Embed Size (px)
Citation preview

2
Nordic HR Study 2017
HR’s view on future organizational challenges and opportunities
B180
01no
rdic

3
ContentsAbout the Nordic HR associations and EY 03 Executive summary 04
About the Nordics 06
Part one – introduction 08
Part two – overview of trends 10 Trend one – job and task automation 16 Trendtwo–flexibleandglobalworkforce22 Trend three – changes in demographics andemployeeexpectations30 Trend four – data analytics 38 Summary – part two 46
Part three – HR’s role in responding to the four trends 48
Part four – appendix 56 Methodology 57 Demographics of the survey respondents 58 References 64
Contact information 67
3
About the Nordic HR Associations and EY
Nordic HR Study 2017
HR Norge and EY have conducted nine human resources (HR) studies from 2007 to 2015, aiming to contribute to a better understanding of developments in HR in Norway. The Nordic HR study 2017 was conducted by the following organizations:
HR Norge is the largest Norwegian membership association for HR professionals with more than 3,000 members. Their main task is to provide expertise and networking about HR and management, and provide news and background information on developments in HR.
Flóra aims to promote professionalism in HR management in Iceland through active involvement in human resource discussion. The members of Flóra work as HR professionals at Icelandic companies and institutions.
HENRY is the biggest arena for HR professionals in Finland with almost 3,000 individual members and more than 100 corporate members.
Sveriges HR Förening has approximately 7,000 members and their purpose is to inspire, develop, and connect HR professionals in Sweden.
EY is a global leader in assurance, tax, transactions and advisory services with more than 250,000 employees located in 150 countries. The insights and quality services they deliver help build trust and confidence in the capital markets and economies around the world. EY’s People Advisory Services (PAS) is a global network of 11,000 professionals offering industry knowledge and end-to-end expertise across all issues regarding people and organization.

4
Executive SummaryThe Nordic HR Study is conducted by EY and the Nordic HR associations HR Norge, Flóra, HENRY and Sveriges HR Förening. This year’s study is a continuation of a long-standing collaboration between EY and HR Norge that in the period 2007-2015 jointly conducted nine HR studies (“HR-undersøkelsen”). This year the focus is on the “future of work”. Based on a literature study and discussions among the HR associations and EY, four trends were identified as particularly relevant for the Nordic region. This report presents how 644 HR professionals from different organizations in the Nordics view the identified trends. Seventy-six percent of these respondents are in top management or HR leadership positions. In the following, the main findings about each of the four trends are briefly described.
Job and task automation is regarded as a highly relevant trend. More than 70% of respondents considered this relevant for their industry now or within four years. Organizations that reported the trend to be relevant now had to a larger extent integrated automation into their strategic plans. The data also indicates that there is a link between the extent of strategic integration and the competency to exploit the trend. Seventy-two percent of respondents reported that more than 10% of HR processes will be automated within the next three to five years. At the same time, only 44% of respondents believed HR is prepared to handle individual consequences of automation.
Flexible and global workforce in this study included questions about global recruitment and the use of contingent workers. Sixty-one percent of respondents viewed increasing use of contingent workers as relevant now or within four years. This trend was perceived as far more relevant for the private sector compared to the public sector. Respondents believed that acquiring workforce flexibility is achieved by increased use of contingent workers, outsourced tasks and strategic alliances. Regarding increased global recruitment, we found that multinational organizations based in the Nordics viewed this trend as relevant. The majority of local Nordic organizations in this study considered global recruitment not applicable or did not know how relevant it will become.
Changes in demographics and employee expectations was explored through questions about aging workforce, increase of millennial workers and greater overall diversity. Fifty-seven percent of respondents considered the aging workforce a relevant trend now or within four years. Fifty-two percent of respondents considered the increase of millennials relevant now or within four years. This trend was also to a larger extent included in the strategic plans of organizations that found them relevant. In combination with expected shifts in the demographics of the workforce, the respondents reported changes in employee expectations. In particular expectations about meaningful vision, flexible workhours, work/life balance and challenging tasks.
Data analytics was explored through questions about analytics in the business as a whole and people analytics in HR. Respondents who found data analytics relevant had to a large extent integrated the trend into strategic plans and built up competencies to address it. For people analytics we found that the respondents recognized the importance of analytics in HR, but reported that they would like to improve their performance in data analytics. Overall, HR professionals reported to perform better with analytics of current or past data than with using analytics for predictive purposes.
1
2
3
4

5
Executive summary Nordic HR Study 2017
The survey also contained questions about important HR areas to improve, and the respondents’ evaluation of their current performance. We found that HR identified a need for improvement in 16 out of 20 areas. Interestingly, we also found that in some areas there was a substantial gap between how respondents evaluated their performance and which areas they found it important to improve. This applies to organizational development, competency development, talent development and leadership development, for instance.
The results indicate that many respondents experience that the nature of work is changing, and for the most part the four described trends are relevant in the Nordics. HR seems to be focusing on improvements in organizational development, leadership development and talent development to address the future. We argue that future trends will also challenge HRs current competency mix, collaboration across boundaries, identity and established power relations.
Results from Sweden are largely in line with results from the other Nordic countries. However, in some areas the Swedish results differ. Respondents from Sweden reported the lowest competency to exploit the trend of automation, and at the same time the highest variance in responses to this question. The respondents in Sweden also reported a lower score on how prepared their organizations are for automating their own processes compared to the other Nordic countries. Regarding the changing workforce, Swedish respondents considered increased use of contingent workers more relevant than Norway and Iceland. Surprisingly, we also found that Swedish respondents considered the increase of millennials relevant at a later stage than the other Nordic countries. Compared to Norway, Sweden is also experiencing more pressure to meet employee expectations to flexible workhours and work/life balance.

6
About the Nordics
IcelandPopulation: 334 2521
KM2: 100 2501
GDP per capita: 56 977 USD1
Biggest companies: Marel, Iceland air group, Landsbankinn, Alcoa Fjardaal5
NorwayPopulation: 5 233 0001
KM2: 365 2451
GDP per capita: 70 812 USD1
Biggest companies: Statoil, Norsk Hydro, Telenor, Aker, Orkla2
DenmarkPopulation: 5 731 0001
KM2: 42 2621
GDP per capita: 53 418 USD1
Biggest companies: A.P.Møller, Novo Nordisk, ISS, Arla Foods, Dong Energy2
SwedenPopulation: 9 903 0001
KM2: 407 3101GDP per capita: 51 600 USD1
Biggest companies: Volvo, Ericsson, H&M, Vattenfall, Skanska2
FinlandPopulation: 5 495 0001
KM2: 303 8901GDP per capita: 43 090 USD1
Biggest companies: Nokia, Neste, UPM, Stora Enso, Kesko, Kone2
7
Nordic HR Study 2017
Source: 1) World Bank Group (2017) / 2) Business Insider (2016) / 3) Nordic co-operation (2016) / 4) Encylopedia Britannica / 5) Iceland Review
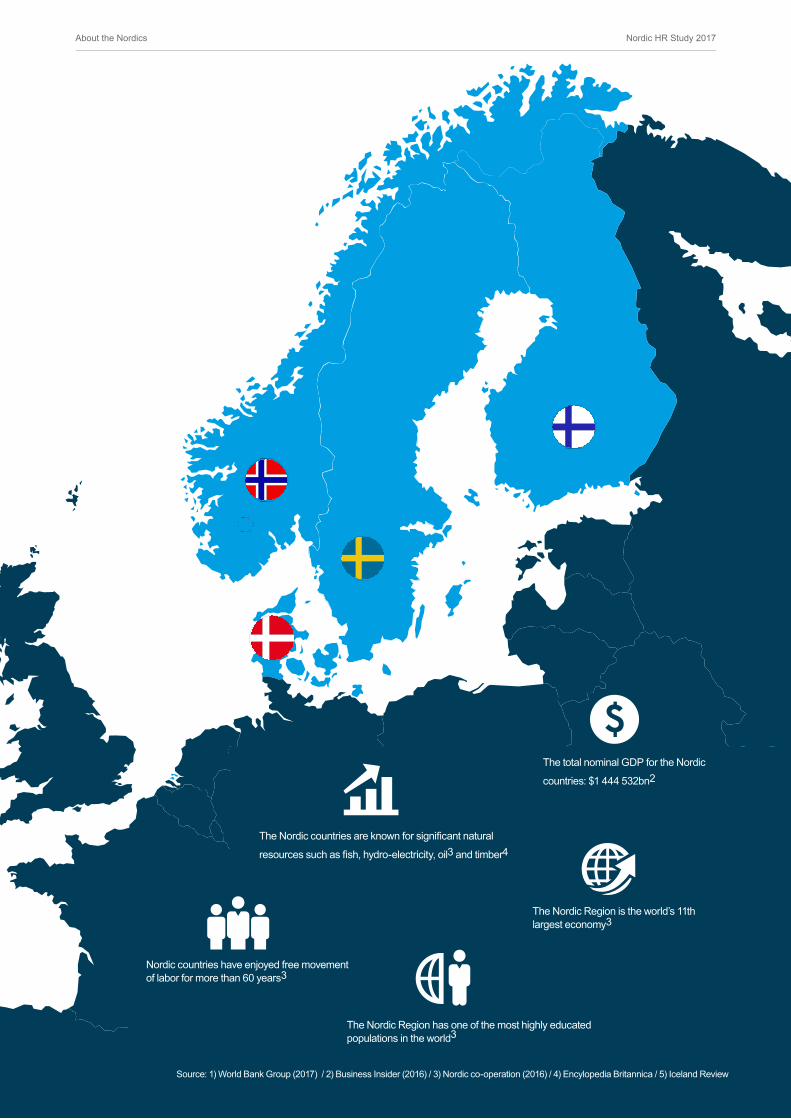
Nordic countries have enjoyed free movement of labor for more than 60 years3
The Nordic countries are known for significant natural
resources such as fish, hydro-electricity, oil3 and timber4
The Nordic Region has one of the most highly educated populations in the world3
The Nordic Region is the world’s 11th largest economy3
The total nominal GDP for the Nordic
countries: $1 444 532bn2
About the Nordics

8
1 The term “disruption” is occasionally used in this report to indicate significant changes, often caused by the introduction of new technologies. In part three, we will also refer to theories on “disruptive innovations” (Bower and Christensen, 1995; Christensen, 1997), which are relevant for understanding current changes in working life. However, these theories do not underpin this Nordic HR study, so we use disruption in a more general sense here.
2 Digitalization is here defined as “the use of digital technologies to change a business model and provide new revenue and value-producing opportunities; it is the process of moving to a digital business” (Gartner IT glossary).
Part one – introductionThe digital revolution, often referred to as “The Fourth Industrial Revolution”, is caused by the rapid increase and embedding of technology into societies. We are only in the midst of understanding how profoundly this revolution may shape the future of work. However, it is anticipated that the organizations most capable of adopting and integrating technology will experience the most positive transformative impact (World Economic Forum, 2016).
Emerging technologies are already disrupting1 the nature of work in certain industries by rendering some tasks redundant and at the same time creating new ones. The automation capabilities of robotics and artificial intelligence are transforming jobs, and can contribute to efficiency, opportunities for scaling and costs reduction. Futurist Thomas Frey predicts that as much as two billion jobs will no longer exist by 2030 due to technological advancement. That is about 50% of all jobs on the planet (Frey, 2012). A similar study in Sweden reported a comparable rate of job displacement in the Swedish labor market over the next 20 years (Fölster, 2014).
However, new technology will require talents capable of supporting these advancements (Murphy, 2016). Meister and Mulcahy (2016) argue that the expectation of social and collaborative tools in the workplace is no longer just a millennial issue, and that workers from several age groups have clear expectations on the digitalization2 of the workplace (ibid).
The Nordic region has been thriving in the use of technology (Murray, 2014) and can be seen as a digital playground for new solutions. The region has experienced great success by early adoption of technologies and new ways of working, and its countries rank high on measures of efficiency of economy, savings in the public sector due to automatization, and start-up success stories such as those of Spotify, Siri, Rovio Entertainment, Skype, Nokia, and Ericsson.
In this report, we will present how respondents from Nordic organizations experience some of the current trends in their working life. Considering the Nordics’ highly educated human capital, high support from social systems, competitive wages, and high degree of innovation, it is likely one of the regions that will experience the impact of digitalization first2 (Colson, 2016; Economist, 2013a, b; Norman, 2013).
When conducting this study on the future of work and implications for HR, we reviewed scientific articles, business reports, news and blog articles and various videos. By grouping several similar trends and looking at them from a HR perspective and a Nordic perspective, we ended up with four major trends: job and task automation, flexible and global workforce, demographic changes in the workforce, and data analytics. This report presents how Nordic HR representatives assess these globally recognized trends. The report is structured as follows: Part two presents the four trends more in depth, and how respondents reported on the relevancy of the trends for their organizations. Part three presents how the organizations responded to these trends. Finally, part four provides a detailed description of the methodology we used, references and contact information and acknowledgements.

9
Nordic HR Study 2017Part one – introduction

10
Part two – overview of trends
Key findings from overview of trends• Analytics and automation are currently the most relevant trends in the Nordics.
• In general, trends reported to be relevant in one to four years, are only to a limited extent integrated in the organizations’ strategic plans.
• A high proportion of respondents consider global recruitment less relevant compared to the other trends and have only to a limited extent integrated it in their strategic plans.

11
Nordic HR Study 2017Part two – overview of trends
This report presents findings from a survey conducted by Nordic HR associations and EY, where respondents from different Nordic organizations have answered questions related to the future of work. We started out by investigating how relevant the respondents find the surveyed trends, and evaluated the extent to which these trends are integrated in the organizations’ strategic plans. Finally, we looked at how respondents assess their organization’s competencies to exploit the described trends. The described trends fall under four categories described below.
FOUR MAIN TRENDS IN THE SURVEY
1. Job and task automation. Questions related to the automation of tasks and activities in the organization and industry, as well as how automation may have implications for competency development and re-skilling.
2. Flexible and global workforce. Questions related to use of contingent workers, future workforce changes and global recruitment.
3. Changes in demographics and employee expectations. Questions related to an aging workforce, increase in millennial workers and other demographic shifts. The respondents also reported changes in employee expectations on issues that are known to affect employee satisfaction.
4. Data analytics. Questions related to the use of analytics, both in the organization as a whole, and within the HR function.
In general, respondents reported that the trends surveyed are already relevant or will be relevant within one to four years (Figure 1). Analytics of current situation and automation of tasks were found to be particularly relevant trends, with respectively 57% and 50% of respondents reporting that these are already relevant in their industry. Global recruitment was found to be the least relevant trend, and 29% reported it not to be applicable for their industry (Figure 1). Interestingly, 25% of respondents reported that the aging workforce would not be relevant for five or more years, while for millennials, this percentage was 22%. These comparatively higher percentages indicate that the level of agreement among respondents was lower for the relevancy of aging workforce and millennials compared to other trends. We will further address these results when we look at each trend separately.
Analytics of current situation and automation of tasks were found to be particularly relevant trends.”

12
Nordic HR Study 2017Part two – overview of trends
Are trends sufficiently integrated in strategic plans?We set out to investigate how well integrated the four trends were in strategic plans in relation to when respondents considered the trends to be relevant. For all trends, we found that relevancy was proportionally related to the extent of integration in strategic plans. In other words, the more relevant the trends were considered, the better they were integrated in strategic plans (Figure 2).
To assess if these responses are adequate, we have to consider the Likert scale in use, with one corresponding to “to a very limited extent” and seven corresponding to “to a very large extent”. Respondents tend to choose values toward the middle of the scale instead of the extremes (Douven 2017). Hence, we advocate that a score above four indicates that a respondent believes that the trend is somewhat integrated in strategic plans.
For the respondents that rated automation and analytics of current situation as already relevant, we find that they score a mean value of ~5 (Figure 2). This indicates that these trends are integrated in strategic plans. The mean score is somewhat lower (4.5) on the strategic integration of developing new skills. This might indicate a discrepancy between the impacts of automation on the organizations, and how they are handling the consequences of automation, as development of new skills is a likely result of employees getting parts of their job automated.
We found a substantial difference in the extent of integration in strategic plans between the group that reported that the trends are already relevant (blue curve), and the group that reported that trends will be relevant in one to four years (orange curve) (Figure 2). This indicates that organizations that found trends to be relevant within one to four years have only to a limited extent accounted for these trends in their strategic plans. This might be indicative of an insufficient response, which is supported by the finding that 40% of respondents report a timeframe for strategic planning above three years (Figure 3).
5,04,5 4,7 4,8 4,7 4,8 5,0 5,0
3,93,7
3,4 3,6
4,1
3,6 3,8 3,6
3,02,5 2,6
2,3
3,23,0
2,6 2,6
1
2
3
4
5
6
7
Automation New skills Contingentworkers
Globalrecruitment
Agingworkforce
Millenials Analytics;current
situation
Analytics;predicitve
Exte
ntof
inte
grat
ion
ofst
rate
gic
plan
s,
mea
nva
lue
(sca
le1-
7)
Already relevant 1-4 years ≥ 5 years
*
Figure 2 – To what extent is the following trend integrated in strategic plans in your organization? Mean score integration by relevancy for each trend. Statistically significant difference in mean scores between the respondents that reported the trend as “Already relevant” and the ones that reported the trend as relevant within “1-4 years” for all trends (p<0,001-0,006)
56,0 %30,4 %
10,1 %3,5 %
1-3 years 4-5 years More than 5 years Don´t know
Figure 3 – What is the timeframe for the overall business plan in your organization?
The scale in use, is a Likert scale of 1-7, with one representing “To a very limited extent”, and seven representing“ To a very large extent”, unless otherwise noted in figures.
13
Nordic HR Study 2017Part two – overview of trends
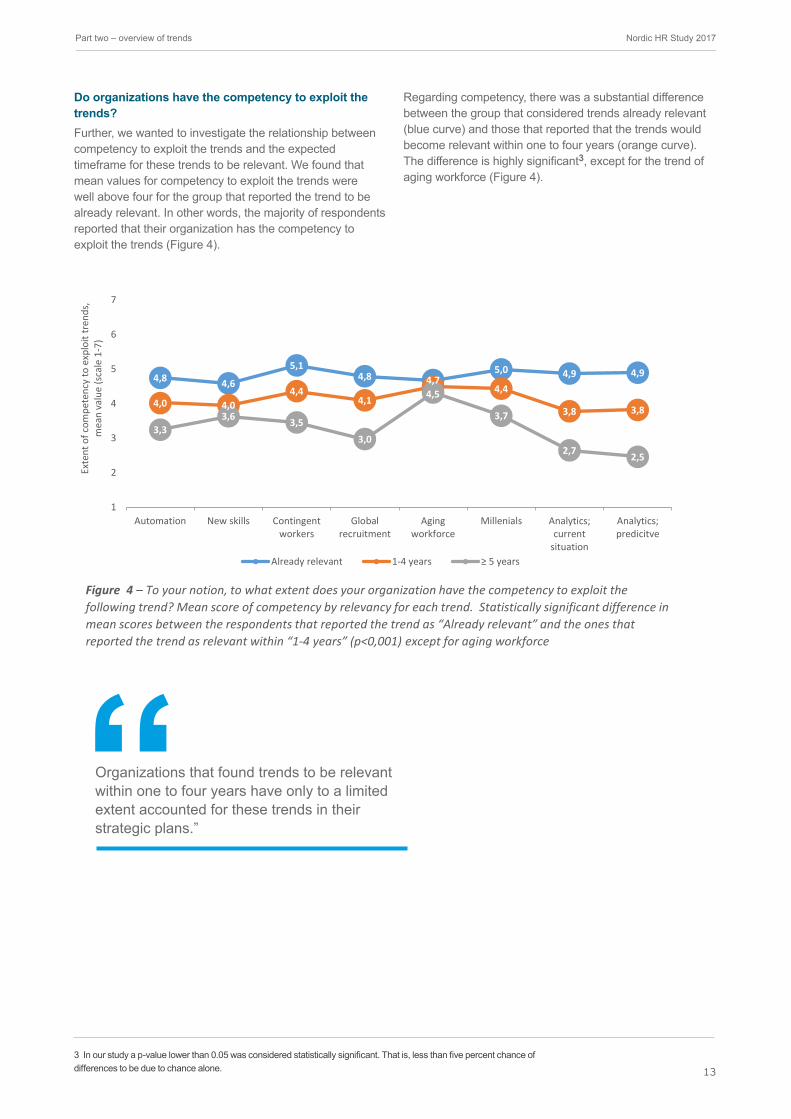
Do organizations have the competency to exploit the trends?Further, we wanted to investigate the relationship between competency to exploit the trends and the expected timeframe for these trends to be relevant. We found that mean values for competency to exploit the trends were well above four for the group that reported the trend to be already relevant. In other words, the majority of respondents reported that their organization has the competency to exploit the trends (Figure 4).
Regarding competency, there was a substantial difference between the group that considered trends already relevant (blue curve) and those that reported that the trends would become relevant within one to four years (orange curve). The difference is highly significant3, except for the trend of aging workforce (Figure 4).
3 In our study a p-value lower than 0.05 was considered statistically significant. That is, less than five percent chance of differences to be due to chance alone.
Organizations that found trends to be relevant within one to four years have only to a limited extent accounted for these trends in their strategic plans.”
4,8 4,6
5,14,8 4,7
5,0 4,9 4,9
4,0 4,04,4
4,1 4,5 4,4
3,8 3,8
3,33,6 3,5
3,0
3,7
2,7 2,5
1
2
3
4
5
6
7
Automation New skills Contingentworkers
Globalrecruitment
Agingworkforce
Millenials Analytics;current
situation
Analytics;predicitve
Exte
nt o
f com
pete
ncy
to e
xplo
it tr
ends
, m
ean
valu
e (s
cale
1-7
)
Already relevant 1-4 years ≥ 5 years
Figure 4 – To your notion, to what extent does your organization have the competency to exploit the following trend? Mean score of competency by relevancy for each trend. Statistically significant difference in mean scores between the respondents that reported the trend as “Already relevant” and the ones that reported the trend as relevant within “1-4 years” (p<0,001) except for aging workforce

14
Nordic HR Study 2017Part two – overview of trends
A tendency to overestimate their competencies to exploit trends?Finally, we compared the degree of integration in strategic plans to the organization’s competency to exploit the trends. Overall, we see a tendency that competency (orange curve) is rated higher than integration into strategic plans (blue curve). This might indicate that the respondents tend to overestimate competencies in the organization. However, this might not be the case for automation and analytics (Figure 5). These trends are viewed as highly relevant (Figure 1), which might result in a more correct evaluation of competencies.
Global recruitment was considered the least relevant trend. This is supported by the low degree of integration in strategic plans and the extent of competency to exploit this trend (Figure 5). This suggests that organizations experience that they do not have to look outside country borders to recruit suitable candidates. One explanation could be that the education level in the Nordic countries is relatively high, and above OECD average (OECD, 2011). In addition, higher education is largely funded by the governments in the Nordics, and the study programs are often designed to meet demands within the respective country. Another contributing factor could be the language barrier. As local language is usually used in the workplace, proficiency of the local language is probably important in many Nordic organizations.
4,3
3,7 3,63,3
4,0 3,8
4,44,1
4,5
3,8
4,5 4,4 4,4 4,2
1
2
3
4
5
6
7
Automation Developingnew skills
Contingentworkers
Globalrecruitment
Aging Millenials Analyticscurrent
Analyticspredictive
Mea
n va
lues
(sca
le 1
-7)
Integrated in strategic plans Competency to exploit trend
Figure 5 – Comparison between integration in strategic plans and competency to exploit trends

15
Nordic HR Study 2017Part two – overview of trends
16
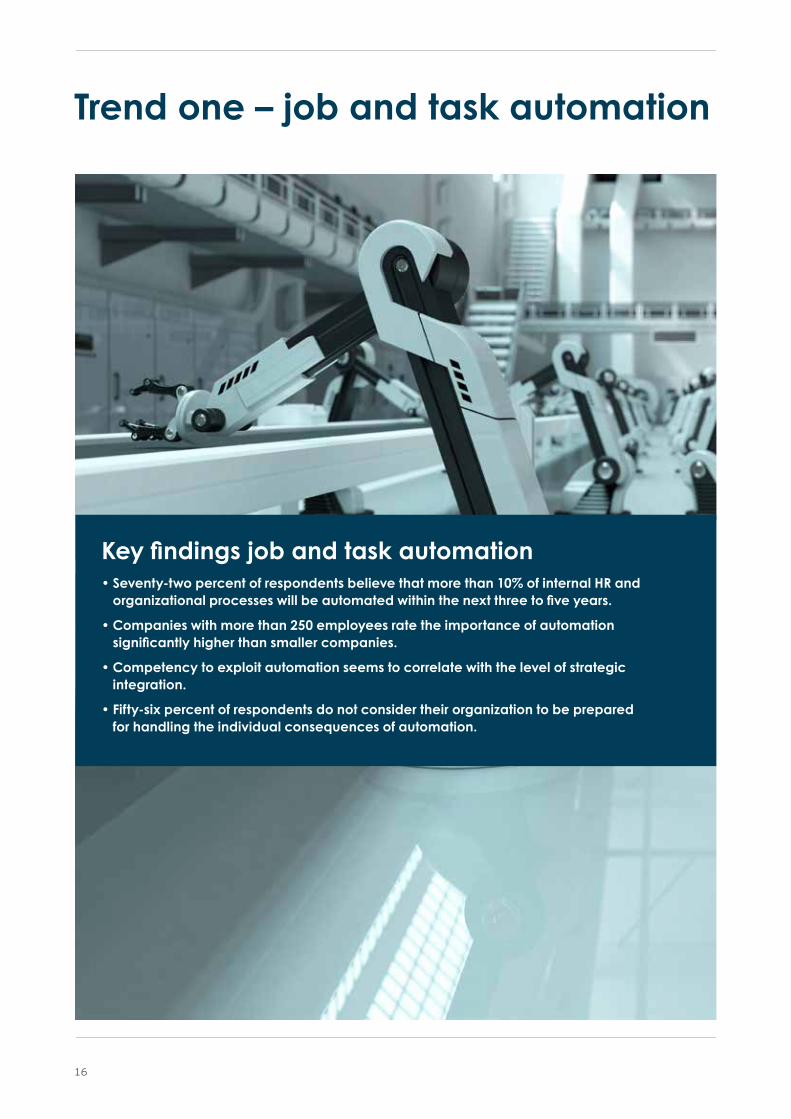
Key findings job and task automation• Seventy-two percent of respondents believe that more than 10% of internal HR and
organizational processes will be automated within the next three to five years.
• Companies with more than 250 employees rate the importance of automation significantly higher than smaller companies.
• Competency to exploit automation seems to correlate with the level of strategic integration.
• Fifty-six percent of respondents do not consider their organization to be prepared for handling the individual consequences of automation.
Trend one – job and task automation

17
Nordic HR Study 2017Trend one – job and task automation
Definition: The automation of specific tasks within a job as well as full automation of entire jobs
Technological advancements across sectors and industries have the potential to become major disrupting factors to the way we work. New technology can now allow us to automate work previously untouched by traditional automation, and the speed of automation is picking up (EY, 2016). There is already evidence of robotics replacing medium-skilled work in several industries (ibid). Machine learning can be most useful in environments with a high degree of complexity (MIT Sloan Management review, 2017). A study that looked into risks of automation across several job categories estimated that 47% of US employment belongs to the high-risk category, meaning jobs one can expect to be automated over the next two decades (Frey and Osborne 2013).
Automation in the 21st centuryAutomation in the 21st century is often linked to digitalization, but the digitalization of businesses also includes a creation of new digital revenue and value-producing opportunities (Gartner, 2015). Digitalization can mean automating previously manual and time-consuming processes, but it also involves creating new digital business models. Digitization, the process of changing from analog to digital form, can be seen as a first step of modern automation since it often requires data to be digitally accessible for processes or tasks to become automated. The rate of automationIn the survey, respondents were asked to define the percentage of business tasks and processes that will be automated within the next three to five years.
Among the respondents, 37% believed that 11%-20% of processes in both their HR function and in their organization as a whole would be automated within the next three to five years. As many as 21% of the respondents believed that 21%-40% of the processes in the organization will be automated within the next three to five years (Figure 6). These numbers indicate that the respondents expect a substantial push toward automation in the future.
Respondents from banking and the IT industry seem to anticipate an especially high rate of automation.”

18
Nordic HR Study 2017Trend one – job and task automation
The reported automation rate varies between industries. In some industries, a higher percentage of tasks and processes are viewed as susceptible for automation4. Respondents from banking and the IT industry seem to anticipate an especially high rate of automation (Figure 7). No respondents from these industries anticiapte that none of their tasks and processes will be automated.
In general, the automation of processes in organizations seems to be largely recognized in the Nordics, but to various extents. For the companies at the forefront of this trend, it represents a significant disruption in how they currently work.
Responding to automationApproximately 64% of respondents see automation as an important tool for improving quality and lead-time and reducing cost. Interestingly, 21% of respondents disagree with this statement (Figure 8).
There can be several explanations for why respondents do not consider automation important, but our data indicates that it might be connected with company size. More specifically, Figure 9 shows that companies with more than 250 employees rate the importance of automation
15%
44%
30%
11%
22%
36% 36%
6%
0%
10%
20%
30%
40%
50%
60%
70%
80%
1-10% 11-20% 21-40% >40%
Perc
enta
ge o
f res
pond
ents
Banking/finance/incurance n=29 IT/telekom n=39
Figure 7 – To your notion, what portion of the internal tasks and processes will be automated in the next 3-5 years in your organization?
3%
6%
12%
15%
23%
20% 21%
0%
5%
10%
15%
20%
25%
1 -Stronglydisagree
2 3 4 -Neutral
5 6 7 -Strongly
agree
Perc
enta
ge o
f res
pond
ents
Figure 8 – My organization sees automation as an important tool to improve quality, improve lead-time, reduce cost, etc. Mean = 4,9
Figure 9 – My organization sees automation as an important tool to improve quality, improve lead-time, reduce cost, etc. Mean score by size of company. Mean = 4,9
4,44,7
5,1 5,25,0
1
2
3
4
5
6
7
0-50 51-250 251-1000 1001-5000 More than5000
employees
Mea
n va
lue
(sca
le 1
-7)
4 In part three of the report a figure shows how a recent article published in New York Times had categorized different types of jobs on the basis of how susceptible they are for computerization.

19
Nordic HR Study 2017Trend one – job and task automation
significantly higher than smaller companies (p=0.06). Smaller companies might not see the value of robotic process automation and other workplace automation technology as they have a lower volume of repetitive tasks and the initial cost of employing these technologies is usually not volume dependent. Smaller companies often have less positive business cases for automation initatives and other effectiveness initiatives might be better suited. When looking at HR, 50% of respondents agree with the statement that their HR organization is prepared to automate their own processes, while 30% disagree (Figure 10). Considering that many traditional HR processes are administrative and repetetive in nature and therefore can be classified as transactional, it is not surprising that many HR professionals consider themselves prepared for automation.
Transactional processes can also be considered relatively mature processes, meaning that they have to a large extent been standardized. Standardization of these processes combined with digital development and investments can be seen as a foundation for automation. The lack of these foundational factors might be the reason why some believe their HR organization is unprepared to automate its processes. Respondents from Sweden have a mean score of 3.9 on this question, which is significantly lower compared to the other Nordic countries (mean=4.5 p=0.015). This might indicate that the Swedish respondents are either more modest in their perception of their own abilities than their Nordic neighbors or that they actually are less prepared to automate their processes. The consequences of automation for the individual employee can be viewed as an important part of HR’s responsibility in the future of work. However, the results show that many organizations think their HR department is not prepared. Only 44% of respondents consider
themselves prepared to handle the consequences of automation for the individual (Figure 11).
The results reflect a great deal of ambiguity related to the potential individual effects of the automation of work. Automating simple and repetetive tasks will presumably free up capacity to perform more cognitive and complex tasks. Since many of these new tasks are still unknown, we expect HR professionals to be somewhat uncertain about how this transition is going to happen. We also expect that the HR professionals that have already been through an automation process will consider themselves more prepared than those that have not. Interestingly, we see significant differences depending on which sector the HR organizations belong to. The data shows that the government and public sector is significantly less prepared (mean=3.8) compared to private and state-owned companies and non-governmental organizations (mean=4.2 p=0.039). The differences may reflect that private and state-owned companies have greater flexibility in terms of investing in practices that facilitate the transition, such as new competency and skill development, compared to the government and public sector.
5%
13% 12%
20%22%
16%
12%
0%
5%
10%
15%
20%
25%
1 -Stronglydisagree
2 3 4 -Neutral
5 6 7 -Strongly
agree
Perc
enta
ge o
f res
pond
ents
Figure 10 – Our HR organization is prepared to automate our own processes.
7%
11%
16%
22%21%
15%
8%
0%
5%
10%
15%
20%
25%
1 -Stronglydisagree
2 3 4 -Neutral
5 6 7 -Strongly
agree
Perc
enta
ge o
f res
pond
ents
Figure 11 – Our HR organization is prepared to handle the individual consequences of automation in our organization. Mean = 4,2

20
Nordic HR Study 2017Trend one – job and task automation
Strategic integration of automation and competenciesThe survey data indicates that automation of tasks and activities is already a relevant trend for more than 50% of the respondents, and more than 73% of the respondents considered automation to be a relevant trend now or within one to four years. Only 9.8% of respondents considered automation of tasks and activities as not applicable for their organization (Figure 12).
Given that respondents considered automation relevant, we looked at how well integrated the trend was in their strategic plans, and how they assessed their competencies related to the trend. Forty-eight percent of respondents reported that automation was integrated in strategic plans (Figure 13) and, as shown in part two, this is among the highest scores for strategic integration among the surveyed trends.
Government and public sector are less likely to have integrated automation into their strategic plans compared to other sectors (p=0.034). A strategic focus on automation can for instance be driven by pressure from the competetive environment in which the organization operates. Since government and public sector organizations are less exposed to competition than private sector organizations, they might not experience the same urgency to automate tasks. Hence, one could argue that the government and public sector is less likely to integrate automation in strategic plans than the private sector. Another explanation might be tied to how strategy is made in the public sector. Organizations in the public sector typically develop their strategies based on priorities outlined by their respective ministries. Strategic integration of automation in the public sector would therefore require politicians to have insight into these trends. If we look to industries, we found that banking to a larger extent has included automation in their strategic plans compared to other industries (mean=5.6 vs. 4.1 p=<0.01). This is in accordance with our initial expectations. We have for a while seen a great deal of focus on automation in the banking industry. This may result from the nature of the tasks performed and the constant pressure to create an effective and pleasant customer experience. Further, we expect that automation will continue to be included in strategic plans in the banking industry. The competency to exploit automation of tasks and activities seem to be even less aligned with the relevancy of the trend. Only 43% of respondents reported that their organization has the necessary competencies to exploit the trend (Figure 14). If we compare that number to the 74% of respondents that believed the trend would be relevant within four years, it is fair to assume that organizations need to focus more on building these competencies.
50,2 %
23,4 %
11,0 % 9,8 %5,6 %
0%
10%
20%
30%
40%
50%
60%
Alreadyrelevant
1-4 years 5 or moreyears
N/A Don´tknow
Perc
enta
ge o
f res
pond
ents
Figure 12 – To your notion, when will automation of tasks/activities become relevant to your industry?
11%
9%
17%
14%
19%
12%
17%
0%
5%
10%
15%
20%
To avery
limitedextent
2 3 4 5 6 To averylarge
extent
Perc
enta
ge o
f res
pond
ents
Figure 13 – To what extent is automation of tasks/activities integrated in strategic plans in your organization? Mean = 4,3
5%
9%
20%
24%
17%
13% 13%
0%
5%
10%
15%
20%
25%
To avery
limitedextent
2 3 4 5 6 To averylarge
extent
Perc
enta
ge o
f res
pond
ents
Figure 14 – To your notion, to what extent does your organization have the competency to exploit automation of tasks/activities?

21
Nordic HR Study 2017Trend one – job and task automation
Respondents who rated automation as highly integrated in their strategic plans are more likely to have rated their competencies in automation high as well.”
The government and public sector scores especially low (mean=3.8) compared to other sectors (mean=4.4). We find no significant differences for companies with less than 250 employees. Respondents who rated automation as highly integrated in their strategic plans are more likely to have rated their competencies in automation high as well (Figure 15).
SummaryAutomation of jobs and tasks seems to already have a major impact on Nordic businesses. The respondents considered the trend highly relevant and predicted high rates of automation in the near future. However, HR is facing the challenge of the individual consequences of automation as more and more tasks are automated and jobs that were previously considered stable start changing.
22
Nordic HR Study 2017
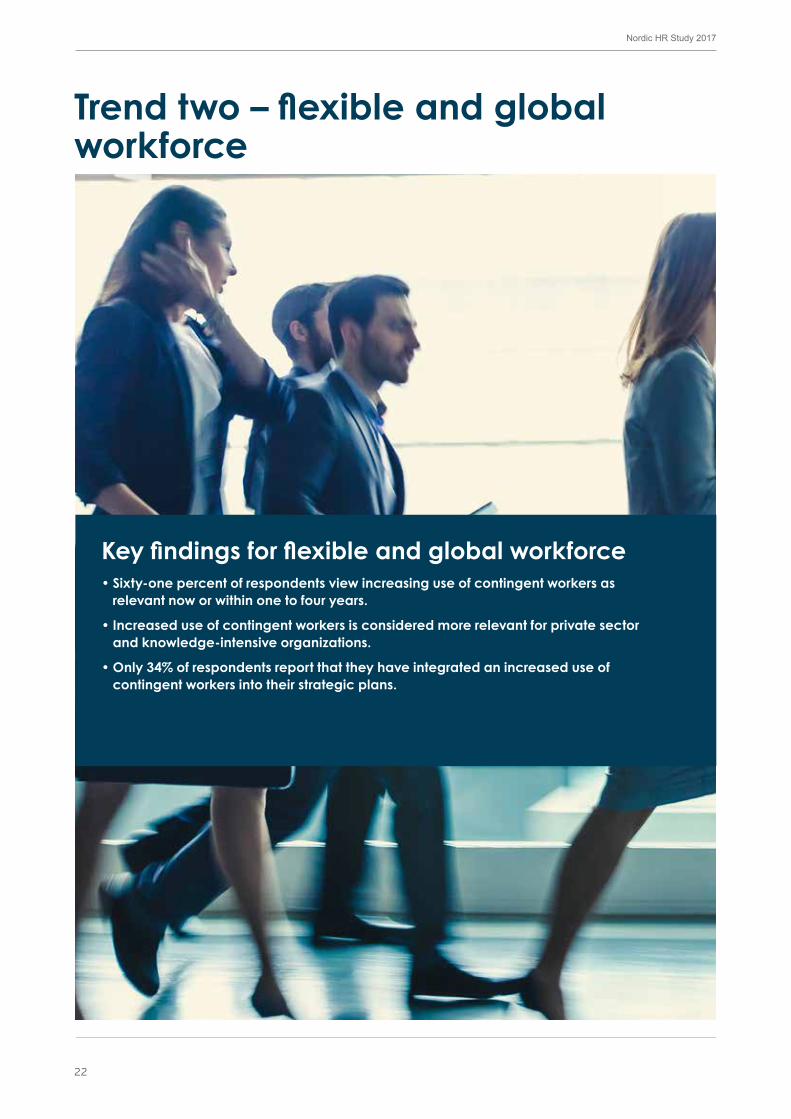
Key findings for flexible and global workforce• Sixty-one percent of respondents view increasing use of contingent workers as
relevant now or within one to four years.
• Increased use of contingent workers is considered more relevant for private sector and knowledge-intensive organizations.
• Only 34% of respondents report that they have integrated an increased use of contingent workers into their strategic plans.
Trend two – flexible and global workforce

23
Nordic HR Study 2017Trend two – flexible and global workforce
Definition: The shift from standard local contract employment to more flexible and global workforce solutions.
The future of work does not only include a shift in automation of labor, but also new ways of employing labor. Intuit (2010) predicts that in the US, contingent workers will make up 40% of the workforce in 2020 as more than 80% of large corporations plan to substantially increase their use of flexible workforce. We are also starting to see the impact of what is called the “gig economy” where tasks are being divided and outsourced to freelancers and companies inside and outside national borders. Some companies already use technology to provide on-demand freelancers in professional services that range from coders, lawyers and even doctors (The Economist, 2015). A recent EY survey from the US found that companies are using contingent workers to complete projects when they lack internal competencies or capacity, to control labor costs, respond to seasonal workforce changes and overcome resistance to change within the permanent workforce (EY, 2016). Digital platforms are enabling greater access to the global labor market than ever before. We can expect further erosion of geographic boundaries in the coming years as people become able to deploy their skills and experiences where they are needed (World Economic Forum, 2016).
The Nordics are in the early stages of the gig economy. They are experiencing a conflict between the “quest for growth and innovation, on the one hand, and for equality and institutional stability, on the other” (Dølvik and Jensen, 2017: 51). In Nordic organizations, the traditional view of accessing competency has been to employ and develop their own people. This might affect how the Nordics assess the possibilities of a flexible workforce.
In the survey, we asked a series of questions related to these predictions to develop a better understanding of how respondents from Nordic organizations assess workforce flexibility and global recruitment. Thirty-nine percent of the respondents stated that increased use of contingent workers such as freelancers, independent professionals, temporary contract workers and independent contractors, is already relevant, and 22% expected it to become relevant within one to four years. Interestingly, 31% of respondents reported “Don’t know” or “N/A” when assessing contingent worker relevancy for their industry (Figure 16).
39%
22%
7%
16% 15%
0%
5%
10%
15%
20%
25%
30%
35%
40%
45%
Alreadyrelevant
1-4 years 5 or moreyears
N/A Don´tknow
Perc
enta
ge o
f res
pond
ents
Figure 16 – To your notion, when will increased use of contingent workers become relevant to your industry?

24
This could indicate that 15% of the respondents have not yet assessed how the business could use contingent workers, and that 16% feel that either they have no use for a more flexible workforce, or that regulations, organizational structure or supply makes it impossible for them to use contingent workers. On a country-by-country basis, the survey indicates that the trend is considered more relevant in Sweden (66%), Denmark (68%) and Finland (67%) than in Norway (55%) and Iceland (51%)5. (Figure 17). For Iceland, the explanation might be that they are currently experiencing higher employment rates than the other
Nordic countries (Nordregio, 2016). This low unemployment rate might have an adverse effect on the supply side of the flexible workforce.
Sector also seems to affect whether respondents consider using contingent workers as relevant for their organization or not. The data indicates that the focus on contingent workers is higher in the private sector than in the public sector. Among private sector respondents, 66% considered contingent workers to be a relevant trend now or within four years while only 41% of public sector respondents said the same (Figure 19). This might be because certain regulations and political sentiments in Nordic countries do not support contingent work in government institutions. Especially in Norway, there has been public and regulatory pressure to employ permanent labor (Virke, 2015; Econa, 2016).
Finally, there are also observable differences between respondents from different industries concerning the relevancy of contingent workers (Figure 20). The industries that scored the highest seem to be knowledge-intensive or seasonal industries that might have a greater need for flexibility and temporary inflow of capacity and competencies.
5 The numbers correspond to the percentage of all respondents that believe the trend to be relevant now or within four years
Trend two – flexible and global workforce
0%
10%
20%
30%
40%
50%
60%
Denmark Finland Iceland Norway Sweden
Perc
enta
ge o
f res
pond
ents
Already relevant 1-4 years 5 or more years
N/A Don´t know
Figure 17 – To your notion, when will increased use of contingent workers become relevant to your industry? Relevancy of trend by country
1,8 1,9
1,3
3,4
1,2
0
1
2
3
4
5
6
Denmark Finland Iceland Norway Sweden
Mea
n va
lue
(sca
le 1
-6)
Figure 18 – Regulation on temporary forms of employment. Scale from 0 (least restrictions) to 6 (most restrictions). Index of regulation from OECD (data from 2014)
24%
32%
44%
17%
24%22%
10%
2%
7%
23%
15% 15%
26% 27%
12%
0%
5%
10%
15%
20%
25%
30%
35%
40%
45%
50%
Government/publicsector
State owned Private sector
Perc
enta
ge o
f res
pond
ents
Already relevant 1-4 years 5 or more yearsN/A Don´t know
Figure 19 – To your notion, when will increased use of contingent workers become relevant to your industry? Trend relevancy by sector

25
Nordic HR Study 2017Trend two – flexible and global workforce
76% 73% 69% 69% 68% 67% 63% 60% 60% 58% 57% 54% 52% 50%44%
0%10%20%30%40%50%60%70%80%
Cons
ultin
g se
rvic
es/p
rofe
ssio
nal
serv
ices
Med
ia/in
form
atio
n/co
mm
unic
atio
n
Oil
and
gas
Tour
ism/h
orpi
talit
y se
ctor
Reas
erac
h/te
achi
ng/e
duca
tion
IT/t
elek
om
Cont
ruct
ion/
real
est
ate
Indu
stry
Trad
e/w
hole
sale
/con
sum
erpr
oduc
ts
Pow
er a
nd u
tilite
s
Bank
ing/
finan
ce/in
sura
nce
Mar
itim
e/sh
ippi
ng/t
rans
port
aio
n/lo
gist
ics
Heal
th c
are/
life
scie
nce/
soci
alca
re se
rvic
es
Spec
ial i
nter
est g
roup
Stat
e/co
unty
auth
ority
/mun
icip
ality
Perc
enta
ge o
f res
pond
ents
Figure 20 – To your notion, when will increased use of contingent workers become relevant to your industry? Trend relevancy by industry; percentage of respondents that reported the trend to be relevant now or within 4 years
Among private sector respondents, 66% considered contingent workers to be a relevant trend now or within four years while only 41% of public sector respondents said the same.“

26
Nordic HR Study 2017
Competency to exploit the use of contingent workersWhen asked about the competency to exploit the increasing use of contingent workers, the mean score for all respondents is 4.5 (Figure 21). As many as 55% of respondents reported that they have the competency to exploit the trend. Furthermore, 13% of respondents reported that they “to a very large extent” have this competency.
This indicates that several companies are starting to build, or have already built, in-house competencies to address a future where flexible workers are more common. An increased use of contingent workers might have a significant impact on management constructs, governance structures, workforce engagement models, value propositions, risk management frameworks and compliance processes (EY, 2016). One could argue that this would require a determined strategic approach to rethinking the total organizational workforce.
However, when we look at the responses to see if the organization has integrated the trend of increased use of contingent workers into their strategies, the mean score is 3.6. This indicates that most respondent organizations have not yet started thinking strategically about how they will use a contingent workforce, that they define “strategic plans” differently, or that they think that strategy refers only to issues strictly related to core business. There are some national differences in the data and the countries that found contingent workers most relevant scored higher in their strategic integration of the trend (Figure 23). Finland and Sweden have a mean score of 4.0 and 3.9, respectively.
These scores cannot be considered particularly high. Therefore, there is a lack of strategic integration even though the same respondents found the trend relevant. This raises a question about whether organizations can address the contingent workforce without a clear strategic approach.
Trend two – flexible and global workforce
7%
10% 10%
18%
22%20%
13%
0%
5%
10%
15%
20%
25%
To avery
limitedextent
2 3 4 5 6 To averylarge
extent
Perc
enta
ge o
f res
pond
ents
Figure 21 – To your notion, to what extent does your organization have the competency to exploit increasing use of contingent workers? Distribution by competency scores. Mean = 4,5
17%15% 16%
18%
15%
12%
7%
0%
5%
10%
15%
20%
To avery
limitedextent
2 3 4 5 6 To averylarge
extent
Perc
enta
ge o
f res
pond
ents
Figure 22 –To what extent is the increasing use of contingent workers integrated in strategic plans in your organization? Distribution by strategic integration scores
3,64,0
3,3 3,2
3,9
1
2
3
4
5
6
7
Denmark Finland Iceland Norway Sweden
Mea
n va
lue
(sca
le 1
-7)
Figure 23 – To what extent is increasing use of contingent workers integrated in strategic plans in your organization? Mean scores of strategic integration by respondent country.

27
Nordic HR Study 2017
Changes in the organization of laborMost respondents believed that they will keep the same number of full-time workers over the next three to five years (Figure 24). Respondents from Finland reported some small changes in full-time workers, a slight overall decrease (3.8) of full-time workers and an increase (4.3) in part-time workers.
On the other hand, Sweden reportedly goes in the opposite direction with an increase in full-time workers (4.4) and a decrease in part-time workers (3.8). Keeping in mind that even though respondents expect more automation, this does not seem to lead to reductions in headcount in the next three to five years. However, when looking at the respondents who said they expect more than 20% of
the internal process to be automated in the next three to five years, they had a different expectation of the full-time workforce (Figure 25).
Overall, the data indicates that automation will allow workers to spend more time on other, more complex tasks, which will require some adjustment in competencies. One can also argue that automation is handling a lot of the business growth in the Nordics, allowing companies to grow without increasing the workforce for the time being. However, as the extent of automation increases, the respondents tend to expect a reduction in the number of full-time employees.
The respondents reported that the use of contingent workers will increase (4.4). The same goes for outsourcing (4.6) and strategic alliances (5.1) (Figure 24). This suggests that the respondents are looking at several opportunities for acquiring workforce flexibility and addressing new competency and capacity demands.
Trend two – flexible and global workforce
The respondents are looking at several opportunities for acquiring workforce flexibility and addressing new competency and capacity demands.“
4,1 4,14,4
4,6
5,1
1
2
3
4
5
6
7
Full timeemployees
Part timeemployees
Contingentworkers
Outsourcedtasks
Strategicalliances
Mea
n va
lue
(sca
le 1
-7)
Figure 24 – To your notion, which changes will your organization make within the workforce in the next 3-5 years? Mean scores of workforce changes scale: 1 = substantial decrease, 4 = no change, 7 = substantial increase
4,3 4,13,9
4,1
1
2
3
4
5
6
7
Full time workers Part time workers
Mea
n va
lue
(sca
le 1
-7)
0-10% Process automation >20% Process automation
Figure 25 – To your notion, which changes will your organization make within the workforce in the next 3-5 years? Mean scores of changes in full and part time workers in organizations who expect different degrees of process automation. Scale: 1 = substantial decrease, 4 = no change, 7 = substantial increase

28
Nordic HR Study 2017Trend two – flexible and global workforce
Local focusGlobal competition for talent seems to be a concern for a majority of multinational Nordic organizations (Figure 26). Sixty-seven percent of respondents from multinational organizations reported the trend to be relevant now or within four years. The domestic organizations seemed to find global recruitment substantially less applicable. This might be because most Nordic businesses have local language requirements and because the Nordic region has access to a highly educated population.
43%
24%
6%
18%
9%
16%13%
11%
38%
22%
0%5%
10%15%20%25%30%35%40%45%
Already relevant 1-4 years 5 or more years N/A Don´t know
Perc
enta
ge o
f res
pond
ents
Multinational National
Figure 26 – To your notion, when will increased global recruitment competition become relevant to your industry? Relevancy by national or multinational organizations
15%
7%
13%
9%
17%16%
18%20%
15%
22%
11%
17%
10%9%
0%
5%
10%
15%
20%
25%
Integration in strategic plans Competency to exploit
Perc
enta
ge o
f res
pond
ents
To a very limited extent 2 3 4 5 6 To a very large extent
Figure 27 – To what extent is the increased global recruitment competition integrated in strategic plans in your organization? Trend integration in strategic plans and competency to exploit the trend; respondent distributionsfor “multinational organization”
Concerning the integration of global recruitment competition in strategic plans, the data indicates that this is not a high priority for the respondents from multinational organizations (Figure 27). However, most respondents from multinational organizations reported that they have the necessary competencies to address increased global competition for talent. The results indicate that even though global recruitment is not a clear strategic priority, the Nordic organizations have confidence in their ability to attract global talent if competition increases. The high wages and living conditions in the Nordic countries could be a competitive advantage.

29
Nordic HR Study 2017Trend two – flexible and global workforce
Respondents from domestic organizations reported that they to a limited extent are more internationally oriented now then 3 years ago when it comes to recruitment (mean = 3.5). However, respondents from multinational organizations are more internationally oriented now then 3 years ago (mean = 4.9). This indicates that the domestic organizations are still focusing more on local knowledge while multinational organizations are increasingly adapting to a more global mindset.
The respondents were also asked if they recruit more globally now compared to three years ago. Only 13% of domestic organizations reported that they have increased their global recruitment in the last three years, compared to 38% of the multinational organizations (Figure 28).
This indicates that the domestic companies mostly focus on local recruitment, but it also shows that multinational companies have not substantially increased their global recruitment. Even though multinational companies are becoming increasingly internationally oriented, it might seem like this has not yet had any real impact on recruitment. However, as competition for talent in the Nordics increases as companies strive to adapt to the digitalization trends, we might see a shift in this local recruitment focus, both for domestic companies and multinational companies.
12% 12% 11%
26%
18%12%
8%
45%
19%
9%15%
8%3% 2%
0%5%
10%15%20%25%30%35%40%45%50%
To a very limitedextent
2 3 4 5 6 To a very largeextent
Perc
enta
ge o
f res
pond
ents
Multinational National
Figure 28 - To your notion, to what extent does your organization recruit more globally now than it did 3 years ago? Distribution of respondents by national and multinational organizations. Mean Multinational = 4,9; Mean National = 3,5
SummaryOur findings suggest that the trend of workforce on demand has yet to become a high priority in the Nordics. Many organizations are exploring the possibility to cover their need for competency or delivery through contingent workers, outsourcing or alliances. However, it seems that the concepts are still in the very early stages, and that the strategies to succeed have yet to be established. There are perhaps some regulatory boundaries to consider, such as laws, unions and culture. Although there is a free flow of labor in the EU, cultural fit or language barriers might stop Nordic organizations from taking advantage of it.

30
Nordic HR Study 2017
Key findings for flexible and global workforce• Trends of aging workforce and millennials are considered relevant within short time.
• Sweden reports a lower degree of relevancy for millennials than the other Nordic countries.
• Integration of aging workforce and millennials into strategic plans is lower for those who consider the trend relevant now, compared to other trends.
• Norway reports fewer changes in employee expectations regarding flexible working hours and work-life balance than the other Nordic countries.
• The public sector reports fewer changes in employee expectations regarding job security than the private sector.
Trend three – changes in demographics and employee expectations

31
Nordic HR Study 2017Trend three – changes in demographics and employee expectations
Definition: The aging workforce combined with an increase of millennial workers and a greater ethnic diversity, and the expectations employees have of to their organizations.
The Nordics are facing demographic shifts with an aging population, increasing number of millennials and higher workforce diversity. Across the Nordics, the average working age is increasing, and large groups of the workforce is nearing retirement (Hörnström & Roto, 2013). The portion of people aged 65 years and older, as a percentage of working age population (15-64 years), is expected to increase by 24% by 2030 (Eurostat, 2017). This might lead to a rise in retirement and subsequent loss of important workforce competencies, but increases in retirement ages might also lead to a larger age diversity in the workforce. HR professionals should reflect on these trends and plan for a workforce where people have to work longer, and where more generations and nationalities will be working together in the same organizations.
Respondents from Sweden report a gradual curve of impact for the trend of millennials.“
1%
6% 7%
23%
29%
22%
13%
22%
14%
9%
25%
19%
9%
3%
0%
5%
10%
15%
20%
25%
30%
35%
To a very limitedextent
2 3 4 5 6 To a very largeextent
Perc
enta
ge o
f res
pond
ents
Multinational National
Figure 29 – To your notion, to what extent is your organization more internationally oriented (e.g. global benchmarking, global knowledge sharing) now than it was 3 years ago. Distribution of respondents by national and multinational organizations. Mean Multinational = 4,9; Mean National = 3,5

32
Nordic HR Study 2017
In the survey, we asked the respondents when the aging workforce would become relevant. For about 42% of the companies, it is already considered relevant. About 15% said it will be relevant in one to four years, and 25% estimated it will be relevant in five or more years (Figure 30). The distribution is similar across the Nordic countries. The Nordics have a larger concentration of people in the 55-64 age group compared to the rest of Europe (Hörnström & Roto, 2013). These are among the people who are considered working age in the population and who will likely retire within the next decade. This expected increase in retirement is probably contributing to respondents reporting aging as a relevant trend.
The Nordics have seen an increase in the age group above 65 years for a long time. However, the number of people considered “not working age” has increased more sharply since 2010. The age dependency ratio, people aged 65 or older as a percentage of the working age population, has increased by 4.6 percentage points since 2010 (Worldbank, 2017). The same ratio is expected to increase from 29% in 2015 to 36% in 20306 (Eurostat, 2017). Therefore, it is relevant to consider whether we are prepared for the potential impact this might have on organizations and society as a whole.
We also asked the respondents when the trend of increasing millennial workers (born from early 1990s to early 2000s) would become relevant. For about 34% of the companies, this trend is already considered relevant, and 29% reported it will be in the next one to four years (Figure 31 a).
Swedish companies reported a gradual curve of impact, suggesting that it will take longer time in Sweden for this trend to be relevant than in the other Nordic countries (Figure 31 b). There is no noticeable difference in distribution of age groups between the Nordic countries, and Sweden does not have fewer millennials than the rest of the Nordics (UNdata, 2015). This indicates that the Swedish respondents were assessing the relevancy of an increase in millennial workers, and not the volume of the increase. One explanation might be the differences in the age distribution in the Swedish organizations compared to the other countries. Another explanation could be differences in the assessment of how the increase in millennials might affect the workforce. The notion that age groups have
42%
15%
25%
13%
5%
0%
5%
10%
15%
20%
25%
30%
35%
40%
45%
Alreadyrelevant
1-4 years 5 or moreyears
N/A Don´tknow
Perc
enta
geof
resp
onde
nts
Figure 30 – To your notion, when will ageing of theworkforce become relevant to your industry?
Trend three – changes in demographics and employee expectations
34%
29%
22%
7% 8%
0%
5%
10%
15%
20%
25%
30%
35%
40%
Alreadyrelevant
1-4 years 5 or moreyears
N/A Don´tknow
Perc
enta
ge o
f res
pond
ents
Figure 31 a) – To your notion, when will increasing number of millennial workers be relevant to your industry
0%
10%
20%
30%
40%
50%
60%
Alreadyrelevant
1-4 years 5 or moreyears
N/A Don´tknow
Perc
enta
ge o
f res
pons
es
Denmark Finland IcelandNorway Sweden
Figure 31 b) – To your notion, when will increasing number of millennial workers become relevant to your industry? Trend relevancy Increasing number of millennials workers by country
6 Iceland is excluded from this forecast

33
Nordic HR Study 2017Trend three – changes in demographics and employee expectations
an empirical effect on work-related variables has been contested academically, and the effectiveness of targeted interventions addressing generational differences has not been established (Costanza et.al, 2012). On the other hand, CEOs and business leaders seem to be particularly concerned with the increase of millennial workers. A recent survey by Oxford Economics (2015) showed that 51% of business leaders reported a significant impact on workforce strategy from millennials entering the workforce.
Integration of demographics in strategic plansThe data shows that the degree of integration in strategic plans increases with perceived relevancy of the trends. As discussed initially in this section, we see that the response is significantly lower for the group that considered the trends relevant within one to four years, compared to those who considered the trends relevant now. The difference is larger for the trend of millennial workers than for aging workforce (Figure 32).
Compared to the other trends in the survey, the integration of aging workforce in strategic plans is perhaps surprisingly low for the group that considered it already relevant, especially knowing that this trend has been possible to foresee for many years. The same can be said about millennials, but this is integrated to a somewhat larger extent (Figure 2). In addition, the distribution of strategic integration scores (Figure 33) suggests that there are differences between organizations in relation to whether these demographic trends are a strategic issue. One hypothesis is that some organizations have already accounted for these trends, and thus no longer need to integrate them in strategic plans. For aging, this is supported by the finding that integration in strategic plans for those who consider it relevant in five or more years, is higher for aging workforce, than for the other trends (Figure 2). Alternatively, it could be an indication of suboptimal handling in some organizations.
3%
7%
15%
21%
26%
18%
9%
4%
9%
15%
22%26%
16%
9%
0%
5%
10%
15%
20%
25%
30%
To a very limitedextent
2 3 4 5 6 To a very largeextent
Perc
enta
ge o
f res
pond
ents
Ageing Millennials
Figure 33 – To what extent is the following trend integrated in strategic plans in your organization. Meanageing = 4,0 Mean millennials = 3,8
4,7 4,84,1
3,63,2 3,0
1
2
3
4
5
6
7
Ageing Millenials
Mea
n va
lue
(sca
le 1
-7)
Already relevant 1-4 years 5 or more years
Figure 32 – Mean score strategic integration by relevancy
34
Nordic HR Study 2017Trend three – changes in demographics and employee expectations
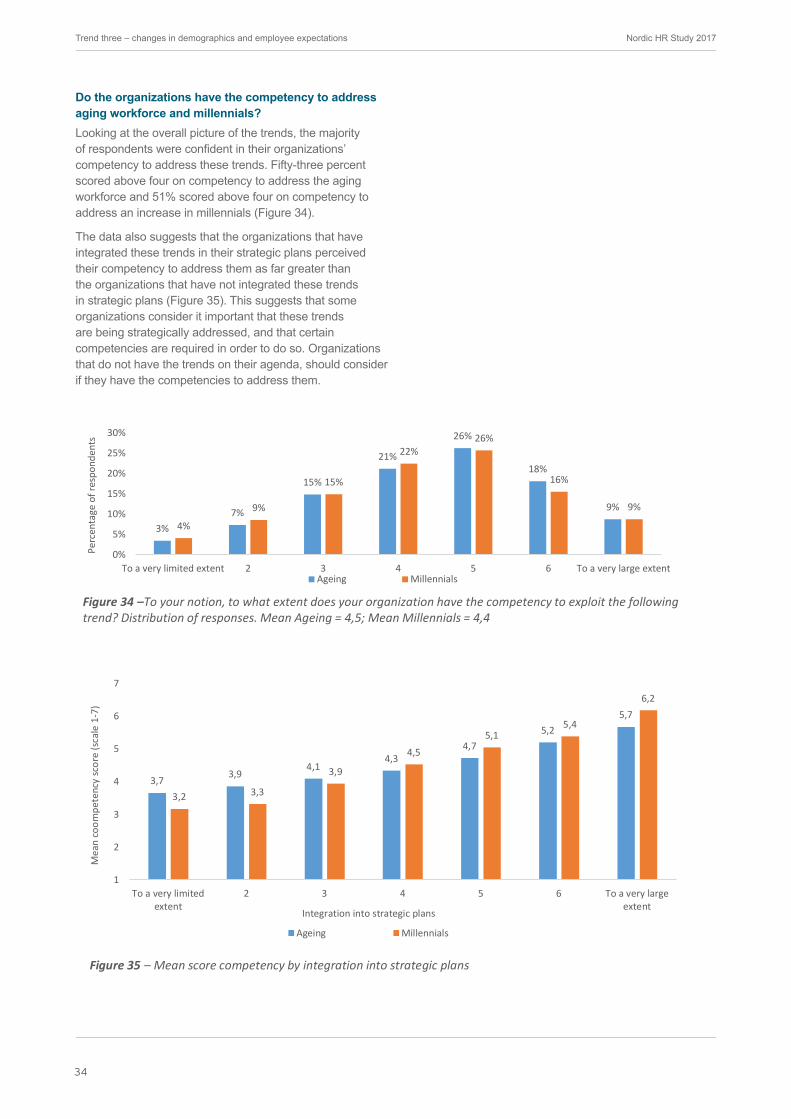
Do the organizations have the competency to address aging workforce and millennials? Looking at the overall picture of the trends, the majority of respondents were confident in their organizations’ competency to address these trends. Fifty-three percent scored above four on competency to address the aging workforce and 51% scored above four on competency to address an increase in millennials (Figure 34).
The data also suggests that the organizations that have integrated these trends in their strategic plans perceived their competency to address them as far greater than the organizations that have not integrated these trends in strategic plans (Figure 35). This suggests that some organizations consider it important that these trends are being strategically addressed, and that certain competencies are required in order to do so. Organizations that do not have the trends on their agenda, should consider if they have the competencies to address them.
3%7%
15%
21%
26%
18%
9%
4%
9%
15%
22%26%
16%
9%
0%
5%
10%
15%
20%
25%
30%
To a very limited extent 2 3 4 5 6 To a very large extent
Perc
enta
ge o
f res
pond
ents
Ageing Millennials
Figure 34 –To your notion, to what extent does your organization have the competency to exploit the following trend? Distribution of responses. Mean Ageing = 4,5; Mean Millennials = 4,4
3,7 3,94,1
4,34,7
5,25,7
3,2 3,3
3,9
4,5
5,15,4
6,2
1
2
3
4
5
6
7
To a very limitedextent
2 3 4 5 6 To a very largeextent
Mea
nco
ompe
tenc
ysc
ore
(sca
le1-
7)
Integration into strategic plans
Ageing Millennials
Figure 35 – Mean score competency by integration into strategic plans

35
Nordic HR Study 2017Trend three – changes in demographics and employee expectations
Changes in employee expectations We find that overall expectations from the employees have increased in the last three to five years. Some expectations have increased a lot, like “Meaningful vision” (5.2), “Flexible hours” (5.3), “Work-life balance” (5.2), and “Challenging tasks” (5.1). This suggests that organizations at some point need to address these expectations to secure a motivated and long-term productive workforce (Figure 36).
There are some differences in employee expectations within the Nordic countries. Norway reports less changes in employee expectations regarding both flexible workhours and work-life balance compared with the other Nordic countries (Figure 37). This might be because these have been important employee expectations for several years in Norway, which is indicated by the large amount of free time for Norwegian workers compared to other European countries, including Finland, Iceland and Sweden (Samfunnsspeilet/SSB, 2005, OECD, 2011). Compared to Norway, Sweden is demonstrating greater changes in employee expectations regarding flexible workhours and work-life balance.
The same applies to Finland for flexible workhours and Iceland for work-life balance (Figure 37). Employee expectations regarding work-life balance in Iceland is perhaps not suprising concidering that Iceland is ranked 31 out of 38 countries in the OECD How´s life Measuring well-being report. Overall, 13.8% in Iceland are working very long hours (>50 hours a week), compared to 1%-4% in the other Nordic countries.
5,2 5,3
4,6
5,24,8
5,1
4,55,1
4,34,7 4,9
1
2
3
4
5
6
7
Mea
ning
ful v
ision
Flex
ible
wor
khou
rs
Soci
al e
ngag
emen
t of
empl
oyee
s
Wor
k/lif
e ba
lanc
e
Rew
ard
and
mon
ey
Chal
leng
ing
task
s
Job
secu
rity
Care
er d
evel
opm
ent
oppo
rtun
ities
Offi
ce lo
catio
n
Life
-pha
se o
rient
edpo
licie
s
Task
and
job
auto
nom
y
Mea
nva
lue
(1-7
)
Figure 36 – To your notion, to what extent has employee expectations within your company changed in the following categories the last 3 – 5 years? Mean scores of change employee expectation. 1 = substantially decreased expectations, 4 = neutral, 7 = substantially increased expectations
Figure 37 – To your notion, to what extent has employee expectations within your company changed in the following categories the last 3 – 5 years? Mean scores of change employee expectation by country. 1= substantially decreased expectations, 4= no change, 7= substantially increased expectations
5,55,25,2
5,65,0 4,9
5,6 5,6
1
2
3
4
5
6
7
Flexible workhours Work/Life balance
Mea
n va
lue
(sca
le 1
-7)
Finland Iceland Norway Sweden

36
Nordic HR Study 2017Trend three – changes in demographics and employee expectations
There were also some interesting differences between sectors. The private sector reports greater changes in employee expectations regarding flexible workhours and work-life balance compared to the public sector (Figure 38). This is likely due to existing differences in work-life balance between these sectors. In addition, the private sector is more concerned with vision and job security (Figure 38). The difference regarding job security is perhaps surprising as the trends that might affect job security are likely to affect both sectors. This could indicate that the public sector is less aware of the consequences of these trends.
SummaryThe demographic trends of aging and millennials in the workforce are for the most part considered already relevant or soon to be relevant. There are indications that some organizations have already accounted for these trends, as is appropriate considering their predictability.
Overall, employee expectations are high. Employees want more out of their working life, and they want more free time. The pressure on organizations to keep employees satisfied by combining meaningful vision, flexibility, work/life balance and challenging tasks is increasing. Getting this balance right might be crucial for organizations that want to keep talent in a future of contingent workers and gig economy.
The private sector reports greater changes in employee expectations regarding flexible work-hours and work-life balance compared to the public sector.”

37
Nordic HR Study 2017Trend three – changes in demographics and employee expectations

38
Nordic HR Study 2017
Key findings for flexible and global workforce• Organizations that report data analytics to be relevant for their industry right now are
to a larger extent integrating it into their strategic plans and focusing on building analytical competencies.
• Eighty percent of respondents consider HR analytics important, but only 37% reported that they are satisfied with the performance of HR departments in HR analytics.
• HR analytics is mainly used for descriptive and diagnostic purposes rather than predictive and prescriptive purposes.
Trend four – data analytics
39
Nordic HR Study 2017Trend four – data analytics
Definition: Data analytics to explain past scenarios, predict future scenarios and automate decision making.
In this part, we explore two different aspects of data analytics: 1) how the organization as a whole is responding to increased focus on data analytics, and 2) how HR is responding to the growing field of people analytics.
We define data analytics as explaining past scenarios, predicting future scenarios and automating decision-making. The term includes various types of data analysis, and can be divided into four main types:
1. Descriptive analytics (describes what has happened over a given period)
2. Diagnostic analytics (focuses more on why something has happened)
3. Predictive analytics (focuses on what is likely to happen in the near term)
4. Prescriptive analytics (focuses on suggesting a course of action)
Data and analytics are increasingly integral in creating competitive advantages for modern businesses. In a paper published by EY and Forbes Insights in 2015, it was argued that leaders gained competitive advantage from data and analytics because it created a noticeable shift in their companies’ ability to meet competitive challenges. The 2016 Data & Analytics Report by MIT Sloan Management Review shows that companies that are successful with analytics are more likely to have a strategic plan for analytics, and that this is frequently aligned with the overall strategy of the organization.
People analytics, defined as “the use of data and analytic tools to identify insights on people that enable faster, more accurate, and more confident business decision-making” (Green, 2017, p. 4), will increasingly become an important factor for Nordic HR. It has been argued that companies with capabilities in people analytics outperform their peers in quality of hire, retention and leadership capabilities (Oxford Economics, 2015). People management in general will need to become more strategic and more evidence-based to accommodate the more flexible and diverse workforce of the future.
Companies that are successful with analytics are more likely to have a strategic plan for analytics.”

40
Nordic HR Study 2017
Analytics in the business The survey results indicate that data analytics is generally perceived as relevant for Nordic organizations. Approximately 83% of respondents reported descriptive analytics to be relevant now or within four years, and 80% reported predictive analytics to be relevant within the same timeframe (Figure 39).
If we look at strategic integration of descriptive and predictive analytics, over half of the respondents reported that they have integrated descriptive analytics into their strategic plans to a large extent (Figure 40).
Not surprisingly, the integration is higher for descriptive than predictive analytics, since descriptive analytics is seen as a prerequisite for predictive analytics as it allows us to summarize and understand historical data, but does not enable forecasting.
As shown in part two, there is a link between perceived relevancy and strategic integration. This holds true for analytics as well. It seems like the respondents who consider data analytics relevant now have integrated these trends into their strategic plans to a larger extent than others (Figure 41).
Trend four – data analytics
57%
26%
4% 5%8%
47%
33%
5% 6%10%
0%
10%
20%
30%
40%
50%
60%
Alreadyrelevant
1-4 years 5 or moreyears
N/A Don´tknow
Perc
enta
ge o
f res
pond
ents
Analytics; current state Analytics; predictive
Figure 39 – To your notion, when will these trends be relevant to your industry? Distribution of respondents by trend
8% 9%
15% 15%
25%
16%13%
10% 11%
15%
19%22%
12% 11%
0%
5%
10%
15%
20%
25%
30%
To a very limitedextent
2 3 4 5 6 To a very largeextent
Perc
enta
ge o
f res
pond
ents
Analytics; current situation Analytics; predictive
Figure 40 – To what extent is the following trend integrated into strategic plans in your organization? Distribution of respondents by trend
5,0 5,0
3,8 3,6
2,6 2,6
1
2
3
4
5
6
7
Analytics; current situation Analytics; predicitve
Mea
nva
lue
(sca
le1-
7)
Already relevant 1-4 years ≥ 5 years
Figure 41 - To what extent is the following trend integrated into strategic plans in your organization? Mean value by relevancy of trend
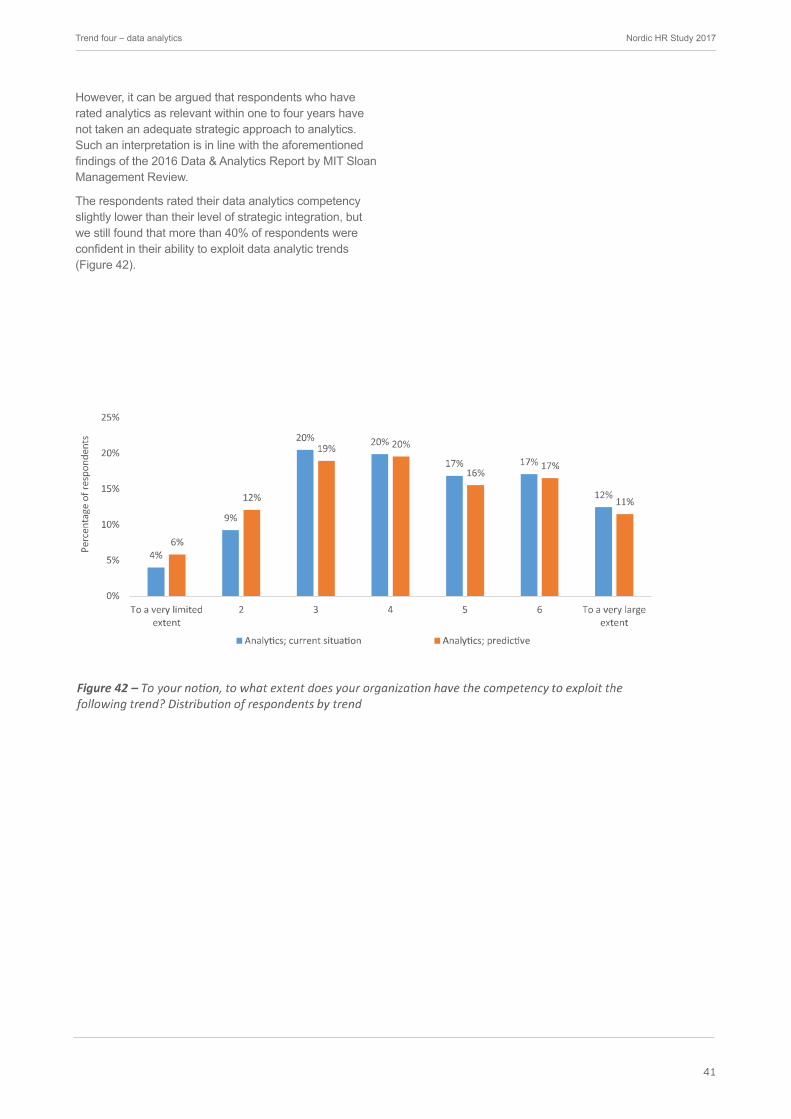
41
Nordic HR Study 2017Trend four – data analytics
However, it can be argued that respondents who have rated analytics as relevant within one to four years have not taken an adequate strategic approach to analytics. Such an interpretation is in line with the aforementioned findings of the 2016 Data & Analytics Report by MIT Sloan Management Review.
The respondents rated their data analytics competency slightly lower than their level of strategic integration, but we still found that more than 40% of respondents were confident in their ability to exploit data analytic trends (Figure 42).

42
Nordic HR Study 2017Trend four – data analytics
When we look at the results from the countries represented in the survey, the mean scores on current state and predictive analytics are relatively similar between countries, with Iceland having the highest mean score in the group (Figure 43).
However, as with strategic integration, the relevancy rating of data analytics seem to have a large effect on the competency score. The respondents who considered analytics already relevant have a higher competency score than the ones who believed it will be relevant within the next one to four years (Figure 44).
4,9 4,9
3,8 3,8
2,7 2,5
1
2
3
4
5
6
7
Analytics; current situation Analytics; predicitve
Mea
n va
lue
(sca
le 1
-7)
Already relevant 1-4 years ≥ 5 years
Figure 44 – To your notion, to what extent does your organization have the competency to exploit the following trend? Mean value by trend relevancy
Overall, the results indicate that the importance of analytics is starting to become apparent to most of our respondents. However, when it comes to strategic integration and competencies there is clearly room for improvement. This could mean further investment in recruiting and developing analytical capabilities and an overall increase in demand for these skills.
Analytics in HRAnalytics is not only a trend that influences the business as a whole; it is also gaining traction within HR departments. The survey data indicates that the respondents consider HR analytics, information and reporting very important. However, the performance of the respondents in this particular area seems to be relatively weak compared to the reported importance.
Approximately 80% of respondents reported that they think HR analytics is important while only 37% reported that they are satisfied with their HR departments’ current performance (Figure 45). This might indicate that respondents recognize the need for better performance in HR analytics, but struggle to achieve it, perhaps due to a lack of competencies, investment or strategic focus.

43
Nordic HR Study 2017Trend four – data analytics
Respondents recognize the need for better performance in HR analytics, but that their organizations struggle to achieve it.”
Industry seems to have an effect on the importance and performance ratings of HR analytics. We find the biggest gaps between importance and performance in the industries research and education, media, banking and health care (Figure 46). These gaps seem to be caused by an above average importance rating. The industry that has the highest rated performance is the maritime industry. They score a mean of 4.8 on performance, which is significantly different from the average of the other industries (p=0.034).
5,9
4,95,3 5,1
6,05,8
5,3
6,05,7
5,45,8 5,8
5,5 5,35,6 5,4
4,1 4,24,6 4,4 4,6
3,84,2
3,9
4,8
3,6 3,5
4,4
3,74,1 4,3
4,0
1
2
3
4
5
6
7
Bank
ing/
finan
ce/in
cura
nce
Cont
ruct
ion/
real
est
ate
Cons
ultin
g se
rvic
es/p
reof
essio
nal s
ervi
ces
Pow
er a
nd u
tilite
s
Heal
th c
are/
life
scie
nce/
soci
al c
are
serv
ices
Indu
stry
IT/t
elek
om
Med
ia/in
form
atio
n/co
mm
unic
atio
n
Mar
itim
e/sh
ippi
ng/t
rans
port
aion
/logi
stic
s
Oil
and
gas
Reas
erac
h/te
achi
ng/e
duca
tion
Spec
ial i
nter
est g
roup
Stat
e/co
unty
aut
horit
y/m
unic
ipal
ity
Tour
ism/h
orpi
talit
y se
ctor
Trad
e/w
hole
sale
/con
sum
er p
rodu
cts
Oth
er- s
peci
fy
Mea
n va
lue
(sca
le 1
-7)
HR Area; Importance HR Area; Performance
Figure 46 – Rating of importance and current performance within HR analytics

44
Nordic HR Study 2017Trend four – data analytics
One explanation for this difference might be that organizations in the martitime industry were early adopters of data and analytical technology in their logistical decision-making. This may have been more important for these organizations’ competitiveness than for organizations representing other industries. HR analytical capability usually benefits from a mature data collection and analytical capability on the corporate level.
If we examine the types of data analytics approaches that HR uses, we find that they mainly employ descriptive and diagnostic analytics (Figure 47). These results are consistent across countries. It might seem like the respondents struggle to adapt to the demands of a more data-driven HR organization. Another explanation might be that HR analytics currently does not demand the most advanced statistical approaches in order to benefit the business.
4,1
3,3
2,8 2,9
1
2
3
4
5
6
7
Analyticalapproach;descriptive
Analyticalapproach;diagnostic
Analyticalapproach;predictive
Analyticalapproach;
prescriptive
Mea
n va
lue
(sca
le 1
-7)
Figure 47 - To your notion, to which degree does HR in your organization use the following analytical approaches?

45
Nordic HR Study 2017Trend four – data analytics
The size of the organization also seems to have a significant effect on how HR organizations use the different analytical approaches (Figure 48). Respondents from companies with more than 5,000 employees score significantly higher than the rest of the population on descriptive (p=<0.01), diagnostic (p=0.02) and predictive (p=0.05) analytical approaches.
The results may indicate that larger organizations invest more heavily in HR analytics and see greater benefits from being data-driven in their approach to HR. It is worth noting that the scores are relatively similar in companies from 51 to 5,000 employees. This is somewhat surprising as one could argue that there are substantial differences between organizations with for instance 50, 500 and 5,000 employees. We also observe that companies with more than 5,000 employees consider the need and benefit of people analytics more important compared to smaller companies.
3,4
4,0 4,1 4,1
4,8
3,13,3 3,3 3,4
3,8
2,9 2,8 2,7 2,8
3,3
1
2
3
4
5
6
7
0-50 51-250 251-1000 1001-5000 More than 5000employees
Mea
n va
lue
(sca
le 1
-7)
Analytical approach; descriptive Analytical approach; diagnostic Analytical approach; predictive
Figure 48 – To your notion, to which degree does HR in your organization use the following analytical approaches? Mean value by company size
SummaryThe focus on data analytics in scientific journals, business publications and other media seems to have made an impact in Nordic organizations. We observe a strong awareness among our respondents to the relevancy of both descriptive and predictive analytics, but there seems to be a need for Nordic businesses to take a strategic approach to data analytics. Organizations that reported that they regard data analytics as relevant now are to a larger extent integrating it into their strategic plans, and have started to build their competencies in the field.
When we look at HR and people analytics, it seems like HR in the Nordics are lacking analytical competencies. They are largely suspended in the descriptive stages of analytics and have not yet managed to advance beyond this. If the future is driven by data, HR should consider where people decisions fit into this landscape.
46
Summary – part twoIn part two, we have taken a more detailed look into each of the four trends introduced in part one. For trend one, job and task automation, seven out of ten participants anticipated that more than 10% of their HR processes will be automated within three to five years. Moreover, larger organizations (with more than 250 employees) are more likely to automate their processes in the near future. Hence, these organizations need to set a clear direction for integrating process automation into their strategies, and prepare for handling potential individual consequences of automation. It is especially important to develop new competencies for individuals with the most repetitive tasks. When we looked at industry differences, we found that banking and IT anticipate a significantly higher rate of automation than other industries.
Moving on to trend two, flexible and global workforce, we raised the question of how important contingent workforce was for the respondents’ industries. Three out of five reported that they expect an increased use of contingent workforce within one to four years. However, there were significant differences between private and public sector. Even though most respondents considered contingent workforce to be relevant in the near future, we found that the trend of workforce on demand is not prevalent in the Nordics.
Trend three concerned changes in demographics and employee expectations. As the average age of the world population rises, the aging workforce is becoming more relevant than ever. Three out of five respondents reported that aging workforce and millennials are relevant now. Despite this, respondents reported that aging workforce is the trend that is the least included in their strategic plans. Employee expectations are overall high, and organizations need to address these expectations in order to keep their talent.
Over the last years, we have seen a significant increase in the use of different software for HR analytics. Our study indicates that organizations that find analytics relevant for their industry now have integrated it into their strategic plans and build analytical competencies to a larger extent than those who do not consider the trend relevant yet. However, while 80% of respondents considered HR analytics important, only 37% reported that they are satisfied with the performance of their HR departments in HR analytics. This indicates that there is considerable room for improvement in many organizations for building competencies in analytics.

47
Summary – part two Nordic HR Study 2017

48
Nordic HR Study 2017
Key findings for HR’s role in responding to the four trends• Respondents find it difficult to prioritize which HR areas they should focus on
improving, and are not satisfied with current performance in many of the HR areas.
• Organizational development, leadership development and talent development is generally considered important, but there is a substantial gap between the reported importance for improvement and current performance in these areas.
• The four trends have many implications for HR departments. This includes organization, expertise, collaboration across boundaries, identity and motivation, and established power relations.
• It is impossible to predict what the future working life will look like and which implications this might have for the HR function. Organizations therefore need to develop capabilities that enable them to balance between exploration and exploitation. In addition, the managerial mindset in some organizations needs to change from regarding failure as not acceptable towards seeing failure as a natural byproduct of learning and experimentation.
Part three – HR’s role in responding to the four trends
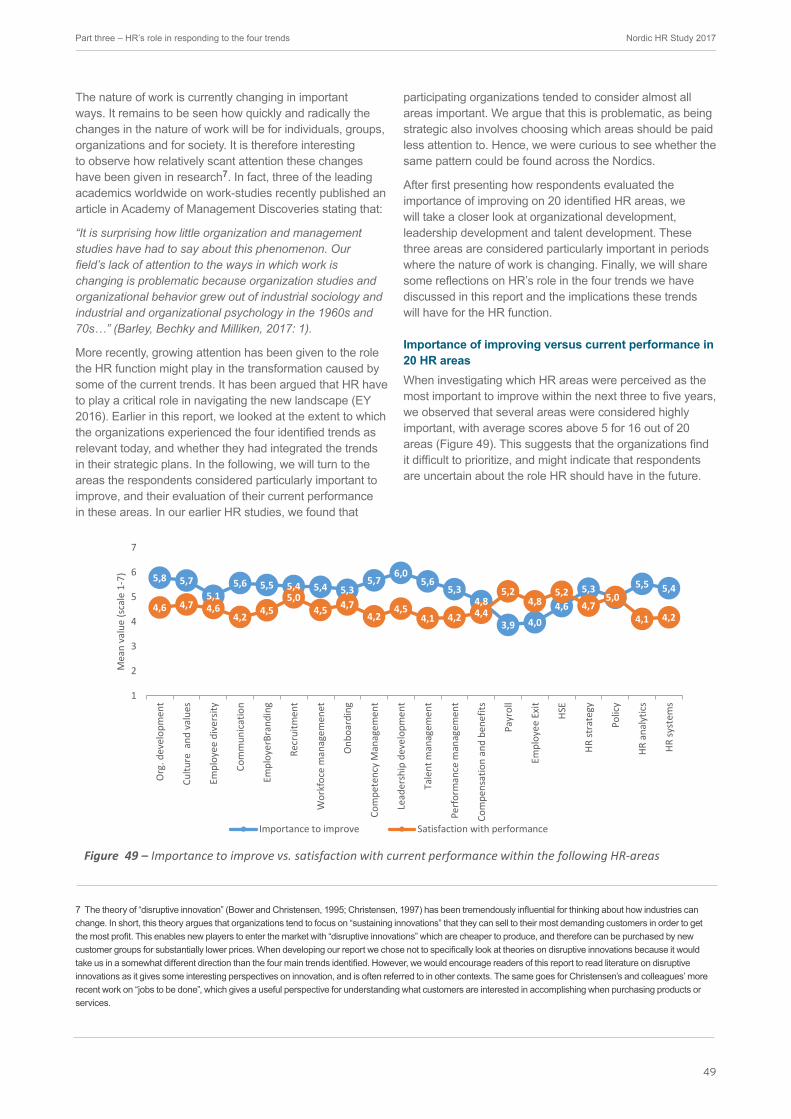
49
7 The theory of “disruptive innovation” (Bower and Christensen, 1995; Christensen, 1997) has been tremendously influential for thinking about how industries can change. In short, this theory argues that organizations tend to focus on “sustaining innovations” that they can sell to their most demanding customers in order to get the most profit. This enables new players to enter the market with “disruptive innovations” which are cheaper to produce, and therefore can be purchased by new customer groups for substantially lower prices. When developing our report we chose not to specifically look at theories on disruptive innovations because it would take us in a somewhat different direction than the four main trends identified. However, we would encourage readers of this report to read literature on disruptive innovations as it gives some interesting perspectives on innovation, and is often referred to in other contexts. The same goes for Christensen’s and colleagues’ more recent work on “jobs to be done”, which gives a useful perspective for understanding what customers are interested in accomplishing when purchasing products or services.
Nordic HR Study 2017Part three – HR’s role in responding to the four trends
The nature of work is currently changing in important ways. It remains to be seen how quickly and radically the changes in the nature of work will be for individuals, groups, organizations and for society. It is therefore interesting to observe how relatively scant attention these changes have been given in research7. In fact, three of the leading academics worldwide on work-studies recently published an article in Academy of Management Discoveries stating that:
“It is surprising how little organization and management studies have had to say about this phenomenon. Our field’s lack of attention to the ways in which work is changing is problematic because organization studies and organizational behavior grew out of industrial sociology and industrial and organizational psychology in the 1960s and 70s…” (Barley, Bechky and Milliken, 2017: 1).
More recently, growing attention has been given to the role the HR function might play in the transformation caused by some of the current trends. It has been argued that HR have to play a critical role in navigating the new landscape (EY 2016). Earlier in this report, we looked at the extent to which the organizations experienced the four identified trends as relevant today, and whether they had integrated the trends in their strategic plans. In the following, we will turn to the areas the respondents considered particularly important to improve, and their evaluation of their current performance in these areas. In our earlier HR studies, we found that
participating organizations tended to consider almost all areas important. We argue that this is problematic, as being strategic also involves choosing which areas should be paid less attention to. Hence, we were curious to see whether the same pattern could be found across the Nordics.
After first presenting how respondents evaluated the importance of improving on 20 identified HR areas, we will take a closer look at organizational development, leadership development and talent development. These three areas are considered particularly important in periods where the nature of work is changing. Finally, we will share some reflections on HR’s role in the four trends we have discussed in this report and the implications these trends will have for the HR function.
Importance of improving versus current performance in 20 HR areas When investigating which HR areas were perceived as the most important to improve within the next three to five years, we observed that several areas were considered highly important, with average scores above 5 for 16 out of 20 areas (Figure 49). This suggests that the organizations find it difficult to prioritize, and might indicate that respondents are uncertain about the role HR should have in the future.
5,8 5,75,1
5,6 5,5 5,4 5,4 5,35,7
6,05,6
5,34,8
3,9 4,04,6
5,35,0
5,5 5,4
4,6 4,7 4,64,2 4,5
5,04,5 4,7
4,24,5
4,1 4,2 4,4
5,24,8
5,24,7
4,1 4,2
1
2
3
4
5
6
7
Org
. dev
elop
men
t
Cultu
re a
nd v
alue
s
Empl
oyee
div
ersit
y
Com
mun
icat
ion
Empl
oyer
Bran
ding
Recr
uitm
ent
Wor
kfoc
e m
anag
emen
et
Onb
oard
ing
Com
pete
ncy
Man
agem
ent
Lead
ersh
ip d
evel
opm
ent
Tale
nt m
anag
emen
t
Perf
orm
ance
man
agem
ent
Com
pens
atio
n an
d be
nefit
s
Payr
oll
Empl
oyee
Exi
t
HSE
HR st
rate
gy
Polic
y
HR a
naly
tics
HR sy
stem
s
Mea
n va
lue
(sca
le 1
-7)
Importance to improve Satisfaction with performance
Figure 49 – Importance to improve vs. satisfaction with current performance within the following HR-areas

50
Nordic HR Study 2017Part three – HR’s role in responding to the four trends
Respondents perceived leadership and organizational development, culture and values, and competency and talent management as the most important areas to improve. In line with this, competency and talent management are also two areas where respondents are least satisfied with current HR performance. In addition, the respondents are less satisfied with HR performance in communication, HR analytics and HR systems.
In contrast, we see that HR consider themselves to perform somewhat better in traditional HR areas, such as payroll, recruitment, employee exit, and health, safety and environment (HSE). This finding is also in line with results from our previous HR studies. In accordance, payroll, employee exit and HSE are considered the least important areas to improve. Interestingly, the results show a wide
Respondents reported that it is important to improve performance in 16 out of 20 HR areas.”
range in perceived performance within these traditional HR tasks, especially regarding payroll and employee exit. This can imply that some organizations are still concerned with getting the basics right, whereas others either do not acknowledge the importance of more traditional tasks or are relatively satisfied with their performance and therefore turn their attention toward more strategic aspects. This is interesting since Dave Ulrich and the RBL Group in several of their publications have underscored the importance of ensuring that HR play multiple roles in organizations and that unless the more traditional HR areas have a high standard, the HR function cannot be considered a strategic partner. The HR Competency (RBL Group, 2015) study shows that the individual HR professionals have little impact and importance compared to the HR department. A functional HR team working together to adapt to trends is nine times as impactful for internal stakeholders such as line managers and employees. This is a strong argument for HR departments to look at the four trends not as individual deliveries, but as a whole. The process gets momentum when the HR department works as a team, not as individual experts.
Concerning the satisfaction with performance within the HR areas in question, there are differences between sectors. In general, the private sector reported higher performance than the public sector, with the exception of performance in recruitment and leadership development (Figure 50).
1
2
3
4
5
6
7
Org
. dev
elop
men
t
Cultu
re a
nd v
alue
s
Empl
oyee
div
ersit
y
Com
mun
icat
ion
Empl
oyer
Bra
ndin
g
Recr
uitm
ent
Wor
kfoc
e m
anag
emen
et
Onb
oard
ing
Com
pete
ncy
Man
agem
ent
Lead
ersh
ip d
evel
opm
ent
Tale
nt m
anag
emen
t
Perf
orm
ance
man
agem
ent
Com
pens
atio
n an
d be
nefit
s
Payr
oll
Empl
oyee
Exi
t
HSE
HR st
rate
gy
Polic
y
HR a
naly
tics
HR sy
stem
s
Mea
n va
lue
(sca
le 1
-7)
Government/public sector Private sector
Figure 50 –Satisfaction with current performance within the following HR-areas by sector

51
Nordic HR Study 2017Part three – HR’s role in responding to the four trends
More specifically, the private sector reported significantly higher performance than the public sector in areas such as organizational development, culture and values, competency, performance and talent management, HR analytics, and HR systems. The private sector also reported better performance in more basic HR areas such as onboarding and employee exit (Figure 50). One potential explanation of this sector difference is that there is stronger competition between private sector organizations, so they need a more strategic approach to be more efficient, and to attract, recruit, develop and retain their employees. There could also be differences in terms of what type of people are recruited to work with HR in these two sectors.
Further, we looked into whether the results differed based on the size of the organization. We found that organizations with less than 50 employees reported higher satisfaction with several HR areas (Figure 51). One explanation could be that smaller organizations can be somewhat easier to manage. Another possible explanation is that smaller organizations may have lower expectations for performance. In addition, HR associations in Finland and Iceland reported that several of their small member companies are new startups. These organizations might have new innovative ways of organizing their HR functions, resulting in better performance.
1
2
3
4
5
6
7
Org
. dev
elop
men
t
Cultu
re a
nd v
alue
s
Empl
oyee
div
ersit
y
Com
mun
icat
ion
Empl
oyer
Bra
ndin
g
Recr
uitm
ent
Wor
kfoc
e m
anag
emen
et
Onb
oard
ing
Com
pete
ncy
Man
agem
ent
Lead
ersh
ip d
evel
opm
ent
Tale
nt m
anag
emen
t
Perf
orm
ance
man
agem
ent
Com
pens
atio
n an
d be
nefit
s
Payr
oll
Empl
oyee
Exi
t
HSE
HR st
rate
gy
Polic
y
HR a
naly
tics
HR sy
stem
s
Mea
n va
lue
(sca
le 1
-7)
0-50 51-250 251-1000 1001-5000 >5000
Figure 51 – Satisfaction with current performance within the following HR-areas by company size

52
Nordic HR Study 2017Part three – HR’s role in responding to the four trends
Organizational development, leadership development and talent developmentMost respondents consider organizational development, leadership development and talent development particularly important.
The focus on organizational development and culture as important improvement areas can be justified given the context in which organizations now operate. Organizations are facing rapid changes in an unpredictable market (EY 2016). More complex problems and unknown solutions require a significantly different organization than one that is primarily organized for efficiency and effectiveness. Turning the attention toward organizational and cultural development may indicate that the Nordic organizations realize that they have to develop capabilities that enable them to balance between “exploration and exploitation” (March, 1991), and to facilitate speed, adaptability and innovation.
More uncertainty, increased information availability and digital innovations call for changes in how organizations perform leadership. The attention the respondents of this survey give to leadership development may reflect that organizations are preparing to lead a workforce that expects more autonomy and authority than before. The expectations of a new workforce composition is further supported by an interesting study, which found that more than 80% of large organizations plan to substantially increase their flexible workforce (Intuit, 2010). The shift we expect to see in workforce composition, due to greater use of contingent workers and increased job automation, requires leaders that are capable of leveraging the total talent of its people to realize the full potential of these changes. We believe that the new reality requires leaders who coach and develop their people by asking the right questions, putting together complementary skills and experiences, and encouraging innovation.
Another major factor affecting leadership is the demographic differences we are now beginning to experience. With the new technological developments, we expect to see greater differences in how experienced executives and young talents are thinking and reacting to these innovations. Subsequently, it is important to focus on minimizing the gap in digital capabilities between the experienced employees in leadership positions and younger employees born in the digital era.
The results of this survey show that organizations are giving more attention to improving talent and developing competency, which is not surprising given the accelerated pace of change in the market. As an example, employees will lose some of their old tasks and gain new ones as various processes are being automated. The Norwegian Trade Organization goes as far as saying that machines might replace one third of all current jobs in Norway within the next 20 years (NHO, 2016). We also expect that
the remaining non-automated tasks will have a higher complexity that requires new knowledge and skills to master. Talent and competency development are also areas that are prone to demographic-led changes in expectations. As Jacob Morgan (2014) argues, “employees which were once thought of as expendable cogs are the most valuable assets that any organization has.” This indicates a power-shift from the employer to the employees who to a larger degree can demand and expect a structured plan for competency development. It also highlights the competition for talent that organizations will need to work hard to attract, develop and retain.
5,8 6,05,6
4,6 4,54,1
1
2
3
4
5
6
7
Organizationaldevelopment
Leadershipdevelopment
Talentmanagement
Mea
n va
lue
(sca
le 1
-7)
Importance Performance
Figure 52 – HR process: importance to improve vs. current performance, mean scores.
Machines are bad at creativity, interpersonal skills and emotional intelligence and physical mobility.” (Brynjolfsson, 2017).

53
Nordic HR Study 2017Part three – HR’s role in responding to the four trends
Possible implications of the four trends for HRFor several years, scholars and practitioners have been questioning whether the HR department is capable of taking a strategic role. We argue that considering the pace of change and business complexity as well as the uncertainty businesses face today, HR do not have much choice. Rapid and unpredictable changes to business, as well as technological, political and economic factors require that organizations become dynamic and adaptable. Individual, organizational and leadership capabilities are all important elements in this and HR must give valuable insights to all these capabilities when contributing to strategic discussions. Successful HR functions work strategically and play a key role in critical business decisions. At the highest level of HR strategic integration, we see a continuous and corresponding coupling between people insights and the business strategy (Dysvik and Kuvaas, 2016).
A key question that every organization needs to ask is what role people will play in a more automated world. Company performance depends largely on the fit between people and jobs, and designing effective and productive collaborations between people and technology in times when jobs and their corresponding tasks are quickly and continuously changing. As Brynjolfsson (2017) argues, it is more useful to think about tasks rather than jobs since many jobs have elements of creativity, interpersonal skills and emotional intelligence, which are difficult to replace by machines. In a recent article by the New York Times, a table developed by the Bureau of Labor Statistics provides an overview of how susceptible jobs are to computerization (Figure 53). Clearly, the automation of jobs and tasks will have important implications for the competencies organizations need, but these changes may also influence the psychological contracts with employees that considered their jobs safe and stable.
Figure 53 – How susceptible different types of jobs are to computerization (Miller and Bui, 2017).

54
Nordic HR Study 2017Part three – HR’s role in responding to the four trends
In relation to the increasing use of contingent workers and more flexible working arrangements, how should organizations manage the pool of an adaptable and creative mix of contingent and permanent employees, and bring them and the business strategy together? Jon Younger at the RBL Group talks about “agile talent” and argues that HR needs to take more responsibility for people working both inside and outside of the organization. The current changes in working life challenge many of the traditional boundaries between individuals, groups, organizations and fields, and in academic research, we therefore see increased interest in what is often referred to as “boundary work”. The notion of “boundary work” was originally coined by Gieryn (1983) to describe the discursive strategies used by scientists to demarcate science from non-science. Later, applying this to other domains has proved useful for describing how changes in working life is affecting ways of collaborating, jurisdictions, expertise, and the role that technology often plays in these processes (see for instance Allen, 2000; Burri, 2008; Mørk et al. 2012; Edlinger, 2015; O’Mahony and Bechky, 2008)). Whereas some boundaries are more stable, for instance between professions, other boundaries are clearly negotiated and constructed. The changes in the nature of work is also linked to identity and motivation (Okhuysen et al., 2013) and expertise (Sandberg et al., 2017). And when new technology is introduced, this tends to challenge the established power structures, jurisdictions and division of labor (Barley, 1986; Barrett et al., 2012). As Nicolini (2007:917) put it, “there is no change in practice without empowerment and disempowerment”.
Further, this survey indicates that it seems to be a while before HR consider themselves to have the required level of expertise in analytics. In a world that generates information much faster than all human beings collectively can manage, data and analytics will be instrumental in achieving competitive advantage. Data and analytics change the way decision-makers think about business problems and HR will need to develop their skills in this area further. HR professionals also need to use important sources of information that contribute to operational excellence more strategically, like people data, competency databases, recruitment systems and reporting. We believe that there is more to the capability gap than HR practitioners’ own perceived lack of competency. A lack of focus on capabilities can potentially lead to reduced credibility for HR professionals and businesses taking insufficient account of important people aspects as a result. Leaders in the HR organizations can also contribute with important input here as they as part of the larger HR function should be familiar with their employees’ concerns.
The future business landscape is uncertain for all people regardless of their position in the organizations. Numerous studies have underscored how even experts are not capable of predicting the future. Philip Tetlok, Professor at the University of Pennsylvania, has conducted studies in this field for more than 20 years. In one of his most famous studies, he analyzed over 82,000 statements from 284 experts from economics, political science, history, journalism and so forth, and found that a clear pattern with their predictions is that they tend to be incorrect (Tetlock, 2005). Similar findings have been made about predictions from physicians, economists and lawyers (Poses and Anthony, 1991; Braun and Yaniv, 1992; Kritzer, 1990; 1991). More recently, events such as the election of Donald Trump as President of the United States and Brexit also illustrate how difficult it can be to predict the future.
In conclusion, in this study we have seen that HR professionals found the four identified trends to be relevant now or in the near future. The extent to which these trends are integrated in the respondent organizations’ strategies varies. We also observe that respondents considered it important to improve many HR areas, while their current performance is relatively low. The changing nature of work therefore represents interesting opportunities for HR professionals to contribute with important people insights as organizations try to balance between exploration and exploitation (March, 1991). This may also call for changing the managerial mindset in many organizations, which has tended to focus solely on success, thereby limiting the opportunities to learn from failure. Studies by Harvard Business School Professor Amy Edmondson and colleagues have found that even though both individuals and organizations may be interested in learning from failure, very few do so in a systematic way. Hence, their focus is on controlling costs and on the daily operations rather than on developing more novel products and practices. Cannon and Edmondson (2004) recommend three strategies for systematically learning from failure: 1. identifying, 2. analyzing and 3. deliberate experimentation. By doing so, organizations might shift the managerial mindset toward seeing failure as a natural byproduct of learning and experimenting. In a worklife characterized by relatively rapid changes rather than stability, the ability to have a more systematic and reflective approach to learning is important. HR professionals have an opportunity to contribute to developing this capability in their organizations.

55
Nordic HR Study 2017Part three – HR’s role in responding to the four trends

56
Part four – appendix
Nordic HR Study 2017

57
Nordic HR Study 2017Methodology
8 Only includes respondents that answered more than background variables
MethodologyThe Nordic HR Study 2017 was conducted by HR Norge, Flóra, HENRY, Sveriges HR Förening and EY. The aim of the study was to contribute to our understanding of how work is changing in the Nordics, and to look at global trends from a Nordic perspective.
Process for identifying trends and generating hypothesis Several publications have discussed trends and changes in the workforce and why these are emerging. Examples are the World Economic Forum that published a workforce report titled The Future of Jobs (2016), Oxford Economics that wrote a series of reports under the Workforce 2020 banner (2015), the Economist that wrote an article detailing the gig economy called There’s an App for That (2015) and EY that published a report called The Upside of Disruption (2016). A working group with representatives from all five Nordic countries evaluated these trends from a national and a Nordic point of viewperspective. Based on these discussions, the four trends presented earlier in this report were identified as particularly relevant.
Survey structure and data collectionThe present report is based on data from an online survey conducted between 7-31 March 2017 in Denmark, Finland, Iceland, Norway and Sweden. We sent invitations by e-mail to HR representatives in companies selected among members of the Nordic HR associations, and in Denmark to EY clients. Subsequently, we sent out tree reminders. In total, 5,922 HR representatives received an invitation and 6448 responded (11%). However, the number of invitations and response rate varied between the countries (Figure 54 a, b). The membership structure in the HR associations also varies. In some countries, the membership is individual, whereas in others it is corporate.
The survey was designed to be completed within approximately 15 minutes. It consisted of background variables and several matrix questions to investigate the areas of interest. In the majority of these matrixes, respondents answered by selecting a number on a bipolar, seven-point Likert scale, common for all items included in the matrix. Despite extensive research in this field, no consensus has been reached concerning the optimal number of categories in a Likert scale (Weijters, Cabooter et al. 2010). However, it can be argued that a seven-point scale to a larger extent than a five-point scale can justify treating the scale as a continuous variable, and thereby the use of mean for estimation of central tendency and also parametric tests (Lubke and Muthén 2004).
Figure 54 a) – Number of invitations sent out
75
2347
145
477
2878
0
500
1000
1500
2000
2500
3000
3500
Denmark Finland Iceland Norway Sweden
Num
bero
finv
itatio
ns
Figure 54 b) – Respons rate
29%
9%
47%44%
5%
0%
5%
10%
15%
20%
25%
30%
35%
40%
45%
50%
Denmark Finland Iceland Norway Sweden
Resp
onse
rate

58
Nordic HR Study 2017Demographics of the survey respondents
Demographics of the survey respondents
Country distributionThe number of respondents varied greatly between the countries. Finland had the highest number of respondents (n=215), while Denmark had the lowest (n=22) (Figure 55 a)). It is likely that this uneven distribution is due to differences in the inclusion process as inclusion was conducted by the HR association in Norway, Sweden and Finland, and by EY in Denmark. Member population and relation to the HR association vary between countries, and prior knowledge to the HR study may affect response rate. Due to this uneven distribution, we were careful to interpret differences between countries if the number of cases in one group was very low. In the analysis, we have mainly focused on the Nordic level rather than on differences between countries. In addition, when interpreting results it was important to consider which background variable would give the most reasonable explanation of the results. Figure 55 a) – Country distribution (n; %)
22; 3 %
215; 33 %
68; 11 %
209; 33 %
130; 20 %
Denmark Finland Iceland Norway Sweden
Figure 55 b) – Firm orientation (n; %)
222; 34 %
71; 11 %
351; 55 %
Global Nordic National
Figure 55 b) – Firm orientation (n; %)
222; 34 %
71; 11 %
351; 55 %
Global Nordic National
Firm orientationIn the survey, we operate with three distinct categories of organizations: domestic (55%), Nordic (11%) or global (34%) (Figure 55 b). It is likely that Nordic companies resemble the domestic companies, due to the similarities in the Nordic countries. For some variables, we therefore found it appropriate to combine Nordic and global organizations to allow comparisons between Nordic and global companies on the one hand and domestic companies on the other.

59
Nordic HR Study 2017Demographics of the survey respondents
Figure 55 c) – Sector (n; %)
128; 20%
450; 70%
41; 6%25; 4%
Government/public sector
Private sector
State owned
Non-Profit Organiszation/NGO
Figure 55 d) – Number of employees (n; %)
89; 14 %
165; 25 %
186; 29 %
133; 21 %
71; 11 %
0-50 51-250 251-1000 1001-5000 >5000
SectorThe distribution of respondents between sectors demonstrates that we have managed to capture respondents from both the public (20%) and private sector (70%). We have also included state-owned (6%) and NGOs (4%) as separate sectors (Figure 55 c). The number of respondents in each category allows for useful analysis of each group.
SizeThe majority of the respondents represent medium-sized companies, but a substantial number of respondents also represent the small (<50) and very large >5,000 companies (Figure 55 d). This enabled us to analyze the effects of company size on trends and HR-responses by using all size categories. Where we found it appropriate we also divided the population in smaller (<250) and larger (>250) companies.

60
Nordic HR Study 2017Demographics of the survey respondents
IndustryA broad range of industries are represented in this survey, including financial services, oil and gas and health care services to name a few. The industry with the largest number of respondents is consulting services/professional services with 90 respondents, and the lowest number of respondents is found in special interest groups with 10 respondents (Figure 55 e). The number of respondents in an industry is likely to be reflected by the member population in the HR associations. We have been careful to interpret results in industries with a low number of respondents, as these results might not be representative for the industry.
Figure 55 e) – Industry (n (%))
46 (7,1%)
30 (4,7%)
90 (14%)
12 (1,9%)
29 (4,5%)
81 (12,6%)
55 (8,5%)
11 (1,7%)
26 (4%)
13 (2%)
40 (6,2%)
10 (1,6%)
85 (13,2%)
16 (2,5%)
50 (7,8%)
50 (7,8%)
0 10 20 30 40 50 60 70 80 90 100
Banking/finance/incurance
Contruction/real estate
Consulting services/preofessional services
Power and utilites
Health care/life science/social care services
Industry
IT/telekom
Media/information/communication
Maritime/shipping/transportaion/logistics
Oil and gas
Reaserach/teaching/education
Special interest group
State/county authority/municipality
Tourism/horpitality sector
Trade/wholesale/consumer products
Other- specify
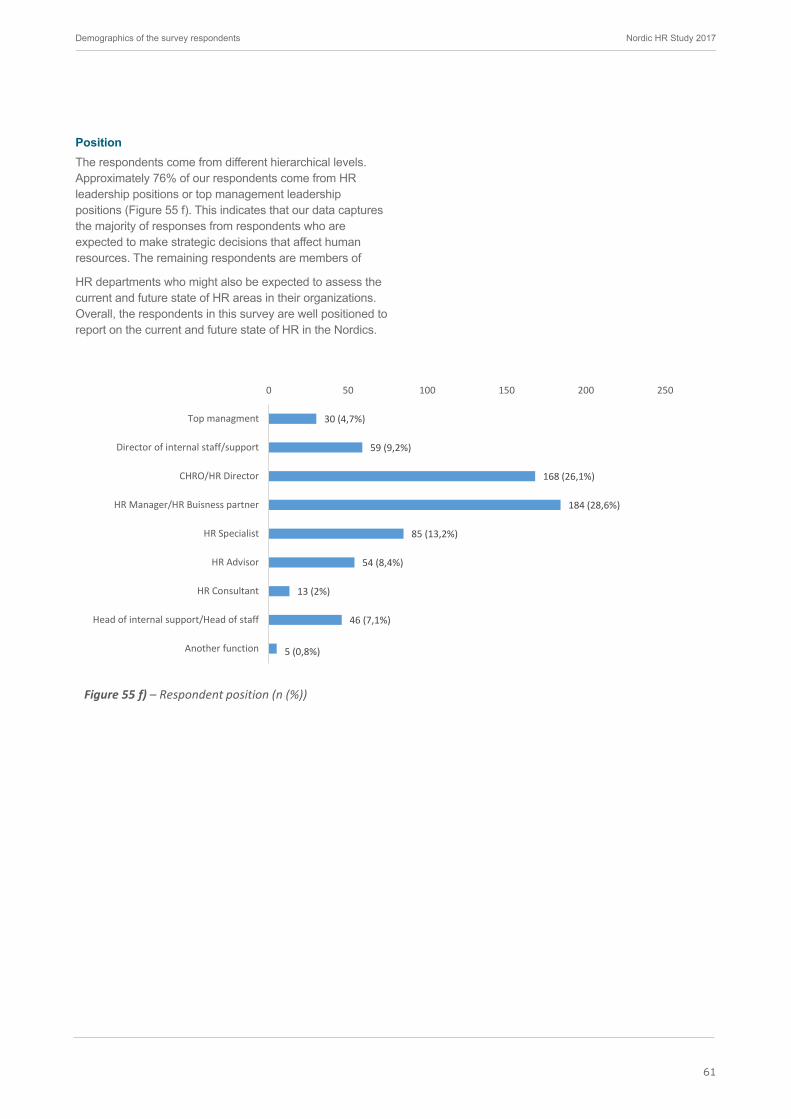
61
Nordic HR Study 2017Demographics of the survey respondents
Position The respondents come from different hierarchical levels. Approximately 76% of our respondents come from HR leadership positions or top management leadership positions (Figure 55 f). This indicates that our data captures the majority of responses from respondents who are expected to make strategic decisions that affect human resources. The remaining respondents are members of
HR departments who might also be expected to assess the current and future state of HR areas in their organizations. Overall, the respondents in this survey are well positioned to report on the current and future state of HR in the Nordics.
Figure 55 f) – Respondent position (n (%))
30 (4,7%)
59 (9,2%)
168 (26,1%)
184 (28,6%)
85 (13,2%)
54 (8,4%)
13 (2%)
46 (7,1%)
5 (0,8%)
0 50 100 150 200 250
Top managment
Director of internal staff/support
CHRO/HR Director
HR Manager/HR Buisness partner
HR Specialist
HR Advisor
HR Consultant
Head of internal support/Head of staff
Another function

62
Nordic HR Study 2017Demographics of the survey respondents
Knowledge intensityThe respondents reported the education level of their typical employees. Most respondents come from organizations where the typical education level is bachelor degree or equivalent (37%) or master’s degree or equivalent (31%) (Figure 55 g). Where we found it appropriate, we grouped education level into the following categories: high school/vocational degree or lower, bachelor degree or equivalent, master’s degree or higher. We did this grouping to reduce the number of categories in comparisons or visualizations.
Figure 55 g) – Typical level of education within company (n (%))
15 (2,3%)
94 (14,6%)
80 (12,4%)
240 (37,3%)
199 (30,9%)
16 (2,5%)
0 50 100 150 200 250
Elementary school
Vocational education
High school degree
Bahelor or equivalent
Masters degree, MBA or equivalent
PhD or equivalent

63
Nordic HR Study 2017Demographics of the survey respondents
StatisticsIn this study, we used descriptive statistics and visualizations to describe our population and distributions across groups. We used paired student t-test to compare means in order to support associations indicated by descriptive statistics, and p < 0.05 was considered statistically significant. The statistical analyses were performed using the statistical package SPSS, version 24.0.
Reflections on strengths and limitations The relatively high number of respondents (n=644 ) and a study population that is distributed across company size, sector and industries are strengths of this study. In addition, the cooperation between Nordic HR associations and the Nordic EY offices resulting in a common survey, with similar inclusion process simultaneously in all included countries, is unique from a Nordic point of view. Further, the survey was based on a thorough review of literature. The constructs presented in the survey were based on hypotheses generated before the survey was designed. We drew on the collective knowledge of the survey group to decide which aspects to focus on and decide whether the interpretations made sense.
It is always important to evaluate if results can be held true, or if there is an alternative explanation for the observed results. Internal validity reflects whether the results are representative for the population. In this survey, our source population is HR representatives in Nordic organizations. Selection bias, information bias and confounding may affect internal validity.
Factors in the recruitment process and factors that influence study participation can lead to selection bias resulting in a study population that is systematically different from the population. It is likely that the overall response rate of 11%, variating between countries from 5%-44% may have resulted in selection bias. In selecting respondents, we used the database of the Nordic HR associations, except from in Denmark, where respondents were sourced from EY’s client database. A legitimate question could be whether the members of such associations are representative for HR in the respective countries, or whether they are more informed about HR trends due to their membership in an HR association. Thus, this is a possible source to selection bias. In addition, each country managed the inclusion process individually, so local differences might have occurred. The uneven distribution across countries means that some countries were affecting the results more than others.
The drop-off rate is about 30% and a possible source of selection bias. One third of everyone that started filling out the survey did not complete it. This might indicate that they perceived the survey as less relevant, that the questions were outside of their areas of expertise or just a simple time-issue.
Misclassification is a source of information bias. The questionnaire was translated from English into Danish, Norwegian and Swedish, but not to Finnish and Icelandic. This introduces a possibility of differences in terminology and local understanding. A strength of our survey is the use of forward and backward translation; translated versions of the questionnaire were translated back to English to ensure that the original meaning of the questions were intact. This has probably reduced the risk of bias casued by language differences. In addition, HR professionals in the different countries tested and made the appropriate adjustments to the questionnaire before we launched the survey. Terms and definitions that might be unfamiliar to some of the respondents may also lead to misclassifications, and it is difficult to conclude if the respondents had a similar understanding of each definition. We tried to mitigate this risk by adding thorough definitions throughout the survey. In addition, the survey used categories that are predefined and might not be exhaustive to all possible views on the trend.
Our source population was HR representatives, and whether survey results give a true indication of attention to trends in the organization they serve relies on HR departments being the office responsible for addressing these trends. Data from other groups of leaders are not part of this study although they might have different perspectives on how deeply and far these trends have touched.
It is also important to consider the reliability of the study. Although no measures of reliability have been done, the study can be repeated with a likeliness of producing coherent results. Since the questions used in the survey have been through a thorough process of backward translation and reviews of HR representatives in each country, the interpretation from the participants are likely to be similar, which supports the reliability of the study.
Given the limitations of the study, one should be careful with generalizing from the sample to HR functions in the Nordics in general. However, due to the relatively high overall number of respondents and the distribution across categories, the results give us interesting insights into how HR in many organizations in the Nordics experience the trends.
Our results differ somewhat from other studies performed outside Nordic countries. This might indicate that some of our findings are not generalizable outside the Nordics, and that differences in culture, regulations, and socioeconomics might cause such differences.

64
Nordic HR Study 2017References
ReferencesAllen, D. (2000). Doing Occupational Demarcation: The “Boundary-Work” of Nurse Managers in a District General Hospital. Journal of Contemporary Ethnography, 29(3), 326-356.
Barley, S.R. (1986). Technology as an occasion for structuring: evidence from observations of CT scanners and the social order of radiology departments. Administrative Science Quarterly 31, 78-108.
Barley, S., Bechky, B. and Milliken, F.J. (2017). The Changing Nature of Work: Careers, Identities, and Work Lives in the 21st Century. Academy of Management Discovery, vol. 3 no. 2 111-115
Barrett, M., Oborn, E., Orlikowski, W.J. and Yates J. (2012). Reconfiguring Boundary Relations: Robotic Innovations in Pharmacy Work. Organization Science 23, 1448-1466.
Bower, J. and Christensen, C. (1995). “Disruptive Technologies: Catching the Wave”, Harvard Business Review, January–February
Braun, P.A. and Yaniv, I. (1992). A case study of expert judgement: Economists’ probabilities vs base-rate model forecasts, Journal of Behavioral Decision Making, 5, 217-231.
Brynjolfsson, E. (2017). Interview presented in article called “New Interviews: Erik Brynjolfsson Speaks Out on Jobs and AI”. https://medium.com/mit-initiative-on-the-digital-economy/new-interviews-erik-brynjolfsson-speaks-out-on-jobs-and-ai-d03ab83c5d7a
Business Insider (2016). These are the 40 biggest companies in the Nordics. http://nordic.businessinsider.com/these-are-the-40-biggest-companies-in-the-nordics-2016-11/
Burri, R. V. (2008). Doing distinctions: Boundary work and symbolic capital in radiology. SocialStudies of Science, 38(1), 35-62.
Cannon, M. and Edmondson, A. (2004). Failing to learn and learning to fail (intelligently): How great organizations put failure to work to innovate and improve Long Range Planning 38 (3), 299-319
Christensen, C., (1997). The Innovator’s Dilemma: When New Technologies Cause Great Firms to Fail, Harvard Business School Press
Colson, Thomas (2016). These are the 11 most educated countries in the world. http://nordic.businessinsider.com/wef-global-competitiveness-report-most-educated-countries-in-the-world-2016-10/
Costanza, D. P., Badger, J. M., Fraser, R. L., Severt, J. B., & Gade, P. A., (2012). Generational Differences in Work-Related Attitudes: A Meta-analysis. https://link.springer.com/article/10.1007/s10869-012-9259-4
Douven, I. (2017). A Bayesian perspective on Likert scales and central tendency. Psychonomic Bulletin & Review. https://link.springer.com/article/10.3758/s13423-017-1344-2
Dysvik, A., & Kuvaas, B. (2016). Lønnsomhet gjennom menneskelige ressurser: evidensbasert HRM.
Dølvik, J. E., & Jesnes, K. (2017). Nordic labour markets and the sharing economy – Report from a pilot project. https://norden.diva-portal.org/smash/get/diva2:1072087/FULLTEXT02.pdf
Economist (2013a). The Nordic countries - The next supermodel. https://www.economist.com/news/leaders/21571136-politicians-both-right-and-left-could-learn-nordic-countries-next-supermodel
Economist (2013b). Entrepreneurs - If in doubt, innovate. https://www.economist.com/news/special-report/21570834-nordic-region-becoming-hothouse-entrepreneurship-if-doubt-innovate
Econa (2016). Midlertidige ansettelser. https://www.econa.no/midlertidige-ansettelser
Edlinger, G. (2015). Employer brand management as boundary‐work: a grounded theory analysis of employer brand managers’ narrative accounts. Human Resource Management Journal, 25(4), 443-457.
Encylopedia Britannica (2017). Resources and power. https://www.britannica.com/place/Finland/Resources-and-power
Eurostat (2017). Open data. http://ec.europa.eu/eurostat/web/products-datasets/products?code=tsdde511

65
Nordic HR Study 2017References
EY (2016). The Upside of Disruption: Megatrends Shaping 2016 and Beyond. http://www.ey.com/Publication/vwLUAssets/EY-the-upside-of-disruption/$FILE/EY-the-upside-of-disruption.pdf
EY (2016). Is the gig economy a fleeting fad, or an enduring legacy? https://gigeconomy.ey.com/Documents/Gig%20Economy%20Report.pdf
EY (2015). Analytics: Don’t Forget the Human Element. http://www.ey.com/Publication/vwLUAssets/EY-Forbes-Insights-Data-and-Analytics-Impact-Index-2015/%24FILE/EY-Forbes-Insights-Data-and-Analytics-Impact-Index-2015.pdf
EY (2014). Partnering for performance Part 2: the CFO and HR. http://www.ey.com/Publication/vwLUAssets/EY-Partnering-for-performance-the-CFO-and-HR/$FILE/EY-Partnering-for-performance-the-CFO-and-HR.pdf
Forbes (2016). The Future Of Work: It’s Already Here - And Not As Scary As You Think. https://www.forbes.com/sites/joshbersin/2016/09/21/the-future-of-work-its-already-here-and-not-as-scary-as-you-think/3/#51022c18413f
Frey, T. (2012). 2 Billion Jobs to Disappear by 2030. http://www.futuristspeaker.com/business-trends/2-billion-jobs-to-disappear-by-2030/
Frey, C. B., & Osborne, M. (2013). The Future of Employment. http://www.oxfordmartin.ox.ac.uk/downloads/academic/The_Future_of_Employment.pdf
Gartner (2015). Digitalization or Automation – Is There a Difference? http://www.gartner.com/smarterwithgartner/digitalization-or-automation-is-there-a-difference/
Gartner (2017). IT Glossary. http://www.gartner.com/it-glossary/digitization/
Gieryn, T. F. (1983). Boundary-Work and the Demarcation of Science from Non-Science: Strains and Interests in Professional Ideologies of Scientists. American Sociological Review, 48(6), 781-795.
Green, D. (2017). The 2016 Data & Analytics Report, PEOPLE ANALYTICS - The what, the why and the how. MIT Sloan Management Review (Presentation HR Norge – HR Analyser)
Hörnström, L., & Roto, J. (2013). A Nordic ‘Agequake’? Population Ageing in Nordic Cities and Regions. http://www.nordregio.se/en/Metameny/Nordregio-News/2013/Nordic-Population-Ageing--Challenge-and-Opportunity/Context/
Iceland Review (2014). Iceland’s Largest Companies. http://icelandreview.com/stuff/ask-ir/2014/07/28/icelands-largest-companies
Intuit (2010). Intuit 2020 Report – Twenty trends that will shape the next decade. https://http-download.intuit.com/http.intuit/CMO/intuit/futureofsmallbusiness/intuit_2020_report.pdf
Kritzer, H.M. (1990). The Justice Broker: Lawyers and Ordinary Litigation. Oxford University Press.
Kritzer, H.M. (1991). Let’s Make a Deal: Understanding the Negotiation Process in Ordinary Litigation, Madison, University of Wisconsin Press.
Lubke, G. & Muthén, B. O. (2004). Applying multigroup confirmatory factor models for continuous outcomes to Likert scale data complicates meaningful group comparisons. http://ibg.colorado.edu/cdrom2012/boomsma/FactorAnalysis/PracticalMeasurementInvarianceOrdinal/Literature/Lubke2004.pdf
March, J.G. (1991). Exploration and Exploitation in Organizational Learning. Organization Science. 2: 71–87.
Meister, J. C., & Mulcahy, K. (2016). The Future Workplace Experience: 10 Rules For Mastering Disruption in Recruiting and Engaging Employees. McGraw-Hill Books-
Morgan, J. (2014). The Future of Work: Attract New Talent, Build Better Leaders, and Create a Competitive Organization. Wiley.
Miller, C. C. and Bui, Q. (2017). Switching Careers Doesn’t Have to Be Hard: Charting Jobs That Are Similar to Yours, New York Times, 27. July. https://www.nytimes.com/2017/07/27/upshot/switching-careers-is-hard-it-doesnt-have-to-be.html

66
Nordic HR Study 2017References
Murray, N. S. W. (2014). The Nordics are the World’s biggest contributors to technology. https://medium.com/@neilswmurray/the-nordics-are-the-worlds-biggest-contributors-to-technology-dac7f5ff142c
Murphy, S. (2016). Don’t Overlook These 5 Shifts Changing the Future of Work. https://www.inc.com/shawn-murphy/dont-overlook-these-5-shifts-changing-the-future -of-work.html
Mørk, B. E., Hoholm, T., Maaninen-Olsson, E., & Aanestad, M. (2012). Changing practice through boundary organizing: A case from medical R&D. Human Relations, 65(2), 263-288.
Nicolini, D. (2007) ‘Stretching out and expanding work practice in time and space: The case of telemedicine’. Human Relations, Vol. 60 (6): 889–920.
NHO (2016). Årskonferansen.
Nordregio (2016). Signs of recovery: High employment, low unemployment. http://www.nordregio.se/Metameny/Nordregio-News/2016/State-of-the-Nordic-region-2016/Signs-of-recovery-High-employment-low-unemployment/
Norman, V. (2013). Scandinavian Countries Benefit From High Wages. https://www.nytimes.com/roomfordebate/2013/05/05/denmarks-work-life-balance/scandanavian-countries-benefit-from-high-wages
OECD (2011). How´s life. Measuring well being. OECD Publishing http://www.oecd-ilibrary.org/economics/how-s-life_9789264121164-en
OECD (2011). Education at a Glance 2011. OECD Publishing. https://www.oecd.org/education/skills-beyond-school/48631582.pdf
O’Mahony, S., & Bechky, B. A. (2008). Boundary organizations: Enabling collaboration among unexpected allies. Administrative Science Quarterly, 53(3), 422-459.
Oxford Economics (2015). Workforce 2020 - The Looming Talent Crisis. https://www.oxfordeconomics.com/recent-releases/workforce-2020-the-looming-talent-crisis
Poses, R.M. and Anthony, M. (1991). Availability, wishful thinking and physicians’ diagnostic judgments for patients with suspected bacteremia, Medical Decision Making, 11, 159-168.
RBL Group (2015). HRCS, Round 7. Creating value from the Outside-In.
Sandberg, J., Rouleau, L., Langley, A. and Tsoukas, H. (eds.) (2017). Skilful Performance: Enacting Expertise, Competence, and Capabilities in Organizations. Oxford University Press.
SSB/Samfunnsspeilet (2005). Tidsbruk i europeiske land: Nordmenn har mest fritid – men ser lite på TV. https://www.ssb.no/kultur-og-fritid/artikler-og-publikasjoner/nordmenn-har-mest-fritid-men-ser-lite-paa-tv
Tetlock, P. (1995). Expert Political Judgment: How Good Is It? How Can We Know? Princeton University Press.
UN Data (2015). Population by age, sex and urban/rural residence. http://data.un.org/Data.aspx?d=POP&f=tableCode%3a22
Virke (2015). Jus på en onsdag Midlertidig ansettelser. https://www.virke.no/lovverk-radgiving/jus-arbeidsliv/fagartikler/midlertidig-ansettelser/
Virke (2015). Jus på en onsdag Midlertidig ansettelser. https://www.virke.no/lovverk-radgiving/jus-arbeidsliv/fagartikler/midlertidig-ansettelser/
Weijters, B., Cabooter, E. & Schillewaert, N. (2010). The effect of rating scale format on response styles: The number of response categories and response category labels. International Journal of Research in Marketing, 27(3): 236-247. http://www.sciencedirect.com/science/article/pii/S0167811610000303
World Bank (2017). Open Data. https://data.worldbank.org/?location=DK-SEIS-NO-FI
World Economic Forum (2016). The Future of Jobs - Employment, Skills and Workforce Strategy for the Fourth Industrial Revolution. http://reports.weforum.org/future-of-jobs-2016/preface/
World Economic Forum (2016). The Human Capital Report. http://reports.weforum.org/human-capital-report-2016/

67
Nordic HR Study 2017Nordic HR Study 2017Contact information
Contact information For further information, please contact:
Even BolstadManaging DirectorHR Norgemob:+47 906 66 720mail: [email protected]
Bjørnar Løwe Skas Executive Director, PASEYmob: +47 452 57 267 mail: [email protected]
Dröfn GuðmundsdóttirManaging Director, HRFlóras [email protected]+354 569 7700
Marita Salo Executive [email protected] +358 50 434 7492
Manne Didehvar Generalsekreterare/VD Sveriges HR Förening [email protected]+46(0)0709 62 75 10
Acknowledgements
Many individuals and organizations have contributed to the Nordic HR study. We would like to express our sincere gratitude to the respondents that despite a busy schedule participated in the survey. Thanks also to the participants at the seminars for sharing your own experiences and reflections on the results.
Conducting the Nordic HR study would not have been possible without the support of many people from the Nordic HR associations and EY. The extended team contributed in planning the design of the study, with gathering and analyzing data, and with developing the report. The intellectual generosity of all of these individuals have been crucial. A special thanks goes to the core team of the project for all of their efforts in all stages of the project. This includes the following individuals: Magnus Frekhaug, Henrik Øhrn, Sven Iversen, Sandra Elise Olsen, Bjørn Erik Mørk, Jens Petter Skaug, Kjetil Kristiansen, Mahta Nayebi, Øystein Skoglund, Hannu Tyyskä, Anna Paula Fijalkowska and Taran Enger-Mår

1
B180
01no
rdic