Embed Size (px)
Citation preview

©Noor Azalina Khalil, Nadhirah Nor Zelan, Mohd Syafaril Jamaludin 2021
First Published 2021
All rights reserved. No part of this publication may be reproduced, stored in retrieval system
or transmitted in any form or by means, electronic, mechanical, photocopying, recording
or otherwise, without prior permission of Noor Azalina Khalil, Nadhirah Nor Zelan
and Mohd Syafaril Jamaluddin
Perpustakaan Negara Malaysia Cataloguing-in-Publication Data
Noor Azalina Khalil, Nadhirah Nor Zelan , Mohd Syafaril Jamaluddin
Basic Characteristic of Soil
Published by POLITEKNIK TUANKU SULTANAH BAHIYAH, Kulim Hi-Tech Park, 09000 Kulim,
Kedah.

ALHAMDULILAH…First and foremost, we would like to praise Allah the Almighty,
the Most Gracious, and the Most Merciful for His blessing given to we during our
writing and in completing this eBook.
Our completion of this eBook could not have been accomplished without the support
of our family and friends. We express our deep gratefulness to all of you.

Soil consist of grain with water and air in the void between grains. The water and air
contents are readily changed by changes in conditions and location. Although the size
and shape of the solid content rarely changes at a given point, they can vary
considerably from point to point.
All soil contains mineral particles, organic matter, water and air. The combination of
these determine the soil properties. Some important physical and chemical properties
of soil are mineral content, texture, action exchange capacity, bulk density, structure,
porosity and organic matter content.
Soil may be described in different ways by different people for their purposes.
Engineers are primarily in soil’s mechanical properties such as strength, stiffness
and permeability. These depend primarily on the nature of the soil grains, the
current stress, the water content and unit weight.
The book has illustrated liberally to help students understand the material.
A number of exercises are provided at the end of each sub topic for homework assignment.
Noor Azalina Khalil
Nadhirah Nor Zelan
Mohd Syafaril Jamaluddin

1 BASIC CHARACTERISTICS OF SOIL
11 SOIL CLASSIFICATION
16 ATTERBERG LIMITS
27 ENGINEERING CLASSIFICATION
31 COMPACTION
38 SAND REPLACEMENT

TOPIC BASIC CHARACTERISTICS OF SOIL
1.0 BASIC CHARACTERISTICS OF SOILS
Soil properties
All soils contain mineral particles, organic matter, water and air. The combinations
of these determine the soil’s properties – its texture, structure, porosity, chemistry
and colour. The spaces between the solids (soil particles) are called voids. If all the
voids are filled by water, the soil is saturated. Otherwise, the soil is unsaturated.
If all the voids are filled with air, the soil is said to be dry.
Figure 1: Soils contain water, solid and air.
The Three Phases of Soil
Referring to figure 2, soil is generally three phases material which contains solids,
water and air.
Figure 2: Three phases of soil
1

The Two Phases of Soil
Figure 3: Two Phase (Fully saturated)
Figure 4: Two Phase (Dry soil)
Physical properties of soil
*The Phases Relationship in Mass Soil and Volume Soil
To develop the weight/mass volume relationship, soil must separate the three phases
(solid, water and air). The total of given soil sample can be expressed as:
VT = VS + VV = VS + VW + Va
Assuming that the weight of the air is negligible, the total weight of the sample as:
W = WS + WW
Where; WS = weight of soil solids
WW = weight of water
2
Relationship Volume Mass Weight
Air VA 0 0
Water VW
MW
WW
Solid VS M
S W
S
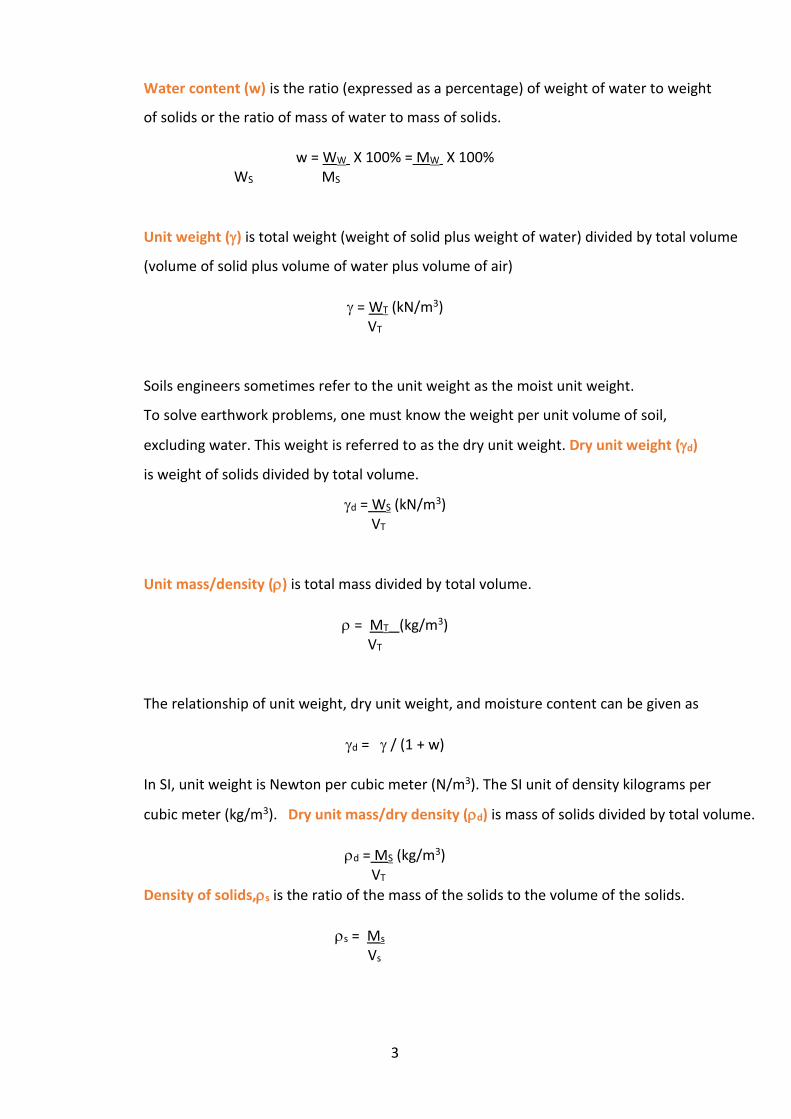
Water content (w) is the ratio (expressed as a percentage) of weight of water to weight
of solids or the ratio of mass of water to mass of solids.
w = WW X 100% = MW X 100% WS MS
Unit weight () is total weight (weight of solid plus weight of water) divided by total volume
(volume of solid plus volume of water plus volume of air)
= WT (kN/m3) VT
Soils engineers sometimes refer to the unit weight as the moist unit weight.
To solve earthwork problems, one must know the weight per unit volume of soil,
excluding water. This weight is referred to as the dry unit weight. Dry unit weight (d)
is weight of solids divided by total volume.
d = WS (kN/m3) VT
Unit mass/density () is total mass divided by total volume.
= MT (kg/m3) VT
The relationship of unit weight, dry unit weight, and moisture content can be given as
d = / (1 + w)
In SI, unit weight is Newton per cubic meter (N/m3). The SI unit of density kilograms per
cubic meter (kg/m3). Dry unit mass/dry density (d) is mass of solids divided by total volume.
d = MS (kg/m3) VT
Density of solids,s is the ratio of the mass of the solids to the volume of the solids.
s = Ms
Vs
3
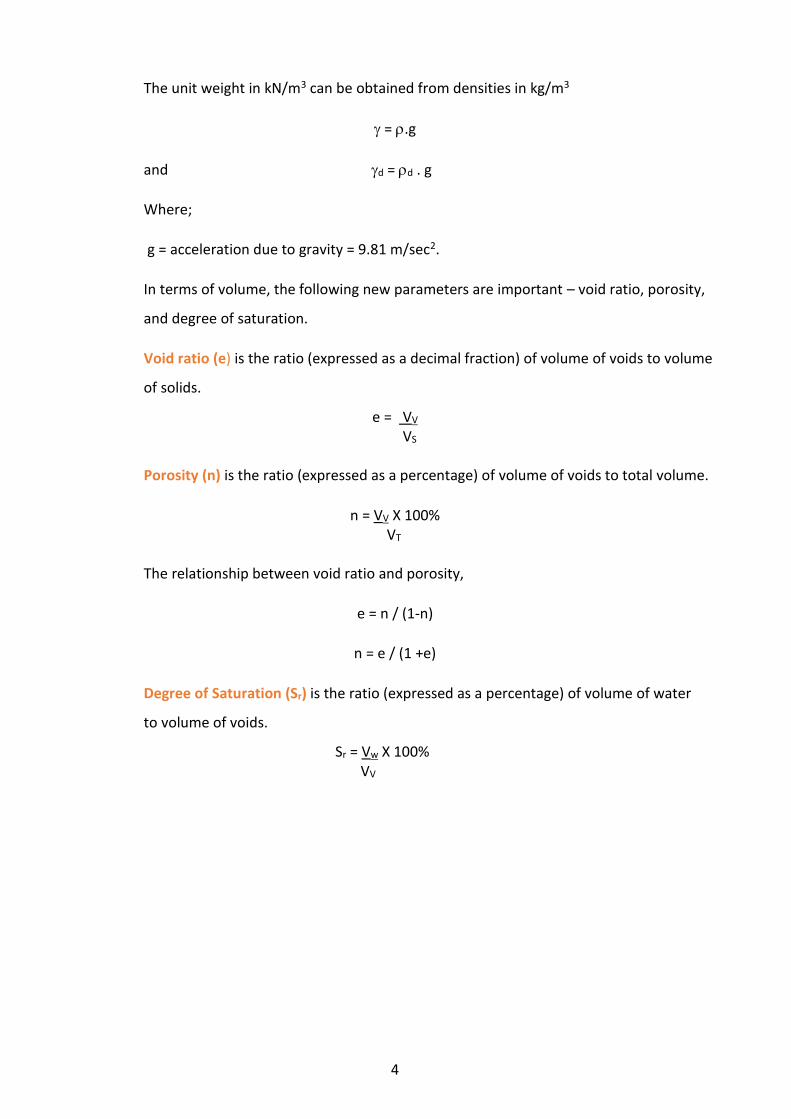
The unit weight in kN/m3 can be obtained from densities in kg/m3
= .g
and d = d . g
Where;
g = acceleration due to gravity = 9.81 m/sec2.
In terms of volume, the following new parameters are important – void ratio, porosity,
and degree of saturation.
Void ratio (e) is the ratio (expressed as a decimal fraction) of volume of voids to volume
of solids.
e = VV VS
Porosity (n) is the ratio (expressed as a percentage) of volume of voids to total volume.
n = VV X 100% VT
The relationship between void ratio and porosity,
e = n / (1-n)
n = e / (1 +e)
Degree of Saturation (Sr) is the ratio (expressed as a percentage) of volume of water
to volume of voids.
Sr = Vw X 100% VV
4
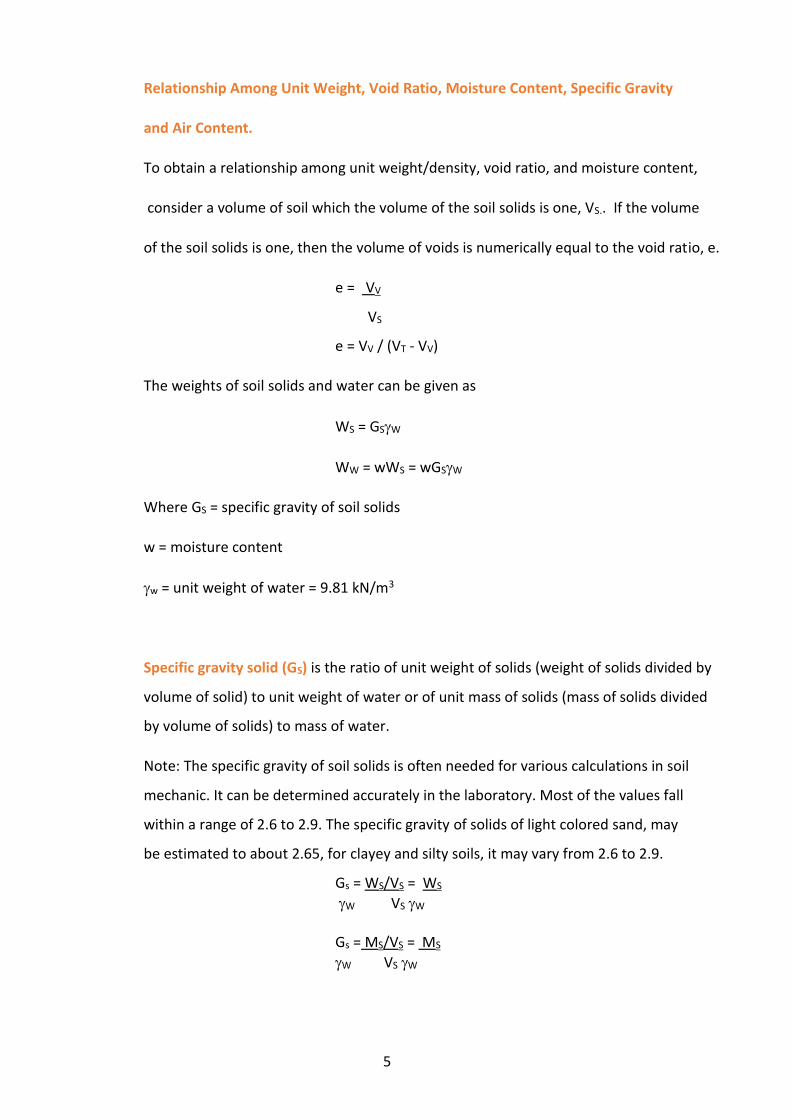
Relationship Among Unit Weight, Void Ratio, Moisture Content, Specific Gravity
and Air Content.
To obtain a relationship among unit weight/density, void ratio, and moisture content,
consider a volume of soil which the volume of the soil solids is one, VS.. If the volume
of the soil solids is one, then the volume of voids is numerically equal to the void ratio, e.
e = VV
VS
e = VV / (VT - VV)
The weights of soil solids and water can be given as
WS = GSW
WW = wWS = wGSW
Where GS = specific gravity of soil solids
w = moisture content
w = unit weight of water = 9.81 kN/m3
Specific gravity solid (GS) is the ratio of unit weight of solids (weight of solids divided by
volume of solid) to unit weight of water or of unit mass of solids (mass of solids divided
by volume of solids) to mass of water.
Note: The specific gravity of soil solids is often needed for various calculations in soil
mechanic. It can be determined accurately in the laboratory. Most of the values fall
within a range of 2.6 to 2.9. The specific gravity of solids of light colored sand, may
be estimated to about 2.65, for clayey and silty soils, it may vary from 2.6 to 2.9.
Gs = WS/VS = WS
W VS W Gs = MS/VS = MS
W VS W
5

Where W and w are the unit weight and unit mass of water. Now, using the definition of
unit weight and dry unit weight,
= W = WS + WW = GSW + wGSW = (1 + w) GSW V V 1 + e 1 + e
d = WS = GSW
V 1 + e
e = GSW - 1
d
From the definition of degree of saturation,
Sr = VW = wGS
VV e Sr = wGS e
If the soil sample is saturated, that is the void spaces are completely filled with water,
Sr = 1, so;
e = wGS
Air ratio (Ar)
Ar = n (1 – Sr)
Relationship between density, unit weight, water content and void ratio can be given as
Density, = (1 + w )GSW
1 + e
Dry density,d = GSW 1 + e
Saturated density,sat = (GS + e)w
1 + e Note: Unit weight of water varies slightly with temperature, but at normal temperatures,
it has a value of around 62.4 pounds per cubic foot (lb/ft3) or 9.81 kN/m3. The unit mass
(density) of water is 1000 kg/m3 or 1 g/cm3.
6

EXAMPLE 1
For a moist soil, given that volume = 6500 cm3; mass = 11.70 kg; moisture
content = 11.50%; Gs = 2.65, calculate the following:
i. Moist density (kg/m3)
ii. Dry density (kg/m3)
iii. Void ratio
iv. Porosity
iv. Degree of saturation (%)
SOLUTION:
VT = 6500 cm3 = 6.50 x 10⁻³ m3
MT = 11.70 kg
w = 11.5%
Gs = 2.65
(i) T = MT/VT
= 11.50/6.50 x 10-3
= 1769.23 kg/m3
(ii) ρdry = ρ / (1+w)
= 1769.23 / (1 + 0.115)
= 1586.75 kg/m3
(iii) Void ratio,e
Use formula d = Gsw / 1 + e
e = Gsw - 1
d
e = (2.65)(1000) - 1 1586.75
= 0.67
7
(iv) Porosity, n = e / 1 + e
= 0.67 / 1 + 0.67 = 0.4
(v) Sr = wGs/e
= 0.115(2.65) / 0.67 = 0.46
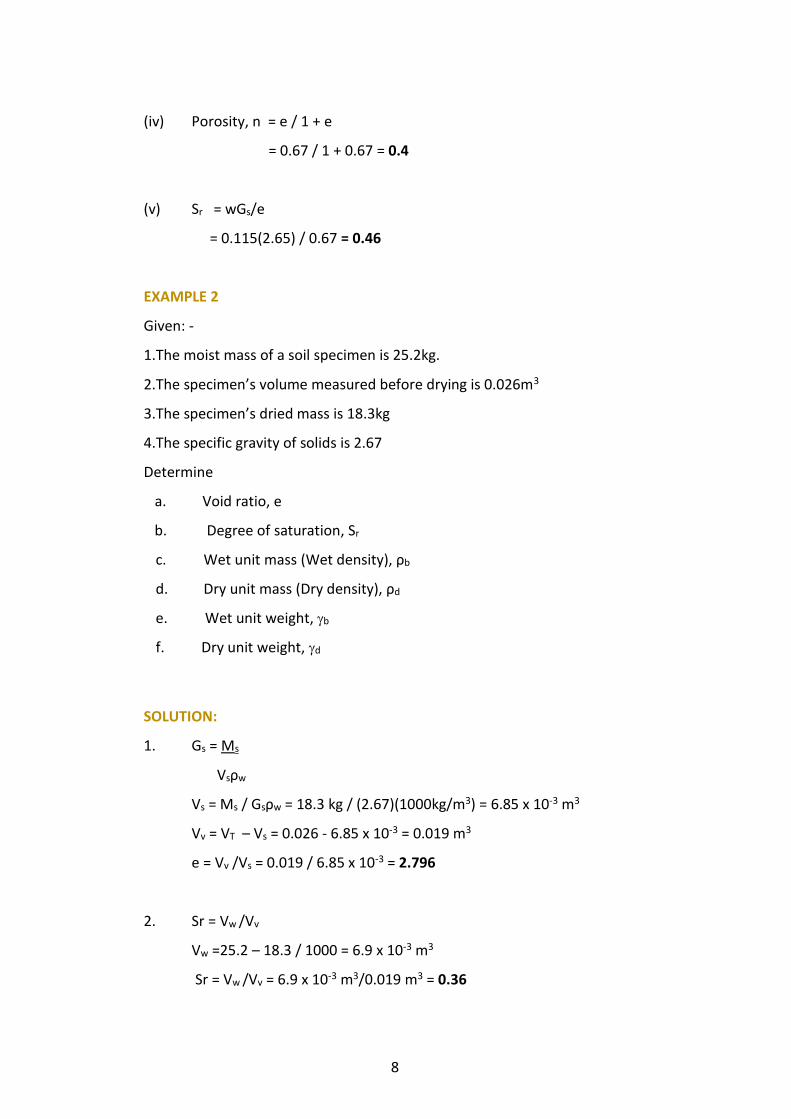
EXAMPLE 2
Given: -
1.The moist mass of a soil specimen is 25.2kg.
2.The specimen’s volume measured before drying is 0.026m3
3.The specimen’s dried mass is 18.3kg
4.The specific gravity of solids is 2.67
Determine
a. Void ratio, e
b. Degree of saturation, Sr
c. Wet unit mass (Wet density), ρb
d. Dry unit mass (Dry density), ρd
e. Wet unit weight, b
f. Dry unit weight, d
SOLUTION:
1. Gs = Ms
Vsρw
Vs = Ms / Gsρw = 18.3 kg / (2.67)(1000kg/m3) = 6.85 x 10⁻³ m3
Vv = VT – Vs = 0.026 - 6.85 x 10-3 = 0.019 m3
e = Vv /Vs = 0.019 / 6.85 x 10-3 = 2.796
2. Sr = Vw /Vv
Vw =25.2 – 18.3 / 1000 = 6.9 x 10⁻³ m3
Sr = Vw /Vv = 6.9 x 10⁻³ m3/0.019 m3 = 0.36
8

3. ρb = MT / VT = 25.2 / 0.026 = 969.23 kg/m3
4. ρd = 18.3 / 0.026 = 703.85 kg/m3
5. b = (969.23 x 9.81) / 1000 = 9.508 kN/m3
6. d = (703.85 x 9.81) / 1000 = 6.9 kN/m3
EXERCISE
1. Sketch the three phases of soil elements.
2. A specimen of clay was tested in the laboratory and the following data were collected:
Mass of wet specimen, M1 = 163.2g
Mass of dry specimen, M2 = 122.2g
Volume of wet specimen, V = 85.2cm3
Determine:
a. bulk density, ρb (Ans. ρb =1.916 g/cm3)
b. dry density, ρd (Ans. ρd =1.434 g/cm3)
3. A specimen of clay was tested in the laboratory and the following data were collected:
Mass of wet specimen, M1 = 156.8g
Mass of dry specimen, M2 = 132.4g
Volume of wet specimen, VT = 105.3cm3
Specific gravity of particles, GS = 2.69
Determine:
i. Water content (Ans.: w = 0.16)
ii. Bulk and dry density (Ans.: 1.50 g/cm3, 1.30 g/cm3)
iii. Void ratio and porosity (Ans.: 1.07, 0.52)
9

4. The mass of a moist soil sample having a volume of 0.0057m3 is 10.5kg. The moisture
content, m and the specific gravity of soil solids, Gs were determined to be 13% and
2.68, respectively. Determine:
a. Moist density, ρb (Ans.1842kg/m3)
b. Dry density, ρd (Ans.1630kg/m3)
c. Void ratio, e (Ans.0.64)
d. Porosity, n (Ans.0.39)
e. Degree of saturation, Sr (Ans.54.4%)
5. For a moist soil, given that
Volume of moist soil = 0.25 ft3
Weight of moist soil = 30 lb
Weight of dry soil = 26.1 lb
Specific Gravity, Gs = 2.63
Calculate
a. Moisture content, m (Ans.14.9 %)
b. Moist unit weight, b (Ans.120 lb/ft3)
c. Dry unit weight, d (Ans.104.41 lb/ft3)
d. Void ratio, e (Ans.0.57)
e. Porosity, n (Ans.0.36)
f. Degree of saturation, Sr (Ans.0.69)
6. For a moist soil, given that volume = 5660cm3, mass = 10.4 kg, moisture
content = 10%, Gs = 2.7, calculate the following:
a. Moist density, b (kg/m3) (Ans.1838 kg/m3)
b. Dry density, d (kg/m3) (Ans.1670 kg/m3)
c. Void ratio, e (Ans.0.62)
d. Porosity, n (Ans.0.38)
e. Degree of saturation, Sr (Ans.0.44)
10

2.0 SOIL CLASSIFICATION
Particles – Size Distribution Curve
The particles-size distribution curves can be used for the comparison of different
soils. Also, there are three basic soil parameters that can be determined from
these curves, and can be used to classify granular soils. These parameters are:
a. effective size
b. uniformity coefficient
c. coefficient of gradation.
Types of particles-size distribution curves
a. well graded soil
b. non-uniform graded soil
c. poorly graded soil
Uniformity coefficient is given by the relation;
Cu = D60
D10
The coefficient of gradation may be expressed as;
Cc = D230
D60 x D10
11

A well-graded soil will have a uniformity coefficient greater than about 4 for gravel
and 6 for sands, and a coefficient of gradation between 1 and 3 (for gravels and sands).
Figure 5: Types of particles-size distribution curves- well graded soil
Figure 6: Types of particles-size distribution curves- non-uniform graded soil
12

Figure 6 shown curve for non-uniform graded, a soil might have a combination of two or more
uniformly graded fraction.
Figure 7: Types of particles-size curves – poorly graded soil
EXAMPLE
Total mass of soil = 450 g
Sieve No
#
Diameter
(mm)
Mass of soil retained
on each sieves (g)
Mass of
passing (g)
Percent passing
(%)
10 2.000 0 450 100
16 1.180 9.90 440.10 98
30 0.600 24.66 415.44 92
40 0.425 17.60 397.84 88
60 0.250 23.90 373.94 83
100 0.150 35.10 338.84 75
200 0.075 59.85 278.99 62
Pan -- 278.99 0 0
TOTAL 450
Column 4 = Total – column 3
Column 5 = (Column 4 /Total mass of soil) x 100
13

Figure 8: Particles-size distribution curve
From the Particles-size distribution curve
% Sand = % passing # 2 mm - % passing # 0.06 mm
= (100 – 63)% = 37 %
% Silt = % passing # 0.06 mm - % passing # 0.002 mm
= (63 – 13)% = 50 %
% Clay = % passing # 0.002 mm - %passing # 0 mm
= (13 – 0)% = 13 %
So, sample is the silt soil.
Cu = D60
D10
Cu = 0.06 / 0.0015 = 40 > 4
Cc = D230
D60 x D10
Cc = (0.007)2 / (0.0015 X 0.06) = 0.54
So sample from poorly graded soil.
14

EXERCISE
1. For a soil, given:
D10 = 0.12mm, D30 = 0.43mm, D60 = 0.65mm
Calculate the uniformity coefficient, Cu and the coefficient of gradation
of the soil, Cc. (Ans.: Cu = 5.42, Cc = 2.37)
2. The result of s sieve analysis of a soil was as follows:
Sieve size (mm) Mass Retained (g)
20 0
12 1.7
10 2.3
6.3 8.4
4.75
5.7
2.8 12.9
2 3.5
1.4 1.1
0.5 30.5
0.355 45.3
0.180 25.4
0.075 7.4
The total mass of the sample was 147.2g. Plot the particle-size distribution curve
and describe the soil. Comment on the flat part of the curve.
15
3.0 ATTERBERG LIMITS
In the early 1900s,a Swedish scientist named Atterberg developed a method to
describe the consistency of fine grained soils with varying moisture contents. At very
low moisture content, soil behaves more like a solid. When the moisture content is
very high, the soil and water may flow like a liquid. The behavior of soil can be divided
into four basic states – solid, semisolid, plastic, and liquid.
The moisture content, in percent, at which the transition from solid to semisolid state
takes place is defined as the shrinkage limit. The moisture content at the point
of transition from semisolid to plastic state is the plastic limit, and from the plastic
to liquid state is the liquid limit. These parameters are also known as Atterberg limits.
There are three Atterberg Limit:
a. Liquid limit
b. Plastic limit
c. Shrinkage limit
Liquid limit
a. minimum water content of the soil can be drained by its own weight
b. is the moisture content above which the soil water mixture passes to a liquid state.
c. at this state the mixture behaves like a viscous fluid and flows under its own weight.
Plastic limit
a. is defined as the moisture content, in percent, at which the soil, when rolled into threads
of 3mm in diameter, crumbles. Plastic limit is the lower limit of the plastic stage of soil.
b. is the moisture content above which the soil water mixture passes to a plastic state.
c. below this moisture content, the mixture is in semi solid state.
d. any change in moisture content at either side of the PL produces a change in volume
of the soil.
16

Figure 9: Illustrating Plastic Limit Test
Source: Geotechnical Test Method, New York State Department of Transportation
Shrinkage limit
a. is defined as the moisture content, in percent, at which the volume of the soil mass
ceases to change.
b. is the moisture content above which the mixture of soil and water passes to semi
solid state.
c. below this moisture content, the mixture is in a solid state.
d. any increase in moisture content is associated with volume change but a decrease
in moisture content does not cause volume change. This is the minimum moisture
content that causes full saturation of the soil water mixture. The volume remains
constant as the mixture goes through the dry state to the SL moving from zero
saturation to 100% saturation.
17

Figure 10: Shrinkage Limit Test
Consistency of Soils Atterberg limits are the limits of water content used to define
soil behavior. The consistency of soils according to Atterberg limits gives the following diagram.
Figure 11: Consistency States
18

3.1 Casagrande Method
Figure 12: Casagrande cup with soil pat and grooving tool.
The liquid limit (LL) is the water content where a soil changes from plastic to
liquid behavior. The original liquid limit test of Atterberg's involved mixing a pat
of clay in a little round-bottomed porcelain bowl of 10-12cm diameter. A groove was cut t
hrough the pat of clay with a spatula, and the bowl was then struck many times against
the palm of one hand.
Casagrande subsequently standardized the apparatus and the procedures to make the
measurement more repeatable. Soil is placed into the metal cup portion of the device
and a groove is made down its center with a standardized tool. The cup is repeatedly
dropped 10mm onto a hard rubber base during which the groove closes up gradually
as a result of the impact. The number of blows for the groove to close for 13 mm
is recorded. The moisture content at which it takes 25 drops of the cup to cause the
groove to close is defined as the liquid limit.
19

Another method for measuring the liquid limit is the Cone Penetrometer test.
It is based on the measurement of penetration into the soil of a standardized cone
of specific mass. Despite the universal prevalence of the Casagrande method, the cone
penetrometer is often considered to be a more consistent alternative because it
minimizes the possibility of human variations when carrying out the test
Figure 13: Graph Moisture Content Versus Number of Blows
3.2 Cone Penetration
In this method the liquid limit is the moisture content of a soil water mixture placed
in a standard cylinder when a standard cone penetrations 20mm into the soil paste in
five seconds after it is released freely from the surface of the sample. The 60° cone is
manufactured from metal and has a height of 32mm whilst the cylinder has a diameter of
53mm and a height of 40mm.The test has to be repeated at least four times using the
original cured sample. Results are plotted in log linear scale, with moisture content on
linear vertical axis and cone penetrations on logarithmic horizontal axis (or graph
penetration vs moisture content). A line of best fit is drawn through the data and
moisture content corresponding to a cone penetration of 20mm is determined.
20

Figure 12: Cone Penetration Apparatus
Figure 13: Graph Cone Penetration Test
Plasticity Index (PI)
Plasticity index is the difference between the liquid limit and plastic limit of a soil.
PI = LL – PL
Liquidity Index (LI)
Liquidity index is the relationship between consistency (stiffness) of a remolded clayey soil.
LI = w – PL / PI
21
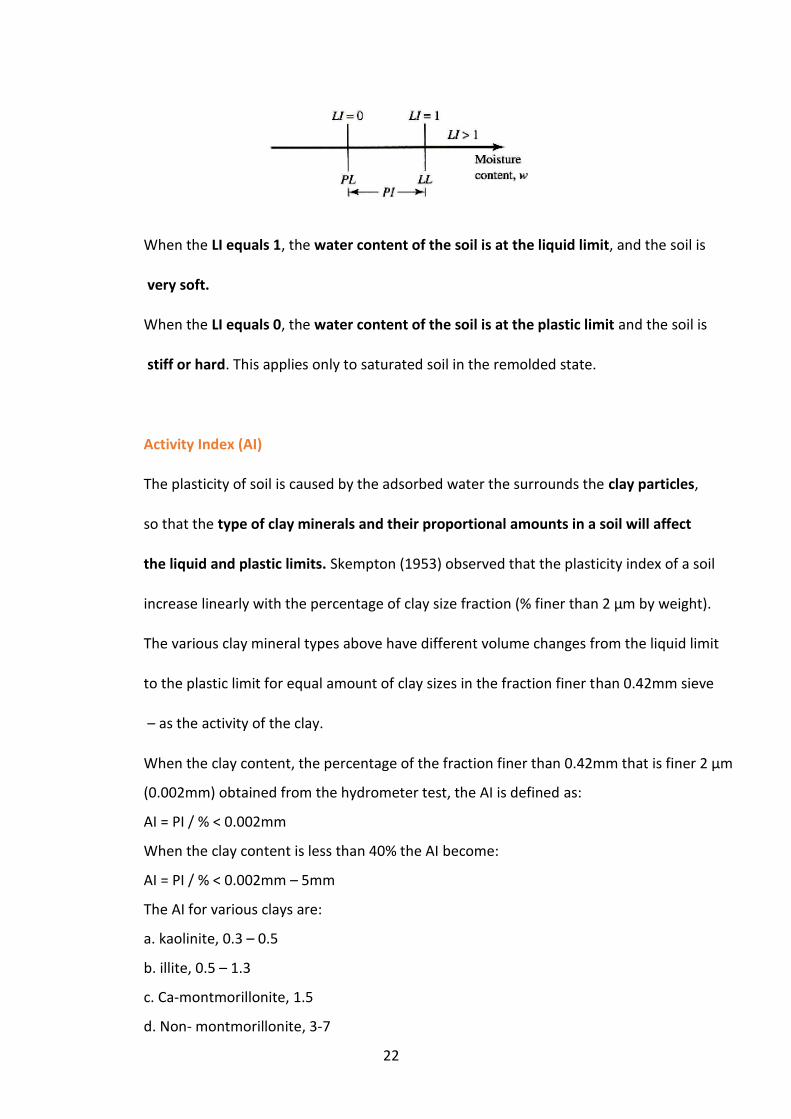
When the LI equals 1, the water content of the soil is at the liquid limit, and the soil is
very soft.
When the LI equals 0, the water content of the soil is at the plastic limit and the soil is
stiff or hard. This applies only to saturated soil in the remolded state.
Activity Index (AI)
The plasticity of soil is caused by the adsorbed water the surrounds the clay particles,
so that the type of clay minerals and their proportional amounts in a soil will affect
the liquid and plastic limits. Skempton (1953) observed that the plasticity index of a soil
increase linearly with the percentage of clay size fraction (% finer than 2 µm by weight).
The various clay mineral types above have different volume changes from the liquid limit
to the plastic limit for equal amount of clay sizes in the fraction finer than 0.42mm sieve
– as the activity of the clay.
When the clay content, the percentage of the fraction finer than 0.42mm that is finer 2 µm
(0.002mm) obtained from the hydrometer test, the AI is defined as:
AI = PI / % < 0.002mm
When the clay content is less than 40% the AI become:
AI = PI / % < 0.002mm – 5mm
The AI for various clays are:
a. kaolinite, 0.3 – 0.5
b. illite, 0.5 – 1.3
c. Ca-montmorillonite, 1.5
d. Non- montmorillonite, 3-7
22

A high AI is associated with those clay minerals that can absorb large amount of water.
Clays with an AI < 0.75 are defined as inactive clays.
AI = 0.75 – 1.25 are defined are normal activity clay
AI > 1.25 are defined as active clays.
EXAMPLE 1
Following are the results from the liquid and plastic limit test for a soil: Liquid
Limit test:
Number of blows, N Moisture content (%)
17 42.1
22 38.2
27 36.2
32 34.1
Plastic limit = 22%
i. Draw the flow curve and obtain the liquid limit
ii. What is the plasticity index of the soil?
23

SOLUTION:
(i)
(ii) PI = LL – PL = 37 – 22 = 15 %
EXAMPLE 2
A saturated, remolded clay soil has a water content 32%, a liquid limit of 35%,
plastic limit of 20%, and an amount of clay sizes (fine than 0.002mm) of 17%.
a. What are the liquidity index?
PI = 35-20 = 15
LI = 32-20 / 35 – 20 = 0.8
b. Is the sample likely to be soft or stiff?
Because the LI is near one, the sample will be soft
c. What is the activity for this soil and which clay mineral does it possess?
A = 15 / (17-5) = 1.25. This indicates that the dominant clay mineral is an illite or that the
clay is a mixture of several clay minerals including kaolinite, Illite and montmorillonite.
24
Mo
istu
re c
on
ten
t (%
)
Number of blows
Moisture content vs Number of blows

EXERCISE
1. In a liquid limit test on a fine-grained soil, using a cone penetrometer, the following
results were recorded:
Cone penetration (mm) 15.9 17.7 19.1 20.3 21.5
Water content (%) 32.6 42.9 51.6 59.8 66.2
In a plastic limit test on the same soil the plastic limit was found to be 25%. Determine
the liquid limit and plasticity index of the soil. (Ans.: LL = 55%, PI = 25%)
2. Following are the results from the liquid and plastic limit tests for a soil:
Liquid limit test:
Number of blows, N Moisture content (%)
15 42.0
20 40.8
28 39.1
Plastic limit = 17.2%
a. Draw the flow curve and obtain the liquid limit. (Ans. LL = 39%)
b. What is the plasticity index of the soil? (Ans. PI = 21.8%)
c. Determine the liquidity index of the soil when the in situ moisture content
is 30%? (Ans. LI = 0.58)
3. The following results were obtained from a liquid limit test using the cone
penetrometer apparatus.
No. of test 1 2 3 4 5
Mass of container 11.40 11.20 10.20 10.40 10.42
Mass of container +
wet soil
21.30 21.20 19.45 19.76 21.32
Mass of container +
dry soil
19.05 18.70 16.76 17.23 16.90
Cone Penetration
(mm)
12.60 15.50 16.80 18.50 23.40
25
From the data above:
a.Determine the liquid limit of soil sample. (Ans. LL = 19%)
b.Calculate the plasticity index if the plastic limit is 21 %.(Ans. PL = 2%)
4. In a liquid limit test using a cone penetrometer method, the following readings
were recorded below.
Cone
penetration
(mm)
14.44 16.4 18.2 21.1 22.3
Moisture
content (%)
30.8 42.2 51.2 68.1 77.4
In a plastic limit test on the same soil, the plastic limit was found to be 23 %.
Determine the liquid limit and plasticity index of the soil, and suggest classification
according to with the British Classification System (BSCS). (Ans.: LL= 62%, PI = 38%, CH)
5. After a series of laboratory tests, the following data were established for fine soil:
Liquid limit = 48%
Plastic limit = 32%
Clay content = 24.2 %
a. Calculate the activity of the soil. (Ans.: 0.66)
b. Determine the liquidity index of the soil when its natural moisture content
is 39%. (Ans.: 0.44)
6. If the saturated, remolded clay of example 1 is dried to water content of 22%,
a. What is it LI? (Ans. LI = 0.13)
b. Is the sample likely to be soft or stiff? (Ans.: Because the LI is near zero, the sample
will be stiff to hard.)
26

4.0 ENGINEERING CLASSIFICATION OF SOIL
Soils are classified according to criteria that are based on specific identification
tests and observations. A soil classification system, as used in geotechnical engineering
practice, is grouping or rating that provides an indication of expected behavior in
a specific engineering application. Three soil classification system are found in the
geotechnical engineering, there are:
a) The Unified Soil Classification System (USCS)
b) The American Associated of State Highway and Transportation Official (AASHTO)
c) U.S Department of Agriculture (USDA)
4.1 Unified Soil Classification System
Table 1: Symbols USCS
27
First Symbols Second Symbols
G – Gravel W – Well graded
S – Sand P – Poorly graded
M – Silt M – Silty
C – Clay C – Clayey
O – 0rganic L –Low plasticity, LL<50%
Pt – Peat soil H – High plasticity, LL>50%

Table 2: Group Symbols for Gravely and Sandy Soils USCS
28

Table 3: Group Symbols for Silty and Clayey USCS
29

EXERCISE
1. Classify each types of soil using British Soil Classification System
2. Classify the following soils by the Unified Classification System.
Percent Passing
Size A B C D E
Sieve No.4 94 98 100 100 100
Sieve No.200 3 10 77 86 45
Liquid Limit - - 63 55 36
Plasticity Index NP NP 25 28 22
30

5.0 COMPACTION
Compaction is the densification of soil by removal of air. There are five principle reasons
to compact soil:
a. Increases the shear strength and load-bearing capacity of the soil.
b. Prevents soil settlement and frost damage
c. Provides stability
d. Reduces water seepage, swelling and contraction
e. Reduces settling of soil
5.1 Factors Affecting Compaction
a. Effect of soil type
The soil type that is grain size distribution, shape of the soil grains, specific gravity
of soil solids, and amount and type of clay minerals present has a great influence on
the maximum dry density and optimum moisture content. Generally, coarse grained soils
can be compacted to higher dry density than fine grained soils.
b. Effect of compaction effort
As the compaction effort is increased, the maximum dry density of compaction is also
increased. As the compaction effort is increased, the optimum moisture content in
decreased to some extent.
c. Effect of moisture content
At low water content, the soil is stiff and offers more resistance to compaction. As the
water content is increased, the soil particles get lubricated. The soil mass becomes
more workable and the particles have closer packing.
The dry density of the soil increase with an increase in the content till the optimum
water content in reached. At the stage, the air voids attain approximately a constant
volume. With further increase in water content, the air voids do not decrease, but the
total voids increase and dry density decrease.
After the optimum water content is reached, it becomes more difficult to force air out
and to further reduce the air voids.
31

Saturation Line
Saturation line is also known as zero air voids line. It represents the dry density obtained
if all the air in the soil can be removed, so that after compaction of the soil samples
to be fully saturated. However, this may not be achieved through compaction either in the
laboratory or on-site. On land usually have 5% or 10% air voids after compaction.
Dry density (kg/m3)
10% air 5% air 0% air
Water content (%)
Figure 15: Compaction Curve and Saturation Line
Curve saturation line can be drawn in the graph compaction by using the following formula:
d = )1(
)1(
wGs
ArGs w
Where,
Gs = Specific Gravity
w = Water content
d = Dry Density
w = Density of water
Ar = Air ratio
32
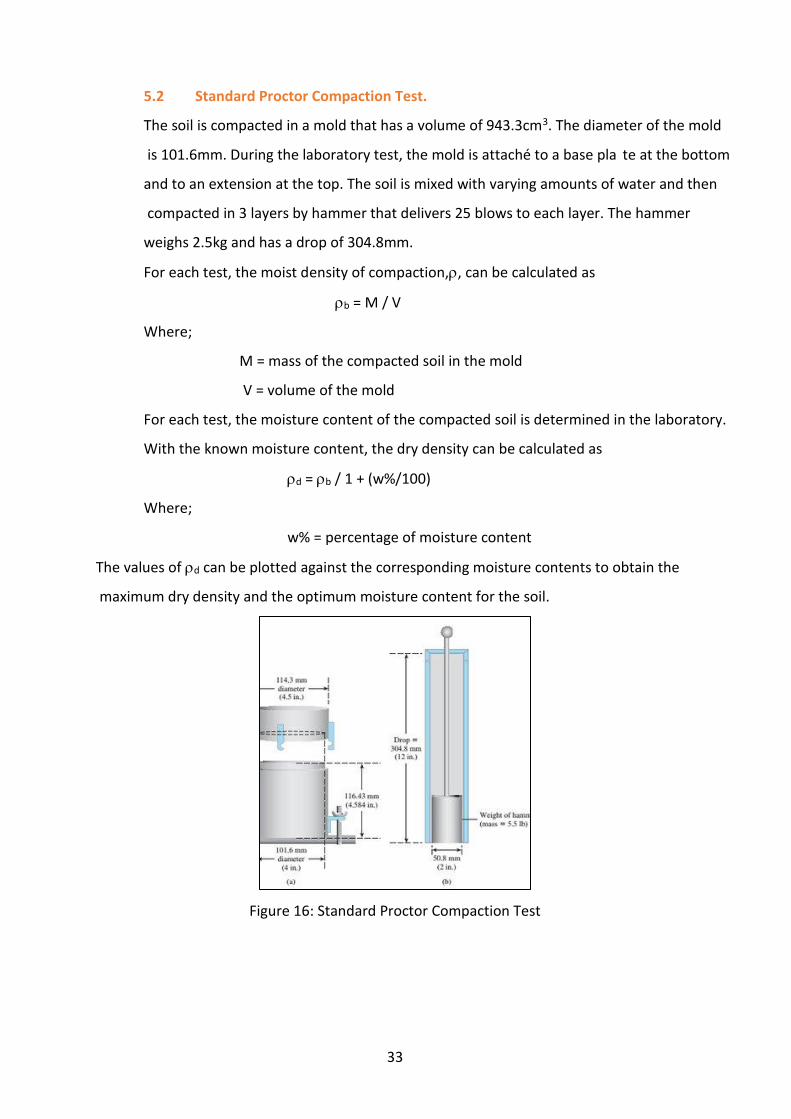
5.2 Standard Proctor Compaction Test.
The soil is compacted in a mold that has a volume of 943.3cm3. The diameter of the mold
is 101.6mm. During the laboratory test, the mold is attaché to a base pla te at the bottom
and to an extension at the top. The soil is mixed with varying amounts of water and then
compacted in 3 layers by hammer that delivers 25 blows to each layer. The hammer
weighs 2.5kg and has a drop of 304.8mm.
For each test, the moist density of compaction,, can be calculated as
b = M / V
Where;
M = mass of the compacted soil in the mold
V = volume of the mold
For each test, the moisture content of the compacted soil is determined in the laboratory.
With the known moisture content, the dry density can be calculated as
d = b / 1 + (w%/100)
Where;
w% = percentage of moisture content
The values of d can be plotted against the corresponding moisture contents to obtain the
maximum dry density and the optimum moisture content for the soil.
Figure 16: Standard Proctor Compaction Test
33
5.3 Modified Proctor Compaction Test.
With the development of heavy rollers and their use in field compaction, the standard
Proctor test was modified to better represent field conditions. This revised version
sometimes is referred to as the Modified Proctor test.
For conducting the modified Proctor test, the same mold is used with a volume of
943.3cm3, as in the case of the standard proctor test. However, the soil is compacted
in 5 layers by hammer that has a mass of 4.54kg. The drop of the hammer is 457mm.
The number of hammer blows for each layer kept at 25 as in the case of standard Proctor
test.
Because it increases the compactive effort, the Modified proctor test results in an
increase of the maximum dry density of the soil. The increase of the maximum
dry density is accompanied by decrease of the optimum moisture content.
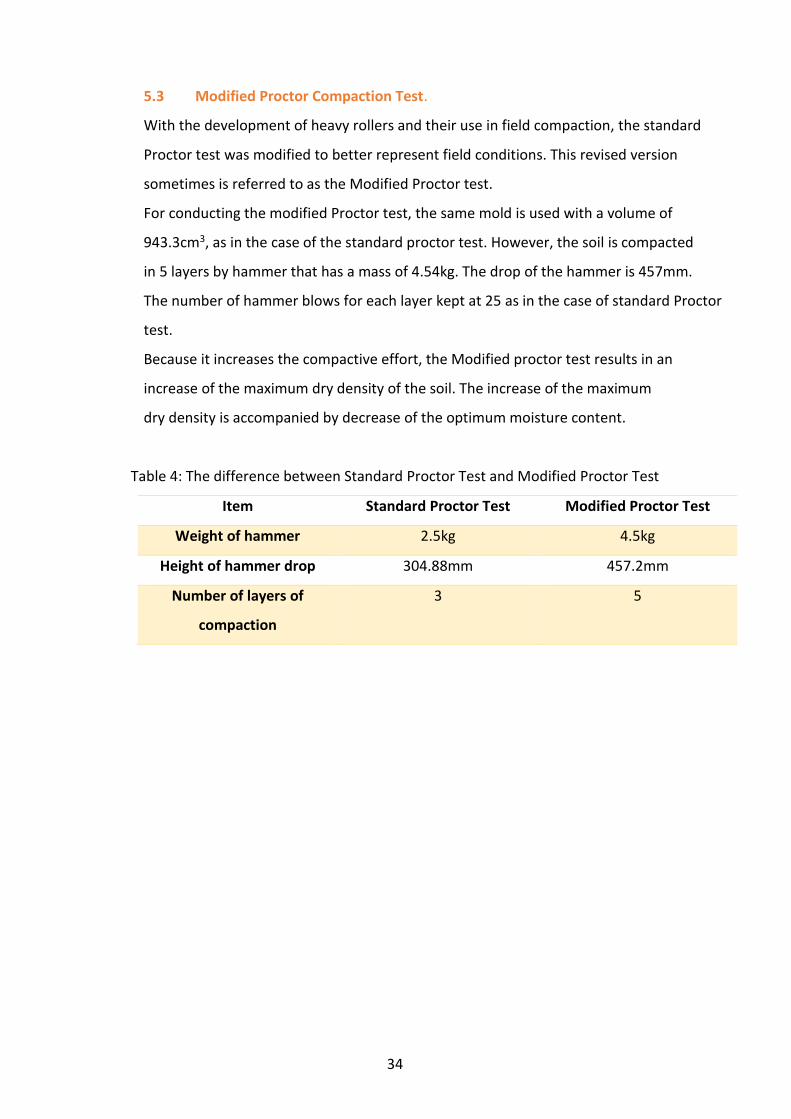
Table 4: The difference between Standard Proctor Test and Modified Proctor Test
Item Standard Proctor Test Modified Proctor Test
Weight of hammer 2.5kg 4.5kg
Height of hammer drop 304.88mm 457.2mm
Number of layers of
compaction
3 5
34

EXAMPLE
Experiment of compaction test have done in laboratory test, the result was shown on
the table below
Plot a dry density vs moisture content curve, and determine optimum moisture content
and dry density optimum.
SOLUTION:
35
Test no. 1 2 3 4 5
Moisture content,
%
12.9 14.3 15.7 16.9 17.9
Bulk Density, kg/m3 2092 2164 2152 2127 2043
Moisture
content
(%)
Bulk
Density
(kg/m3)
Dry Density
(kg/m3)
12.9 2092 1853
14.3 2164 1893
15.7 2152 1860
16.9 2127 1820
17.9 2043 1733

Graph Dry Density vs Water Content
EXERCISE
1. Give the description of compaction in terms of civil engineering discipline.
2. List THREE (3) types of compaction test.
3. State FIVE (5) objective of compaction.
4. Describes THREE (3) factors affecting compaction.
5. List THREE (3) types of compaction machines used on construction sites and specify the
types of soil suitable for the machines.
6. Compaction test result obtained from the laboratory cannot be directly used for
compaction processes on site. Explain the above statement.
7. If the bulk density of a soil sample is 2.15 Mg/m3and water content is 15.5 %, what is the
value of dry density after standard proctor compaction test? (Ans.: 1.86 Mg/m3)
36
Max dry density = 1895 kg/m3
Dry Density
(kg/m3)
Water Content (%)
Optimum water content = 15 %

8. Experiment of compaction test have done in laboratory test; the result was shown on
the below.
Test no. 1 2 3 4 5
Moisture content, % 12.9 14.3 15.7 16.9 17.9
Bulk Unit Weight, kN/m3 20.92 21.64 21.52 21.27 20.43
i. Plot a dry unit weight vs moisture content curve, and determine optimum
moisture content value. (Ans.: γdry =21.00 kN/m3, mopt. = 16%)
ii. Determine a void percent, Ar in maximum of dry unit weight optimum of water
content (use Gs=2.67) (Ans.: Ar = 0.14%)
9. The following data were recorded during a BS compaction test:
Volume of mould =0.945 x 10⁻³ m3, Gs = 2.70
Mass of wet soil in
mould (kg)
1.791 1.937 2.038 2.050 2.022 1.985
Water content (%) 8.4 10.6 12.9 14.4 16.6 18.6
Plot the curve of dry density against water content and from it obtain the maximum dry
density and optimum water content for the compacted soil.
On the same axes, plot the dry density vs water content curve for 0% and 5% air voids
and so obtain the air voids content of the soil at the optimum water content.
(Ans.: ρdmax = 1900kg/m3, mopt. = 14%)
37
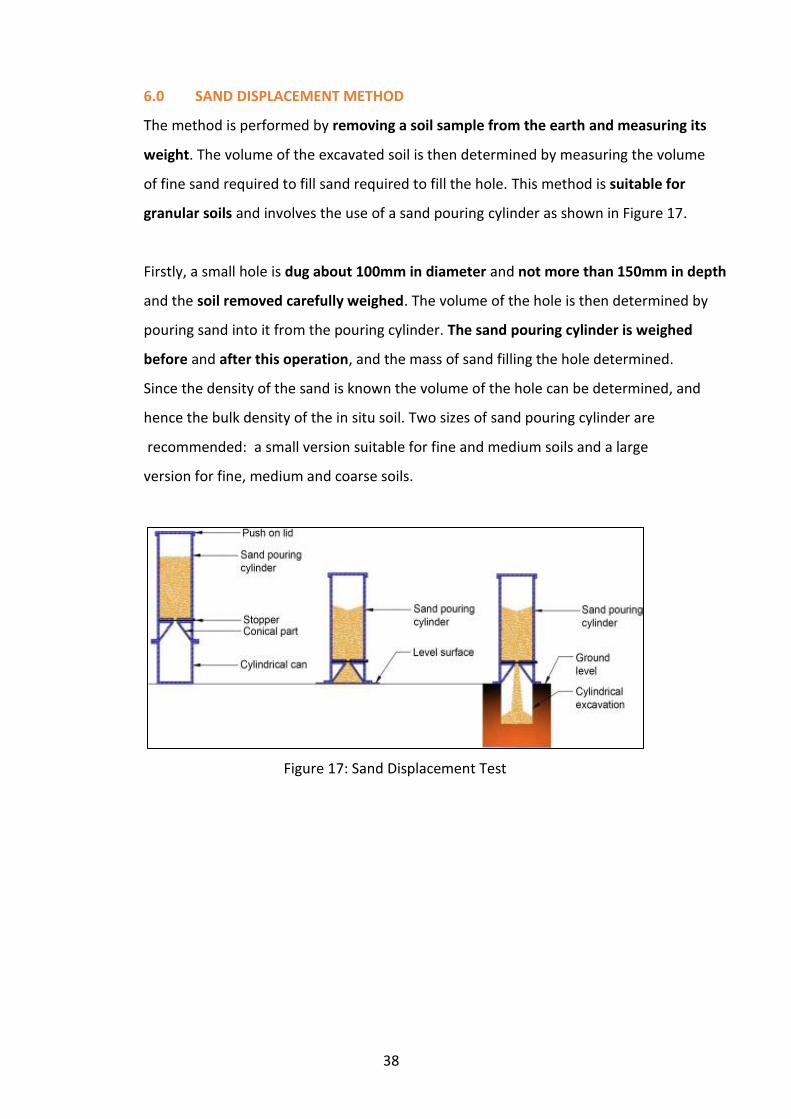
6.0 SAND DISPLACEMENT METHOD
The method is performed by removing a soil sample from the earth and measuring its
weight. The volume of the excavated soil is then determined by measuring the volume
of fine sand required to fill sand required to fill the hole. This method is suitable for
granular soils and involves the use of a sand pouring cylinder as shown in Figure 17.
Firstly, a small hole is dug about 100mm in diameter and not more than 150mm in depth
and the soil removed carefully weighed. The volume of the hole is then determined by
pouring sand into it from the pouring cylinder. The sand pouring cylinder is weighed
before and after this operation, and the mass of sand filling the hole determined.
Since the density of the sand is known the volume of the hole can be determined, and
hence the bulk density of the in situ soil. Two sizes of sand pouring cylinder are
recommended: a small version suitable for fine and medium soils and a large
version for fine, medium and coarse soils.
Figure 17: Sand Displacement Test
38

EXAMPLE
The following data were recorded during a sand replacement test:
Mass of soil removed from hole = 1.914kg
Mass of soil after oven drying = 1.664kg
Initial total mass of sand pouring cylinder = 3.426kg
Mass of sand pouring cylinder after running sand into hole = 1.594kg
Density of pouring sand = 1.62Mg/m3
Mass of sand in cone in sand pouring cylinder = 0.248kg
Determine the bulk and dry unit weights of the soil in situ.
SOLUTION:
Mass of sand run out of cylinder = 3.426 – 1.594 = 1.832kg
Mass of sand in cone of cylinder = 0.248kg
Mass of sand required to fill the hole = 1.832 – 0.248 = 1.584kg
Volume of the hole = 1.584 / Density of pouring sand = 9.778 x 10⁻⁴m3
Bulk density of in situ soil = 1.914 / 9.778 x 10⁻⁴m3= 1957.456 kg/m3
Bulk unit weight = (1957.456 x 9.81) / 1000 = 19.20 kN/m3
w = (1.914 – 1.664) / 1.664 = 0.15
Dry unit weight = 19.20/(1 + w) = 19.2 / 1 + 0.15 = 16.7 kN/m3
39

REFERENCE
Braja (2010). Principle of Geotechnical Engineering (7th ed.). Cengage.Learning.
United States of America.
Donald P. Coduto (1999). Geotechnical Engineering (Principles and Practices).
Prentice-Hall. Inc. Upper Saddle River. New Jersey. US
Marcus M. Truitt (1983). Soil Mechanics Technology. United States of America.
Prentice – Hall. Inc. Englewood Cliffs, New Jersey. US
Muni Budhu (2011). Soil Mechanics & Foundation (3rd ed). John Wiley & Sons Inc.


![DICHOS ESPIRITUALES Comentario [LT1]: Khalil Gibránweb.seducoahuila.gob.mx/biblioweb/upload/Gibran, Khalil... · 2017. 12. 19. · DICHOS ESPIRITUALES Khalil Gibrán . Descubrí](https://img.dokumen.tips/doc/110x75/610ccee2eae4ae416770ef9a/dichos-espirituales-comentario-lt1-khalil-gibrnweb-khalil-2017-12-19.jpg)


![[Khalil] - Nonlinear Systems](https://img.dokumen.tips/doc/110x75/55cf880955034664618cb489/khalil-nonlinear-systems-5671b09889c90.jpg)