Embed Size (px)
Citation preview
- 50- 286
SUMMARY .OF THE TEARING STABILITY ANALYSISOF THE INDIAN.P0 -PRIMARY COOLANT SYSTEM.
- n 1,, #504- !'6 Date ql42e, of Document.
.-- REGULATORY DOCKET FILE
RECORDS FACILITY BRANCH
-NOTICE
THE ATTACHED FILES ARE OFFICIAL RECORDS OF THE DIVISION OF DOCUMENT CONTROL. THEY HAVE BEEN CHARGED TO YOU FOR A LIMITED TIME PERIOD AND MUST BE* RETURNED TO THE RECORDS FACILITY BRANCH 016. PLEASE DO NOT SEND DOCUMENTS CHARGED OUT THROUGH THE MAIL. REMOVAL OF*ANY PAGE(S) FROM: DOCUMENT FOR. REPRODUCTION MUST BE REFERRED TO FILE PERSONNEL.
DEADLINE RETURN DATE
New York Power Authority Contract No. 80-121
Final Report, May 4, 1984 Revision 1, February 7, 1985
Report Number 83-76
SUMMARY OF THE TEARING STABILITY ANALYSIS OF THE
INDIAN POINT 3 PRIMARY COOLANT SYSTEM
Prepared by
FRACTURE PROOF DESIGN CORPORATION
77 Maryland Plaza St. Louis, MO- 63108
Principal Investigators
K. H. Cotter Paul C. Paris
Prepared for
New York Power Authority 123 Main Street
White Plains, NY 10601
New York Power Authority Project Manager
James V. Brunetti Civil-Structural Department, Design and Analysis
8504050206 850401 PDR ADOCK 05000286 P PDR
(NON-PROPRIETARY)
____FPDC..
I.. fracture proof design corporation IIII
- NOTICE THE ATTACHED FILES ARE OFFICIAL RECORDS OF THE
DIVISION OF DOCUMENT CONTROL. THEY HAVE BEEN CHARGED TO YOU FOR A LIMITED TIME PERIOD AND MUST BE RETURNED TO THE RECORDS FACILITY
BRANCH 016. PLEASE DO NOT SEND DOCUMENTS CHARGED OUT THROUGH THE MAIL. REMOVAL OF ANY PAGE(S) FROM DOCUMENT FOR REPRODUCTION MUST BE REFERRED TO FILE PERSONNEL.
DEADLINE RETURN DATE
RECORDS FACILITY BRANCH
TABLE OF CONTENTS
Pa &_
1 INTRODUCTION 1-1
2 STRUCTURAL DUCTILITY CONCEPTS 2-1
2-1 Stored Elastic Energy 2-1
2-2 Structural Ductility 2-1
3 TEARING STABILITY / STRUCTURAL DUCTILITY, RESULTS AND DISCUSSION 3-1 3-1 Analysis Approach 3-1 3-2 Hot Leg Results 3-1
3-3 Cold Leg Results 3-2
3-4 Cross Leg Results 3-2
4 SSY BASED ANALYSIS 4-1
4-1 S-Integral Estimation 4-1
4-1.1 Circumferential Cracks 4-1
4-1.2 Longitudinal Cracks 4-3
4-1.3 Tearing Stability for SSY Conditions 4-3
4-1.4 Plastic Zone Instability Failure 4-4
4-2 Leak Rate Analysis 4-4
5 LEAKAGE SIZE CRACK STABILITY, RESULTS AND DISCUSSION 5-1
5-1 Primary Coolant Loop Piping System 5-1
5-1.1 System Description 5-2
5-1.2 Piping Code Structural Analysis 5-2
5-2 Leak Detectability 5-3
5-2.1 Circumferential Flaws 5-4
5-2.2 Longitudinal Flaws 5-4
5-3 Crack Stability, Level D Loads 5-5 5-3.1 Circumferential Flaws 5-5
5-3.2 Longitudinal Flaws 5-6
6 SUMMARY AND CONCLUSIONS 6-1
7 REFERENCES 7-1
APPENDIX A PROGRAM: JTPIPE A-1
APPENDIX B CIRCUMFERENTIAL CRACK CALCULATIONS B-1
APPENDIX C LONGITUDINAL CRACK CALCULATIONS C-1
APPENDIX D LEAKAGE DETECTION D-1
THIS PAGE IS NON-PROPRIETARY

Section 1
INTRODUCTION
Beginning in July, 1980, Fracture Proof Design Corporation (FPDC)
began an analysis of the New York Power Authority's (NYPA) Indian Point 3
Nuclear Power Plant for purposes of demonstrating that no asymmetric
loads were applied to the reactor pressure vessel (RPV) during a
postulated LOCA accident. The approach taken by FPDC was to demonstrate
that even if i) upper-bound loads, that is, loads that are larger than
Level D or design loads, and ii), large cracks, ranging from 60 to
greater than 1800 of circumferential length, were present in the reactor
coolant system (RCS) piping, no instability of the cracks would occur.
The conclusion of such a postulate is that no instantaneous guillotine
type break could occur even under the' foregoing postulated severe
conditions. Thus, if no guillotine break occurs, no large LOCA loads
would be present, and thus, the Indian Point 3 asymmetric load problem
has been resolved.
In the summer of 1981, FPDC transmitted the results of the analysis
of the Indian Point 3 RCS (1) to the USNRC. This was followed by a
briefing given to the Commission's Staff in September, 1981. At the time
of the briefing, the Commission indicated, verbally, that it was in
agreement with the approach taken to demonstrate that no large LOCA loads
could exist. But, ' it requested further evaluation of material
properties. Thus, FPDC undertook a testing program to develop tearing
Page 1-2
resistance data for the primary piping materials and welds, on behalf of
NYPA. The test program included S-resistance curves and computation of
the material tearing modulus for the wrought and cast materials and welds
thereof that are in the RCS. The test program was completed in the
summer of 1983 and the results (2) were forwarded to the USNRC for
review.
During the period between th e original submittal of the analysis of
the RCS (1) and the present time, a number of criteria have been drafted
for purposes of postulating pipe-breaks in nuclear piping using fracture
mechanics methods. This activity culminated with the USNRC publishing a
draft criteria (3) in November, 1983. Between 1981 and the present,
developments in analysis methodology and concepts were being made. These
included the work of Paris and Cotter ()on the concept of structural
ductility.
It is the intent of this summary document to re-evaluate the results
of the original analysis (.) by incorporating the material resistance
data developed in the test program (2,to compare the analysis with the
proposed NRC criteria (.), and finally, to demonstrate the applicability
of the new structural ductility (!I) concepts.
Section 2
STRUCTURAL DUCTILITY CONCEPTS
The fundamental concepts involved in structural ductility arguments
were presented by Paris and Cotter (4j) and Paris (5) and are reviewed in
this section to acquaint the unfamiliar reader.
2-1 STORED ELASTIC ENERGY
Earlier arguments by Nathan Newmark showed that to insure suffcient
structural ductility, it was necessary to show that a structure could
absorb (up to) twice its stored elastic energy by a plastic energy
dissipation mechanism. Paris and Cotter (4I) applied this concept to
problems involving the integrity of nuclear piping and related the
Newmark requirement to the tearing modulus (Ej) approach.
* ** *PROPRIETARY DATA OMITTED *
2-2 STRUCTURAL DUCTILITY
The foregoing section, describing the absorption of stored elastic.
energy is only one of two portions of the structural ductility arguments
presented by Paris and Cotter (4I). Following their arguments, it is
Page 2-2
noted that the requirement of Equation 2-7 is based on a global energy
dissipation requirement. The portion remaining is that of a local
requirement. In structural analyses involving nuclear piping systems,
the local requirement is met by determining the value of the applied
J-integral, at the crack section, due to local loading conditions. The
value for Japp is readily computed using one or more methods. For the
purpose of this analysis, the JTPIPE computer program (8) was used. By
so doing, it is found that the total J at the crack section is equal to
* * * * PROPRIETARY DATA OMITTED * * * *
if structural ductility requirements are to be met. An additional
requirement is that, to insure crack stability, the value of the applied
tearing modulus, Tapp, must satisfy
-Tapp < Tmat (2-9)
where Tapp is computed by use of JTPIPE or by similar schemes, Tmat is
the value of the material tearing modulus, corresponding to the value of
'japp given in Equation 2-7 and q is the Newmark factor,
* * * * PROPRIETARY DATA OMITTED * * * *
Page 2-3
Thus, the second requirement to insure structural ductility is
satisfaction of Equation 2-9, which is simultaneously subject to the J app
being computed in accordance with Equation 2-7. In other words, the Japp
and Tapp, as developed in Equation 2-8 and 2-9, must be adequately within
the stable region of a J-T stability diagram.
Section 3
RESULTS
It was necessary to re-analyze the Indian Point 3 RCS because of the
development of the new material property data (2), the development of new
bounding loads as described below, and the development of structural
ductility concepts (4).
3-1 ANALYSIS APPROACH
This sub-section describes the analytical methods used for analyzing
the RCS.
* * * * PROPRIETARY DATA OMITTED * * * *
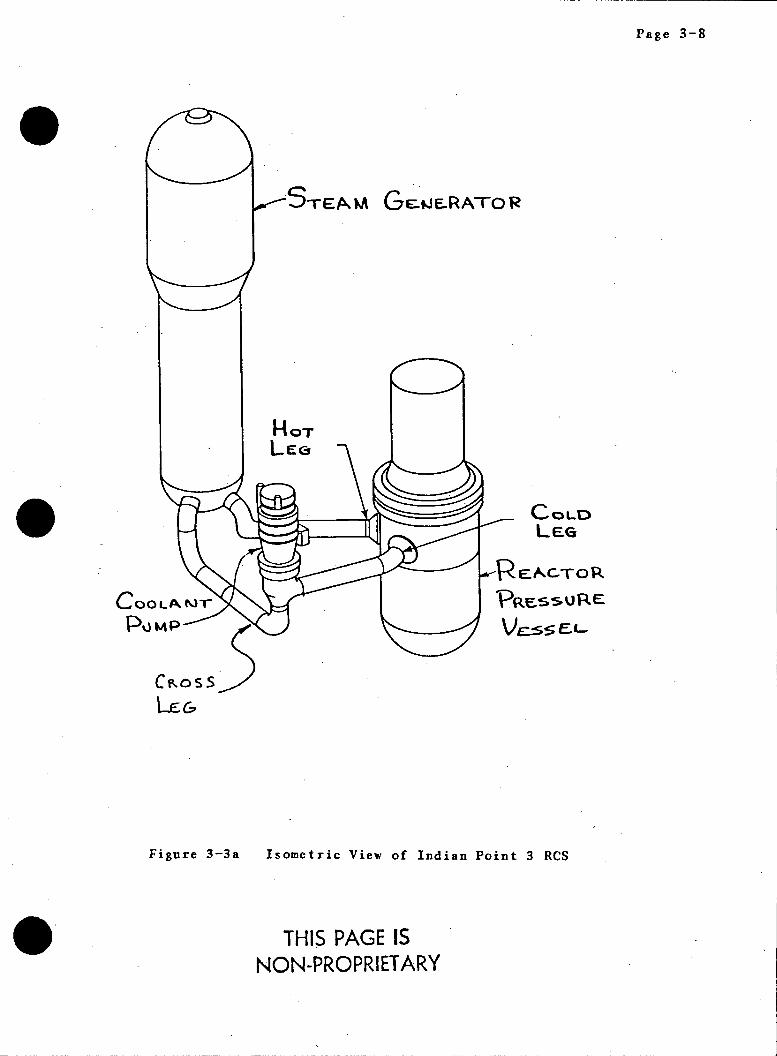
3-2 HOT LEG RESULTS
An isometric view of the RCS is shown in Figure 3-3a, the hot leg of
the RCS connects the RPV to the steam generator (SG). This is shown in
elevation view in Figures 3-3b (OMITTED AS PROPRIETARY) and 3-3c, based
on measurements taken at the Indian Point 3 site (11),
* * * * PROPRIETARY DATA OMITTED * * * *
The total value of Iapp is represented by the horizontal bar at the limit
Page 3-2
of the vertical line as shown in Figures 3-5 thru 3-7. Using this
approach, and material, data based on deformation theory J, I d' stability
of the hot leg was proven unconditionally.
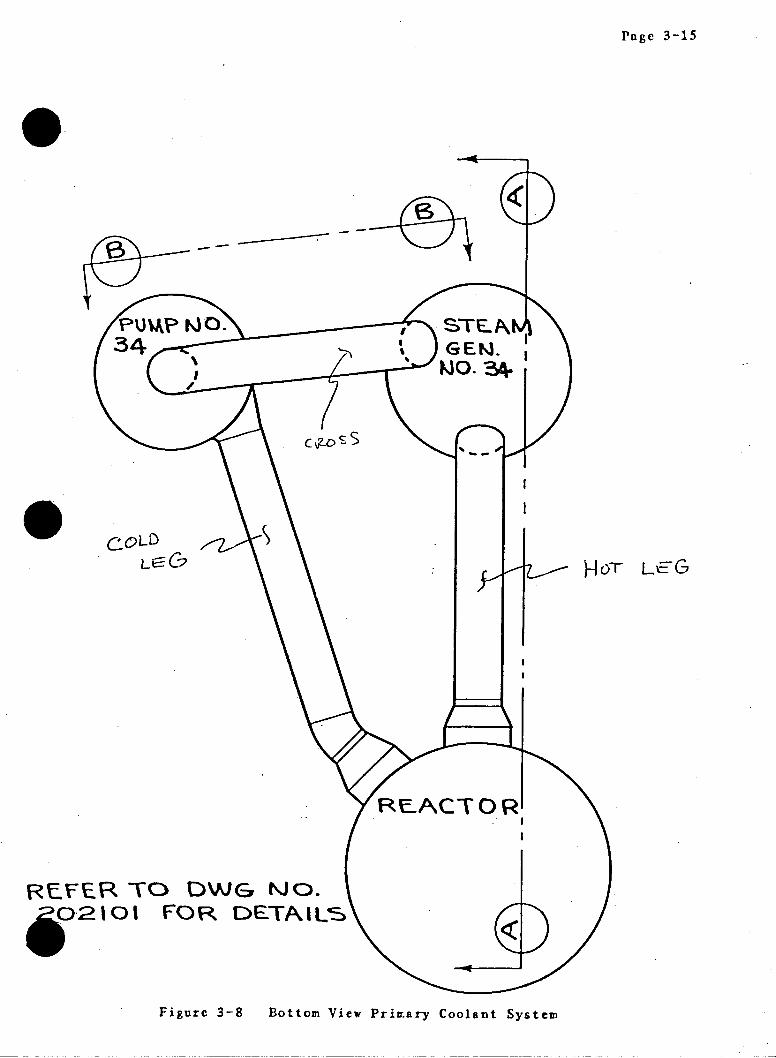
3-3 COLD LEG RESULTS
The plan view of the RCS is shown in Figure 3-8.
* ** *PROPRIETARY DATA OMITTED** *
Stability of the cold leg was demonstrated based on tearing stability and
structural ductility as shown in Figures (OMITTED AS PROPRIETARY).
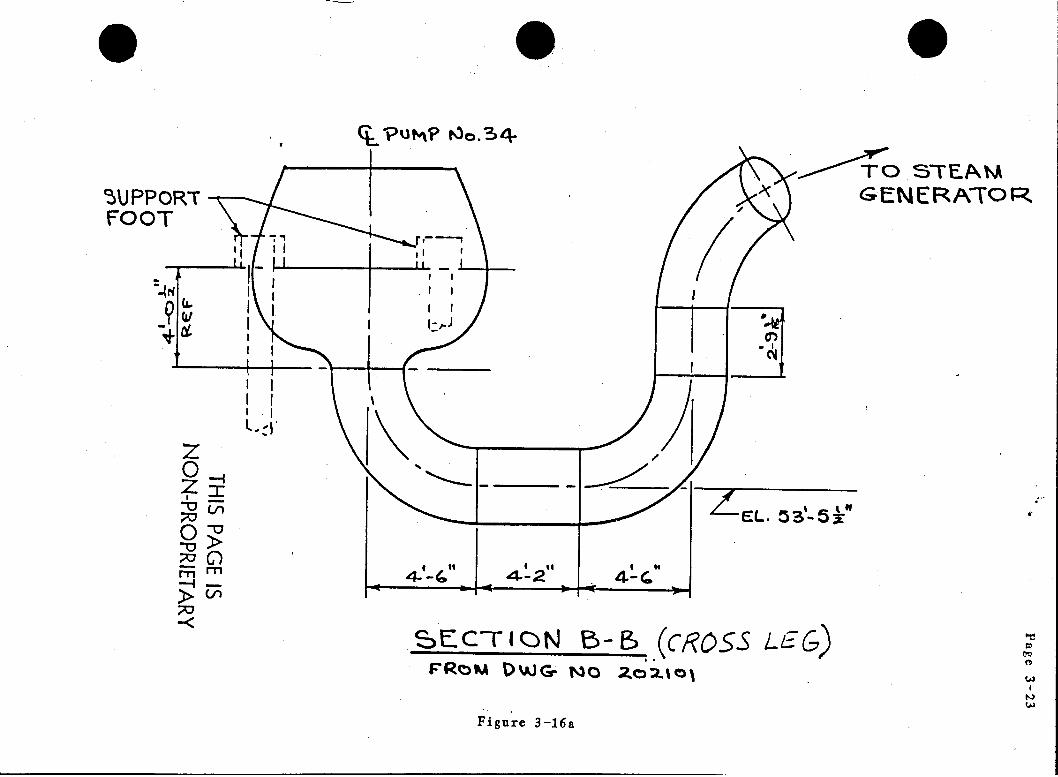
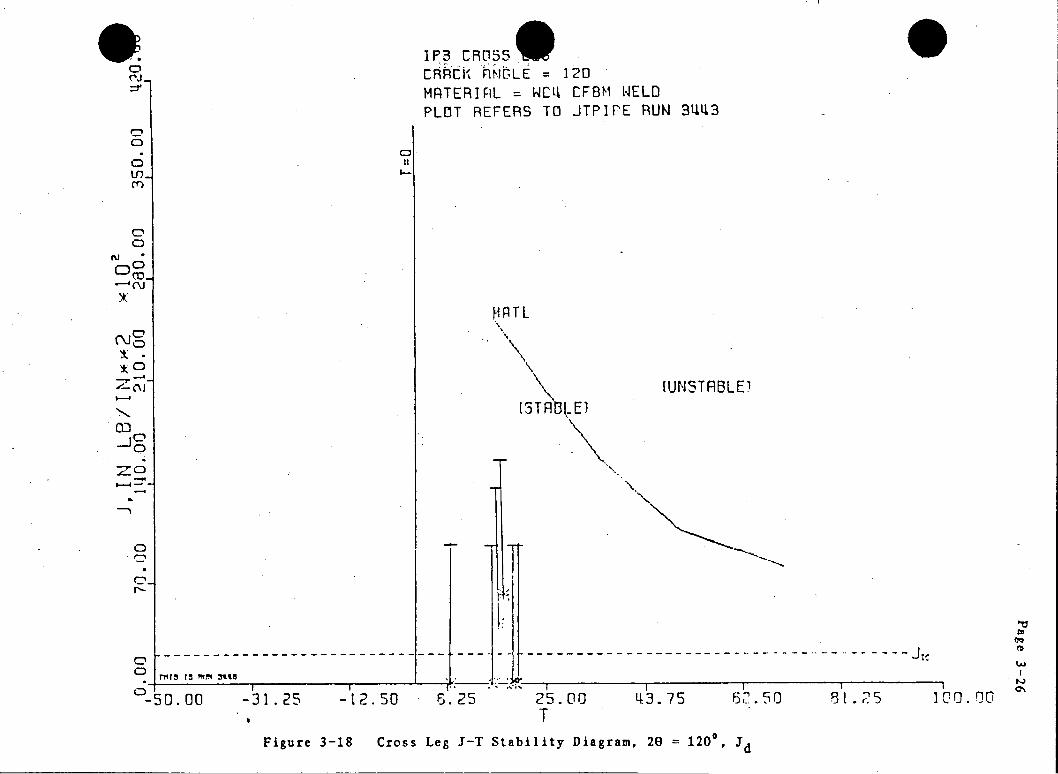
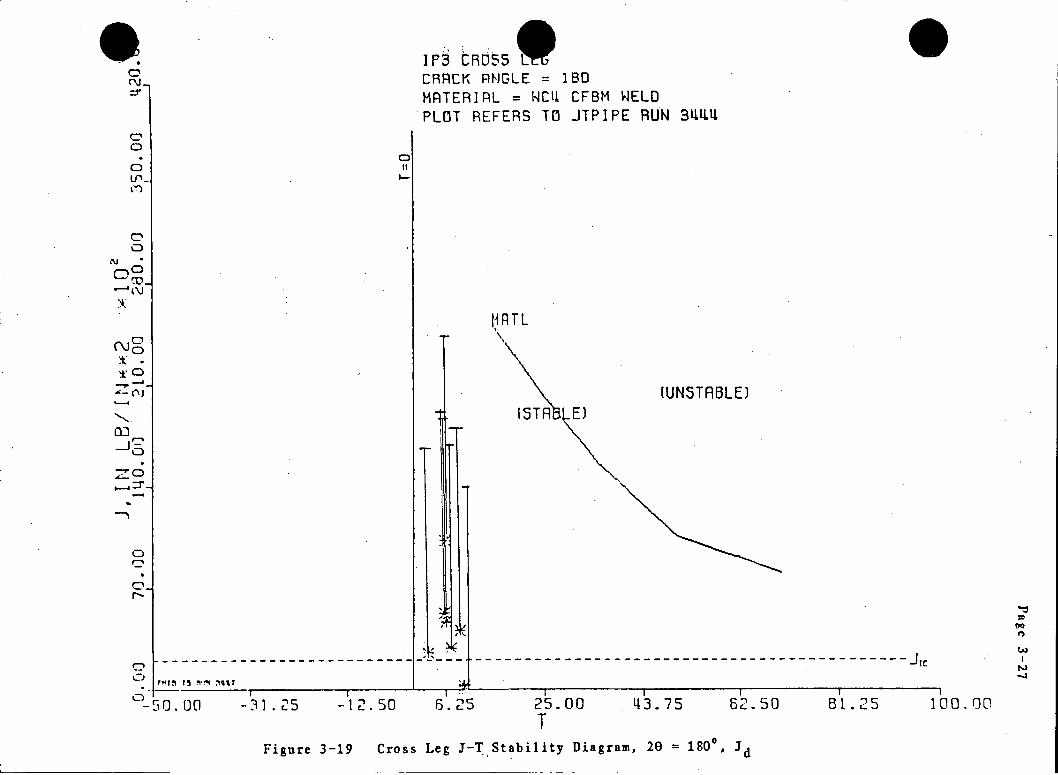
3-4 CROSS LEG RESULTS
The cross leg is shown in Figure 3-16a and its idealization in
* ** *PROPRIETARY DATA OMITTED* **
The results, using deformation theory I for the material resistance, are
shown in Figures 3-17 through 3-19. Again, these represent results for
60, 120, and 180 degrees, respectively. Stability is again indicated
even with these unduly conservative assumptions on loading.
.+.+.+ NOTE: ALL PROPRIETARY FIGURES ARE OMITTED .+.+.+
"TF_A, GJtjFRA-TO R
COLD LEG
-REA TOR 'ppFs sU R E
Figure 3-3a Isometric View of Indian Point 3 RCS
THIS PAGE IS NON-PROPRIETARY
Page 3-8
Coss

ZEL. r'3732
SECTION A- A% .(V40 L EGFRoaM .D JG- NO Z 1 1
Figure 3-3c

1r3 HOT LEG CRRCK ANGLE = 60 HRTERIAL = WCU CFBM WELD PLOT REFERS TO JTPIPE RUN 33BQ
N I \l'Q~YJt~" .&1 -31.25 -12.50 6.25
(UNSTRBLE)
--- - - - - - - - - - - - - - - - - - - - - j r
I 25.00 T
43.75 62.501 81.25
Figure 3-5 Hot Leg I-T Stability Diagram, 20 = 600, d
0
C) -)d
-JO
co C)
C)
zO
C C)
04-
-50.00 100.00
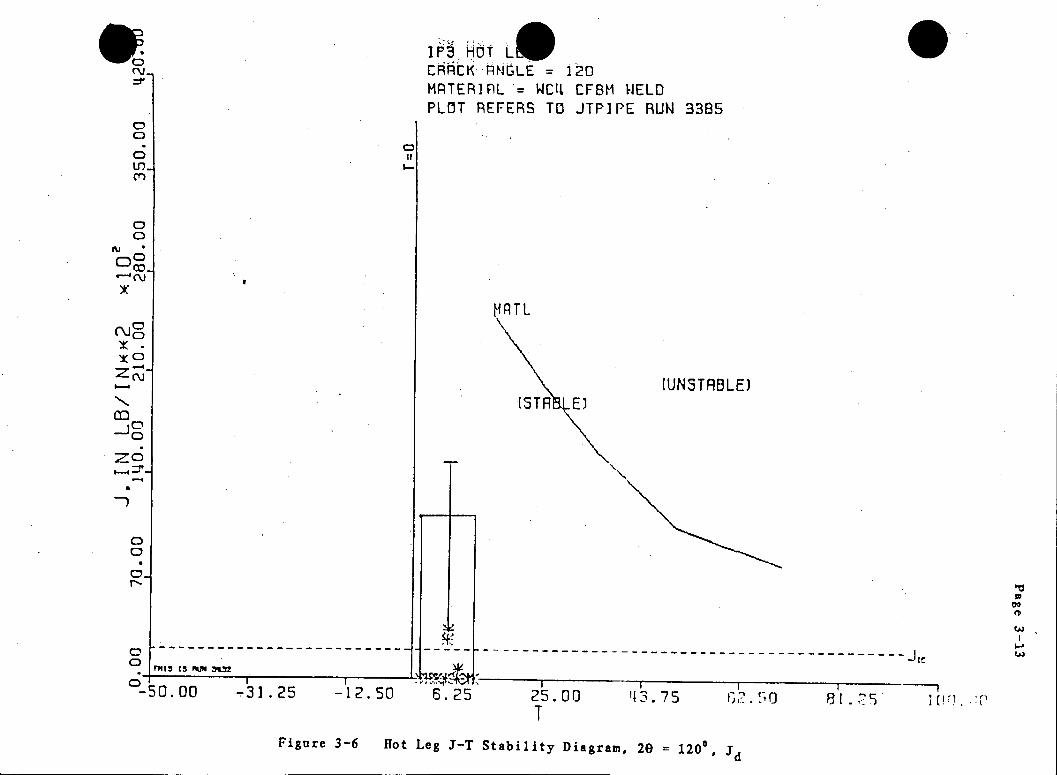
I F31 HOT LW ChRCk R-NGLE = 120 MATERIPL = WCtI CFBM WELD PLOT REFERS TO JTP]PE RUN 3385
-f I L
-12.50
C3 C)
C; U.cr)
C:)
0
C\0
fu
oc
Co
C(:)
-.4
O0 -o
0
C)
0 F-
[STAR1LE)
-4-
6.25
- jI
25.00 T
13.75 5 0
Hot Leg J-T Stability Diagram, 20 = 120° , d
(UNSTABLE)
C mts t3BsA 3M
-50. 00 -31.25 I I (!rl
Figure 3-6

P3. HOT LEWnI'Rk RNGLE = 180
MATERIFiL = WCL CFBM WELD PLOT REFERS TO JTPIPE RUN BB7
0
CD
C\Jo
-4
0 C,
c4
IUNSTRBLE)ISTR13LE)
,.25I
25.00 T
1 43.75 I 62...50
Hot Leg J-T Stability Diagram, 20 = 1800, d
ATL
-50.00
!- -
-12. 501 -31 .25 I6 . 81t. 25
IO~L FM'
- - - - -- -- -- - - -- -- - - - - -- -- - - - - -- -- - - j1C: 13
Figure 3-7
Page 3-15
RFeE-R TO DWG N(O. 1 2101 FOR DETAILS
)-oT L EG
Bottom View Primary Coolant SystemFigure 3-8
PUM? .o-3.4
SUPPORT FOOT
GENERA-TOP,
-EL. 33!-5:k"
SEc-r ION B-e IBG -FRZM DAJG- No Zo2.vm
Figure 3 -16a

I P3 C 5, CRRLK RNGLE = 60 MRTERIRL = WC, CFBM WELD PLOT REFERS TO JTPIPE RUN MUtL2
r14fi M N i 3t
-50.00 I -3 1. 25 -12.50
C C
In
C
co
C
0
-C
I wm.I
6.25
I I*--- -- -- -- -- ---- --- -- --- --- --- --- --- ---- ic
25.00 T
43.75 62.50 a t
Figure 3-17 Cross Leg J-T Stability Diagram, 20 = 600, Jd
[UN5TABLE)
I W d. vi_
(D
I P3 C RO W1 5 CRE! hMt'LE = 120 MATERIFAL = WC, CF8M 1ELD PLOT REFERS TO JTPIPE RUN 3111,3
ev
.r,_
CD
0
Co
('O_
ZO0 ... 0
uNTFRBLE.3T R131-_E)
25.00 T
. 43.75
Figure 3-18 Cross Leg J-T Stability Diagram, 20 = 1200, id
f PIT L
-50.00 -31.25 -12.50S aI 'L &
6.25
-......,--Jtc
I 611..50 81.25 I- 0 . 90-'T,- I I
,' .. :, ' L I F3 CRO55I CRRCK RNGLE = 1BD
MATER]L = WC1I CFBM WELD
PLOT REFERS TO JTPIPE RUN 3M111U,
RTL
IUNSTABLE)
6.25 25.00 T
62.50
Figure 3-19 Cross Leg J-TStability Diagram, 20 = 1800, 3 d
C"
c~- C]
C)
OD
-31.25 -12.50
- - - - - - - - -- - - - - - - - - - - - - - - - - - - - - - - - - JT c
BI.25 100. 00is M-,f *71%7l
Section 4
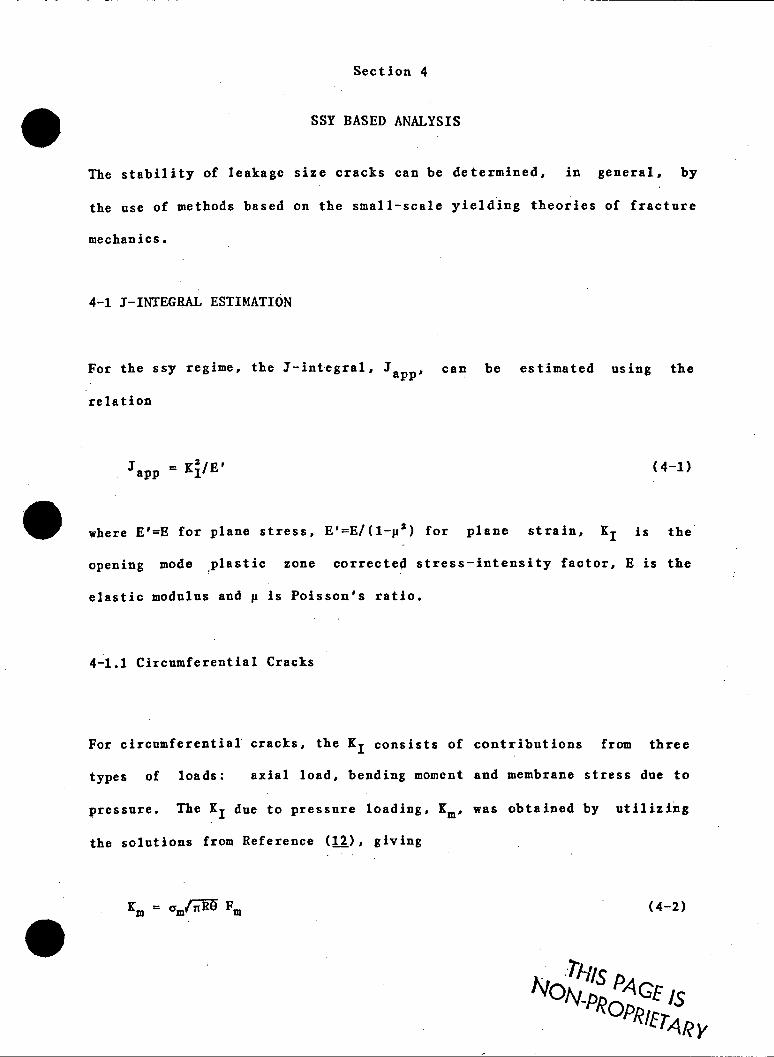
SSY BASED ANALYSIS
The stability of leakage size cracks can be determined, in general, by
the use of methods based on the small-scale yielding theories of fracture
mechanics.
4-1 I-INTEGRAL ESTIMATION
For the ssy regime, the -integral, Japp' can be estimated using the
relation
Japp = K2/EV (4-1)
where E'=E for plane stress, E'=E/(l-p2) for plane strain, K1 is the
opening mode plastic zone corrected stress-intensity factor, E is the
elastic modulus and p is Poisson's ratio.
4-1.1 Circumferential Cracks
For circumferential cracks, the KI consists of contributions from three
types of loads: axial load, bending moment and membrane stress due to
pressure. The KI due to pressure loading, Km* was obtained by utilizing
the solutions from Reference (12), giving
K. m'R Fm(4) (4-2)

Page 4-2
where m is the membrane stress (axial) and Fm is a non-dimensional shell
correction factor that depends upon the length of the crack and the
geometrical dimensions of the shell.
The KI due to the applied axial tension load is
Kt = atfn-RO Ft (4-3)
where Ft depends upon the same parameters as Fm . The function Ft can be
derived from the recent work of Erdogan and Delale(13). FPDC has
developed its own approximate, but conservative, expression for Ft which
was used in this study. crt is the stress (tension) due to the axial load
Fax
t = Fax/(2nRt) (4-4)
Similar to the tension loading case, FPDC had previously developed an
estimate of K for the externally applied bending load; and the K due to
this loading is
Kb = GbffbiO Fb (4-5)
where Fb is a correction factor for a circumferential crack in a shell
subjected to a bending load. b is the maximum bending stress due to the
external moment, M,
b = M/Z (4-6)
Page 4-3
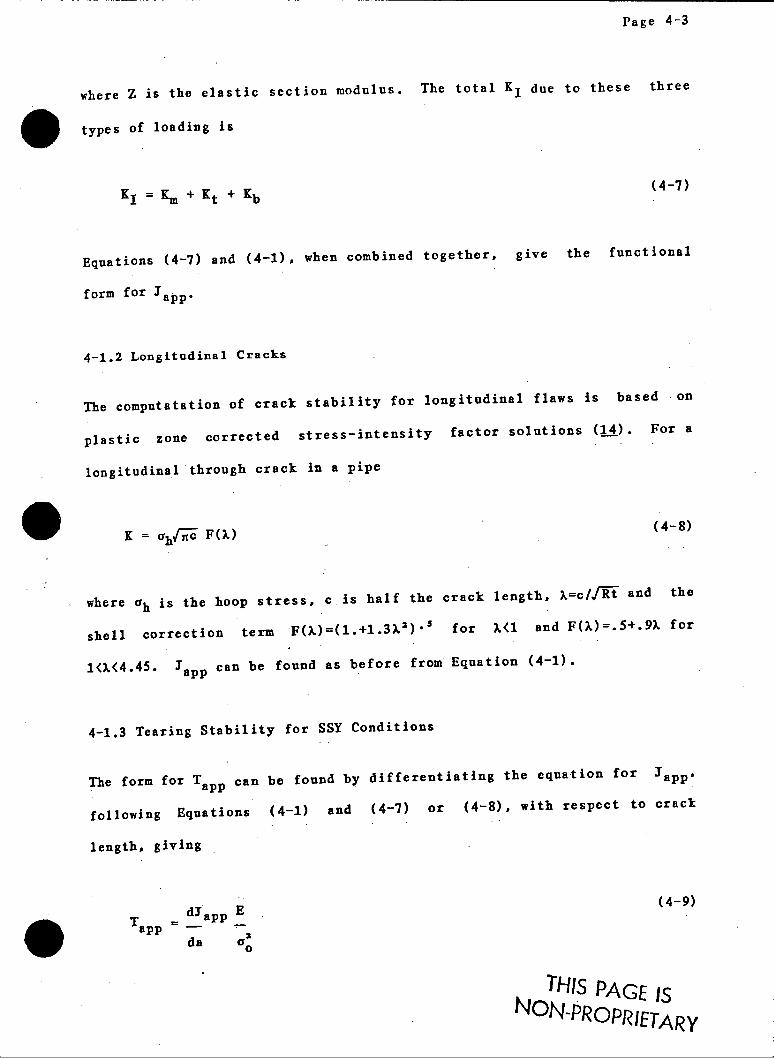
where Z is the elastic section modulus. The total K, due to these three
types of loading is
K, = Km + Kt + Kb (4-7)
Equations (4-7) and (4-1), when combined together, give the functional
form for Japp
4-1.2 Longitudinal Cracks
The computatation of crack stability for longitudinal flaws is based on
plastic zone corrected stress-intensity factor solutions (14). For a
longitudinal through crack in a pipe
K = ah1 F(W)
(4-8)
where ah is the hoop stress, c is half the crack length, X=c/fRi and the
shell correction term F(X)=(.+1.3X2)s for ).(1 and F(%)=.5+.9k for
1(.(4.45. Japp can be found as before from Equation (4-1).
4-1.3 Tearing Stability for SSY Conditions
The form for Tapp can be found by differentiating the equation for Japp0
following Equations (4-1) and (4-7) or (4-8), with respect to crack
length, giving
T pp dl' app E (4-9)
Tap p - - 2
da ao0
aTHIS PAGE IS NON-PROPRIETARY

Page 4-4
Then, using Equations (2-2) through (2-4), the stability of the crack can
be determined.
4-1.4 Plastic Zone Instability Failure
Vasquez and Paris(14) have shown that situations exist in which the
gradient with respect to the crack size of the elastic stress field at
the tip of the crack becomes sufficiently large that the plastic zone
cannot maintain stable static equilibrium and plastic zone instability
occurs, followed by the propagation (or unstable extension) of the crack.
This mode of unstable extension is called a "plastic zone instability
failure" or PZIF). The functional form of the PZIF criterion is given by
K2 = 2nCeff/pz (4-10) pzif o
where Pz=1+2kF'/F, and ceff, X and F(M) are the plastic zone corrected
terms described in Equation (4-8).
4-2 LEAK RATE ANALYSIS
The estimate of the leak rate for various cracks was based upon the LEFM
based methods given in Reference (15). In general, the leak rate depends
upon the applied stress and crack length. Thus, the calculation of leak
rate necessitates the development of a fluid flow model for fluid leaking
through a crack. It also requires consideration of the thermodynamics of
the flow and the surface roughness of the crack.
THIS PAGE IS
NONpROPRIETARY

Section 5
LEAKAGE SIZE CRACK STABILITY, RESULTS AND DISCUSSION
The theory of Section 2 and the results of Section 3 were developed
solely for the purposes of demonstrating the margins of safety against
unstable fracture. The approach used therein relied on postulated cracks
having circumferential lengths of 60, 120 or 1800. It is not suggested
that cracks of that size exist because, as this Section will prove,
cracks of much shorter lengths are readily detectable.
The safety of the primary coolant system piping at the Indian Point Unit
3 focuses on the ability of leakage monitoring systems to detect leakage
size cracks in the piping and the demonstration of their having adequate
marginus against unstable behavior. The evaluation of this system begins
with a description thereof including the code stresses, pipe geometry and
operating pressures and temperatures.
The criteria used for the analysis of the p rimary coolant system piping
in this Section is based on that contained in NUREG-1061(16). The
approach used is described in the following Sub-Sections.
5-1 PRIMARY COOLANT LOOP PIPING SYSTEM
The primary coolant system provides a continuous flow of coolant through
the RPV in order to achieve heat transfer rates greater than that
possible by natural convection. The system is composed of 4 loops,
similar to the single loop shown in Figure 3-3a. The loops are referred
THIS PAGE IS NON-PROPRIETARY

Page 5-2
to as loops 31, 32, 33 and 34. In this study, only loop 34 is
*considered.
The portion of the primary coolant loop piping system that is of interest
in this study is limited to the hot leg, cross leg and cold leg piping
portions of the loop.
5-1.1 System Description
Following the isometric view of loop 34, shown in Figure 3-3a, the system
can be readily explained. Flow from the RPV is via the 29 in. hot leg at
a pressure of 2235 psig under normal conditions. The normal operating
temperature for the hot leg is 605F. The coolant flows through the hot
leg to the steam generator, then via a 31 in. cross leg to the pump and
finally thru the 27.5 in. cold leg back to the RPV. The temperatures of
the. cross and cold legs were taken as 551F and the pressures were assumed
to be equal to that of the hot leg.
5-1.2 Piping Code Structural Analysis
Because a stress analysis had already been performed by Westinghouse
(!7), as part of the design of the NSSS, it was not necessary to perform
another. The W stress analysis (WSA) results (1.) used herein are taken
directly from the stress report. The leak rate computation required by
NUREG-1061(1) uses normal operating stresses. To be conservative, for
purposes of computing leak rates, the stresses due to dead weight and
thermal expansion were neglected and only the pressure term was used.
• THIS PAGE IS N4ON-PROPRIETARY
Page 5-3
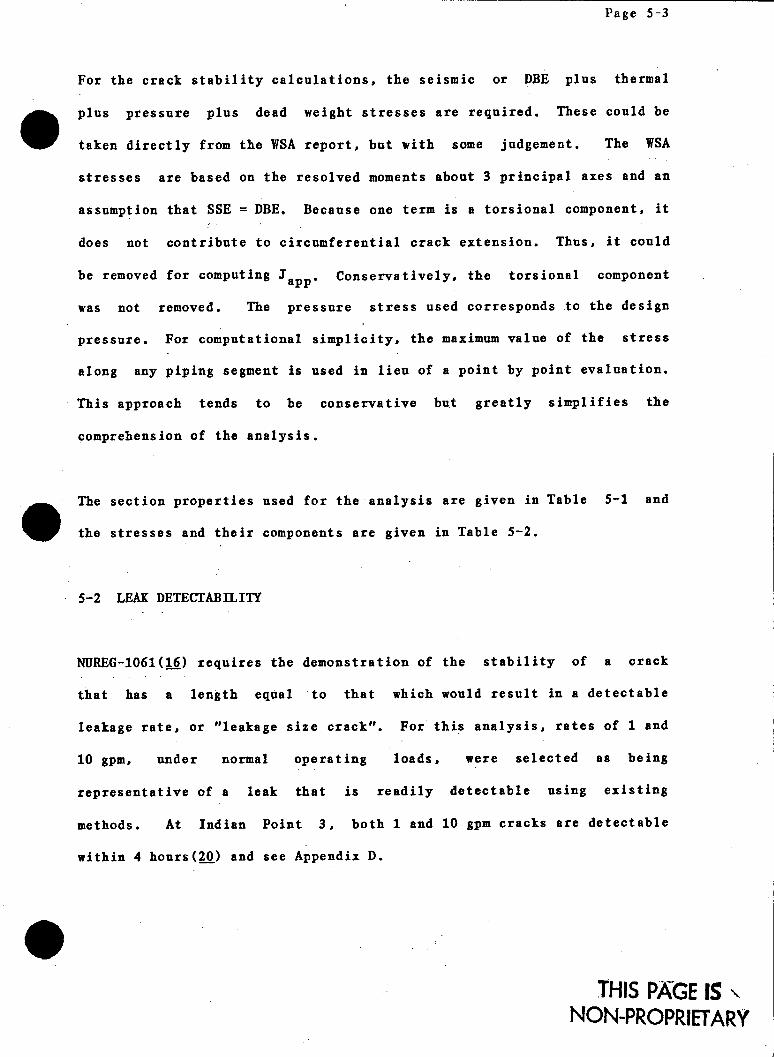
For the crack stability calculations, the seismic or DBE plus thermal
plus pressure plus dead weight stresses are required. These could be
taken directly from the WSA report, but with some judgement. The WSA
stresses are based on the resolved moments about 3 principal axes and an
assumption that SSE =DBE. Because one term is a torsional component, it
does not contribute to circumferential crack extension. Thus, it could
be removed for computing I apConservatively, the torsional component
was not removed. The pressure stress used corresponds to the design
pressure. For computational simplicity, the maximum value of the stress
along any piping segment is used in lieu of a point by point evaluation.
This approach tends to be conservative but greatly simplifies the
comprehension of the analysis.
The section properties used for the analysis are given in Table 5-1 and
the stresses and their components are given in Table 5-2.
5-2 LEAK DETECTABILITY
NUREG-1061(16) requires the demonstration of the stability of a crack
that has a length equal to that which would result in a detectable
leakage rate, or "leakage size crack". For this analysis, rates of 1 and
10 gpm, under normal operating loads, were selected as being
representative of a leak that is readily detectable using existing
methods. At Indian Point 3, both 1 and 10 gpm cracks are detectable
within 4 hours(20) and see Appendix D.
T HIS PAGE IS NON-PROPRIETARY'

Page 5-4
5-2.1 Circumferential Flaws
The leakage rate computation is conservatively based on the stresses that.
result from the normal operating pressure (2,235 psi) component(17.)
alone. The dead weight plus thermal components of stress were
conservatively ignored. No dynamic loads are used in developing the
stresses for the leak rate computation. It. is noted that the lower the
stress, the lower the leak rate, and the longer the crack must be in
order to have a detectable leak. Leakage rates were computed for a
series of crack sizes based on the computed pressure stresses. It was
found that cracks having lengths ranging from 6.8 to 7.2 inches
correspond to a rate of leakage of 1 gpm. For a 10 gpm rate, the lengths
ranged from 11.5 to 12.6 inches. The results are shown in Figure 5-1 and
Table 5-3.
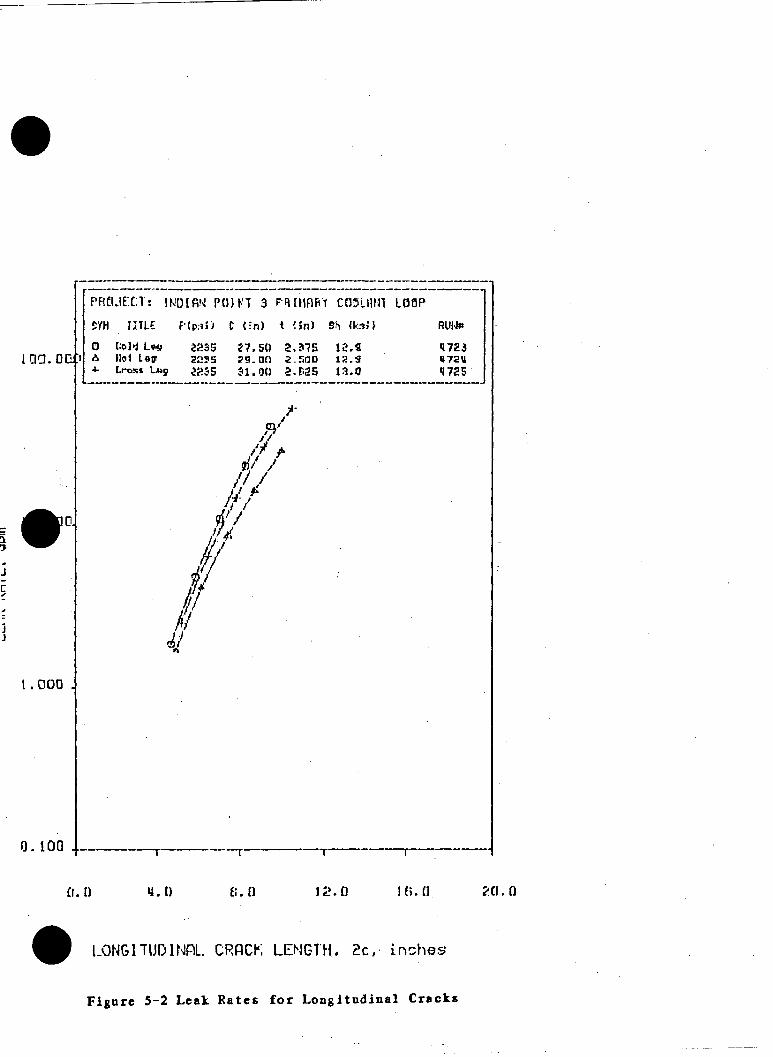
5-2.2 Longitudinal Flaws
The leakage rates for longitudinal flaws were computed using a hoop
stress again conservatively based on a normal operating pressure of 2,235
psi(17). For the range of flaw sizes considered, It was found that a
1 gpm leak rate was attained for cracks having lengths between 3.9 and
4.3 inches. For the 10 gpm rate, the lengths ranged from" 7.0 to 7.8
inches. The results are presented in Figure 5-2 and Table 5-3.
THIS PAGE 1S NON-PROPRIETARY
Page 5-5
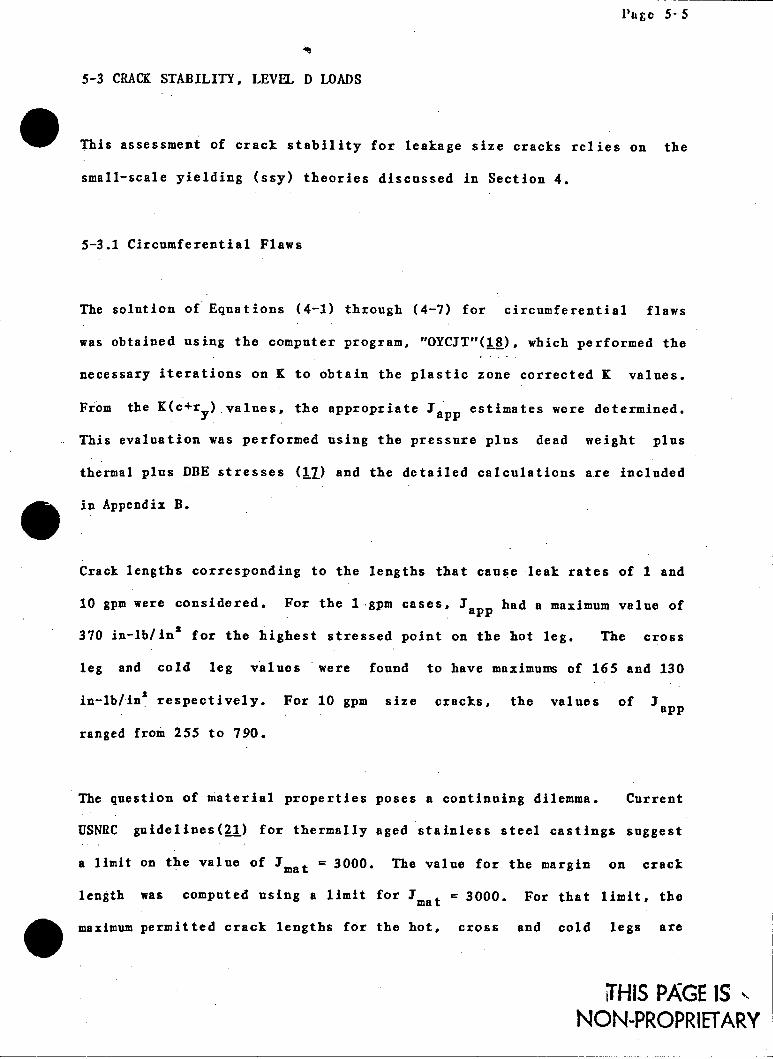
5-3 CRACK STABILITY, LEVEL D LOADS
This assessment of crack stability for leakage size cracks relies on the
small-scale yielding (ssy) theories discussed in Section 4.
5-3.1 Circumferential Flaws
The solution of Equations (4-1) through (4-7) for circumferential flaws
was obtained using the computer program, "OYCJT"(18), which performed the
necessary iterations on K to obtain the plastic zone corrected K values.
From the K(c+ry )values, the appropriate Iapp estimates were determined.
This evaluation was performed using the pressure plus dead weight plus
thermal plus DBE stresses (_7) and the detailed calculations are included
in Appendix B.
Crack lengths corresponding to the lengths that cause leak rates of 1 and
10 gpm were considered. For the 1 gpm cases, Jap p had a maximum value of
370 in-lb/in 2 for the highest stressed point on the hot leg. The cross
leg and cold leg values were found to have maximunm of 165 and 130
in-lb/in respectively. For 10 gpm size cracks, the values of Japp
ranged from 255 to 790.
The question of material properties poses a continuing dilemma. Current
USNRC guidelines(21) for thermally aged stainless steel castings suggest
a limit on the value of Jmat = 3000. The value for the margin on crack
length was computed using a limit for Jmat = 3000. For that limit, the
maximum permitted crack lengths for the hot, cross and cold legs are
THIS PAGE IS NON-PROPRIETARY

Page 5-6
25.0, 39.5 and 39.8 inches respectively. Thus, excellent margins on
crack length were demonstrated.
To determine the margin on load, the pressure, dead weight and thermal
expansion stresses were held constant while the uncertainty in the
seismic component was explored. It was found that more than 4 times the
DBE load could be tolerated for both 1 and 10 gpm size cracks. This
insures an excellent margin of stability based on load.
For the levels of Iapp computed using Level D loading and leakage size
cracks, it was found that only small amounts of crack extension would
occur. Because the loading and amount of crack-tip plasticity are within
the ssy regime, Tap p is small ((6). Thus, no crack instability is
indicated for any location. Refer to the results in Appendix B for
details of the calculations.
5-3.2 Longitudinal Flaws
Crack stability, as evidenced by J<J<c and 3 <1 pzif' was checked using the
hoop stress at the pipe wall mid-plane. Upon substituting the
appropriate crack lengths (2c(10 gpm) plus 2t) and stresses into Equation
(4-8), we find, for the 10 gpm crack, that the plastic zone correctel
values of J range from 396 to 412 in-lb/ins. Because the cracks are
longitudinal, it is appropriate to use base metal properties. Again,
using a limit of Jmat 3000, we are insured of crack stability. Having
satisfied the fracture toughness criterion, a check for a plastic zone
instability failure (PZIF) was made following the methods of Vasquez and
THIS PAGE IS NON-PROPRIETARY
Page 5-7
Paris (14). Jpzif was computed using
it was found, that JappJpzif thereby
results are included in Appendix C.
the "PZIF"(19) computer code. Larger
sizes.
the relation of Equation (4-10) and
satisfying the PZIF criterion. The
These computations were made using
margins were shown for 1 gpm crack
THIS PKGE IS \ NON-PROPRIETARY
Page 5-8
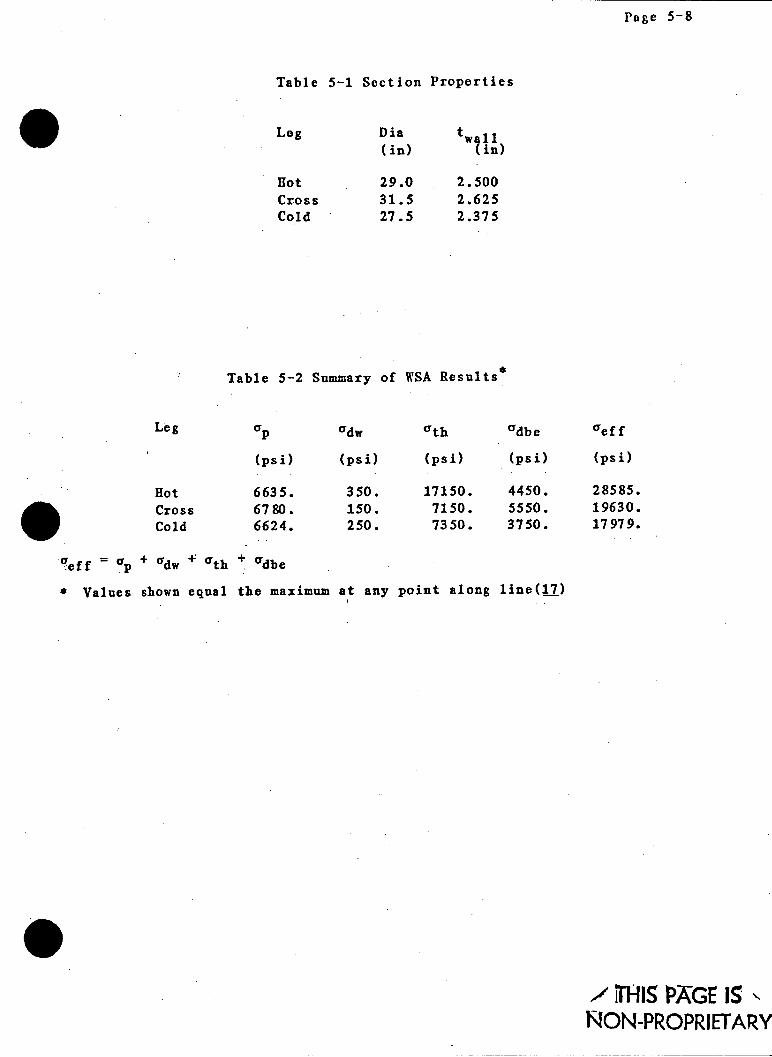
Table 5-1 Section Properties
Leg
Hot Cross Cold
Dia (in)
29.0 31.5 27.5
twfll (in)
2.500 2.625 2.375
Table 5-2 Summary of WSA Results *
cdw
(psi)
6635. 6780. 6624.
(psi)
350. 150. 250.
"th
(psi)
17150. 7150. 7350.
adb e
(psi)
4450. 5550. 3750.
aef f
(psi)
28585. 19630. 17979.
.0ff =p + adw + ath + adbe
Values shown equal the maximum at any point along line(17)
/ THIS PAGE IS\NON-PROPRIETARY
Leg
Hot Cross Cold

Page 5-9
Table 5-3 J3p for Leak Rates of 1.0 and 10.0 gpm
Crack Orientation
Crack Length, (inches)-
2c j in. I Yin2
LONG ITUJDINAL LONG ITU DINAL LONG ITU DINAL LONG ITU DINAL LONG ITU DINAL LONG ITUDINAL
CIRCUMFERENTIAL CIRCUMFERENTIAL CIRCUMFERENTIAL CIRCUMFERENTIAL CIRCUMFERENTIAL CIRCUMFERENTIAL
,~/ THIS PAGE IS N~ON-PROPRIETAR~Y
,eak Rate (gpm)
Leg
1.0 1.0 1.0
10.0 10.0 10.0
1.0 1.0 1.0
10.0 10.0 10.0
Hot Cross Cold Hot Cross Cold
Hot Cross cold Hot Cross Cold
4.5 4.5 4.5 7.8 7.8 7.8
7.2 7.0 6.8
12.6 11.9 11.5
229 23 9 230 396 397 412
370 165 130 790 295 255

PRLIEI:T: IND[iN PO1NT 3 PRI[EHfI COVL11T4I LOOP
!'YH -TTLE P (psi) D in I 4in 9St, 4k:si . RL114
0 Col Lw 2?.35 27.50 2. 1S GD 0. a 4720 tO . a %I I lo1 Le : L)5 2g . 2.f .L 0_ S72L
4- [;ros Lp US.35 31 .00 2. i2S S. D 0.1 q722
/
• . // • / "#
.-- ----
O000 /// .
1. 000
9/
0. 100 - -
0.o D.D E; .D 12.0 !I.0 20.0
CIRCUMFERENIIPL CRflUK LENGTH, 2c, inche~s
Figure 5-1 Leak Rates for Circumferential Cracks
F
[ 00. 0' I
I. 000
0. 100
Cl. 10
LONGITUDIN L. CRRCK LENGTH. 2c,. inche.5
Figure 5-2 Leak Rates for Longitudinal Cracks
PRFIJE:T:T: INMAN P03I 1 3 P9HtAflBT C0 I111 LOOP 't .T[ITLE F' (p:+i (.'n) "I ;n) Sh lk.; i RUI14#
0 Co] Lw 2235 '7.50 2,1'15 12.9 q723
I - :rc's LAby 2 .5 1'1.00 2F.Ils2 13.0 q725
4. C) E~. I) 12. 0 1 6. G 20. (1

Section 6
SUMMARY AND CONCLUSIONS
As a result of performing a tearing stability analysis of and
developing material property data for the Indian Point Unit 3 Nuclear
Plant, a number of conclusions were reached. These conclusions
demonstrated that no asymmetric vessel loads can be expected.
The basic tearing stability criteria (6), Tap p < Tmat, was satisfied
unconditionally, for the case of large circumferential cracks under
upper-bound loading conditions, Slocal" throughout the reactor coolant
system. It was demonstrated that under the conditions described by
3local that no crack instabilities would occur for the RCS hot leg, cross
leg, or cold leg.
Further, the additional stability criteria, as defined by the
structural ductility concepts (4), -q Tapp < Tmat was proven for the total
applied S-integral, Japp = slocal + jabs"
The use of the global crack driving force parameter, Yabs' was shown
to be an effective bound to any errors that might occur in a level D or
design stress or loads analysis.
The above considerations were shown to be satisfied using lower (j
bound material properties developed for the Indian Point 3 RCS. It was
Lc
:2

1'&Lc 6-2
noted that these material properties varied considerably by product form
and whether the crack was located in base or weld metal. It was found
that the material tearing resistance (or toughness) of stainless steel
piping is an important factor and must be included in any safety
analysis.
The earlier analysis of the Indian Point 3 RCS (1) was shown to be
too conservative. This observation was based on taking measurements and
photographs inside the Indian Point 3 containment and showing that the
previously assumed displacement limiting dimensions were excessive.
Using the lbb approachi it was shown that cracks, having lengths
which would result in readily detectable leaks, were stable under Code
loads (Level D or faulted conditions). Stability was shown for both . longitudinal and circumferential cracks. Excellent margins were
demonstrated based on crack length criteria and on loads.
The USNRC proposed criteria for alleviation of pipe break
postulation (3) was satisfied by this analysis; plus, additional
conservatisms were included in the form of structural ductility
requirements.
Because no break can occur in the RCS based on the above t/)
conclusions, it follows that no large LOCA can be expected. Thus, no
< CL asymmetric vessel loads will occur and, accordingly, no vessel restraints 0- C
are required.
* This analysis has met current USNRC criteria (pending) and the
material data, previouly requested by the USNRC, has been provided.
Therefore, it is requested that the requirement to install asymmetric
load restraints be eliminated.

Section 7
REFERENCES
1. "Tearing Stability Analysis of the Reactor Coolant System Indian Point 3
Nuclear Power Plant," Fracture Proof Design Corporation Report, May 28,
1981. (PROPRIETARY)
2. "Development of Material Property Data for the Tearing Stability Analysis
of the Indian Point 3 Primary Coolant System," FPDC Report 83-104, Rev. 1, September 28, 1983, K. H. Cotter, Paul C. Paris and F. Baradari (PROPRIETARY)
3. "Step-Wise Approach, Leak-Before-Break (LBB) Analysis," Draft USNRC
Criteria Dated 11/29/83, prepared by the USNRC Piping Review Committee Staff.
4. "A Critical Review of Methods of Alleviating the Requirement to Postulate
Guillotine Type Breaks," Paul C. Paris and Keyren H. Cotter, presented at
the CSNI Specialist's Meeting on Leak-Before-Break, September 1 and 2,
1983, Monterey, CA.
5. "Structural Ductility Concepts," Paul C. Paris, FPDC Report 83-76,
Rev. 1, May 6, 1983. (PROPRIETARY)
I "A Treatment of the Subject of Tearing Stability," P. C. Paris, et al.,
USNRC Report NUREG-0311, August, 1977.
7. "Stability Analysis of Circumferential Cracks in Reactor Piping Systems,"
H. Tada, P. Paris and R. Gamble, USNRC Report NUREG/CR-0838, February,
1979.
8. "JTPIPE, A Finite Element Program for Computing the Integrity of Cracked
Piping Using Tearing Stability Methodology," FPDC, St. Louis, MO,
Ver. 2,Lev 3 (PROPRIETARY).
9. ASME Boiler and Pressure Vessel Code, Section III, Appendix I, 1983.
10. "Material Resistance and Instability Beyond 1-Controlled Growth,"
H. A. Ernst in Elastic-Plastic Fracture: Second Symposium, ASTM STP 803, C. F. Shih and J. P Gudas, Eds., ASTM, 1983.
11. Indian Point 3 Site Visit Report, K. H. Cotter, FPDC Report 83-77, Sept.
23, 1983.
Ir THIS PAGE 15
NON-PROPRIETARY
Page 7-2
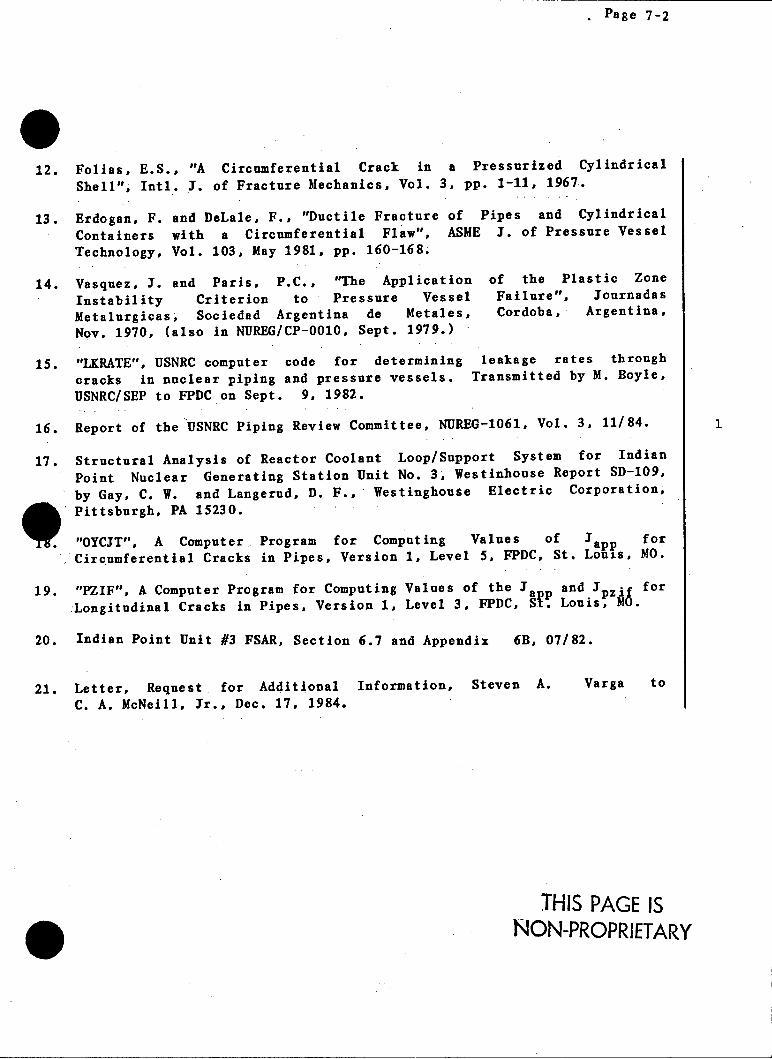
12. Folias, E.S., "A Circumferential Crack in a Pressurized Cylindrical
Shell", Intl. J. of Fracture Mechanics, Vol. 3, pp. 1-11, 1967.
13. Erdogan, F. Containers Technology,
and DeLale, F., "Ductile Fracture of Pipes and Cylindrical
with a Circumferential Flaw", ASME 1. of Pressure Vessel
Vol. 103, May 1981, pp. 160-168.
14. Vasquez, 3. and Paris, P.C., "The Application
Instability Criterion to Pressure Vessel
Metalurgicas, Sociedad Argentina de Metales,
Nov. 1970, (also in NUREG/CP-0010, Sept. 1979.)
of the Plastic Zone Failure", Journadas Cordoba, Argentina,
15. "LKRATE", USNRC computer code for determining leakage rates through
cracks in nuclear piping and pressure vessels. Transmitted by M. Boyle,
USNRC/SEP to FPDC on Sept. 9, 1982.
16. Report of the USNRC Piping Review Committee, NUREG-1061, Vol. 3, 11/84.
17. Structural Analysis of Reactor Coolant Loop/Support System for Indian
Point Nuclear Generating Station Unit No. 3, Westinhouse Report SD-109,
by Gay, C. W. and Langerud, D. F., Westinghouse Electric Corporation,;
O Pittsburgh, PA 15230.
"OYCJT", A Computer Program for Computing Values of Japp for
Circumferential Cracks in Pipes, Version 1, Level 5, FPDC, St. Louis, MO.
19. "PZIF", A Computer Program for Computing Values of the J and J z for
.Longitudinal Cracks in Pipes, Version 1, Level 3, FPDC, S Louis, MO.
20. Indian Point Unit #3 FSAR, Section 6.7 and Appendix 6B, 07/82.
21. Letter, Request for Additional Information, Steven A.
C. A. McNeill, Jr., Dec. 17, 1984.
Varga to
THIS PAGE IS NON-PROPRIETARY
APPENDIX A
JTPIPE
A FINITE ELEMENT PROGRAM FOR COMPUTING
PIPING SYSTEM CRACK STABILITY PARAMETERS
THIS PAGE IS NON-PROPRIETARY
l'agc A-Z
CONTENTS
A-1 INTRODUCTION
A-2 APPROACH
A-3 ANALYSIS AND IDEALIZATION OF THE STRUCTURE
A-3.1 ELEIENT TO STRUCTURAL MATRICES
A-3.2 BOUNDARY CONDITIONS
A-3.3 COMPLIANCE COMPUTATION AT CRACK SECTION
A-4 PROGRAM1 ORGANIZATION
A-4.1 NODAL POINT AND ELEMENT DATA INPUT
A-4.2 ASSEIBLAGE OF STIFFNESS MATRIX
A-4.3 COMPLIANCE CALCULATIONS
A-4.4 COMPUTATION OF Japp
A-4.5 COMPUTATION OF T app
THIS PAGE IS NON-PROPRIETARY
A
l'iri A- 3
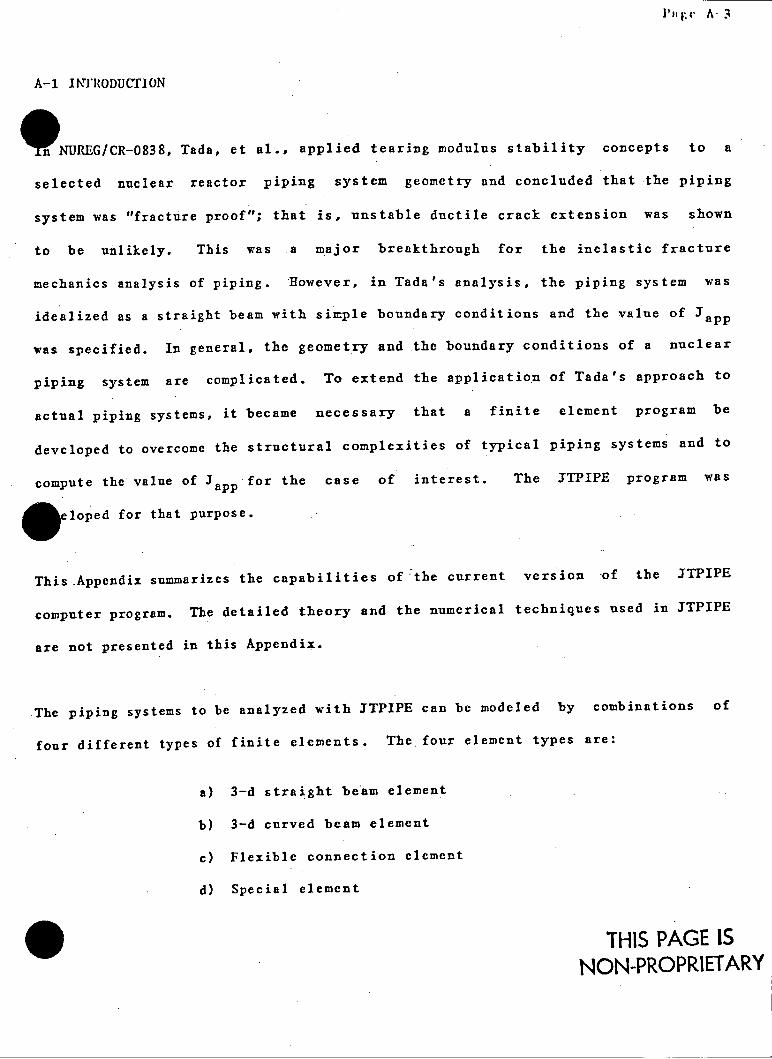
A-1 INTIODUCTION
n NUREG/CR-0838, Tada, et al., applied tearing modulus stability concepts to a
selected nuclear reactor piping system geometry and concluded that the piping
system was "fracture proof"; that is, unstable ductile crack extension was shown
to be unlikely. This was a major breakthrough for the inelastic fracture
mechanics analysis of piping. However, in Tada's analysis, the piping system was
idealized as a straight beam with simple boundary conditions and the value of 3 app
was specified. In general, the geometry and the boundary conditions of a nuclear
piping system are complicated. To extend the application of Tada's approach to
actual piping systems, it became necessary that a finite element program be
developed to overcome the structural complexities of typical piping systems and to
compute the value of Japp for the case of interest. The JTPIPE program was
eloped for that purpose.
This Appendix summarizes the capabilities of the current version :of the JTPIPE
computer program. The detailed theory and the numerical techniques used in JTPIPE
are not presented in this Appendix.
The piping systems to be analyzed with JTPIPE can be modeled by combinations of
four different types of finite elements. The four element types are:
a) 3-d straight beam element
b) 3-d curved beam element
c) Flexible connection element
d) Special element
STHIS PAGE IS NON-PROPRIETARY
I'uec A-4
A-2 APPROACH
9 program determines the elastic compliance of the piping system at specified
locations for use in the crack stability analysis. The location of the maximum
compliance is also identified. The computed compliance values are then used to
determine principal stiffnesses at each location to be analyzed. From the minimum
stiffness at each location, the Leff/R is determined. The Leff/R data is stored
for post-processing.
Using the aforementioned Leff/R data, Tapp and Tapp are computed using Equations
(3-3) and (3-5) for each postulated crack location in another program. These
latter values are tabulated for a series of circumferential through-wall cracks
having included angles of 60 to 300 degrees in 60 degree increments. Alternately,
*:fic angles can be selected. All J vs. T data is saved and later utilized for
computer plotting the stability diagram where corresponding material resistance in
the form of gmat vs. Tmat is also included.
A-3 ANALYSIS AND IDEALIZATION OF THE STRUCTURE
In this section, a brief description of the method of idealization of the
structure is presented. The direct stiffness method is used to analyze the
structural systems.
A-3.1 Formulation of Structural Matrices
A piping system is basically a three dimensional frame. It can be idealized as a
.r of discrete beam (straight or curved) elements, flexible connection
THIS PAGE IS NON-PROPRIETARY

Pagce A-5
elements and special elements. The beam elements are two node elements with six
9 ees of freedom at each node. The stiffness matrices of the elements are 12 x
1 symmetrical matrices which can be directly formulated from beam theory. After
the transformation from the local element coordinate system to the global
coordinate system, the total system stiffness matrix can be formed by direct
addition of the element matrices according to the index of the degree of freedom.
It can be expressed in the following manner:
N l (in)(A )
Kij = (A-)
(in)
where Ki is the stiffness matrix component of the total system, Kij is the
stiffness matrix component of the mth element and N is the total number of
*ents in the system.
The external force can be expressed in the form:
Fi Kij Uj (A-2)
where Fi is the external force applied at the ith degree of freedom and Uj is the
displacement at the jth degree of freedom.
A-3.2 Boundary Conditions
To simplify the programing problems associated with the specific displacements on
the boundary, a spring that is very stiff in comparison with the structure, is
assumed to connect the boundary nodal point to a fixed point. If the applied
displacement component is zero, the node will be restrained by the stiff
THIS PAGE IS NON-PROPRIETARY

Pae A-6
spring. If a non-zero displacement component is specified, it can be replaced by
Pequivalent force applied at that nodal point. The equivalent force is
evaluated by the specified displacement applied on the stiff spring with the
system structure stiffness ignored. Since the spring is much stiffer than the
structure, the error introduced is negligible.
Gap elements are included as a feature of the program. These elements may have
any one of the principal directions. Displacements limits can be specified in
either the ±X, ±Y or +Z directions.
A-3.3 Compliance Computation At Cracked Section
In the stability analysis of a through-wall circumferential crack in a piping
Sem, the rotational compliance at the pipe cracked section is required for the
computation of the applied tearing modulus, T. This is because of the fact
that the cracked section of the pipe is idealized as a plastic hinge. The
rotational compliance at the pipe cracked section is due- to the flexural rigidity
of two elastic piping sections joined by the hinged section.
From the total system stiffness, including the boundary conditions, as formulated
in Section A-3.1 and A-3.2, the rotational compliance at the pipe cracked section
can be obtained by applying unit moments on opposite sides of the hinged section.
The principal rotational compliance at that section and the maximum rotational
compliance of the selected locations in the piping system are both calculated.
THIS PAGE IS NON-PROPRIET-ARY
I"c A-7
A-4 PROGRAM ORGANIZATION
e computation process in the JTPIPE program is basically divided into five
distinct phases plus post-processing.
A-4.1 Nodal Point And Element Data Input
In this phase, the control information and nodal point geometry data are input and
nodal points are generated by the program as required. The indices of the degrees
of freedom at each nodal point are established. The element data are input and
element groups generated, the element connection arrays and the element coordinate
transformation matrices are calculated and all element information is stored in a
disc file for use in the second and third phases.
A-4.2 Assemblage Of System Stiffness Matrix
JTPIPE uses a compacted storage scheme in which the system stiffness matrix is
stored as a one-dimensional array. In the second phase, the index of the storage
is established, then the system stiffness matrix is assembled and modified to
satisfy the boundary conditions.
A-4.3 Compliance Calculations
In the third phase, the locations of the postulated crack locations desired for
the compliance computation, are input. The rotational compliances and minimum
stiffnesses at each cracked nodal point is calculated based on the response of the . cture to the imposed load. The status of gap elements (open or closed) are
THIS PAGE I NON-PROPRIETARY
Page A-8
taken into account at this point. Next, the Lcff/R are calculated and stored for
. -processing.
A-4.4 Computation of Japp
I app can be specified by an input value such as SIC or an input value for rotation
at the cracked section. Alternately, Sapp can be determined from the response of
the structure. This latter method is the preferred approach but involves
considerably longer computer run times.
A-4.5 Computation of Tapp
Finally, a post-processor is used to compute Tap p for specified crack sizes and
k rotations. The data is displayed in tabular form and is stored on a disk
for subsequent post-processing: namely, the generation of J vs. T diagrams.
* THIS PAGE IS NON-PROPRIETARY
APPENDIX B
CRACK STABILITY CALCULATIONS
CIRCUMFERENTIAL CRACKS
THIS PAGE IS NON-PROPRIETARY

INDIAN POINT 3 PRIMAlY LOOP ,'OT L-c
THERMAL + DEAD WT + SSE
Faxial = Saxial
PIPE OD =
ALFA
34.000 6.
,lapplied = 0.39870E+08
Sbendinq = 21950.
THICKNESS = 2.500
ELAS MOD =0.256E+08
Poper =
Smem =
2485. nsi
6635. psi
Sflow 55000. 0Si
Jic = 1200. in-lb/in**:
CRACK
LENGTH,IN
LEAK AREA
IN**2L/Dh J
IN-LD/ IN**2
0 032
0 075
0 141
0 232
0 352
0 504 0 .692
0 917
1 181
1 483
1 .824
2 .199 ***** EXCEEDED
0.17328E+03 0.22447E+03
0.10994E+03 0.36323E+03
0.78098E+02 0.52611E+03
0.59017E+02 0.71756E+03
0.46410E+02 0.94239E+03
0.37551E+02 0.12056E+04 0.31060E+02 0.15125E+04
0.26159E+02 0.18687E+04
0.22375E+02 0.22801lE+04
0.19403E+02 0.27530E+04
0.17037E+02 0,32940E+04
0.15132E+02 0.39102E+04
MAX Japp REQUESTED = NORMAL STOP
0. 10304E+;1
0.1205OE+01
0. 1413E+01
0. 16649E+C1
0. 19527E+01
0. 22810E+C0 0.26546"+01
0.3037E+01 0. 35419E+01
0. 40620E+C1
0. 636?E+01
0 .52695E+01
/ THIS PKGE IS NON-PROPRIETARY
4.78
7.14
9.48
11.79
1A .07
16 .31 18 51
20.66
22 .75
24 .78
26 .75
28 .64

INDIAN POINT 3 FRImAnY LOOP cno.s LEG
THERMAL + DEAD WT + SEE
raxial
Saxial
P1IPE OD =
ALFA -
36.320
6.
Mapplied 0.28074E+08
Sbendin = 12050.
THICKNESS 2.625
ELAS MOD =0.256E+08
Poper =
Smem =
2485. psi 6780. psi
Sflow = 55000. psi Jic = 1200. in.-lb/in**
CRACK
LENGTH, IN
LEAK AREA
IN**2
L/Dh J IN-LBl IN**2
0. 025
0 .059
0. 111
0. 183
0 280
0 404
0 560
0.751
0.981
1.252
1.568
1.928
2.335
2.788 3.286
3.826
4.404
***** EXCEEDED
0.25175E+03 0.10963E+03
0.15945E+03 0.17769E+03
0.11302E+03 0.25729E+03
0.85161E+02 0.35043E+03
0.66712E+02 0.45914E+03
0.53713E+02 0.58556E+03
0.44156E+02 0.73192E+0Z
0.36914E+02 0.90060E+03
0.31298E+02 0.10941E+04
0.26865E+02 0.13150E+04
0.23315E+02 0. 15660E+04
0.20439E+02 0.10502E+04
0.18085E+02 0.21704E+04
0.16142E+02 0.25298E+04
0 .14527E+02 0.29317E+04
0..13176E+02 0.33797E+04
0.12040E+02 0.38772E+04
MAX Japp REQUESTED = NORMAL STOP
0. 48073E+00 0. 56141E+CC 0. 65712E+00
0. 7615E+00
0. 13711S1E+00
0. 10388E+01
0 .12000E+01
0. 13798E+01
0.1.5790E+01
0. 17987E+01
0. 20400E+01
0. 23033E+01
0. 25912E+01 0. 29033E+01
0.32412E+01
0. 36058E+01
0. 39904E+01
THIS PAGE IS NON-PROPRIETARY
5.14
7.70
10 .25
12.78
15 .30
17 80
20 28
.22 74
25 17
27 58
.29 95
32 30
34 61 36 88
39 11
41 29
43 42
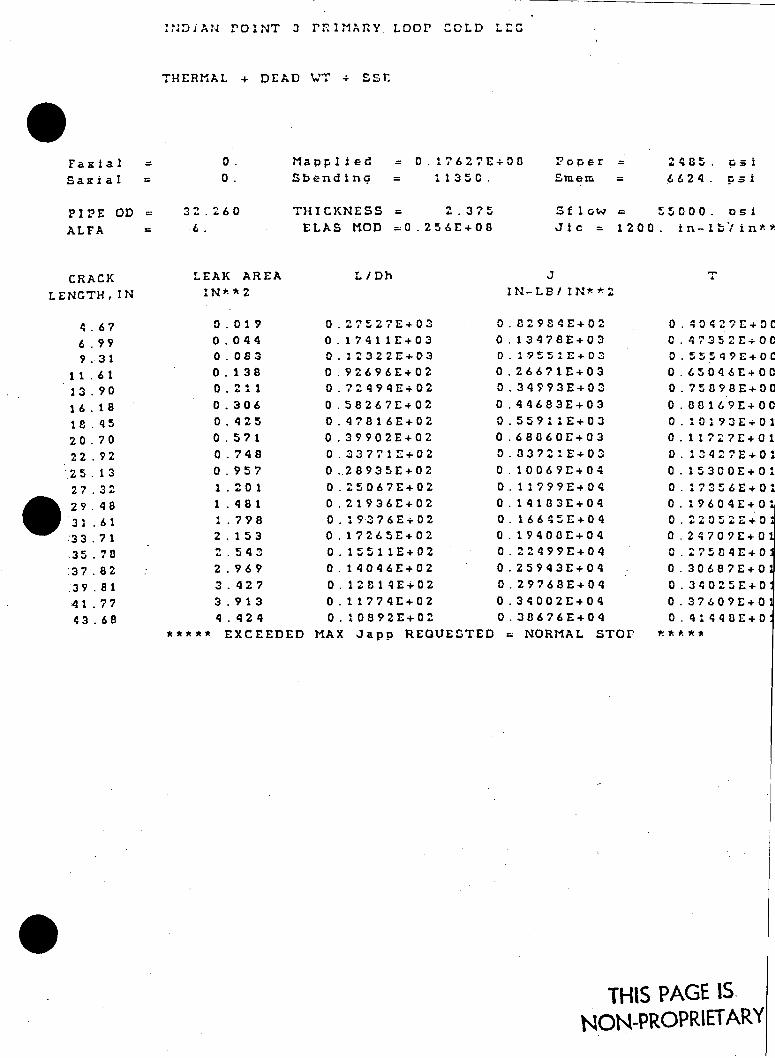
"'DiAN POINT 3 PRT"MARY LOOP COLD LEG
THERMAL + DEAD WT 4 £SE
Fazial = Saxial =
PIPE OD =
ALFA =
CRACK
LENGTHIN
4.67
6 .99 9. 31
11 61
13 90 16 18
18 45
20 70
22 92
25 13
27 32
29 48
31 .61 :33 .71
,35 78
:37 82 .39 81
4 1 77 43 .68
0. 0.
32.260
6.
LEAK AREA IN**2
0.019; 0 044 0. 083
0.138 0.211
0 306
0 425
0 571
0 748 0 957 1.201
1 481
.798 2 15 3
2543
2 969
3 427
3 913
4 424
Mapplied = 0.17627E+03
Sbendina = 1135C.
THICKNESS = 2.3?5
ELAS MOD =0.256E+08
PoDer =
Sflme =
Sf Ilow=
2485. psi 6624. psi
'5000. Dsi
Jic = 1200. in-lb'/in**
L/Dh
0. 2?527E+03 0.17411E+03 0. 12322E+03
0 .92696E+02
0. 72494E+02
0 .58267E+02
0.47816E+02
0 .39902E+02
0.3377 1+02
0..28935E+02
0. 25067E+02
0 .21936E+02
0. 19376E+02
0. 17265E+02
0. 15511E+02
0. 14046E+02
0. 1281qE+02
0.1 1774E+02
0. 10892E+02
IN-LB/1 IN**2
0.82934E+02
0. 13478E+03 o . 155 1r+03
0.26671E+03
o .34993E+03
0 .44683E+03
0. 55911E+03
0 .68060E+03
0.3372:E+03
0. 10069E+04
0. 11799E+04
0. 14183E+04
0. 16645E+04
0. 19408E+04
0. 22499E+04
0. 25943E+04
0. 29768E+04
0 .34002E+04
0. 38676E+04
0. 10427E+0C C. 47352E 00
0. 55549E+0C
0. 65046E+00
0. 75898E+00
0. 88169E+00
0. 10193E+01
0. 11727E+01
0 13427E+01
0. 15300E+01
0. 17356E+0
0. 19604E+01
0 22052c+0
0. 24709E+0
0 .275V4E+0
0. 30687E+0 0. 34025E+0
0. 37609E+0
0. 41440E+0
***** EXCEEDED MAX Japp REQUESTED = NORMAL STOP
THIS PAGE IS NON-PROPRIETARY
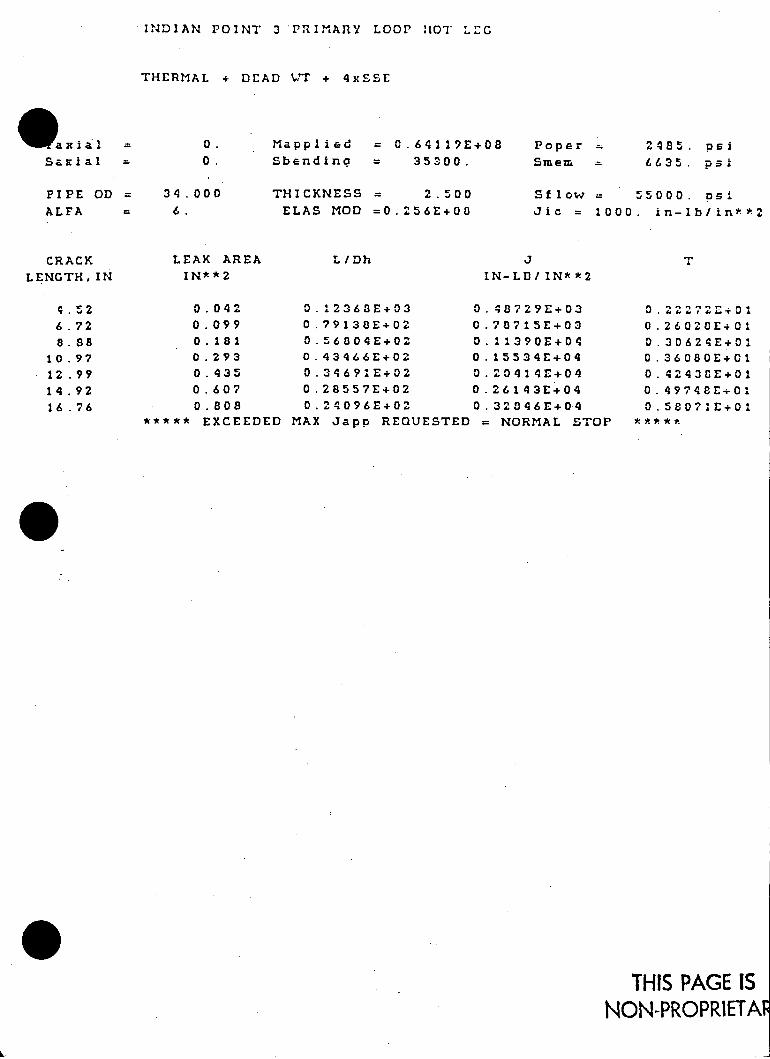
INDIAN POINT 3 PRlIMARY LOOP HOT' LI-G
THERMAL + DEAD VT + 4xSSE
Waxial Saxial =
PIPE OD =
ALFA
34.000
6.
Mapplied 0.64129E+08
Sbendin = 35300.
THICKNESS = 2.500
ELAS MOD =0.256E+00
Poper =
Smexi -
2485. psi
6635. psi
Sf low = 55000. Dsi Jic = 1000. in-lb/in**2
CRACK
LENGTH,IN
LEAK AREA
IN**2
L / Dh
IN-LD/IN**2
0.042
0 .099
0. 181
0 .293
0 .435
0 607
0 808 ***** EXCEEDED
0.12363E+03 0,^8929E+03 O.22292E+01 0.79138E+02 0.78715E+03 0.26028E+0X 0.56804E+02 0.11390E+04 0.30624E+01 0.43466E+02 0.15534E+04 0.36080E+c1 0.34691E+02 0.20414E+04 0.42438E+01 0.28557E+02 0.26143E+04 0.49748E+01
0. 24096E+02 0. 32846E+04 0.5807lE+01 MAX Japp REQUESTED = NORMAL STOP *****
THIS PAGE IS NON-PROPRIETA
4.52
6 .72
8 88
10.97
12 .99
14 .92
16 .?6

INDIAN POINT 3 PRIMARY LOOP CROSS LEG
THERMAL + DEAD WT + 4xSST,
raxial =
Saxial =
PIPE OD =
ALFA
36.320
Maoplked = 0.64450E+08 'Sbendinq = 29500.
THICKNESS = 2.625
ELAS MOD =0.256E+00
PoDer = Smem
2485. rs i 6780. pSi
Sflow = 55000. psi Jic = 1000. in-lblin *2
CRACK
LENGTH.IN
LEAK AREA
IN* * 2
L/Dh I IN-LB/ IN**2
0 .043
0 100
0 184
0 300
0 450
0 .637
0 860
1 121
***** EXCEEDED
0.13967E+03 0.38143E+03
0.89087E+02 0.61567E+03
0.63683E+02 0.83972E+03
0.48477E+02 0.12114E+04
0.38440E+02 0.15888E+04
0.31396E+02 0.20305E+04
0.26244E+02 0. 25455E+04
0.22363E+02 0.31433E+04
MAX Jaop REQUESTED = NORMAL STOP
0. 16568E+01 0.1931 1E+01
o 22649E+01 0. 26593E+01 0.31 169E+01
0.36414E+C1
0. 42367E+01
0.490?1E+01
THIS PAGE IS NON-PROPRIETAR
4.87 7.27
.9. 62
11 .93
14.18
16.37
18 .49
20.52

INDIAN POINT 3 VfRIMARY LOOP COLD LCG
THERMAL + DEAD WT + 4xSSE
IaIia =
Saxial =
PIPE OD =
ALFA =
32.260
6.
Mapplied = 0.35099E+08
Sbendlna = 22600.
THICKNESS = 2.375 ELAS MOD =0.256E+08
roper =
Smem
2485. psD
6624. psi
Sf low = 55000. psi
Jic = 1000. in1-b/ n**2
CRACK
LENGTH.IN
LEAK AREA
IN**2
L I DhINq-LB/ IN**2
0.029 0 .069
0 129
0 213
0 323
0 462
0 .633
0 .839
1 .078
1 .353 1 .660
* EXCEEDED
0.16969E+03 0.22305E+03 0.1077"C+31 0.10769E+03 0.36097E+03 0.12605E+01 0.76517E+02 0.52279E+03 0.14819E+01 0.578q3E+02 0.71312E+03 0.17427E+01 0 45507E+02 0.9367 E+03 0. 204472+01 0. 36840E+02 0.11986E+04 C 239C3E+0 0.30492E+02 0.15040E+04 0.27819E+01 0 .25700E+02 0. 18586E+04 0. 32223E+01 0. 22002E+02 0. 22604E+04 0.37145E+01 0. 19099E+02 0. 27396E+04 0. 42615E+01 0.16789E+02 0.32787E+04 0.48663E+01
MAX Jaop REQUESTED = NORMAL STOP ****It
THIS PAGE IS NON-PROPRIETARY
4. 53
6.77 3. 98
11.17
13 .33
15.44
17 .5Z 19.54
2.1.51 23.42
.26
APPENDIX C
CRACK STABILITY CALCULATIONS
LONG ITUDI NAL CRACKS
THIS PAGE IS NON-PROPRIETARY

NYPA IF3 PRIMAlY LOOP PIPIN4G
HOT LEG LONGITUDINAL CRACK STAEILITY
**r,******* CASE I ***********f******
LONGITUDINAL CRACK LEAK RATE. LEVEL A
Leak Rate = 0.1 ipm
Soper 2c
11.934 3.500
LONGITUDINAL CRACK STADILITY. LEVEL D LOADS
Sleak = 11934. psi Shoop =, 14364. psi
PIPE OD =
CRACK
LENGTH, IN
34.000 in THICKNESS =
Ce f
8.50 0.000
8.50 0.346
8.50 0.397
8.50 0.406
8.50 0.407
***** CONVERGENCE ACHIEVED
0. 42500E+01 0.45956E+01
0. 46474E+01
0. 46556E+01
0. 46569E+01
2.500 in SfIow =
IN-LB 1IN**2
0. 1545!E+03
0.17764E+03
0. 10131E+03
0. 18190E+03
0. 18199E+03
45000. psI
Jpz if
0. 10874E+04 0.11271E+04
0. 11337"+04
0. 11347E+04
0. 1134CE+04
wCASE
LONGITUDINAL CRACK LEAK RATE, LEVEL A Leak Rate = 1.0 Gpm
Soper
11.934
LC
,.500
LONGITUDINAL CRACK STADILITY, LEVEL D LOADS
11934. psi Shoop - 14364. psi
PIPE OD = 34.000 in THICKNESS = 2.500 in Si low c 45C00. psi
CRACK
LENGTH, IN
9. 50 0 .000
9. 50 0 .422
9.510 0. 496
9.50 0 .510
S9.50 0 .513
s*a** CONVERGENCE ACHIEVED
Ceff
0. 47500E+D1 0.51722E+01
0. 52462E+01
0.52601E+01
0.52620E+01
i IN-LBIIN**2
0. 28076E+03
0.22183E+03
0. 22805E+03
0.22923E+03
0.22745E+03
Jpz if
0. 2144LE+0 0.11931E+04
0. 12014E+04
0. 12029E+0
0. izo3z:.0
Sleak
THIS PAGE IS NON-PROPRIETARY
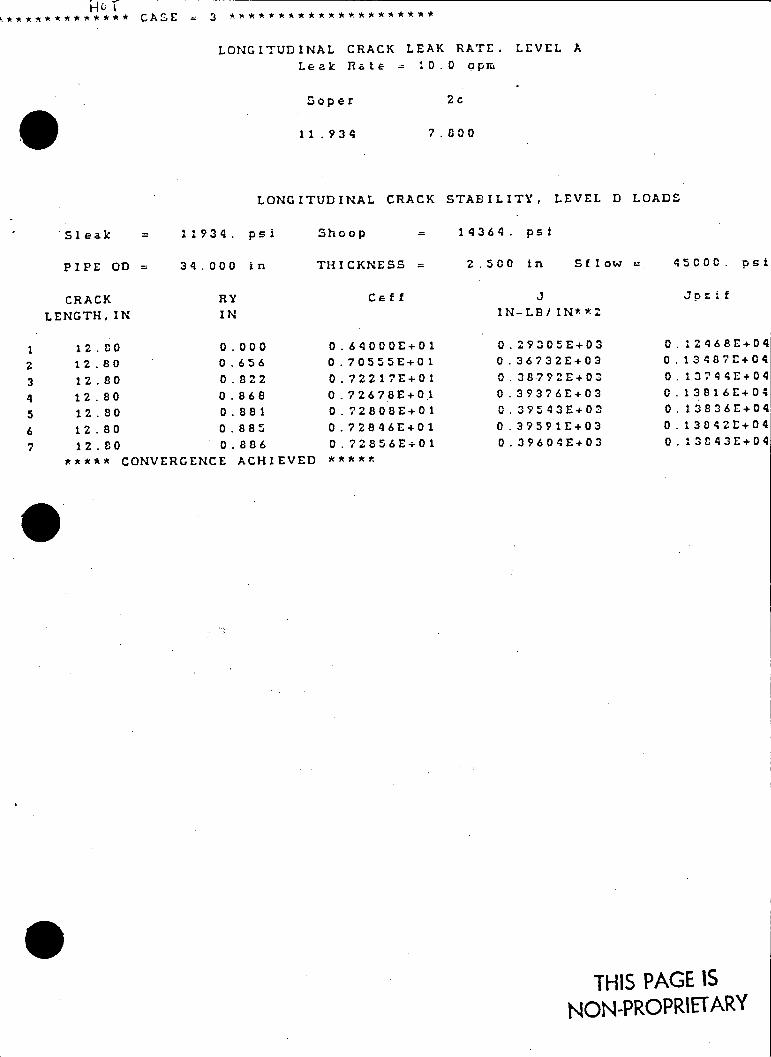
~~ CASE 3
LONGITUDINAL CRACK LEAK RATE, LEVEL A
Leak Rate = 10.0 opm
Soper
11 .934
2c
7.800
LONGITUDINAL CRACK STABILITY, LEVEL D LOADS
Sleak = 11934. psi Shoop - 14364. psi
PIPE OD = 34.000 in THICKNESS = 2 .500 in Sf low 45C00. psi
Cef fCRACK
LENGTH, IN
12 .80 0.000 0 .64000E+01
12.80 0.656 0.70555E+01
12 80 0 822 0 72217E+01
12 80 0 868 0 72678E+01
12 80 0 881 0 .72808E+01
12 80 0 885 0 7284 6E+01
12.80 0 886 0 72856E+01
***** CONVERGENCE ACHIEVED ****t
3 IN-LB/IN**2
0.29305E+03
0. 36732E+03
0. 38.792E+03
0. 39376E+03
0. 39543E+03
0 .39591E+03
0. 39604E+03
0. 12468E+04 0. 134?87E+04
0. 13744E+04
0 .13816E+04
0. 13836E+04
0. 13042E+04
0. 13C43E+04
THIS PAGE IS NON-PROPRIETARY
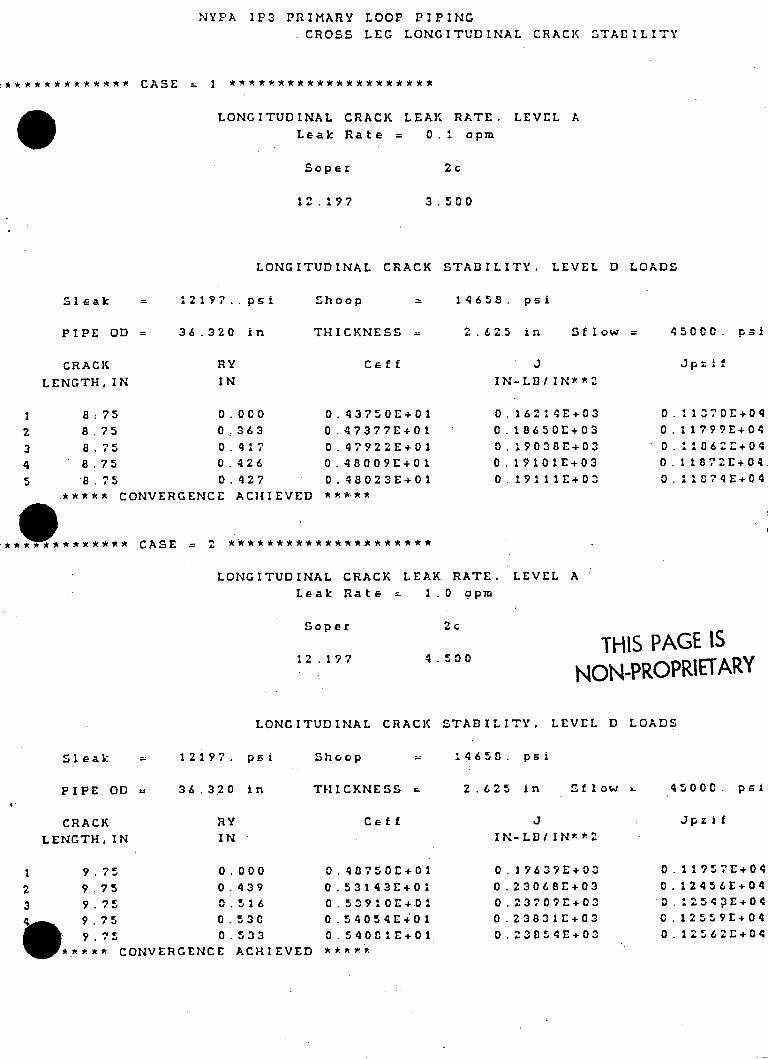
NYPA IF3 PRIMARY LOOP PIPING
.CROSS LEG LONGITUDINAL CRACK STABILITY
.************* CASE = *********************
LONGITUDINAL CRACK LEAK RATE. LEVEL A
Leak Rate = 0.1 opm
Soper 2c
12.197 3.500
LONGITUDINAL CRACK STABILITY, LEVEL D LOADS
1219?. psi Shoop = 14658. psi
PIPE OD
CRACK
LENGTH, IN
36.320 in THICKNESS =
Cef [
8 ;75 0.000
8 .75 0.363
8.75 0.417
8 .75 0.426
8 .75 0.427 ***** CONVERGENCE ACHIEVED
0. 43750E+01 0.47377E+01
0. 47922E+01
0.48009E+01
0. 48023E+01 * -* t
2.62.5 in
I IN-LB/IN**2
0. 16214E+03
0. 18650E+03
0. 19038E+03
0. 19101E+03
0 19121E+03'
Sflow = 45000. psi
Jpz A f
0. 1130E+04 0. 11799E+04
0. 11062E+04
0.118"2E+04
0. l 074E+04
',********** CASE = 2
LONGITUDINAL CRACK LEAK RATE. LEVEL A
Leak Rate = 1.0 apm
Soper
12 .197
2c
4.500
LONGITUDINAL CRACK STABILITY. LEVEL D LOADS
1219?. psi Shoop - 14658. psi
PIPE OD
CRACK
LENGTH,IN
36.320 in THICKNESS =
Ce ff
9.75 0.000
9.75 0.439
9.75 0.516 9.75 0.530
, 9.75 0.533
,*** CONVERGENCE ACHIEVED
0. 40750E+01
0.53143E+01
0. 53910E+01
O.54054E+01
0.54081E+01
2.625 in
3 IN-LBIIN**2
0. 19639E+03
0.23068E+03
0.23709E+03
0.23831E+03
0.23854E+03
Sflow = 45000. psi
Jpz if
0. 11957E+04 0. 12456E+04
0. 12543E+04
0. 12559r+04
0. 12562E+04
SI eak
Sleak
THIS PAGE IS NON-PROPRIETARY
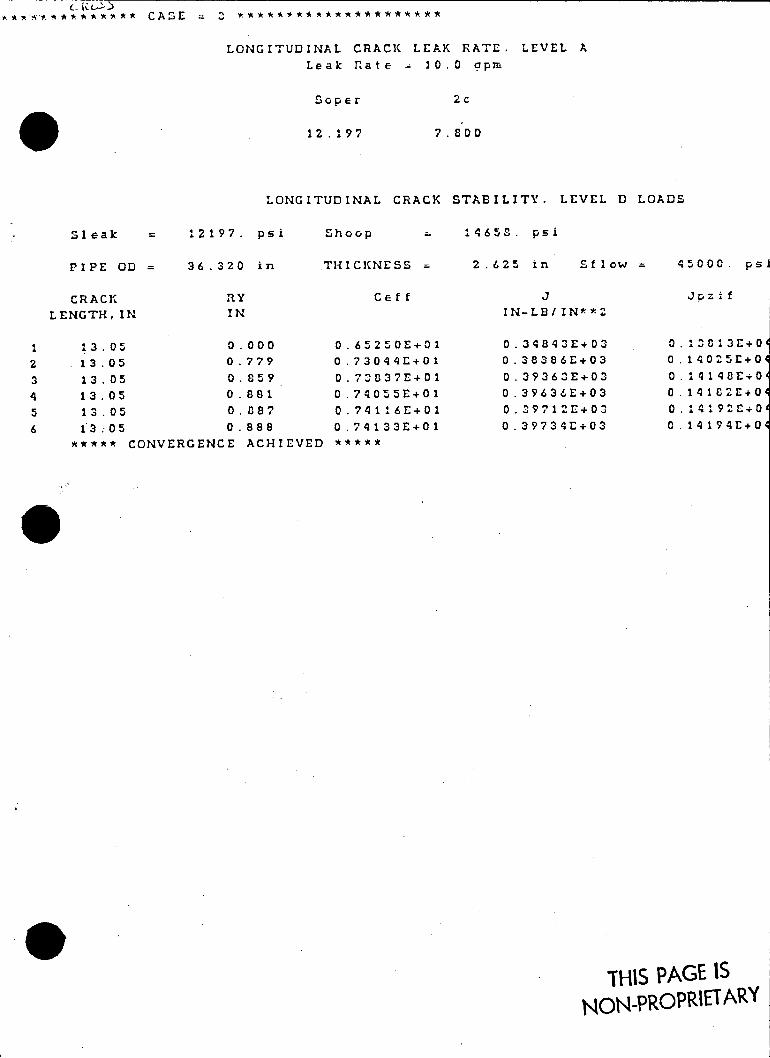
'P ACASE =3
LONGITUDINAL CRACK LEAK RATE, LEVEL A
Leak rate 10.0 apm
lope r
12.197
2c
7 .800
LONGITUDINAL CRACK STABILITY. LEVEL D LOADS
Sleak = 12197. psi Shoop - 14658. psi
PIPE OD = 36.320 in THICKNESS = 2.625 in Sflow = 4500C. psi
Ce fCRACK
LENGTH,IN
13.05 0.000 0.65250E+01
13.05 0.779 0.73044E+01
13.05 0.859 0.73837E+01
13.05 0.881 0.7;055E+01
13.05 0.887 0.74116E+01
13.05 0.888 0.74133E+01
A**** CONVERGENCE ACHIEVED *****
J IN-LB/IIN**2
0.343843E+03
0.38386E+03
0.39363E+03
0.39636E+03
0.39712E+03
0.39734E+03
Jpz 'f
0. 13013E+04 0. 14025E+04
0. 14148E+04
0. 14182E+04
0. 14192E+04
0 14194E+04
THIS PAGE IS NONPROPRIETARY
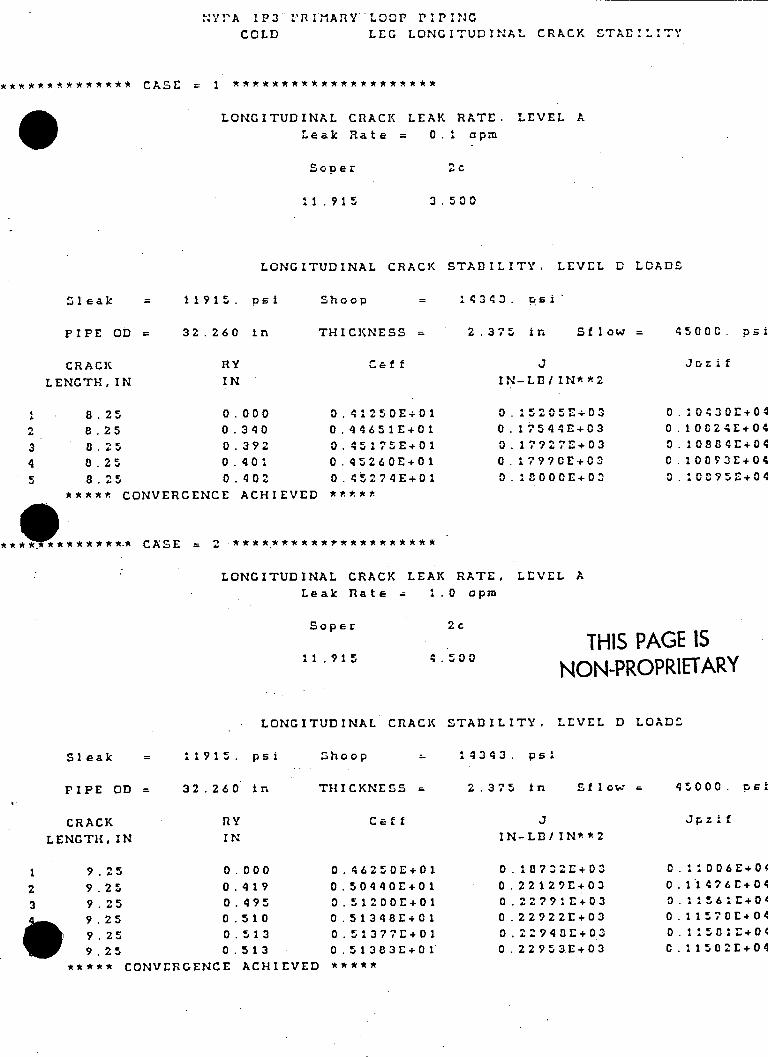
I.PA 1P3 PRIMARY LOOP P1PING
COLD LEG LONGITUDINAL CRACK ZTAEILITY
************** CASE 1 ********************
LONGITUDINAL CRACK LEAK RATE, LEVEL A
Leak Rate = 0.1 opm
Soper 2c
11.915 3.500
LONGITUDINAL CRACK STABILITY. LEVEL D LOADS
Sleak = 11915. psi Shoop 14343. osi'
PIPE OD = 32.260 in THICKNESS = 2.375 in S low = 450CC. p54
CRACK
LENGTH,IN
8.25 0.000
8.25 0.340
8.25 0.392
0.25 0.401
8.25 0.402
***** CONVERGENCE ACHIEVED
Caf f
0. 41250E+01
0.44651E+01
0. 45175E+01
0.45260E+01
0. 45274E+01
IN-LE/ IN**2
0. 1520 5E+ CO
0.17544E+03
0. 17927E+03
0. 17990E+03
0. 13000E+03
Jr,z if
0. 10430E+04 0. 10824E+04
0. 10884E+04
0. 10093E+04
0. 1C?95E+04
***r* ****** CASE
LONGITUDINAL CRACK LEAK RATE, LEVEL A
Leak fate 1.0 opm
Soper
11.915
2c
4.500
LONGITUDINAL CRACK STADILITY. LEVEL D LOADS
Sleak = 11915. psi Shoop - I14343. psi
PIPE OD = 32.260 in THICKNESS = 2.375 in Sf low 45000. PSi
Jpz IfCRACK
LENGTH, IN
9.25 0. 000
9. 25 0.419
9. 25 0. 495
9.25 0 510
9.25 0 513
9. 25 0 513
***** CONVERGENCE ACHIEVED
0. 46250E+01
0.50440E+01 0.51200E+01
0.51348E+01
0.51377E+01 0.51383E+01
IN-LD/IN**2
0. 18732E+03
0. 22129E+03
0.22791E+03 0 .22922E+03
0. 22940E+03
0. 22953E+03
. 1:006E+04 0.11476E+04 0. 11561E+04
0 .11570 E404
0. 11502E+04 C.115,82E+04
THIS PAGE IS NON-PROPRIETARY
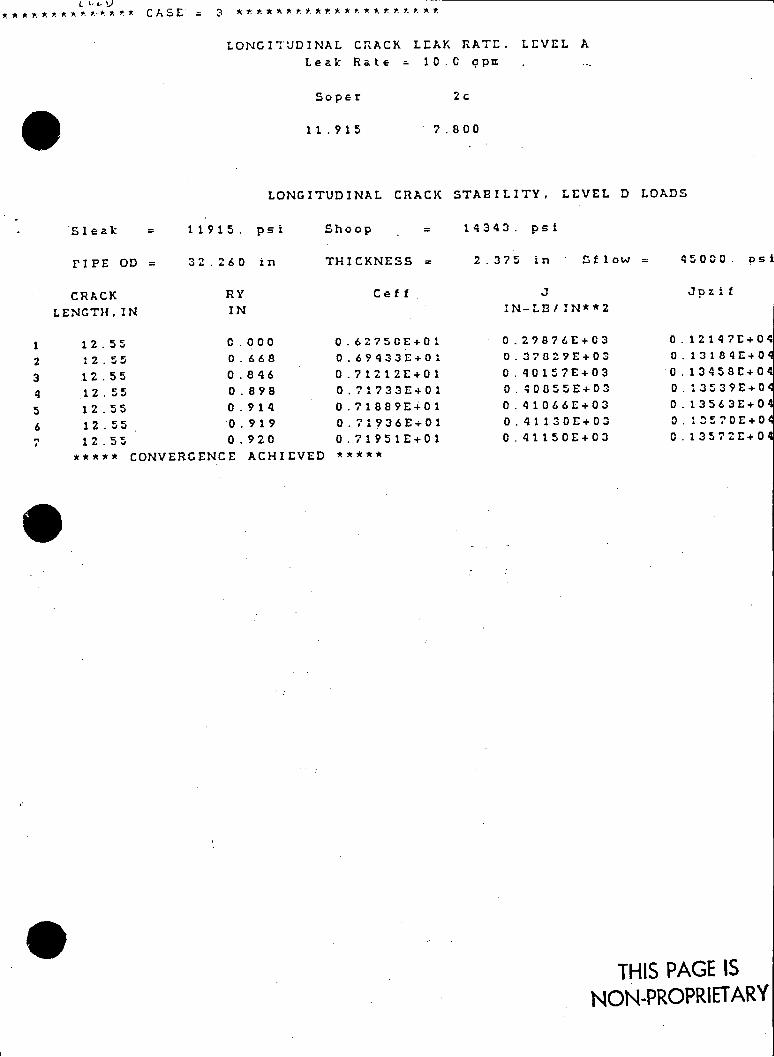
L V ~~ I )k .*)*, CASE 3
LONGITUDINAL CRACK LEAK RATE. LEVEL A
Leak Rate 10.0 op.
Soper
11.915
2c
? .800
LONGITUDINAL CRACK STABILITY, LEVEL D LOADS
Sleak = 11915. psi Shoop - 14343. psi
PIPE OD = 32.260 in THICKNESS = 2.375 in 1flow = 45000. psi
CRACK
LENGTH,IN
12 .55 0 000
12. 55 0 668
12.55 0.846
1255 0 .898
12 .55 0 .914
12 .55 .919
12.55 0.920
***** CONVERGENCE ACHIEVED
Cef f
0. 62750E+01
0. 69433E+01
0 .71212E+01
0. 71733E+01
0. 71889E+01
0. 71936E+01
0. 71951E+01
3 IN-Lfl/IN**2
0.29876E+03
0.3782?E+03
0. 40157E+03
0. 40855E+03
0. 41066E+03
0.41130E+03
0.41150E+03
JpziA
0. 12147E+04 0. 13184E+09
0.13458E+04
0. 3539E+04
0.13563E+04
0. 13570E+01
0. 13572E+04
THIS PAGE IS NON-PROPRIETARY
APPENDIX D
LEAK DETECTION

IP3 FSAR UPDATE
1.7 LEAKAGE DETECTION AND PROVISIONS FOR THE PRIMARY AND AUXILIARY COOLANT LOOPS
6.7.1 Leakage Detection Systems
The leakage detection systems reveal the presence of significant leakage
from the primary and auxiliary coolant loops.
6.7.1.1 Design Bases
The General Design Criteria presented and discussed in this section are
those which were in effect at the time when Indian Point 3 was designed and
constructed. These general design. criteria, which formed the bases for the
Indian Point 3 design, were published by the Atomic Energy Commission in the
Federal Register of July 11, 1967, and subsequently made a part of 10 CFR
50.
The Authority has completed a study of compliance with 10 CFR Parts 20 and
50 in accordance with some of the provisions of the Commission's
Confirmatory Order of February 11, 1980. The detailed results of the
evaluation of the compliance of. Indian Point 3 with the General Design
Critriapresently established by the Nuclear Regulatory Commission (NRC) in
CFR 50 Appendix A, were submitted to NRC on August 11, 1980, and approved
the Commission on January 19, 1982. These results are presented in
ction 1.3.
Monitoring Reac tor Coolant Leakage
Criterion: Means shall be provided to detect significant uncontrolled
leakage from the reactor coolant pressure boundary. (GDC 16 of
7/11/67)
Positive indications in the Control Room of leakage of coolant from the
Reactor Coolant System to the Containment are provided by equipment which
permits continuous monitori-ng of containment air activity and humidity, and
of runoff from the condensate collecting pans under the cooling coils of the
containment air recirculation units. This equipment provides indication of
normal background which is indicative of a basic level of leakage from
primary systems and components. Any increase in the observed parameters is
an indication of change within the Containment, and the equipment provided
is capable of monitoring this change. The basic design criterion is the
detection of deviations from normal containment environmental conditions
including air particulate activity, radiogas activity, humidity, condensate
runoff and in addition, in the case of gross leakage, the liquid inventory
in the-process systems and containment sump.
These methods are designed to monitor leakage into the Containment
atmosphere and as such do not distinguish between identified and
1nidentified leaks.
6.7-1

IP 3 FSAR UPDATE
t onitoring Radioactivity Releases Criterion: Means shall be provided for monitoring the containment
atmosphere and the facility effluent discharge paths for
radioactivity released from normal operations, from anticipated
transients, and from accident conditions. An environnetal
monitoring program shall be maintained to confirm that
radioactivity releases to the environs of the plant have not
been excessive. (GDC 17 of 7/11/67)
The containment atmosphere, the plant ventilation exhaust (including
exhausts from the Fuel Storage Building, Primary Auxiliary Building, and
Waste Holdup Tank Pit), the containment fan-coolers service water
discharge, the component cooling loop liquid, the liquid phase of the
secondary side of the steam generator, and the condenser air ejector exhaust
are monitored for radioactivity concentration during normal operation,
anticipated transients and accident conditions.
'Principles of Design
The principles for design of the leakage detection systems can be summarized
as follows:
Ia) Increased leakage could occur as the result of failure of pump seals, valve packing glands, flange gaskets or instrument
connections. The maximum single leakage rate calculated for these
types of failures is 50 gpm which would be the anticipated flow
rate of water through the pump seal if the entire seal were wiped. out and the area between the shaft and housing were completely
open.
b) The leakage detection systems shall not produce spurious
annunciation from normal expected leakage rates but shall reliably
annunciate increasing leakage.
c) Increasing leakage rate shall be annunciated in the control room.
Operator action will be required to isolate the leak in the
leaking system.
For Class I systems located outside the containment, leakage is determined
by one or more of the following methods:
a) For systems containing radioactive fluids, leakage to the
atmosphere would result in an increase in local atmospheric
activity levels and would be detected by either the plant vent
monitor or by one of the area radiation monitors. Similarly
leakage to other systems which do not normally contain radioactive
6.7-2 Rev. 0 7/82

IP3 FSAR UPDATE
W fluids would result in an increase in the activity level in that system.
b) For closed systems such as the component cooling system, leakage would result in a reduction in fluid inventory.
c) All leakage would collect in specific areas of the building for subsequent handling by the building drainage systems, e.g., leakage in the vicinity of the residual heat removal pumps would collect in the sumps provided, and would result in operation, or increased operation, of the associated sump pumps.
Details of how these methods are utilized to detect leakage from Class I systems other than the Reactor Coolant System are given in the following sections and summarized in Table 6.7-1.
The Authority has established a program to identify and reduce leakage from systems outside containment that would or could contain highly radioactive fluids during a serious transient or accident (NUREG - 0578). Leak test results for these systems are presented in Table 6.7-2.
6.7.1.2 Systems Design and Operation
ious methods are used to detect leakage from either the primary loop or auxiliary loops. Although described to some extent under each system
es criptiong all methods are included here for completeness.
Reactor Coolant System
During normal operation and anticipated reactor transients the following tmethods'are employed t0 detect leakage from the Reactor Coolant System:
Containment Air Particulate Monitor
This channel takes continuous air samples from the containment atmosphere and measures the air particulate beta and gamma radioactivity. The samples, drawn outside. the Containment, are in a closed, sealed system and are monitored by a scintillation counter - filter paper detector assembly.. The filter paper collects all particulate matter greater than 1 micron in size on its constantly moving surface, which is viewed by a hermetically sealed scintillation crystal (Nal) - photomultiplier combination. After pasiing through the gas monitor, the samples are returned to the Containment.
The filter paper has a 25-day minimum supply at normal speed. The filter paper mechanism, and electromagnetic assembly which controls the filter paper movement, is provided as an integral part of the detector unit.
The detector assembly is in a completely closed housing. The detector tput is amplified by a preamplifier and transmitted to the Radiation
6.7-3 Rev. 0 7/82
1P3 FSAR UPDATE
k1onitoring System cabinet in the Control Room. Lead shielding is provided
for the radiogas detector to reduce the background radiation level to where
it does not interfere with the detector's sensitivity.
The activity is indicated on meters and recorded by a stripchart recorder.
High-activity alarm indications are displayed on the control board
annunciator in addition to the radiation monitoring cabinets. Local alarms
provide operational status of supporting equipment such as pumps, motors and
flow and pressure controllers.
The containment air particulate monitor is the most sensitive instrument of
those available for detection of reactor coolant leakage into the Contain
ment. The measuring range of this monitor is given in Section 11.2.
The sensitivity of the air particulate monitor to an increase in reactor
coolant leak rate is dependent upon the magnitude of the normal baseline
leakage into the Containment. The sensitivity is greatest where 'baseline
leakage is low as has been demonstrated by experience. (See Appendix 6B)
Where containment air particulate activity is below the threshold of detect
ability, operation of the monitor with stationary filter paper would in
crease leak sensitivity to a few cubic centimeters per minute. Assuming a
l'ow background of containment air particulate radioactivity, a reactor
coolant corrosion product radioactivity (Fe, Mn, Co, Cr) of approximately
.4 1c/cc (a value consistent with little or no fuel cladding leakage), and P omplete dispersion of the leaking radioactive solids into the containment 0 air, the 4 r11MM! ttr is capable of detecting an increase in
coolant leakage rate as small as aproximately I M (100 cc/minute)
within twenty minutes after it occurs. If only ten percent of the
particulate activity is actually dispersed in the air, leakage rates of the
order of 0.25 gpm (1000 cc/minute) are detectable within the same time
period.
For cases where baseline reactor coolant falls within the detectable limits
of the air particulate monitor, the instrument can be adjusted to alarm on
leakage increases from two to five times the baseline value. The contain
ment air particulate monitor together with the other radiation monitors
mentioned in this section are further described in Section 11.2
Containment Radioactive Gas Monitor
This channel measures the gaseous gaimma radioactivity in the Containment by
taking the continuous air samples from the containment atmosphere, after
they pass through the air particulate monitors, and drawing the samples
through a closed, sealed system to a gas monitor assembly.
Each sample is constantly mixed in the fixed, shielded volumes, where it is
viewed by Geiger-Mueller tubes. The samples are then returned to the
Containment.
6.7-4 Rev. 0 7/82

IP3
FSAR UPDATE
he deLector is in a completely enclosed housing containing a gamma
sensitive Geiger-Mueller tube mounted in a constant gas volume container.
Lead shielding is provided to reduce the background radiation level to a
point where it does not interfere with the detector's sensitivity. A
preamplifier and impedance matching circuit is mounted at the detector.
The detector outputs are transmitted to the Radiation Monitoring System cab
inets in the Control Room. The activity is indicated by meters and recorded
by a stripchart recorder. High-activity alarm indications are displayed on
the control board annunciator in addition to the Radiation Monitoring System
cabinets. Local alarms annunciate the supporting equipments' operational
status.
The containment radioactive gas monitor is inherently less sensitive
(threshold at 10- 7 lic/cc) than the containment air particulate monitor, and
would function in the event that significant reactor coolant gaseous
activity exists from fuel cladding defects. The measuring range of this
monitor is given in Section 11.2. Assuming the design value of reactor
coolant gaseous activity (1% fuel cladding defects), the occurrence of a
coolant leak of one gpm would double the background in about two hours. For
coolant gaseous activity consistent with minimal cladding defects, a one gpm
coolant leak would double the background in aproximately two minutes. In
these circumstances, this instrument is a useful backup to the air
0 aQticulate monitor.
containment air particulate and radioactive gas monitors have assemblies
that are common to both channels. They are described as follows:
a) The flow assembly includes a pump unit and selector valves that
provide a representative sample (or a "clean" sample) to the
. detector.
b) The pump unit consists of:
1) A pump to obtain the air sample
2) A flowmeter to indicate the flow rate
3) A flow control valve to provide flow adjustment
4) A flow alarm assembly to provide low and high flow alarm
signals.
c) Selector valves are used to direct the desired sample to the
detector for monitoring and to blow flow when the channel is in
maintenance or "purging" condition.
.d) A pressure sensor is used to protect the system from high
pressure. This unit automatically closes an inlet and outlet
valve upon a high pressure condition.
6.7-5 Rev. 0 7/82
IP 3 FSAR UPDATE
1e) Purging is accomplished with a valve control arrangement whereby the normal sample flow is blocked and the detector purged with a "1clean" sample. This facilitates detector calibration by
establishing the background level and aids in verifying sample
activity level.
f) The flow -control panel in the Control Room Radiation Monitoring
System racks permits remote operation of the flow control
assembly. By operating a sample selector on the control panel the
containment sample may be monitored.
g) A sample flow rate indicator is calibrated linearly (from 0 to 14)
cubic feet per minute.
Alarm lights are actuated by the following:
1) Flow alarm assembly (low or high flow)
2) The pressure sensor assembly (high pressure)
3) The filter paper sensor (paper drive malfunction)
4)~ The pump power control switch (pump motor on).
Humidity Detector
The humidity detection instrumenta tion offers another means of detection of
leakage into the Containment. Although this instrumentation has not nearly
the sensitivity of the air particulate monitor, it has the characteristics
of 7being sensitive to vapor originating from all sources within the Contain
ment, including the reactor coolant and steam and feedwater systems. Plots
of containment air dew point variations above a base-line maximum
established by the cooling water temperature to the air coolers should be
sensitive to incremental increases of water leakage to the containment
atmosphere on the order of f of dewpoint temperature
increase.
The sensitivity of this method depends on cooling water temperature,
containment air temperature variation. and containment air recirculation
rate.
Condensate Measuring System
This method of leak detection is based on the principle that, under
equilibrium conditions, the condensate flow draining from the cooling coils
of the containment air handling units will equal the amount of water (and/or
steam) evaporated from the leaking system. Reasonably accurate measurement
of leakage from the Reactor Coolant System by this method is possible,
1 ause containment air temperature and humidity promote complete
6.7-6 Rev. 0 7/82
IP3 FSAR UPDATE
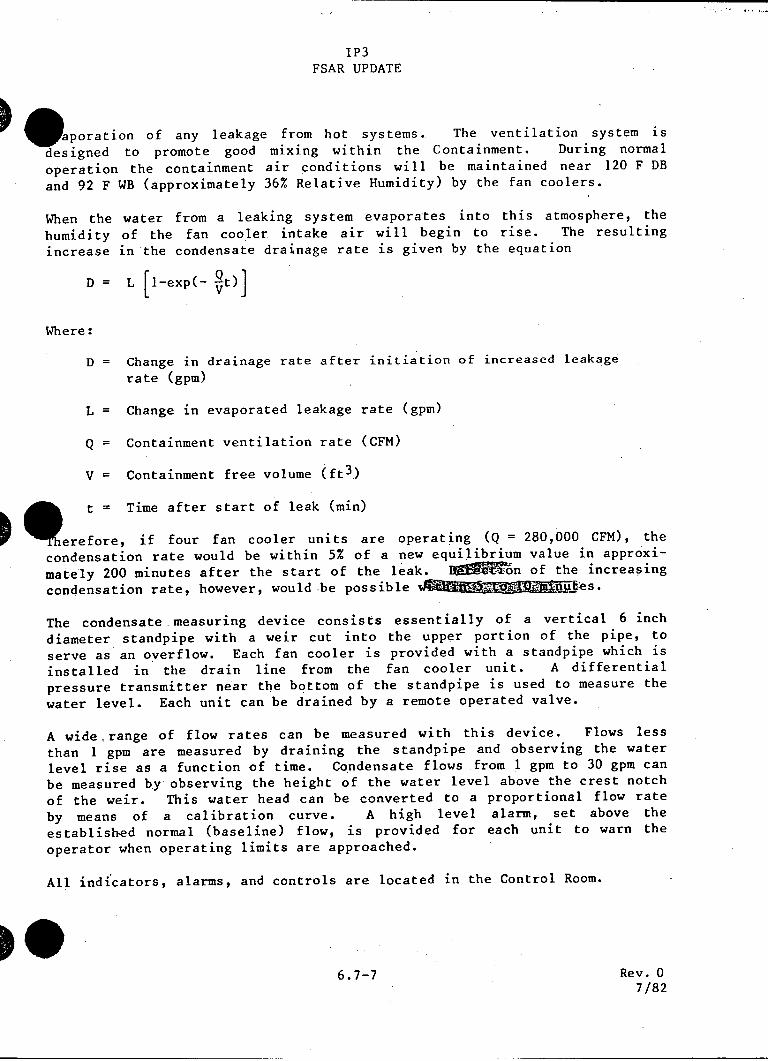
O aporation of any leakage from hot systems. The ventilation system is designed to promote good mixing within the Containment. During normal
operation the containment air conditions will be maintained near 120 F DB
and 92 F WB (approximately 36% Relative Humidity) by the fan coolers.
When the water from a leaking system evaporates into this atmosphere, the
humidity of the fan cooler intake air will begin to rise. The resulting
increase in the condensate drainage rate is given by the equation
D = L [l-exp(- 20)
Where:
D = Change in drainage rate after initiation of increased leakage
rate (gpm)
L = Change in evaporated leakage rate (gpm)
Q = Containment ventilation rate (CFM)
V = Containment free volume (ft3 )
t = Time after start of leak (min)
O erefore, if four fan cooler units are operating (Q = 280,000 CFM), the
condensation rate would be within 5% of a new equilibrium value in approxi
mately 200 minutes after the start of the leak. o on of the increasing
condensation rate, however, would be possible - .s
The condensate measuring device consists essentially of a vertical 6 inch
diameter standpipe with a weir cut into the upper portion of the pipe, to
serve as an overflow. Each fan cooler is provided with a standpipe which is
installed in the drain line from the fan cooler unit. A differential
pressure transmitter near the bottom of the standpipe is used to measure the
water level. Each unit can be drained by a remote operated valve.
A wide.range of flow rates can be measured with this device. Flows less
than I gpm are measured by draining the standpipe and observing the water
level rise as a function of time. Condensate flows from 1 gpm to 30 gpm can
be measured by observing the height of the water level above the crest notch
of the weir. This water head can be converted to a proportional flow rate
by means of a calibration curve. A high level alarm, set above the
established normal (baseline) flow, is provided for each unit to warn the
operator when operating limits are approached.
All indicators, alarms, and controls are located in the Control Room.
6.7-7 Rev. 0 7/82
FSAR UPDATE
S Component Cooling Liquid Monitors
These channels continuously monitor the component cooling loop of the Auxiliary Coolant System for activity indicative of a leak of reactor coolant from either the Reactor Coolant System, the recirculation loop, or the residual heat removal loop of the Auxiliary Coolant System. Each
scintillation counter is located in an in-line well down stream of the component cooling heat exchangers. The detector assembly output is
amplified by a preamplifier and transmitted to the Radiation Monitoring System cabinets in the Control Room. The activity is indicated on a meter and recorded by a two-point recorder. High activity alarm indications are displayed on the control board annunciator in addition to the Radiation Monitoring System cabinets.
The measuring range of this monitor is given in Section 11.2.
Condenser Air Ejector Gas Monitor
This channel monitors the discharge from the air ejector exhaust header of the condensers for gaseous radiation which is indicative of a primary to secondary system leak. The gas discharge is routed to the turbine roof vent. On high radiation level alarm, this gas discharge is diverted to the Containment.
e detector output is transmitted to the Radiation Monitoring System
cabinets in the Control Room. The activity is indicated by a meter and recorded by a two-point recorder. High activity alarm indications are
displayed on the control board annunciator in addition to the Radiation Monitoring cabinets.
A remote indicator panel, mounted at the detector location, indicates the
radiation level and high radiation alarm.
A gamma sensitive Geiger-Mueller tube is used to monitor the gaseous
radiation level. The detector is inserted into an in-line fixed volume container which includes adequate shielding to reduce the background
radiation to where it does not interfere with the detector's maximum
sensitivity. The sensitivity of this monitor is given in Section 11.2.
Steam Generator Liquid Sample Monitor
This channel monitors the liquid phase of the secondary side of the steam generator for radiation, which would indicate a primary-to-secondary system
leak, providing backup information to that of the condenser air ejector gas monitor. Samples from the bottom of each of the four steam generators are mixed to a common header and the common sample is continuously monitored by a scintillation counter and holdup tank assembly. Upon indication of a high radiation level, each steam generator is individually sampled in order
6.7-8 Rev. 0 7/82

IP3 ESAR UPDATE
determine the source. This sampling sequence is achieved by manually lecting the desired unit to be monitored and allotting sufficient time for
'ample equilibrium to be established (approximately I minute).
The sensitivity range of this monitor is given in Table 11.2-7.
A photomultiplier tube - scintillation crystal (NaI) combination, mounted in a hermetically sealed unit, is used to monitor liquid effluent activity. Lead. shielding is provided to reduce the background level so it does not interfere with the detector's maximum sensitivity. The in-line, fixedvolume container is an integral part of the detector unit.
Personnel can enter the Containment and make a visual inspection for leaks. The location of any leak in the Reactor Coolant System would be determined by the presence of boric acid crystals near the leak. The leaking fluid transfers the boric acid crystals outside the Reactor Coolant System and the evaporation process leaves them behind.
If an accident involving gross leakage from the Reactor Coolant System occurred it could be detected by the following methods:
Pump Activity
During normal operation only one charging pump is operating. If a gross ss of reactor coolant to another closed system occurred which was not tected by the methods previously described, the speed of the charging pump
liuldindicate the leakage.
The leakage from the reactor coolant will cause a decrease in the pressurizer liquid level that is within the sensitivity range of the pressurizer level indicator. The speed of the charging pump will
..._ automatically increase to try to maintain the equivalence between ,the letdown flow and the combined charging line flow and flow across the reactor coolant pump seals. If the pump reaches a high speed limit, an alarm is actuated.
A break in the primary system would. result in reactor coolant flowing into the Containment, reactor vessel, and/or recirculation sumps. Gross leakage to these sumps would be indicated by the frequency of operation of the containment or recirculation pumps. Since the building floor drains preferentially to the containment sump, the operating frequency of the containment sump pumps would be more likely to indicate the leak than the operating frequency of the recirculation or reactor vessel sump pumps.
The contains two (2) 194MOMP rbrs each consisting, of a column containing five (5) level switches which indicate a vertical array of five (5) lights on the control room supervisory panel. Two (2) 'out of the five*(5) switches on each level indicator measure level within the sump.
6.7-9 Rev. 0 7/82
IP3 FSAR UPDATE
eOn addition an overflow alarm provides an annunciated alarm on the control
room supervisory panel if the level in the sump reaches the containment
floor. The recirculation sump contains two (2) level indicators, each
consisting of a column containing five (5) level switches which indicate a
vertical array of five (5) lights on the control room supervisory panel.
One (1) switch on one indicator measures level within the sump while three
(3) switches on the other indicator measure level within the sump.
The reactor vessel sump contains a level indicator which annunciates two (2)
alarms on the control room supervisory panel. These alarms will annunciate
at different levels when the sump accumulates with water prior to the level
reaching the in-core instrumentation tubing for the reactor vessel. In
addition, when the first sump pump starts, an indicating light will
illuminate on the control room supervisory panel.
The containment sump contains two (2) sump pumps which are actuated by
separate pump float switches. These pumps discharge the water to the waste
holdup -tank outside Containment. Located on this discharge line outside
containment is the flow meter and totalizer, which indicates on the Primary
Auxiliary Building waste disposal panel the flow from the pumps and a
cumulative measure of the amount of water being discharged from Containment.
The cumulative volume is trended by the control room operators to identify
many abnormal increases in leakage on a daily basis. In addition, indicating
ights on the waste disposal panel indicate when the containment sump pumps
Wre running. This panel is periodically operated and monitored by the
auxiliary operator who reports directly to the control room operator.
The recirculation-sump contains redundant level indication. Loss of both of
these level indications for more than seven days requires a plant shutdown
in_-accordance .. with. Technical Specifications. *.The sump pumps, which
discharge into the Reactor Coolant System, are rpquired for a LOCA and
require an'ininediate plant shutdown if they become inoperable.
The reactor vessel sump contains a level indicator which annunciates at two
separate levels. In addition, the running of the first sump pump indicates
in the Control Room.* At the present time during normal plant operation,
* there . is no. means to test operability of either the level indication or
pumps since this sump is normally maintained dry.
The containment sump contains redundant level indication. Loss of both of
these level indications for more than seven days requires a plant shutdown
in accordance with the Technical Specifications. Even if both level
indications were operable, the level probe at the top of the sump would
still provid-e an annunciated alarm. In addition, the sump pumps indicating
lights and the flow meter/totalizer on the waste disposal panel outside
containment provide back up indication of conditions occurring in the sump.
Both pumps operate independently, but should they both become inoperable, a
containment entry would be performed to attempt to make any necessary
*epairs. If the pumps could not be made operable, continued plant operation
6.7-10 Rev. 0 7/82

IP3 FSAR UPDATE
ould be considered after a complete evaluation of the leakage rate, waste
wup tank capacity and source of the leakage.
Liquid inventory
Gross leaks might be detected by unscheduled increases in the amount of
reactor coolant makeup water which is required to maintain the normal level
in the pressurizer.
A large tube side to shell side leak in the non-regenerative (letdown) heat
exchanger would result in reactor coolant flowing into the component cooling
water and a rise in the liquid level in the component cooling water surge
tank. The operator would be alerted by a high water alarm for the surge
tank and high radiation and temperature alarms actuated by monitors at the
component cooling water pump suction header. In addition a low flow alarm
would be actuated by a monitor on the outlet line of the Chemical and Volume
Control System from the non-regenerative heat exchanger.
A high level alarm for the component cooling water surge tank and high
radiation and temperature alarms actuated by monitors at the component
cooling pump suction header could also indicate a thermal barrier cooling
coil rupture in a reactor coolant pump. However, in addition to these
alarms, high temperature and high flow on the component cooling outlet line
from the pump would activate alarms.
055 leakage might also be indicated by a rise in the normal containment
0 *d/or recirculation sump levels. High level in either of these sumps is
idicated* in the Control Room by indicating lights. Since the building
floor drains preferentially to the containment sump, the containment sump
level transmitter would most likely be -actuated prior to the level
transmitter in the recirculation sump.
The f from an unidentified source that will be OO
during normal operation is 6V .
Leakage directly into the Containment indicates the possibility of a breach
in the coolant envelope. The -limitation of 1 gpm for a source of leakage
not identified is sufficiently above the minimum detectable leakage rate to
provide a reliable indication of leakage. The 1 gpm limit is well below the
capacity of one coolant charging pump (98 gpm).
The relationshi p between leak rate and crack site has been studied in detail
in WCAP-75Q30), Revision 1, February 1972. This report includes the
following information:
6.7-11 Rev. 0 7/82
1P3
FSAR UPDATE
1 ) The length of a through-wall crack that would leak at. the rate of
W the proposed limit, as a function of wall thickness.
2) The ratio of that length to the length of a critical through-wall
crack, based on the application of the principles of fracture
mechanics.
3) The mathematical model and data used in such analyses.
Leak rate detection. is not relied upon for assuring the integrity of the
primary system pressure boundary during operation. The conservative
approach which is utilized in the design and fabrication of the components
which constitute the primary system pressure boundary together with the
operating restrictions which are imposed for system heatup and cooldown
give adequate assurance that the integrity of the primary system pressure
boundary is maintained throughout plant life. The periodic examination of
the primary pressure boundary via the in-service inspection program
(specified in the Technical Specifications) will physically demonstrate that
the operating environment will have no deleterious effect on the primary
pressure boundary integrity.
The maximum unidentified leak rate of 1 gpm which is permitted during normal
operation is well within the sensitivity of the leak detection systems
incor'porated within the containment, and it reflects good operating practice Ied on operating experience gained at other PWR plants. Detection of
Mraagefrom the primary system directs the operator's attention to
potential sources of leakage such as valves, and permits timely evaluation
to -ensure that any associated activity release does not constitute a public
hazard, that the reactor coolant inventory is not significantly affected and
tha't the leakage is well within the capability of the containment drainage
system.
Residual Heat Removal Loop
The residual heat removal loop removes residual and sensible heat from the
core and reduces the temperature of the Reactor Coolant System during the
second phase of plant shutdown.
During normal operation the containment air particulate and radioactive gas
monitors, the humidity detector and the condensate measuring system provide
means for detecting leakage from the section of the residual heat removal
loop inside the Reactor Containment. These systems have been described pre
viously in this section (see description of leak detection from the Reactor
Coolant System). Leakage from the residual heat removal loop into the com
ponent cooling water loop during normal operation would be detected outside.
the Containment by the component cooling loop radiation monitor (see
analysis of detection of leakage from the Reactor Coolant System in this
section).
6.7-12 Rev. 0 i 7/82

IP3 FSAR UPDATE
APPENDIX 6B
PRIMARY SYSTEM LEAK DETECTION INTO CONTAINMENT VESSEL
1.0 INTRODUCTION
Small leaks developed in the primary system pressure boundary could be
detected by several continuously recording instruments available to the
plant operators. The most sensitive of these detectors is the radioactive
air particulate monitor which continuously samples the air in the contain
ment cooling system. The purpose of the containment cooling system is to
maintain proper ambient temperatures for equipment in the containment
vessel. This system takes air from the upper elevations of the vessel and
recirculates it through cooling coils on the suction side of the supply fan.
This air is then discharged at a rate of 40,000 cfm. The turnover rate of
air in the containment vessel as a result of this system is approximately
once every hour. By sampling air from the discharge of the containment
cooling system supply fan, leak rates as small as L I(20 cc/minute) could be detected.
Another detector, the radiogas monitor, sampling air from the same, position
as the air particulate monitor, continuously analyzes air from the
containment cooling system for gaseous radioactivity. This monitor is
capable of detecting a leak rate of about ' h ,7 (6500 cc/minute).
In addition to measuring changes in the radioactivity of the containment
vessel, dew point sensors continuously sample the air from the suction side
of the containment cooling system supply fans. These instruments could
detect a primary coolant leak rate of approximately pali (250 cc/minute) by
measuring changes in the moisture content of the containment vessel.
By the use of the above instruments, plant operators could continuously
monitor the containment vessel for primary system leakage and take any steps
necessary to operate the facility safely. Measurements made by the New York
University Medical Center, Institute of Environmental Medicine, have shown
that the samples analyzed by these instruments are representative of the
containment vessel and that samples taken manually to back up these
detectors were accurate to within a factor of 2.
Other methods for detecting and locating primary system leakage include
visual inspection for escaping steam or water, boric acid crystal formation,
component and primary relief tank levels, hydrogen concentration and radio
activity, containment sump level, and manually taken samples for tritium
radioactivity in condensed moisture from the containment vessel.
I 6B-l Rev. 0 7/82
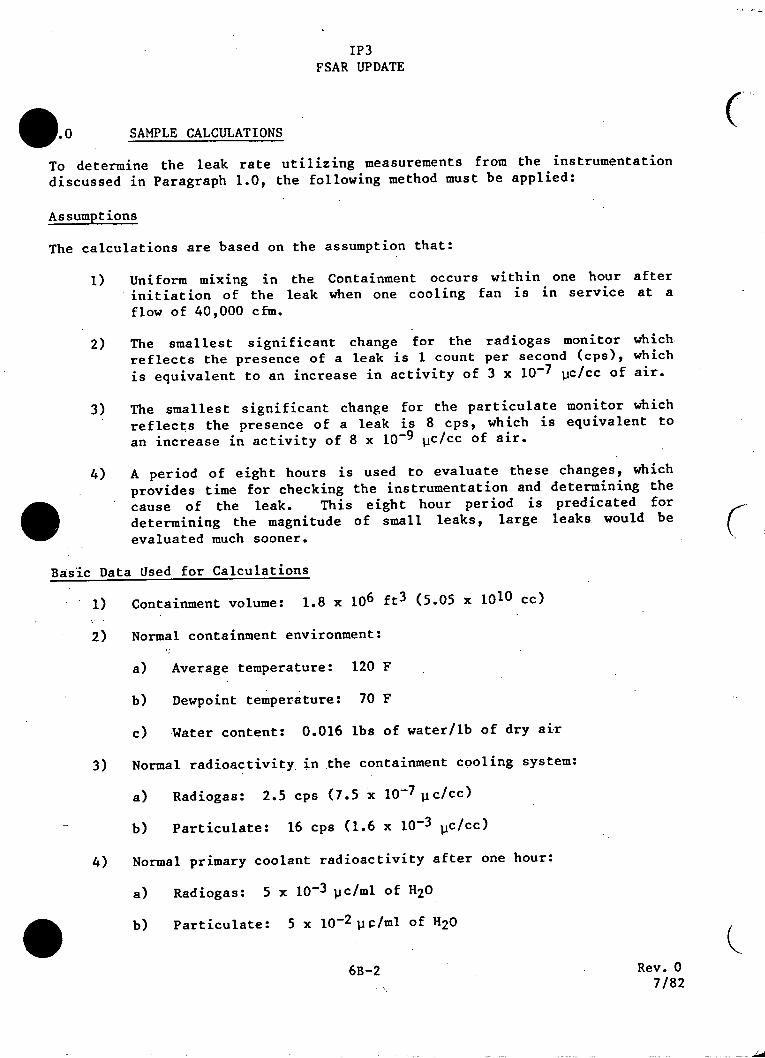
IP3 FSAR UPDATE
0 SAMPLE CALCULATIONS
To determine the leak rate utilizing measurements from the instrumentation
discussed in Paragraph 1.0, the following method must be applied:
Assumptions
The calculations are based on the assumption that:
I) Uniform mixing in the Containment occurs within one hour after
initiation of the leak when one cooling fan is in service at a
flow of 40,000 cfm.
2) The smallest significant change for the radiogas monitor which
reflects the presence of a leak is I count per second (cps), which
is equivalent to an increase in activity of 3 x 10- 7
1ic/cc of air.
3) The smallest significant change for the particulate monitor which
reflects the presence of a leak is 8 cps, which is equivalent to
an increase in activity of 8 x 10- 9 Vc/cc of air.
4) A period of eight hours is used to evaluate these changes, which
provides time for checking the instrumentation and determining the
cause of the leak. This eight hour period is predicated for
determining the magnitude of small leaks, large leaks, would be
evaluated much sooner.
Basic Data Used for Calculations
1) Containment volume: 1.8 x 106 ft3 (5.05 x 10¹⁰ cc)
2) Normal containment environment:
a) Average temperature: 120 F
b) Dewpoint temperature: 70 F
c) Water content: 0.016 lbs of water/lb of dry air
3) Normal radioactivity in the containment cooling system:
a) Radiogas: 2.5 cps (7.5 x 10- 7 pc/cc)
b) Particulate: 16 cps (1.6 x 10- 3 Pc/cc)
4) Normal primary coolant radioactivity after one hour:
a) Radiogas: 5 x 10- 3 , c/ml of H20
b) Particulate: 5 x 10- 2 pp/ml of H20
6B-2 Rev. 0 7/82
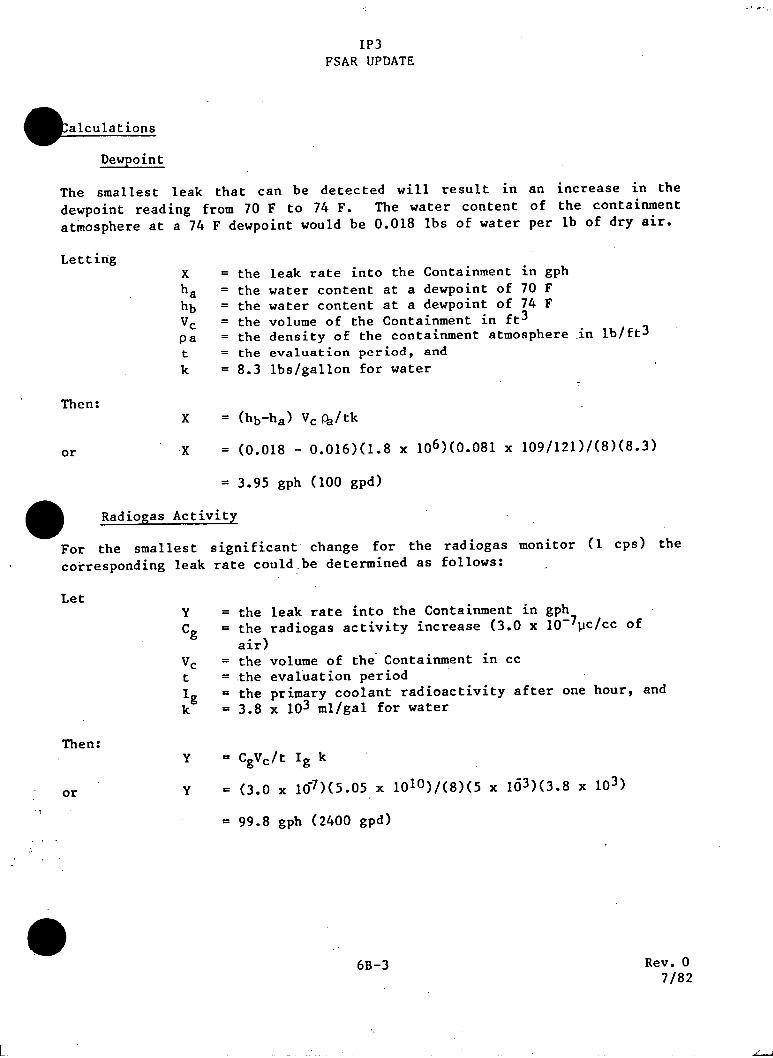
IP3 FSAR UPDATE
kalculations
Dewpoint
The smallest leak that can be detected will result in an increase in the
dewpoint reading from 70 F to 74 F. The water content of the containment
atmosphere at a 74 F dewpoint would be 0.018 lbs of water per lb of dry air.
Letting X the leak rate into the Containment in gph
ha = the water content at a dewpoint of 70 F
hb = the water content at a dewpoint of 74 F
Vc the volume of the Containment in ft3
pa = the density of the containment atmosphere in lb/ft3
t = the evaluation period, and
k = 8.3 lbs/gallon for water
Then: X (hb-ha) Vcf: /tk
or X = (0.018 - 0.016)(1.8 x 10⁶)(0.081 x 10⁹/121)/(8)(8.3)
3.95 gph (100 gpd)
SRadiogas Activity
For the smallest significant change for the radiogas monitor (I cps) the
corresponding leak rate could-be determined as follows:
Let Y = the leak rate into the Containment in gph
Cg = the radiogas activity increase (3.0 x 10⁻⁷pc/cc of
air) Vc = the volume of the Containment in cc
t = the evaluation period
1Ig = the primary coolant radioactivity after one hour, and
k = 3.8 x 10³ ml/gal for water
Then: Y = CgVc/t Ig k
or Y = (3.0 x 10⁷)(5.05 x 10¹⁰)/(8)(5 x 163)(3.8 x 10³)
= 99.8 gph (2400 gpd)
6B-3 Rev. 0 7/82
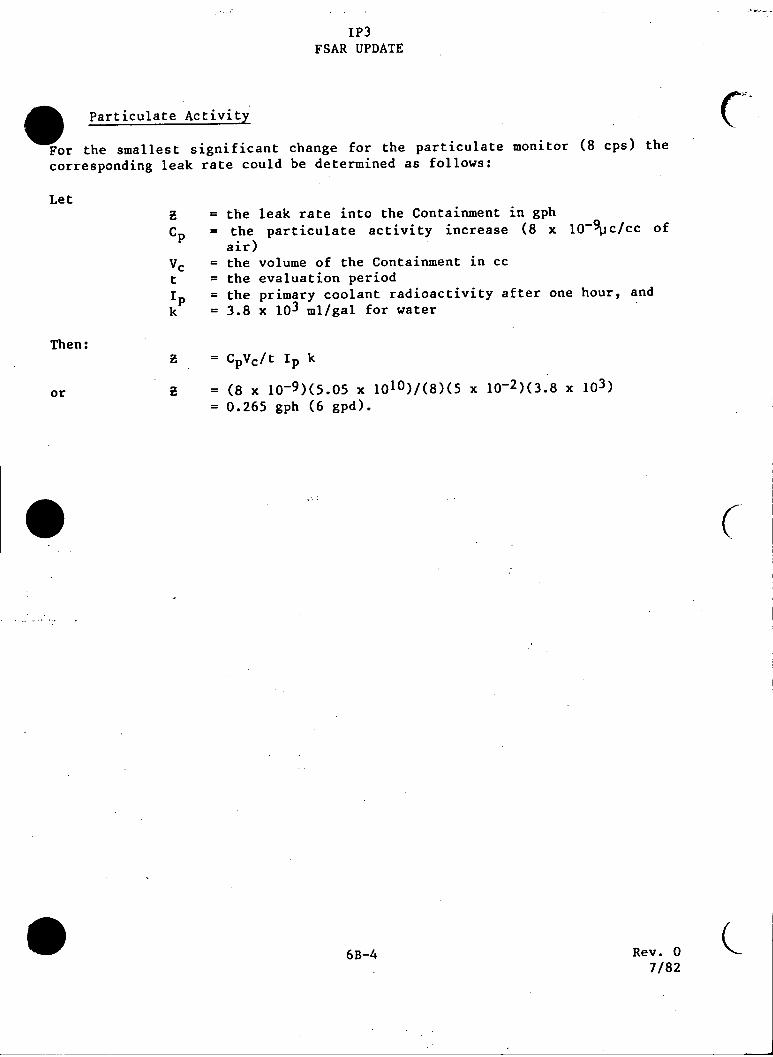
IP3 FSAR UPDATE
I Particulate Activity
For the smallest significant change for the particulate monitor (8 cps) the
corresponding leak rate could be determined as follows:
Let = the leak rate into the Containment in gph
Cp = the particulate activity increase (8 x l0-9c/cc of
air)
Vc = the volume of the Containment in cc
t = the evaluation period
I p = the primary coolant radioactivity after one hour, and
k = 3.8 x 10³ ml/gal for water
Then: 9 = CpVc/t Ip k
or 9 = (8 x 10⁻⁹)(5.05 x 10¹⁰)/(8)(5 x 10-2)(3.8 x 10³)
= 0.265 gph (6 gpd).
I C
6B-4 Rev. 0 7/82
-~

PROP
PROPRIETARY INFORMATION
NOTICE
THE ATTACHED DOCUMENT MAY CONTAIN "PROPRIETARY INFORMATION" AND SHOULD BE HANDLED AS NRC "OFFICIAL USE ONLY" INFORMATION. IT SHOULD NOT BE DISCUSSED OR MADE AVAILABLE TO ANY PERSON NOT REQUIRING SUCH INFORMATION IN THE CONDUCT OF OFFICIAL BUSINESS AND SHOULD BE STORED, TRANSFERRED, AND DISPOSED OF BY EACH RECIPIENT IN A MANNER WHICH WILL ASSURE THAT ITS CONTENTS ARE NOT MADE AVAILABLE TO UNAUTHORIZED PERSONS.
PROPRIETARY INFORM NRC Form 190 (4-78)
j
,FPDC.-
"imimfracture proof designcrorio
'4
-NOTICE
THE ATTACHED FILES ARE OFFICIAL RECORDS OF THE
DIVISION OF DOCUMENT CONTROL. THEY HAVE BEEN
CHARGED TO YOU FOR A LIMITED TIME PERIOD AND MUST BE" RETURNED TO THE RECORDS FACILITY
BRANCH 016. PLEASE DO NOT SEND DOCUMENTS CHARGED OUT THROUGH THE MAIL. REMOVAL OF ANY
PAGE(S) FROM DOCUMENT FOR REPRODUCTION MUST
BE REFERRED TO FILE PERSONNEL.
DEADLINE RETURN DATE _________
RECORDS FACILITY BRANCH
corporation
//
C,