Embed Size (px)
Citation preview

TexasCommission onEnvironmentalQuality
Texas State Soil & Water ConservationBoard SFR-066/18 January 2019
Funding provided by the Environmental Protection Agency through Clean Water Act Section 319(h) grant funds
Printed on recycled paper using vegetable-based ink.
www.tceq.texas.gov/assets/public/comm_exec/pubs/sfr/sfr-066-18.pdf
The TCEQ is an equal opportunity employer. The agency does not allow discrimination on the basis of race, color, religion, national origin, sex, disability, age, sexual orientation, or veteran status. In compliance with the Americans with Disabilities Act, this document may be requested in
alternate formats by contacting the TCEQ at 512-239-0010, or 1-800-RELAY-TX (TDD), or by writing P.O. Box 13087, Austin, TX 78711-3087.
How is our customer service?Fill out our online customer-satisfaction survey at www.tceq.texas.gov/customersurvey
Nonpoint Source Pollution Management in Texas2018 ANNUAL REPORT

Authorization to use or reproduce any original material contained in this publication, not obtained from other sources, is freely granted. The Texas Commission on Environmental Quality (TCEQ)
and the Texas State Soil and Water Conservation Board (TSSWCB) would appreciate acknowledgement.
Copies of this publication are available for public use through the Texas State Library, other state depository libraries, and the TCEQ Library, in compliance with state depository law. For more information on TCEQ publications visit our website at: tceq.texas.gov/publications
This document may also be downloaded from the TSSWCB website at: www.tsswcb.texas.gov/reports
Published and distributed by the Texas Commission on Environmental Quality
P.O. Box 13087, Austin, TX 78711-3087Texas State Soil and Water Conservation Board
1497 Country View Lane, Temple, TX 76504-8806

TEXAS STATE SOIL & WATER CONSERVATION BOARD
TEXAS COMMISSION ON ENVIRONMENTAL QUALITY
Nonpoint Source Pollution Management in Texas2018 ANNUAL REPORT
2
Rex IsomExecutive Director
Texas State Soil and Water Conservation Board
Toby BakerExecutive Director
Texas Commission on Environmental Quality
LETTER FROM THE EXECUTIVE DIRECTORS
NONPOINT SOURCE POLLUTION MANAGEMENT IN TEXAS | 2018 ANNUAL REPORT
The Nonpoint Source Management Program outlines Texas’ comprehensive strategy to protect and restore waters across the state impacted by nonpoint source pollution. This strategy is implemented by utilizing voluntary, regulatory, financial, and technical
assistance approaches, while working with a multitude of partners, to achieve a balanced program. The United States Environmental Protection Agency (EPA) provides grant funding to Texas to implement the components and goals set forth in the Texas Nonpoint Source Management Program. The responsibility for implementing this program is shared be-tween the Texas Commission on Environmental Quality (TCEQ) and the Texas State Soil and Water Conservation Board (TSSWCB).Texas has consistently worked with partners across the state to develop and implement watershed-based plans to improve water quality. At the close of fiscal year 2018, more than 25 watershed protection plans have been accepted by the EPA. Together with partners and stakeholders, the TCEQ and the TSSWCB are actively engaged in implementing voluntary management measures identified in the watershed-based plans. In fiscal year 2018, the state finalized and submitted to EPA an updated Texas Nonpoint Source Management Program. This update included the implementation of the water-shed action planning process to address water quality issues in the state; enhanced coordi-nation of the Clean Water Act Section 303(d) Vision between the Nonpoint Source and Total Maximum Daily Load Programs; and substantial progress between the TCEQ and the Texas General Land Office in moving the state closer to full federal approval of the Texas Coastal Nonpoint Source Pollution Control Program. We are pleased to present the 2018 Annual Report of the state’s Nonpoint Source Man-agement Program. The report highlights our accomplishments in managing nonpoint source pollution and meeting the goals of the program. In partnership with the EPA and other federal, state, regional, and local watershed stakeholders, the TCEQ and the TSSWCB look forward to the continued implementation of an efficient, accountable, and transparent program.
Sincerely,

Letter from the Executive Directors 2
Chapter 1: Introduction 7 Defining Nonpoint Source Pollution 7 What Guides Nonpoint Source Pollution Management in Texas? 7 Partnerships 7 The Texas Nonpoint Source Management Program 8 Goals for Nonpoint Source Management 8 Long-Term Goal 8 Short-Term Goals 8 The Watershed Approach 8 Watershed Action Planning 8
Chapter 2: Progress in Improving Water Quality 11 Reductions in Pollutant Loadings 11 Lower Colorado River Authority’s Creekside Conservation Program 11 San Antonio River Authority’s Low Impact Development Retrofits 12 Implementing Agricultural Best Management Practices in the Plum Creek Watershed 12 Implementing the Lower Nueces River Watershed Protection Plan 12 Water Quality Improvements 12 Success Story Highlights 12 Partnerships and Conservation Planning Help Restore Water Quality in Catfish Creek 12 Water Quality Improved 12 Problem 13 Project Highlights 13 Results 13 Partners and Funding 14 Slowing, Detaining, and Filtering Stormwater Reduces Bacteria Loads in the North Concho River 14
Water Quality Improved 14 Problem 14 Project Highlights 15 Results 15 Partners and Funding 15
Chapter 3: Progress Toward Meeting the Goals and Objectives of the Texas Nonpoint Source Management Program 17 Clean Water Act Section 319(h) Grant Program 17 Status of Clean Water Act Section 319(h) Grant-Funded Projects 17 Short-Term Goals and Milestones of the Texas Nonpoint Source Management Program 18 Goal One—Data Collection and Assessment 18 Texas Integrated Report 18 Water Quality Status Categories 19 Summary of the 2014 Integrated Report 19 Summary of Impairments on the 2014 Integrated Report 20 2016 and 2018 Integrated Reports 20 Continuous Water Quality Monitoring 20 Texas Stream Team Monitoring 21 Goal Two—Implementing Programs to Reduce Nonpoint Source Pollution 22 Implementation Project Highlights 22 Implementing the Geronimo and Alligator Creeks Watershed Protection Plan 22 Implementing the Arroyo Colorado Watershed Protection Plan at Los Fresnos High School and Nature Park 23 Total Maximum Daily Loads and Implementation Plans 23 Texas Coastal Management Program 24 Septic Systems 24 Multi-Management Measure Program and the Coastal Stormwater Management Manual 24 Estuary Programs in Texas 25 Galveston Bay Estuary Program 25 Coastal Bend Bays and Estuaries Program 25
3
TABLE OF CONTENTS
NONPOINT SOURCE POLLUTION MANAGEMENT IN TEXAS | 2018 ANNUAL REPORT

4 NONPOINT SOURCE POLLUTION MANAGEMENT IN TEXAS | 2018 ANNUAL REPORT
Texas Groundwater Protection Committee 26 Clean Water State Revolving Fund Loans for Nonpoint Source Projects 26 Goal Three—Education 26 Coastal Communities Nonpoint Source Pollution Prevention Outreach Project 26 Riparian and Stream Ecosystem Education Program 27 Watershed-Based Feral Hog Management 28 Healthy Lawns and Healthy Waters 28
Chapter 4: Developing and Implementing Watershed Protection Plans 31 Watershed Protection Plan Highlights 34 Upper San Marcos River 34 Development of the Watershed Protection Plan 34 Watershed Implementation Activities 35 Attoyac Bayou 35 Development of the Watershed Protection Plan 35 Watershed Implementation Activities 35
Abbreviations 37
Appendix 39 Texas Nonpoint Source Management Program Milestones 39
TABLE OF CONTENTSC O N T I N U E D
FiguresFigure 1.1 Social, Economic, and Environmental Considerations for Water Quality Restoration 8
Figure 2.1 Map of the Catfish Creek Watershed 13
Figure 2.2 E. coli Assessment Data from 2005 – 2012 for Catfish Creek 13
Figure 2.3 E. coli Grab Samples from 2000 – 2017 for Stations 12412 and 15886 15
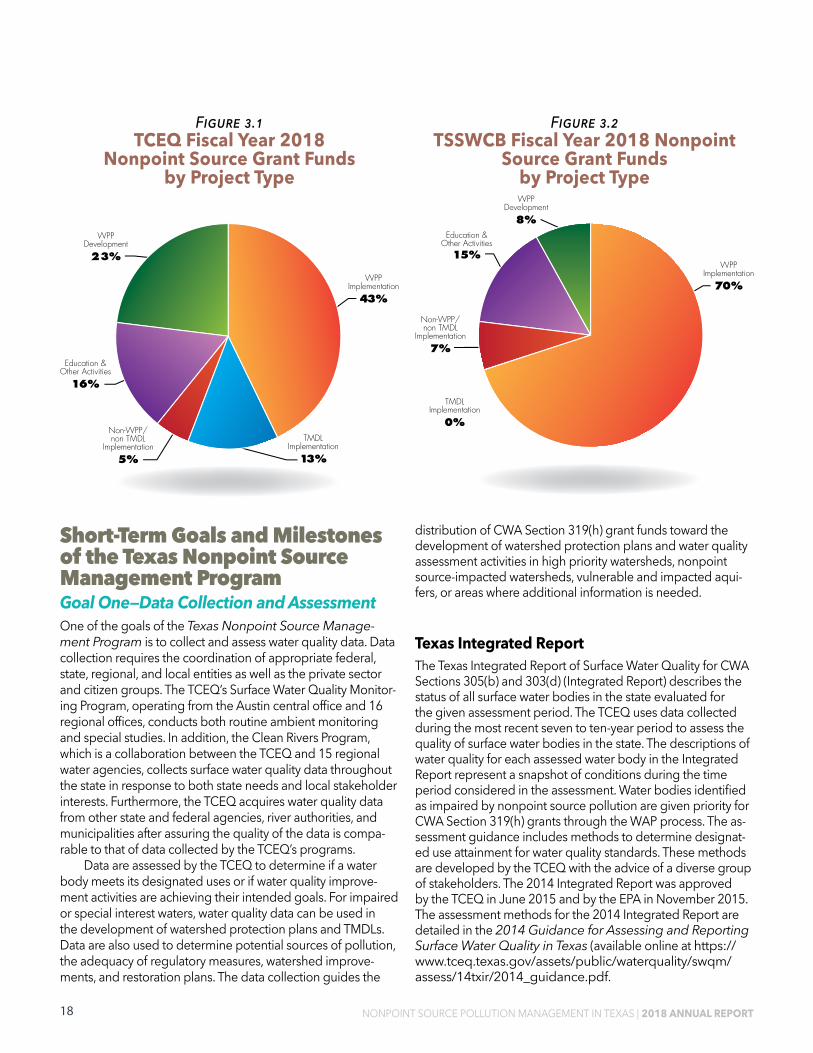
Figure 3.1 TCEQ Fiscal Year 2018 Nonpoint Source Grant Funds by Project Type 18
Figure 3.2 TSSWCB Fiscal Year 2018 Nonpoint Source Grant Funds by Project Type 18
Figure 3.3 Active Continuous Water Quality Monitoring Stations in Fiscal Year 2018 21
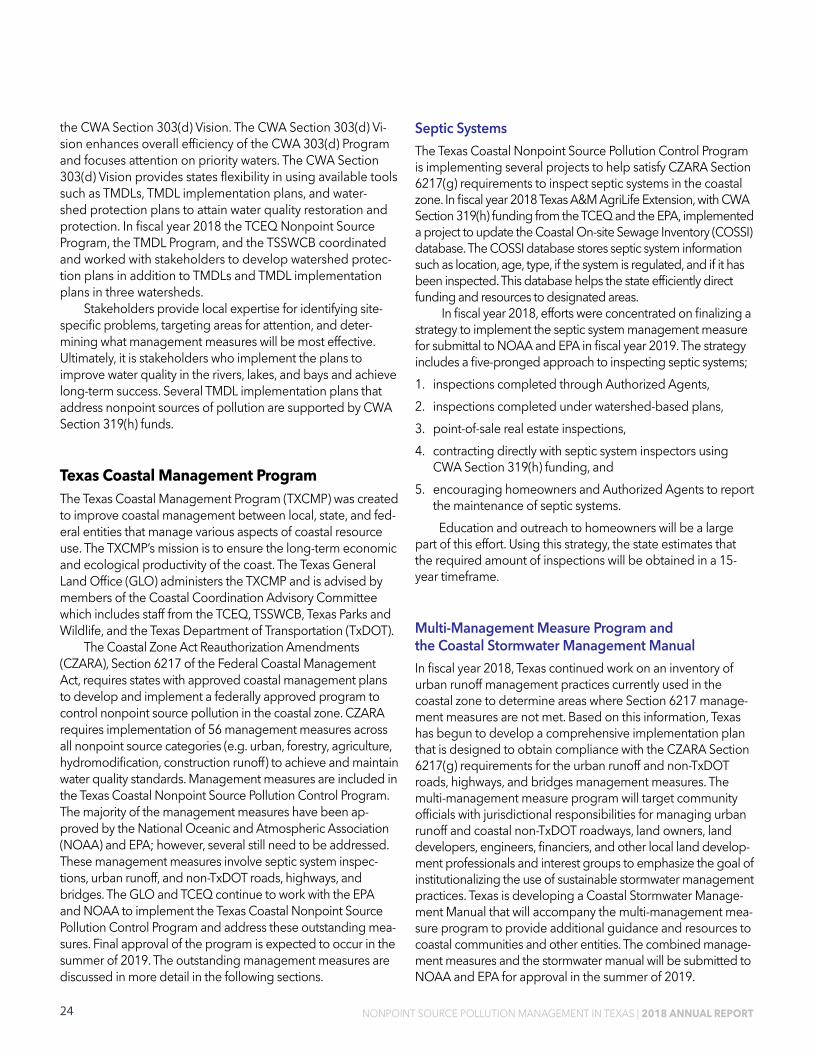
Figure 3.4 Active Texas Stream Team Monitoring Sites in Fiscal Year 2018 22
Figure 4.1 Map of Watersheds with Watershed Protection Plans or Watershed Characterizations 32
Tables Table 3.1 Number of Water Bodies Assigned to Each Assessment Category in the 2014 Integrated Report 19
Table 3.2 Subcategories of Category 5 in the 2014 Integrated Report 19
Table 3.3 Summary of Impairments in the 2012 Versus 2014 Integrated Report 20
Table 4.1 Watershed Protection Plans Completed or Under Development in Texas 33

5NONPOINT SOURCE POLLUTION MANAGEMENT IN TEXAS | 2018 ANNUAL REPORT


7
CHAPTER 1 Introduction
Defining Nonpoint Source Pollution
Nonpoint source pollution occurs when rainfall or snowmelt flows over land, roads, buildings, and other features of the landscape, and carries pollutants into
drainage ditches, lakes, rivers, wetlands, coastal waters, and even underground sources of water. This is unlike point source pollution which results from a discharge at a specific single location. Some nonpoint source pollutants include:
X fertilizers, herbicides, and insecticides from agricultural lands and residential areas;
X oil, grease, and toxic chemicals from spills, roads, urban areas, industrial facilities, and energy production;
X sediment from construction sites, crop and forest lands, and eroding stream banks; and
X bacteria and nutrients from livestock, pet waste, wildlife, and leaking septic systems.Nonpoint source pollution can also originate as air pollu-
tion which is deposited onto the ground and into waterways, through a process called atmospheric deposition.
What Guides Nonpoint Source Pollution Management in Texas?Under the federal Clean Water Act (CWA) and the Texas Water Code, Texas must adopt surface water quality standards for waters in the state, assess the status of water quality, and implement actions necessary to achieve and maintain those standards. The long-term goal of the Texas
Nonpoint Source Management Program, developed under CWA Sections 319(a) and 319(b), is to protect and restore the quality of the state’s water resources from the adverse effects of nonpoint source pollution. This is accomplished through cooperative implementation using the organiza-tional tools and strategies defined below.
Partnerships The Texas Commission on Environmental Quality (TCEQ) is the lead state agency responsible for establishing the level of water quality to be maintained in Texas. Per the Texas Water Code Chapter 26, a primary responsibility of the TCEQ is the abatement of nonpoint source pollution from sources which are not agricultural or silvicultural. The Texas State Soil and Water Conservation Board (TSSWCB) is the lead agency in the state for planning, implementing, and managing programs and practices that prevent and abate agricultural and silvicul-tural nonpoint source pollution. The TCEQ and the TSSWCB coordinate closely to jointly administer the Texas Nonpoint Source Management Program.
Management of nonpoint source pollution in Texas in-volves partnerships with many organizations to coordinate, de-velop, and implement the Texas Nonpoint Source Manage-ment Program. With the extent and variety of nonpoint source issues across Texas, cooperation across political boundaries is essential. Many local, regional, and state agencies play an inte-gral part in managing nonpoint source pollution. They provide information about local concerns and infrastructure and build support for the management measures that are necessary to prevent and reduce nonpoint source pollution. By coordinat-ing with these partners to share information and resources, the state can more effectively manage its water quality protection and restoration efforts.
NONPOINT SOURCE POLLUTION MANAGEMENT IN TEXAS | 2018 ANNUAL REPORT

8 NONPOINT SOURCE POLLUTION MANAGEMENT IN TEXAS | 2018 ANNUAL REPORT
The Texas Nonpoint Source Management ProgramThe Texas Nonpoint Source Management Program outlines Texas’ comprehensive strategy to protect and restore waters impacted by nonpoint source pollution. Nonpoint source pollu-tion is managed through assessment, planning, implementation, and education. The state has established long- and short-term goals and objectives for guiding and tracking the progress of its nonpoint source management program. This report highlights the success in achieving these goals and objectives.
Goals for Nonpoint Source ManagementLong-Term GoalThe long-term goal of the Texas Nonpoint Source Manage-ment Program is to protect and restore water quality affected by nonpoint source pollution through implementing the following short-term goals: data collection and assessment, implementation, and education.
Short-Term GoalsGoal One—Data Collection and AssessmentCoordinate with appropriate federal, state, regional, and local entities, and stakeholder groups to target water quality as-sessment activities in high priority, nonpoint source-impacted watersheds, vulnerable and impacted aquifers, or areas where additional information is needed.
Goal Two—ImplementationImplement Total Maximum Daily Load (TMDL) implementa-tion plans and/or watershed protection plans and other state, regional, and local plans/programs to reduce nonpoint source pollution by targeting implementation activities to the areas identified as impacted or potentially degraded by nonpoint source pollution with respect to use criteria.
Goal Three—EducationConduct education and technology transfer activities to increase awareness of nonpoint source pollution and activi-ties which contribute to the degradation of water bodies, including aquifers, by nonpoint source pollution.
The Watershed ApproachProtecting the state’s streams, lakes, bays, and aquifers from the impacts of nonpoint source pollution is a complex process. Texas uses the Watershed Approach to focus efforts on the
highest priority water quality issues of both surface water and groundwater. The Watershed Approach is based on the follow-ing principles:
X a geographic focus based on hydrology rather than political boundaries;
X water quality objectives based on scientific data; X coordinated priorities and integrated solutions; and X diverse, well-integrated partnerships.
For groundwater management, the geographic focus is on aquifers rather than watersheds. Wherever interactions be-tween surface water and groundwater are identified, manage-ment activities will support the quality of both resources.
The Watershed Approach recognizes that to achieve restoration of impaired water bodies, solutions to water quality issues must be socially equitable, economically viable, and environmentally bearable.
Figure 1.1 Social, Economic, and Environmental
Considerations for Water Quality Restoration
Watershed Action PlanningA major element in the Texas Nonpoint Source Management Program is the inclusion of the Watershed Action Planning (WAP) process and the Nonpoint Source Priority Watersheds Report.
The WAP process provides a framework for tracking pri-ority water quality issues from selection through implemen-tation. Partner agencies first review identified water quality issues, which are typically water bodies listed as impaired

9NONPOINT SOURCE POLLUTION MANAGEMENT IN TEXAS | 2018 ANNUAL REPORT
on the CWA 303(d) list, then determine the best strategy for addressing the issue. Strategies may include further data col-lection and evaluation of appropriate water quality standards, and/or development of a watershed-based plan with specific restoration activities. Once a strategy is determined, a lead program for implementation is assigned. Restoration activi-ties identified in watershed-based plans are eligible and prioritized for federal funding for implementation.
Management strategies to address nonpoint source water quality issues are determined through a collaborative approach and documented in the Nonpoint Source Priority Watersheds Report. This comprehensive planning process fosters relation-ships and facilitates greater coordination and leveraging of resources between state and local water resource agencies.
Funding limitations, new guidelines, increasing popula-tions, and evolving environmental policies create new chal-lenges for the state water quality planning programs. This elevates the importance of incorporating the WAP process in the Nonpoint Source Program. The coordination process al-lows stakeholders the opportunity to provide a local perspec-tive into water quality management strategies and priorities. Interagency coordination of the state’s water quality programs allows for more effective development of projects, leveraging of resources, and the implementation of water quality manage-ment strategies with stakeholder support.
The WAP process integrates information from existing planning tools and from the coordination process to develop
quality management strategies and implementation. As part of the WAP process, these strategies are documented and periodically updated with the cooperation of the WAP part-ners. Partners include the TSSWCB, the Clean Rivers Program partners (typically river authorities), and the five TCEQ Water Quality Planning Division program areas—Texas Surface Water Quality Standards Group, Surface Water Quality Monitoring Program, Clean Rivers Program, TMDL Program, and the Non-point Source Program. The result of this process is a list of all water quality impairments and special interest water bodies in the state that identifies what will be done to address the impairment or concern, the party responsible for undertaking the action, and a means of tracking progress. The recom-mended strategies are documented in the WAP Table, which summarizes the water quality management information. The WAP Table is available to the public and located on the TCEQ’s website at: http://www.tceq.texas.gov/waterquality/planning/wap/. Data contained in the WAP Table, as well as special projects associated with impaired waterbodies, are available through the WAP Public Viewer, an interactive, web-based application. Visit the WAP Public Viewer at https://www80.tceq.texas.gov/WapWeb/public/map.htm. Water quality management strategies identified through the WAP process are implemented on a continuing basis. The WAP process has helped identify and track restoration efforts, the collection of water quality data, the adoption of TMDLs, and the completion of watershed protection plans.
Clear Fork tributary to the Blanco River (Source: Wyman Meinzer)


CHAPTER 2
Progress in Improving Water Quality
11
Section 319(h) of the CWA requires that state nonpoint source annual reports include, “…to the extent that ap-propriate information is available, reductions in nonpoint
source pollutant loading and improvements in water quality… resulting from implementation of the management program.” This specifically applies to the water bodies that have previous-ly been identified as requiring nonpoint source pollution con-trol actions in order to “…attain or maintain applicable water quality standards or the goals and requirements of the Clean Water Act.” The three primary ways of measuring improvement in water quality are through:
X measuring actual results from implementing management measures;
X calculating estimated load reductions with the help of mod-els or other calculations; and
X long-term monitoring of the water body.Other indicators of progress toward water quality im-
provements include land use modifications or behavioral changes that are associated with reductions in loadings or pollutant concentrations in water bodies. Examples include restored riparian habitat and reduced use of fertilizers and pesticides.
Reductions in Pollutant LoadingsLower Colorado River Authority’s Creekside Conservation ProgramThe Lower Colorado River Authority (LCRA) Creekside Con-servation Program is a collaborative partnership between the LCRA, private landowners, the United States Department of Agriculture - Natural Resources Conservation Service (NRCS),
and local Soil and Water Conservation Districts. Utilizing a CWA Section 319(h) grant from the TSSWCB and EPA, this cost-sharing incentive program aims to reduce soil erosion and agricultural nonpoint source pollution by providing techni-cal and financial assistance to producers implementing best management practices (BMPs) on private property within the Colorado River watershed.
In fiscal year 2018, the Creekside Conservation Program provided financial assistance to 10 producers. As a result, 2,149 acres of private lands were placed under conservation management plans that incorporate prescribed grazing and upland wildlife habitat management. Notable BMPs com-pleted through the program included a total of 11,195 feet of cross fencing, 2,763 feet of pipeline, 238 acres of brush management, and the installation of two water troughs and one grade stabilization structure. Using the Texas Best Man-agement Practices Evaluation Tool, these efforts achieved the following estimated load reductions:
Pollutant Load Reduction
Sediment 840 tons
Nitrogen 9,340 lbs1
Phosphorus 1,204 lbs1 – pounds
The Creekside Conservation Program is applicable to landowners within the Colorado River watershed of Bastrop, Blanco, Burnet, Colorado, Fayette, Lampasas, Llano, Matago-rda, San Saba, Travis, and Wharton counties. For more infor-mation regarding the LCRA Creekside Conservation Program, please visit https://www.lcra.org/community-services/land-conservation.
NONPOINT SOURCE POLLUTION MANAGEMENT IN TEXAS | 2018 ANNUAL REPORT

12 NONPOINT SOURCE POLLUTION MANAGEMENT IN TEXAS | 2018 ANNUAL REPORT
San Antonio River Authority’s Low Impact Development Retrofits In fiscal year 2018, the San Antonio River Authority (SARA) completed the installation of low impact development (LID) retrofits at their office facilities in San Antonio using a CWA Section 319(h) grant from the TCEQ and the EPA. These retrofits included seven rain water cisterns with a total rainwater storage capacity of 30,000 gallons, nine rain gardens with the capacity to capture 41,206 gallons of runoff, and 21 permeable pavement parking spaces with 38,139 gallons of runoff treatment capacity.
During 25 storm events monitored over one year, the cisterns captured 15,446 gallons of runoff for irrigation use, and the rain gardens and permeable pavement filtered and discharged an-other 23,748 gallons of runoff. Eighty percent of runoff flowing to the LID features during monitored storms was retained on-site.
SARA tracked the flow of treated and untreated runoff from the LID features and changes in the volume of stored water in the cisterns with each storm. SARA applied simple spreadsheet calculations to estimate the annual pollutant load reductions. The following load reductions were calculated:
Pollutant Load ReductionSediment 1 ton
Nitrogen 145 lbs
Phosphorus 19 lbs
E. coli1 1.5E+10 MPN2
1 E. coli - Escherichia coli2MPN – Most Probable Number
Implementing Agricultural Best Management Practices in the Plum Creek WatershedThe Plum Creek Watershed Protection Plan was developed to address elevated bacteria levels and reduce nonpoint source pollution in Plum Creek. The Caldwell-Travis Soil and Water Conservation District received CWA Section 319(h) fund-ing from the TSSWCB and the EPA to implement agricultural management measures identified in the Plum Creek Water-shed Protection Plan. In fiscal year 2018, technical and financial assistance was provided to landowners for the development and implementation of ten water quality management plans (WQMPs) covering 853 acres. Best management practices implemented through this effort include two water wells, two pumping plants, 200 feet of pipeline, one watering facility, 37.5 acres of grass planting, 4,486 feet of cross fencing, 765 acres of prescribed grazing, 760 acres of herbaceous weed control, 760 acres of nutrient management, 51.6 acres of brush man-agement, and 22.6 acres of heavy use area protection. Based on the Texas Best Management Practices Evaluation Tool, the BMPs provided the following load reductions:
Pollutant Load ReductionSediment 433 tons
Nitrogen 9,464 lbs
Phosphorus 2,202 lbs
Implementing the Lower Nueces River Watershed Protection PlanIn fiscal year 2018, the Nueces River Authority used CWA Sec-tion 319(h) funds from the TCEQ and the EPA to implement the septic system repair and replacement management measure identified in the watershed protection plan. A total of 43 systems were inspected, 14 systems were replaced, and nine systems were repaired. Assuming two people per household, each using 70 gallons of water per day, and according to litera-ture values for loadings per day, the estimated load reductions achieved based on 23 replacements and repairs are:
Pollutant Load ReductionE. coli 2.18 * 1015 cfu/100mL1
Nitrogen 219 - 621 lbs
Phosphorus 37 - 73 lbs
Total Suspended Solids 1,278 - 2,774 lbs1cfu/100mL - colony forming units per 100 milliliters
Water Quality ImprovementsThe TCEQ and the TSSWCB work together to identify water quality improvements where the implementation of nonpoint source BMPs is a contributing factor. Once a candidate is identified, a “success story” is written and sent to the EPA for review and approval. Linking instream nonpoint source pollut-ant reductions to land management practices is challenging. Changes to the land can occur over varying temporal and spa-tial scales and contributions to the stream are rainfall driven. As a result, changes in water quality often lag behind the imple-mentation of nonpoint source BMPs, and many years of imple-mentation may be needed before significant improvements in a water body are observed. Despite these challenges, Texas continues to see measurable water quality improvements.
Success Story HighlightsPartnerships and Conservation Planning Help Restore Water Quality in Catfish CreekWater Quality Improved High levels of bacteria prompted the TCEQ to add Catfish Creek to the 2010 list of impaired waters for not supporting
13NONPOINT SOURCE POLLUTION MANAGEMENT IN TEXAS | 2018 ANNUAL REPORT
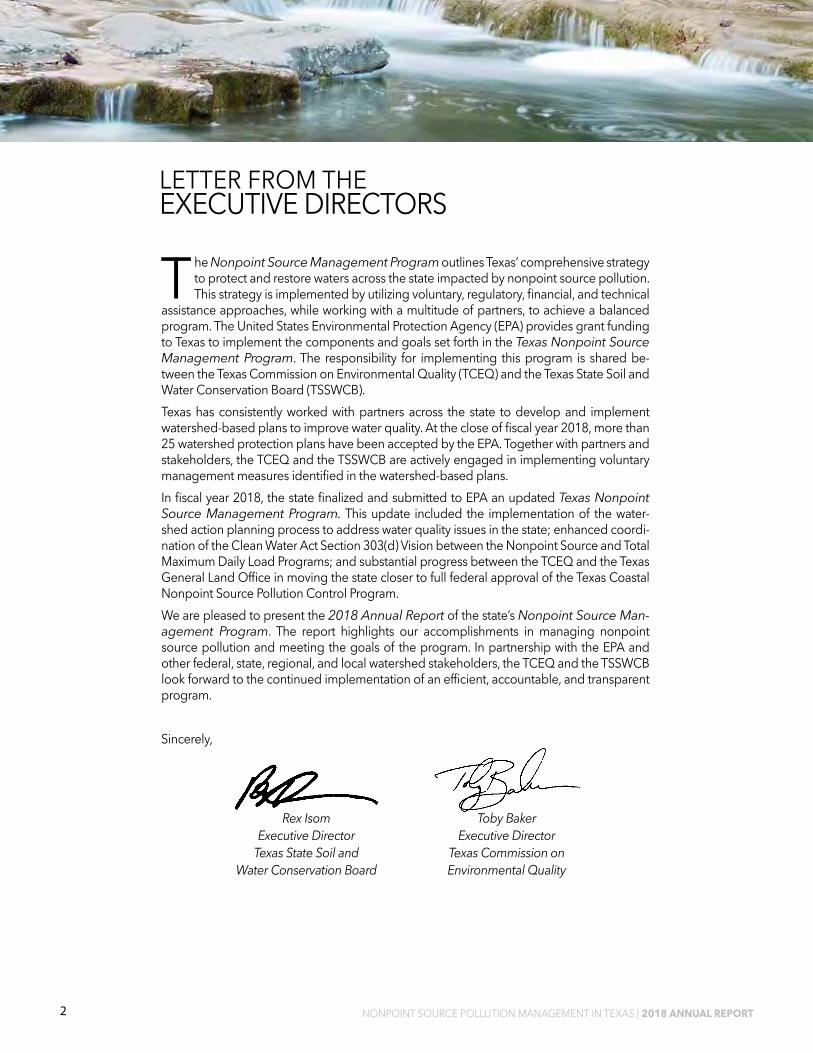
the designated primary contact recreation use. The TSSWCB and an extensive group of partners came together to engage with the community in 2010 to help address these issues. Project partners used CWA Section 319(h) grant funds from the TSSWCB and EPA to develop a network of private landowners engaged in cooperative conservation to advance the restora-tion and protection of water quality in the Trinity River Basin. Through these efforts water quality was improved and in 2014 Catfish Creek (assessment unit 0804G_1) was removed from the state’s list of impaired waters for bacteria.
Figure 2.1 Map of the Catfish Creek watershed
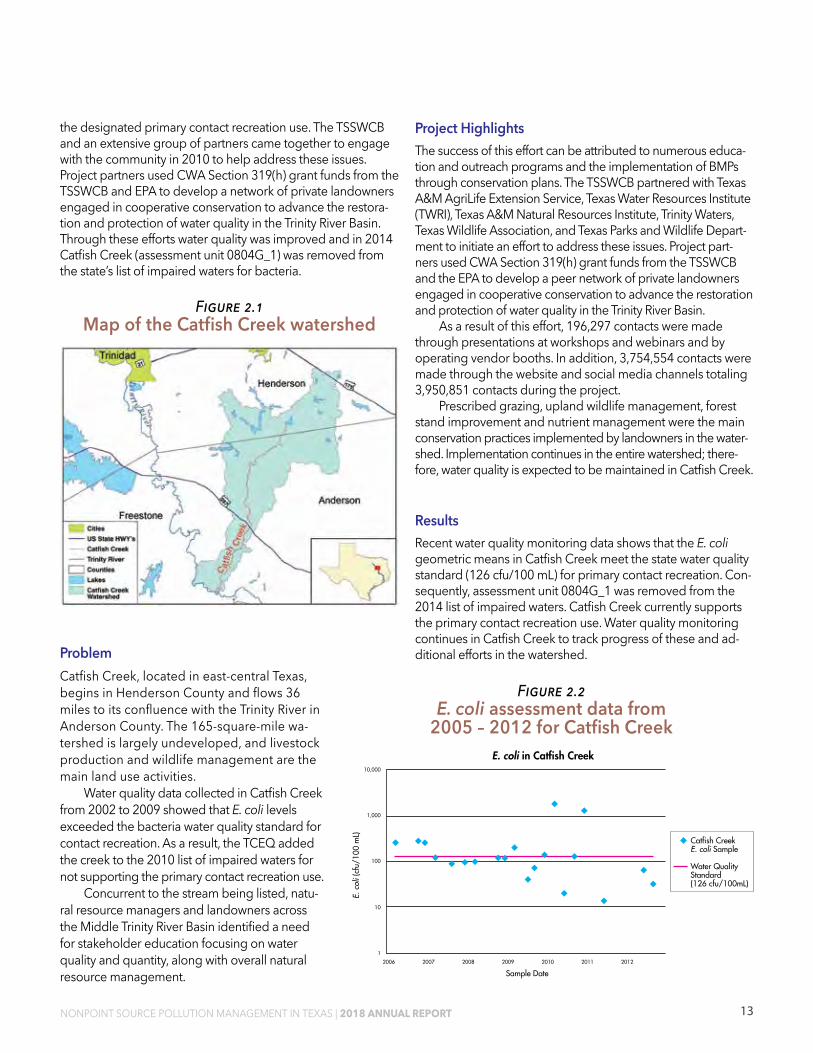
Figure 2.2 E. coli assessment data from
2005 – 2012 for Catfish Creek
ProblemCatfish Creek, located in east-central Texas, begins in Henderson County and flows 36 miles to its confluence with the Trinity River in Anderson County. The 165-square-mile wa-tershed is largely undeveloped, and livestock production and wildlife management are the main land use activities.
Water quality data collected in Catfish Creek from 2002 to 2009 showed that E. coli levels exceeded the bacteria water quality standard for contact recreation. As a result, the TCEQ added the creek to the 2010 list of impaired waters for not supporting the primary contact recreation use.
Concurrent to the stream being listed, natu-ral resource managers and landowners across the Middle Trinity River Basin identified a need for stakeholder education focusing on water quality and quantity, along with overall natural resource management.
Project HighlightsThe success of this effort can be attributed to numerous educa-tion and outreach programs and the implementation of BMPs through conservation plans. The TSSWCB partnered with Texas A&M AgriLife Extension Service, Texas Water Resources Institute (TWRI), Texas A&M Natural Resources Institute, Trinity Waters, Texas Wildlife Association, and Texas Parks and Wildlife Depart-ment to initiate an effort to address these issues. Project part-ners used CWA Section 319(h) grant funds from the TSSWCB and the EPA to develop a peer network of private landowners engaged in cooperative conservation to advance the restoration and protection of water quality in the Trinity River Basin.
As a result of this effort, 196,297 contacts were made through presentations at workshops and webinars and by operating vendor booths. In addition, 3,754,554 contacts were made through the website and social media channels totaling 3,950,851 contacts during the project.
Prescribed grazing, upland wildlife management, forest stand improvement and nutrient management were the main conservation practices implemented by landowners in the water-shed. Implementation continues in the entire watershed; there-fore, water quality is expected to be maintained in Catfish Creek.
ResultsRecent water quality monitoring data shows that the E. coli geometric means in Catfish Creek meet the state water quality standard (126 cfu/100 mL) for primary contact recreation. Con-sequently, assessment unit 0804G_1 was removed from the 2014 list of impaired waters. Catfish Creek currently supports the primary contact recreation use. Water quality monitoring continues in Catfish Creek to track progress of these and ad-ditional efforts in the watershed.
2006 2007 2008 2009 2010 2011 2012
1
10
100
1,000
10,000
Catfish Creek E. coli Sample
Water Quality Standard(126 cfu/100mL)
E. c
oli (
cfu/
100
mL)
Sample Date
E. coli in Catfish Creek

Partners and FundingOver $437,900 in CWA Section 319(h) funds from the TSS-WCB and EPA, matched with over $293,500 from Texas A&M AgriLife Extension Service, TWRI, Texas A&M Natural Resources Institute, Texas Wildlife Association, and Trinity Waters were used to educate stakeholders in the Middle Trinity River Basin, including Catfish Creek. The NRCS provided more than $17,800 in Farm Bill funding, combined with more than $8,000 in local match to implement conservation practices on over 26,000 acres in the watershed.
Slowing, Detaining, and Filtering Stormwater Reduces Bacteria Loads in the North Concho River Water Quality Improved The Concho River was included in the 1992 list of impaired wa-ters. Low dissolved oxygen and eutrophication were identified as the main concerns. In 2008 high levels of bacteria prompted the TCEQ to add a bacteria impairment for the North Concho River to the list of impaired waters. The City of San Angelo (the City) and the Upper Colorado River Authority (UCRA) imple-mented BMPs to slow, detain, and filter stormwater entering the river. The City conducted education and outreach and
partnered with UCRA to develop a watershed protection plan and a stormwater management plan. As a result, water qual-ity in the North Concho River, assessment unit 1421_08, has improved and the TCEQ is proposing to remove the bacteria impairment from the 2016 list of impaired waters.
ProblemThe North Concho River is 88 miles long, and flows from Glass-cock County into O. C. Fisher Lake and then through the City reaching the confluence of the South Concho River near Bell Street. Assessment unit 1421_08 of the North Concho River is about six and a half miles long and flows through the City.
Land use in the North Concho River watershed includes rangeland for livestock grazing, farming, crop irrigation, concentrated animal feeding operations, extensive rural subdivision development, and residential, commercial, and industrial development.
The designated beneficial use for assessment unit 1421_08 is primary contact recreation. To meet the water quality standard, E. coli levels cannot exceed a geometric mean of 126 cfu/100mL of water. Assessment unit 1421_08 had geometric means that exceeded the standard. As a result, this assessment unit was included on the 2008 list of impaired
North Concho River with bank stabilizing BMPs (Source: UCRA)
14 NONPOINT SOURCE POLLUTION MANAGEMENT IN TEXAS | 2018 ANNUAL REPORT

waters. In 2008, development of the North Concho River Watershed Protection Plan was initiated by the UCRA, with CWA Section 319(h) funding from the TSSWCB and the EPA. Potential sources of nonpoint source pollution were evaluated in the watershed protection plan, and the stakeholders identi-fied pollution control strategies.
Project HighlightsA CWA Section 319(h) funded project was initiated in 1994 between the City, UCRA, and the TCEQ to restore the North Concho River by constructing BMPs that slowed and filtered stormwater before it entered the North Concho River. Gabion retention structures designed to reduce stormwater runoff were constructed at the Civic League Park and Santa Rita Park in the City in 1998. These were the first of many structural BMPs built using 319(h) funding to reduce urban runoff and pollutant loading to the North Concho River.
The construction of two BMPs, a wet retention pond at Brentwood Park and a dry detention pond near 11th Street were completed in 2001 and 2003 respec-tively. Monitoring has demonstrated that the Brentwood Park retention pond can remove 99 percent of total suspended solids, 85 percent of the biochemical oxygen demand, and 98 percent of fecal coliform from stormwater. A gravity-based stormwater cleaning device was also installed downtown in 2007. After storm-water is gravity-separated and filtered by this device, high-quality effluent from the system is discharged into the river or pumped into nearby man-made ponds which are part of the expanded public education effort.
Rainwater harvesting is a BMP that catches rain fall and prevents it from contributing bacteria loadings to water bodies. The North Concho River watershed is prone to drought conditions and the City has been encouraging homeowners to adopt rainwater harvesting practices. The City created an educational video on rainwater harvesting, that is posted on their website, http://www.co-satx.us/departments-services/water-conservation. There are four rainwater harvesting systems installed on City build-ings and four systems installed on various private commercial buildings in the watershed. The City will continue to promote rainwater harvesting as a BMP to address stormwater loadings and water conservation concerns.
The City started an Adopt-A-Spot-Program in 1998 and continues to support groups, clubs, families, or individuals to maintain different property locations. Pet waste stations have also been placed at parks along the river, and the City maintains the stations. The Water Education Center continues to reach large numbers of school age youth, and adults. By serving as
a vehicle for implementation of the recommended BMPs and continual education programs, the Center is a key component of the North Concho River Watershed Protection Plan.
ResultsThe TCEQ originally listed assessment unit 1421_08 on the 2008 list of impaired waters because of high bacteria levels at surface water quality monitoring stations 12412 and 15886. Water quality data indicate that concentrations of E. coli have decreased. The bacteria levels have been improving at stations 12412 and 15886 (Figure 2.2). During the most recent assess-ment of water bodies, the E. coli geometric mean for assess-ment unit 1421_08 was below the 126 cfu/100 mL primary contact recreation use standard, resulting in the waterbody’s proposed removal from the 2016 list of impaired waters.
Figure 2.3 E. coli grab samples from 2000 – 2017
for Stations 12412 and 15886
8/2000 5/2003 2/2006 10/2008 7/2011 4/2014 1/2017
10
50
250
1,250
6,2500
12412
15886
Standard(126/100mL)E.
col
i (cf
u/10
0 m
L)
North Concho River SWQM Sites: Bacteria
Partners and FundingWatershed partners have spent approximately $3,928,263 on water quality improvements in the North Concho River, combin-ing $2,358,958 in CWA Section 319(h) funds with $1,569,305 matched by local efforts. Of these combined funds from the EPA, the TCEQ administered $1,983,718 with $1,322,478 from local match, for a total of $3,306,196. The TSSWCB administered $375,240 with $246,827 from local match, for a total of $622,067.
Private funding for nonpoint source water quality improve-ments on the North Concho River included a contribution of $260,000 in 1997, from a private benefactor. The City also col-lects a half-cent sales tax implemented in 1999, which helped fund this project.
15NONPOINT SOURCE POLLUTION MANAGEMENT IN TEXAS | 2018 ANNUAL REPORT
CHAPTER 3
Progress Toward Meeting the Goals and Objectives of the Texas Nonpoint Source Management Program
17
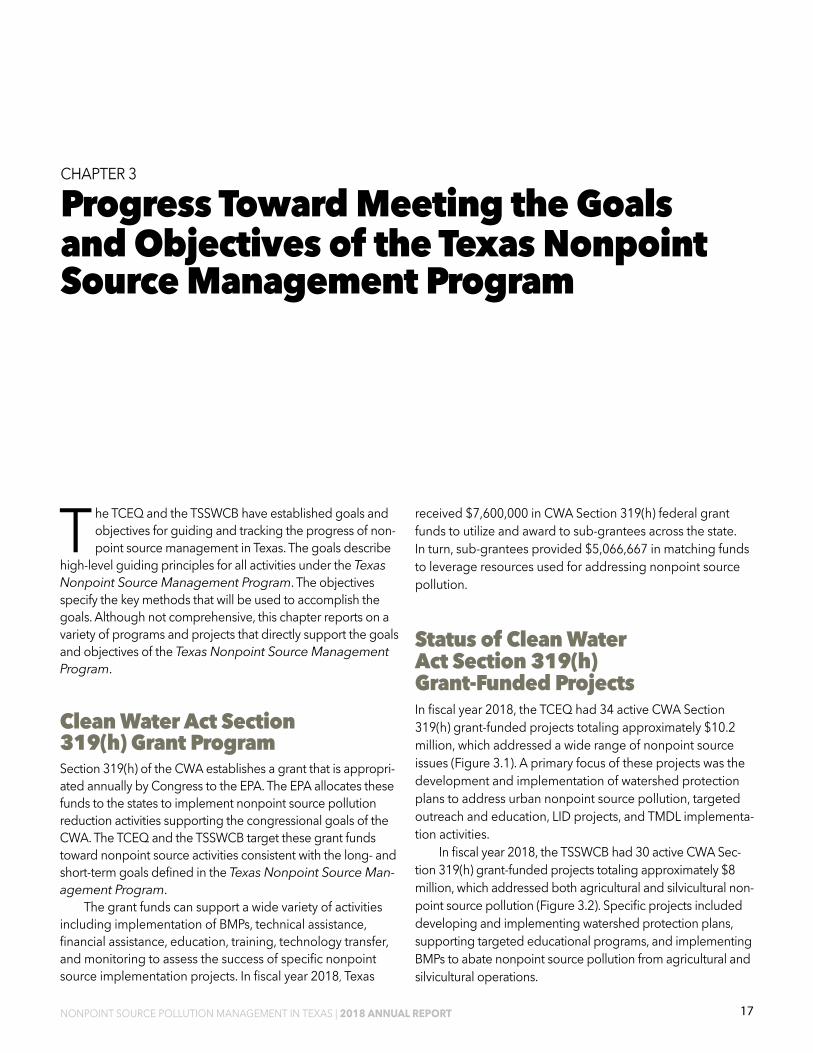
The TCEQ and the TSSWCB have established goals and objectives for guiding and tracking the progress of non-point source management in Texas. The goals describe
high-level guiding principles for all activities under the Texas Nonpoint Source Management Program. The objectives specify the key methods that will be used to accomplish the goals. Although not comprehensive, this chapter reports on a variety of programs and projects that directly support the goals and objectives of the Texas Nonpoint Source Management Program.
Clean Water Act Section 319(h) Grant ProgramSection 319(h) of the CWA establishes a grant that is appropri-ated annually by Congress to the EPA. The EPA allocates these funds to the states to implement nonpoint source pollution reduction activities supporting the congressional goals of the CWA. The TCEQ and the TSSWCB target these grant funds toward nonpoint source activities consistent with the long- and short-term goals defined in the Texas Nonpoint Source Man-agement Program.
The grant funds can support a wide variety of activities including implementation of BMPs, technical assistance, financial assistance, education, training, technology transfer, and monitoring to assess the success of specific nonpoint source implementation projects. In fiscal year 2018, Texas
received $7,600,000 in CWA Section 319(h) federal grant funds to utilize and award to sub-grantees across the state. In turn, sub-grantees provided $5,066,667 in matching funds to leverage resources used for addressing nonpoint source pollution.
Status of Clean Water Act Section 319(h) Grant-Funded ProjectsIn fiscal year 2018, the TCEQ had 34 active CWA Section 319(h) grant-funded projects totaling approximately $10.2 million, which addressed a wide range of nonpoint source issues (Figure 3.1). A primary focus of these projects was the development and implementation of watershed protection plans to address urban nonpoint source pollution, targeted outreach and education, LID projects, and TMDL implementa-tion activities.
In fiscal year 2018, the TSSWCB had 30 active CWA Sec-tion 319(h) grant-funded projects totaling approximately $8 million, which addressed both agricultural and silvicultural non-point source pollution (Figure 3.2). Specific projects included developing and implementing watershed protection plans, supporting targeted educational programs, and implementing BMPs to abate nonpoint source pollution from agricultural and silvicultural operations.
NONPOINT SOURCE POLLUTION MANAGEMENT IN TEXAS | 2018 ANNUAL REPORT
18
Figure 3.1 TCEQ Fiscal Year 2018
Nonpoint Source Grant Funds by Project Type
Figure 3.2 TSSWCB Fiscal Year 2018 Nonpoint
Source Grant Funds by Project Type
NONPOINT SOURCE POLLUTION MANAGEMENT IN TEXAS | 2018 ANNUAL REPORT
Short-Term Goals and Milestones of the Texas Nonpoint Source Management ProgramGoal One—Data Collection and AssessmentOne of the goals of the Texas Nonpoint Source Manage-ment Program is to collect and assess water quality data. Data collection requires the coordination of appropriate federal, state, regional, and local entities as well as the private sector and citizen groups. The TCEQ’s Surface Water Quality Monitor-ing Program, operating from the Austin central office and 16 regional offices, conducts both routine ambient monitoring and special studies. In addition, the Clean Rivers Program, which is a collaboration between the TCEQ and 15 regional water agencies, collects surface water quality data throughout the state in response to both state needs and local stakeholder interests. Furthermore, the TCEQ acquires water quality data from other state and federal agencies, river authorities, and municipalities after assuring the quality of the data is compa-rable to that of data collected by the TCEQ’s programs.
Data are assessed by the TCEQ to determine if a water body meets its designated uses or if water quality improve-ment activities are achieving their intended goals. For impaired or special interest waters, water quality data can be used in the development of watershed protection plans and TMDLs. Data are also used to determine potential sources of pollution, the adequacy of regulatory measures, watershed improve-ments, and restoration plans. The data collection guides the
WPPImplementation
43%
TMDLImplementation
13%
Non-WPP/non TMDL
Implementation
5%
Education &Other Activities
16%
WPPDevelopment
23%WPP
Implementation
70%
TMDLImplementation
0%
Non-WPP/non TMDL
Implementation
7%
Education &Other Activities
15%
WPPDevelopment
8%
distribution of CWA Section 319(h) grant funds toward the development of watershed protection plans and water quality assessment activities in high priority watersheds, nonpoint source-impacted watersheds, vulnerable and impacted aqui-fers, or areas where additional information is needed.
Texas Integrated ReportThe Texas Integrated Report of Surface Water Quality for CWA Sections 305(b) and 303(d) (Integrated Report) describes the status of all surface water bodies in the state evaluated for the given assessment period. The TCEQ uses data collected during the most recent seven to ten-year period to assess the quality of surface water bodies in the state. The descriptions of water quality for each assessed water body in the Integrated Report represent a snapshot of conditions during the time period considered in the assessment. Water bodies identified as impaired by nonpoint source pollution are given priority for CWA Section 319(h) grants through the WAP process. The as-sessment guidance includes methods to determine designat-ed use attainment for water quality standards. These methods are developed by the TCEQ with the advice of a diverse group of stakeholders. The 2014 Integrated Report was approved by the TCEQ in June 2015 and by the EPA in November 2015. The assessment methods for the 2014 Integrated Report are detailed in the 2014 Guidance for Assessing and Reporting Surface Water Quality in Texas (available online at https://www.tceq.texas.gov/assets/public/waterquality/swqm/assess/14txir/2014_guidance.pdf.

19NONPOINT SOURCE POLLUTION MANAGEMENT IN TEXAS | 2018 ANNUAL REPORT
Water Quality Status CategoriesThe Integrated Report assigns each assessed water body to one of five categories in order to report water quality status and potential management options to the public, the EPA, state agencies, federal agencies, municipalities, and environ-mental groups. These categories indicate the status of a water body and describe how the state will approach identified water quality problems. Table 3.1 defines the five categories and shows the number of water bodies assigned to each as-sessment category in the 2014 Integrated Report.
Table 3.1 Number of Water Bodies Assigned to
Each Assessment Category in the 2014 Integrated Report
Category Definition Number of Water Bodies
1Attaining all the water quality standards and no use is threatened.
85
2
Attaining some of the designated uses, no use is threatened, and insufficient or no data and information are available to determine if the remaining uses are attained or threatened.
336
3
Insufficient or no data and information to determine if any designated use is attained. Many of these water bodies are intermittent streams and small reservoirs.
127
4
The standard is not supported or is threatened for one or more designated uses but does not require the development of a TMDL.
104
5
The water body does not meet applicable water quality standards or is threatened for one or more designated uses by one or more pollutants. Category 5 is the CWA Section 303(d) list.
401
Total 1053
The 303(d) list of impaired waters (Category 5 of the Integrated Report) identifies waters that do not meet Texas surface water quality standards. It is an important manage-ment tool produced as part of the Integrated Report and must be approved by the EPA. Water bodies on the 303(d) list of impaired waters are those that require action to restore water quality. An impairment occurs when a water body does not meet water quality criteria to protect a specific use. The same assessment unit can have multiple impairments. For example, a water body may not meet the criteria for both dissolved oxygen and bacteria; this is considered two impairments. This explains why the total number of impairments in Table 3.3 is greater than the number of water bodies in Category 5 in Table 3.1. Since a water body has multiple uses, it may fall into different categories for different uses. In that case, the overall category for the water body is the one with the highest category number.
The Integrated Report further divides Category 5 water bodies into subcategories, also shown in Table 3.2, to reflect additional options for addressing impairments:
X Water bodies in Category 5a have a TMDL underway, scheduled, or to be scheduled.
X Water bodies in Category 5b require a review of the water quality standards for the water body to be conducted be-fore a management strategy is selected.
X Water bodies in Category 5c require additional data and information to be collected or evaluated before a manage-ment strategy is selected.
Table 3.2 Subcategories of Category 5
in the 2014 Integrated Report Category Definition
5
5a —TMDL scheduled or underway
5b—Water Quality Standards review scheduled or underway or undergoing. Use Attainability Analysis
5c—Need additional monitoring
Summary of the 2014 Integrated ReportThe 2014 Integrated Report reviewed the water quality of 1,409 water bodies. Sufficient data was available to assess uses for 1,053 water bodies which resulted in 589 impairments (Table 3.3). Of the 1,409 water bodies, 401 were classified as Category 5 water bodies (Table 3.1). The number of water bodies classified as Category 5 was a slight decrease from the 2012 CWA Section 303(d) list, which included 410 water bod-ies, while the total number of impairments increased from 568 to 589 (Table 3.3).

20 NONPOINT SOURCE POLLUTION MANAGEMENT IN TEXAS | 2018 ANNUAL REPORT
Summary of Impairments on the 2014 Integrated ReportImpairments identified in the 2014 Integrated Report have been grouped by the parameter and the beneficial use of the water body affected (Table 3.3). Elevated levels of bacteria represent the majority of the listed impairments. Many of these bacteria im-pairments are the result of urban and agricultural nonpoint source pollution. Low dissolved oxygen, impairing many of the same water bodies, is also a leading cause of impairment.
Table 3.3 Summary of Impairments in the 2012 Versus 2014 Integrated Report
Impairment Group Media 2012 Number of
Impairments2014 Number of
Impairments Use
Bacteria
in water 257 243 recreation
in water 0 2 general use
in shellfish 15 8 oyster waters
beaches 1 2 beach use
Dissolved oxygen in water 90 96 aquatic life
Toxicityin ambient water 2 2
aquatic lifein ambient sediment 6 6
Organicsin water 0 0
fish consumption, aquatic lifein fish or shellfish 99 114
Metals (except mercury)
in water 4 6 fish consumption, oyster waters, aquatic lifein fish or shellfish 0 0
Mercuryin water 1 1 fish consumption, oyster
waters, aquatic lifein fish or shellfish 23 24
Dissolved solids
chloride 11 17
generalsulfate 9 12
total dissolved solids 14 18
Temperature in water 0 1 general
pH in water 17 17 general
Nutrients nitrogen 0 0 general, public water supply
Biological habitat, macrobenthic com-munity, or fish community 19 20 aquatic life
Totals 568 589
2016 and 2018 Integrated ReportsThe TCEQ released the 2016 Integrated Report for public com-ment in May of 2018. The 2016 Integrated Report was adopted by the Commission in fiscal year 2019. The TCEQ also initiated the development of the 2018 Integrated Report, convening the Guidance Advisory Workgroup to present information on proposals and gather input on the methods to be used to as-sess the water quality.
Continuous Water Quality MonitoringThe TCEQ has a network of continuous water quality monitor-ing sites on priority water bodies. The agency maintains 30-45 sites in its Continuous Water Quality Monitoring Network (CWQMN). The number and locations of sites varies from year to year. In fiscal year 2018, the TCEQ had 40 active sites as seen in Figure 3.3. At these sites, instruments measure basic water quality conditions every 15 minutes. The CWQMN monitoring
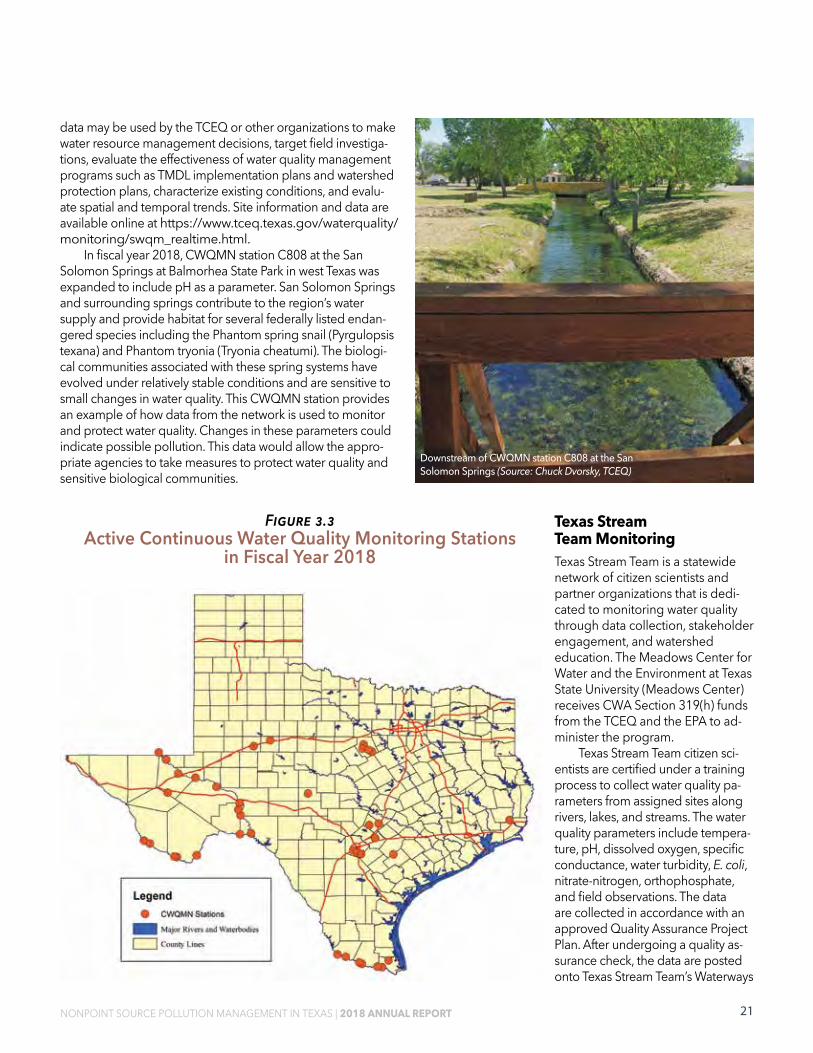
21NONPOINT SOURCE POLLUTION MANAGEMENT IN TEXAS | 2018 ANNUAL REPORT
data may be used by the TCEQ or other organizations to make water resource management decisions, target field investiga-tions, evaluate the effectiveness of water quality management programs such as TMDL implementation plans and watershed protection plans, characterize existing conditions, and evalu-ate spatial and temporal trends. Site information and data are available online at https://www.tceq.texas.gov/waterquality/monitoring/swqm_realtime.html.
In fiscal year 2018, CWQMN station C808 at the San Solomon Springs at Balmorhea State Park in west Texas was expanded to include pH as a parameter. San Solomon Springs and surrounding springs contribute to the region’s water supply and provide habitat for several federally listed endan-gered species including the Phantom spring snail (Pyrgulopsis texana) and Phantom tryonia (Tryonia cheatumi). The biologi-cal communities associated with these spring systems have evolved under relatively stable conditions and are sensitive to small changes in water quality. This CWQMN station provides an example of how data from the network is used to monitor and protect water quality. Changes in these parameters could indicate possible pollution. This data would allow the appro-priate agencies to take measures to protect water quality and sensitive biological communities.
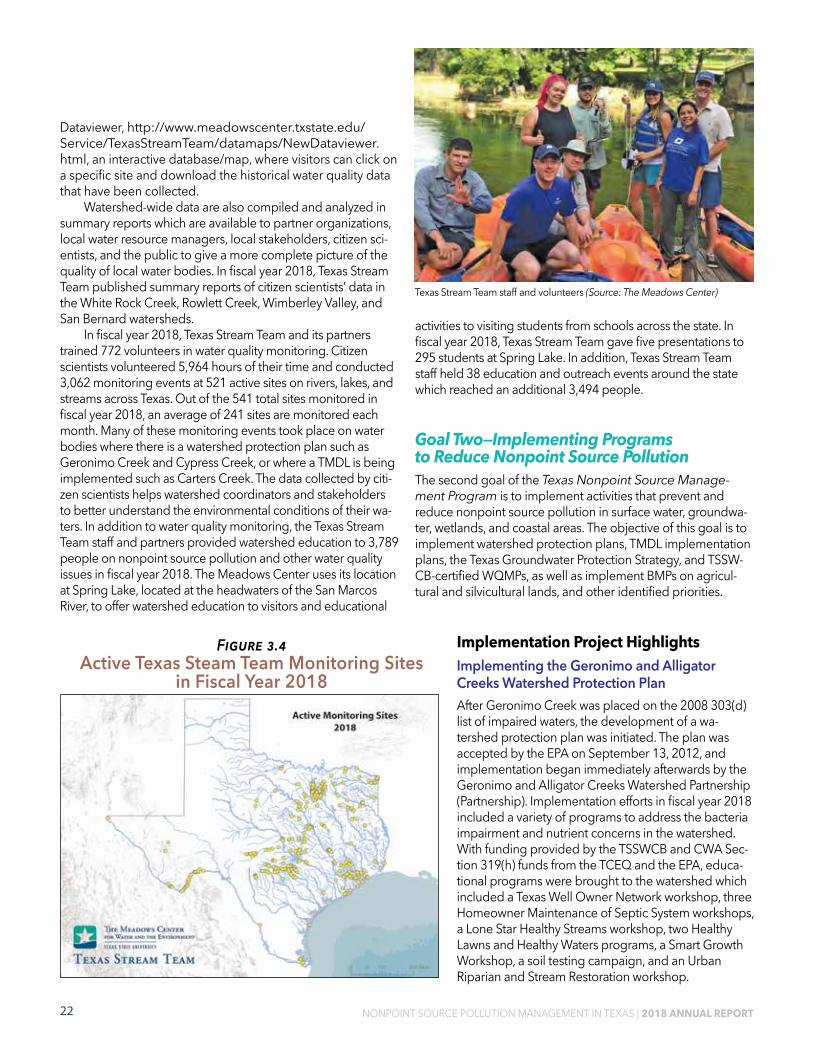
Texas Stream Team MonitoringTexas Stream Team is a statewide network of citizen scientists and partner organizations that is dedi-cated to monitoring water quality through data collection, stakeholder engagement, and watershed education. The Meadows Center for Water and the Environment at Texas State University (Meadows Center) receives CWA Section 319(h) funds from the TCEQ and the EPA to ad-minister the program.
Texas Stream Team citizen sci-entists are certified under a training process to collect water quality pa-rameters from assigned sites along rivers, lakes, and streams. The water quality parameters include tempera-ture, pH, dissolved oxygen, specific conductance, water turbidity, E. coli, nitrate-nitrogen, orthophosphate, and field observations. The data are collected in accordance with an approved Quality Assurance Project Plan. After undergoing a quality as-surance check, the data are posted onto Texas Stream Team’s Waterways
Figure 3.3 Active Continuous Water Quality Monitoring Stations
in Fiscal Year 2018
Downstream of CWQMN station C808 at the San Solomon Springs (Source: Chuck Dvorsky, TCEQ)
22 NONPOINT SOURCE POLLUTION MANAGEMENT IN TEXAS | 2018 ANNUAL REPORT
Dataviewer, http://www.meadowscenter.txstate.edu/Service/TexasStreamTeam/datamaps/NewDataviewer.html, an interactive database/map, where visitors can click on a specific site and download the historical water quality data that have been collected.
Watershed-wide data are also compiled and analyzed in summary reports which are available to partner organizations, local water resource managers, local stakeholders, citizen sci-entists, and the public to give a more complete picture of the quality of local water bodies. In fiscal year 2018, Texas Stream Team published summary reports of citizen scientists’ data in the White Rock Creek, Rowlett Creek, Wimberley Valley, and San Bernard watersheds.
In fiscal year 2018, Texas Stream Team and its partners trained 772 volunteers in water quality monitoring. Citizen scientists volunteered 5,964 hours of their time and conducted 3,062 monitoring events at 521 active sites on rivers, lakes, and streams across Texas. Out of the 541 total sites monitored in fiscal year 2018, an average of 241 sites are monitored each month. Many of these monitoring events took place on water bodies where there is a watershed protection plan such as Geronimo Creek and Cypress Creek, or where a TMDL is being implemented such as Carters Creek. The data collected by citi-zen scientists helps watershed coordinators and stakeholders to better understand the environmental conditions of their wa-ters. In addition to water quality monitoring, the Texas Stream Team staff and partners provided watershed education to 3,789 people on nonpoint source pollution and other water quality issues in fiscal year 2018. The Meadows Center uses its location at Spring Lake, located at the headwaters of the San Marcos River, to offer watershed education to visitors and educational
activities to visiting students from schools across the state. In fiscal year 2018, Texas Stream Team gave five presentations to 295 students at Spring Lake. In addition, Texas Stream Team staff held 38 education and outreach events around the state which reached an additional 3,494 people.
Goal Two—Implementing Programs to Reduce Nonpoint Source PollutionThe second goal of the Texas Nonpoint Source Manage-ment Program is to implement activities that prevent and reduce nonpoint source pollution in surface water, groundwa-ter, wetlands, and coastal areas. The objective of this goal is to implement watershed protection plans, TMDL implementation plans, the Texas Groundwater Protection Strategy, and TSSW-CB-certified WQMPs, as well as implement BMPs on agricul-tural and silvicultural lands, and other identified priorities.
Implementation Project HighlightsImplementing the Geronimo and Alligator Creeks Watershed Protection PlanAfter Geronimo Creek was placed on the 2008 303(d) list of impaired waters, the development of a wa-tershed protection plan was initiated. The plan was accepted by the EPA on September 13, 2012, and implementation began immediately afterwards by the Geronimo and Alligator Creeks Watershed Partnership (Partnership). Implementation efforts in fiscal year 2018 included a variety of programs to address the bacteria impairment and nutrient concerns in the watershed. With funding provided by the TSSWCB and CWA Sec-tion 319(h) funds from the TCEQ and the EPA, educa-tional programs were brought to the watershed which included a Texas Well Owner Network workshop, three Homeowner Maintenance of Septic System workshops, a Lone Star Healthy Streams workshop, two Healthy Lawns and Healthy Waters programs, a Smart Growth Workshop, a soil testing campaign, and an Urban Riparian and Stream Restoration workshop.
Figure 3.4 Active Texas Steam Team Monitoring Sites
in Fiscal Year 2018
Texas Stream Team staff and volunteers (Source: The Meadows Center)

23NONPOINT SOURCE POLLUTION MANAGEMENT IN TEXAS | 2018 ANNUAL REPORT
The 6th Annual Creek Clean Up Event took place in April 2018. Over 100 volunteers helped to remove 1,800 lbs of trash and debris from the watershed. Since its inception, over 1,100 volunteers have removed 15,950 lbs of trash and debris from the watershed.
Through CWA Section 319(h) funds from the TCEQ and the EPA, the Partnership took part in an Urban Riparian and Stream Restoration project, which provided revegetation with native species in a section of Geronimo Creek at the Irma Lewis Seguin Outdoor Learning Center. The study will evaluate pos-sible differences in erosion rates between restored areas and the rest of the creek. Automatic water samplers were installed and will collect water quality data over the next two years to document any changes
The Partnership has partnered with Guadalupe County and the Meadows Center to deliver feral hog abatement and education to local landowners which includes a bounty program with funding provided by the Texas A&M AgriLife Extension Service Wildlife Services.
Implementing the Arroyo Colorado Watershed Protection Plan at Los Fresnos High School and Nature ParkThe Arroyo Colorado Watershed Protection Plan was accepted by the EPA in fiscal year 2018. The TWRI partnered with the City of Los Fresnos to implement urban stormwater management measures included in the Arroyo Colorado Watershed Protec-tion Plan. Using CWA Section 319(h) funds from the TCEQ and the EPA, the project installed LID practices and conducted education and outreach at the City of Los Fresnos Nature Park and Los Fresnos High School. The sites are in the riparian area of Resaca Escondida, located in the Arroyo Colorado water-shed. Resacas are natural, intermittently-flowing, strongly me-andering water bodies that historically developed as shallow disconnected channels dissipating Rio Grande floodwaters.
In 2018, the TWRI installed a bioswale and pervious walk-ing trails at the City of Los Fresnos Nature Park using CWA Sec-tion 319(h) funds from the TCEQ and the EPA. In addition to the new features, the TWRI coordinated with the Texas Stream Team to train students at Los Fresnos High School. The train-
ing was conducted by recently certified Texas Stream Team trainers from the University of Texas Rio Grande Valley, another partner of the Arroyo Colorado Watershed Protection Plan. A rainwater harvesting system and educational signage will also be installed at the Nature Park. Los Fresnos High School stu-dents will use the park as an outdoor classroom for a variety of natural resource-based classwork. As part of this project, a BMP treatment train will be installed at Los Fresnos High School.
The Arroyo Colorado Watershed Coordinator continues to conduct education and outreach efforts in the watershed, facili-tating and supporting partner communication and cooperation, while raising public awareness of nonpoint source pollution. For more information on activities and upcoming events in the Ar-royo Colorado watershed visit http://arroyocolorado.org/.
Total Maximum Daily Loads and Implementation PlansThe TMDL Program develops targets for reducing pollution and helps communities build plans to improve water quality in local waterways. TMDL implementation plans may be devel-oped concurrently with TMDLs to leverage resources and in-crease the pace at which Texas improves impaired waterways. In fiscal year 2018, the TMDL Program continued to implement
Geronimo and Alligator Creeks Septic System Workshop (Source: Ryan Gerlich, Texas A&M AgriLife)
Urban Riparian and Stream Restoration Demonstration Project (Source: Clare Entwistle, TWRI)
24 NONPOINT SOURCE POLLUTION MANAGEMENT IN TEXAS | 2018 ANNUAL REPORT
the CWA Section 303(d) Vision. The CWA Section 303(d) Vi-sion enhances overall efficiency of the CWA 303(d) Program and focuses attention on priority waters. The CWA Section 303(d) Vision provides states flexibility in using available tools such as TMDLs, TMDL implementation plans, and water-shed protection plans to attain water quality restoration and protection. In fiscal year 2018 the TCEQ Nonpoint Source Program, the TMDL Program, and the TSSWCB coordinated and worked with stakeholders to develop watershed protec-tion plans in addition to TMDLs and TMDL implementation plans in three watersheds.
Stakeholders provide local expertise for identifying site-specific problems, targeting areas for attention, and deter-mining what management measures will be most effective. Ultimately, it is stakeholders who implement the plans to improve water quality in the rivers, lakes, and bays and achieve long-term success. Several TMDL implementation plans that address nonpoint sources of pollution are supported by CWA Section 319(h) funds.
Texas Coastal Management ProgramThe Texas Coastal Management Program (TXCMP) was created to improve coastal management between local, state, and fed-eral entities that manage various aspects of coastal resource use. The TXCMP’s mission is to ensure the long-term economic and ecological productivity of the coast. The Texas General Land Office (GLO) administers the TXCMP and is advised by members of the Coastal Coordination Advisory Committee which includes staff from the TCEQ, TSSWCB, Texas Parks and Wildlife, and the Texas Department of Transportation (TxDOT).
The Coastal Zone Act Reauthorization Amendments (CZARA), Section 6217 of the Federal Coastal Management Act, requires states with approved coastal management plans to develop and implement a federally approved program to control nonpoint source pollution in the coastal zone. CZARA requires implementation of 56 management measures across all nonpoint source categories (e.g. urban, forestry, agriculture, hydromodification, construction runoff) to achieve and maintain water quality standards. Management measures are included in the Texas Coastal Nonpoint Source Pollution Control Program. The majority of the management measures have been ap-proved by the National Oceanic and Atmospheric Association (NOAA) and EPA; however, several still need to be addressed. These management measures involve septic system inspec-tions, urban runoff, and non-TxDOT roads, highways, and bridges. The GLO and TCEQ continue to work with the EPA and NOAA to implement the Texas Coastal Nonpoint Source Pollution Control Program and address these outstanding mea-sures. Final approval of the program is expected to occur in the summer of 2019. The outstanding management measures are discussed in more detail in the following sections.
Septic SystemsThe Texas Coastal Nonpoint Source Pollution Control Program is implementing several projects to help satisfy CZARA Section 6217(g) requirements to inspect septic systems in the coastal zone. In fiscal year 2018 Texas A&M AgriLife Extension, with CWA Section 319(h) funding from the TCEQ and the EPA, implemented a project to update the Coastal On-site Sewage Inventory (COSSI) database. The COSSI database stores septic system information such as location, age, type, if the system is regulated, and if it has been inspected. This database helps the state efficiently direct funding and resources to designated areas.
In fiscal year 2018, efforts were concentrated on finalizing a strategy to implement the septic system management measure for submittal to NOAA and EPA in fiscal year 2019. The strategy includes a five-pronged approach to inspecting septic systems; 1. inspections completed through Authorized Agents, 2. inspections completed under watershed-based plans, 3. point-of-sale real estate inspections, 4. contracting directly with septic system inspectors using
CWA Section 319(h) funding, and 5. encouraging homeowners and Authorized Agents to report
the maintenance of septic systems. Education and outreach to homeowners will be a large
part of this effort. Using this strategy, the state estimates that the required amount of inspections will be obtained in a 15-year timeframe.
Multi-Management Measure Program and the Coastal Stormwater Management ManualIn fiscal year 2018, Texas continued work on an inventory of urban runoff management practices currently used in the coastal zone to determine areas where Section 6217 manage-ment measures are not met. Based on this information, Texas has begun to develop a comprehensive implementation plan that is designed to obtain compliance with the CZARA Section 6217(g) requirements for the urban runoff and non-TxDOT roads, highways, and bridges management measures. The multi-management measure program will target community officials with jurisdictional responsibilities for managing urban runoff and coastal non-TxDOT roadways, land owners, land developers, engineers, financiers, and other local land develop-ment professionals and interest groups to emphasize the goal of institutionalizing the use of sustainable stormwater management practices. Texas is developing a Coastal Stormwater Manage-ment Manual that will accompany the multi-management mea-sure program to provide additional guidance and resources to coastal communities and other entities. The combined manage-ment measures and the stormwater manual will be submitted to NOAA and EPA for approval in the summer of 2019.
25NONPOINT SOURCE POLLUTION MANAGEMENT IN TEXAS | 2018 ANNUAL REPORT
Estuary Programs in TexasGalveston Bay Estuary ProgramThe Galveston Bay Estuary Program (GBEP) is one of 28 National Estuary Programs in the United States and works with local stakeholders to provide comprehensive ecosystem management through collaborative partnerships to ensure preservation of the bay’s multiple uses. Specifically, the GBEP is charged with implementing The Galveston Bay Plan—a Com-prehensive Conservation Management Plan for Galveston Bay. The GBEP addresses nonpoint source pollution through development and implementation of watershed protection plans, nonpoint source outreach and education, and structural and nonstructural water quality improvement BMPs.
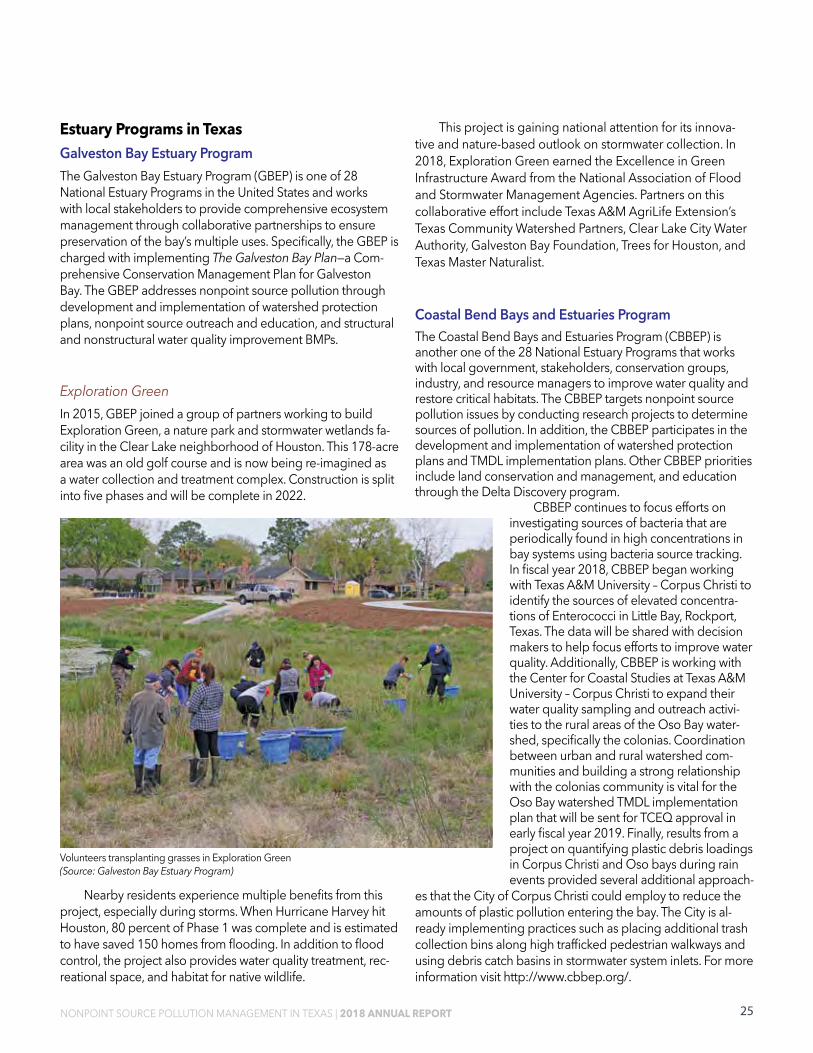
Exploration GreenIn 2015, GBEP joined a group of partners working to build Exploration Green, a nature park and stormwater wetlands fa-cility in the Clear Lake neighborhood of Houston. This 178-acre area was an old golf course and is now being re-imagined as a water collection and treatment complex. Construction is split into five phases and will be complete in 2022.
Nearby residents experience multiple benefits from this project, especially during storms. When Hurricane Harvey hit Houston, 80 percent of Phase 1 was complete and is estimated to have saved 150 homes from flooding. In addition to flood control, the project also provides water quality treatment, rec-reational space, and habitat for native wildlife.
This project is gaining national attention for its innova-tive and nature-based outlook on stormwater collection. In 2018, Exploration Green earned the Excellence in Green Infrastructure Award from the National Association of Flood and Stormwater Management Agencies. Partners on this collaborative effort include Texas A&M AgriLife Extension’s Texas Community Watershed Partners, Clear Lake City Water Authority, Galveston Bay Foundation, Trees for Houston, and Texas Master Naturalist.
Coastal Bend Bays and Estuaries ProgramThe Coastal Bend Bays and Estuaries Program (CBBEP) is another one of the 28 National Estuary Programs that works with local government, stakeholders, conservation groups, industry, and resource managers to improve water quality and restore critical habitats. The CBBEP targets nonpoint source pollution issues by conducting research projects to determine sources of pollution. In addition, the CBBEP participates in the development and implementation of watershed protection plans and TMDL implementation plans. Other CBBEP priorities include land conservation and management, and education through the Delta Discovery program.
CBBEP continues to focus efforts on investigating sources of bacteria that are periodically found in high concentrations in bay systems using bacteria source tracking. In fiscal year 2018, CBBEP began working with Texas A&M University – Corpus Christi to identify the sources of elevated concentra-tions of Enterococci in Little Bay, Rockport, Texas. The data will be shared with decision makers to help focus efforts to improve water quality. Additionally, CBBEP is working with the Center for Coastal Studies at Texas A&M University – Corpus Christi to expand their water quality sampling and outreach activi-ties to the rural areas of the Oso Bay water-shed, specifically the colonias. Coordination between urban and rural watershed com-munities and building a strong relationship with the colonias community is vital for the Oso Bay watershed TMDL implementation plan that will be sent for TCEQ approval in early fiscal year 2019. Finally, results from a project on quantifying plastic debris loadings in Corpus Christi and Oso bays during rain events provided several additional approach-
es that the City of Corpus Christi could employ to reduce the amounts of plastic pollution entering the bay. The City is al-ready implementing practices such as placing additional trash collection bins along high trafficked pedestrian walkways and using debris catch basins in stormwater system inlets. For more information visit http://www.cbbep.org/.
Volunteers transplanting grasses in Exploration Green (Source: Galveston Bay Estuary Program)

26 NONPOINT SOURCE POLLUTION MANAGEMENT IN TEXAS | 2018 ANNUAL REPORT
Texas Groundwater Protection CommitteeGroundwater is a major source of water in Texas, providing about 62% of the 16.5 million acre-feet of water used in the state. Texas’ groundwater is used as drinking water for people and livestock, irrigation for crops, and in mining and industrial processes. It also serves as habitat for plants and animals, some of which are endangered species. The Texas Groundwa-ter Protection Committee (TGPC) was established by the Texas Legislature in 1989 as an interagency committee to manage this essential resource. The TGPC consists of nine state entities and an association of groundwater districts. The TGPC strives to improve interagency coordination in the area of groundwa-ter quality protection and continues developing and updating the comprehensive groundwater protection strategy for the state. The TGPC also identifies areas where new programs could be created, or existing programs could be enhanced, to provide added protection.
Two subcommittees, the Groundwater Issues Subcom-mittee and the longstanding Public Outreach and Education Subcommittee, execute the majority of the TGPC’s responsi-bilities. Both the Groundwater Issues Subcommittee and the main TGPC have standing agenda items at every meeting for discussion of nonpoint source pollution issues. The Groundwa-ter Issues Subcommittee oversees the cooperative groundwa-ter monitoring program for pesticides in groundwater, which monitors aquifer conditions for select pesticides of interest.
Because contamination of groundwater is easier to prevent than it is to clean up, the TGPC emphasizes groundwater aware-ness in their outreach and education efforts. Targeting primarily rural Texans, the Public Outreach and Education Subcommit-tee worked with partner agency Texas A&M AgriLife Extension Service to develop Fact Sheets and Frequently Asked Ques-tions that include nonpoint source pollution information and management practices. Several thousand copies of the Fact Sheets were distributed during visits to the TGPC’s traveling dis-play during five statewide events in fiscal year 2018. The TGPC supported Texas A&M AgriLife Extension Service in conducting several educational events for water well owners and dissemi-nating literature while screening water well samples from nine counties for basic groundwater quality data. For more informa-tion visit the TGPC’s website at http://tgpc.state.tx.us/.
Clean Water State Revolving Fund Loans for Nonpoint Source ProjectsAnother tool available in Texas for addressing nonpoint source pollution is the Clean Water State Revolving Fund (CWSRF), which is administered by the Texas Water Develop-ment Board (TWDB). The CWSRF is a financing program au-thorized under the federal CWA and is partially capitalized by an annual grant from the EPA. This program provides funding assistance in the form of up to 30-year loans at interest rates lower than the market offers, as well as a limited amount of
funds which do not have to be repaid. The funds that do not have to be repaid are available to disadvantaged communi-ties as well as for green projects. Although most of the funds finance publicly owned wastewater treatment and collection systems, the TWDB can also use the CWSRF for nonpoint source pollution abatement and stormwater projects. Funds are available to cities, counties, groundwater conservation districts, Soil and Water Conservation Districts, and other public agencies, as well as to nonprofit organizations, mainly water supply and/or sewer service corporations.
A water quality-based priority system is used to rank po-tential applicants and fund projects, including nonpoint source projects. To be eligible, a nonpoint source project must be an identified practice within a WQMP, TMDL implementation plan, or watershed protection plan; a nonpoint source manage-ment activity that has been identified in the Texas Groundwater Protection Strategy; or a BMP identified in the Texas Nonpoint Source Management Program or the National Estuary Program. All applications are initiated with TWDB, and then reviewed by a TCEQ staff in cooperation with Councils of Government participating in the CWA Section 604(b) Grant to ensure confor-mance with the Texas WQMP. Loans can be used for planning, designing, acquiring, and constructing wastewater treatment facilities, wastewater recycling and reuse facilities, and collec-tion systems. Other activities eligible for funding assistance include agricultural, rural, and urban runoff control; estuary improvement; nonpoint source education; and wet weather flow control, including stormwater management activities.
Staff members from the TWDB, the TCEQ, and the TSSW-CB meet regularly to coordinate efforts to identify water bodies that are impacted by nonpoint source pollutants and to identify potential applicants for CWSRF assistance. They also identify po-tential candidates for Green Project Reserve funding, which can provide some loan forgiveness if LID practices are constructed.
Goal Three—EducationThe third goal of the Texas Nonpoint Source Management Program is to conduct education and technology transfer activities to raise awareness of nonpoint source pollution and activities that contribute to the degradation of water bodies by nonpoint source pollution. Education is a critical aspect of managing nonpoint source pollution. Public outreach and technology transfer are integral components of every water-shed protection plan, TMDL, and implementation plan. This section highlights some of the nonpoint source education and public outreach activities conducted in fiscal year 2018.
Coastal Communities Nonpoint Source Pollution Prevention Outreach ProjectThe Houston-Galveston Area Council’s (H-GAC) Coastal Com-munities program provides resources and support for small

27NONPOINT SOURCE POLLUTION MANAGEMENT IN TEXAS | 2018 ANNUAL REPORT
communities in coastal watersheds of the upper Texas Gulf Coast region. The program helps small communities engage residents to reduce nonpoint source pollution. The four pillars of this education and outreach program are pet waste; fats, oils, and grease disposal; litter and illegal dumping; and septic system repair and maintenance.
Project staff identified communities in two EPA-accepted watershed protection plan areas, Bastrop Bayou and Double Bayou, to participate in the project. By early 2018, after Hur-ricane Harvey caused severe flooding in both project water-sheds, community needs assessments were conducted with the H-GAC water resources outreach coordinator to determine specific needs for each community.
In fiscal year 2018, year one of the three-year project, H-GAC project staff launched a comprehensive website contain-ing education and outreach materials, resources to evaluate nonpoint source reduction needs, funding opportunities, and the promotion of partnership programs and materials. An open house was held to connect regional water quality orga-nizations with city staff which served as the first meeting of a pollution prevention outreach work group. This work group will meet regularly to plan and execute education and outreach along the coast. The work group created a public outreach plan and roadmap to help city staff meet timely messaging goals in an easy-to-use format for print, social media, and event outreach. H-GAC staff will continue to connect with community leaders, develop new outreach materials, attend local events, and enhance the website in years two and three of the project. For more information visit the project website at http://www.coastalcommunitiestx.com/.
Riparian and Stream Ecosystem Education ProgramThe TWRI, a part of Texas A&M AgriLife, was awarded CWA Section 319(h) funds from the TSSWCB and EPA to conduct Ri-parian and Stream Ecosystem education programs across the state. To implement this project, the TWRI has partnered with
the TSSWCB, Texas Riparian Association, Texas A&M AgriLife Extension Service, Texas A&M Forest Service, Texas Parks and Wildlife Department, NRCS, Texas A&M Natural Resource Insti-tute, Texas Comptroller of Public Accounts, and others.
To improve the management of riparian areas across Texas, the Riparian and Stream Ecosystem education program provides the opportunity for landowners and land managers to understand the function and benefits of riparian zones and BMPs. The program website includes online tools and educa-tion modules and in fiscal year 2018 had 7,472 blog subscrib-ers at http://www.texasriparian.org/ and http:// naturalresourcestraining.tamu.edu/courses/texas- riparian/. The Riparian and Stream Ecosystem education pro-gram maintains a listserv with 360 members and a Facebook page with 1,143 followers that serve as outlets for disseminat-ing information. Workshops are conducted in watersheds where watershed protection plans and TMDLs are being implemented. In fiscal year 2018, workshops were conducted in the following watersheds: Lavon Lake and Denton County, Plum Creek, Lower Nueces River, Mill Creek, San Jacinto River, Cibolo Creek, Mission/Aransas and Goliad County, and Lower Colorado River/Tres Palacios Creek. A total of 378 people participated in eight workshops.
Course evaluations were received from 79% of participants. The evaluations showed high satisfaction ratings with 99% of the respondents being mostly or completely satisfied with the program and the quality of course material. Evaluation responses showed that 99% of respondents would recommend the
above: Riparian and Stream Ecosystem Education Program indoor session in Goliad (Source: Michael Schramm, TWRI)
left: Riparian and Stream Ecosystem Education Program outdoor session along the Medina River (Source: Clare Entwistle, TWRI)

28 NONPOINT SOURCE POLLUTION MANAGEMENT IN TEXAS | 2018 ANNUAL REPORT
program to others, and 97% said they plan to adopt BMPs dis-cussed during the training, specifically reducing bare ground, feral hog management, and herbaceous riparian buffers. The course resulted in overall knowledge gained by 10% with a mean score on pre-tests of 83.6 while the mean score on post-tests was 91.1. Almost half of respondents said they believed they might benefit economically from this program in the future. Evaluation responses showed that 157 people owned or managed land totaling to 305,810 acres.
Watershed-Based Feral Hog Management In fiscal year 2018, the Lone Star Healthy Streams Feral Hog program continued the promotion of healthy watersheds through face-to-face educational programming, distance-based education, resource creation, interagency collabora-tions, and social media outreach. The program focused on increasing the understanding and knowledge of feral hog biology, their economic impact, methods of removal, laws and regulations related to feral hog management in Texas, and overall awareness. One-on-one technical assistance was also provided to landowners to increase the efficacy of their abatement efforts. Priority watersheds were targeted to reduce damages in areas where feral hogs had the greatest potential to contribute to water quality issues. The Lone Star Healthy Streams Feral Hog program is funded by CWA Section 319(h) funds from the TSSWCB and EPA, and activities were facilitated by the Texas A&M AgriLife Extension Service and the Texas A&M Natural Resources Institute. An Extension Associate was employed centrally and located near priority watersheds.
Forty feral hog programs were conducted in fiscal year 2018. These programs were delivered within target water-sheds throughout Texas and an international conference poster presentation was given in Oklahoma. Additionally, one
remotely administered online training was conducted in priority watersheds across Texas A&M AgriLife’s District 8 of central Texas. Educational programming reached a total of 2,180 attendees and resulted in 2,668 direct contact hours. Three direct technical assistance site visits were conducted. Post program evaluations showed that 88.3 percent of sur-veyed participants reported knowledge gained concerning feral hog biology, legal control options, efficient trap/bait techniques, and the types and extent of feral hog damage. The statewide online feral hog reporting tool documented a total of 107 hogs based on 20 total reports.
Educational resource media created in fiscal year 2018 included a new feral hog website, three “Wild Pig Newsletters” sent to 339 subscribers and 6,514 readers via Facebook, seven blog articles with 2,062 reads, four videos, two extension pub-lications, and one educational feral hog international confer-ence poster. The Lone Star Healthy Streams Feral Hog pro-gram’s Facebook page received 571 “Likes” with a total reach of 201,500 users and the Twitter page gained 51 new follow-ers. A total of five AgriLife Communication news releases and three news media interviews further promoted the educational programs and feral hog abatement within priority watersheds.
Lone Star Healthy Streams Feral Hog program staff maintained working relationships with watershed coordina-tors, project managers, and other personnel across the state through both face-to-face and online collaborations. Staff also served as specialists, providing expertise in feral hog related educational programming and field-based technical assistance to County Extension Agents associated with the Texas A&M AgriLife Extension Service. Collaborations among multiple federal and state agencies and public organizations increased the effectiveness and outreach of this program. For instance, organizations such as the TWRI, Texas A&M Natural Resources Institute, NRCS, Texas Parks and Wildlife Department, Texas Animal Health Commission, United States Department of
Agriculture-Animal and Plant Health Inspec-tion Service, Texas Wildlife Services, Texas Department of Agriculture, Wildlife Manage-ment Associations, various private home own-ers associations, and Texas Master Naturalist chapters assisted in programming, resource creation, and/or dissemination of feral hog educational resources.
Healthy Lawns and Healthy WatersHealthy Lawns and Healthy Waters is a new educational program that aims to improve and protect surface water quality by enhancing Texans’ awareness and knowledge of BMPs for residential landscapes. Through a partner-ship between Texas A&M AgriLife Extension Service’s Soil & Crop Sciences Department
Wild pig in water (Source: Texas A&M National Resources Institute)

29NONPOINT SOURCE POLLUTION MANAGEMENT IN TEXAS | 2018 ANNUAL REPORT
and the TWRI, funded with CWA Section 319(h) funds from the TCEQ and the EPA, Healthy Lawns and Healthy Waters fo-cuses on protecting water quality by reducing runoff through rainwater capture and delivering information on ecologically-appropriate turf species, and quantities and timing of inputs to residential lawns. Participants also receive a free soil test analysis through the Texas A&M AgriLife Extension Soil, Water, and Forage Testing Laboratory. Through this program, Texans have a better understanding of the relationships between practices at their residence and the quantity and quality of water in the watershed.
Workshop participants learn how to design and install residential rainwater capture devices, the importance of choosing climate- and soil-appropriate turf and landscaping species, the importance of soil testing, and how to determine appropriate nutrient application amounts. The training also covers how to improve irrigation water use efficiency through a better understanding of evapotranspiration, smart meters, deficit irrigation, and cycle-soak methods for reducing runoff. In fiscal year 2018, six training events were delivered to 221 participants in five central Texas watersheds with impairments for bacteria and concerns for nutrients. Additionally, 95 soil tests were submitted for analysis.
Pre- and post-tests administered at the trainings measured knowledge gained by participants. On average, participant program test scores increased by 33%. Following the training, program evaluations indicate that 92% of participants plan to fertilize based on soil test recommendations, 83% will install a rainwater capture system, 79% will improve their home ir-rigation system management, and 90% plan to select plants and grass based on water conservation. Six months following the training, 57% of respondents indicated that they reduced their fertilizer use and 92% of respondents either installed a rainwater capture system or were planning installations. The Healthy Lawns and Healthy Waters training received satisfac-
tory responses from 95% of respondents. Information about rainwater harvesting, turf grass management, and upcoming trainings is available by visiting hlhw.tamu.edu.
above: Turf grass management plots (Source: Texas A&M AgriLife Research)
left: Healthy Lawns and Healthy Waters (Source: Texas A&M AgriLife Research)
Sunset on the Upper Gulf Coast (Source: H-GAC)

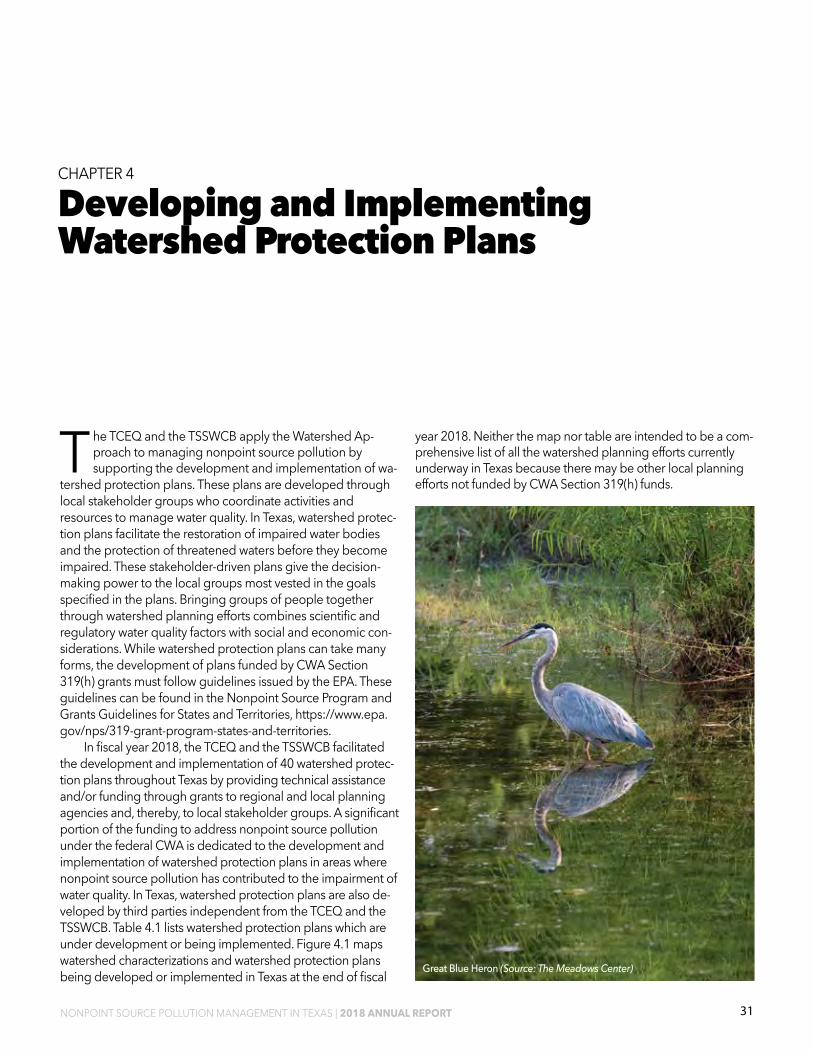
CHAPTER 4
Developing and Implementing Watershed Protection Plans
31
The TCEQ and the TSSWCB apply the Watershed Ap-proach to managing nonpoint source pollution by supporting the development and implementation of wa-
tershed protection plans. These plans are developed through local stakeholder groups who coordinate activities and resources to manage water quality. In Texas, watershed protec-tion plans facilitate the restoration of impaired water bodies and the protection of threatened waters before they become impaired. These stakeholder-driven plans give the decision-making power to the local groups most vested in the goals specified in the plans. Bringing groups of people together through watershed planning efforts combines scientific and regulatory water quality factors with social and economic con-siderations. While watershed protection plans can take many forms, the development of plans funded by CWA Section 319(h) grants must follow guidelines issued by the EPA. These guidelines can be found in the Nonpoint Source Program and Grants Guidelines for States and Territories, https://www.epa.gov/nps/319-grant-program-states-and-territories.
In fiscal year 2018, the TCEQ and the TSSWCB facilitated the development and implementation of 40 watershed protec-tion plans throughout Texas by providing technical assistance and/or funding through grants to regional and local planning agencies and, thereby, to local stakeholder groups. A significant portion of the funding to address nonpoint source pollution under the federal CWA is dedicated to the development and implementation of watershed protection plans in areas where nonpoint source pollution has contributed to the impairment of water quality. In Texas, watershed protection plans are also de-veloped by third parties independent from the TCEQ and the TSSWCB. Table 4.1 lists watershed protection plans which are under development or being implemented. Figure 4.1 maps watershed characterizations and watershed protection plans being developed or implemented in Texas at the end of fiscal Great Blue Heron (Source: The Meadows Center)
NONPOINT SOURCE POLLUTION MANAGEMENT IN TEXAS | 2018 ANNUAL REPORT
year 2018. Neither the map nor table are intended to be a com-prehensive list of all the watershed planning efforts currently underway in Texas because there may be other local planning efforts not funded by CWA Section 319(h) funds.
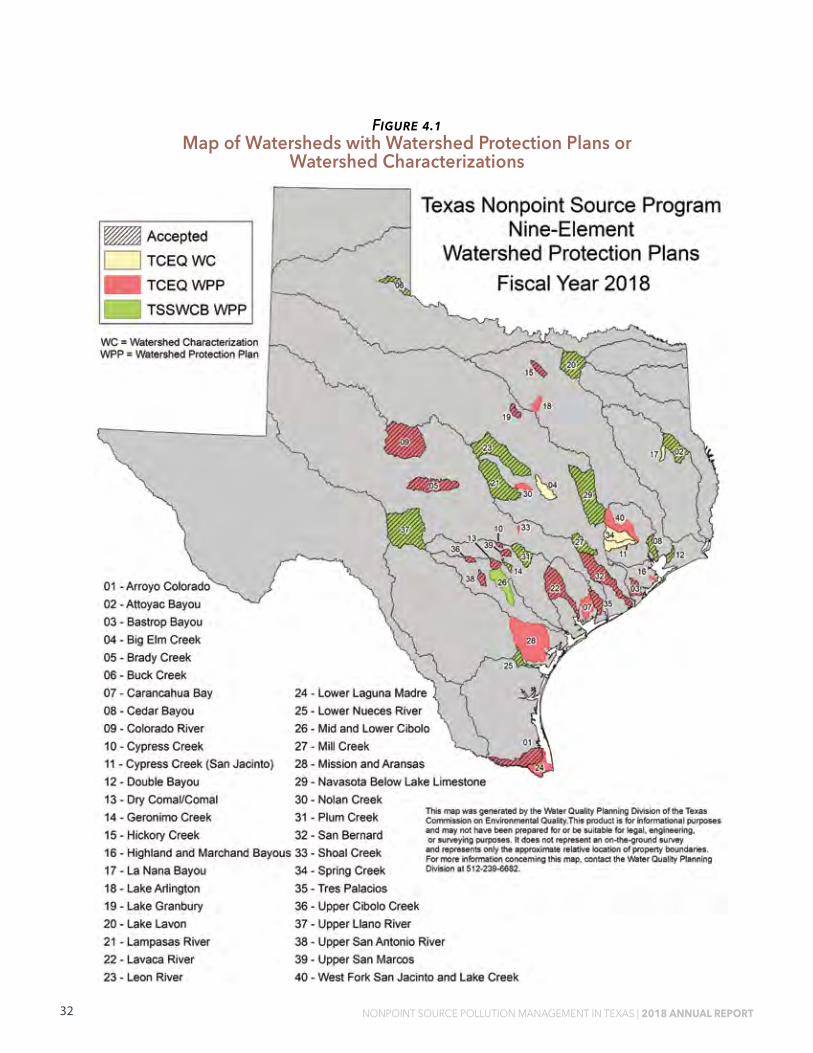
Figure 4.1 Map of Watersheds with Watershed Protection Plans or
Watershed Characterizations
32 NONPOINT SOURCE POLLUTION MANAGEMENT IN TEXAS | 2018 ANNUAL REPORT

33
table continued on next page
NONPOINT SOURCE POLLUTION MANAGEMENT IN TEXAS | 2018 ANNUAL REPORT
Table 4.1 Watershed Protection Plans Completed or Under Development in Texas
TSSWCB WPPs Links
Attoyac Bayou http://attoyac.tamu.edu/
Buck Creek http://buckcreek.tamu.edu/
Cedar Bayou http://www.cedarbayouwatershed.com/
Double Bayou http://www.doublebayou.org/
Geronimo Creek http://www.geronimocreek.org/
Lake Lavon https://www.ntmwd.com/watershed-planning/
Lampasas River http://www.lampasasriver.org/
Leon River http://leonriver.tamu.edu/our-watershed/
Lower Nueces River http://www.nuecesriverpartnership.org/
Mid and Lower Cibolo Creek http://cibolo.tamu.edu/
Mill Creek http://millcreek.tamu.edu/
Navasota River http://navasota.tamu.edu/
Plum Creek http://plumcreek.tamu.edu/
Upper Llano River https://www.depts.ttu.edu/junction/lrfs/ULRWPP.php
TCEQ WPPs Links
Arroyo Colorado http://arroyocolorado.org/watershed-protection-plan/
Bastrop Bayou http://www.bastropbayou.org/
Brady Creek http://www.ucratx.org/brady.html
Carancahua Bay http://matagordabasin.tamu.edu/carancahua-bay/
Colorado River Below EV Spence Reservoir https://www.tceq.texas.gov/assets/public/waterquality/nps/watersheds/ColoradoRiverBelowEVSpenceTMDL_BridgeDoc_Final.pdf
Cypress Creek (Segment 1815) http://www.cypresscreekproject.net/
Dry Comal/Comal River http://www.nbtexas.org/1914/Watershed-Protection-Planning
Hickory Creekhttps://www.cityofdenton.com/CoD/media/City-of-Denton/Residents/Make%20a%20Difference/Watershed%20Protection/HCWPP_Final_with_2016_Addendum-1.pdf
Highland Bayou & Moses-Karankawa Bayous http://www.agrilife.org/highlandbayou/
Lake Arlington/Village Creek http://www.trinityra.org/lakearlingtonvillagecreek
Lake Granbury https://www.brazos.org/About-Us/Water-Quality/Watershed-Protection-Plans/Lake-Granbury-WPP
Lavaca River http://matagordabasin.tamu.edu/lavaca/
Lower Laguna Madre/Brownsville Ship Channel http://www.arroyocolorado.org/lower-laguna-madrebrownsville-ship-channel-watershed/
Mission and Aransas Rivers https://www.tceq.texas.gov/waterquality/tmdl/42-copano.html
Nolan Creek http://www.nolancreekwpp.com
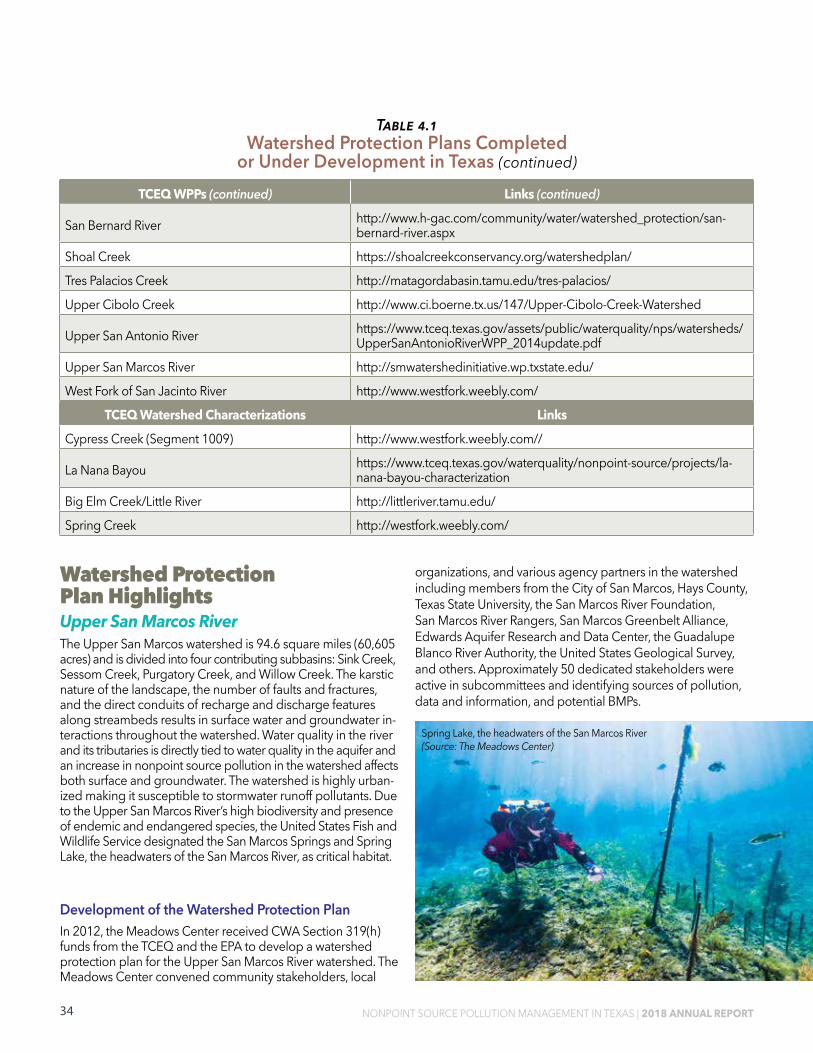
34
Table 4.1 Watershed Protection Plans Completed
or Under Development in Texas (continued)
NONPOINT SOURCE POLLUTION MANAGEMENT IN TEXAS | 2018 ANNUAL REPORT
TCEQ WPPs (continued) Links (continued)
San Bernard River http://www.h-gac.com/community/water/watershed_protection/san-bernard-river.aspx
Shoal Creek https://shoalcreekconservancy.org/watershedplan/
Tres Palacios Creek http://matagordabasin.tamu.edu/tres-palacios/
Upper Cibolo Creek http://www.ci.boerne.tx.us/147/Upper-Cibolo-Creek-Watershed
Upper San Antonio River https://www.tceq.texas.gov/assets/public/waterquality/nps/watersheds/UpperSanAntonioRiverWPP_2014update.pdf
Upper San Marcos River http://smwatershedinitiative.wp.txstate.edu/
West Fork of San Jacinto River http://www.westfork.weebly.com/
TCEQ Watershed Characterizations Links
Cypress Creek (Segment 1009) http://www.westfork.weebly.com//
La Nana Bayou https://www.tceq.texas.gov/waterquality/nonpoint-source/projects/la-nana-bayou-characterization
Big Elm Creek/Little River http://littleriver.tamu.edu/
Spring Creek http://westfork.weebly.com/
Watershed Protection Plan HighlightsUpper San Marcos River The Upper San Marcos watershed is 94.6 square miles (60,605 acres) and is divided into four contributing subbasins: Sink Creek, Sessom Creek, Purgatory Creek, and Willow Creek. The karstic nature of the landscape, the number of faults and fractures, and the direct conduits of recharge and discharge features along streambeds results in surface water and groundwater in-teractions throughout the watershed. Water quality in the river and its tributaries is directly tied to water quality in the aquifer and an increase in nonpoint source pollution in the watershed affects both surface and groundwater. The watershed is highly urban-ized making it susceptible to stormwater runoff pollutants. Due to the Upper San Marcos River’s high biodiversity and presence of endemic and endangered species, the United States Fish and Wildlife Service designated the San Marcos Springs and Spring Lake, the headwaters of the San Marcos River, as critical habitat.
Development of the Watershed Protection PlanIn 2012, the Meadows Center received CWA Section 319(h) funds from the TCEQ and the EPA to develop a watershed protection plan for the Upper San Marcos River watershed. The Meadows Center convened community stakeholders, local
organizations, and various agency partners in the watershed including members from the City of San Marcos, Hays County, Texas State University, the San Marcos River Foundation, San Marcos River Rangers, San Marcos Greenbelt Alliance, Edwards Aquifer Research and Data Center, the Guadalupe Blanco River Authority, the United States Geological Survey, and others. Approximately 50 dedicated stakeholders were active in subcommittees and identifying sources of pollution, data and information, and potential BMPs.
Spring Lake, the headwaters of the San Marcos River (Source: The Meadows Center)

35
Park on the Upper San Marcos River (Source: The Meadows Center)
NONPOINT SOURCE POLLUTION MANAGEMENT IN TEXAS | 2018 ANNUAL REPORT
With a few exceptions and storm related spikes in pollut-ants, the Upper San Marcos River consistently meets the state’s water quality standards and screening levels. For this reason, and because of the river’s unique groundwater driven system, stakeholders set water quality goals that are more stringent than state water quality standards and screening levels. The Upper San Marcos River Watershed Protection Plan establishes stringent target levels for chloride, sulfate, total dissolved solids, dissolved oxygen, total suspended solids, nitrogen and nitrate, phosphorus, oil and grease, and E. coli. Final acceptance of the watershed protection plan was granted by the EPA in June 2018.
Watershed Implementation ActivitiesThe Upper San Marcos Watershed Protection Plan includes streambank stabilization, land management and conservation measures, stormwater retrofits, LID features, and education and outreach activities.
Implementation is scheduled to begin in fiscal year 2019. The Meadows Center and the San Marcos Greenbelt Alliance have received two CWA Section 319(h) grants from the TCEQ and the EPA to perform streambank and upland restoration at four sites, install two vegetated filter strips in the Sessom Creek subbasin, and install a stormwater BMP in downtown San Marcos. An analysis of water quality ordinances, codes, and regulations to develop a report on potential enhance-ments to protect water quality and nonpoint source education and outreach activities will also be performed. These BMPs and others, are expected to be implemented by many watershed protection plan partners, including the City of San Marcos, Hays County, Texas State University, and nongovernmental organizations over the next five years.
Neches River Authority (ANRA), Castilaw Environmental Ser-vices, Stephen F. Austin State University, Texas A&M AgriLife Research, and the TWRI efforts began to develop the Attoyac Bayou Watershed Protection Plan using financial support from CWA Section 319(h) funds from the TSSWCB and the EPA. Through this stakeholder process, partnership members were guided through the watershed plan development process and produced a plan that identified the causes and sources of excessive E. coli, established target E. coli reduction thresholds, and identified voluntary management practices to reduce E. coli loadings across the watershed. This plan was accepted by the EPA in fiscal year 2015.
Watershed Implementation ActivitiesIn 2013, ANRA was awarded a CWA Section 319(h) grant from the TCEQ and the EPA to create a database of septic systems, and to repair and replace failing septic systems around Lake Sam Rayburn. As the project progressed, additional grant funds were added, and the project area was extended to cover the entire Attoyac Bayou watershed. Through this program, 26 failing septic systems were replaced in the Attoyac Bayou wa-tershed addressing one of the largest E. coli loading concerns voiced by stakeholders. This program also laid groundwork for a follow up CWA Section 319(h) project awarded to the TWRI, who coordinated with Pineywoods Resources Conservation and Development and ANRA to replace up to 20 more failing septic systems in the watershed. Between these two projects, 29 failing septic systems have been replaced as of fiscal year 2018. Supplemental Environmental Program funds have also been leveraged through this work and three additional systems have been replaced using those dollars. Of the septic systems replacements listed above, nine occurred in fiscal year 2018.
The development of WQMPs is also underway in the watershed through a CWA Section 319(h) grant from the TSSWCB and the EPA to improve watershed health and reduce E. coli loads transported to the stream during runoff events. In fiscal year 2018, two WQMPs were completed on 652 acres and four more are being developed on 956 acres. Practices included in these WQMPs are cross fencing, forage planting, and brush management.
Education and outreach activities carried out in fiscal year 2018 included the Texas Watershed Steward program with 35 attendees and a Homeowner Septic System Operation and Main-tenance program with 28 attendees. These programs provided information to watershed stakeholders on watershed health and function and septic system design, operation, and maintenance.
Continued water quality monitoring conducted by ANRA through their Clean Rivers Program monitoring and by Ste-phen F. Austin State University special projects has revealed that E. coli concentrations are improving in the watershed. Data used by the TCEQ in their biennial water quality assessments shows declining E. coli concentrations at two of the three moni-toring sites. Additionally, in the draft 2016 Integrated Report, the most downstream portion of Attoyac Bayou (Assessment Unit 0612_01) is proposed for delisting as an impaired water as it now meets its designated water quality standard for pri-mary contact recreation.
Attoyac BayouDevelopment of the Watershed Protection PlanThe Attoyac Bayou, located in east Texas, extends approxi-mately 82 miles from its headwaters in Rusk County and flows through Nacogdoches, San Augustine, and Shelby counties before emptying into Sam Rayburn Reservoir. It was first listed as impaired in 2004 for elevated levels of E. coli which did not meet the designated primary contact recreation use.
In 2010, the Attoyac Bayou Watershed Partnership was formed and with technical support from the Angelina &
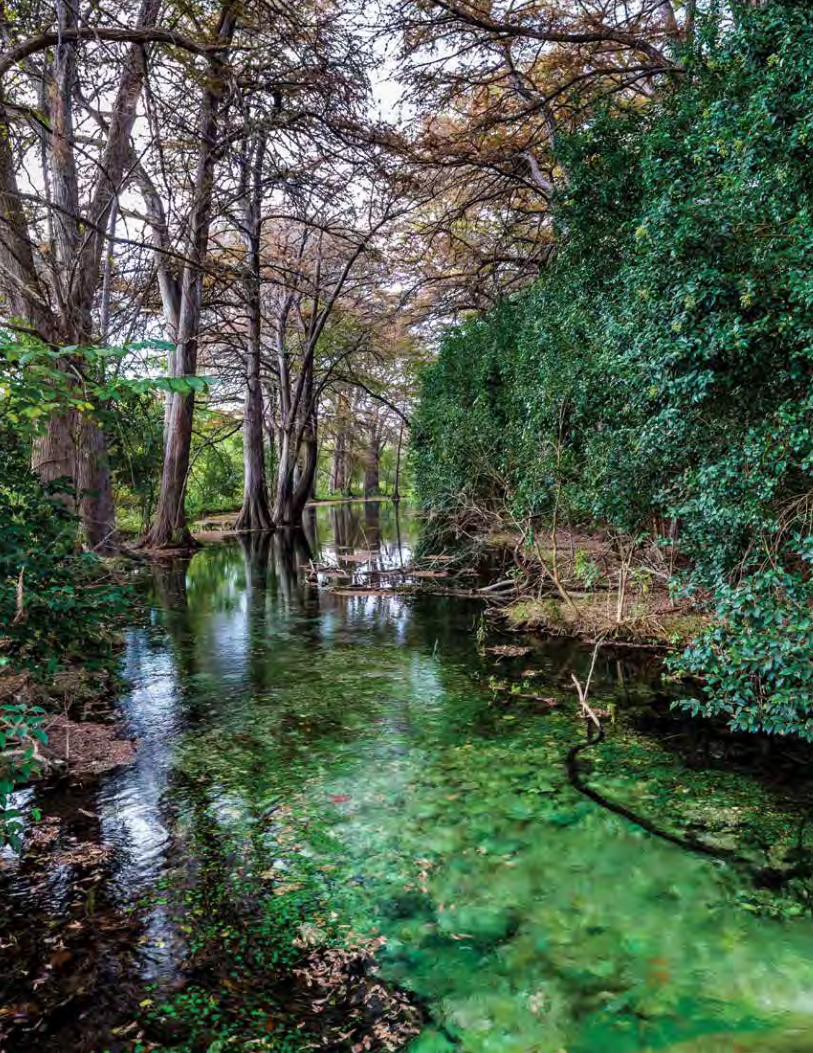
Abbreviations
37
ANRA Angelina & Neches River Authority BMP Best Management Practice CBBEP Coastal Bend and Bays Estuary Program cfu/100mL colony forming units per 100 milliliters COSSI Coastal On-site Sewage Inventory CWA Clean Water Act CWQMN TCEQ Continuous Water Quality Monitoring Network CWSRF Clean Water State Revolving Fund CZARA Coastal Zone Act Reauthorization Amendment E. coli Escherichia coli EPA U.S. Environmental Protection Agency GBEP TCEQ Galveston Bay Estuary Program GLO Texas General Land Office GRTS Grants Reporting and Tracking System H-GAC Houston Galveston Area Council Integrated Texas Integrated Report of Surface Report Water Quality for Clean Water Act Sections 305(b) and 303(d) lbs Pounds LCRA Lower Colorado River Authority LID Low Impact Development Meadows The Meadows Center for Water and the Center Environment at Texas State University NOAA National Oceanic and Atmospheric Administration NRCS Natural Resources Conservation Service PPG Performance Partnership Grant
SARA San Antonio River Authority TCEQ Texas Commission on Environmental Quality TGPC Texas Groundwater Protection Committee TMDL Total Maximum Daily Load TSSWCB Texas State Soil and Water Conservation Board TWDB Texas Water Development Board TWRI Texas Water Resources Institute TXCMP Texas Coastal Management Program TxDOT Texas Department of Transportation UCRA Upper Colorado River Authority WAP Watershed Action Planning WC Watershed Characterization WPP Watershed Protection Plan WQMP Water Quality Management Plan
NONPOINT SOURCE POLLUTION MANAGEMENT IN TEXAS | 2018 ANNUAL REPORT


39
table continued on next page
Appendix
Texas Nonpoint Source Management Program Milestones
Goals / Objectives Milestone Milestone Description Milestone
Measurement20181
Estimate2018 Actual Comments
ST1/A
Nonpoint Source Assessment Report
The state will produce the Integrated Report in accordance with applicable EPA guidance
Integrated Report 0 0
LT/2
Nonpoint Source Management Program Updates
The state will update the Management Program in accordance with applicable EPA guidance
Management Program updates
0 1
The 2017 Nonpoint Source Management Program update was approved in fiscal year 2018
LT/2
Nonpoint Source Performance Partnership Grant (PPG) End of Year Reports
The state will produce End of Year Report for PPG activities completed by the TCEQ
PPG End of Year Reports 1 1
LT/7Nonpoint Source Annual Report
The state will produce the Nonpoint Source Annual Report in accordance with applicable EPA guidance
Nonpoint Source Annual Report
1 1 Due to EPA in January 2019
LT/5
Implementation of Coastal Nonpoint Source Pollution Control Management Measures
Applicable Management Measure
Nonpoint Source Annual Report and GLO Reporting Mechanisms
TBD 0
Program management measures due to EPA and NOAA for approval by June 2019.
NONPOINT SOURCE POLLUTION MANAGEMENT IN TEXAS | 2018 ANNUAL REPORT

40
Texas Nonpoint Source Management Program Milestones (continued)
table continued on next page
NONPOINT SOURCE POLLUTION MANAGEMENT IN TEXAS | 2018 ANNUAL REPORT
Goals / Objectives Milestone Milestone Description Milestone
Measurement20181
Estimate2018 Actual Comments
LT/2-5Section 319(h) Grant Program Solicitation
The state will conduct individual TCEQ and TSSWCB solicitations for Section 319(h) grant funding
Grant Solicitation documentation
2 2 One from each agency
LT/2-5Section 319(h) Grant Program Application
The state will prepare individual TCEQ and TSSWCB grant program applications and submit them to EPA for Section 319(h) grant funding
Grant Application documentation
2 2 One from each agency
LT/2Section 319(h) Grant Program Reporting
The state will report grant funded activities to the Grants Reporting and Tracking System (GRTS) in accordance with EPA guidance
GRTS updates 4 4Two semi-annual updates from each agency
ST2/APriority Watersheds Report Updates
The state will update the Priority Watersheds Report based upon information and recommendations derived through the WAP process as described in the Management Program
Priority Watersheds Report Updates
1 1
Updated with the 2017 Nonpoint Source Management Program
ST3/C,D Watershed Training
The state will provide training to watershed professionals to ensure quality and consistency in the development and implementation of watershed protection efforts
Texas Watershed Planning Short Course
0 1
ST3/A,B,F,G Watershed Education
The state will provide watershed education to help citizens participate in programs designed to address water quality issues
Texas Watershed Steward Program(number of workshops)
8 11
ST3/C,D Watershed Training
The state will provide a forum to facilitate the transfer of information between watershed professionals in the state
Texas Watershed Coordinator Roundtable
2 2

41
Texas Nonpoint Source Management Program Milestones (continued)
table continued on next page
NONPOINT SOURCE POLLUTION MANAGEMENT IN TEXAS | 2018 ANNUAL REPORT
Goals / Objectives Milestone Milestone Description Milestone
Measurement20181
Estimate2018 Actual Comments
ST3/B,F,G Volunteer Monitoring
The state will provide support for local volunteer monitoring groups. These groups provide water quality data to the state water quality planning program and gain insight into resolving water quality issues
Texas Stream Team Participation (numbers of stations monitored)
250 241
Although the number of sites was less than expected, the number of citizens trained in fiscal year 2018 doubled from previous years. The number of sites is expected to increase in fiscal year 2019.
ST1/B Quality Assurance
The state will ensure that monitoring procedures are in compliance with EPA-approved TCEQ and TSSWCB Quality Management Plans
Annual Quality Management Plan updates
2 2 One from each agency
ST1/C Watershed Characterization
The state will support the implementation of projects designed to evaluate watershed characteristics and produce the information needed for watershed and water quality models
Watershed characterization projects
3 6
ST2/A,C Watershed Coordination
The state will support watershed coordination projects which facilitate the implementation of WPPs
Watershed coordination projects
12 25
ST1/D Develop WPPs
The state will support projects which provide for the development of WPPs which satisfy applicable EPA guidance
WPP development projects
5 8
ST2/D Implement WPPs
The state will support projects which provide for the implementation of management measures specified in WPPs which satisfy applicable EPA guidance
WPP implementation projects
42 47

42
Texas Nonpoint Source Management Program Milestones (continued)
Comal Springs and Landa Lake (Source: City of New Braunfels)
NONPOINT SOURCE POLLUTION MANAGEMENT IN TEXAS | 2018 ANNUAL REPORT
Goals / Objectives Milestone Milestone Description Milestone
Measurement20181
Estimate2018 Actual Comments
ST1/D
Develop TMDLs and implementation plans
The state will support projects which provide for the development of TMDLs and implementation plans which satisfy applicable state, federal, and program regulations and guidance
TMDL and implementation plan development projects
0 0
ST2/D
Implement TMDLs and implementation plans
The state will support projects which provide for the implementation of management measures specified in TMDLs and implementation plans which satisfy applicable state, federal, and program regulations and guidance
TMDL implementation plan implementation projects
5 8
AT2/B,C Load Reductions
The state will support projects which provide for the reduction of loadings of nonpoint source pollutants
Nonpoint source load reduction projects
18 25
ST2/B,CLoad Reductions (Nitrogen)
The state will ensure project reductions are reported utilizing GRTS
GRTS Report RQ2 54,822 lbs/yr
Numbers reflect projects with load reductions reported in fiscal year 2018
ST2/B,CLoad Reductions (Phosphorus)
The state will ensure project reductions are reported utilizing GRTS
GRTS Report RQ2 7,888lbs/yr
Numbers reflect projects with load reductions reported in fiscal year 2018
ST2/B,CLoad Reductions (Sediment)
The state will ensure project reductions are reported utilizing GRTS
GRTS Report RQ2 1,629 tons/yr
Numbers reflect projects with load reductions reported in fiscal year 2018
ST2/E Effectiveness Monitoring
The state will support projects which provide for the collection and analysis of water quality and other watershed information for the purpose of evaluating the effectiveness of BMPs
Effectiveness monitoring projects
12 10 Numbers reflect active projects
1 Estimates are from the 2017 Texas Nonpoint Source Management Program report2 RQ – Reportable Quantity
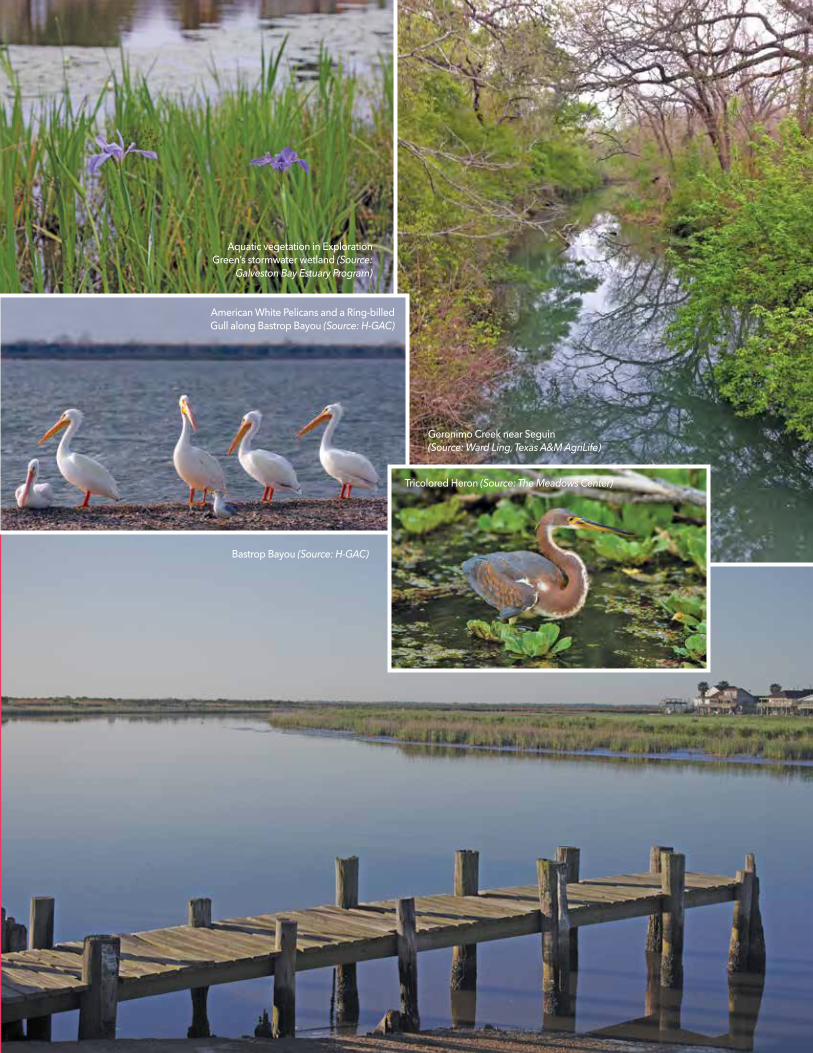
Bastrop Bayou (Source: H-GAC)
Geronimo Creek near Seguin (Source: Ward Ling, Texas A&M AgriLife)
Tricolored Heron (Source: The Meadows Center)
American White Pelicans and a Ring-billed Gull along Bastrop Bayou (Source: H-GAC)
Aquatic vegetation in Exploration Green’s stormwater wetland (Source:
Galveston Bay Estuary Program)
Authorization to use or reproduce any original material contained in this publication, not obtained from other sources, is freely granted. The Texas Commission on Environmental Quality (TCEQ)
and the Texas State Soil and Water Conservation Board (TSSWCB) would appreciate acknowledgement.
Copies of this publication are available for public use through the Texas State Library, other state depository libraries, and the TCEQ Library, in compliance with state depository law. For more information on TCEQ publications visit our website at: tceq.texas.gov/publications
This document may also be downloaded from the TSSWCB website at: www.tsswcb.texas.gov/reports
Published and distributed by the Texas Commission on Environmental Quality
P.O. Box 13087, Austin, TX 78711-3087Texas State Soil and water Conservation Board
1497 Country View Lane, Temple, TX 76504-8806

TexasCommission onEnvironmentalQuality
Texas State Soil & Water ConservationBoard SFR-066/18 January 2019
Funding provided by the Environmental Protection Agency through Clean Water Act Section 319(h) grant funds
Printed on recycled paper using vegetable-based ink.
www.tceq.texas.gov/assets/public/comm_exec/pubs/sfr/sfr-066-18.pdf
The TCEQ is an equal opportunity employer. The agency does not allow discrimination on the basis of race, color, religion, national origin, sex, disability, age, sexual orientation, or veteran status. In compliance with the Americans with Disabilities Act, this document may be requested in
alternate formats by contacting the TCEQ at 512-239-0010, or 1-800-RELAY-TX (TDD), or by writing P.O. Box 13087, Austin, TX 78711-3087.
How is our customer service?Fill out our online customer-satisfaction survey at www.tceq.texas.gov/customersurvey
Nonpoint Source Pollution Management in Texas2018 ANNUAL REPORT