Embed Size (px)
Citation preview
-70
-60
-50
-40
-30
-20
-10
0
10
20
30
40
50
60
70
0 10 20 30 40 50 60 70 80
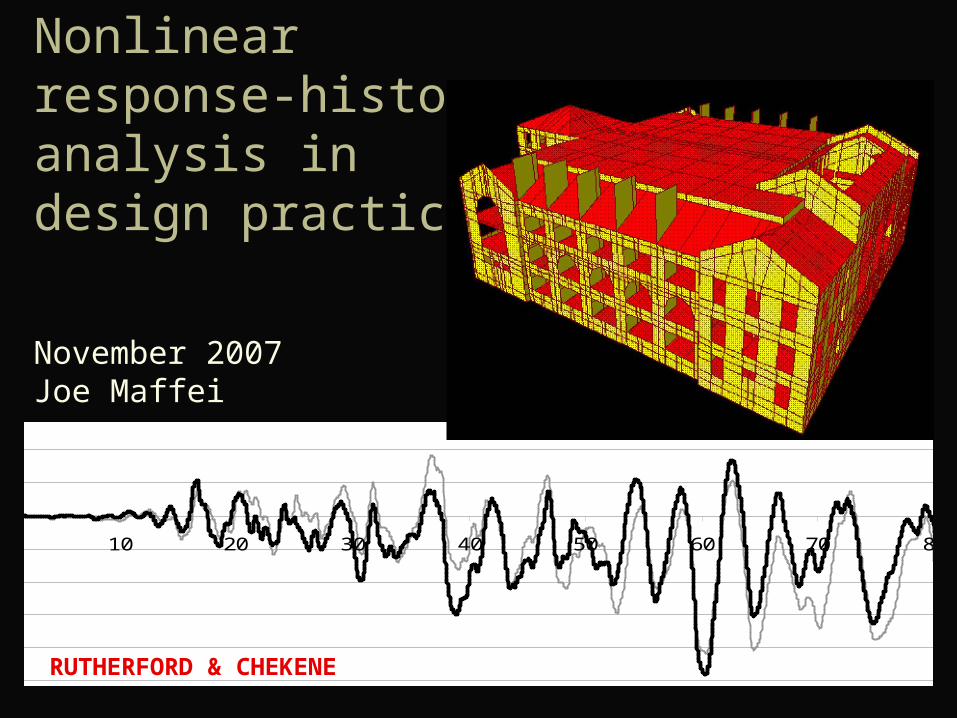
Nonlinear response-history analysis in design practice
RUTHERFORD & CHEKENE
November 2007Joe Maffei
RUTHERFORD & CHEKENE

RUTHERFORD & CHEKENE
Why do NLRH?• The code makes us. (Base isolation or
supplemental damping)
• Substantiation of non-prescriptive (“alternative”) designs.
• We want to know what happens.
What is the value of NLRH?
OutlineExample projects
Unique value of NLRH
Findings from NLRH of tall buildings
Dispersion of NLRH results
Ground motion input
Conclusions
[Modeling uncertainty]
Example projects that used NLRH

RUTHERFORD & CHEKENE
RUTHERFORD & CHEKENE
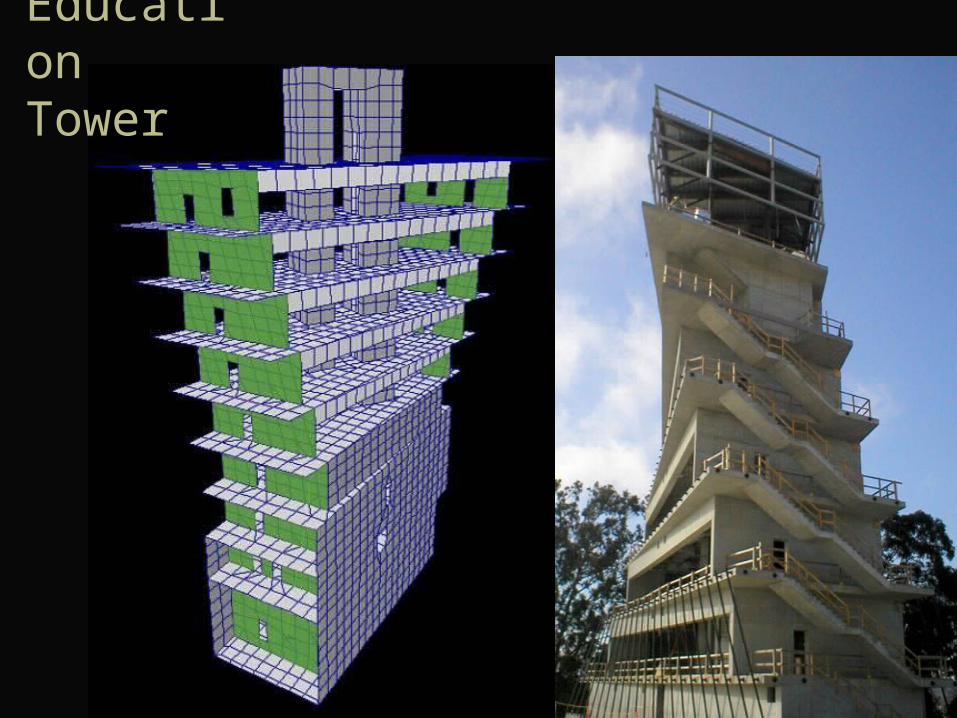
Education Tower

RUTHERFORD & CHEKENE
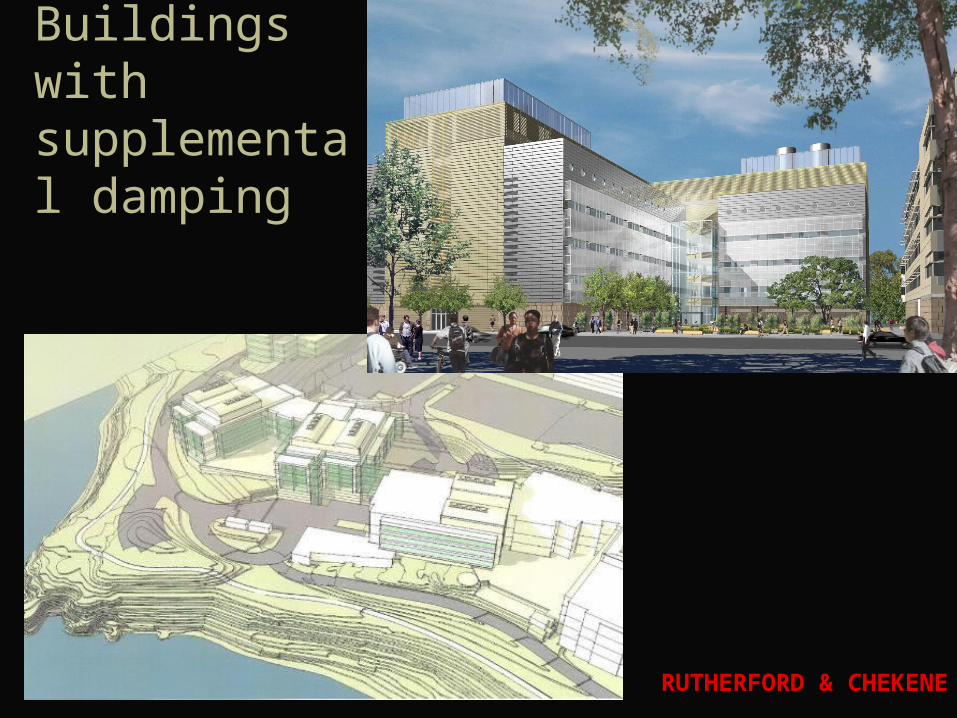
Buildings with supplemental damping
RUTHERFORD & CHEKENE
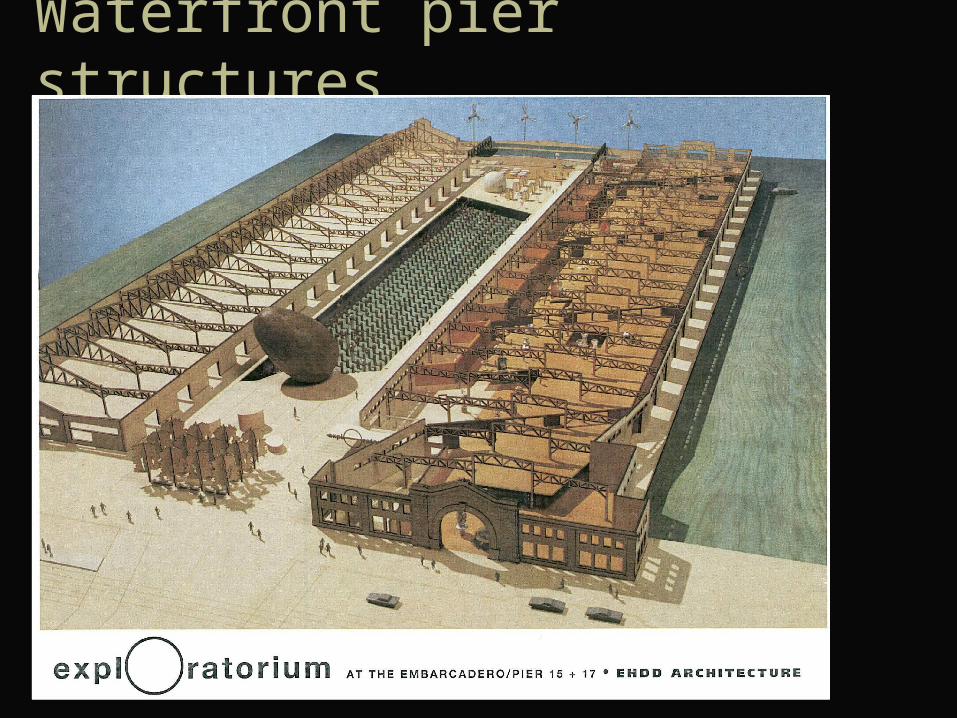
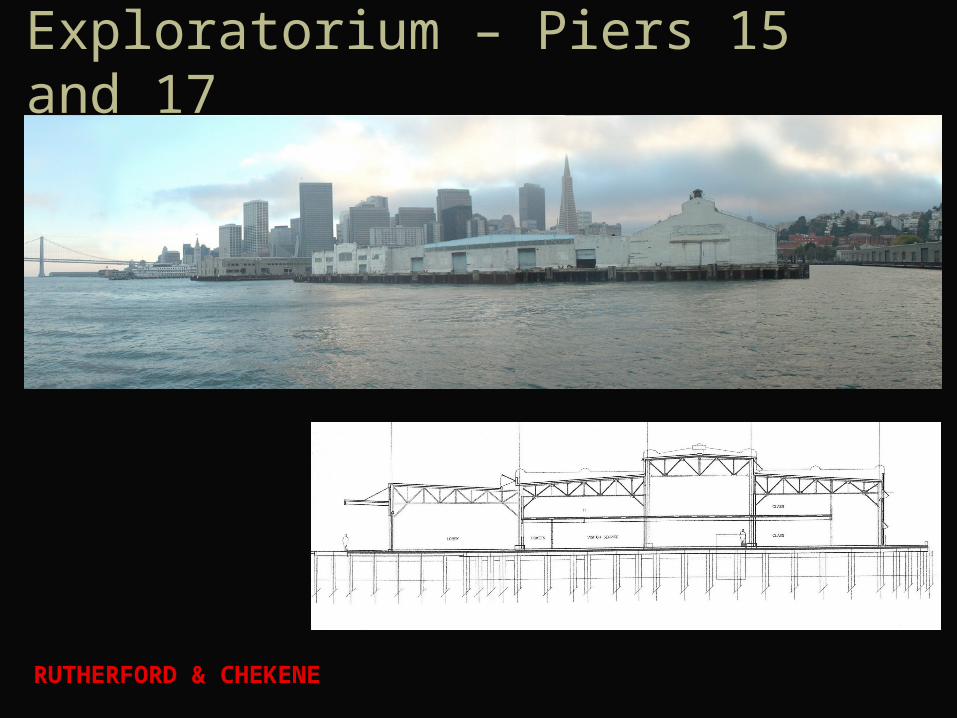
Waterfront pier structures
RUTHERFORD & CHEKENE
Exploratorium – Piers 15 and 17

Non-prescriptive seismic design

BASE
13th
ROOF

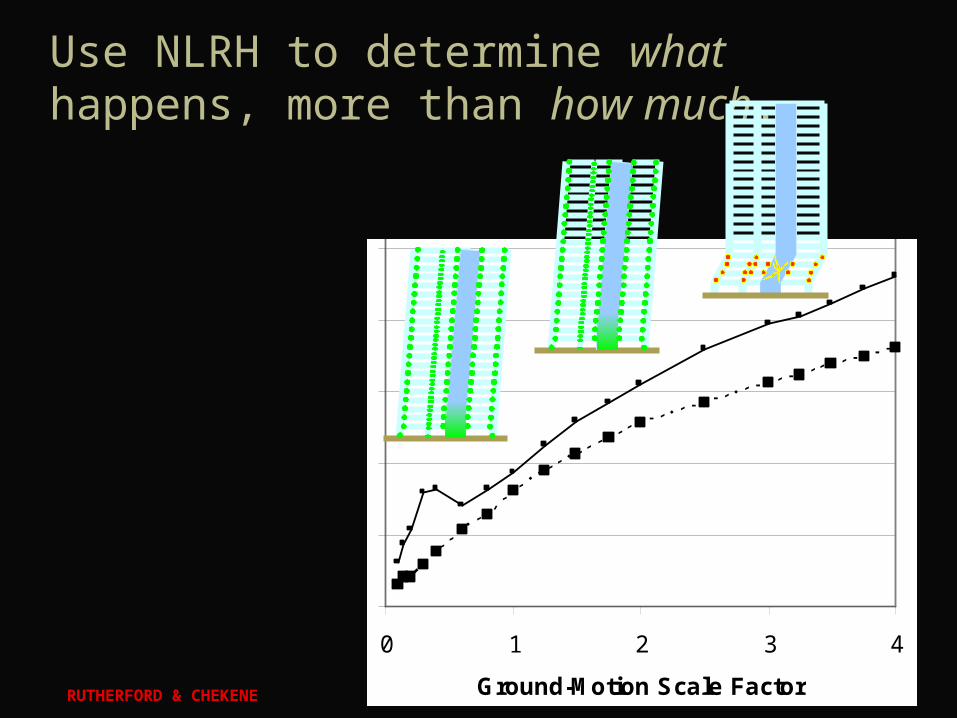
What is the unique value of NLRH? …

To determine what happens, not how much.
Desired mechanism
RUTHERFORD & CHEKENE
Undesirable mechanism

Findings from NLRH analyses of high-rise
buildings

Runs scaled from 0.1x MCE to 4x MCE

Runs scaled from 0.1 x MCE to 4 x MCE
0
5
10
15
20
25
30
35
40
45
0 1 2 3 4
Ground-Motion Scale Factor
Pea
k L
ater
al R
oo
f D
isp
lace
men
t H
2 (f
t)
IDA H2

Core wall moment versus shear amplification
0
5000
10000
15000
20000
25000
30000
35000
40000
45000
0 1 2 3 4
Ground-Motion Scale Factor
Pea
k C
ore
Sh
ear
Fo
rce
H2
(kip
-ft)
IDA H2@7th
IDA H2@1st
0
250000
500000
750000
1000000
1250000
1500000
1750000
2000000
0 1 2 3 4
Ground-Motion Scale Factor
Pea
k C
ore
Mo
men
t ab
ou
t H
1 (k
ip-f
t)
IDA H2@7th
IDA H2@1st

Moment to shear ratio
0
20
40
60
80
100
120
140
0 1 2 3 4
Ground-Motion Scale Factor
Eff
ec
tive
He
igh
t M/V
(ft
)
IDA H1@7th
IDA H1@1st
IDA H2@7thMCE level
110’ at 0.6x MCE90’ at MCE57’ at 2x MCE
230’
175’
0
5000
10000
15000
20000
25000
30000
35000
40000
45000
0 1 2 3 4
Ground-Motion Scale Factor
Use NLRH to determine what happens, more than how much.
RUTHERFORD & CHEKENE

Coupled wall
Plastic hinge locations
RUTHERFORD & CHEKENE


RUTHERFORD & CHEKENE
Dispersion of results among 7 or 14 ground
motion records
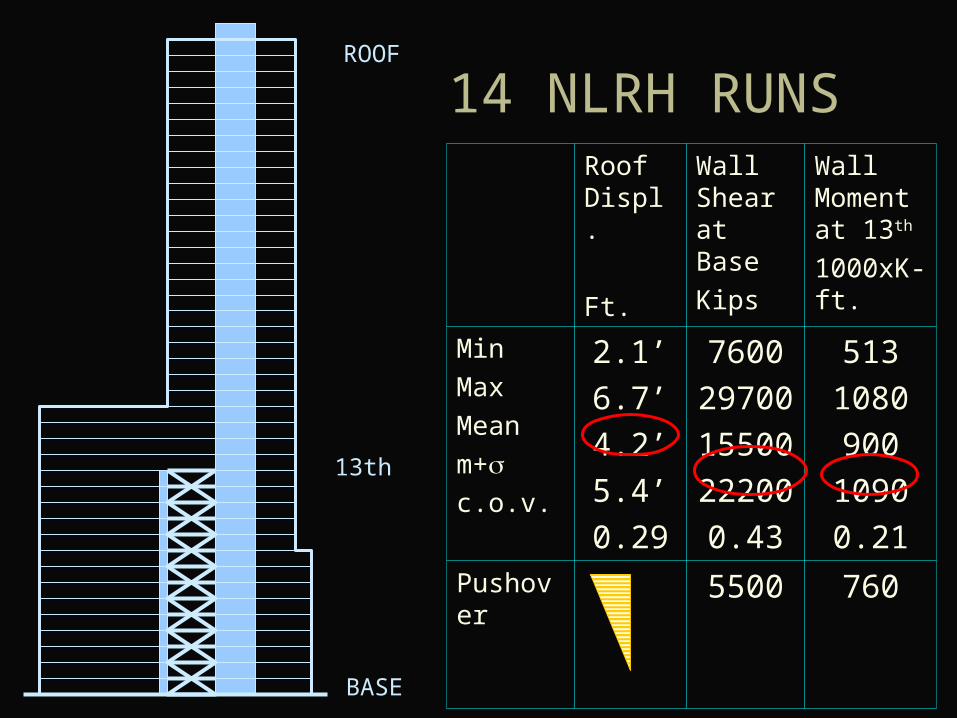
14 NLRH RUNS
BASE
13th
ROOF
Roof Displ.
Ft.
Wall Shear at BaseKips
Wall Moment at 13th
1000xK-ft.
MinMaxMeanm+c.o.v.
2.1’6.7’4.2’5.4’0.29
76002970
01550
02220
00.43
5131080900
10900.21
Pushover
5500 760

Coupling beam rotation
0
50
100
150
200
250
300
350
0 0.005 0.01 0.015 0.02 0.025 0.03
Plastic Rotation [rad]
Bu
ildin
g H
eig
ht
[ft]
Bhuj
El Salvador
Hector
Landers
Mexico
Nisqually
Peru
Average
Capacity
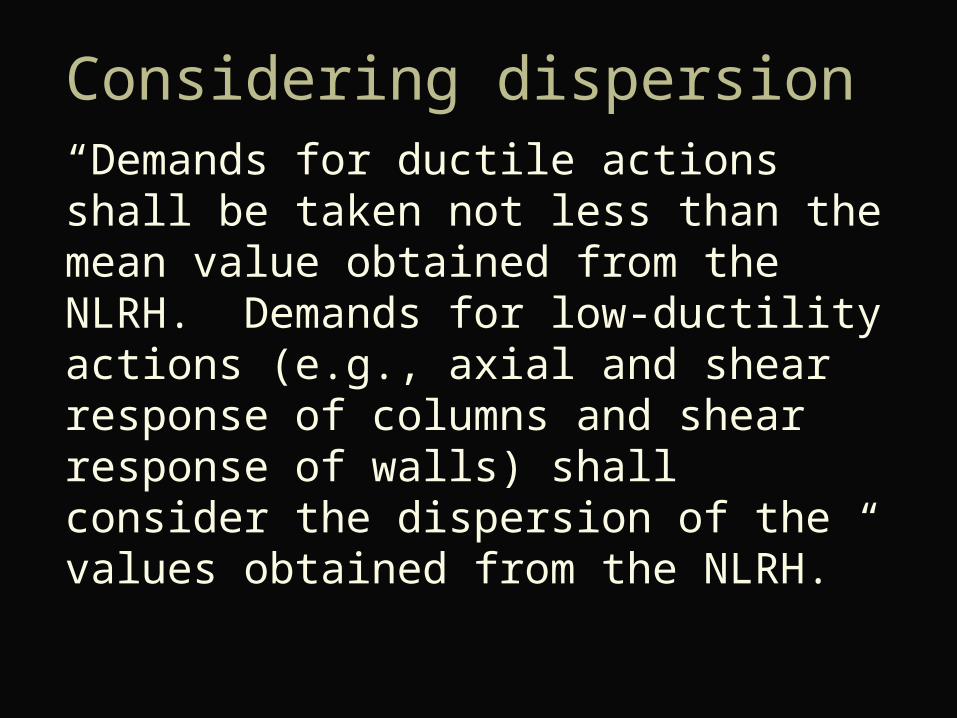
Considering dispersion“Demands for ductile actions shall be taken not less than the mean value obtained from the NLRH. Demands for low-ductility actions (e.g., axial and shear response of columns and shear response of walls) shall consider the dispersion of the values obtained from the NLRH.”
NLRH ground motion input
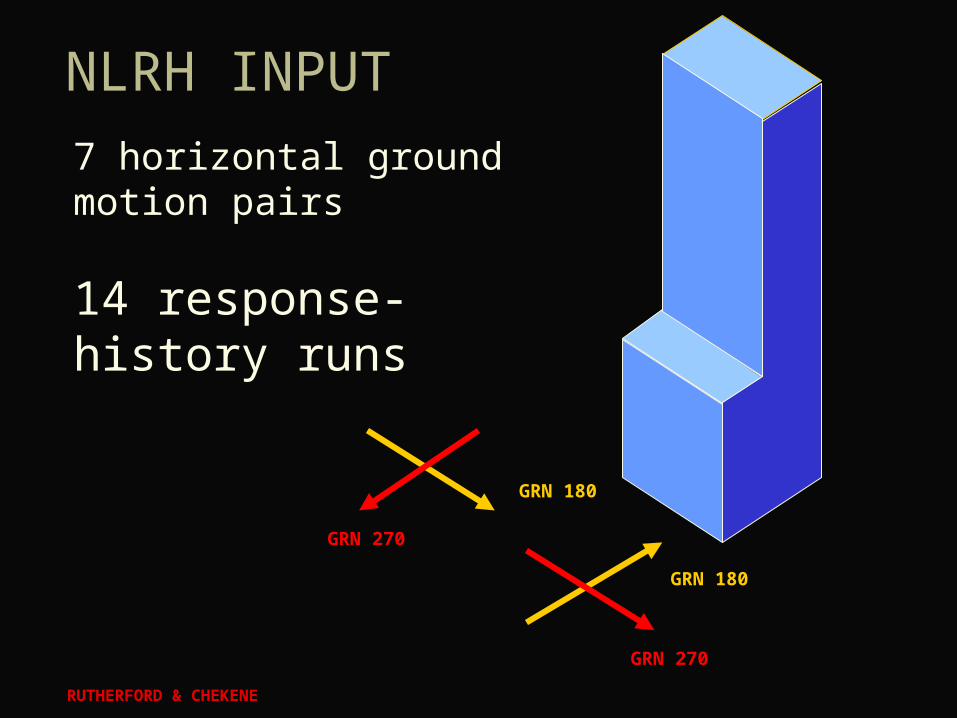
NLRH INPUT
7 horizontal ground motion pairs
14 response-history runs
GRN 270
GRN 180
GRN 270
GRN 180
RUTHERFORD & CHEKENE

NLRH analysis at MCE“When the ground motion components [statistically] represent site-specific fault-normal ground motions and fault-parallel ground motions, the components shall be applied to the three-dimensional mathematical analysis model according to the orientation of the fault with respect to the building. When the ground motion components represent random orientations, the components shall be applied to the model at orientation angles that are selected randomly; individual ground motion pairs need not be applied in multiple orientations. .”

NLRH analysis at MCE“Where applicable, an appropriate number of the ground motion time series shall include near fault and directivity effects such as velocity pulses producing relatively large spectral ordinates at relatively long periods.”
Conclusions
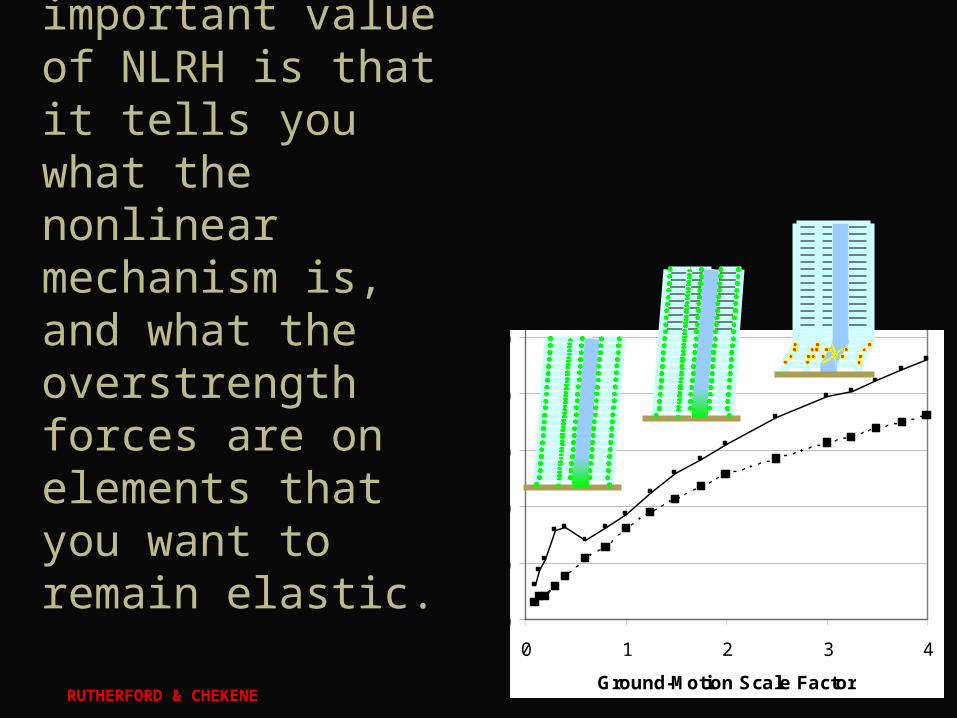
The most important value of NLRH is that it tells you what the nonlinear mechanism is, and what the overstrength forces are on elements that you want to remain elastic.
RUTHERFORD & CHEKENE
0
5000
10000
15000
20000
25000
30000
35000
40000
45000
0 1 2 3 4
Ground-Motion Scale Factor


Modeling uncertainty

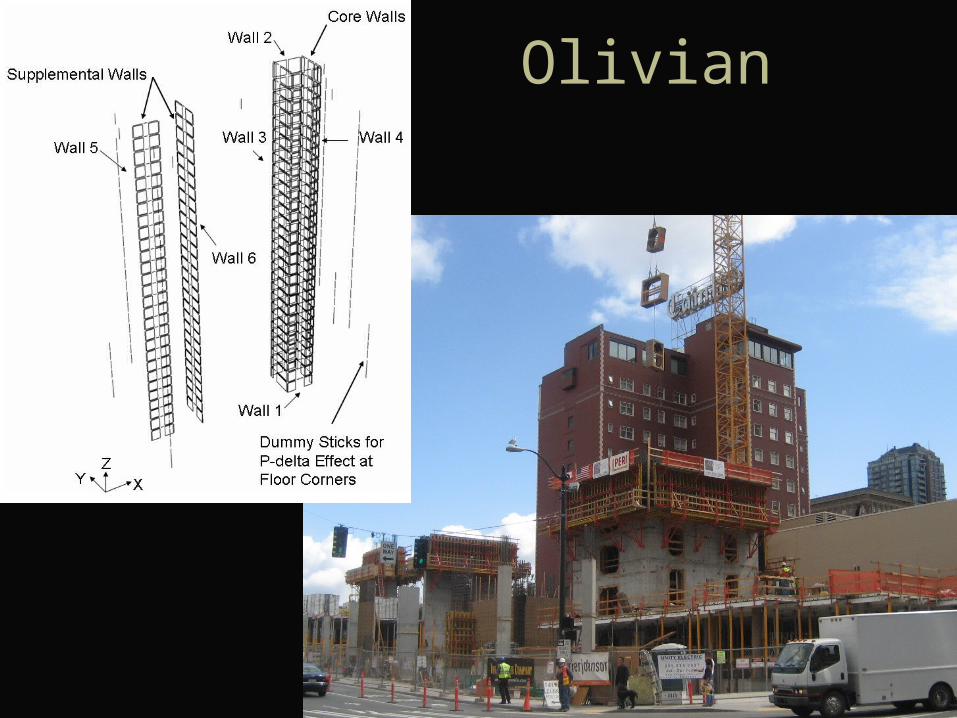
Olivian
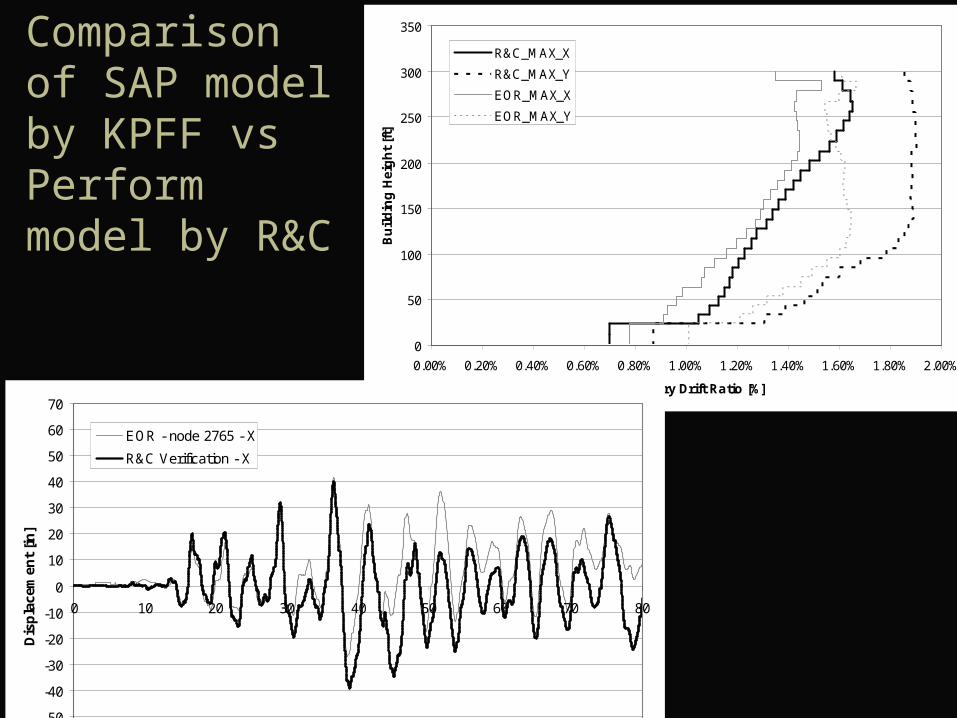
Comparison of SAP model by KPFF vs Perform model by R&C
0
50
100
150
200
250
300
350
0.00% 0.20% 0.40% 0.60% 0.80% 1.00% 1.20% 1.40% 1.60% 1.80% 2.00%
Inter-Story Drift Ratio [%]B
uil
din
g H
eig
ht
[ft]
R&C_MAX_X
R&C_MAX_Y
EOR_MAX_X
EOR_MAX_Y
-70
-60
-50
-40
-30
-20
-10
0
10
20
30
40
50
60
70
0 10 20 30 40 50 60 70 80
Time [s]
Dis
pla
cem
ent
[in
]
EOR - node 2765 - X
R&C Verification - X
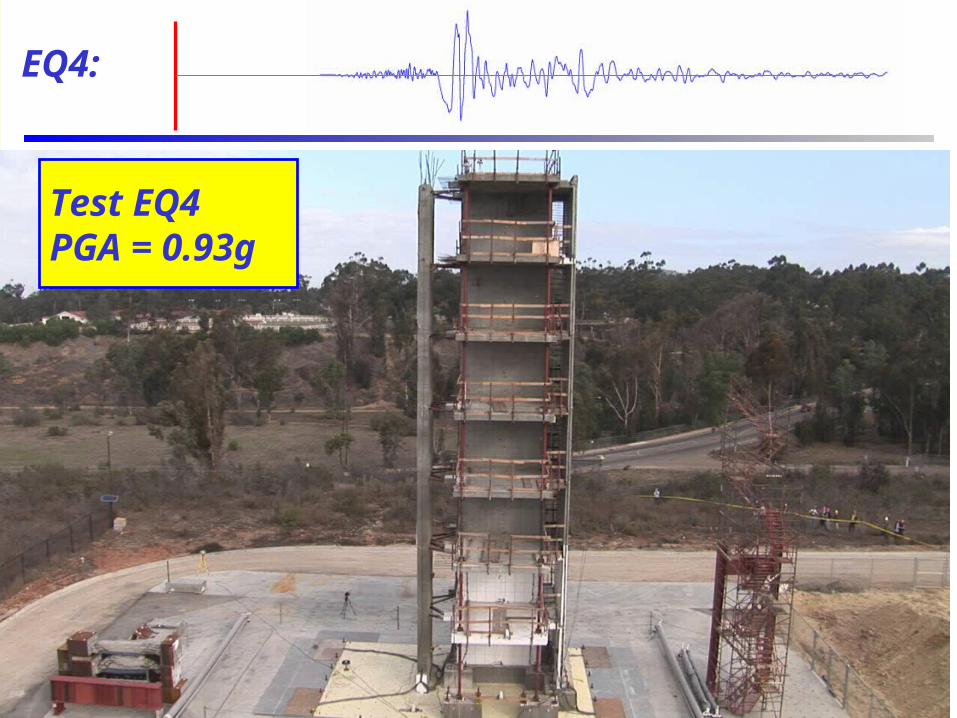
EQ4:
Test EQ4PGA = 0.93g

EQ4:

EQ3 and EQ4 - Experimental
-10000
-8000
-6000
-4000
-2000
0
2000
4000
6000
8000
10000
-17.5 -12.5 -7.5 -2.5 2.5 7.5 12.5 17.5
Roof Displacement [in]
Bas
e M
om
ent
[kip
-ft]
Experimental results
EQ4: Non-linear
EQ3: Essentially
linear
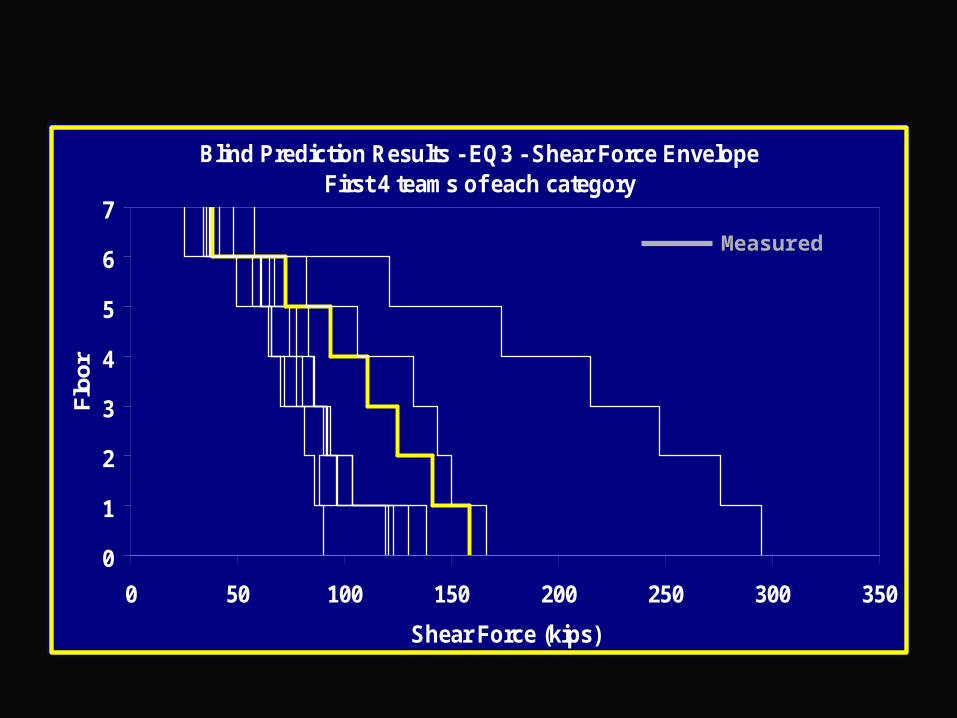
Blind Prediction Results - EQ3 - Shear Force EnvelopeFirst 4 teams of each category
0
1
2
3
4
5
6
7
0 50 100 150 200 250 300 350
Shear Force (kips)
Floo
r
Measured
111 Almaden Ave San Jose

-8 -6 -4 -2 0 2 4 6 8
Rotation (%)
Initiation of Shear Tab Failure
Str
eng
th
1.1
-2.0
Bottom flange fracture
Gravity Collapse
7.0-7.0
Top flange fracture
Initiation of Shear Tab Failure
Beam connection behavior
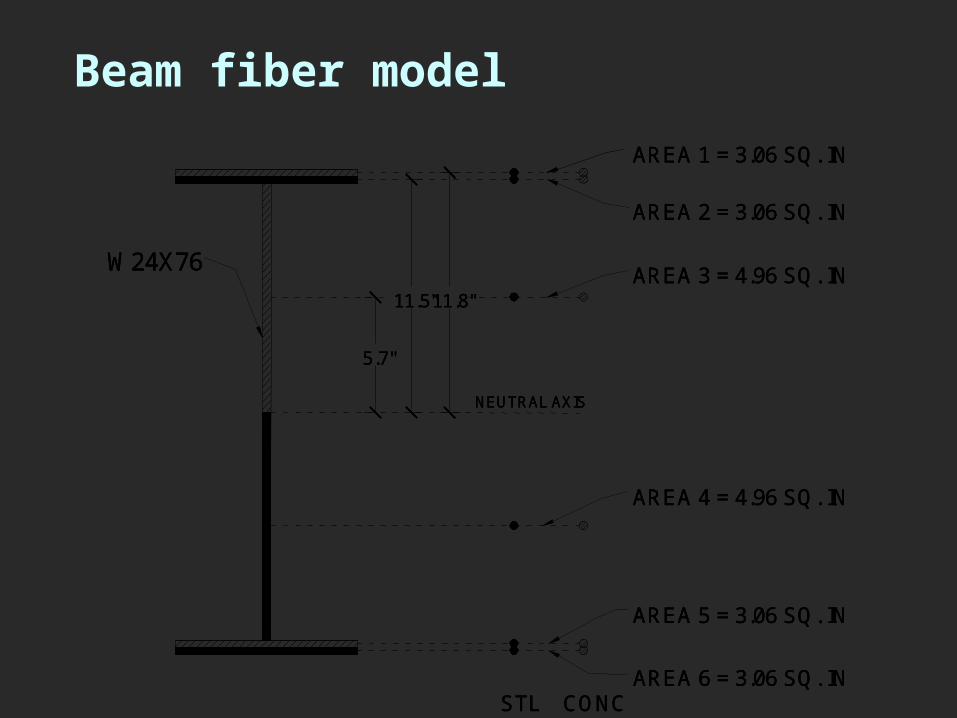
W24X76
NEUTRAL AXIS
AREA 1 = 3.06 SQ. IN.
AREA 2 = 3.06 SQ. IN.
AREA 3 = 4.96 SQ. IN.
AREA 4 = 4.96 SQ. IN.
AREA 5 = 3.06 SQ. IN.
AREA 6 = 3.06 SQ. IN.CONCSTL
5.7"
11.5"11.8"
W24X76
NEUTRAL AXIS
AREA 1 = 3.06 SQ. IN.
AREA 2 = 3.06 SQ. IN.
AREA 3 = 4.96 SQ. IN.
AREA 4 = 4.96 SQ. IN.
AREA 5 = 3.06 SQ. IN.
AREA 6 = 3.06 SQ. IN.
W24X76
NEUTRAL AXIS
AREA 1 = 3.06 SQ. IN.
AREA 2 = 3.06 SQ. IN.
AREA 3 = 4.96 SQ. IN.
AREA 4 = 4.96 SQ. IN.
AREA 5 = 3.06 SQ. IN.
AREA 6 = 3.06 SQ. IN.CONCSTL CONCSTL
5.7"
11.5"11.8"
5.7"
11.5"11.8"
Beam fiber model

RAM Model SAC_14: Force vs. displacement
-200
0
200
-4.00 -2.00 0.00 2.00 4.00
Displacement (in)
Fo
rce
(k
)
a. Model behavior b. Test behavior
RAM Model SAC_14: Force vs. displacement
-200
0
200
-4.00 -2.00 0.00 2.00 4.00
Displacement (in)
Fo
rce
(k
)
a. Model behavior b. Test behaviora. Model behavior b. Test behaviora. Model behavior b. Test behavior
Analysis model versus test results
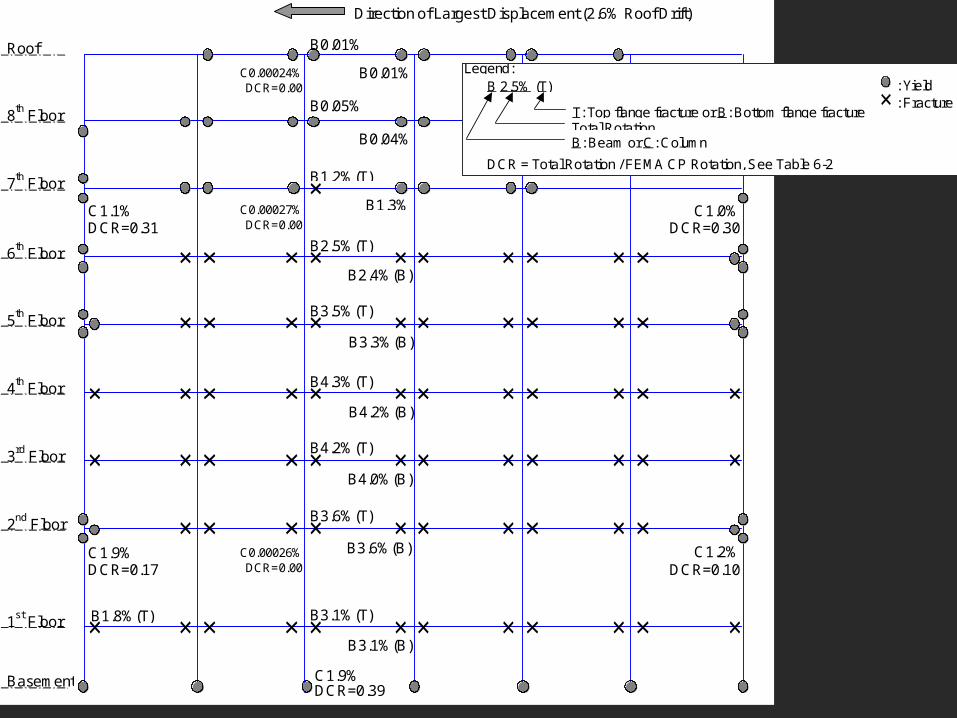
C1.2%C1.9%
B1.8%(T) B3.1%(T)
B3.6%(T)
B4.2%(T)
B4.3%(T)
B3.5%(T)
B2.5%(T)
B1.2%(T)
C1.0%
C0.00024%
B0.05%
B0.01%
C1.9%
Roof
8th Floor
7th Floor
6th Floor
5th Floor
4th Floor
3rd Floor
2nd Floor
1st Floor
Basement
B2.4%(B)
B0.01%
B0.04%
B1.3%
B3.3%(B)
B4.2%(B)
B4.0%(B)
B3.6%(B)
B3.1%(B)
Direction of Largest Displacement (2.6% Roof Drift)
C0.00027%C1.1%
C0.00026%
DCR=0.31
DCR=0.00
DCR=0.00
DCR=0.00DCR=0.17
DCR=0.30
DCR=0.10
DCR=0.39
: Fracture: Yield
Legend:
B: Beam or C: ColumnTotal RotationT: Top flange fracture or B: Bottom flange fracture
B 2.5% (T)
DCR = Total Rotation / FEMA CP Rotation, See Table 6-2
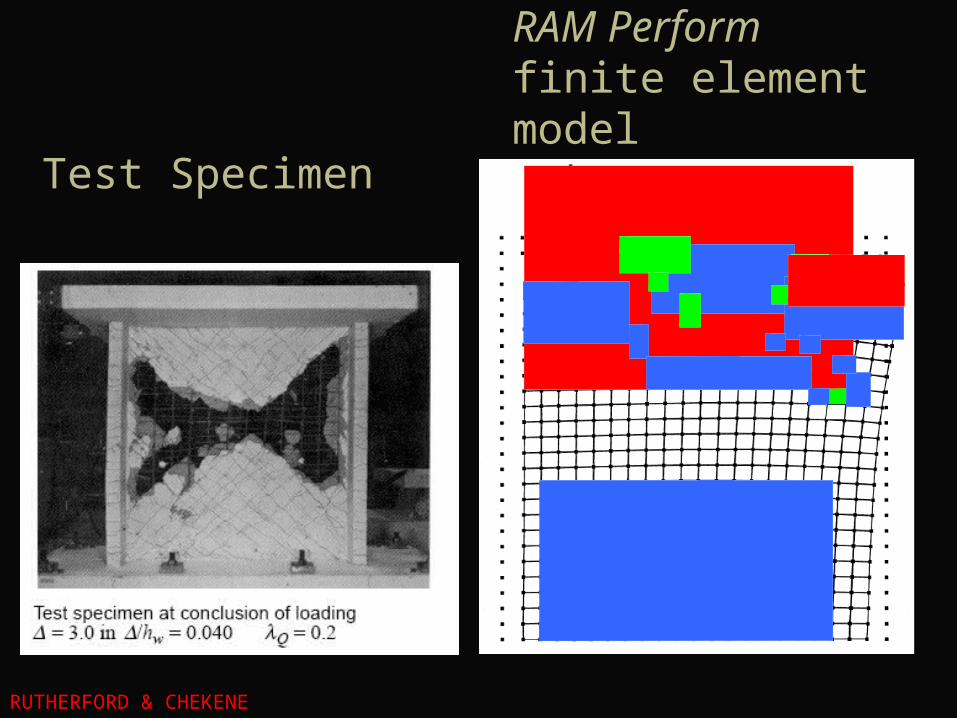
Test Specimen
RAM Perform finite element model
RUTHERFORD & CHEKENE

-250
-200
-150
-100
-50
0
50
100
150
200
250
-0.020 -0.010 0.000 0.010 0.020 0.030 0.040
Roof Drift
Ba
se
Sh
ea
r (k
)
RAM Perform Cyclic Pushover
Envelope of test specimen hysteresis loops
Cyclic pushover results
RUTHERFORD & CHEKENE