Embed Size (px)
Citation preview

Scientia Iranica A (2014) 21(4), 1249{1262
Sharif University of TechnologyScientia Iranica
Transactions A: Civil Engineeringwww.scientiairanica.com
Nonlinear �nite element analysis of RC beams undercombined shear and torsion to extract linear andcurvilinear ranges of interaction curves
S.B. Talaeitabaa;� and M.E. Torkib
a. PhD Graduate and Assistant Professor of Azad University, Department of Civil Engineering, Isfahan University of Technology,P.O. Box 8415683111, Isfahan, Iran.
b. PhD Student, Department of Aerospace Engineering, Texas A&M University, College Station, TX 77843, USA.
Received 2 December 2012; received in revised form 4 September 2013; accepted 4 January 2014
KEYWORDSShear-torsioninteraction curve;FEM analysis;Transversereinforcement;Torque-twist curve.
Abstract. The use of non-linear �nite elements to assess the e�ect of transversereinforcement amount on the shape of shear-torsion interaction curve for RC beams isaddressed. At �rst, FEM results for specimens under pure torsion and combined shear andtorsion were validated with previous outcomes. Secondly, reference specimens were madewith the minimum required transverse reinforcement at �rst. Each specimen was analyzedwith the �nite element method and tested under similar conditions in the laboratory, andthe results, including the cracking pattern, cracking and ultimate loads, and shear-torsioninteraction curves, were found to be in very good agreement. Finally, the transversereinforcement amount was increased to certain extents and similar results were determined.FEM interaction curve stood below the experimental curve. It was also deduced that,from a certain increase in the transverse reinforcement, the shear-torsion interaction curvetransforms from linear to elliptical.
c 2014 Sharif University of Technology. All rights reserved.
1. Introduction
Dealing with the combined e�ects of shear and torsiondates back to about 70 years ago [1,2]. By using theskew bending method, shear-torsion interaction curvesfor RC beams were �rstly put forward as circular orbilinear curves, depending on the ratio between exure,shear, and torsion [3,4]. From a set of experimentaldata, it has been gathered that not only increasingthe transverse reinforcement, but also reducing theconcrete cover on the transverse bars and increasingthe torsion-to-shear ratio (leading to shatter in the
*. Corresponding author. Tel.: +98 311 3912701;Fax: +98 311 3912700E-mail addresses: [email protected] (S.B. Talaeitaba);[email protected] and [email protected] (M.E.Torki)
concrete cover), the shear-torsion interaction deviatesfrom linear into curvilinear. This curve tends towardsthe vertical axis (pure torsion) perpendicularly [1,5].A large cache of work exists in the literature regardingthe issue of torsion in concrete beams, either alone orin a combined state with other loading schemes, whichare truly concurrent with the results later expressed inthe present research.
The torsional behavior of concrete elements wasdeveloped by Karayannis [6,7], expressed in termsof normal stress and crack width, for the behav-ior of concrete elements in increasing torsion, alsoapplicable to concrete elements subjected to torsioncombined with exure, shear, and axial force. Theydeduced that increasing the transverse reinforcementdoes not bear a signi�cant e�ect upon the crackingload. Moreover, assuming a simpli�ed bilinear stress-strain curve for concrete, Karayannis and Chalioris [8]

1250 S.B. Talaeitaba and M.E. Torki/Scientia Iranica, Transactions A: Civil Engineering 21 (2014) 1249{1262
used two-dimensional elements for the solution of amodi�ed Poisson's equation within the Saint-Venanttorsion theory for concrete beams without reinforce-ment. They presented material failure criteria consid-ering the in uence of prestressing forces in additionto torsional torque. A combination of two di�erenttheoretical models was adopted for concrete beams byChalioris [9,10] in which the elastic response until ini-tial cracking was described by the modi�ed approachesof the classical elastic theory, and the post-crackingpart was considered by specially extended versions ofthe softened truss model. These combined methodshave been reported to provide full analytical torsionalcurves for the behavior of rectangular �brous beamswith conventional reinforcement outlines. Their resultsincluded a non-linear analysis for torsional concretebeams that yields to a realistic modeling of the entire(i.e. elastic and post-cracking) response of beams.
Chaisomphob and Kritsanawonghong [11] testedRC beams under combined double-axis shear andtorsion. They set forth that the double-axis shearcapacity becomes rigorously decreased when torsionexists. A nonlinear �nite element method for analyzingthe load-de ection behavior and failure characteris-tics of deep reinforced concrete coupling beams wasdeveloped by Zhao et al. [12]. Their investigationrevealed that although adding more shear reinforce-ment can suppress shear-tension failure, it will causeshear-sliding failure at the beam-wall joints. Garciaand Bernat derived the interactive equations of beamsunder combined shear and torsion, solved them numer-ically, and veri�ed their results with those obtainedfrom nonlinear modeling [13]. Green and Belarbiplotted force-displacement curves for RC beam crosssections under shear, torsion, and bending by solvingequations of equilibrium and consistency [14]. Theyvalidated their results with 28 experimental outcomes.Based on the Modi�ed Compression Field Theory witha tangent-sti�ness formulation and the Timoshenkobeam theory, a model for the analysis of reinforced andprestressed concrete frame elements under combinedloading axial, biaxial bending, torsion, and biaxialshear loadings was presented by Gregori et al [15].They validated their results with well-known tests.Using a speci�cally-designed test setup subjecting thebeam to combined shear and torsion with di�erentratios, the strengthening e�ects of FRP strips wereinvestigated by Deifalla and Ghobarah [16] with fourstrengthening outlines for concrete T -shaped beamsunder combined shear and torsion. The extended U -jacket technique proved to show the most promisingresults in terms of strength and ductility while beingquite feasible for strengthening. Seismic performanceof concrete circular columns under cyclic bending andshear, cyclic pure torsion, and various levels of com-bined cyclic bending, shear, and torsion were presented
by Prakash et al. [17]. They demonstrated that thereis no considerable variation in exural or torsionalcapacities with decrease in aspect ratio. However,their results showed a signi�cant change in the failuremode and deformation characteristics due to reductionin aspect ratio. Based on the softened membranemodel with a tangent-sti�ness formulation and theTimoshenko beam theory, a three-dimensional (3D)concrete constitutive model for �ber-based analysisof concrete members subjected to combined loadingsincluding torsion was implemented by Mullapudi andAyoub [18] in order to evaluate the interactive behaviorbetween the axial force, bidirectional shear, biaxialbending, and torsion. They emphasized the use ofthe model for the evaluation of the e�ect of thedi�erent stress states on the global and local behaviorof concrete members.
The �nite element modeling of RC structures sub-jected to shear deformations includes considerable workin the literature, but it demands more profound resultswith respect to the derivation of shear-torsion interac-tion curves emphasizing a complete range of transversereinforcement amount. The present research aims atusing nonlinear �nite element analysis to evaluate thee�ect of transverse reinforcement amount on the shapeof the shear-torsion interaction curve in RC beams. At�rst, the specimens are analyzed and tested with theminimum transverse reinforcement, required accordingto ACI 318, and the shear-torsion interaction curve isplotted. The FEM interaction curve, being slightlylower, is satisfying compared to that obtained fromthe experiment. Then, the transverse reinforcement ismultiplied by di�erent ratios, and the new interactioncurve in each case is plotted to �gure out in whichranges the interaction curve is linear, and in whichranges it is curvilinear.
2. Materials and method
2.1. ConcreteFrom the library of elements, SOLID65 (as a 3Delement with 3 degrees of freedom at each node) wasused for reinforced concrete. This class of elementsallows the opportunity to de�ne the reinforcementvolumetric ratio (as the ratio of reinforcement volumeto the element volume) in three orthogonal directions.The method used in the present research is nonlinear�nite element which lies on the �ve-parameter William-Warnke yield model for concrete, de�ned as [19]:
Ffc� S � 0; (1)
where F is a function of principal stresses, S is theyield surface, and fc is the concrete uniaxial crushingstress. The parameters of in uence in this model arethe concrete elasticity modulus (Ec), the maximum

S.B. Talaeitaba and M.E. Torki/Scientia Iranica, Transactions A: Civil Engineering 21 (2014) 1249{1262 1251
uniaxial compressive stress in concrete (f 0c), the max-imum tensile stress in concrete, i.e. rupture modulus(fr), Poisson's ratio (�), the shear transfer coe�cientsin open and closed cracks (�t and �c, respectively),and the uniaxial compressive stress-strain curve forconcrete. Among all parameters, the second andthird parameters bear the utmost in uence on theyield surface. Generally, a concrete element crackswhenever the principal tensile stress lies out of theyield surface. On the other hand, an element issaid to crush when all the three principal stresses arecompressive and lie out of the yield surface. In theformer case, the elasticity modulus becomes zero alongthe direction normal to the cracking principal stress,and in the latter case, it is considered to be zero alongall principal directions, implicating that the element iscomputationally omitted [20]. The schematic shape ofthis yield surface is shown in Figure 1 [20].
Figure 1. William-Warnke computational yield surface:(a) An example of the general 3D surface(en.wikipedia.org/wiki/Willam-Warnke yield criterion);and (b) the biaxial sub-surface.
The elasticity and rupture moduli of concrete inthis research were obtained, respectively, using theexpressions (in MPa).
Ec = 5000pf 0c; (2)
fr = 0:67pf 0c: (3)
Furthermore, the Poisson's ratio was considered tobe 0.2. The values of �t were di�erent in prismaticspecimens (made for veri�cation of calculations withprevious results), and non-prismatic ones (main speci-mens used in the present investigation), which will bepointed out in the corresponding sections. The valueof �c has been suggested to be taken unity all thetime. However, numerous analyses have proven thatfor better convergence, �c is better to be consideredslightly smaller than unity, e.g. 0.99, the value con-sidered in all calculations in the present research [20-23]. An important fact in concrete fracture is thatin most practical cases, pure compressive fracture isimprobable [23]. Even in a uniaxial compressive test,secondary tensile stresses (induced due to the Poissone�ect) bring about cracking and yielding. Therefore, tohave a realistic model, the crushing ability of concretehas to be prevented [19]. This can be done by taking f 0cto be -1 [20]. After initial cracking, the tensile strengthof the cracked cross section is reduced as multiplied bya reduction factor Tc, which is mostly considered tobe 0.6. After initial cracking, the mechanical behaviorof concrete depends on a reduced secant modulusnamed Rt, as shown in Figure 2. The concrete's post-cracking elasticity matrix is modi�ed according to thisparameter, as included in Appendix A.
2.2. ReinforcementIt may be specious to use a prescribed reinforcedsolid element, which de�nes the reinforcement as thevolumetric ratio of reinforcement to concrete. However,this has not proven to be the best way because theexact location of the bar is unknown, and even worse,full adhesion is considered between concrete and thebars, which is not a realistic assumption. Instead, it
Figure 2. Tensile stress deterioration after initialcracking.

1252 S.B. Talaeitaba and M.E. Torki/Scientia Iranica, Transactions A: Civil Engineering 21 (2014) 1249{1262
Table 1. Properties of specimens under pure torsion.
Specimen'scode
Length(mm)
Shape anddimensions of the
cross section
Transversereinforcement
amount
Longitudinalreinforcement amount
f 0c(MPa)
N1 �6.32@120 mmfy = 456:8 MPa
top: 2�11.3 mmfy = 400
N22440 Rec.150 � 350 mm
�6.32@70 mmfy = 456:8 Mpa
bot: 2�16fy = 409 Mpa 37.0
N3 �6.32@200 mmfy = 567 Mpa
top: 2�11.3 mmfy = 400
bot: 2�19.4fy = 461 Mpa
RC 1900 Rec.150*350 mm �6@80 mm 4�16 mm in corners 39.0RG fy = 251 Mpa fy = 502 Mpa 36.0
Rb-s5.5/160 1000 Rec.150*300 mm �5.5@160 mmfy = 350 Mpa
4�8 mm in cornersfy = 560 Mpa
28.8
Ref 3960 Rec.279.4*279.4mm
�9.53 [email protected] = 420 Mpa
Corner: 4�12.7fy = 460 MpaSides: 4�9.53
34
Table 2. Comparison between FEM and experimental results in specimens under pure torsion.
Specimen's codeCracking load
from experiment(kN)
Ultimate loadfrom experiment
(kN)
Cracking loadfrom FEM (kN)
Ultimate loadfrom FEM (kN)
N1 5.32 12.88 5.22 12.10N2 5.88 12.80 5.93 11.81N3 6.59 12.59 6.40 12.01RC 9.50 15.00 7.65 11.80RG 8.00 14.80 6.72 13.09
Rb-s5.5/160 6.92 |{ 5.69 7.21Ref. 17.00 18.00 13.60 19.42
is expedient to model the bars separately by using linkelements, for which LINK 8 was picked from the library,which is a 3D truss element with 3 degrees of freedomat each node. This method is in all aspects preferableto the other reported method [20], since it especiallyhelps to model more conveniently, enables to de�nethe reinforcement in every direction without changingthe whole element direction, and the analysis will bemore time-e�cient. Hence, this method has beenrecommended by the software manual. The von Misesyield criterion was used for the steel reinforcement barswith a tri-linear stress-strain behavior. The analysesinclude the validation of models with those of theexisting literature and the new innovative results of thepresent research as comes in the sequel.
3. Veri�cation and comparison
3.1. Specimens under pure torsionIn the �rst step, cantilevered specimens undergoingpure torsion were adopted from previous works. The
geometric and reinforcement parameters of these speci-mens are included in Table 1. Figure 3 shows the �niteelement model of one of these models.
As many references have recommended (for pris-matic models), �t was taken to be 0.4 for better con-vergence of analysis [19-22]. To forestall the analysisdivergence due to stress concentration under the loadedpoints, the elements in a length equaling the crosssection height from the loaded points were considereddevoid of any cracking and nonlinear behavior. Theloading scheme was load-controlled analysis. Table 2includes the comparison between FEM and experimen-tal results for cracking and ultimate loads.
Moreover, the cracking patterns in FEM and ex-perimental models are identical, as shown in Figures 4and 5.
Finally, the torque-twist curves, as shown inFigure 6 for N2 specimen, are consistent up to thecracking threshold. However, after cracking initiation,the FEM curve does not have enough precision. Thislies in the fact that the open-crack shear transfer

S.B. Talaeitaba and M.E. Torki/Scientia Iranica, Transactions A: Civil Engineering 21 (2014) 1249{1262 1253
Figure 3. Meshing and modeling of a specimen underpure torsion.
Figure 4. Cracking pattern in the experimental specimen.
coe�cient after cracking initiation is a small value.This makes the corresponding element of the sti�nessmatrix (according to Appendix A) too small, andthus the analysis loses exactitude. However, the FEManalysis gives the ultimate (fracture threshold) loadtruly [24].
3.2. Specimens under combined shear andtorsion
In the second stage, FEM analyses were comparedto those obtained from Rahal's experiments [1]. The
Figure 5. Cracking pattern in the FEM model: (a) Leftface; (b) up face; (c) right face; and (d) down face.
Figure 6. Torque-twist curve belonging to N2.
geometric and reinforcement parameters of this modelare shown in Figure 7. Each specimen was madewith this model and a speci�c load eccentricity (i.e.the torsion to shear ratio). The reinforcement barshad a bilinear stress-strain curve, in which the post-yielding modulus was 5 percent of the initial (elasticity)modulus. The longitudinal bars had 25 mm diameters,the yield stress of 480 MPa, and the ultimate stress of466 MPa. All the same, the transverse bars had 10 mm

1254 S.B. Talaeitaba and M.E. Torki/Scientia Iranica, Transactions A: Civil Engineering 21 (2014) 1249{1262
Figure 7. Geometric and reinforcement properties of Rahal's models.
Table 3. Mechanical properties of Rahal's models.
Specimenno.
Specimen'scode
Eccentricity(mm)
Compressivestrength (MPa)
Ultimate strain(�10�3)
Concreteelasticity modulus
(MPa)1 RC2-1 162 53.9 2.25 394002 RC2-2 0 38.2 2.80 283003 RC2-3 1500 42.2 2.25 385304 RC2-4 80 48.7 2.21 31500
diameters, the yield stress of 676 MPa, and the ultimatestress of 626 MPa. The models were made in the sameway as the purely torsional models had been made.The proposed specimens in this reference are includedin Table 3. The cracking pattern was identical in bothexperimental and FEM results. For instance, the RC2-2 cracked specimen in the laboratory and the crackedFEM model are shown in Figure 8. Moreover, thecracking and ultimate loads, obtained from experimentand FEM analysis, for di�erent specimens, are includedin Table 4. It can be observed that the results arequite coincident. On the other hand, as for the caseof purely torsional models, after initial cracking, thetorque-twist curve obtained from FEM analysis is notin full agreement with that obtained from experiment,as shown in Figure 9 for RC2-4. The reason is the sameas that stipulated for the purely torsional models.
4. Modeling the main specimens
4.1. Geometric and reinforcement propertiesThe modeling procedure of the main specimens of thepresent research is being addressed in this section. The
Figure 8. Cracking outline in the FEM analyzed RC2-2specimen.
support conditions were clamped-clamped because ofthe special characteristics of the loading apparatus [25].The ends were clamped against bending and torsion,and the eccentric load was applied at the middle (andthe centric load was applied as pure shear). Because ofthe restrictions in the experimental test apparatus, itwas inconvenient, however possible, to make a multi-bay beam. Instead, the non-prismatic assemblage

S.B. Talaeitaba and M.E. Torki/Scientia Iranica, Transactions A: Civil Engineering 21 (2014) 1249{1262 1255
shown in Figure 10 was prepared. This lies upon thefact that, on the basis of the designed supportingsystem, the zone with negligible bending momentstands in the two end quarters of the length in theproximity of contra exure points, i.e. in the reduced
Figure 9. The shear-displacement curve belonging toRC2-4 specimen.
cross section zones. The beam cross section and itstransverse reinforcement (hoops) were reduced in thesezones to concentrate the shear-torsion fracture zone tothese regions. Otherwise, the ultimate load, and thusthe moment in the middle and the ends would haveincreased, and this would have intertwined the exuraland shear-torsional behaviors in fracture. However, thebeam ends had to have larger cross sections to providesu�cient rigidity at the clamped supports.
On the other hand, the longitudinal and trans-verse (hoop) reinforcements were increased in zoneswith high bending moments (to prevent exural or,less probably, shear-torsional fracture from happeningin those regions) and decreased to the minimum re-quirement stated in ACI 318-08 [26] in the reducedcross sections (to reassure that shear-torsional frac-
ture occurs in these cross sections). Moreover, thelongitudinal and transverse reinforcing bars in the exural zone were made of steel with a 400 MPatensile strength and had 16 and 8 mm diameters,respectively. However, the hoops used in the reducedsections (i.e. the test regions) had 4 mm diameter andhad 240 MPa tensile strength. The concrete used in allspecimens had a 35 MPa compressive strength. Table 5
Table 4. Cracking and ultimate loads for Rahal's specimens.
Specimen'scode
Cracking shear fromexperiment (kN)
Ultimate shear fromexperiment (kN)
Cracking shearfrom FEM (kN)
Ultimate shear fromFEM (kN)
RC2-1 137 533 133 464RC2-2 240 796 230 776RC2-3 64 111 64 94RC2-4 233 715 228 715
Figure 10. Specimens dimension and reinforcement (all dimensions in mm).

1256 S.B. Talaeitaba and M.E. Torki/Scientia Iranica, Transactions A: Civil Engineering 21 (2014) 1249{1262
Figure 11. The �nite element model of a main specimen: (a) Under pure shear; (b) under combined shear and torsion;and (c) under pure torsion.
Table 5. Main specimens' properties.
Specimen's code Eccentricity (mm)
E0 0
E1 290
E2 470
E3 616
E4 1
includes the specimens' names and each specimen'sload eccentricity, ranging from zero (pure shear) toin�nity (pure torsion). The twisting rotation wasmeasured by using two LVDTs on the middle crosssection width ends, and dividing the di�erence of themeasured digits by the cross section width. Due to thestructural weakness induced by reducing the sectionat the proximity of the contra exure points, fractureoccurred in the reduced zone in all specimens, andthe bigger section had only rigid movement. Hence,the twisting torque-vs.-twisting rotation curves for allspecimens depend directly on the behavior of thereduced section.
4.2. Finite element modelAs stated in the above, concrete was modeled us-ing solid elements. The elements without transversereinforcement were considered to be devoid of volu-metric reinforcement, and those including transversereinforcement were identi�ed by specifying the bar-to-element volumetric ratio along the direction of thetransverse bars (hoops). However, the longitudinalbars were modeled separately by using link elementsalong the longitudinal direction. Figure 11 showsthe meshing and reinforcing of the model used inthe present research. The metal belt around thebeam was modeled using solid elements made of steel,with full adhesion to the concrete elements. Afternumerous analyses, the optimum values of �t and�c were obtained to be 0.05-0.25 (depending on themodel, but can be considered the average value of0.2 in most cases) and 0.99, respectively [19]. Theminimum transverse reinforcement was �rstly used
in specimens and each specimen was analyzed underdi�erent shear load eccentricities (with the eccentricityde�ned as the torsion to shear ratio) and FEM resultswere compared to those obtained from experiment.Secondly, the transverse reinforcement amount wasincreased according to Subsection 5.5 and new FEMmodels were made and analyzed likewise.
5. Results and discussion
5.1. Cracking patternFigure 12 shows the cracking pattern belonging to oneof the specimens, which is in complete agreement withthe spiral cracking pattern observed in the laboratory.The small dashes and the complete squares show thecracked and inept paths, respectively.
5.2. Cracking and ultimate loadsThe cracking and ultimate loads for all specimens areincluded in Table 6. It can be realized that there issatisfactory agreement between the results.
5.3. Curves of behaviorThe torque-twist curves for di�erent specimens areshown in Figure 13 as compared to the experimentalcurves. It can be observed that the initial behaviorsof the two curves are in complete match. However,as seen in all cases in Section 4, the FEM curve stopsafter initial cracking for the same reason as theorized inSection 4. It can be seen that, in all cases, the ultimate(capacity) load (either pure shear or twisting torque)value obtained from FEM analysis is smaller than thatobtained from experiment.
Figure 12. Cracking in a main specimen.

S.B. Talaeitaba and M.E. Torki/Scientia Iranica, Transactions A: Civil Engineering 21 (2014) 1249{1262 1257
Table 6. Cracking and ultimate loads for main specimens.
Specimen's code
Crackingload from
experiment(kN)
Ultimate loadfrom
experiment(kN)
Crackingload fromFEM (kN)
Ultimate loadfrom FEM
(kN)
E0 100.0 134.0 103.1 127.0
E1 38.0 49.2 35.5 46.9
E2 21.0 33.7 20.8 32.0
E3 18.0 29.0 16.5 28.2
E4 20.0 55.0 19.8 50.2
Figure 13. Torque-twist curves for main specimens.

1258 S.B. Talaeitaba and M.E. Torki/Scientia Iranica, Transactions A: Civil Engineering 21 (2014) 1249{1262
5.4. Interaction curvesThe ultimate (capacity) shear-torsion interactioncurve, including the data of all 5 specimens, is shownin Figure 14. This �gure reveals that, on the one hand,the interaction curve, either from FEM analysis or from
Figure 14. Shear torsion interaction curve for theminimum required transverse reinforcement.
experiment, can be considered linear although bothcurves deviate slightly downward in the 470 mm loadeccentricity. On the other hand, since the ultimate loadfrom FEM calculation is smaller than that determinedby experiment, the FEM interaction curve stands belowthe experimental curve.
5.5. E�ect of transverse reinforcement on theinteraction curve.
Considering the transverse reinforcement amount asthe comparator, this section contains the e�ect ofincreasing the transverse reinforcement amount on theshape of the shear-torsion interaction curve. For thispurpose, the reference transverse reinforcement amountin the reduced cross section (equaling the minimumrequirement according to ACI 318-08 [26]) has beenmultiplied by 2, 3, 4 and 5. The new specimens'properties are included in Table 7. As an instance,the twisting rotation curves for E1-E15 specimens in a290 mm load eccentricity are given in Figure 15.
In order to compare the e�ect of transversereinforcement more appropriately, the cracking andultimate loads for di�erent transverse reinforcementamounts in the reduced cross section have been plottedagainst the ratio of the increased transverse reinforce-
Table 7. Specimens with increased transverse reinforcement amount.
No. Specimen'scode
Equivalenttransverse
reinforcementamount (mm)
Eccentricity(mm)
Ratio of the transversereinforcement to the minimum
requirement
1 E02
�6@100
0
22 E12 2903 E22 4704 E32 6165 E42 16 E03
�8@120
0
37 E13 2908 E23 4709 E33 61610 E43 111 E04
�10@145
0
412 E14 29013 E24 47014 E34 61615 E44 116 E05
�10@120
0
517 E15 29018 E25 47019 E35 61620 E45 1

S.B. Talaeitaba and M.E. Torki/Scientia Iranica, Transactions A: Civil Engineering 21 (2014) 1249{1262 1259
Figure 15. Torque-twist curves of main specimens in the290 mm eccentricity.
ment to the reference reinforcement in Figure 16. This�gure reveals the following results:
1. Increasing the transverse reinforcement amountdoes not have a signi�cant e�ect on the crackingload, especially for specimens under combined shearand torsion (from E1 onwards). However, it consid-erably increases the ultimate load. Thus, the initialslope of the torque-twist curve remains almost un-varied while the ultimate slope becomes remarkablyincreased with the transverse reinforcement. Thee�ect of increasing the transverse reinforcement ismaximum, both in cracking and ultimate loads,for the specimen under pure shear (E0), and itdecreases with the load eccentricity (in specimensunder combined shear and torsion).
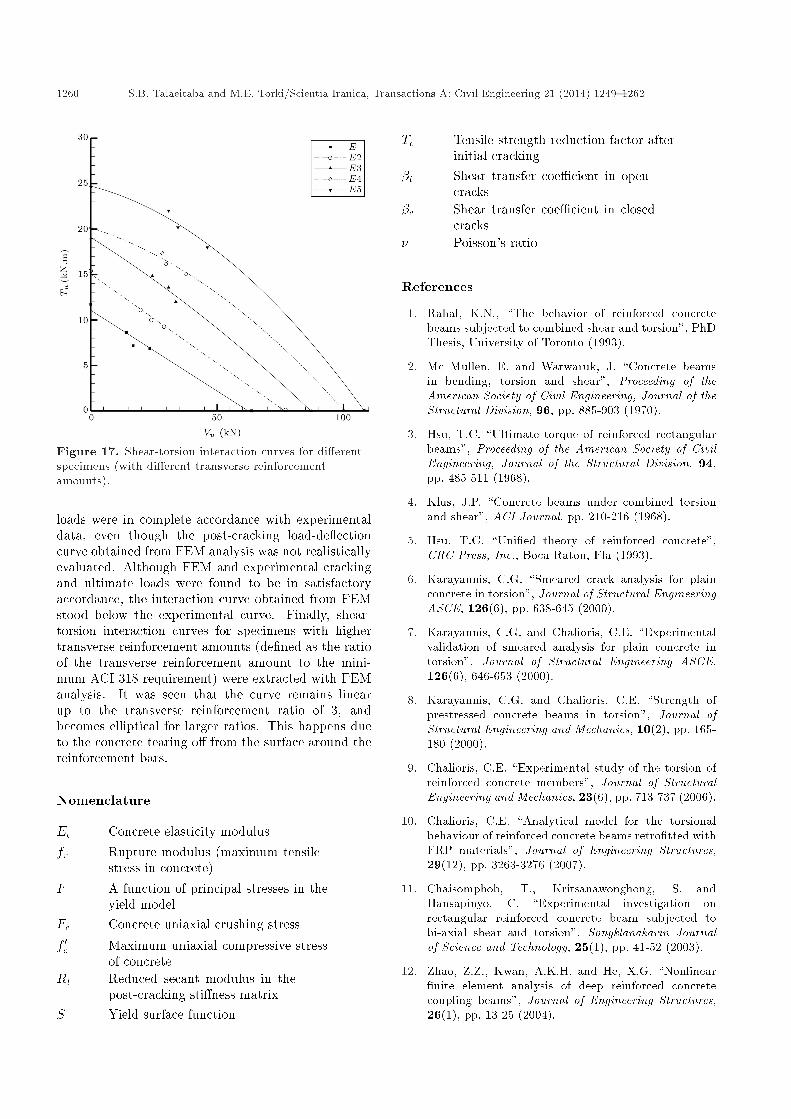
2. By increasing the transverse reinforcement amount,the ultimate load increases linearly up to the trans-verse reinforcement ratio of 3. For greater ratios,it increases by more than the corresponding linearincrease. For this reason, the ultimate shear-torsioninteraction curves remain linear up to the ratioof 3. However, for greater ratios, the curves becomeelliptical rather than linear. This phenomenon is inexact coincidence with previous research outcomesand the fact underlying this occurrence is the morebrittle behavior of the structure happening due toconcrete tearing o� from the surface of the surfacearound the bars [1]. The interaction curves fordi�erent transverse reinforcement ratios are shownin Figure 17 (the numerical data are given inAppendix B).
6. Conclusions
The present research contains nonlinear �nite ele-ment analysis of reinforced concrete beams under
Figure 16. E�ect of transverse reinforcement amount inthe reduced cross section: (a) On the cracking load; and(b) on the ultimate load.
combined shear and torsion to evaluate the e�ectof transverse reinforcement amount on the shape ofshear-torsion interaction curve. In this respect, FEMmodels were �rstly made to verify the results withprevious investigations for pure torsion and combinedshear-torsion. Then, main models were made witha clamped-clamped boundary condition and a non-prismatic cross section along the longitudinal direction.Each model, with the transverse reinforcement equalto the minimum required amount and a speci�c loadeccentricity, was analyzed with nonlinear �nite elementand the cracking pattern, cracking and ultimate loadswere obtained and validated with experiment. Thecracking paths as well as the cracking and ultimate
1260 S.B. Talaeitaba and M.E. Torki/Scientia Iranica, Transactions A: Civil Engineering 21 (2014) 1249{1262
Figure 17. Shear-torsion interaction curves for di�erentspecimens (with di�erent transverse reinforcementamounts).
loads were in complete accordance with experimentaldata, even though the post-cracking load-de ectioncurve obtained from FEM analysis was not realisticallyevaluated. Although FEM and experimental crackingand ultimate loads were found to be in satisfactoryaccordance, the interaction curve obtained from FEMstood below the experimental curve. Finally, shear-torsion interaction curves for specimens with highertransverse reinforcement amounts (de�ned as the ratioof the transverse reinforcement amount to the mini-mum ACI 318 requirement) were extracted with FEManalysis. It was seen that the curve remains linearup to the transverse reinforcement ratio of 3, andbecomes elliptical for larger ratios. This happens dueto the concrete tearing o� from the surface around thereinforcement bars.
Nomenclature
Ec Concrete elasticity modulusfr Rupture modulus (maximum tensile
stress in concrete)F A function of principal stresses in the
yield modelFc Concrete uniaxial crushing stressf 0c Maximum uniaxial compressive stress
of concreteRt Reduced secant modulus in the
post-cracking sti�ness matrixS Yield surface function
Tc Tensile strength reduction factor afterinitial cracking
�t Shear transfer coe�cient in opencracks
�c Shear transfer coe�cient in closedcracks
� Poisson's ratio
References
1. Rahal, K.N., \The behavior of reinforced concretebeams subjected to combined shear and torsion", PhDThesis, University of Toronto (1993).
2. Mc Mullen, E. and Warwaruk, J. \Concrete beamsin bending, torsion and shear", Proceeding of theAmerican Society of Civil Engineering, Journal of theStructural Division, 96, pp. 885-903 (1970).
3. Hsu, T.C. \Ultimate torque of reinforced rectangularbeams", Proceeding of the American Society of CivilEngineering, Journal of the Structural Division, 94,pp. 485-511 (1968).
4. Klus, J.P. \Concrete beams under combined torsionand shear", ACI Journal, pp. 210-216 (1968).
5. Hsu, T.C. \Uni�ed theory of reinforced concrete",CRC Press, Inc., Boca Raton, Fla (1993).
6. Karayannis, C.G. \Smeared crack analysis for plainconcrete in torsion", Journal of Structural EngineeringASCE, 126(6), pp. 638-645 (2000).
7. Karayannis, C.G. and Chalioris, C.E. \Experimentalvalidation of smeared analysis for plain concrete intorsion", Journal of Structural Engineering ASCE,126(6), 646-653 (2000).
8. Karayannis, C.G. and Chalioris, C.E. \Strength ofprestressed concrete beams in torsion", Journal ofStructural Engineering and Mechanics, 10(2), pp. 165-180 (2000).
9. Chalioris, C.E. \Experimental study of the torsion ofreinforced concrete members", Journal of StructuralEngineering and Mechanics, 23(6), pp. 713-737 (2006).
10. Chalioris, C.E. \Analytical model for the torsionalbehaviour of reinforced concrete beams retro�tted withFRP materials", Journal of Engineering Structures,29(12), pp. 3263-3276 (2007).
11. Chaisomphob, T., Kritsanawonghong, S. andHansapinyo, C. \Experimental investigation onrectangular reinforced concrete beam subjected tobi-axial shear and torsion", Songklanakarin Journalof Science and Technology, 25(1), pp. 41-52 (2003).
12. Zhao, Z.Z., Kwan, A.K.H. and He, X.G. \Nonlinear�nite element analysis of deep reinforced concretecoupling beams", Journal of Engineering Structures,26(1), pp. 13-25 (2004).

S.B. Talaeitaba and M.E. Torki/Scientia Iranica, Transactions A: Civil Engineering 21 (2014) 1249{1262 1261
13. Garcia, J.M.B. and Bernat, A.R.M. \Shear-bending-torsion interaction in structural concrete members:A nonlinear coupled sectional approach", Journal ofArchitecture Computational Methods in Engineering,14, pp. 249-278 (2007).
14. Green, G. and Belarbi, A. \Model for reinforcedconcrete members under torsion, bending, and shear.I: Theory", Journal of Engineering Mechanics, ASCE,135(9), pp. 961-969 (2009).
15. Gregori, J.N., Sosa, P.M., Prada, M.A. and Filip-pou, F.C. \A 3D numerical model for reinforced andprestressed concrete elements subjected to combinedaxial, bending, shear, and torsion loading", Journal ofEngineering Structures, 29, pp. 3404-3419 (2007).
16. Deifalla, A. and Ghobarah, A. \Strengthening RCT -beams subjected to combined torsion and shearusing FRP fabrics: Experimental study", Journal ofComposites for Construction, ASCE, 14, pp. 301-311(2010).
17. Prakash, S., Belarbi, A. and You, Y.M. \Seismicperformance of circular RC columns subjected to axialforce, bending, and torsion with low and moderateshear", Journal of Engineering Structures, 32, pp. 46-59 (2010).
18. Mullapudi, T.R.S. and Ayoub, A. \Analysis of rein-forced concrete columns subjected to combined axial, exure, shear, and torsional loads", Journal of Struc-tural Engineering, ASCE, 139, pp. 561-573 (2013).
19. Willam, K.J. and Warnke, E.P. \Constitutive modelsfor the triaxial behavior of concrete", Proceedings ofthe International Assoc. for Bridge and StructuralEngineering, 19, pp. 1-30 (1975).
20. Mosto�nejad, D. and Talaeitaba, S.B. \Nonlinearmodeling of RC beams subjected to torsion using thesmeared crack model", Journal of Procedia Engineer-ing, 14, pp. 1447-1454 (2011).
21. Hii, A.K.Y. and Al-Mahaidi, R. \An experimental andnumerical investigation on torsional strengthening ofsolid and box-section RC beams using CFRP lami-nates", Journal of Composite Structures, 75, pp. 213-221 (2006).
22. Kachlakev, D., Miller, T., Yim, S., Chansawat, K. and
Potisuk, T. \Finite element modeling of reinforced con-crete structures strengthened with FRP laminates",Final Report SPR 316 (2001).
23. Hemmaty, Y. \Modeling of the shear force transferredbetween cracks in reinforced and �ber reinforced con-crete structures", Proceedings of the ANSYS Confer-ence, Pittsburgh, Pennsylvania, USA, 1, pp. 123-138(1998).
24. Najim Mahmood, M. \Nonlinear analysis of reinforcedconcrete beams under pure torsion", Journal of Ap-plied Science, 7(22), pp. 3524-3529 (2007).
25. Talaeitaba S.B. and Mosto�nejad, D. \A new testsetup for experimental test of RC beams under com-bined shear and torsion", Journal of Advanced Mate-rials Research, 335, 336, pp. 355-358 (2011).
26. ACI 318-08: Building Code Requirement for StructuralConcrete (ACI318M-02) and Commentary-ACI 318R-08, American Concrete Institute, Farming Hills, MI,USA (2008).
Appendix A
The concrete post-cracking elasticity matrix:
D0c =E
(1 + �)2666666666666666664
Rt(1+�)E 0 0 0 0 0
0 11�� �
1�� 0 0 0
0 �1�� 1
1�� 0 0 0
0 0 0 �t2 0 0
0 0 0 0 12 0
0 0 0 0 0 �t2
3777777777777777775Appendix B
Numerical data for Figure 17 is as follows:
E E2 E3 E4 E5
Vu(kN)
Tu(kN. m)
Vu Tu Vu Tu Vu Tu Vu Tu
0.00 11.55 0.00 15.29 0.00 19.14 0.00 20.06 0.00 24.66
14.07 8.63 19.65 11.04 24.28 14.73 28.33 17.08 30.85 21.80
17.32 7.31 24.06 9.90 30.61 13.41 30.05 16.22 34.88 20.25
23.66 6.91 29.24 9.21 34.06 12.26 38.11 15.13 46.57 18.13
62.58 0.00 77.17 0.00 87.35 0.00 100.02 0.00 108.27 0.00

1262 S.B. Talaeitaba and M.E. Torki/Scientia Iranica, Transactions A: Civil Engineering 21 (2014) 1249{1262
Biographies
Sayed Behzad Talaeitaba is a PhD graduate ofcivil engineering from Isfahan University of Technologyand an assistant professor of Azad University. Hisprofessional background includes the coordination ofthe structural design team at Faratarh Ariana Corpora-tion, and his research interests include the mechanical
properties of FRP reinforced concrete.
Mohammad Ebrahim Torki is a PhD researchassistant at the Department of Aerospace Engineering,Texas A&M University, College Station, TX. He hasbeen a lecturer at Azad University, and his researchinterests include mechanics of composite materials andfracture mechanics.