Embed Size (px)
Citation preview

NONLINEAR DYNAMIC ANALYSIS OF 3 -D-
BASE-ISOLATED STRUCTURES
By Satish Nagarajaiah,1 Andrei M. Reinhorn,2 Member, ASCE, and Michalakis C. Constantinou,3 Associate Member, ASCE
ABSTRACT: In base-isolated structures specially designed isolation systems provide the needed flexibility and energy dissipation capacity. The isolation systems, which can be either elastomeric or sliding systems, exhibit highly nonlinear behavior. The existing algorithms cannot analyze base-isolated structures with sliding isolation systems accurately. This paper presents an analytical model and a solution algorithm developed for nonlinear dynamic analysis of three-dimensional-base-isolated structures with elastomeric and/or sliding isolation systems. The novelty of the analytical model and solution algorithm is its capability to capture the highly nonlinear frictional behavior of sliding isolation systems in plane motion. Nonlinear behavior is restricted to the base and the superstructure is considered to be elastic at all times. Biaxial and uniaxial models, which can represent both elastomeric and sliding isolation bearings, are presented. The solution algorithm consisting of the pseudoforce method with iteration is presented. Comparison of computed results with experimental results is presented for verification. A six-story-reinforced-concrete-base-isolated structure is analyzed.
INTRODUCTION
The concept of base isolation, which is rapidly gaining wide acceptance (Kelly 1986; Buckle and Mayes 1990), is one in which flexibility and energy dissipation capacity are provided by a specially designed isolation system that is placed between the superstructure and its foundation. Isolation systems used for seismic protection of buildings and bridges are mainly elastomeric isolation systems or sliding isolation systems. Flexibility in elastomeric isolation systems is provided by elastomeric bearings (laminated rubber bearings reinforced with steel plates). Energy-dissipation capacity is provided by the lead plug within the rubber unit, as in lead-rubber bearings or by inherent damping capacity of the rubber, as in high-damping elastomeric bearings or by steel dampers. Sliding bearings (Teflon-slider sliding on a stainless steel plate) in sliding isolation systems support and decouple the superstructure from the ground. Sliding bearings dissipate energy by means of frictional behavior. Restoring force or recentering capability is provided by helical springs or by springs in the form of rubber cylinders.
Analysis capability and code provisions of base-isolated buildings are still in a developmental stage. Only tentative code provisions have been developed by the Structural Engineering Association of California ("Tentative" 1990). A comprehensive analysis capability for base-isolated structures, with elastomeric and/or sliding isolation systems, with uplift-resistant mechanism and fail-safe systems, is still lacking.
'Res. Asst. Prof., Dept. of Civ. Engrg., State Univ. of New York, Buffalo, NY 14260.
2Prof., Dept. of Civ. Engrg., State Univ. of New York, Buffalo, NY. 3Assoc. Prof., Dept. of Civ. Engrg., State Univ. of New York, Buffalo, NY. Note. Discussion open until December 1, 1991. To extend the closing date one
month, a written request must be filed with the ASCE Manager of Journals. The manuscript for this paper was submitted for review and possible publication on June 25, 1990. This paper is part of the Journal of Structural Engineering, Vol. 117, No. 7, July, 1991. ©ASCE, ISSN 0733-9445/91/0007-2035/$1.00 + $.15 per page. Paper No. 25982.
2035

The existing algorithms specifically developed for base-isolated structures such as NPAD by Way and Jeng (1988), used for analysis of the Foothill Communities Law and Justice Center, California, or a general-purpose-finite-element program such as ANSR by Mondkar and Powell (1975), have plasticity-based nonlinear elements that can be used to model elastomeric isolation elements. However, these elements cannot model sliding isolation elements accurately. Hence, these algorithms cannot analyze base isolated structures with sliding isolation systems accurately.
This paper presents an analytical model and a solution algorithm developed specifically for the analysis of base-isolated structures with elastomeric and/or sliding isolation systems. The superstructure is modeled as an elastic frame-shear wall structure. The superstructure and base are modeled with three degrees of freedom per floor attached to the center of mass. The base and floors are assumed to be infinitely rigid in plane. The isolation bearings are modeled by a discrete model with nonlinear characteristics. The model developed can represent the uniaxial and biaxial behavior and the behavior of elastomeric and sliding isolation bearings. Furthermore, the isolation system may include linear springs and viscous elements.
The two-step solution algorithm developed involves the solution of equations of motion using the unconditionally stable Newmark's constant-average-acceleration method with the nonlinear forces being represented as pseu-doforces and the solution of differential equations governing the behavior of the nonlinear isolation elements using the unconditionally stable semi-implicit Runge-Kutta method (suitable for solution of stiff differential equations). Furthermore, an iterative procedure consisting of corrective pseudoforces is employed within each time step until equilibrium is achieved. The solution algorithm developed is accurate and efficient, especially for the solution of base-isolated structures with sliding isolation systems (Nagarajaiah 1990). The analytical model and the solution algorithm have been implemented in the computer program 3D-BASIS (Nagarajaiah et al. 1991).
Comparison with experimental results (Mokha et al. 1990a) and results obtained using the general-purpose finite element program ANSR (Mondkar and Powell 1975) are presented to verify the accuracy. The efficiency of the algorithm is demonstrated by analyzing a six-story—reinforced-concrete building on different isolation systems and comparing the response with results from two-dimensional analyses using Gear's method (Gear 1971) and DRAIN-2D (Kannan and Powell 1975).
MODELS FOR ISOLATION ELEMENTS
Isolation elements can be mainly, elastomeric bearings that can be represented by models with bilinear characteristics or sliding bearings that can be represented by models with rigid-plastic characteristics. Several models have been used to represent the uniaxial and biaxial behavior of isolation elements. The uniaxial and biaxial behavior of elastomeric bearings have been modeled by Japanese researchers (Yasaka et al. 1988) using the multiple spring model and by Way and Jeng (1988) using a plasticity-based nonlinear model. Younis et al. (1983) have analyzed plane motion of rigid bodies in contact with coulomb friction, taking into account biaxial effects. The writers have used the model presented in this paper for modeling uniaxial and biaxial effects (Nagarajaiah et al. 1990).
2036

The isolation system often experiences multidirectional motion under multidirectional excitation, wherein each isolation element experiences a different motion, and when sliding bearings are present in the isolation system multiple stick-slip conditions result. In such cases the conventional method of keeping track of transition from stick to sliding mode and vice versa described by Mostaghel et al. (1988) and Su et al. (1989) results in complications. Hence, in the presented analytical model a hysteretic model is used to represent the stick-slip behavior of sliding bearings. Sliding bearings are usually made of Teflon-steel interface and Teflon undergoes a small elastic shear deformation (of the order of 0.1-0.2 mm) before sliding commences (Constantinou et al. 1990). Even though the hysteretic model presented cannot capture rigid-plastic behavior, the small shear deformation of Teflon renders a finite but high elastic stiffness to the hysteretic loop, which can be captured by the hysteretic model.
The isolation elements presented in this paper can model both uniaxial and biaxial behavior of either elastomeric or sliding bearings. The model for sliding bearings can account for the variation of coefficient of friction with velocity and bearing pressure observed in Teflon sliding bearings (Constantinou et al. 1990). The model for elastomeric bearings can account for the change in energy dissipation capacity due to the variation of axial force. First the developed biaxial model is described and then the uniaxial model, which is a particular case of the biaxial model, is described.
Biaxial Model for Isolation Elements At a bearing undergoing plane motion,with displacement components Ux
and Uy and velocity components Ux and Uy in the X and Y directions, lateral forces develop and these forces exhibit biaxial interaction. In addition, a torsional moment develops at the bearing. The contribution of this torsional moment to the total torque exerted to the structure supported by several bearings is insignificant.
The direction of the resultant force at the bearing opposes the direction of the motion given by:
e^tan-'f^) (1) Vx.
The model presented herein accounts for the direction and magnitude of the resultant hysteretic force.
The model for biaxial interaction is based on the following set of equations proposed by Park et al. (1986):
Z,Y\ _ lAU, Zj) ~ \AU,
Zx[y sign (UXZX) + p] ZxZy[y sign (J/,ZV) + |3]
ZxZy[y sign (UXZX) + p] Z\\y sign (£>,ZV) + 0] a <* in which Zx and Zy = hysteretic dimensionless quantities, Y = the yield displacement, and A, y, and (5 = dimensionless quantities that control the shape of the hysteresis loop. The values of A = 1, 7 = 0.9, and (3 = 0.1 are used in this paper. When yielding commences, (2) has the following solution provided that A/((3 + 7) = 1 (Constantinou et al. 1990):
Zx = cos 9 (3a)
2037
Zy = sin 9 (3b)
Zx and Zy are bounded by values ± 1 and account for the direction and biaxial interaction of hysteretic forces. The interaction curve given by (2) is circular.
For a sliding bearing, the mobilized forces are described by the equations (Constantinou et al. 1990):
Fx = ix,sWZx (4a)
Fy = ^WZy (4b)
in which W = the vertical load carried by the bearing and JJL, = the coefficient of sliding friction, which depends on the value of bearing pressure, angle 8, and the instantaneous velocity of sliding U:
U=(U2X + UV>2 (5)
Zx and Zy, which are bounded by the values ± 1 , account for the conditions of separation and reattachment (instead of a signum function) and also account for the direction and biaxial interaction of frictional forces.
The coefficient of sliding friction is modeled by the following equation (Constantinou et al. 1990):
M-* = /max - A/exp (-a\U\) (6)
in which /max = the maximum value of the coefficient of friction and A/ = the difference between the maximum and minimum (at U ~ 0) values of the coefficient of friction. /max, A/, and a are functions of bearing pressure and angle 6 (Constantinou et al. 1990). To account for the effects of axial load, the parameters are adjusted based on experimental results (Mokha et al. 1990b). The dependency on the angle 0 is neglected.
For an elastomeric bearing, the mobilized forces are described by the equations:
Fy
FX = OL—UX + ( \ - a)FyZx (la)
Fy Fy = a — Uy + (1 - a)FyZy (lb)
in which a = the postyielding to preyielding stiffness ratio, Fy = the yield force, and Y = the yield displacement. Zx and Zy account for the direction and biaxial interaction of hysteretic forces. To account for the effects of axial load, parameter a , yield force Fy, and yield displacement Y are adjusted based on experimental results (Built 1982).
Uniaxial Model for Isolation Elements The biaxial interaction can be neglected when the off-diagonal elements
of the matrix in (2) are replaced by zeros. This results in a uniaxial model with two either frictional or bilinear independent elements in the two orthogonal directions.
VERIFICATION OF HYSTERETIC MODEL
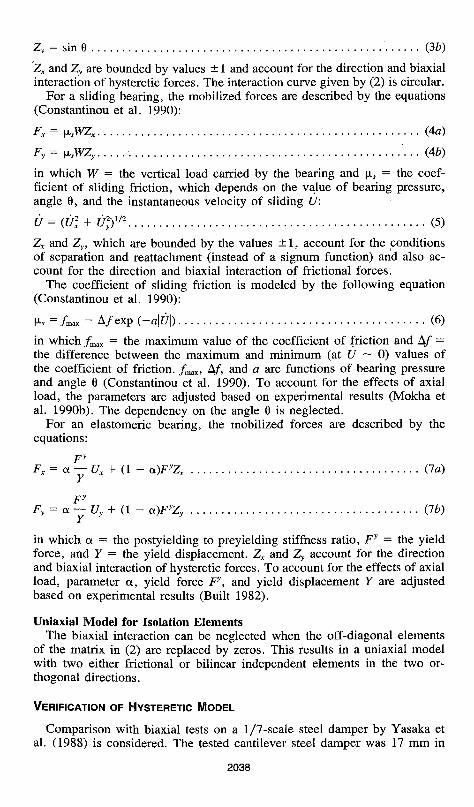
Comparison with biaxial tests on a 1/7-scale steel damper by Yasaka et al. (1988) is considered. The tested cantilever steel damper was 17 mm in
2038

O
CO
1 1
/ (f
( 1
(i
1
ij 1
/ A
V -
UX
-QX
\
iwk
r TT
TP
U
Y-Q
Y
DIS
PLA
CE
ME
NT
(C
M)
(a)
SIM
ULA
TIO
N
— IT
3
{A
^ -
|
—*.
s
ix-u
r
f
<* /
'// >,
/>
ux ft
> ' -Q
X
DIS
PLA
CE
ME
NT
(C
M)
(b)
EX
PE
RIM
EN
T
0.15
•
Ux/
Uo
Uy/
Uo
(C)
TIM
E (
SE
C)
FIG
. 1
. B
iaxi
al
Re
sults
of
1/7
-Sca
le S
teel
Dam
per
unde
r B
idir
ect
ion
al
Mo
tio
n:
(a)
Sim
ula
ted
; (b
) E
xpe
rim
en
tal,
Sim
ula
ted
Bia
xia
l F
rict
ion
Be
ha
vio
r o
f T
eflo
n-S
teel
Int
erfa
ce u
nd
er
Bid
ire
ctio
na
l M
oti
on
; (c
) F
orce
-Dis
plac
emen
t L
oo
p;
(d)
For
ce T
ime
His
tory
(1
ton
= 9
.81
kN)

diameter and had an effective height of 100 mm. The steel damper had a lateral elastic stiffness of 2.58 ton/cm (2.53 kN/mm; 1 metric ton = 9.81 kN), yield force of 0.286 ton (2.8056 kN), and yield displacement of 0.111 cm (1.11 mm). The hysteresis loops are simulated using (2) and (7), with a = 0.023. The bidirectional motion shown in Fig. 1(a) and (b) is given by:
Ux = U0 sin co? (8a)
Vy = U0 sin 2wr (8fc)
in which U0 = 2.93 cm (29.3 mm) and co = 1.57 rad/s. The simulated and experimental results shown in Fig. 1(a) and (b) indicate good agreement. In Fig. 1(a) and (b), Qx and Qy represent forces and Ux and Uy represent displacements, in the X and Y directions, respectively.
Experimental results are available for uniaxial sliding behavior of Teflon-steel interfaces (Mokha et al. 1990b) and good agreement between the simulated and experimental loops was obtained (Nagarajaiah 1990) when the uniaxial model for sliding bearings was used. However, no experimental data is available for biaxial sliding behavior, hence only indirect verification (Constantinou et al. 1990) is presented for the biaxial model for sliding bearings. Teflon-steel interface at 1,000 psi (6.9 MPa) is considered. The parameters in (6) from Constantinou et al. (1990) are/max = 0.1193, A/ = 0.0927, and a = 0.6 sec/in. (0.02363 s/mm). The hysteresis loops are simulated using (2) and (4), with Y = 0.01 in. (0.254 mm). The bidirectional motion shown in the upper left corner of Fig. 1(c) is based on (8) with U0 = 1 in. (25.4 mm) and w = 1 rad/s. The simulated results for the bidirectional motion are shown in Fig. 1(c) and (d) along with the uniaxial case (results in the Y direction are partially shown only for the biaxial case for clarity). The results shown in Fig. 1(c) and (d) have the following features: the biaxial force in X direction approaches the uniaxial force in X direction, when the biaxial force in Y direction approaches zero value, indicating appropriate interaction. This can be observed at points 2 and 4 in Fig. 1(d). Furthermore, the biaxial force in X direction is zero at point 3, wherein the motion is only in the Y direction. Note the marked similarity of the simulated hysteresis loops in Fig. 1(c) with experimental hysteresis loops of the steel damper shown in Fig. 1(b). Further verification of both biaxial and uniaxial models can be found in Nagarajaiah (1990).
EQUATIONS OF MOTION AND SOLUTION ALGORITHM
The elastic frame-shear wall superstructure and the base are modeled with three degrees of freedom per floor attached to the center of mass. The base and floors are assumed to be infinitely rigid in plane. The isolation system may consist of elastomeric and/or sliding isolation bearings, linear springs, and viscous elements. The equations of motion for the elastic superstructure are expressed in the following form:
M„x„u„xl + C„x„u„xi + K„x„u„xl = -M„x„R„x3(«g + %hxi (9)
in which n = three times the number of floors, M = the diagonal superstructure mass matrix, C = the superstructure damping matrix, K = the superstructure stiffness matrix, and R = the matrix of earthquake influence
2040
coefficients, i.e., the matrix of displacements and rotation at the center of mass of the floors resulting from a unit translation in the X and Y directions and unit rotation at the center of mass of the base. Furthermore, ii, u, and u represent the floor acceleration, velocity, and displacement vectors relative to the base, u4 = the vector of base acceleration relative to the ground, and ug = the vector of ground acceleration.
The equations of motion for the base are as follows:
R3x„M„x„[(u) + R(fl» + u s)L x l + M^tfk* + ug)3 x l + C ^ J u ^ x !
+ K ^ u ^ x , + (f)3xl = 0 (10)
in which Mb = the diagonal mass matrix of the rigid base, Cb = the resultant damping matrix of viscous isolation elements, Kb = the resultant stiffness matrix of elastic isolation elements, and f = the vector containing the forces mobilized in the nonlinear elements of the isolation system such as the presented elements for sliding or elastomeric bearings. Employing modal reduction:
u„ = <&„ (11)
in which <& = the modal matrix normalized with respect to the mass matrix, u* = the modal displacement vector relative to the base, and m = the number of eigenvectors retained in the analysis. Combining ( 9 ) - ( l l ) , the following equation is derived:
] 3>rMR R7M3> RTMR + M„
VU*/(m+3)xl
<aj 0 0 K„
4>rMR R rMR + M6_ (m+3)
( • ' ) +
(m+3)x(m+3) V U i > / ( m + 3 ) x l
2&w, 0
0
cJ (m+3)x(m + 3)
(ra+3)x(m+3) V U i , / ( m + 3 ) x l V / (m+3)xl
ii„ X3
(12)
in which £, = the modal damping factor and <o, = the natural frequency of the fixed base structure in the ith mode. In (12) matrices 2|,co, and to? are diagonal.
Eq. (12) can be written as follows:
Mu, + Cu, + Ku, + f, = P,
At time t + Af
fr+Ar — P(+Af •
Writ ten in incremental form
MAuH CAu,H KAuH Af,4 Mu, - Cu, - Ku, - f,.
(13)
(14)
(15)
in which , M , C , K , and P represent the reduced m a s s , damping , stiffness, and load matr ices [see (12)] . Fur thermore , the state,of mot ion of moda l superstructure and base is represented by vectors u „ u, and u, [see (12)] .
The incremental nonlinear force vector Af,+A, in (15) is unknown . This vector is brought on to the r ight-hand side of-(15) and treated as a pseu-doforce vector. The two-step solution algori thm developed involves the solution of equations of mot ion using the uncondit ional ly stable N e w m a r k ' s
2041
constant-average-acceleration method and the solution of differential equations governing the behavior of the nonlinear isolation elements using the unconditionally stable semi-implicit Runge-Kutta method (Rosenbrock 1964) suitable for solution of stiff differential equations. Furthermore, an iterative procedure consisting of corrective pseudoforces is employed within each time step until equilibrium is achieved. The pseudoforce method with iteration is used for the solution since it is accurate and efficient, especially for solution of base-isolated structures with sliding systems (Nagarajaiah 1990). The developed solution algorithm is shown below:
1. Initial conditions. a. Form stiffness matrix K, mass matrix M, and damping matrix C. In
itialize u0, u0 and u0. b. Select time step Af, set parameters 8 = 0.25 and 6 = 0.5, and calculate
the integration constants:
1 at = (16a)
S(Af)2
*2 = i (m)
fl3 = 2^ ( 1 6 C )
a, = — (16d) 8Af
e a5 = - (16e)
8
«6 = A ^ - - 1 ) (16/)
c. Form the effective stiffness matrix
K* = a,M + a4C + K (17)
d. Triangularize K* using Gaussian elimination (only if the time step is different from the previous step).
2. Iteration at each time step. a. Assume the pseudoforce vector
Af;+A, = 0 (18)
in iteration i = 1.
b. Calculate the effective load vector at time t + At:
Pf+A, = AP,+A, - Af;+A, + M(a2u, + a3u,) + c(a5u, + a6ut) (19)
AP,+A, = P,+A, - (Mi , + Cii, + Ku, + f,) (20)
c. Solve for displacements at time t + A;:
K*Aui+A, = Pf+A( (21)
2042

d. Update the state of motion at time t + At:
U,+A/ = u, + aiAfl;+A/ - o2u, - a3u, (22)
U,+A, = u, + a4Au{+A, - a5u, - a6u, (23)
U,+A» = u, + AUJ+A, (24)
e. Compute the state of motion at each bearing and solve for the nonlinear forces [(2) and (4) or (7)] at each bearing using the semi-implicit Runge-Kutta method.
f. Compute the resultant nonlinear force vector at the center of mass of the base Afj+i,.
g. Compute
|Af;:i, - Af;+A,| error = (25)
ref. max moment
where | • | is the euclidean norm. h. If error a tolerance, further iteration is needed; iterate starting from
step 2a and use AfJ+A, as the pseudoforce vector and the state of motion at time t, u„ u„ and u,.
i. If error :£ tolerance, no further iteration is needed; update the nonlinear force vector f,+A, = f, + Af£A„ reset time step if necessary, and go to step 2a if the time step is not reset or lb if the time step is reset.
Varying Time Step for Accuracy The solution algorithm has the option of using a constant time step or
variable time step. The time step is reduced from Afslip—the time step at high velocity dictated by standard requirements of numerical accuracy and stability—to a fraction of its value at low velocities to maintain accuracy, especially in sliding isolated structures (Nagarajaiah 1990). The time step is reduced based on the magnitude of the resultant velocity at the center of mass of the base:
A^stick ~ Afsiip 1 - exp I c
(26)
in which u = resultant velocity at the center of mass of the base, Afstick = reduced time step used when the structure velocity is low (Afslip > Afstick > Afsiip/tt/, nl = integer to introduce the desired reduction), and c = constant to define the range of velocity over which the reduction takes place. The time step is not reduced continuously as implied by (26), but rather at discrete intervals of velocity, for computational efficiency.
VERIFICATION OF ALGORITHM
Comparison with Experimental Results of Six-Story-Sliding-Base-Isolated Model
Comparison with experimental results of a shake table test (Mokha et al. 1990a) performed on a 1/4-scale artificial mass-simulation model (total weight 228.6 kN) of a six-story steel moment-resisting frame with a sliding isolation system called the friction pendulum system (FPS) is considered. The model
2043
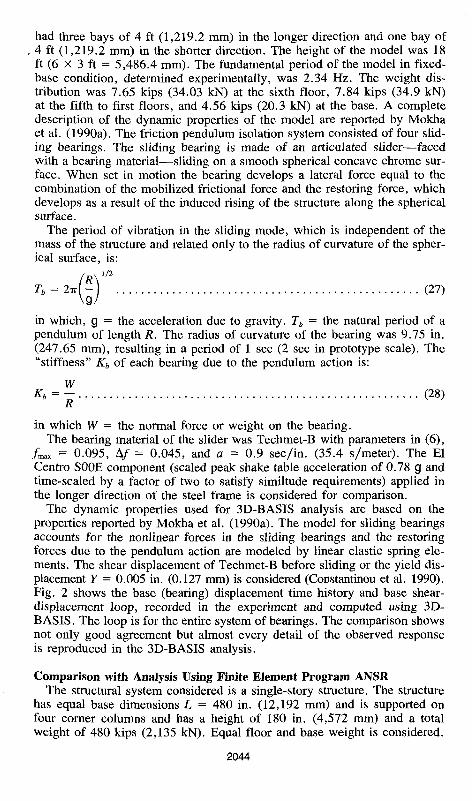
had three bays of 4 ft (1,219.2 mm) in the longer direction and one bay of 4 ft (1,219.2 mm) in the shorter direction. The height of the model was 18 ft (6 X 3 ft = 5,486.4 mm). The fundamental period of the model in fixed-base condition, determined experimentally, was 2.34 Hz. The weight distribution was 7.65 kips (34.03 kN) at the sixth floor, 7.84 kips (34.9 kN) at the fifth to first floors, and 4.56 kips (20.3 kN) at the base. A complete description of the dynamic properties of the model are reported by Mokha et al. (1990a). The friction pendulum isolation system consisted of four sliding bearings. The sliding bearing is made of an articulated slider—faced with a bearing material—sliding on a smooth spherical concave chrome surface. When set in motion the bearing develops a lateral force equal to the combination of the mobilized frictional force and the restoring force, which develops as a result of the induced rising of the structure along the spherical surface.
The period of vibration in the sliding mode, which is independent of the mass of the structure and related only to the radius of curvature of the spherical surface, is:
/R\i/2
Tb = 2-rrl - J (27)
in which, g = the acceleration due to gravity. Tb = the natural period of a pendulum of length R. The radius of curvature of the bearing was 9.75 in. (247.65 mm), resulting in a period of 1 sec (2 sec in prototype scale). The "stiffness" Kb of each bearing due to the pendulum action is:
W Kb = ~ (28)
R in which W = the normal force or weight on the bearing.
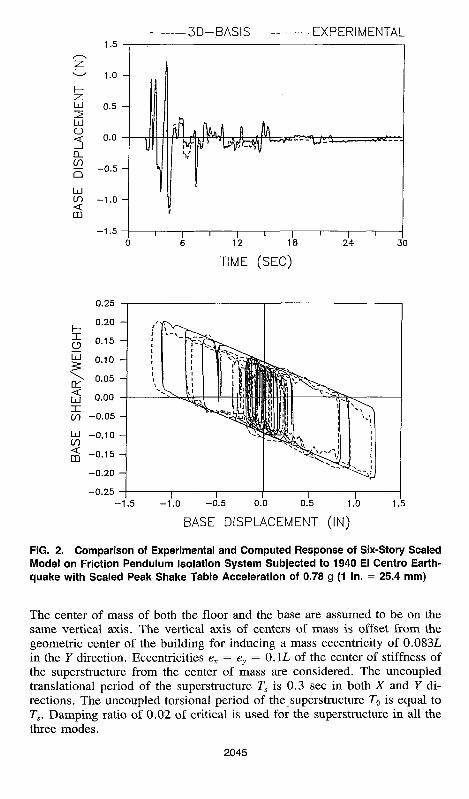
The bearing material of the slider was Techmet-B with parameters in (6), /max = 0.095, A/ = 0.045, and a = 0.9 sec/in. (35.4 s/meter). The El Centro S00E component (scaled peak shake table acceleration of 0.78 g and time-scaled by a factor of two to satisfy similtude requirements) applied in the longer direction of the steel frame is considered for comparison.
The dynamic properties used for 3D-BASIS analysis are based on the properties reported by Mokha et al. (1990a). The model for sliding bearings accounts for the nonlinear forces in the sliding bearings and the restoring forces due to the pendulum action are modeled by linear elastic spring elements. The shear displacement of Techmet-B before sliding or the yield displacement Y = 0.005 in. (0.127 mm) is considered (Constantinou et al. 1990). Fig. 2 shows the base (bearing) displacement time history and base shear-displacement loop, recorded in the experiment and computed using 3D-BASIS. The loop is for the entire system of bearings. The comparison shows not only good agreement but almost every detail of the observed response is reproduced in the 3D-BASIS analysis.
Comparison with Analysis Using Finite Element Program ANSR The structural system considered is a single-story structure. The structure
has equal base dimensions L = 480 in. (12,192 mm) and is supported on four corner columns and has a height of 180 in. (4,572 mm) and a total weight of 480 kips (2,135 kN). Equal floor and base weight is considered.
2044
-3D-BASIS EXPERIMENTAL
TIME (SEC)
0.25
- 1 . 0
BASE DISPLACEMENT (IN)
FIG. 2. Comparison of Experimental and Computed Response of Six-Story Scaled Model on Friction Pendulum Isolation System Subjected to 1940 El Centra Earthquake with Scaled Peak Shake Table Acceleration of 0.78 g (1 in. = 25.4 mm)
The center of mass of both the floor and the base are assumed to be on the same vertical axis. The vertical axis of centers of mass is offset from the geometric center of the building for inducing a mass eccentricity of 0.083L in the Y direction. Eccentricities ex = ey = 0.1L of the center of stiffness of the superstructure from the center of mass are considered. The uncoupled translational period of the superstructure Ts is 0.3 sec in both X and Y directions. The uncoupled torsional period of the superstructure J9 is equal to Ts. Damping ratio of 0.02 of critical is used for the superstructure in all the three modes.
2045
An isolation system consisting of four lead-rubber bearings placed below the columns is considered. The design of the isolation system was based on a ground motion with the characteristics of the ATC 0.4 g S2 spectrum and on the procedure developed by dynamic isolation systems (Seismic 1983). The torsional response was not accounted for in the design. A design live load of 200 kips (889.6 kN) was considered in addition to the total dead load of 480 kips (2,135 kN). The bearings chosen were of 13-in. (330.2-mm) diameter and composed of 18 layers of natural rubber (hardness 50) of 0.375-in. (9.53-mm) thickness. Lead plugs of 2.5-in. (63.5-mm) diameter were placed in all four bearings. The properties of bearings determined were the initial elastic stiffness of 17.8 kips/in. (3.12 kN/mm), the postyielding stiffness of 2.74 kips/in. (0.48 kN/mm), and the yield strength Fy of 6.6 kip (29.36 kN). The total yield strength of the isolation system is 5.5% the total weight
The rigid body mode period:
(w\U2
rfc = 2ir — (29) \Kbg/
in which W = the total weight and Kb = the total postyielding stiffness of four lead-rubber bearings. Tb in the present case is 2.12 sec. The biaxial model for elastomeric bearings is used to model the lead-rubber bearings.
The ground motion considered is 1940 El Centro. The S00E component is input in the X direction and S90W component is input in the Y direction. Fig. 3 shows the base displacement response at a corner bearing where maximum response occurred. The peak ground displacement (PGD) of 4.29 in. (108.96 mm) is used for normalizing the displacement response. The comparison shows good agreement between response computed using 3D-BASIS and ANSR, with completely different modeling and solution procedures. The time step of computation was kept constant at 0.01 sec in both analyses (3D-BASIS and ANSR). The CPU time on a VAX 8700 was 16 sec for 3D-BASIS analysis and 14 sec for ANSR analysis.
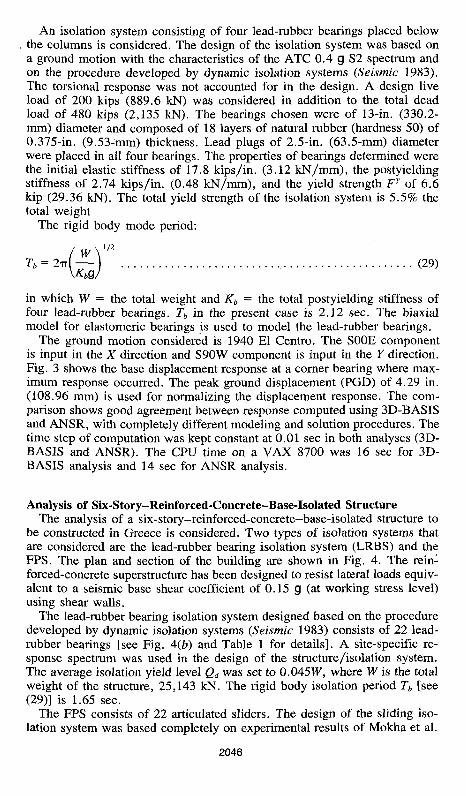
Analysis of Six-Story-Reinforced-Concrete-Base-Isolated Structure The analysis of a six-story-reinforced-concrete—base-isolated structure to
be constructed in Greece is considered. Two types of isolation systems that are considered are the lead-rubber bearing isolation system (LRBS) and the FPS. The plan and section of the building are shown in Fig. 4. The rein-forced-concrete superstructure has been designed to resist lateral loads equivalent to a seismic base shear coefficient of 0.15 g (at working stress level) using shear walls.
The lead-rubber bearing isolation system designed based on the procedure developed by dynamic isolation systems (Seismic 1983) consists of 22 lead-rubber bearings [see Fig. 4(b) and Table 1 for details]. A site-specific response spectrum was used in the design of the structure/isolation system. The average isolation yield level Qd was set to 0.045W, where W is the total weight of the structure, 25,143 kN. The rigid body isolation period Tb [see (29)] is 1.65 sec.
The FPS consists of 22 articulated sliders. The design of the sliding isolation system was based completely on experimental results of Mokha et al.
2046

3D-BASIS •ANSR
Q O D-
U
bJ O
Q_
Q
O
a: < CD
X <
6 9
TIME (SEC)
TIME (SEC)
FIG. 3. Comparison of Response Computed Using 3D-BASIS and ANSR of Single-Story Structure on Lead-Rubber Isolation System Subjected to El Centro Earthquake with Component SOOE in X Direction and Component S90W in Y Direction (Peak Ground Displacement = 108.9 mm)
(1990a). The bearing material of the slider was Techmet-B with parameters in (6) from Mokha et al. (1990a) being/max = 0.095, A/ = 0.045, and a = 0.9 sec/in. (35.4 s/m). The radius of curvature of the spherical concave surface was chosen to be 1 m so that the period of vibration in the sliding mode [see (27)] is 2 sec. The equivalent "stiffness" Kb of the articulated slider was calculated based on the normal force at each bearing.
Response of Structure with Lead-Rubber-Bearing Isolation System The superstructure is modeled as a three-dimensional building using ETABS
2047
LEAD-RUBBER OR SLIDING BEARINGS
ROOF
5th FL.
4th FL.
3rd FL
2nd FL,
1st FL.
6.65 m , i , 6.65 m.,
3.2 m
3.2 m
3.3 m
3.6 m
3.2 m
3.7 m
(a)
6.65
6.85
W—
9.15 m
LEAD 7 rRUBBER
BEARING
S 1 5 - 9 - 2 . 7 5
S 1 8 - 9 - 4 . 0
S 2 1 - 9 - 3 . 5
3.45 m
ZW1
CENTER OF
I i f o-ofeJk^l3 _ i ^ ^ n a k- m—I—y^s^t F S 1 ^ : w- r = *— ^ = t # r
! a.1 m I !1.2 m r 1-3 Pi i N m
3.6 m i 3.6 m 3.6 m 3.6 m
(h)
FIG. 4. Six-Story-Reinforced-Concrete-Base-lsolated Structure: (a) Section; (b) Plan
(Wilson et al. 1975). The frequencies and mode shapes of the first six modes (shown in Table 2) are used to model the superstructure in 3D-BASIS. Damping ratio of 0.05 is used for the superstructure in all the modes. The lead-rubber bearings are modeled using the biaxial model for elastomeric bearings (see Table 1 for details of the parameters). The dynamic response is computed for three artificial accelerograms, of 20-sec duration. These artificial accelerograms are realized from the site-specific response spectrum.
The peak response values due to one of the three earthquakes that gave the maximum response are shown in Table 3. The same earthquake gave maximum response in the X and Y directions. In Table 3 the response in the X direction is shown when the ground motion is applied in the X direction
2048
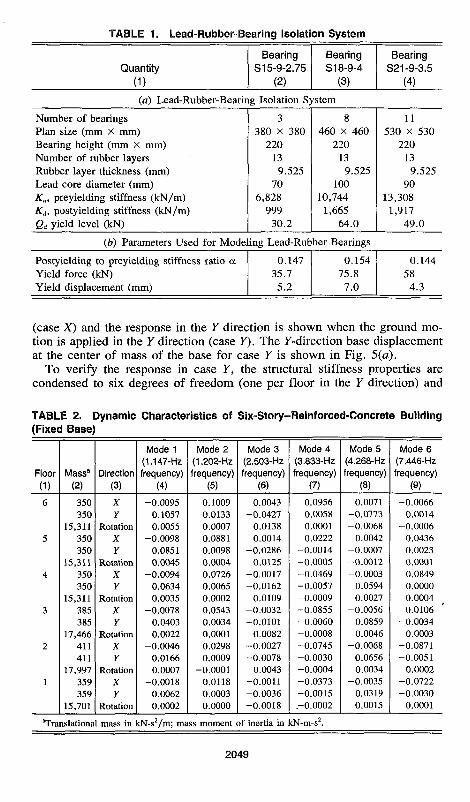
TABLE 1. Lead-Rubber-Bearing Isolation System
Quantity (1)
Bearing S15-9-2.75
(2)
Bearing S18-9-4
(3)
Bearing S21-9-3.5
(4)
(a) Lead-Rubber-Bearing Isolation System
Number of bearings
Plan size (mm X mm)
Bearing height (mm X mm)
Number of rubber layers
Rubber layer thickness (mm)
Lead core diameter (mm)
Ku, preyielding stiffness ( k N / m )
Kd> postyielding stiffness ( k N / m )
Qd yield level (kN)
3
380 x 380
220
13
9.525
70
6,828
999
30.2
8 460 x 460
220
13 9.525
100
10,744
1,665
64.0
11
530 X 530 220
13
9.525 90
13,308
1,917
49 .0
(b) Parameters Used for Modeling Lead-Rubber Bearings
Postyielding to preyielding stiffness ratio a
Yield force (kN)
Yield displacement (mm)
0 .147
35.7
5.2
0 .154
75.8
7.0
0 .144
58
4 ,3
(case X) and the response in the Y direction is shown when the ground motion is applied in the Y direction (case Y). The 7-direction base displacement at the center of mass of the base for case Y is shown in Fig. 5(a).
To verify the response in case Y, the structural stiffness properties are condensed to six degrees of freedom (one per floor in the Y direction) and
TABLE 2. Dynamic Characteristics of Six-Story-Reinforced-Concrete Building (Fixed Base)
Floor
(1)
6
5
4
3
2
1
Mass8
(2)
350 350
15,311 350 350
15,311 350 350
15,311 385 385
17,466 411 411
17,997 359 359
15,701
Direction
(3)
X ¥
Rotation X Y
Rotation X Y
Rotation X Y
Rotation X Y
Rotation X Y
Rotation
Mode 1 (1.147-Hz frequency)
(4)
-0.0095 0.1057 0.0055
-0.0098 0.0851 0.0045
-0.0094 0.0634 0.0035
-0.0078 0.0403 0.0022
-0.0046 0.0166 0.0007
-0.0018 0.0062 0.0002
Mode 2 (1.202-Hz frequency)
(5)
0.1009 0.0133 0.0007 0.0881 0.0098 0.0004 0.0726 0.0065 0.0002 0.0543 0.0034 0.0001 0.0298 0.0009
-0.0001 0.0118 0.0003 0.0000
Mode 3 (2.503-Hz frequency)
(6)
0.0043 -0.0427
0.0138 0.0014
-0.0286 0.0125
-0.0017 -0.0162
0.0109 -0 .0032 -0.0101
0.0082 -0.0027 -0.0078
0.0043 -0.0011 -0.0036 -0.0018
Mode 4 (3.833-Hz frequency)
(7)
0.0956 0.0058 0.0001 0.0222
-0.0014 -0 .0005 -0.0469 -0.0057 -0.0009 -0.0855 -0.0060 -0.0008 -0.0745 -0.0030 -0.0004 -0.0373 -0.0015 -0.0002
Mode 5 (4.268-Hz frequency)
(8)
0.0071 -0.0773 -0.0068
0.0042 -0.0007 -0.0012 -0.0003
0.0594 0.0027
-0.0056 0.0859 0.0046
-0.0068 0.0656 0.0034
-0.0035 0.0319 0.0015
Mode 6 (7.446-Hz frequency)
(9)
-0.0066 0.0014
-0.0006 0.0436 0.0023 0.0001 0.0849 0.0000 0.0004 0.0106
-0.0034 0.0003
-0.0871 -0.0051
0.0002 -0.0722 -0.0030
0.0001
"Translational mass in kN-s2/m; mass moment of inertia in kN-m-s2.
2049
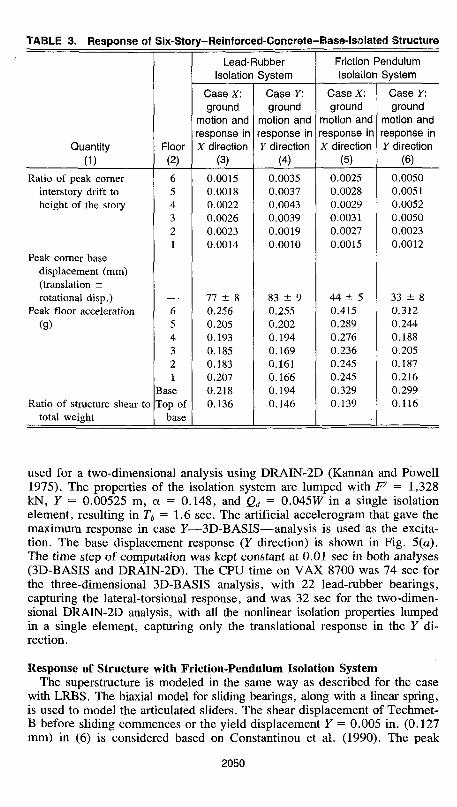
TABLE 3. Response of Six-Story-Reinforced-Concrete-Base-Isolated Structure
Quantity
(1)
Ratio of peak corner interstory drift to height of the story
Peak corner base displacement (mm) (translation ± rotational disp.)
Peak floor acceleration
(9)
Ratio of structure shear to total weight
Floor (2)
6 5 4 3 2 1
6 5 4 3 2 1
Base Top of
base
Lead-Rubber Isolation System
Case X: ground
motion and response in X direction
(3)
0.0015 0.0018 0.0022 0.0026 0.0023 0.0014
77 ± 8 0.256 0.205 0.193 0.185 0.183 0.207 0.218 0.136
Case Y: ground
motion and response in Y direction
(4)
0.0035 0.0037 0.0043 0.0039 0.0019 0.0010
83 ± 9 0.255 0.202 0.194 0.169 0.161 0.166 0.194 0.146
Friction Pendulum Isolation System
Case X: ground
motion and response in X direction
(5)
0.0025 0.0028 0.0029 0.0031 0.0027 0.0015 :
44 ± 5 0.415 0.289 0.276 0.236 0.245 0.245 0.329 0.139
Case Y: ground
motion and response in Y direction
(6)
0.0050 0.0051 0.0052 0.0050 0.0023 0.0012
33 ± 8 0.312 0.244 0.188 0.205 0.187 0.216 0.299 0.116
used for a two-dimensional analysis using DRAIN-2D (Kannan and Powell 1975). The properties of the isolation system are lumped with Fy = 1,328 kN, Y = 0.00525 m, a = 0.148, and Qd = 0.045W in a single isolation element, resulting in Tb = 1.6 sec. The artificial accelerogram that gave the maximum response in case Y—3D-BASIS—analysis is used as the excitation. The base displacement response (Y direction) is shown in Fig. 5(a). The time step of computation was kept constant at 0.01 sec in both analyses (3D-BASIS and DRAIN-2D). The CPU time on VAX 8700 was 74 sec for the three-dimensional 3D-BASIS analysis, with 22 lead-rubber bearings, capturing the lateral-torsional response, and was 32 sec for the two-dimensional DRAIN-2D analysis, with all the nonlinear isolation properties lumped in a single element, capturing only the translational response in the Y direction.
Response of Structure with Friction-Pendulum Isolation System The superstructure is modeled in the same way as described for the case
with LRBS. The biaxial model for sliding bearings, along with a linear spring, is used to model the articulated sliders. The shear displacement of Techmet-B before sliding commences or the yield displacement Y = 0.005 in. (0.127 mm) in (6) is considered based on Constantinou et al. (1990). The peak
2050

^~. E h
Ul in
EM
EN
T
THE
B
A
Sl8 Q <
Mli . ^ O
UJ
z o
1 0 0 -
8 0 -
6 0 -
4 0 -
2 0 -
0 -
- 2 0 -
- 4 0 -
- 6 0 -
- 8 0 -
J U U H J I J
.4. / \ k r v
B i* / \ / 1 /
'»>{ ^ X-ll
1 1 1 1 1 1 1 1 1
u
L
I 1 " i i M
1 t '/i / a 'J 1 i ' l i l
I i l i
r\MIIN^U
- R SYSTEM
,, A
'A ;' \̂ 3 W V ** / / N - « I I ',#( y ^ > ^
I 1 1 V
1 1 1 1 1 ' 2 4 6 8 10 12 14 16 18 20
TIME (SEC)
3DBASIS •-- GEAR
Ul
3 i - m
ujuj Ul1^
o < U l 2
TIME (SEC)
FIG. 5. Response of Six-Story-Reinforced-Concrete Structure to Simulated Earthquake: (a) Lead-Rubber Isolation System; (ft) Friction Pendulum Isolation System
response occurred for the artificial accelerogram that gave the maximum response in the lead-rubber bearing isolation system. The peak response values are shown in Table 3. The Y direction base displacement at the center of mass of the base for case Y is shown in Fig. 5(b).
To verify the response in case Y, the structural stiffness properties are condensed to six degrees of freedom (one per floor in the Y direction) and used for a two-dimensional analysis. The properties of the isolation system are lumped in a single isolation element. The equivalent "stiffness" Kb is based on the total normal force on all bearings. However, the parameters in
2051
100 mm 1 g FPS SYSTEM
- 6 t h o
- 5 t h t)
4th >̂
- 3 r d b
- 2 n d b
- 1st <
base
DISR ACCLN.
1 T
9
6
T
? &
t=5 .311 sec t=5 .341 sec t=5 .431 sec t=14 .161 sec
(PK. DRIFT) (PK. BASE SHEAR)(PK. BASE DISP.) (PK. ACCEL.)
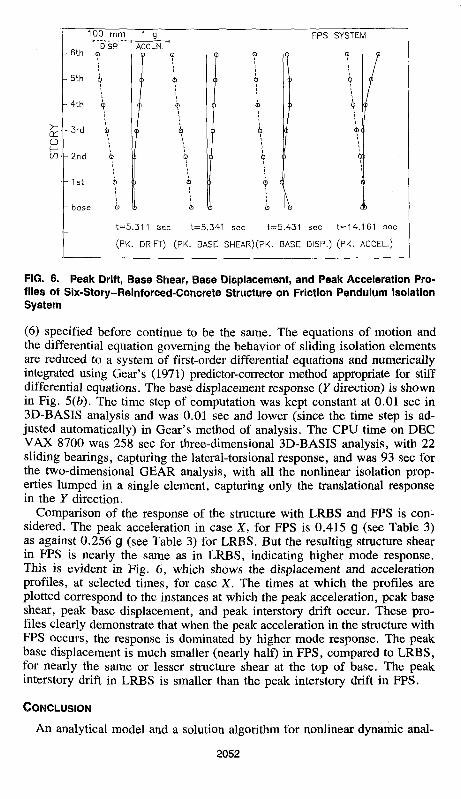
FIG. 6. Peak Drift, Base Shear, Base Displacement, and Peak Acceleration Profiles of Six-Story-Reinforced-Concrete Structure on Friction Pendulum Isolation System
(6) specified before continue to be the same. The equations of motion and the differential equation governing the behavior of sliding isolation elements are reduced to a system of first-order differential equations and numerically integrated using Gear's (1971) predictor-corrector method appropriate for stiff differential equations. The base displacement response (Y direction) is shown in Fig. 5(b). The time step of computation was kept constant at 0.01 sec in 3D-BASIS analysis and was 0.01 sec and lower (since the time step is adjusted automatically) in Gear's method of analysis. The CPU time on DEC VAX 8700 was 258 sec for three-dimensional 3D-BASIS analysis, with 22 sliding bearings, capturing the lateral-torsional response, and was 93 sec for the two-dimensional GEAR analysis, with all the nonlinear isolation properties lumped in a single element, capturing only the translational response in the Y direction.
Comparison of the response of the structure with LRBS and FPS is considered. The peak acceleration in case X, for FPS is 0.415 g (see Table 3) as against 0.256 g (see Table 3) for LRBS. But the resulting structure shear in FPS is nearly the same as in LRBS, indicating higher mode response. This is evident in Fig. 6, which shows the displacement and acceleration profiles, at selected times, for case X. The times at which the profiles are plotted correspond to the instances at which the peak acceleration, peak base shear, peak base displacement, and peak interstory drift occur. These profiles clearly demonstrate that when the peak acceleration in the structure with FPS occurs, the response is dominated by higher mode response. The peak base displacement is much smaller (nearly half) in FPS, compared to LRBS, for nearly the same or lesser structure shear at the top of base. The peak interstory drift in LRBS is smaller than the peak interstory drift in FPS.
CONCLUSION
An analytical model and a solution algorithm for nonlinear dynamic anal-
2052

ysis of three-dimensional-base-isolated structures with either elastomeric and/ or sliding isolation systems has been presented. Fundamental novelty of the analytical model and solution algorithm is its capability to capture the highly nonlinear frictional behavior of sliding isolation systems in plane motion. Biaxial and uniaxial models for both elastomeric and sliding isolation bearings have been presented. The solution algorithm consisting of the pseu-doforce method with iteration has been presented.
The comparison with test results of the model sliding base-isolated structure demonstrates the accuracy of the modeling and solution algorithm. The analysis of six-story-reinforced-concrete structure on FPS demonstrates the efficiency. The analytical model and solution algorithm developed offer a significant analysis capability.
ACKNOWLEGMENTS
This work has been supported by the National Center for Earthquake Engineering Research (which is supported by the National Science Foundation Grant No. ECE 86-07591 and the State of New York). This support is gratefully acknowledged.
APPENDIX. REFERENCES
Buckle, I. G., and Mayes, R. L. (1990). "Seismic isolation: history, application, and performance—A world overview." Earthquake Spectra, 6(2), 161-202.
Built, S. M. (1982). "Lead-rubber dissipators for the base isolation of bridge structures." Report No. 289, Dept. of Civ. Engrg., Univ. of Auckland, Auckland, New Zealand.
Constantinou, M. C , Mokha, A., and Reinhorn, A. M. (1990). "Teflon bearings in base isolation II: Modeling." J. Struct. Engrg., ASCE, 116(2), 455-474.
Gear, C. W. (1971). "The automatic integration of ordinary differential equations." Numerical Mathematics, Communications of ACM, 14(3), 176-190.
Kannan, A. M., and Powell, G. H. (1975). "DRAIN-2D: a general purpose computer program for dynamic analysis of inelastic plane structures with users guide." Report No. UCB/EERC-73/22, Earthquake Engrg. Res. Ctr., Univ. of California, Berkeley, Calif.
Kelly, J. M. (1986). "Aseismic base isolation: review and bibliography." Soil Dyn. Earthquake Engrg., 5(4), 202-217.
Mokha, A., Constantinou, M. C , and Reinhorn, A. M. (1990a). "Experimental study and analytical prediction of earthquake response of a sliding isolation system with a spherical surface." Report No. NCEER-90-0020, Nat. Ctr. for Earthquake Engrg. Res., State Univ. of New York, Buffalo, N.Y.
Mokha, A., Constantinou, M. C , and Reinhorn, A. M. (1990b). "Teflon bearings in base isolation I: Testing." / . Struct. Engrg., ASCE, 116(2), 438-454.
Mondkar, D. P., and Powell, G. H. (1975). "ANSR—general purpose program for analysis of nonlinear structural response." Report No. UCB/EERC-75/37, Earthquake Engrg. Res. Ctr., Univ. of California, Berkeley, Calif.
Mostaghel, N., and Khodaverdian, M. (1988). "Seismic response of structures supported on R-FBI system." Earthquake Engrg. Struct. Dyn., 16(4), 839-854.
Nagarajaiah, S. (1990). "Nonlinear dynamic analysis of three dimensional base isolated structures," thesis presented to the State University of New York, Buffalo, New York, in partial fulfillment of the requirements for the degree of Doctor of Philosophy.
Nagarajaiah, S., Reinhorn, A. M., and Constantinou, M. C. (1990). "Analytical modeling of three dimensional behavior of base isolation devices." Proc. Fourth
2053
U.S. Nat. Conf. on Earthquake Engrg., Earthquake Engrg. Res. Inst., 3, 579-588.
' Nagarajaiah, S., Reinhorn, A. M., and Constantinou, M. C. (1991). "Nonlinear dynamic analysis of three dimensional base isolated structures (3D-BASIS)." Report No. NCEER-91-0005, Nat. Ctr. for Earthquake Engrg, Res., State Univ. of New York, Buffalo, N.Y.
Park, Y. J., Wen, Y. K., and Ang, A. H. S. (1986). "Random vibration of hysteretic systems under bidirectional ground motions." Earthquake Engrg. Struct. Dyn., 14(4), 543-557.
Rosenbrock, H. H. (1964). "Some general implicit processes for the numerical solution of differential equations." Comput. J., 18(1), 50-64.
Seismic base isolation using lead-rubber bearings. (1983). Dynamic Isolation Systems, Inc., Berkeley, Calif.
Su, L., Ahmadi, G., and Tadjbakhsh, I. G. (1989). "A comparative study of performance of various base isolation systems, Part I: Shear beam structures." Earthquake Engrg. Struct. Dyn., 18(1), 11-32.
"Tentative general requirements for the design and construction of seismic-isolated structures." (1990). Recommended lateral force requirements and commentary, Struct. Engrg. Association of California, Calif., 177C-203C.
Way, D., and Jeng, V. (1988). "NPAD—a computer program for the analysis of base isolated structures." Proc. ASME Pressure Vessels and Piping Conf., American Society of Mechanical Engineers, 147, 65-69.
Wilson, E. L., Hollings, J. P., and Dovey, H. H. (1975). "ETABS—Three dimensional analysis of building systems." Report No. UCB/EERC-75/13, Earthquake Engrg. Res. Ctr., Univ. of California, Berkeley, Calif.
Yasaka, A., Mizukoshi, K., Izuka, M., Takenaka, Y., Maeda, S., and Fujimoto, N. (1988). "Biaxial hysteresis model for base isolation devices." Summaries of technical papers of annual meeting, Architectural Inst, of Japan, Tokyo, Japan, 1, 395-400.
Younis, C , Tadjbakhsh, I. G., and Saibel, E. A. (1983). "Analysis of general plane motion with coulomb friction." Wear, 91(3), 319-331.
2054


![Torsional Response of Base-Isolated Structures Due to ... · superstructure varied from 0.1s to 1.2s, ... (up to 1/6 of the width). Nagarajaiah et al. [3] ... Jangid and Datta](https://img.dokumen.tips/doc/110x75/5ac0ce777f8b9a213f8c63dd/torsional-response-of-base-isolated-structures-due-to-varied-from-01s-to-12s.jpg)