Embed Size (px)
Citation preview

JACC Vol. 13, No. 3 September 1989~639-52
639
METHODS
Noninvasive Quantitation of Myocardial Blood Flow in Human Subjects With Oxygen-15Labeled Water and Positron Emission Tomography
STEVEN R. BERGMANN, MD, PHD, FACC, PILAR HERRERO, MS, JOANNE MARKHAM, MS,
CARLA J. WEINHEIMER, BS, MARY NORINE WALSH. MD
St. Louis, Missouri
Noninvasive measurement of myocardial blood flow in absolute terms (i.e., milliliters per gram per min) has been difficult to accomplish despite the intrinsically quantitative power of positron emission tomography because of the nonphysiologic nature of tracers that have been employed conventionally as well as tbe limited spatial resolution of currently available instruments. It was previously demon- strated that myocardial blood flow in animals can be quantitated accurately with the diffusible tracer oxygen- &labeled water (H,“O) when the arterial input function and myocardial radiotracer concentration were measured directly. To extend the approach for completely noninva- sive measurement of blood flow, a parameter estimation procedure was developed whereby effects of limited tomo- graphic spatial resolution and cardiac motion were com- pensated for within the operational flow model.
In validation studies in 18 dogs, myocardial blood flow measured with positron emission tomography after intra-
venously administered H,“O correlated closely with Bow measured with concomitantly administered radiolabeled microspheres over the range of 0.29 to 5.04 ml/g per min (r = 0.95). Although regional ischemia was clearly ldenti- liable tomographically, absolute flow could not be deter. mined accurately in ischemic regions in four dogs because of poor count statistics related to wall thinning. Subse- quently, myocardii blood flow was measured in 11 normal human subjects. Flow was homogeneous throughout the myocardium, averaged 0.90 + 0.22 ml/g per min at rest and increased to 3.55 2 1.15 ml/g per min after intravenous administration of dipyridamole.
Therefore, positron emission tomography with H,“O and the approach developed permits noninvasive measure. ment of myocardial blood flow in absolute terms in humans and should facilitate objective assessment of interventions designed to enhance nutritive perfusion.
(J Am Co11 Cardiol1989;14:639-52)
Measurement of myocardial blood flow is of paramount importance for evaluation of the functional significance of coronary artery disease and for assessment of effects of therapeutic interventions, such as thrombolytic therapy, balloon angioplasty and coronary artery bypass surgery, on nutritional perfusion. However, quantitation of myocardial blood flow in absolute terms with noninvasive techniques
From the Cardiovascular Division, Department of Internal Medicine, Washington University School of Medicine, St. Louis, Missouri. This study was supported in part by Grant HLl7646 from the National Institutes of Health, and Specialized Center of Research in lschemic Heafl DiPease, Bethesda, Maryland. This work was presented in part at the 61st Scientific Sessions of the American Heart Association, Washington. D.C., November 1988.
Manuscript received August 15. 1988: revised manuscript received De- cember 29, 1988, accepted February 21, 1989.
&&&QJ remintg: Steven R. Bergmann, MD, PhD, Cardiovascular Division, Washington University School of Medicine, Box 8086, 660 South Euclid Avenue, St. Louis, Missouri 631 IO.
01989 by the American College of Cardiology
has been hampered by instrumentation limitations and by the non-physiological nature of tracers conventionally used (1).
We and others have previously demonstrated that myo- cardial blood flow can be measured accurately in intact dogs with radiolabeled water with use of a one-compartment mathematical model when the arterial input function and tissue radioactivity are measured directly (2,3). Oxygen- 154abeled water (H,lSO) has several advantages as a positron emitting tracer for measurement of blood flow compared with other tracers such as nitrogen (N)-13 ammo- nia or rubidium-82. Myocardial uptake and retention of cationic tracers are dependent on active processes and affected by the metabolic status of the myocardium (1,4-12). In addition, recent studies (13) indicate that N-13 ammonia is rapidly converted to metabolic intermediates after intrave- nous administration further complicating estimates of blood flow with this tracer. In contrast, radiolabeled water is a diffusible tracer. Its myocardial kinetics appear to be related
0735-1097/89/53.50

640 BERGMANN ET AL. JACC Vol. 14, No. 3 MEASUREMENT OF MYOCARDIAL BLOOD FLOW WITH H,l50 September 1989539-52
solely to flow and are not altered by changes in metabolism (2,3). In addition, the short physical half-life of oxygen-15 @l/2 = 2.1 min) permits rapid sequential evaluations of myocardial blood flow with only modest radiation exposure to the subject.
In previous laboratory and clinical studies (2,1C17), we demonstrated the utility of noninvasive measurement of the regional distribution of H,150 (i.e., relative tracer content in abnormal compared with normal myocardium). In studies in animals (2,15,16), we correlated these regional differences with absolute flow. However, totally noninvasive quantifi- cation of myocardial blood flow with H,150 has been difficult to achieve because of the need to measure tissue radiotracer concentration in absolute terms.
Positron emission tomography is an intrinsically powerful quantitative imaging tool that provides noninvasively ac- quired, three-dimensional reconstructions of the distribution of positron emitting radiotracers within an organ of interest. However, accurate measurement of the concentration of tracers within the heart, necessary for assessment of myo- cardial blood flow and metabolism in absolute terms with the use of appropriate mathematical models, is complicated by cardiac motion (l&19) and by the limited spatial resolution of available tomographic systems in relation to the dimen- sion of the myocardial wall imaged (20), in addition to factors such as inaccurate random and photon attenuation correc- tions and the path length of positrons in tissue before annihilation (1). Interrogation of regions ~2 times the full width at half maximal resolution of the tomograph used results in partial volume effects (underestimation of true radiotracer concentration) and spillover (contamination of activity in one region with that from an adjacent one) (20). These effects as well as effects of cardiac motion present particularly difficult problems.
Solutions have been proposed to correct for effects of cardiac motion (18,191 and of partial volume and spillover e$ects (21). However, they have not been employed gener- ally because of the complexity of their implementation and because of the additional practical problems that their use engenders. For example, use of electrocardiographic gating to reduce motion artifact decreases the amount of data collected per cardiac cycle, thereby decreasing signal to noise ratios. Henze et al. (21) proposed a valuable approach to correct for partial volume and spillover effects when the performance characteristics of the individual tomograph used and myocardial wall thickness and left ventricular cavity dimensions are known. Then, four correction factors (FBB 7 the recovery coefficient of radioactivity in the left ventricular chamber: F,,, the fraction of radioactivity spill- ing over from the cavity into the myocardium; F,,, the recovery coefficient of radioactivity in myocardium; and F,,, the fraction of radioactivity spilling from myocardium into blood) can be calculated and used to estimate true radiotracer concentrations from observed count data. Al-
though we confirmed the accuracy of this approach (22) and showed that it can be employed successfully for measure- ment of myocardial blood flow in absolute terms using H,“O, the fact that the dimensions of the heart must be known accurately introduces a serious logistic limitation for clinical use.
Because sufficiently accurate measurements of cardiac dimensions cannot be made directly with positron emission tomography, they must be obtained with a second modality such as echocardiography, nuclear magnetic resonance im- aging or ultrafast X-ray computed tomography. Dual modal- ity imaging is not practical for routine use. Also, it is difficult to assure that interrogation of the myocardium has been accomplished in the same anatomic planes with both modal- ities. Intrinsic difficulties in measuring myocardial cavity diameter and wall thickness at different times occur because ventricular loading conditions can change rapidly, especially in the setting of acute cardiac events. In addition, relatively modest errors in measured wall thickness or cavity diameter assignments can lead to substantial errors in the estimates of radiotracer concentration and therefore myocardial blood flow (Appendix). Unless cardiac and respiratory gating are employed, the procedure proposed by Henze et al. (21) does not account for effects of cardiac motion on quantitation of radiotracer concentrations.
Recently, Iida et al. (23) used a kinetic model for mea- surement of myocardial blood flow with H,150 that corrects for partial volume effects and presented promising data in a small number of human subjects. However, the approach developed was not validated by an independent measure- ment of myocardial blood flow. In addition, effects of spillover of H,“O from the blood pool into the myocardium were corrected with the use of independent measurement of blood volume with oxygen-&labeled carbon monoxide (C”O) and a subtraction technique that can lead to errors, especially if the patient moves between scans (17,24).
In the present study, we report a mathematical model coupled with the use of H,“O and positron emission tomog- raphy that is designed to overcome the limitations of previ- ous correction schemes. The approach employs parameter estimation to correct for partial volume and spillover effects as well as to account for the influence of motion. Once we had demonstrated that use of this novel correction scheme led to accurate estimates of myocardial blood flow in studies in experimental animals, we applied it to 11 normal human volunteers.
Methods Validation Studies in Dogs
All studies in experimental animals were performed under general anesthesia and conformed to the “Position of the American Heart Association on Research Animal Use.”

JACC Vol. 14, No. 3 BERGMANN ET AL. 641 September 1989:63%52 MEASUREMENT OF MYOCARDIAL BLOOD FLOW WITH H2150
Experimental preparation. Eighteen mongrel dogs were sedated with I mg/kg body weight of morphine subcutane- ously after an overnight fast and anesthetized with 12.5 mgikg of thiopental and 60 mg/kg of alpha-chloralose admin- istered intravenously. The dogs were intubated and venti- lated with room air. Ten dogs without coronary instrumen- tation were studied at rest, after coronary hyperemia induced with intravenous dipyridamole or after global low flow. In five other intact dogs, regional ischemia was in- duced. Thrombosis was initiated in the left anterior descend- ing coronary artery with an intracoronary copper coil as described previously (25). In three additional intact dogs, coronary stenosis of 50% to 70% diameter narrowing was induced by placement of an intracoronary plastic stenosis in the left anterior descending coronary artery after anticoagu- lation with 500 U/kg heparin intravenously as described previously (IS).
To evaluate a wide range of pow, in some studies myocardial hyperemia was induced with intravenous dipyr- idamole (a gift of Boehringer-Ingleheim) infused at a dose of 0.15 mg/kg per min for 4 min. After a 4 to 5 min delay, estimates of flow were made. To characterize low flow without regional wall thinning otherwise induced by coro- nary occlusion, global low flow was induced in three dogs by treatment with propranolol (2 mg/kg intravenously) and hypotension (systolic pressure <40 mm Hg) induced by hemorrhage of 50% of calculated circulatory blood volume and intravenous nitroprusside.
Tomographic procedure. Dogs were placed in a plexi- glass shell and positioned within PETT VI, a positron emission tomograph designed for clinical neurologic studies, and permitting the simultaneous acquisition of seven trans- verse tomographic slices with a slice to slice distance of 1 A4 cm and a slice thickness of 1.39 cm (26). A transmission scan, necessary for attenuation correction. was obtained with use of an external ring of germanium-68igallium-68. To permit delineation of the blood pool, dogs inhaled 20 to 40 mCi of Cl50 to label red blood cells in vivo. After a 30 s delay to allow residual C”O to clear the lungs, emission data, collected in the high resolution mode, were acquired for 5 min. After completion of the Cl50 data collection, 5 additional min were allowed for the decay of the oxygen-15. Then, 20 to 30 mCi of H,i50 was administered intravenously as a bolus over 3 to 5 s. Tomographic acquisition was initiated at the time of administration of the H2150 bolus and continued for 90 s. Data were processed in 5 s frames.
In preliminary studies we determined that, in dogs, in contrast to data recently reported by Weinberg et al. (27) and in agreement with data from Henze et al. (21), the arterial input function could not be accurately obtained noninva- sively from a region of interest placed in the blood pool in reconstructed images because of resolution limitations com- bined with the influence of cardiac and respiratory motion. Therefore, in dogs, the arterial input function was obtained
by monitoring the time-activity curve from a catheter exte- riorized from the thoracic aorta by way of the femoral artery. Radioactivity was detected with a collimated scintillation probe and data were acquired on a minicomputer for subse- quent analysis. The collimation provided complete shielding from activity within the experimental animal. Comparisons between time-activity curves defined by the probe and data obtained by direct sampling of blood were excellent (unpub- lished observations). Use of the directly measured input function in dogs obviated the need for correcting blood counts for recovery coefficient (Fau) or for myocardial to blood spillover (F,n).
Measurement of blood flow with radiolabeled micro- spheres. The results of measurement of blood flow obtained with positron emission tomography were compared with those obtained with radiolabeled 15 pm microspheres admin- istered through a retrogradely placed left atria1 catheter immediately at the completion of each data collection from H,“O. While microspheres were administered, blood from a femoral artery was withdrawn with a constant withdrawal pump. After the dogs had been killed with an overdose of anesthesia and saturated potassium chloride intravenously, 10 to 20 transmural samples (approximately 1 g each) of myocardium from the anterior left ventricle (i.e., distal to the left anterior descending coronary artery stenosis or coil in those dogs subjected to those procedures), and 8 to 12 samples from normal posterolateral myocardium were ob- tained. Regions were selected to correspond with large regions of interest readily identifiable from the reconstructed positron emission tomography images. Blood flow was cal- culated with the standard microsphere reference technique (28).
Human Studies The protocol was approved by the Washington Univer-
sity Institutional Review Board (Human Studies Committee) on June 8, 1983. The nature of the study was explained to each subject and written informed consent was obtained.
Study subjects. All subjects (5 male, 6 female with a mean age of 25.5 years, evaluated consecutively) were without history or symptoms suggestive of coronary artery disease. Subjects did not fast but refrained from oral intake of methyl xanthines (including caffeine) on the day of the study so as not to attenuate effects of dipyridamole (29). Each was positioned in Super PETT I, a whole body time-of-flight positron emission tomograph that permits simultaneous ac- quisition of seven transaxial slices with a center to center slice separation of 1.5 cm and a slice thickness of 1.14 cm (30). Polyurethane molds were made individually for each subject before each study and used to stabilize the head, neck and upper torso of the subject so that movement between tomograms was minimized. A transmission scan of

642 BERGMANN ET AL. MEASUREMENT OF MYOCARDIAL BLOOD FLOW WITH H,150
JACC Vol. 14. No. 3 September lYXY:63Y-52
Figure 1. Reconstructed tomographic images obtained in one study in a nor- mal human volunteer depicting the placement of regions of interest &thin the left atrium (LA) (unner left). left ventricle (LV) (upper right) and tho- racic aorta (AO) (lower left). These reconstructions were performed after the volunteer inhaled approximately 30 to 40 mCi of oxygen-15 carbon monox- ide to label erythrocytes in vivo. Ante- rior is to the top, posterior is to the bottom, the subject’s left is to the right and the subject’s right is to the left. On the lower right of this figure, the re- gions of interest in the lateral (LAT.), anterior (ANT) and septal (SEP) myo- cardium as well as in the middle of the left ventricle are displayed in a tomo- gram obtained after administration of Ha”0 after correction for vascular ra- dioactivity. Images were used only for visualization of the myocardium and for placement of regions of interest and not used for quantitation of flow.
the chest was obtained with an external ring of germanium- 68/gallium-68 to correct for photon attenuation.
Tomographic procedure. After collection of attenuation data, 0.4 mCi/kg of H,“O was injected as a bolus (over 3 to 5 s) through a large bore catheter inserted into an antecubital vein. Data were collected in list mode in the high resolution mode beginning at the time of the initiation of the infusion. After a 5 min interval to allow decay of activity of the tracer to baseline levels, 40 to 50 mCi of Cl50 was administered by inhalation to label the blood pool. After a subsequent inter- val of 30 to 60 s to allow clearance of carbon monoxide from the lungs, data were collected for 5 min. After completion of data collection under baseline conditions, dipyridamole (Per- santine, supplied by Boehringer-Ingelheim), 0.14 mg/kg per min for 4 min (0.56 mg/kg total dose), was administered intravenously. After an interval of 4 min to permit develop- ment of peak responses of flow, the tomographic imaging sequence was repeated.
Analysis of tomographic data. Tomographic data were reconstructed by filtered back projection (PETT VI) or confidence weighting (Super PETT I). For PETT VI, emis- sion data were reconstructed into 100 by 100 data point matrixes (400 by 400 pixels [picture elements]), with each data point representing 2.7 mm. The full width at half maxima1 resolution in reconstructed PETT VI images was 12 mm. Super PETT I data were reconstructed into 128 by 128 data point matrixes (384 by 384 pixels) with each data point
representing 3.5 mm. The full width at half maximum in reconstructed Super PETT I images was 13.5 mm.
Although arterial sampling to obtain the input function is feasible in human subjects, it is desirable to obtain the input function without the need for an arterial catheterization. In three patients (not included in the data analysis of this study) immediately after cardiac catheterization (in which a femoral artery sheath had been left in place and was used for direct sampling of arterial blood). the input function measured directly was compared with values obtained by analysis of tomographic reconstructions. In these patients, regions of interest representing volumes of approximately 3.5 cm3 (1.75 X 1.75 cm area X slice thickness) were placed with the aid of the reconstructions obtained after inhalation of C”O in the left atrium, the left ventricle and the thoracic aorta (Fig. 1). Decay-corrected counts per data point obtained in one of these three patients from sequential 5 s tomographic recon- structions after the intravenous administration of H,150 compared with directly sampled arterial counts are depicted in Figure 2. The left atria1 region of interest appeared to provide the most accurate and representative determination of the arterial input function. Subsequently, in the normal human subjects constituting the study group reported herein, the input function was obtained from the time-activity data in the left atria1 region of interest. This region was assumed to have a recovery coefficient (Fnn) of 100% and negligible spillover from myocardium (FM, = 0) based on results

JACC Vol 14, No. 3 BERGMANN ET AL. h43 September 1989:63’+52 MEASUREMENT OF MYOCARDIAI, BLOOD FLOW WITH HZ150
TIME (SK)
Figure 2. Comparison of the input function obtained in a human subject from direct sampling from the femoral artery (solid line) (scaled to positron emission tomographic [PET] counts/pixel based on phantom studies) compared with noninvasive estimation by analysis of time-activity curves obtained in 5 s frames from regions of interest (ROI) placed in the left atrium, left ventricle or thoracic aorta. The time-activity curve obtained in the left atrium matched most closely with the input function sampled directly and was subsequently used for the input function. As is also depicted, the time-activity curve obtained from a region of interest within the left ventricle underestimates the peak arterial radiotracer concentration, and at times later than 30 s, is contaminated from spillover from the myocardium. The time-activity curve obtained from the region of interest within (he thoracic aorta underestimates peak arterial ra- diotracer concentration because of partial volume effects.
obtained in experiments with phantoms (22) and on the anatomic size of these structures in transaxial tomographic reconstructions in humans.
To obtain myocardial time-activity curves in tomographic reconstructions in both human and canine studies, three regions of interest representing 1.0 to 5.0 cm3 were interac- tively placed on one to two midventricular transverse tomo- graphic reconstructions (Fig. 1). The three regions placed represented anterior, septal and lateral myocardium. Be- cause HII labels both myocardium and blood, placement of myocardial regions of interest were performed with the aid of the scan corrected for vascular radioactivity as previ- ously described (2,17). Then, with unsubtracted H,“O scans, counts per data point were calculated from each 5 s frame for 90 s after appearance of HZ”0 in the left ventricle.
Calculation of myocardial blood flow from positron emis- sion tomographic data. Myocardial blood flow in absolute terms was determined with a kinetic modification of the Kety one-compartment model (31-33). For calculation of flow, the input function, the time-activity profile of tracer in the myocardial tissue and the tissue/blood partition coefficient must be known. All data were corrected for isotope physical decay. In studies in animals, the arterial input measured directly was used. In human subjects, the input function obtained from analysis of the time-activity curve obtained from a left atrial region of interest was used. To correct observed myocardial time-activity curves for count recovery
(FhlM). for radioactivity emanating in the ventricle and spilling into the myocardium (F& as well as for effects of motion, we estimated F,,, F,, as well as myocardial blood flow with a three parameter fitting technique developed for this purpose and described in detail in the Appendix. By including correction for partial volume, spillover and motion effects within the mathematical model for estimation of myocardial blood flow, no a priori knowledge of F,, and F nM is needed, avoiding errors associated with estimates and use of these parameters measured independently with other approaches. In addition, parameter estimates of F,, and F,, with our procedure incorporate the effects of motion, as well as any other factors that would tend to make observed counts deviate from true radiotracer concentra- tion.
The tissuelblood partition coeficient used was 0.92 mllg for all studies. This value was derived previously (2). Al- though the true tissue/partition coeficient may change with changes in blood hematocrit as well as with myocardial injury, computer simulations have demonstrated that the flow model used is relatively insensitive to values of a tissue/blood partition coefficient from 0.8 to 1.0 (unpublished observations).
Statistics. All data are presented as the mean values ? SD. For comparison of differences, the Student’s t test for independent or paired analysis, as appropriate, was em- ployed. Differences with a p value <O.OS were considered statistically significant.
Results Measurement of arterial time-activity curves. in dogs,
because of the small cardiac dimensions compared with the resolution of PETT VI and because of motion effects, recovery of count data in the blood pool (FBB) is < 100%. At intervals >20 to 30 s after administration of H,“O, blood pool activity is increased because of spillover from myocar- dium into blood. Therefore, for studies in animals, we sampled the arterial input function directly from a catheter placed in the thoracic aorta.
In three human subjects, time-activity data obtained with positron emission tomography from a region of interest placed in the center of the left atrium. left ventricle and thoracic aorta were compared with the arterial time-activity curve obtained by direct arterial sampling after intravenous administration of H2150 (Fig. 2). In this limited number of comparisons, the time-activity data obtained from a region of interest placed within the left atrium appeared to agree most closely with the input function sampled directly. In addition, because the left atria1 blood pool in adult humans is >2 times the reconstructed full width at half maximal resolution of the tomograph used and because in transaxial reconstructions at the level of the left atrium there is minimal resoluble myocardial tissue that might cause myocardial to

644 BERGMANN ET AL. MEASUREMENT OF MYOCARDIAL BLOOD FLOW WITH H,“O
JACC Vol. 14, No. 3 September 1989363%52
blood pool spillover, we used the time-activity curve ob- tained from this region of interest to define the arterial input for all subsequent analyses in human volunteers. Time- activity data obtained from regions of interest placed within the left ventricle underestimated peak arterial tracer con- centration and at times >30 s appeared to overestimate arterial tracer concentration because of left ventricular myocardium to left ventricular blood pool spillover (FhIn) (Fig. 2). Time-activity data from a region of interest placed within the thoracic aorta significantly underestimated peak arterial radiotracer concentration because of partial volume effects but is not subjected to myocardial to blood spillover because it is sufficiently distant from myocardial regions (Fig. 1B).
Tomographic estimates of myocardial blood flow in ani- maIs. Figure 3 depicts representative observed, fitted and model corrected time-activity curves obtained in dogs with the parameter estimation technique developed. In uncor- rected data, early after administration of H2150, tracer in the blood pool spills into myocardial regions of interest, thereby falsely elevating tissue radiotracer concentration values. At later intervals, this influence is decreased (although the spillover fraction is constant) because of diminished blood tracer concentration.
Time-activity profiles were obtained over 90 s in each study. Myocardial blood flow was calculated with the model described in the Appendix and compared with measure- ments obtained with microspheres in control dogs at rest, or in dogs with coronary artery occlusion or stenosis studied at rest and after dipyridamole administration and in dogs with global low flow induced by hypotension. The correlation over the flow range of 0.29 to 5.04 ml/g per min determined with microspheres was 0.95 (Fig. 4).
Determinations of flow in seven ischemic myocardial regions in four dogs (Table 1) could not be made (i.e., the model corrected tissue curves were too statistically inaccu- rate for parameters to be estimated with confidence). In these regions, microsphere-determined flow averaged 0.26 5 0.14 ml/g per min and F,,, the myocardial recovery coef- ficient, averaged 0.20 t 0.08 (compared with an F,, of 0.65 f 0.17 in normal regions at rest, p < 0.005) (Fig. 5).
Because we previously demonstrated that myocardial blood flow could be measured accurately in ischemic regions with microsphere-determined flows of as low as 0.1 ml/g per min when H21S0 content was measured directly (2) we believed the inability to measure absolute flow in ischemic regions with positron emission tomography was most likely due to 1) the low number of true counts in the region as a result of ischemia; 2) decreased myocardial count recovery secondary to wall thinning (34); and 3) the greater influence of count spillover into ischemic, thinned regions from blood as well as from adjacent normal myocardium. To determine which effect was predominant, in three dogs we induced global low flow without regional ischemia using a combina-
IO00 [ n
2 9oa x h =, 600
!i g 400
c =ca . . . . = CT lObrewed __- = CT (Obrmrd.ilcd~
TIME (see1
- ‘Co .a... ‘CT (Observed) __- = CT ~Observed.lilW~
f!Kl,
0 IO 20 30 40 50 60 70 80 90 100
TIME kc)
‘, 600
!i
2 400
- ‘C, . . . . = CT LObserved me_ = CT (Observed, fitted)
- .CT (Corrected1
c L2 -,#&J+, 0 IO 20 30 40 50 60 70 60 90
TIME fsec)
Figure 3. Time-activity curves obtained in studies from a dog at rest (A), after intravenous dipyridamole (B) and during global low flow (C). In these figures the directly sampled arterial input function is depicted (Ca) (scaled to positron emission tomographic [PET] counts/pixel) as is observed tracer concentration in tissue (Cd. as well as the fitted line that best describes the discrete data (C, observed, fitted). Also depicted in the thin solid line (C,, corrected) is the parameter estimation model fitted curve incorporating correc- tion for spillover and partial volume effects as well as for cardiac motion (see text and Appendix). In this example, myocardial blood flow was calculated at 1 AlO, 3.75 and 0.37 ml/g per min, respectively, for the three curves.
tion of hemorrhage, beta-blockade and peripheral vasodila- tion. In these animals, flow determined noninvasively aver- aged 0.27 -t 0.10 ml/g per mitt, agreeing closely with microsphere-determined flow (0.33 + 0.03 ml/g per min) (Table I, Fig. 5). In these dogs, F,, during low flow was 0.74 t 0.18, suggesting that failure to calculate flow in ischemic regions manifesting wall thinning (reflected by a low F,,) was secondary to poor count statistics predomi- nantly related to wall thinning and was not model related.

JACC Vol. 14, No. 3 BERGMANN ET AL. September 1989:639-52
645 MEASUREMENT OF MYOCARDIAL BLOOD FLOW WITH Hz%
6Or /
MYOCARDIAL BLOOD FLOW ~mwx.phera) (ml/q/min)
Figure 4. Correlation between myocardial blood flow estimated by positron emission tomography (PET) and that obtained from con- comitantly administered radiolabeled microspheres in 18 dogs (37 observations) showing the close correlation over the flow range from 0.29 to 5.04 ml/g per min.
Noninvasive assessment of myocardial blood flow in human subjects. Myocardial blood flow was determined in the 11 normal human volunteers at rest and again after intravenous administration of dipyridamole. During the baseline study, heart rate and blood pressure of all 1 I subjects averaged 67 + 11 beats/min and 112 + 9/76 5 5 mm Hg, respectively. During the scan obtained after intravenous dipyridamole. heart rate increased to 90 +- 12 beats/min, and blood pressure was 119 ? I1170 ‘- 7 mm Hg (p < 0.025 for each compari- son).
Figure 6 depicts time-activity curves obtuined in one study. At rest, myocardial blood flow in all subjects averaged 0.90 t 0.22 mVg per min (Table 2). In 10 of the 11 subjects evaluated, after intravenous dipyridamole, myocardial blood flow increased by an average of 435 + 84%. In one subject (Case 7), myocardial blood flow increased only 20% after dipyridamole (Fig. 7, Table 2). Regional myocardial blood flow was homogeneous at rest, and increased uniformly after dipyridamole (Fig. 8).
Discussion
Accuracy of myocardial blood flow measurements with positron emission tomography. Measurement of myocardial blood flow is of importance for studies of normal human physiology as well as for characterization of changes in flow with cardiac disease and for assessment of effects of inter- ventions designed to improve myocardial perfusion (35,36). We previously demonstrated the feasibility and utility of assessing relative myocardial blood flow ratios in both animal and clinical studies (2,lb17). However, realization of the full potential of positron tomography for absolute quantitation of myocardial blood flow requires correction for partial volume, spillover and motion effects (1).
Table 1. Estimates of Myocardial Blood Flow (MBF) With the Noninvasive Approach Developed Compared With Blood Flow Determined With Microspheres (MSBF) in the Study Dogs
Study Group SCAN REG F,, Far+, MBF MSBF
COlltrOlS 1 Rest 2 Rest 3 Rest 4 Rest 5 Rest
Rest 6 Dipyr 7 Dipyr
Dipyr Coronary stenosis
8 Rest Dipyr Rest Dipyr
Y Rest Dipyr Rest Dipyr
IO Rest Dipyr Rest Dipyr
Coronary occlusion II Rest
Rest 12
13
14
15
Low flow 16 I7
18
Rest Dipyr R&t Dipyr Rest Dipyr Rent Dipyr Rest Dipyr Red Dipyr Rest Dipyr Rest Dipyr
Low Row Rest Low flow Rest
Norm
Norm Norm
Norm Norm Norm
Norm
Abn Abn Norm Norm Abn Abn Norm Norm Abn Abn
Norm Abn Norm Norm Abn Abn Norm Norm Abn Abn Norm
Abn Abn Norm Norm Abn Abn
Norm Norm Norm Norm
Low flow Norm
0.82 0.15 1.50 1.32 0.48 0.26 0.66 0.95 0.66 0.14 0.87 0.98 0.80 0.17 0.55 0.57 0.94 0.11 1.04 1.00 0.57 0.20 1.05 I .34 0.83 0.15 3.48 3.33 1.00 0.00 3.62 2.48 0.95 0.00 5.25 5.04
0.50 0.11 0.72 0.99 0.20 1.37 0.53 0.10 0.61 0.82 0.22 0.86 0.47 0.11 0.72 0.63 0.04 2.35 0.43 0.10 0.66 0.60 0.04 2.48 0.56 0.16 0.79 I.41 0.07 2.86 0.54 0.05 0.71 0.88 0.04 1.34
0.71 1.30 0.61 0.83 0.62 2.40 0.62 1.56 0.51 I .79 0.53 0.89
0.63 0.20 I .27 0.57 0.30 0.76 0.53 0.14 0.64 I.10 0.03 2.22 0.51 0.07 0.63 0.18 0.02 * 0.57 0.22 1.15 0.66 0.10 1.89 0.15 0.22 * 0.10 0.19 * 0.47 0.18 0.58 0.73 0.22 1.89 0.18 0.22 * 0.18 0.27 * 0.56 0.18 0.74 0.95 0.10 3.40 0.29 0.05 * 0.32 0.12 *
I.23 0.52 0.79 2.62 058 0.17 1.03 1.98 0.13 0.08 0.58 I .98 0.35 0.27 0.55 2.X 0.36 0.47
0.55 0.14 0.37 0.35 0.92 0.13 0.42 0.62 0.78 0.18 0.17 0.35 0.88 0.19 0.36 0.53 0.90 0.09 0.28 0.29
Seven dogs C I to 7) were studied at rest or after dipyridamole without any coronary instrumentation. Dogs 8 to IO had a coronary stenosis placed resulting in 50% 10 70% narrowing of the luminal diameter. Five dogs (I 1 to 151 were aubjected to regional ischemia by placement of a thrombogenic copper coil within the left anterior descending coronary artery, and three dogs (I6 to 18) were studied with Induced low flow but without regional lschemia (see text). * indicates that a value of flow could not be computed because myocardial count recovery was too low yielding statistically inaccurate count data. F,, and F,, refer to the myocardial recovery coeficient and the blood to myocardial spillover fraction, respectively. REG refers to the analyzed myo- cardial region of interest (normal (Norm) or abnormal (Abn) in the territory of the left anterior descending coronary artery). SCAN indicates whether studies were done at rest, after dipyridamole (Dipyr) or with low flow without ischemia.

646 BERGMANN ET AL. MEASUREMENT OF MYOCARDIAL BLOOD FLOW WITH H,“O
JACC Vol. 14. No. 3 September 1989:63%52
Figure 5. Histogram displaying myocardial recovery coefficient (FM& blood to myocardial spillover (F&, myocardial blood flow estimated by positron emission tomography (MBF-PET) or by microspheres (MBF-MS) in normal regions at rest or after dipyri- damole and in ischemic regions in four dogs with coronary occlusion (Dogs 12, 13, I4 and 15; Table 1) compared with estimates obtained in three dogs with global low flow (Dogs 16, I7 and 18; Table I). In four dogs with coronary occlusion, myocardial blood flow could not be estimated with positron emission tomography because of low observed counts (related to wall thinning and decreased myocardial count recovery as well as to low flow in itself) resulting in data too statistically inaccurate to make valid estimates of flow with the three parameter model. Note that F,, in the ischemic regions was significantly lower than F,, in normal myocardium. Estimates of low flow in dogs with global low flow were accurate. In these dogs, because regional ischemia did not result in wall thinning, F,, was preserved and permitted adequate count recovery despite low flow.
We previously showed (2) that H2”0 provided accurate estimates of myocardial blood flow over a wide range of flows with the one-compartment Kety model when the input function and tissue activity were assayed directly. The results of the present study indicate that absolute blood flow can be measured accurately with positron emission tomog- raphy after intravenous administration of H,“O with a novel parameter estimation technique that incorporates a correc- tion for factors (including partial volume. spillover and motion effects) that can otherwise cause disparities between observed radiotracer concentration evident in reconstructed images and true radiotracer concentration in tissue. Results of validation studies in dogs indicated that flow calculated with positron emission tomography over a wide range of flows correlated very closely with flow measured concomi- tantly with microspheres. In human subjects, flow determi- nations at rest and after dipyridamole yielded values similar to those observed by others with invasive techniques (37,38).
Technical considerations. Blood to myocardium spillover activity. After intravenous administration of H,“O, radio- activity in the blood pool is initially high. Activity spills over from blood into the myocardium resulting in elevation of observed tissue counts. With time, activity in the blood diminishes and apparent activity in myocardium attributable
f 3500i n - ‘C. . . . . = CT (Observed1 - - - = CT IObserved, fitted,
r 2000 - =CT (CorrectedI
8 1500
0 IO 20 30 40 50 60 70 80 90 TIMEhc)
??*** =CT IObserved --- ‘CT IObserved, f~tfed)
- i CT I Corrected)
0 IO 20 30 40 50 60 m 80 90 TIME(sec)
Figure 6. Representation of time-activity data obtained in one myocardial region in a representative human study at rest (A) and after intravenous dipyridamole (B). The data presented are analo- gous to that in Figure 3 and represent the data obtained in a myocardial region of interest after intravenous administration of H,‘50. The input function (C,) was obtained from a region of interest placed in the left atrial blood pool. In this subject, calculated myocardial blood flow at rest was 0.69 ml/g per min and increased to 3.33 ml/g per min after dipyridamole.
to spillover decreases, whereas true myocardial counts increase because of tracer diffusing into tissue (Fig. 3 and 6). This results in spillover of activity in myocardium to activity detected in the chamber. Because of the relative sizes of these structures, spillover from the ventricular cavity to the myocardial tissue (F,,) is large, whereas spillover from tissue to cavity (FMB) is small. In addition, recovery of radioactivity is high in the left ventricular chamber and lower in the myocardial tissue (21). As depicted by the data in Figure 2, in human subjects, the time-activity curve in arterial blood can be obtained accurately from measurement of radioactivity from a region of interest in the left atrium in reconstructed tomographic scans. Estimates of the input function obtained noninvasively from blood pool regions in smaller hearts (i.e., from children or experimental animals such as dogs) exhibit lower recovery coefficients and greater bidirectional spillover. These errors in measurement of input function in small hearts should decrease as the resolution of future tomographs improve.
Partial volume andspillover effects. With use of currently available tomographs for quantitation of radiotracer concen- tration, observed data must be corrected for partial volume, spillover and motion effects (I, 18-23). Previous studies have

IACC Vol. 14, No. 3 BERGMANN ET AL. 647 September 1989:63%52 MEASUREMENT OF MYOCARDIAL BLOOD FLOW WITH H,‘5O
Table 2. Myocardial Blood Flow Determined With Use of Positron Emission Tomography and H,“O in 11 Normal Human Subjects
SubJeCt
I 2 3 4 5 6 7 8 9
IU II
Age (yr) &
Gender
26 F 23 M 25 M 20 M 22 M 28 F 26 M 34 F 28 F 24 F 24 F
” MBF
6 0.67 2 0.27 6 1.03 f 0.48 4 0.69 2 0.26 6 1.38 r 0.23 6 0.78 + 0.35 6 1.08 + 0.30 6 1.17 ? 0.44 3 0.90 z 0.26 3 0.81 k 0.39 3 0.77 i 0.22 3 0.67 r 0.16
Baseline
F&W
0.74 f 0.23 0.47 + 0.17 0.75 5 0.18 0.69 ? 0.10 0.70 * 0.09 0.54 + 0.15 0.56 f 0.16 0.44 c 0.05 0.76 f 0.32 0.79 -t 0.18 0.51 ? 0.05
F BM
0.26 k 0.07 0.37 ? 0.18 0.20 ? 0.03 0.23 2 0.06 0.28 k 0.05 0.26 ? 0.09 0.30 ? 0.08 0.33 + 0.14 0.33 + 0.07 0.36 -c 0.09 0.26 + 0.09
After Dtpyridamole
MBF F MM F BM
3.61 f 0.54 0.62 = 0.1 I 0.37 k 0.17 3.20 + 0.68 0.62 ‘- 0.28 0.30 k 0.14 3.33 ? 0.47 0.68 k 0.14 0.24 ? 0.06 4.75 + 1.40 0.34 t 0.16 0.42 2 0.24 3.21 f 2.04 0.39 2 0.05 0.43 k 0.12 6.02 k 1.41 0.74 i 0.12 0.15 k 0.20 1.40 -c 0.47 0.69 2 0.12 0.27 2 0.14 4.13 2 1.63 0.15 ? 0.13 0.47 ? 0.20 2.91 2 0.33 0.25 k 0.03 0.48 ? 0.17 4.00 i 0.81 0.54 t 0.07 0.23 + 0.09 2.48 2 1.11 0.47 i- 0.12 0.35 k 0.09
Average 0.90 f 0.22 0.63 t 0.12 0.29 f 0.05 3.55 f 1.15 0.50 i 0.19 0.34 i 0.10
Tabulation of myocardial blood flow (MBFI in the 11 consecutively studied human volunteers under baseline conditions and after intravenous administration of dipyridamole. F,, and F,, = the myocardial recovery coefficient and the blood to myocardial spillover fraction, respectively; n = the total number of regions evaluated. Values are mean values ? SD
employed cavitary and wall thickness measurements ob- tained in vivo with echocardiography, or measurements obtained postmortem in experimental animals to correct for resolution limitations (21). However, use of these measure- ments can lead to error because they assess anatomic relations in a different plane from that used for interrogation with positron emission tomography. Modest errors in wail thickness assignments (i.e., 2 to 4 mm ) can result in significant errors in estimates of radiotracer concentration and thus of flow (Fig. 9). Although we demonstrated that incorporation of such partial volume and spillover measure- ments can be used to quantify myocardial blood flow in
Figure 7. Representation of myocardial blood flow estimated at rest and after administration of dipyridamole in all 11 human volunteers studied. As depicted, myocardial blood flow at rest averaged 0.90 * 0.22 ml/g per min. After dipyridamole, the flow response was variable, but increased to an average of 3.55 k 1.15 ml/g per min, corresponding to a perfusion reserve of 4.1 2 1.2.
absolute terms (22), in the present study, we developed and implemented a parameter fitting technique that accounts for factors such as partial volume, spillover and motion effects that cause observed data to vary from true concentrations. Its use obviates the need for independent measures of cavity radius and wall thickness and reduces error that might otherwise be introduced by making such dimensional assign- ments with an independent modality or by using “lumped” data. Because the estimates utilize information obtained at the time that data acquisition for Row is made, they avoid error that might otherwise be introduced by obtaining dimen- sional measurements at times different from those at which emission data are collected.
Figure 8. Regional myocardial blood flow at rest and after intrave- nous dipyridamole in the 11 normal human subjects showing re- gional homogeneity of flow at rest and homogeneous increases in flow with pharmacologic coronary vasodilation. The coefficient of variation in individuals averaged 35 +- 10% at rest and 29 f IO% after dipyridamole.
2 m- REST DIPYRIDAMOLE
E ‘r p 50- E
MYOCARDIAL REGION OF INTEREST
448 BERGMANN ET AL. JACC Vol. 14. No. 3 MEASUREMENT OF MYOCARDIAL BLOOD FLOW WITH H,“O September 1989:639-52
-40L 0 10 12 14 16
“WALL” DIAMETER (D), mm
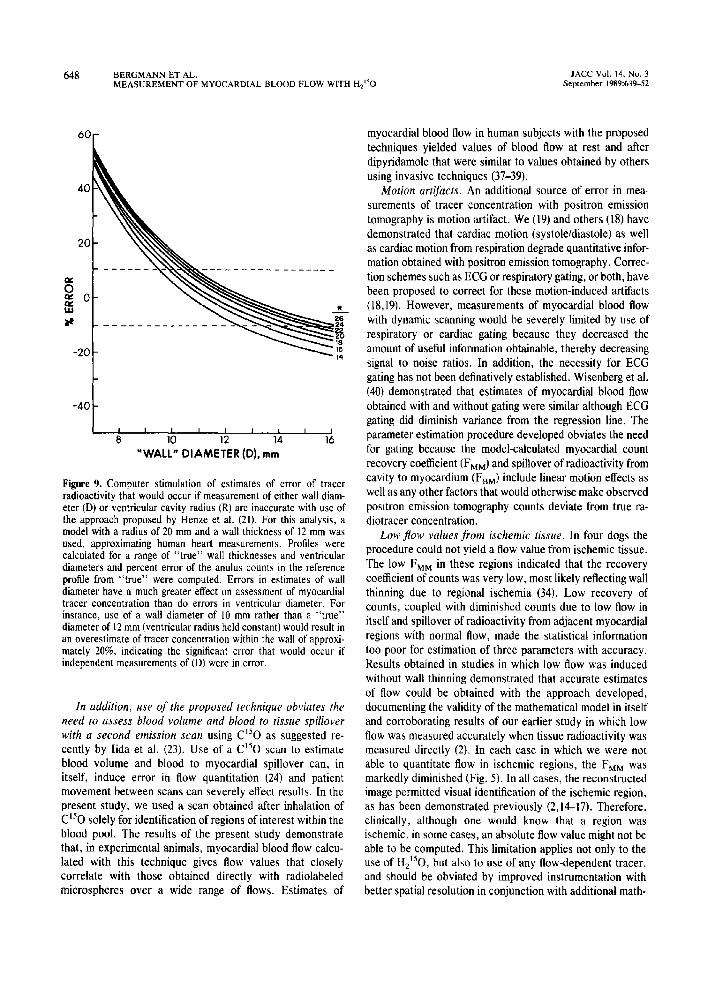
Figure 9. Computer stimulation of estimates of error of tracer radioactivity that would occur if measurement of either wall diam- eter (D) or ventricular cavity radius (R) are inaccurate with use of the approach proposed by Henze et al. (21). For this analysis, a model with a radius of 20 mm and a wall thickness of 12 mm was used, approximating human heart measurements. Profiles were calculated for a range of “true” wall thicknesses and ventricular diameters and percent error of the anulus counts in the reference profile from “true” were computed. Errors in estimates of wall diameter have a much greater effect on assessment of myocardial tracer concentration than do errors in ventricular diameter. For instance, use of a wall diameter of IO mm rather than a “true” diameter of 12 mm (ventricular radius held constant) would result in an overestimate of tracer concentration within the wall of approxi- mately 20%, indicating the significant error that would occur if independent measurements of(D) were in error.
In addition, use of the proposed technique obviates the need to assess blood volume and blood to tissue spillover with a second emission scan using Cl50 as suggested re- cently by Iida et al. (23). Use of a Cl50 scan to estimate blood volume and blood to myocardial spillover can, in itself, induce error in flow quantitation (24) and patient movement between scans can severely effect results. In the present study, we used a scan obtained after inhalation of C”O solely for identification of regions of interest within the blood pool. The results of the present study demonstrate that, in experimental animals, myocardial blood flow calcu- lated with this technique gives flow values that closely correlate with those obtained directly with radiolabeled microspheres over a wide range of flows. Estimates of
myocardial blood flow in human subjects with the proposed techniques yielded values of blood flow at rest and after dipyridamole that were similar to values obtained by others using invasive techniques (37-39).
Motion artifacts. An additional source of error in mea- surements of tracer concentration with positron emission tomography is motion artifact. We (19) and others (18) have demonstrated that cardiac motion (systoleldiastole) as well as cardiac motion from respiration degrade quantitative infor- mation obtained with positron emission tomography. Correc- tion schemes such as ECG or respiratory gating, or both, have been proposed to correct for these motion-induced artifacts (18,19). However, measurements of myocardial blood flow with dynamic scanning would be severely limited by use of respiratory or cardiac gating because they decreased the amount of useful information obtainable, thereby decreasing signal to noise ratios. In addition, the necessity for ECG gating has not been definatively established. Wisenberg et al. (40) demonstrated that estimates of myocardial blood flow obtained with and without gating were similar although ECG gating did diminish variance from the regression line. The parameter estimation procedure developed obviates the need for gating because the model-calculated myocardial count recovery coefficient (FMM) and spillover of radioactivity from cavity to myocardium (FBM) include linear motion effects as well as any other factors that would otherwise make observed positron emission tomography counts deviate from true ra- diotracer concentration.
Low flow values from ischemic tissue. In four dogs the procedure could not yield a flow value from ischemic tissue. The low F,, in these regions indicated that the recovery coefficient of counts was very low, most likely reflecting wall thinning due to regional ischemia (34). Low recovery of counts, coupled with diminished counts due to low flow in itself and spillover of radioactivity from adjacent myocardial regions with normal flow, made the statistical information too poor for estimation of three parameters with accuracy. Results obtained in studies in which low flow was induced without wall thinning demonstrated that accurate estimates of flow could be obtained with the approach developed, documenting the validity of the mathematical model in itself and corroborating results of our earlier study in which low flow was measured accurately when tissue radioactivity was measured directly (2). In each case in which we were not able to quantitate flow in ischemic regions, the F,, was markedly diminished (Fig. 5). In all cases: the reconstructed image permitted visual identification of the ischemic region, as has been demonstrated previously (2,lC17). Therefore, clinically, although one would know that a region was ischemic, in some cases, an absolute flow value might not be able to be computed. This limitation applies not only to the use of H,“O, but also to use of any flow-dependent tracer, and should be obviated by improved instrumentation with better spatial resolution in conjunction with additional math-

JACC Vol. 14, No. 3 BERGMANN ET AL. 649 September 1989:639-52 MEASUREMENT OF MYOCARDIAL BLOOD FLOW WITH H,“O
ematical approaches to correct for count spillover from adja- cent regions. Clearly, until this can be done, the approach is most accurate in regions with normal or hyperemic flows.
Variable bloodjlow response to dipyridamole. Although we did not measure myocardial blood flow directly by a second technique in our studies in human subjects, the flow values at rest and after dipyridamole obtained with the technique developed agree quite closely with results of others using invasive techniques (37-39). In 10 of the II normal subjects, intravenous dipyridamole resulted in a large increase in myocardial blood flow. One subject did not have a myocardial blood flow response to dipyridamole. Variability in the blood flow response to dipyridamole has been previously reported (37-39).
Advantages of Hz”0 as a tracer of myocardial blood flow. Water, as compared with other proposed positron emitting flow tracers such as ammonia and rubidium, is relatively freely diffusible in the myocardium (2). The short life of oxygen-15 (2.1 min) allows rapid sequential measurements of flow, and the diffusibility characteristics of H,“O permit acquisition of accurate flow estimates over a wide range of flow and metabolic conditions. The short physical half-life of oxygen-15 limits radiation exposure. Whole body radiation exposure for a study at rest and after dipyridamole in human subjects is approximately 270 mrem/70 kg compared with an exposure of 360 mreml70 kg for a single conventional thal- lium-201 study.
In contrast to the diffusibility of H,“O, the two other tracers that have been used for measurement of flow with positron emission tomography, rubidium-82 and N-13 am- monia, require functionally intact cell membrane systems for transport of tracer into myocardium and intracellular pro- cesses for trapping (I ,4-12). It has been demonstrated (4,9- 12) that both of these processes may be affected by ischemia or reperfusion resulting in error in flow estimates if the variables of extraction fraction and myocardial washout are not included in quantitative estimates of flow. Quantitation of myocardial blood flow in absolute terms in human sub- jects has not been delineated with either tracer.
Although implementation of partial volume and spillover corrections or incorporation of the parameter estimation procedure developed in this study adds computational time and adds to the complexity of imaging, its use permits application of positron emission tomography to clinical research requiring measurement of perfusion in absolute terms. The disadvantages of using H,“O are the necessity for an on-site cyclotron for produ&on and the need for tomographs with high count and temporal resolution capa- bilities for collection of dynamic data. Estimates of myocar- dial blood flow with H,150 with equilibrium scans are insensitive to changes in flow (41).
Clinical implications. The results of the study indicate that, with the approach developed, positron emission tomog- raphy with Hz”0 provides rapidly attainable, accurate esti-
mates of myocardial blood flow in absolute terms. The approach developed is rapid (a typical rest and dipyridamole study including collection of attenuation data can be per- formed in <I h) and provides quantitative estimates of myocardial blood flow. Although estimates of myocardial blood flow in absolute terms in ischemic zones may be limited by the low number of true counts and by wall thinning, improved instrumentation with enhanced spatial resolution and sensitivity as well as additional mathematical approaches to correct for count spillover from adjacent, normal regions may permit improvement of the ability to quantitate flow in ischemic regions. The use of the positron emission tomograph in human subjects should permit reso- lution of several critical clinical questions requiring accurate estimation of myocardial flow reserve in patients with car- diac disease of diverse origins and rapid assessment of the efficacy of pharmacologic, mechanical and surgical interven- tions designed to augment nutritional blood flow.
We thank the personnel of the Washington University Cyclotron for prepa- ration of the positron emitting radiotracers used in this study: Howard James, Theron Baird, Colleen Schaab. RN and C. Gregory Henes, MD for technical assistance: Burton E. Sobel. MD, Edward M. G&man, MD and Michel M. Ter-Pogossian. PhD for helpful discussions; and Becky Parrack for prepara- tion of the typescript.
Appendix
Assumptions underlying the use of the one-compartment Kety model for estimates of myocardial blood flow. With the development of positron emission tomographic instruments with rapid data ac- quisition capabilities, application of the approach originally de- scribed by Kety (31-33) became feasible. Scans are performed over many seconds and the tissue radioactivity detected represents the integrated sum of radioactivity over time. Tracer activity in arterial blood can be determined by sampling arterial blood directly or by assessing tracer activity in the cardiac chamber.
Several assumptions underlie the use of the one-compartment model for the measurement of myocardial bloodf7ow including: I) the uptake of tracer into tissue is flow dependent and not diffusion limited, 2) no arteriovenous shunts or bypasses are present, 3) the solubility of tracer must be constant, and 4) the flow must be constant and homogeneous throughout the sampled myocardial region interrogated (l-3,30-32).
We previously demonstrated (2) that the limitation of free diffusibility of water in myocardium is modest, constant and not altered by changes in flow. Exclusion of shunts or bypasses is probably a valid assumption for the heart (42). However, whereas distribution of a diffusible tracer such as water or butanol may differ from the distribution of microspheres and shunting cannot be excluded with certainty, the single pass diffusion of H2150 was found to be invariant over a wide range of flow (2). In addition, measurements of nutritional perfusion with diffusible tracers may represent a more valid estimate of flow than that obtained with inert, carbonized microspheres (43). The assumption that flow is uniform in a region is likely to hold when small regions of interest are evaluated. It is clearly not valid for the heart as a whole. If the necessary assumptions are met or approximated, regional flow can

650 BERGMANN ET AL. MEASUREMENT OF MYOCARDIAL BLOOD FLOW WITH H,“O
JACC Vol. 14, No. 3 September 1989:63%52
be determined by monitoring the arterial concentration of tracer and the concentration of tracer in tissue.
Theoretical and mathematical basis of the method. For an inert, diffusible tracer, conservation of mass exists such that the rate of change in concentration of tracer in the tissue is equal to the rate of tracer entering the tissue minus the rate of tracer leaving the tissue with respect to tissue volume. Therefore:
dC&)/dt = ; (C,(t) - C,(t)).
where CT = tissue tracer concentration (counts per gram): F/V = flow per unit of tissue volume (milliliters per gram per minute); C, = arterial concentration of tracer (counts per milliliter); and C, = venous concentration of tracer (counts per milliliter).
Kety described the relation of venous concentration of tracer to the tissue concentration of tracer assuming equilibration of tracer between blood and tissue during a single capillary passage of tracer:
(C, - C,) = m(C, - C&J, 121
where A = tissue/blood partition coefficient (milliliters per gram); and m = a diffusion constant reflecting effects of diffusion limitations and all other factors tending to limit equilibration of tracer between tissue and blood and defined as:
m = 1 - e(-B/F). I31
where PS is the product of capillary permeability and surface area (ml/g per min). For studies of H,‘*O in myocardium, A = 0.92 ml/g (2) and m = 1.0. Substituting (2) into (1):
Then, solving (4):
CT(t) = ; C,(t) * exp -; ( i i
151
where * represents convolution. Because current generations of positron emission tomographic
scanners cannot measure instantaneous tissue activity, scans are performed over many seconds summing the decay events occurring during the scan:
El
Averaged counts over short scan intervals (i.e., 5 s) are used to approximate instantaneous count rates. FN (flow per unit volume) can be estimated by minimizing the sum of squared deviations with respect to F/V given that A is known and C,(t) and C,(t) can be measured.
where C,.?,,(t) = observed tissue activity (counts per gram); C,(t) = true tissue activity (counts per gram); C&t) = observed blood pool activity (counts per gram): C,(t) = true blood pool activity (counts per gram); F,, = recovery coefficient of tissue; F,, = fraction of blood activity into tissue; F,, = recovery coefficient of blood pool: and F,, = fraction of tissue activity into blood pool.
These corrections imply that the recovery coeficients and spill-
A least squares technique was used for fitting equation 6 to all data values in the interval from 0 to 90 s after the appearance of tracer in the left atrium (or in directly sampled arterial blood in experimental animals). Therefore, estimates of F/V reflect both wash-in and washout processes. The optimal value of F/V is obtained by a direct search over the entire range of values.
over factors are known accurately. We previously demonstrated that these fractions can be calculated analytically if the resolution of the tomograph as well as the blood pool and cardiac tissue dimen- sions are known and if there is no motion present (22). However, when cardiac and respiratory motion is present or when inaccurate estimates of blood pool and tissue dimensions are used, or both, correction fractions may be inaccurate and consequently the cor- rection of observed positron emission tomography counts are in- valid and can result in substantial error (Fig. 9).
The 90 s time interval was selected because the actual number of To circumveni the problem of having to estimate correction counts in a region after this interval is very small and extending the fractions with independenr assessments of chamber and wall dimen- scan time results in addition of low signal-to-noise data. In addition, sions. we have incorporated within the flow model the relation simulation studies show that the early part of the curve is most sensitive to values of flow (Fig. 10).
between true tissue counts and observed positron emission tomo- graphic tissue counts expressed in equation 7.
TIME (set)
Figure 10. Computer simulation of myocardial time-activity curves (with use of a single arterial input function) for flows from 0.2 to 4.0 ml/g per min. In the approach developed, data were used from the time of appearance of tracer in the left atrium for 90 s. The 90 s time point was selected because of decreased statistical confidence in counts obtained after this interval, and because the early part of the curve is most sensitive to values of flow.
Correction of observed counts for effects of motion and of resolution limitation. Because of the limited resolution of the present generation of tomographs in relation to the thickness of myocardium and effects of cardiac motion, true tissue radiotracer concentration cannot be measured directly with positron emission tomography. However, observed positron emission tomographic tissue and blood pool activ- ity can be related to true tissue and blood pool tracer concentration by correcting for partial volume and spillover effects:
C,,,,(t) = F,, x C,(t) + F,, C,(t) 171
C&t) = F,, x C,(t) f F,, x C,(t). Bl

JACC Vol. 14, No. 3 September 1989:63Y-52
BERGMANN ET AL. 651 MEASUREMENT OF MYOCARDIAL BLOOD FLOW WITH HL150
The operational equation is thus:
Cq,,$, : t2) = ” C,,,,(t) dt = FM,., x
[;~;Ca~t~*.., (“;l) ,,]+,.,,lc.,,dt. 191
where the observed positron emission tomographic tissue activity can now be fitted directly to the operational flow equation to estimate myocardial blood flow per unit volume (F/V) as well as F,, and F,, using a nonlinear least squares fitting routine. The optimal value of F/V is obtained by a direct search over the entire range of possible flow values with values of F,, and F,, estimated for each value of FN by linear, least squares approximation. The optimal set of parameters is then the set that minimizes the sum of squared deviations. By including the tissue activity correction for partial volume and spillover effects within the estimation of F/V, no a priori knowledge of F,, and F,, is needed, and consequently no error in its calculation is introduced in accurate correction factors. Furthermore, because equation 9 represents the empirical relation between true tissue activity and observed positron emission tomo- graphic tissue activity, the parameter estimated correction fraction? F MM and FaM include effects of linear cardiac and respiratory motion on observed positron emission tomographic counts. The model assumes that C,(t) is true (i.e., F,, = 1.0 and F,, = 0) and consequently that C,(t) can be obtained directly from observed positron emission tomography counts or that it is obtained by direct arterial sampling.
References I. Bergmann SR. Fox KAA, G&man EM, Sobel BE. Posilron emission
tomography of the heart. Prog Cardiovasc Dis 1985;28:165-94.
2. Bergmann SR. Fox KAA. Rand AL, et al. Quantlficalion of regional myocardial blood flow in viva with H2’50. Circulation 1984:70:724-33.
3. Tripp MR, Meyer MW, Emzig S, Leonard JJ, Swayre CR, Fox IJ. Simultaneous regional myocardial blood flows by tritiated water and microspheres. Am J Physlol:Heart Circ Physlol 1977:232:Hl73-H90
4. Bergmann SR, Hack S, Tewson T. Welch MJ, Sobel BE. The dependence of accumulation of “NH, by myocardmm on metabolic factors and its implications for quantitative assessment of perfusion. Circulation 1980: 61334-43.
5. Rauch B, Helus F, Grunze M, et al. Kinetics of “N-ammonia uptake in myocardial single cells Indicating potential limitations in its applicability as a marker of myocardial blood Row. Circulation 1985:71:387-93.
6. Knvokapich J. Huang S-C. Phelps ME. MacDonald NS. Shine KI. Dependence of “NH, myocardial extraction and clearance on flow and metabolism. Am J Physiol:Heart Circ Physiol 1982:242:H536-H42.
7. Shah A, Schelbert HR, Schwaiger M, et al. Measurement of regional myocardial blood flow with N-13 ammonia and positron-emission tomog- raphy in Intact dogs. J Am Coil Cardiol 1985:5:92-100.
8. Foster DO. Frydman ML. Comparison of microspheres and “Rb+ as tracers of the distribution of cardiac output in rats indicates invalidity of “Rb+-based measurements. Can J Physiol Pharmacol 1977:56:97-109.
9. Fukuyama T. Nakamura M, Nakagaki 0, et al. Reduced reflow and diminished uptake of @‘Rh after temporary coronary occlusion. Am J Physiol 1978;234:H724-9.
IO. Selwyn AP. Allan RM. L’Abbate A, et al. Relation between regional myocardial uptake of rubidium-82 and perfusion: absolute reduction of cation uptake in ischemia. Am J Cardiol 1982:50: 112-21.
I I. Wilson RA, Shea M, De Landsheere C, et al. Rubidium-82 myocardial uptake and extraction after transient ischemia: PET characteristics. J Comp Assist Tomogr 1987:11:6C&
12. Goldstein RA. Rubidium-82 kinetics after coronary occlusion: temporal relation of net myocardial accumulation and viability in open-chested dogs. J Nucl Med 1987;27:1456-61.
13. Rosenspire KC. Schwa&r M. Mangner TJ. et al. Metabolic fate of N-13 ammonia in human blood: implications for quantification of myocardial blood flow by PET (abstr). 1 Nucl Med 1988:29:783.
14. Beqmann SR. Fox KAA. Ter-Pogossian MM, Sobel BE, Collen D. Clot-selective coronary thrombolysis with tissue-type plasminogen acti-
15.
16.
17.
18.
19.
20.
!I.
22.
23.
24.
25
26
27
28
29
vator. Science 1983;220:1181-3.
Knabb RM, Fox KAA, Sobel BE. Bergmann SR. Characterization of the rtmctional significance of subcritical coronary stenoses with H,“O and positron-emission tomography. Circulation 1985;71: 1271-8.
Knabb KM, Rosamond ‘TL, Fox KAA. Sobel BE, Bergmann SR. En- hancement of salvage of reperfused ischemic myocardium by diltiazem. 1 Am Coil Cardiol 1986;8:861-71.
Walsh MN, Bergmann SR, Ter-Pogossian MM, Sobel BE, Geltman EM. Identificatmn of patients with coronary artery disease by positron tomog- raphy with H2’s0. Circulation 1988:78:612-20.
Hoffman EJ. Phelps ME. Wisenberg G. Schelbert HR, Kuhl DE. Elec- trocardiographic gating in positron emission computed tomography. J Comp Assist Tomogr 1979:3:733-9.
Ter-Pogossian MM, Bergmann SR. Sobel BE. Influence of cardiac and respiratory motion on tomographic reconstructions of the heart: implica- tion for quantitative nuclear cardiology. J Cornpot Assist Tomogr 1982; 6:1148-1155.
Hoffman EJ, Huang S-C, Phelps ME. Quantitatlon in posltron emission computed tomography: I. effect of object size. J Comput Assist Tomogr 1979:3:299-308.
Henze E. Huang S-C, Ratib 0, Hoffman E. Phelps ME, Schelbert HR. Measurements of regional tissue and blood-pool radiotracer concentra- tions from serial tomographic images of the heart. J Nucl Med 1983; 24:9X7-96.
Hcrrero P. Markham J, Myears DW. Weinheimer CJ, Bergmann SR. MedSUrement of myocardial blood flow with positron emission tomogra- phy: correction for count spillover and partial volume effects. Math] Comput Modelling 1988:11:807-12.
Iida H. Kanno I, Takahashi A. et al. Measurement of absolute myocardial blood flow with Hz”0 and dynamic positron-emission tomography. Circulation 1988:78:104-15.
Huang SC, Schwaiger M, Carson RE. et al. Quantitative measurement of myocardial blood flow with oxygen-15 water and positron computed tomography: an assessment of potential and problems. J Nucl Med 1985:26:61&25.
Bergmann SR, Lerch RA, Fox KAA. et al. Temporal dependence of beneficial effects of coronary thrombolysis characterized by positron tomography. Am J Med 1982;73:573-81.
Ter-Pogosslan MM, Ficke DC. Hood JT, Yamamoto M. Mullani NA. PETT VI: a positron emission tomograph utilizing cesium fluoride scin- tillation detectors. J Comput Assist Tomogr 1982:6:125-33.
Weinberg IN. Huang S-C, Hoffman EJ. et al. Validation of PET-acquired input functions for cardiac studies. I Nucl Med 1988;29:241-7.
Heymann MA, Payne BD, Hoffman JIE, et al. Blood flow measure- ments with radionuclide-labeled particles. Prog Cardiovasc Dis 1977:20: 55-78.
Daley PJ, Mann TH, Zielonka JS, Krubsack AJ, Akhtar R, Bamrah VS. Effect of maintenance oral theophylline on dipyridamole-thallium-201 myocardial imaging using SPECT and dipyridamole-induced hemody- namic changes. Am Heart J 1988:115:1185-92.
30. Ter-Pogossian MM, Flcke DC, Yamamoto M, Hood JT. Super PETT I: a positron emission tomography utilizing photon time-of-flight information. IEEE Tram Med lmag 1982;Ml.1:179-87.

652 BERGMANN ET AL. MEASUREMENT OF MYOCARDIAL BLOOD FLOW WITH H,“O
31. Kety SS. The theory and applications of the exchange of inert gas at the lungs and tissues. Pharmacol Rev 1951;3:1-41.
32. Kety SS. Theory ofblood-tissue exchange and its application to measure- ment of blood flow. Meth Med Res 1960;8:223-7.
33. Kety SS. Measurement of local blood flow by the exchange of an inert, diffusible substance. Meth Med Res 1960;8:228-36.
34. Parodi 0. Schelbert HR, Schwaiger M, Hansen H, Selin C, Hoffman EJ. Cardiac emission computed tomography: underestimation of regional tracer concentrations due to wall motion abnormalities. J Comput Assist Tomogr 1984:8: 1083-92.
Klocke FJ. Measurements of coronary flow reserve: defining pathophys- iology versus making decisions about patient care. Circulation 1987; 76:1183-9.
Marcus ML, Wilson RF, White CW. Methods of measurement of myo- cardial blood Row in patients: a critical review. Circulation 1987;76: 245-53.
Brown BG, Josephson MA. Petersen RB, et al. Intravenous dipyridamole combined with isometric handgrip for near maximal acute increase in coronary flow in patients with coronary artery disease. Am J Cardiol 1981;48:1077-85.
JACC Vol. 14, No. 3 September 198963952
38. Wilson RF, Laughlin DE, Ackell PH, et al. Transluminal, subselective measurement of coronary artery blood flow velocity and vasodilator reserve in man. Circulation 1985:72:82-92.
39. Picano E. Simonetti I. Masini M. et al. Transient mvocardial dvsfunction during pharmacologic vasodilation as an index of reduced’ coronary reserve: a coronary hemodynamic and echocardiographic study. J Am Coil Cardiol 1986;8:8d-90.
40 Wisenberg G, Schelbert HR, Hoffman El. et al. In viva quantitation of regional myocardial blood flow by positron-emission computed tomogra- phy. Circulation 1981;63:1248-57.
41. Hack SN, Eichling JO, Bergmann SR, Welch MJ, Sobel BE. External quantification of myocardial perfusion by exponential infusion of positron-emitting radionuclides. J Clin Invest 1980:66:918-27.
42
43.
Palmer WH, Fam WM, McGregor M. The effect of coronary vasodilata- tion (dipyridamole-induced) on the myocardial distribution of tritiated water. Can J Physiol Pharmacol 1966;44:777-82.
Yoshida S, Akizuki S, Gowski D, Downey JM. Discrepancy between microsphere and diffusible tracer estimates of perfusion to ischemic myocardium. Am J Physiol:Heart Circ Physiol 1985;249:H255-64.


![Parametric imaging of myocardial blood flow and viability ... · Parametric imaging of myocardial blood flow and viability using [15O]H 2 O and PET/CT REVIEW PET is the unrivalled](https://img.dokumen.tips/doc/110x75/5f0efa557e708231d441e0ab/parametric-imaging-of-myocardial-blood-flow-and-viability-parametric-imaging.jpg)