Embed Size (px)
Citation preview
© 2011 Pearson Prentice Hall, Salkind.
Nonexperimental Research: Descriptive and Correlational Methods

© 2011 Pearson Prentice Hall, Salkind.
� Explain the purpose and use of descriptive and correlational studies.
� Discuss the development and use of surveys.
� Explain the different types of tools used in survey research.
� List the “Ten Commandments” of interviewing.
� Summarize how to conduct survey research.
� Discuss how to verify the validity of survey research.
� Outline the pros and cons in survey research.

© 2011 Pearson Prentice Hall, Salkind.
� Define correlational research and discuss how correlations assess the degree to which variables are related.
� Discuss scattergram data and what the correlation coefficient means.
� Compute the Pearson product moment correlation coefficient.
� Explain the difference between a coefficient of determination and a coefficient of alienation.
© 2011 Pearson Prentice Hall, Salkind.
� Descriptive Research
� Correlational Research

© 2011 Pearson Prentice Hall, Salkind.
� Descriptive Research
� Correlational Research Methods

© 2011 Pearson Prentice Hall, Salkind.
© 2011 Pearson Prentice Hall, Salkind.
� Asks about the characteristics of a phenomenon
� Does not include treatment or control groups

© 2011 Pearson Prentice Hall, Salkind.
� Survey Research
� Correlational Studies—relationships between variables are characterized

© 2011 Pearson Prentice Hall, Salkind.
� Examines the frequency and relationships between psychological and sociological variables
� Assesses constructs such as attitudes, beliefs, prejudices, etc.

© 2011 Pearson Prentice Hall, Salkind.
� Basic tool of survey
� Face sheet—neutral background information
◦ Helps establish rapport with interviewee
◦ Establishes data characteristics
� Two types of questions
◦ Structured questions require an explicit answer
◦ Open-ended questions allow the interviewee to elaborate
© 2011 Pearson Prentice Hall, Salkind.
� Advantages
◦ Flexibility in collecting data
◦ Interviewer can set tone and agenda
� Disadvantages
◦ Expensive
◦ Lack anonymity, so responses might not be honest
◦ Lack standardized questions

© 2011 Pearson Prentice Hall, Salkind.
� Describe goals of project
� Select appropriate sample
� Develop interview questions
� Train interviewers
� Conduct interviews

© 2011 Pearson Prentice Hall, Salkind.
1. Do not begin the interview cold.
2. Remember that you are there to get information.
3. Be direct.
4. Dress appropriately.
5. Find a quiet place to conduct the interview.
6. If your interviewee doesn’t give a satisfactory answer the first time, don’t give up.
7. Use a tape recorder.
8. Make the interviewee a part of the interview.
9. Practice.
10. Thank interviewees for their help, and ask for questions.

© 2011 Pearson Prentice Hall, Salkind.
� The general (flow) plan
1. Clarify the objectives
2. Identify a sample
3. Define a method
� How will the questions be structured?
� How will the sample be defined?
� How will the data be collected?
� What types of questions will be asked?
4. Coding and scoring

© 2011 Pearson Prentice Hall, Salkind.
� Advantages◦ Permits good
generalization
◦ Efficient data collection
◦ Can yield very accurate results
� Disadvantages◦ Bias
� Interviewer bias
� Interviewee bias
◦ Non-response
© 2011 Pearson Prentice Hall, Salkind.
© 2011 Pearson Prentice Hall, Salkind.
� Describe a linear relationship between variables
� Do not imply a cause-and-effect relationship
� Do imply that variables share something in common
© 2011 Pearson Prentice Hall, Salkind.
� Expresses degree of linear relatedness between two variables
� Varies between –1.00 and +1.00
� Strength of relationship is◦ Indicated by absolute value of coefficient
◦ Stronger as shared variance increases

© 2011 Pearson Prentice Hall, Salkind.
If X… And Y…The correlation
isExample
Increases
in value
Increases in
valuePositive or direct
The taller one gets (X),
the more one weighs (Y).
Decreases
in value
Decreases in
valuePositive or direct
The fewer mistakes one
makes (X), the fewer
hours of remedial work
(Y) one participates in.
Increases
in value
Decreases in
value
Negative or
inverse
The better one behaves
(X), the fewer in-class
suspensions (Y) one has.
Decreases
in value
Increases in
value
Negative or
inverse
The less time one spends
studying (X), the more
errors one makes on the
test (Y).

© 2011 Pearson Prentice Hall, Salkind.
� Pearson product moment correlation◦ rxy
◦ Correlation between variables x and y
� Scattergram representation1. Set up x and y axes
2. Represent one variable on x axis and one on y axis
3. Plot each pair of x and y coordinates

© 2011 Pearson Prentice Hall, Salkind.
• When points are closer to a straight line, the correlation becomes
stronger
• As slope of line approaches 45°, correlation becomes stronger
© 2011 Pearson Prentice Hall, Salkind.
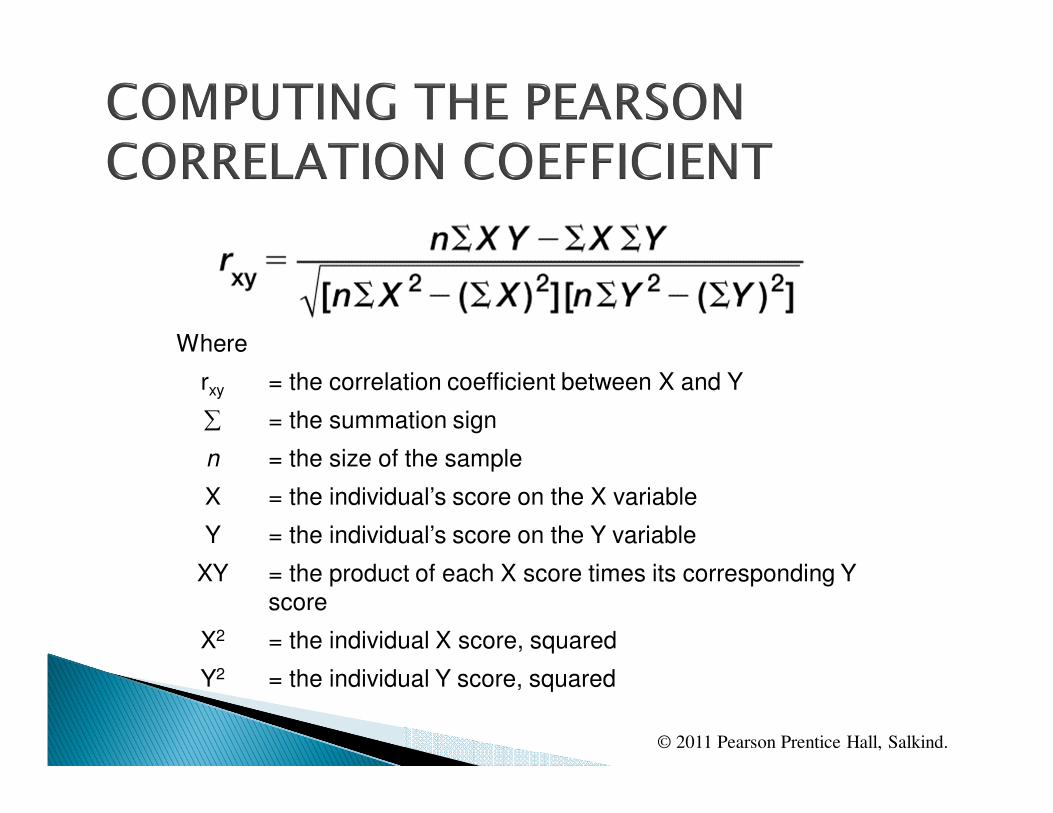
Where
rxy = the correlation coefficient between X and Y
∑ = the summation sign
n = the size of the sample
X = the individual’s score on the X variable
Y = the individual’s score on the Y variable
XY = the product of each X score times its corresponding Y
score
X2 = the individual X score, squared
Y2 = the individual Y score, squared
© 2011 Pearson Prentice Hall, Salkind.
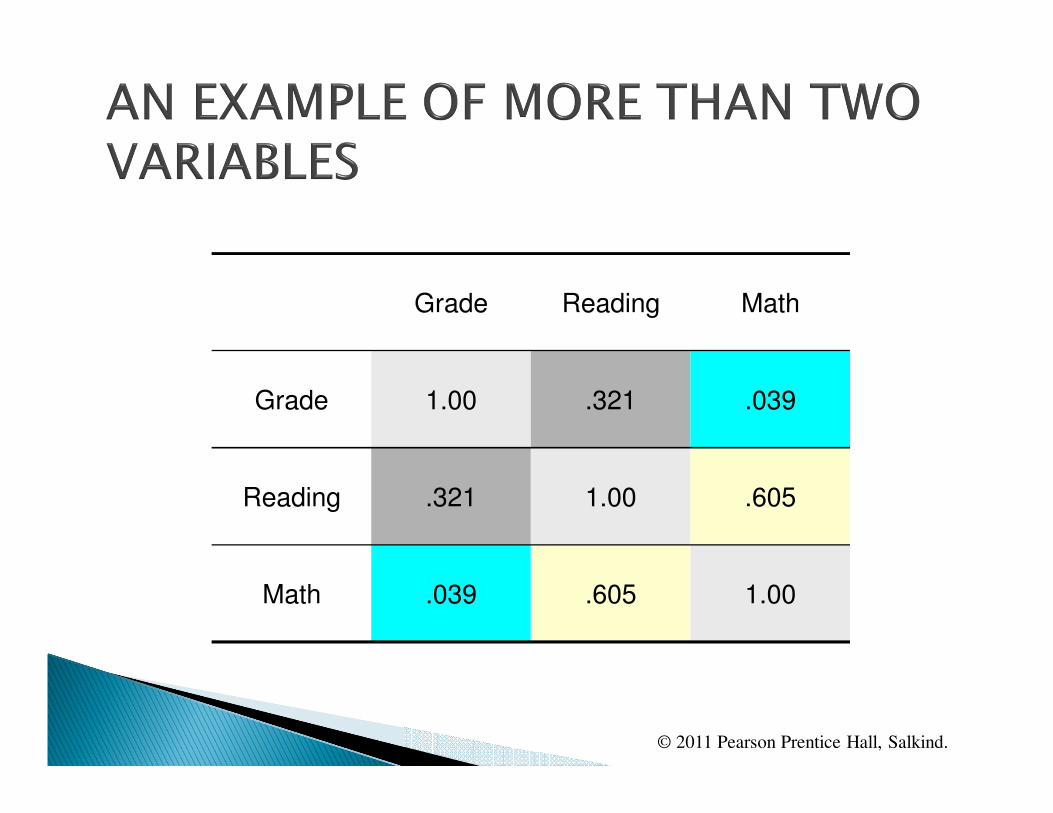
Grade Reading Math
Grade 1.00 .321 .039
Reading .321 1.00 .605
Math .039 .605 1.00

© 2011 Pearson Prentice Hall, Salkind.
� “Eyeball” method
Correlations
between
Are said to be
± .8 and 1.0 Very strong
± .6 and .8 Strong
± .4 and .6 Moderate
± .2 and .4 Weak
± 0 and .2 Very weak
© 2011 Pearson Prentice Hall, Salkind.
� Coefficient of determination
◦ Squared value of correlation coefficient
◦ Proportion of variance in one variable explained by variance in the other
� Coefficient of alienation
◦ 1 – coefficient of determination
◦ Proportion of variance in one variable unexplained by variance in the other
© 2011 Pearson Prentice Hall, Salkind.
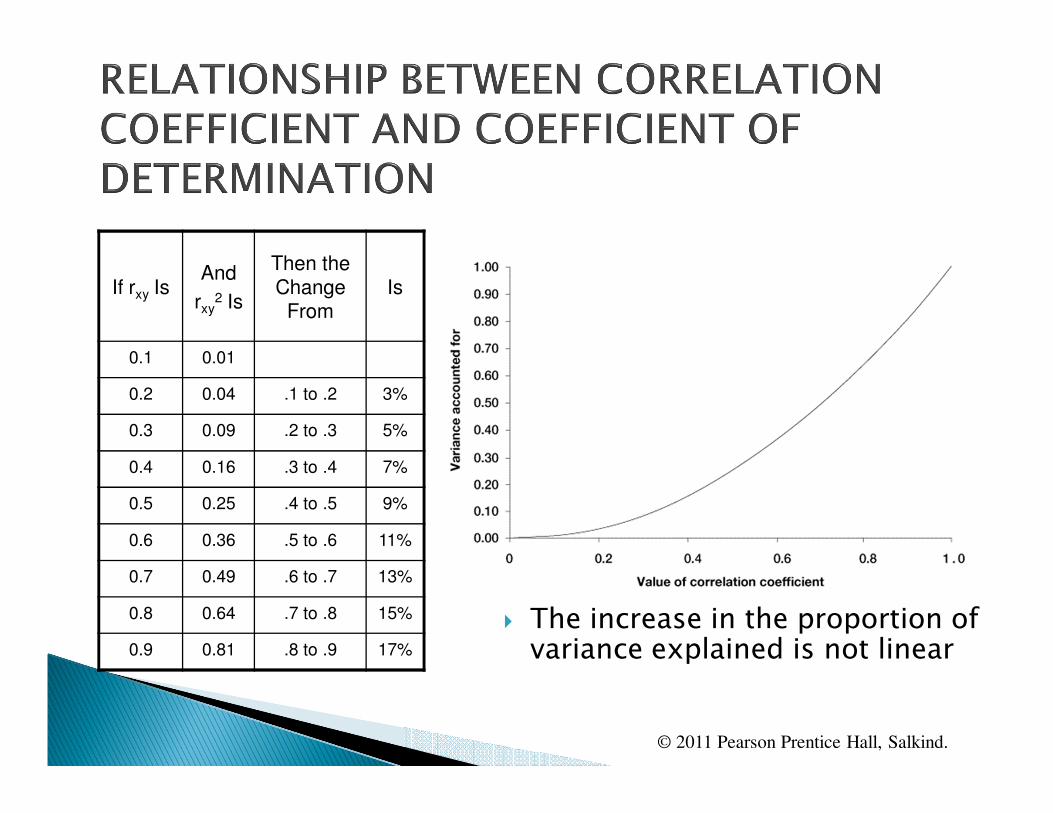
� The increase in the proportion of variance explained is not linear
If rxy IsAnd
rxy2 Is
Then the Change
FromIs
0.1 0.01
0.2 0.04 .1 to .2 3%
0.3 0.09 .2 to .3 5%
0.4 0.16 .3 to .4 7%
0.5 0.25 .4 to .5 9%
0.6 0.36 .5 to .6 11%
0.7 0.49 .6 to .7 13%
0.8 0.64 .7 to .8 15%
0.9 0.81 .8 to .9 17%

© 2011 Pearson Prentice Hall, Salkind.
� Explain the purpose and use of descriptive and correlational studies?
� Discuss the development and use of surveys?
� Explain the different types of tools used in survey research?
� List the “Ten Commandments” of interviewing?
� Summarize how to conduct survey research?
� Discuss how to verify the validity of survey research?
� Outline the pros and cons in survey research?

© 2011 Pearson Prentice Hall, Salkind.
� Define correlational research and discuss how correlations assess the degree to which variables are related?
� Discuss scattergram data and what the correlation coefficient means?
� Compute the Pearson product moment correlation coefficient?
� Explain the difference between a coefficient of determination and a coefficient of alienation?


