Embed Size (px)
Citation preview

TRANSPORTATION RESEARCH RECORD 1295
Nondestructive Tests for Determining Compressive Strength of CementStabilized Soils
PAUL A. OKAMOTO, BRIANT. BOCK, AND PETER J. NUSSBAUM
Nondestructive impact hammer tests were made on cementstabilized noncohesive soils using a Clegg impact soil tester and a Proceq Type PT test hammer. Compressive trength of the stabilized oil varied from about 5 to l 000 psi . urves correlating impact hammer values with cement-stabilized oi l compressive strength were developed for each of the test hammer ·. These curves can be used to correlate in situ nondc rructive tc t value with the compressive strength of cement-stabilized soils.
Normally, tests for acceptance of the quaJjty of soil-cement or cement-treated base course construction involve determination of cement content, compaction, and layer thickness.
In some areas, agencies have attempted to base acceptance on the compre ive strength of drilled core (see ASTM 01633-84 and ASTM C39-86). This procedure has led to difficulties, especia lly where relatively low-'trength material is spec.ified (300 to 400 psi). Often, it is not possible to obtain good core recovery from cement-stabilized base at early ages; thi difficulty can lead to unwarranted conclusions about the quality of construction. In addition, core drilling and testing of cores for compressive strength are both costly and time consuming. Thu , a need exists for a simple nondestructive testing de ice that can be used in the field to provide a more meaningful evaluation of the quality of cement-stabilized materials.
OBJECTIVE AND SCOPE
The investigation was undertaken to develop a nonde tructive test method for determjnjng the compre sive trength of cement-stabilized soil. The objective was accomplished within the following scope:
1. Two commercially available impact hammers, a Clegg impact soil tester and a Proceq Type PT test hammer were elected to evaluate correlations between test hammer values
and cement-stabilized soil compressive strength. 2. Six cohesionless soil materials were selected to evaluate
impact hammer responses for a range of soil materials. 3. Each of the six soils was stabilized with different amounts
of cement to develop a range of compressive strength. 4. Cement-stabilized soil test blocks were molded for im
pact hammer testing. Companion cylindrical specimens were
P.A. Okamoto and P. J. Nussbaum, Construction Technology Laboratories, Inc., 5420 Old Orchard Road, Skokie, Ill . 60077. B. T. Bock, Portland Cement Association, 5420 Old Orchard Road, Skokie, Ill. 60077.
compacted to the same density as the test blocks to determine compressive strength.
5. Correlation curves of cement-stabilized soil compressive strength versus impact hammer test values were developed for each of the two instruments.
TEST EQUIPMENT AND SOILS
Two commercially available impact hammers were selected for the test program. Selection criteria included transportability, ease of operation, and cost. The Clegg impact soil tester
FIGURE 1 Clegg impact soil tester.

2
FIGURE 2 Proceq Type PT hammer.
including an appruximalely 10x10 x 31-in. carrying case weighs about 15 lb . The Proceq Type PT test hammer weighs about 51/2 lh and is carried in an approximately 3 x 6 x 10-in. case. The test hammers are shown in Figures 1 and 2.
The Clegg impact soil tester consists of a 10-lb compaction hammer together with a guide tube and an electronic meter. The meter signal is provided by an accelerometer fastened to the hammer. Meter maximum deceleration readout is in digital form.
The Proceq Type PT hammer is a penrlulum-type impact tester. Impact energy is 0.65 ft-lb with a hammer surface area of about 1.95 in. 2 Impact hammer rebound values are read from a scale on the instrument.
Six soils encompassing the range of cohesionless soil materials commonly used for soil-cement construction were obtained for this laboratory test program. Soil classifications and descriptions are presented in Table l. AASHTO soil classifications vary from A-1-a to A-3(1). Standard density and optimum moisture determined in accordance with ASTM 0558-82, Moisture-Density Relations of Soil-Cement Mixtures, varied from 106 to 142 lb/ft3 and from 6 to 13 .5 percent by weight of dry soil plus cement, respectively. Moisture-density tests were made using the amount of cement estimated to produce soil-cement for each of the six soils.
TEST PROCEDURES
To evaluate the response of the impact hammers over a hardness range of compressive stren~th of about 5 to 1,000 psi,
TRANSPORTATION RESEARCH RECORD 1295
TABLE 2 CEMENT CONTENTS AND DENSITIES
Cement Dry Soil No. Conteni, Dens~y.
percent pcf
1 2 86.3 5 95.9 8 101 .4
10 99.5 12 99.5 16 99.5
2 2 100.5 5 100.5 8 99.5
10 100.5 12 105.7 16 105.7
3 5 108.2 10 108.2 15 106.2
4 5 104.1 10 102.0 15 102.0
5 8 -I -1 "'7 A 111 . ...
12 122.0 16 122.0
6 4 128.3 7 128.3
10 118.5
cement-stabilized soil test blocks were molded with varying amounts of cement. Amounts of cement used for test blocks made with each of the six soils are presented in Table 2. The amount of water used for batching the cement-stabilized soil was equivalent to the optimum moisture content determined from the moisture-density tests.
The mix was placed in a 12 x 24 x 8-in. container and statically compacted to a thickness of about 6 in . On the basis of experience with both impact hammers , the boundary support of the container has an insignificant effect on surface hardness impact values when specimens are at least 6 in. deep and have
TABLE 1 SOIL CLASSIFICATION AND DESCRIPTION
Max. Dry Optimum Soil AASHTO Dens~y . Moisture, Sieve Analysis, percent passing No. Class pcf percent 1/2 in. no.4 no. 10 no. 40 no.200
1 A-1-b 118 11.0 100 96 75 38 11 2 A-3 106 11.5 100 100 100 96 0 3 A-1-b 128 9.5 100 96 78 44 10 4 A-2-4 118 13.5 100 99 89 61 15 5 A-1-b 127 8.5 100 97 76 28 1 6 A-1-a 142 6.0 83 60 49 24 4 I•

Okamoto et al.
a compressive strength of less than 1,000 psi. For specimens with compressive strengths in excess of approximately 1,000 psi, the within-test variability of impact values exceeds any differentiation of specimen support and boundary type.
Companion 2.8 x 5.6-in. cylindrical specimens were made in general compliance with ASTM D1632-87, Making and Curing Soil-Cement Compression and Flexure Test Specimens in the laboratory. However, the cylinders were compacted to the same density as the companion block specimens and curing was under wet burlap at 72°F.
Impact hammer tests on the cement-stabilized blocks were made after 1, 2, 3, 5, 7, 10, 14, and 17 days of curing under wet burlap. Three impact instrument readouts were averaged for each test to provide an impact value. The hammers were moved between each impact readout to prevent impact footprint superposition. Companion cylindrical specimens were tested each day that impact values were obtained according to ASTM D1633-84, Compressive Strength of Molded SoilCement Cylinders. A best-fit curve of compressive strength versus curing age was determined for each block's companion cylinders. Thus, normalized compressive strength data were available for each of the impact hammer values.
TEST RESULTS
Individual Soil Analysis
A linear regression of compressive strength on impact values for the Clegg impact soil tester and the Proceq Type PT test hammer was done for each of the six different soils. Outlier and leverage points identified in each linear regression were eliminated. The regression analysis for the six individual soils is presented in Table 3. The linear regression form for the compressive strength and impact value data is the log-log equation. For the six equations derived for the Clegg data, the coefficients of determination, R2
, ranged from 0.75 to 0.94 and averaged 0.86. For the Proceq data, the values of R2 ranged from 0.25 to 0.97 and averaged 0.75.
3
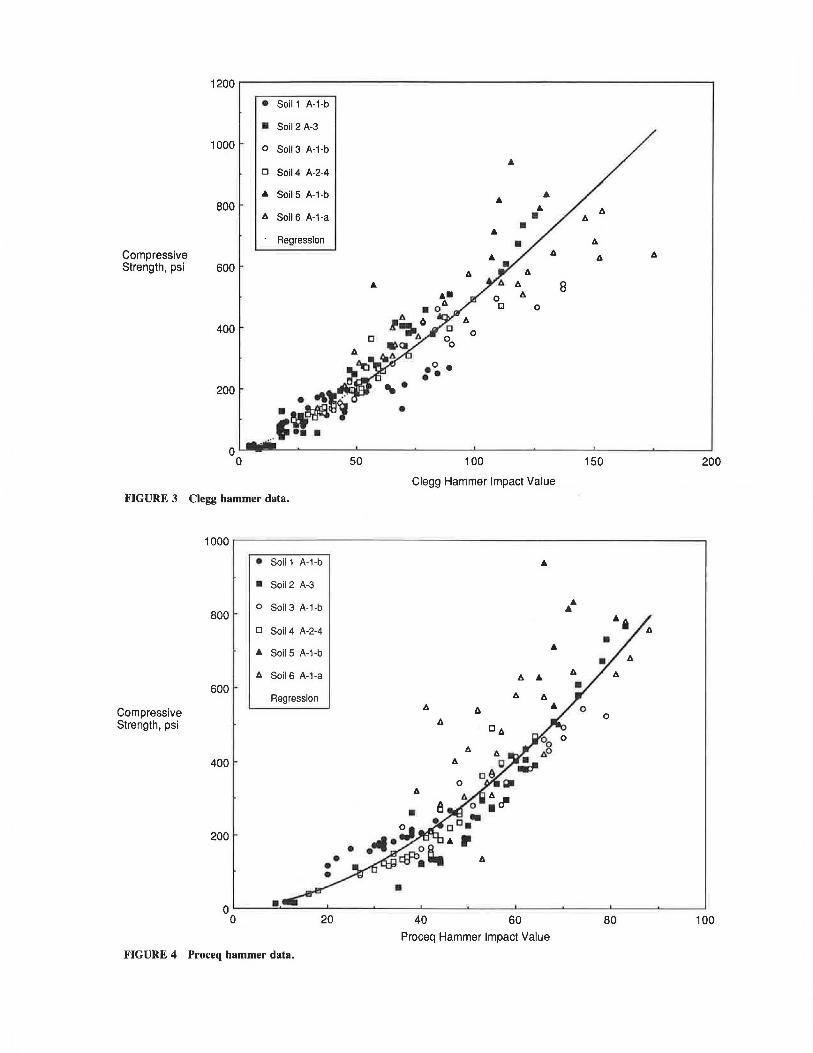
Combined Analysis
The analysis of individual soil data indicated that a single loglog relationship for all soils combined was feasible for both impact testers. Impact values versus compressive strength for the Clegg and Proceq testers are plotted in Figures 3 and 4, respectively. The values of R2 for the Clegg and Proceq hammer log-log relationships are 0.90 and 0.84, respectively. The resulting equations are presented in Table 4.
Confidence Intervals of Strength Prediction
Confidence intervals at the 5 percent level of significance for the prediction of the actual value resulting from a given impact value were computed as shown in Figures 5 and 6 for the Clegg and Proceq hammers, respectively. The 95 percent confidence intervals represent the uncertainty of the probability density function about compressive strength, given an impact value. The conditional expectation, also computed for the two data sets, is presented in Table 5. The 95 percent confidence levels for the conditional expectation represent the uncertainty of the probability density function about the expected, or average, compressive strength for a given impact value. The conditional expectation confidence intervals are nonlinear functions of the impact values. The half-prediction interval as a percentage of compressive strength ranged from approximately 5 to 11 percent for both hammers.
Within-Test Variability
The within-test coefficient of variation, equal to the standard deviation divided by the mean, can be estimated from the within-test range of the three impact values (see ACI 214-77). The soil-cement specimen surface is assumed to be uniform in hardness and compressive or impact strength. Any impact value variation, therefore, follows from equipment and test method variability. The range in impact values cal-
TABLE 3 SUMMARY OF LINEAR REGRESSION ANALYSIS ON INDIVIDUAL SOILS
Impact Soil Soil No. of Compressive Strength, psi log (f'c) = "a" + "b" x log (Impact) Hammer No. Class Tests Minimum Maximum Average "a" "b" A-sq.
Clegg 1 A-1-b 40 60 270 150 0.949 0.762 0.75 2 A-3 39 40 770 300 0.015 1.372 0.90 3 A-1-b 23 120 540 320 0.279 1.176 0.91 4 A-2-4 24 100 490 230 0.326 1.173 0.94 5 A-1-b 9 440 940 690 -0.263 1.522 0.75 6 A-1-a 23 210 780 490 1.093 0.800 0.89
Proceq 1 A-1-b 25 90 270 190 0.952 0.857 0.86 2 A-3 27 120 770 370 -2.327 2.742 0.97 3 A-1-b 22 120 540 330 -0.960 1.981 0.94 4 A-2-4 24 100 490 230 -1.024 2.049 0.93 5 A-1-b 9 440 940 690 -0.304 1.703 0.25 6 A-1-a 23 210 780 490 0.806 1.058 0.54
Compressive Strength, psi
FIGURE 3
Compressive Strength, psi
FIGURE 4
• Soil 1 A-1-b
• Soil 2 A-3
1000 o Soil 3 A-1-b
Cl Soil 4 A-2-4
• Soil 5 A-1-b 800
6. Soil 6 A-1-a
Regression
600
400 Cl
200
50
Clegg hammer data.
1000
• Soil 1 A-1-b
• Soil 2 A-3
800 o Soil 3 A-1-b
Cl Soil 4 A-2-4
• Soil 5 A-1-b
6. Soil 6 A-1-a
600 Regression
400
200 •
0 • 0 20
Proceq hammer data.
•
•
.o • • •
0
100
0 IJ 0
Clegg Hammer Impact Value
• 6. •
6. 6. 6
6. Cl 6.
6. 6.
6.
•
6.
40 60 Proceq Hammer Impact Value
150 200
• •
6.
0
80 100

Okamoto et al. 5
TABLE 4 SUMMARY OF LINEAR REGRESSION ANALYSIS
Impact No. of Compressive Strength, psi Hammer Tests Minimum Maximum Average "a"
Clegg 179 5 940 275 0.081
Proceq 145 15 940 325 -0.516
culated for each soil, cement content, and test age were also assumed to represent the true ranges, because a single set of tests may be statistically insufficient.
The coefficient of variation calculated for the three impact values can be compared to that expected from compressive strength tests. The coefficient of variation of within-test compressive strength testing was calculated from published data of 115 sets of duplicate specimens molded from 35 different soil materials (2,3; ASTM D1633-84).
The resulting distributions of within-test coefficient of variation are shown in Figures 7 and 8. Average within-test coefficients of variation are 13. 7, 9. 7, and 10.5 percent for the Clegg hammer, Proceq hammer, and compressive strength tests, respectively. For coefficients of variation between 5 and 20 percent, the impact hammers exhibit a slightly larger variation than that expected from compressive strength testing. The percentages with coefficients of variation less than 20 percent are 80, 93, and 85 for the Clegg, Proceq, and com-
3
Log Compressive Strength 2
log f'c = 0.081 + 1.309 log (CIV) R-sq. = 0.90
D
log (f'c) = "a" + "b" x log (Impact) Standard I-statistic "b" I-statistic Error A-sq.
1.4 1.309 39.5 0.157 0.90
-4.8 1.757 27.1 0.133 0.84
pressive strength data, respectively . The analysis indicates that similar within-test scatter of data exists between the impact hammers and compressive strength testing.
ADDITIONAL RESEARCH
The research program evaluated testing equipment to nondestructively determine compressive strength of soil-cement. Testing of the equipment in the field should be done to verify or modify the compressive strength versus impact value correlation developed from laboratory data. During field testing, the following issues should be addressed :
1. The number of impact tests averaged at a given test location may have to be increased to obtain similar coefficients of variation in the field as those expected from compressive strength testing.
0'--~~~~--~~~~~-'-~~~~~ ...... ~~~~~-'-~~~~~'--~~~~--' 0 2 3
Log Clegg Impact Value
FIGURE 5 Clegg hammer 95 percent confidence intervals.

TABLE 5 CONFIDENCE INTERVALS FOR STRENGTH PREDICTION
f'c, psi
100 200 300 400 500 600 700 800 900
1000
NOTE:
3
Log Compressive Strength 2
Clegg at 95% Level of Significance
Lowl'c, Highf'c, Plus or Range, psi psi minus, psi percent
94 106 6 6.1 190 211 11 5.3 283 318 18 5.8 375 427 26 6.6 465 538 37 7.3 554 650 48 8.0 643 762 60 8.5 731 876 73 9.1 818 990 86 9.6 905 1105 100 10.0
Prediction interval of the conditional expectation.
Range percent is one half the prediction interval as a percentage of compressive strength.
log f'c = -0.516 + 1.757 log (PIV) A-sq. = 0.84
Proceq at 95% Level of Significance
Lowf'c, Highf'c, Plus or Range, psi psi minus, psi percent
92 109 9 8.5 190 211 11 5.3 285 316 15 5.1 377 424 24 5.9 467 536 34 6.9 555 649 47 7.8 641 764 61 8.7 727 880 76 9.6 812 997 93 10.3 896 1116 110 11.0
o '--~~~~-'-~~~~~..__~~~~---~~~~~.1...--~~~~--'-~~~~---'
U.8 1.2 1.6 2.0
Log Proceq Impact Value
FIGURE 6 Proceq hammer 95 percent confidence intervals.

Relative Frequency
0.10
0.08
0.06
0.04
0.02
0.00 2.5 7.5 12.5 17.5 22.5 27.5 32.5 37.5 42.5 47.5 52.5
Coefficient of Variation, percent
FIGURE 7 Relative frequency histogram for Clegg hammer impact values.
Relative Frequency
0.10
0.08
0.06
0.04
0.02
0.00 2.5 7.5 12.5 17.5 22.5 27.5 32.5 37.5 42.5 47.5 52.5
Coefficient of Variation, percent
FIGURE 8 Relative frequency histogram for Proceq hammer impact values.

8
2. The effects of specimen damage during coring need to be established. Correlations between strength and impact value may need to be modified to incorporate specimen damage.
3. The study incorporated only six different cohesionless parent soils . Field testing should encompass a variety of soils (with differing degrees of cohesion) and cement contents.
CONCLUSIONS
Correlation curves were developed permitting the use of results from impact hammer nondestructive tests to determine the compressive strength and rate of strength gain of in situ cement-stabilized soil construction. This nondestructive method avoids the testing difficulties associated with drilling cores . It is recommended that five hammer readings, each on an untested area of the surface, be averaged.
ACKNOWLEDGMENTS
This investigation was sponsored by the Portland Cement Association. Special thanks go to R. Packard and R. Kuhart for their valuable input and assistance.
TRANSPORTATION RESEARCH RECORD 1295
REFERENCES
1. Soil-Cement Laboratory Handbook. Portland Cement Association , Skokie, Ill., 1971.
2. R . G. Packard. Alternate Method. for Mea uring Freeze-Thaw and Wet-Dry Resistance of oil- ement Mjxtures. Bulle1i11 353, l·IRB , National Research Council , Washington D. ., 1962, pp. 8- 41.
3. R. G. Packard and G. A. hapman. Developments in Durability Testing of oil- cmcnt Mixtures. Highway Research Record 36, HRB, National Research Council, Washington, D.C. , 1963, pp. 97-122.
The opinions and findings expressed or implied in this paper are those of the authors.
Publication of this paper sponsored by Committee on Soil-Portland Cement Stabilization .