Embed Size (px)
Citation preview

Nondestructive Evaluation of Bituminous
Compaction Uniformity: GPR
Prof. Lev Khazanovich
University of Minnesota
November 3, 2016

What is GPR?
• GPR is a non-
invasive, non-
destructive testing
tool for mapping
subsurface
conditions
• E-M waves detect
objects and
determine
distance from the
object 2

Why Use GPR for Air Voids?
• Washington DOT 1989 study found pavement
density has great effects on performance
– Each 1% increase in air voids beyond 7% leads to
~10% loss in pavement life
• Lack of density is local, can be missed by coring
– Core is local evaluation
– Need full coverage evaluation of the surface
• GPR is a potential tool: Continuous profile
– Locate relative high- or low-density areas based on
dielectric map
3
Rolling Density Meter
• RDM operates in passes in
regions of interest (e.g., near
longitudinal joint)
– Pass width depends on number
of antenna arrays, size of region
• Can be operated without
extensive training
– Data acquisition relatively quick
– Data processing/analysis
handled by software
5

SHRP2 R06C
5
• PI: Tom Scullion, Texas A&M
• Completed: December 2013

Rolling Density Meter
Saarenketo and Scullion, 2000

Test Protocol
1. Survey Setup
a. Survey wheel calibration
b. Project and data file input format
c. General survey considerations
d. Survey types
e. Survey Distance
2. Survey Data Collection
a. RDM data collection
b. Core data collection
3. Data Processing
a. Exporting data
b. Airvoid VS Dielectric Calibration
4. Data Analysis and Applications

Survey Data File: File Root Name

Survey Distance
•500 ft survey recommended
•Generally larger than construction/design changes
•Makes data entry easier
•Limits user input and processing errors
•Any data loss is limited to 500ft
•Limits walking distance when returning for cores
•Small section allows RDM survey to stay close to paving crew
during moving operations

General Survey Considerations
•Surveys should be conducted as soon after
paving as possible.
•Survey parameters must consider paving
speed/closure time.
•Battery charge typically limits RDM surveys
to 6 hrs.
•Conducting a joint survey requires a
minimum of 9 in. of pavement on the other
side of the joint. Coordinate traffic barrel
placement and removal accordingly.
•Survey closest to traffic should be
conducted against the direction of traffic,
allowing users to see any troublesome
vehicles before they arrive.

Survey Methods: Survey Types
Lane pass survey: The
center sensor is offset 6ft
from longitudinal joint.
Joint pass survey: The
center sensor is offset 2.5ft
from the longitudinal joint
Swerve survey: The
center sensor is offset 6ft
from longitudinal joint and
the cart is swerved
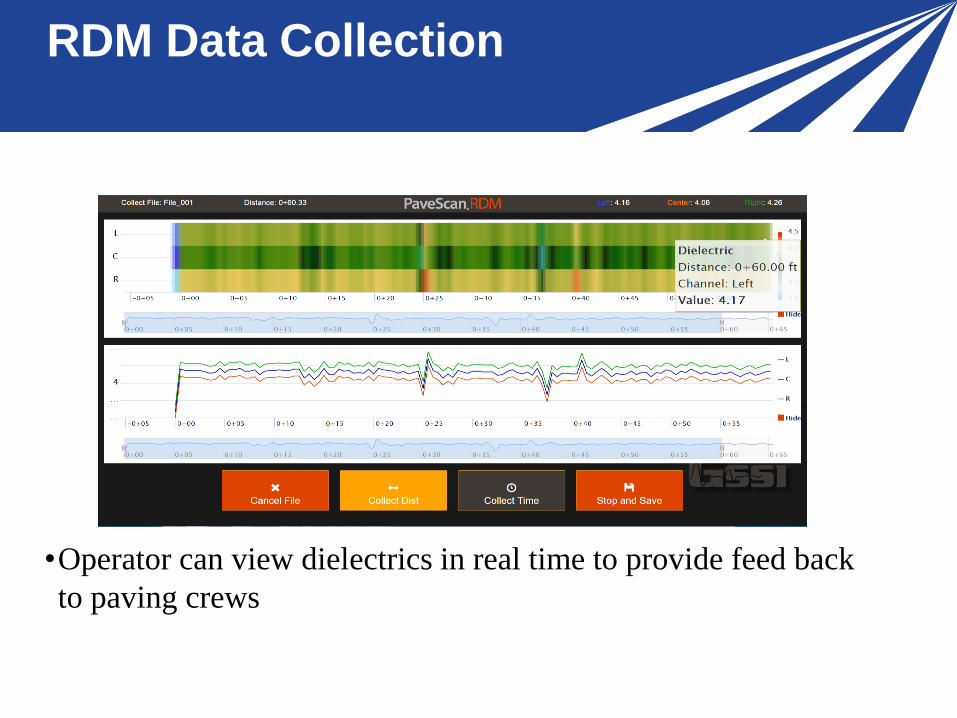
•Operator can view dielectrics in real time to provide feed back
to paving crews
RDM Data Collection

Infield Data Analysis
Though dielectric does not give direct, immediate
measurements of compaction, it can provide valuable infield
insights:
•Effect of different roller variables (pattern, vibration, ect)
•Relatively high and low joint compaction achievement
•Regions of anomalous low dielectric (low compaction) can be
compared with construction practices at that location
•Overall variability

Infield Data Analysis (cont.)
Example of Infield Data Analysis: Joint anomaly worthy of investigation

Core Data Collection
• Cores are necessary for creation
of the dielectric - % air void
calibration curve.
• Unique dielectric -% airvoid
curves need for unique sections.
• Consult with contractors to
determine “unique sections”
• A minimum of 10 recommended
• Location of high and values can
be found in “File Playback” ->
‘Core Locations”.
• Current stationing – core location =
distance to core
• 1160+00 – 1155+99.02 = 400.98 ft
Core Data Collection (cont.)
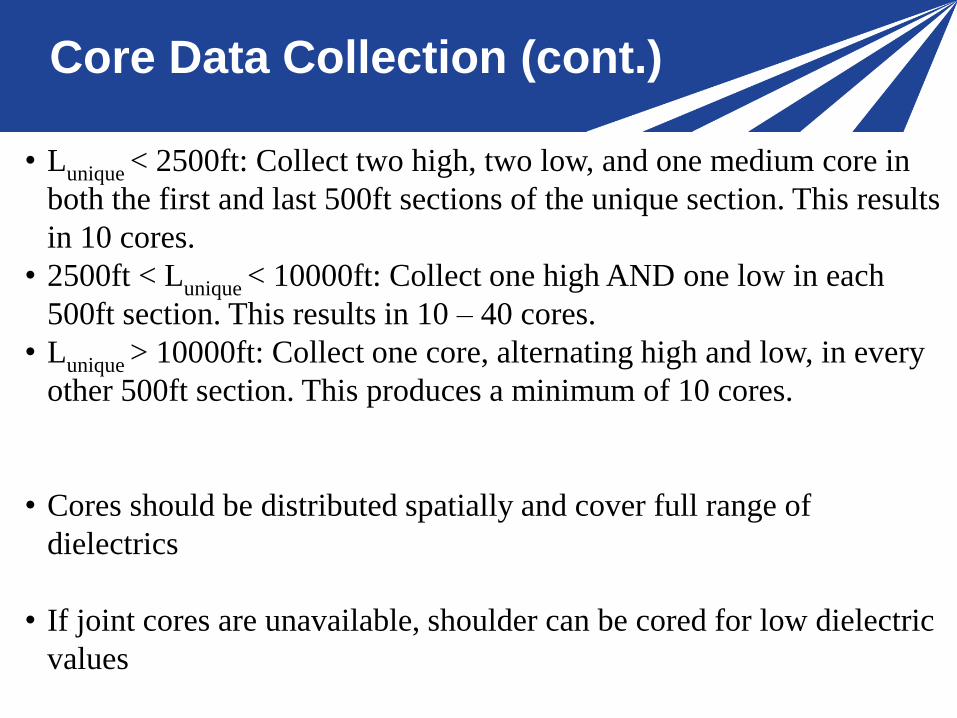
• Lunique < 2500ft: Collect two high, two low, and one medium core in
both the first and last 500ft sections of the unique section. This results
in 10 cores.
• 2500ft < Lunique < 10000ft: Collect one high AND one low in each
500ft section. This results in 10 – 40 cores.
• Lunique > 10000ft: Collect one core, alternating high and low, in every
other 500ft section. This produces a minimum of 10 cores.
• Cores should be distributed spatially and cover full range of
dielectrics
• If joint cores are unavailable, shoulder can be cored for low dielectric
values

%Airvoids vs Dielectric
Calibration
• Filter cores with QA/QC
• If “Core Survey” was collected,
average data within +/- 0.25ft of
core
• Fit exponential curve to %airvoids
vs dielectric in Excel or RDM
software (recommended)
• Go into main menu ->Collect-
Existing Project->Core Calibration -
> Calc from Cores and enter airvoid
and dielectric data
• Select ‘save’
• Dielectrics can now be viewed as air
void
y = aebx

Air Void Maps
• Once calibration coefficients are entered air void map can be plotted
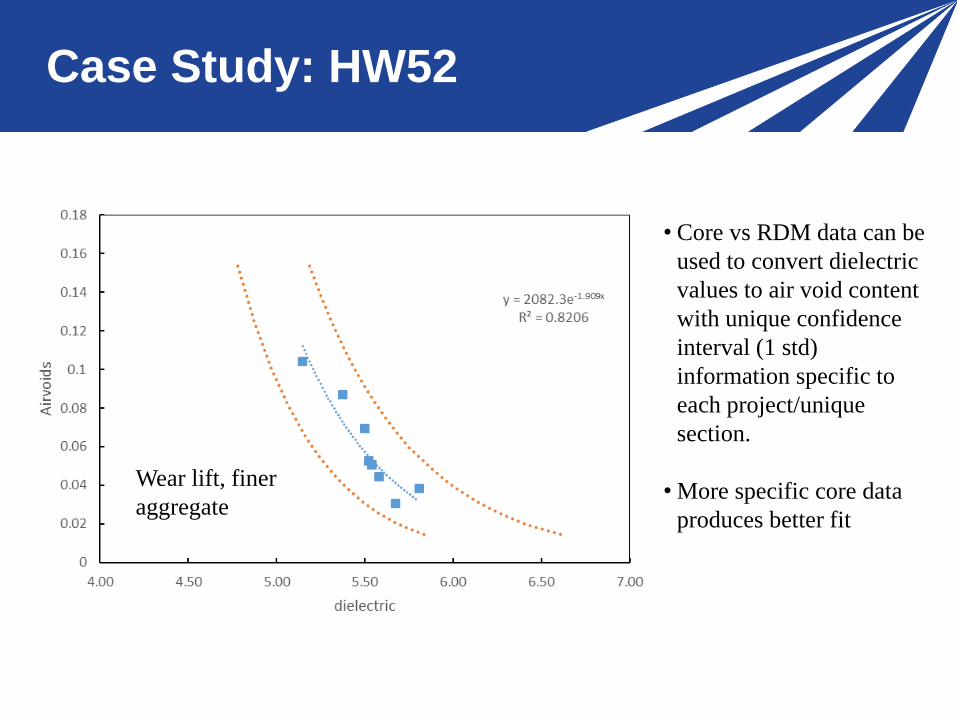
Case Study: HW52
• Core vs RDM data can be
used to convert dielectric
values to air void content
with unique confidence
interval (1 std)
information specific to
each project/unique
section.
• More specific core data
produces better fit
Wear lift, finer
aggregate
Case Study (cont.)
109000.0 110000.0 111000.0 112000.0 113000.0 114000.0 115000.00
1
2
3
4
5
6
7
8
9
10
Air
Voi
d P
erce
ntag
e [%
]
Stationing [ft]
| = Mean
O = UB
First Region (Red)
-8ft to -4ft
Median 6.4900
Mean 6.4376
Wear
Second Region (Blue)
4ft to 8ft
Median 6.3556
Mean 5.0546
Wear
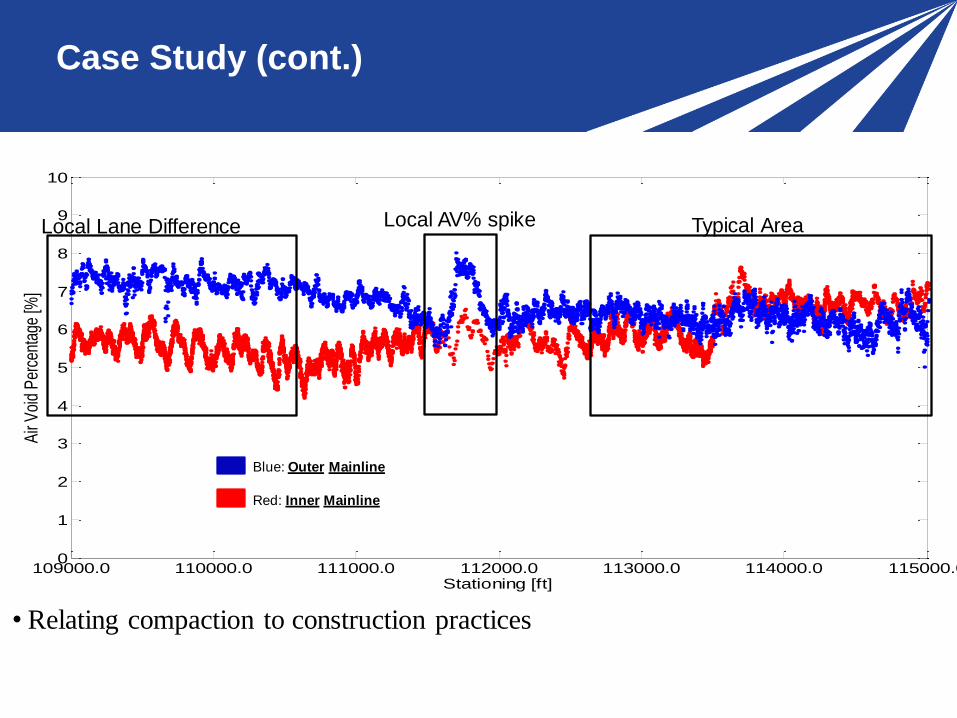
Blue: Outer Mainline
Red: Inner Mainline
Local Lane Difference Typical AreaLocal AV% spike
• Relating compaction to construction practices

111000.0 111,200 111,400 111,600 111,800 112,000 112,200 112,400 112,600 112,800 113,0000
1
2
3
4
5
6
7
8
9
10
Air
Voi
d P
erce
ntag
e [%
]
Stationing [ft]
| = Mean
O = UB
First Region (Red)
-8ft to -4ft
Median 6.4900
Mean 6.4376
Wear
Second Region (Blue)
4ft to 8ft
Median 6.3556
Mean 5.0546
Wear
Inner Lane: 0.3% Reduced Binder Content
Blue: Outer Mainline
Red: Inner MainlineOuter Lane: New Paving Date Start
• Construction records suggest reduced binder content or transition to new paving day
may have resulted in decreased compaction
Case Study (cont.)

Surface view of dielectric map with associated
air void changes due to construction
Case Study (cont.)
Dielectric

Key Lessons Learned
•RDM survey allows real time feedback which can influence paving
decisions
•RDM survey must be adapted to project characteristics
•Data file organization is crucial
•Air void calibration with associated confidence intervals can be
used to evaluate the compaction efforts at a greater coverage than is
achievable using cores alone
• Identification of low and high air void content areas can be
compared with construction practices to determine the most critical
factors in achieving improved density
Opportunities to Enhance QC
on Asphalt Pavements
• Use RDM for continuous profiling of critical
locations such as longitudinal joint evaluation
• Evaluate density based on GPR mapping, not
just on limited core samples
• Provide feedback during paving operation to
optimize performance
• Evaluate new innovative construction methods
– e.g., Use map or profile to show actual benefit
of the method to determine if/when it should
be applied12