Embed Size (px)
Citation preview

Journal of Pharmaceutical and Biomedical Analysis 38 (2005) 210–215
Nondestructive determination of the ambroxol content intablets by Raman spectroscopy
Min-Sik Hwanga, Soohwa Choa, Hoeil Chunga, ∗, Young-Ah Woob
a Department of Chemistry, College of Natural Sciences, Hanyang University,Haengdang-Dong, Seongdong-Gu, Seoul 133-791, South Korea
b College of Pharmacy, Dongduk Women’s University, Seoul 136-814, South Korea
Received 2 November 2004; received in revised form 22 December 2004; accepted 24 December 2004Available online 12 February 2005
Abstract
We describe a method for determining the ambroxol content in tablets nondestructively. To obtain a reliable quantitative calibration, weprepared 20 pellet samples (ambroxol content: 8.30–16.25 wt.%) and acquired their Raman spectra while rotating the pellets. The spectra ofthe rotated samples reflected the compositional variations better than those that were recorded without rotation. To reduce both the baselinev e used then ation. Thea nged werep ly changed.A the similars dard tabletso f tablets area©
K
1
twatcrmsil
ative
inbletstion
non-d for
ethodman) re-onspec-of
ectraepre-ion-
0d
ariations and the spectral noise simultaneously, the spectra were pre-processed using wavelet transformation (WT). Then, wormalization method before partial least-squares (PLS) regression to correct Raman intensity variation from laser power fluctuchieved standard error of cross validation (SECV) was 0.30%. Two different datasets where Raman intensity was artificially charepared and the corresponding spectra were quantitatively analyzed. The result was reproducible even if laser intensity was fairdditionally, two different commercial tablets were analyzed and the accuracy of measurement was better for a tablet that hadpectral features of the standard pellet samples. The proposed method can be utilized for the analysis of commercial tablets if stanf various ambroxol concentrations that have the same chemical components including additives and the same physical shape ovailable.2005 Elsevier B.V. All rights reserved.
eywords:Ambroxol; Raman spectroscopy; Partial least-squares; Wavelet transformation
. Introduction
Ambroxol [1] is one of the most popular medicines usedo relieve the symptoms of coughs, asthma, and colds. Theeight of a normal tablet is ca. 240 mg, comprising mostlymbroxol and lactose as the excipient (support); the concen-
ration of ambroxol is 12.5wt.%. To determine the ambroxoloncentration in tablets, high-performance liquid chromatog-aphy (HPLC) and ultraviolet (UV) spectroscopy are usedost frequently[2–5], but these approaches are destructive,
low, and require the use of chemical reagents. Additionally,t is hard to utilize these methods practically for the fast on-ine analyses required for continuous quality assurance of
∗ Corresponding author. Tel.: +82 2 2290 0937; fax: +82 2 2299 0762.E-mail address:[email protected] (H. Chung).
tablets and therefore, there is a strong demand for alternanalytical methods to replace them.
Raman spectroscopy[6–8] has strong potential for usethe fast, nondestructive, on-line analysis of ambroxol tabecause it provides rich chemical and structural informawithout destruction of the samples. Recently, diversecontact Raman optical fiber probes have been developenondestructive analysis. In this paper, we describe a mfor determining the ambroxol content of tablets using Raspectroscopy with the aid of partial least-squares (PLSgression[9,10]. We prepared 20 pellets with concentratiranging from 8.30 to 16.25% and collected their Raman stra in two different ways, i.e., with and without rotationthe sample during spectral collection. The Raman spobtained upon rotating a sample during measurement rsented the concentration variation more correctly. Additally, we employed wavelet transformation (WT)[11–13] to
731-7085/$ – see front matter © 2005 Elsevier B.V. All rights reserved.oi:10.1016/j.jpba.2004.12.031

M.-S. Hwang et al. / Journal of Pharmaceutical and Biomedical Analysis 38 (2005) 210–215 211
reduce the baseline variation selectively and the spectral noisesuperimposed on the raw Raman spectra. The variation of Ra-man intensity was corrected by using a normalization methodthat each spectrum is divided by area of spectral range used.The achieved standard error of cross validation (SECV) was0.30% using PLS regression.
To evaluate the analytical performance in a situation oflaser intensity variation, two different Raman sets, wherelaser power was artificially changed, were prepared sepa-rately to simulate routine analysis. The resulting standarderror of predictions (SEP) from both sets was 0.36% ap-proximately. Even though the resulting SEPs were slightlyincreased, we have achieved reproducible quantitative ana-lytical performance by normalizing Raman intensity varia-tion.
We have also studied actual applicability of the proposedmethod to commercial tablets. For this purpose, two differentkinds of commercial tablets were analyzed and the accuracyof measurement was better for the tablet that had the similarspectral features of the standard pellet samples. The spectralfeatures of commercial tablets were slightly different owingto the presence of additives such as binder, disintegrationagent, and tablet lubricant. If we can prepare the standardtablets of various ambroxol concentrations that have the samechemical components including additives and the same phys-ical shape, the proposed Raman spectroscopy combined withn l ford ticalr
2
2
ge:8 iatea asedf ans-f ssedu finalp eachp
2
amans CCDd Ar-b d toc c-t th ane elletsw m-p nute(
Partial least-squares regression and wavelet transforma-tion were accomplished using Matlab Version 6.5 (The Math-Works Inc., MA, USA).
3. Results and discussion
3.1. Raman spectral features
Fig. 1presents the Raman spectra of ambroxol and lactose,together with their molecular structures. The benzene ring inambroxol causes the isolated and unique bands, centered inthe 1670–1550 cm−1 range, and the intense aromatic featureat 1002 cm−1 (ring breathing mode). Since the spectral fea-tures of these compounds are clearly different, we expectedthat we would have no significant difficulty in quantifyingambroxol as long as we could collect reproducible Ramanspectra. Therefore, we focused more of our efforts on findinga method of collecting Raman spectra that allows accuratequantitative representations to be made. This analysis canbe accomplished by using an appropriate spectral collectionconfiguration and spectral processing algorithms.
Fig. 2 displays a visual microscopic image(160�m× 130�m) of an ambroxol pellet’s surface.We examined the surface to find out whether or not thecollected Raman spectra were representative of the samplec all( thes e is ap onrp eouso ares reas( aido layediw eaks.S rentf nces
ormalization, baseline correction, and WT will be usefuetermining the ambroxol content non-invasively in pracoutine analysis.
. Experimental
.1. Sample preparation
Twenty different sample pellets (concentration ran.30–16.25 wt.%) were prepared by mixing approprmounts of ambroxol and lactose, which were purch
rom Sigma–Aldrich. The mixed powder samples were trerred into a vial and mixed thoroughly and then were presing a conventional infrared (IR) presser to produceellet samples. The diameter, thickness, and weight ofellet were 13 mm, 0.6 mm, and 240 mg, respectively.
.2. Raman spectral collection and data processing
Raman spectra were collected using a dispersive Rpectrometer equipped with a diode laser (785 nm), aetector, and a holographic grating (Kaiser Optical, Annor, MI, USA). A non-contact optical fiber probe was useollect the spectra at a 4 cm−1 resolution. Each Raman sperum corresponded to an accumulation of 64 scans wixposure time of 2 s for each scan. The spectra of the pere collected both with and without rotation of the sale. The rate of pellet rotation was 60 revolutions per mirpm).
omposition; the size of the laser illumination spot is sm1–5�m) relative to the sample size and therefore, ifample were inhomogeneous on the micron scale, therossibility of acquiring only localized chemical informatiather than averaged chemical features. The picture inFig. 2resents a case in which the sample is inhomogenn the micron scale: the light- and dark-gray areaspread irregularly. The Raman spectra of four random adesignated A–D) were collected selectively with thef a microscope; the corresponding spectra are disp
n Fig. 2. Initially, we examined the range 950–650 cm−1
here both ambroxol and lactose have strong Raman ppectra A and D are similar to one another, but are diffe
rom spectra B and C; that is to say, although the dista
Fig. 1. Raman spectra of ambroxol and lactose.
212 M.-S. Hwang et al. / Journal of Pharmaceutical and Biomedical Analysis 38 (2005) 210–215
Fig. 2. Visual microscopic image of an ambroxol pellet’s surface (top),Raman spectra of four different spots in the 950–650 cm−1 (middle) and1700–1500 cm−1 (bottom).
between these four spots are very close, the resulting Ramanspectra are clearly different. In addition, we examined thespectral range 1700–1500 cm−1 in which the unique peaksarising from the benzene ring of ambroxol appears. Again,the peak intensities at each spot obviously change as aresult of variations in the local ambroxol content. Theseobservations imply that a Raman spectrum obtained froma particular sample area, equivalent in size to the area ofthe laser spot, do not necessarily represent the total samplecomposition and, therefore, to achieve reliable quantitativecalibration models we must average Raman spectra collectedover a larger sample area.
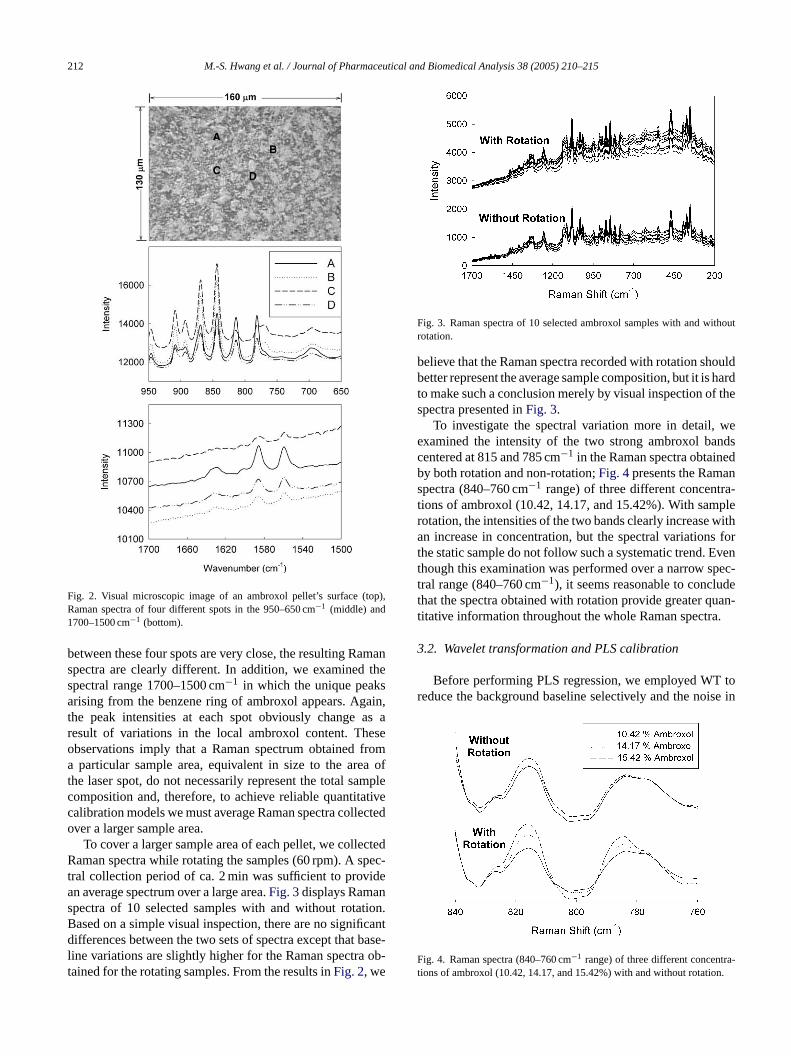
To cover a larger sample area of each pellet, we collectedRaman spectra while rotating the samples (60 rpm). A spec-tral collection period of ca. 2 min was sufficient to providean average spectrum over a large area.Fig. 3displays Ramanspectra of 10 selected samples with and without rotation.Based on a simple visual inspection, there are no significantdifferences between the two sets of spectra except that baseline variations are slightly higher for the Raman spectra ob-tained for the rotating samples. From the results inFig. 2, we
Fig. 3. Raman spectra of 10 selected ambroxol samples with and withoutrotation.
believe that the Raman spectra recorded with rotation shouldbetter represent the average sample composition, but it is hardto make such a conclusion merely by visual inspection of thespectra presented inFig. 3.
To investigate the spectral variation more in detail, weexamined the intensity of the two strong ambroxol bandscentered at 815 and 785 cm−1 in the Raman spectra obtainedby both rotation and non-rotation;Fig. 4presents the Ramanspectra (840–760 cm−1 range) of three different concentra-tions of ambroxol (10.42, 14.17, and 15.42%). With samplerotation, the intensities of the two bands clearly increase withan increase in concentration, but the spectral variations forthe static sample do not follow such a systematic trend. Eventhough this examination was performed over a narrow spec-tral range (840–760 cm−1), it seems reasonable to concludethat the spectra obtained with rotation provide greater quan-titative information throughout the whole Raman spectra.
3.2. Wavelet transformation and PLS calibration
Before performing PLS regression, we employed WT toreduce the background baseline selectively and the noise in
F ra-t n.
-
ig. 4. Raman spectra (840–760 cm−1 range) of three different concentions of ambroxol (10.42, 14.17, and 15.42%) with and without rotatio

M.-S. Hwang et al. / Journal of Pharmaceutical and Biomedical Analysis 38 (2005) 210–215 213
the raw spectra displayed inFig. 3. WT decomposes an orig-inal spectrum using a wavelet, i.e., the projection onto awavelet basis function. Wavelet coefficients of the decom-posed spectrum can be manipulated for various purposes,such as de-noising or signal compression. Generally, the pro-cedure involves removing the specific wavelet coefficientsassociated with baseline variation or noise, and then inverselytransforming back to the original domain. In this study, weemployed the discrete wavelet transformation (DWT) usingDaubechies wavelet (order: 8, level: 8). The details of theDWT process have been described in several articles[11–13].As a result of DWT, we obtained two sets of wavelet coef-ficients, the detail (dn) and approximation coefficients (an),where the superscriptn reflects the level of resolution. Thedetail and approximation coefficients, which can be viewedas the result of high- and low-pass filtering, usually are re-garded as noise and broad baseline variations, respectively.
Fig. 5 displays the raw and wavelet-transformed spectra;the 1700–1500 cm−1 range is magnified and presented in thesame plot. The transformed spectrum was obtained by re-moving three levels of detail (d1, d2, d3) and one level ofapproximation (a1) coefficients that we presumed to be thespectral noise and baseline, respectively. As presented in themagnified view, the baseline variation and spectral noise aredecreased effectively without distortion of the spectral fea-tures.
um-b lyingt thel um-b d anob weres linec selinev dy,wW
F mple.T
One of the most important steps for reliable quantita-tive calibration using Raman spectroscopy is the acquisi-tion of reproducible spectra, since its intensity varies withlaser intensity fluctuation that is always occurring in an ac-tual measurement. The Raman intensity can be corrected us-ing an internal reference that has separate Raman bands tokeep track of intensity variation. This is a reliable method;however, it cannot be adopted for this study, since quan-titative inclusion of an internal standard into a tablet isunrealistic. The other approach is to treat mathematicallyspectra for obtaining correct spectral variation. The reason-able approach is the normalization of spectrum by divid-ing the area under specific Raman peaks. The tablet is abinary mixture, so the area of spectral region containingboth ambroxol and lactose information will be nearly con-stant if Raman scattering coefficients of both componentsare not significantly different from each other as shown inFig. 1. Therefore, the normalization of acquired spectra willhelp to produce reproducible spectra for quantitative anal-ysis. For PLS regression, we used the normalized spectra(1170–750 cm−1 range) followed by baseline correction andWT.
For the sake of comparison, we performed PLS usingthe Raman spectra obtained both with and without rota-tion. We evaluated simultaneously both the raw and wavelet-transformed spectra for each case. All the spectra were nor-m aria-t
aluet Thec a seti asingS CVd grad-u lueo typi-c re thei bero
then PLSf ringR sitionc ithc s ad-d bys varia-t llec-t
TO
n
WW
It is known generally that the spectral range and the ner of PLS factors are important parameters when app
he PLS algorithm[14,15]. The spectral range determinesocation of the necessary spectral information, and the ner of PLS factors should be selected optimally to avoiverfitting. In this study, we used the 1170–750 cm−1 rangeecause both Raman peaks of ambroxol and lactosetrongest in this range. Additionally, the underlying baseould be regarded as linear, so it was easy to correct baariations by using simple two-point correction. In this stue corrected baselines and zeroed at 1170 and 750 cm−1 afterT.
ig. 5. Raw (a) and wavelet-transformed spectra (b) of the ambroxol sahe range 1700–1500 cm−1 is magnified for the better examination.
alized to compensate for the slight Raman intensity vions from sample to sample, as discussed.
We identified the optimum number of factors as the vhat gave a minimum standard error of cross validation.ross validation method was applied by dividing the datnto five segments and examined the pattern of decreECV as a function of the number of PLS factors. The SEecreased sharply for the first factor and then decreasedally for the following factors. At a certain factor, the vaf the SECV began to increase. These trends are fairlyal in factor-based analyses. We chose the factor befoncrease in the value of the SECV to be the optimum numf factors.
Table 1 summarizes the overall calibration results;umbers in parentheses correspond to the number of
actors used. It is clear that rotation of the sample duaman collection helps to represent the sample compoorrectly and leads to much lower calibration errors. Worrect sample representation, the subsequent WT helpitionally to improve the calibration performance furtherelectively decreasing the spectral noise and baselineion. The best SECV we obtained was 0.30% for data coion with sample rotation.
able 1verall PLS calibration results (unit: wt.%)
Raw Wavelet transformatio
ithout rotation 1.24 (2) 1.04 (2)ith rotation 0.46 (3) 0.30 (3)
214 M.-S. Hwang et al. / Journal of Pharmaceutical and Biomedical Analysis 38 (2005) 210–215
3.3. Raman reproducibility under laser intensityvariation
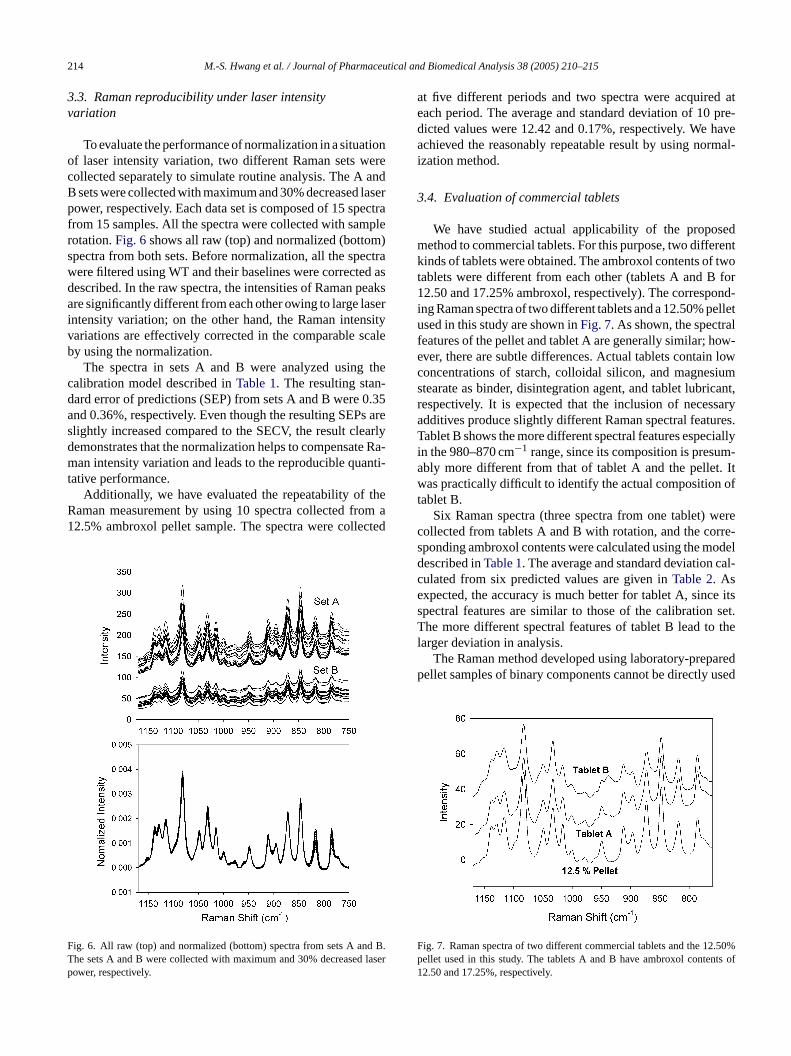
To evaluate the performance of normalization in a situationof laser intensity variation, two different Raman sets werecollected separately to simulate routine analysis. The A andB sets were collected with maximum and 30% decreased laserpower, respectively. Each data set is composed of 15 spectrafrom 15 samples. All the spectra were collected with samplerotation.Fig. 6shows all raw (top) and normalized (bottom)spectra from both sets. Before normalization, all the spectrawere filtered using WT and their baselines were corrected asdescribed. In the raw spectra, the intensities of Raman peaksare significantly different from each other owing to large laserintensity variation; on the other hand, the Raman intensityvariations are effectively corrected in the comparable scaleby using the normalization.
The spectra in sets A and B were analyzed using thecalibration model described inTable 1. The resulting stan-dard error of predictions (SEP) from sets A and B were 0.35and 0.36%, respectively. Even though the resulting SEPs areslightly increased compared to the SECV, the result clearlydemonstrates that the normalization helps to compensate Ra-man intensity variation and leads to the reproducible quanti-tative performance.
Additionally, we have evaluated the repeatability of theR om a1 cted
F d B.Tp
at five different periods and two spectra were acquired ateach period. The average and standard deviation of 10 pre-dicted values were 12.42 and 0.17%, respectively. We haveachieved the reasonably repeatable result by using normal-ization method.
3.4. Evaluation of commercial tablets
We have studied actual applicability of the proposedmethod to commercial tablets. For this purpose, two differentkinds of tablets were obtained. The ambroxol contents of twotablets were different from each other (tablets A and B for12.50 and 17.25% ambroxol, respectively). The correspond-ing Raman spectra of two different tablets and a 12.50% pelletused in this study are shown inFig. 7. As shown, the spectralfeatures of the pellet and tablet A are generally similar; how-ever, there are subtle differences. Actual tablets contain lowconcentrations of starch, colloidal silicon, and magnesiumstearate as binder, disintegration agent, and tablet lubricant,respectively. It is expected that the inclusion of necessaryadditives produce slightly different Raman spectral features.Tablet B shows the more different spectral features especiallyin the 980–870 cm−1 range, since its composition is presum-ably more different from that of tablet A and the pellet. Itwas practically difficult to identify the actual composition oft
werec rre-s odeld cal-ce e itss set.T thel
aredp used
F .50%
aman measurement by using 10 spectra collected fr2.5% ambroxol pellet sample. The spectra were colle
ig. 6. All raw (top) and normalized (bottom) spectra from sets A an
he sets A and B were collected with maximum and 30% decreased laserower, respectively.p nts of1
ablet B.Six Raman spectra (three spectra from one tablet)
ollected from tablets A and B with rotation, and the coponding ambroxol contents were calculated using the mescribed inTable 1. The average and standard deviationulated from six predicted values are given inTable 2. Asxpected, the accuracy is much better for tablet A, sincpectral features are similar to those of the calibrationhe more different spectral features of tablet B lead to
arger deviation in analysis.The Raman method developed using laboratory-prep
ellet samples of binary components cannot be directly
ig. 7. Raman spectra of two different commercial tablets and the 12ellet used in this study. The tablets A and B have ambroxol conte2.50 and 17.25%, respectively.

M.-S. Hwang et al. / Journal of Pharmaceutical and Biomedical Analysis 38 (2005) 210–215 215
Table 2The analyzed results using two different commercial tablets
Tablet A Tablet B
Ambroxol content (%) 12.50 17.25Average 12.82 13.89S.D. 0.11 0.15
for some commercial tablets, since the pellet samples usedin this research do not have the same chemical composi-tion, physical shape, and packing density as commercialtablets. If we can prepare the standard tablets of various am-broxol concentrations that have the same chemical compo-sition including additives and the same physical shape oftablets, the proposed Raman spectroscopy combined withnormalization, baseline correction and WT will be useful forthe non-invasive determination of ambroxol in commercialtablets.
Acknowledgement
This work is supported by the Korea Science and Engi-neering Foundation (Grant No. R-14-2002-004-01000-0).
References
[1] E. Schraven, F.W. Koss, J. Keck, G. Beisenherz, Eur. J. Pharmacol.1 (1967) 445–451.
[2] Z. Dincer, H. Basan, N.G. G̈oger, J. Pharm. Biomed. Anal. 31 (2003)867–872.
[3] G. Indrayanta, R. Handayani, J. Pharm. Biomed. Anal. 11 (1993)781–784.
[4] J. Schmid, J. Chromatogr. B 414 (1987) 65–75.[5] T. Perez-Ruiz, C. Martinez-Lozano, A. Sanz, E. Bravo, J. Chro-
matogr. B 742 (2000) 205–210.[6] S.P. Mulvaney, C.D. Keating, Anal. Chem. 72 (2000) 145R–157R.[7] T. Vankeirsblick, A. Vercauteren, W. Baeyens, G. Van der Weken,
F. Verport, G. Vergote, J.P. Remon, Trends Anal. Chem. 21 (2002)869–877.
[8] M.J. Pelletier, Appl. Spectrosc. 57 (2003) 20A–42A.[9] H. Martens, T.M. Naes, Multivariate Calibration, John Wiley and
Sons, New York, 1989.[10] K.R. Beebe, R.J. Pell, M.B. Seasholtz, Chemometrics: A Practical
Guide, Wiley-Interscience, New York, 1998.[11] B. Walczak, D.L. Massart, Chemom. Intell. Lab. Syst. 36 (1997)
81–94.[12] C.K. Chui, Introduction to Wavelets, Academic Press, Boston, 1991.[13] M. Bos, J.A.M. Vrielink, Chemom. Intell. Lab. Syst. 23 (1994)
115–122.[14] H. Chung, J.S. Lee, M.S. Ku, Appl. Spectrosc. 52 (1998) 885–889.[15] J.S. Lee, H. Chung, Vib. Spectrosc. 17 (1998) 193–201.