Embed Size (px)
Citation preview
Watanabe et al. Earth, Planets and Space (2015) 67:184 DOI 10.1186/s40623-015-0352-6
LETTER Open Access
Non-volcanic crustal movements of thenorthernmost Philippine Sea plate detectedby the GPS-acoustic seafloor positioning
Shun-ichi Watanabe*, Tadashi Ishikawa and Yusuke YokotaAbstract
Repeatedly performing the GPS-acoustic seafloor positioning, we first succeeded in detecting non-volcanic seafloormovements on the Philippine Sea plate (PHS) subducting along the Sagami Trough. At a seafloor geodetic site onthe northernmost part of the PHS off the Boso Peninsula, we detected significant eastward motion with respect tothe central part of the PHS. This is unaccountable by the coupling between the Pacific plate and the PHS along theIzu-Bonin (Ogasawara) Trench because it would cause the westward elastic deformation at BOSS. It is ratherconsistent with the rigid motion of the tectonic block in the fore-arc along the Izu-Bonin Trench, associated with theback-arc rift. The other site on the western side of the Sagami Bay had moved toward the north relative to the IzuPeninsula. It suggests that the Izu microplate obviously moves relative to the northern PHS. The difference betweenthe velocities of the Sagami Bay and the Izu Peninsula indicates the coupling on the boundary fault as well.
Keywords: GPS-acoustic, Seafloor geodetic observation, Philippine Sea plate, Sagami Trough, Izu arc, Izu microplate,Plate motion
IntroductionThe northernmost part of the Philippine Sea plate (PHS)subducts beneath the North American plate (NA) alongthe Sagami Trough. In this region, thrust earthquakessuch as the 1923 Taisho Kanto earthquake (M7.9) andthe 1703 Genroku Kanto earthquake (M7.9–8.2) had oc-curred repeatedly. Additionally, slow slip events off theBoso Peninsula with a recurrence interval of severalyears have been observed (e.g., Ozawa, 2014). In thenorthern side of the PHS, the Izu microplate (IM) isconsidered to move relative to the PHS, whose boundaryis located on the west edge of the Sagami Bay (e.g.,Sagiya, 1999). The IM subducts beneath the Eurasianplate (EU) along the Suruga Trough, where a large earth-quake had occurred in 1854 (Ando, 1975). In order toinvestigate the accumulation and/or the release of strainon the plate interface, it is necessary to estimate the pre-cise convergence rate of the subducting oceanic platerelative to the continental plates, as Yasuda et al. (2014)had directly investigated in the Suruga Trough. They
* Correspondence: [email protected] and Oceanographic Department, Japan Coast Guard, 2-5-18Aomi, Koto-ku, Tokyo 135-0064, Japan
© 2015 Watanabe et al. Open Access This articInternational License (http://creativecommons.oreproduction in any medium, provided you givthe Creative Commons license, and indicate if
indicated the strong coupling in the shallow portion of theplate boundary from the seafloor geodetic observation.On the other hand, researchers had estimated the mo-
tion of the PHS in the frame of the whole plate kinemat-ics, with geological (e.g., Seno et al. 1993) and geodeticobservations (e.g., Sella et al. 2002; DeMets et al. 2010).However, because the most part of the PHS is coveredwith ocean, the insufficiency of precise geodetic observa-tions makes it difficult to reduce the indeterminacy ofthe velocities. Especially in the portion near the bound-aries, the non-rigid deformation would affect the veloci-ties on the PHS. One of such deformation is caused byback-arc rift along the Izu-Bonin (Ogasawara) Trenchwhere the Pacific plate (PAC) subducts beneath the PHS(Taylor et al. 1991).Nishimura (2011) divided the northern PHS into sev-
eral tectonic blocks, one of which is the fore-arc alongthe Izu-Bonin Trench, to simultaneously evaluate therigid velocities of blocks and elastic deformation due tothe slip deficits on the boundary faults and the volcanicinflations using the GNSS sites. However, many geodeticsites on the PHS relatively near the Sagami Trough are
le is distributed under the terms of the Creative Commons Attribution 4.0rg/licenses/by/4.0/), which permits unrestricted use, distribution, ande appropriate credit to the original author(s) and the source, provide a link tochanges were made.

a
b
Fig. 1 GPS-acoustic observation system. a Pole system for drift observation. b Hull-mounted system for line-controlled sailing observation
Fig. 2 Locations of the seafloor geodetic sites used in this paper; BOSS is located on the seafloor between the Sagami Trough and the Izu arc.SAGA is located on the flat seafloor in the Sagami Bay, between the Sagami Trough and the Izu microplate
Watanabe et al. Earth, Planets and Space (2015) 67:184 Page 2 of 9
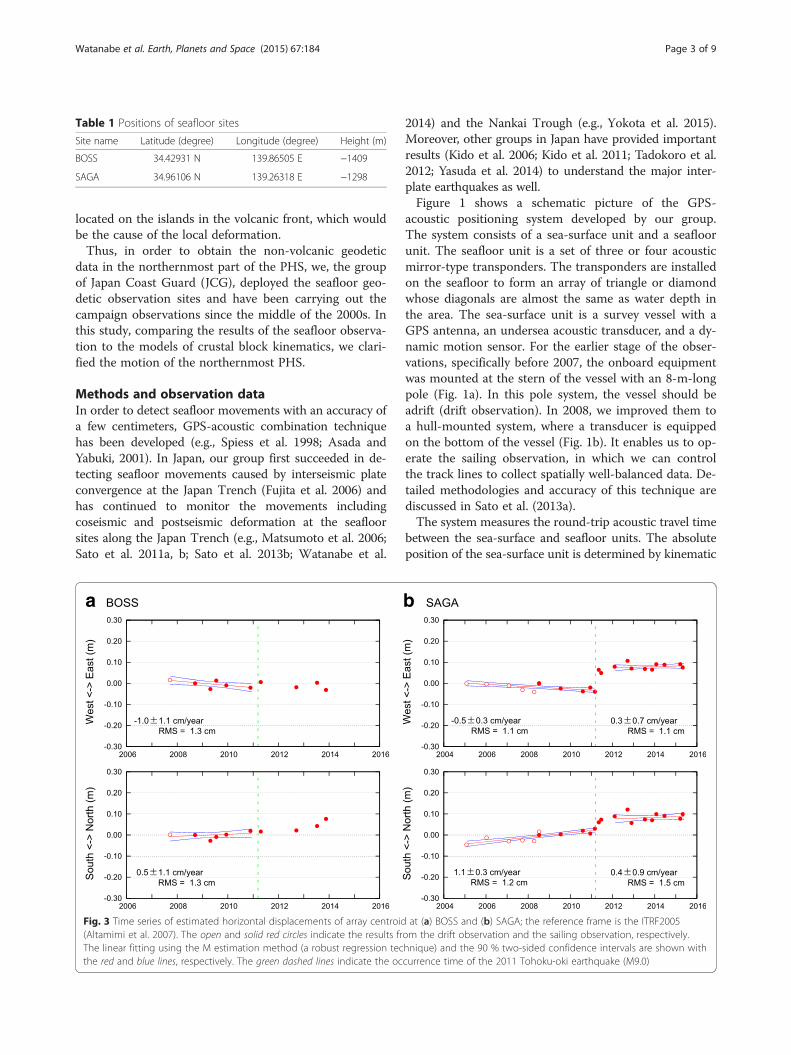
Table 1 Positions of seafloor sites
Site name Latitude (degree) Longitude (degree) Height (m)
BOSS 34.42931 N 139.86505 E −1409
SAGA 34.96106 N 139.26318 E −1298
Watanabe et al. Earth, Planets and Space (2015) 67:184 Page 3 of 9
located on the islands in the volcanic front, which wouldbe the cause of the local deformation.Thus, in order to obtain the non-volcanic geodetic
data in the northernmost part of the PHS, we, the groupof Japan Coast Guard (JCG), deployed the seafloor geo-detic observation sites and have been carrying out thecampaign observations since the middle of the 2000s. Inthis study, comparing the results of the seafloor observa-tion to the models of crustal block kinematics, we clari-fied the motion of the northernmost PHS.
Methods and observation dataIn order to detect seafloor movements with an accuracy ofa few centimeters, GPS-acoustic combination techniquehas been developed (e.g., Spiess et al. 1998; Asada andYabuki, 2001). In Japan, our group first succeeded in de-tecting seafloor movements caused by interseismic plateconvergence at the Japan Trench (Fujita et al. 2006) andhas continued to monitor the movements includingcoseismic and postseismic deformation at the seafloorsites along the Japan Trench (e.g., Matsumoto et al. 2006;Sato et al. 2011a, b; Sato et al. 2013b; Watanabe et al.
a
Fig. 3 Time series of estimated horizontal displacements of array centroid(Altamimi et al. 2007). The open and solid red circles indicate the results frThe linear fitting using the M estimation method (a robust regression tecthe red and blue lines, respectively. The green dashed lines indicate the oc
2014) and the Nankai Trough (e.g., Yokota et al. 2015).Moreover, other groups in Japan have provided importantresults (Kido et al. 2006; Kido et al. 2011; Tadokoro et al.2012; Yasuda et al. 2014) to understand the major inter-plate earthquakes as well.Figure 1 shows a schematic picture of the GPS-
acoustic positioning system developed by our group.The system consists of a sea-surface unit and a seafloorunit. The seafloor unit is a set of three or four acousticmirror-type transponders. The transponders are installedon the seafloor to form an array of triangle or diamondwhose diagonals are almost the same as water depth inthe area. The sea-surface unit is a survey vessel with aGPS antenna, an undersea acoustic transducer, and a dy-namic motion sensor. For the earlier stage of the obser-vations, specifically before 2007, the onboard equipmentwas mounted at the stern of the vessel with an 8-m-longpole (Fig. 1a). In this pole system, the vessel should beadrift (drift observation). In 2008, we improved them toa hull-mounted system, where a transducer is equippedon the bottom of the vessel (Fig. 1b). It enables us to op-erate the sailing observation, in which we can controlthe track lines to collect spatially well-balanced data. De-tailed methodologies and accuracy of this technique arediscussed in Sato et al. (2013a).The system measures the round-trip acoustic travel time
between the sea-surface and seafloor units. The absoluteposition of the sea-surface unit is determined by kinematic
b
at (a) BOSS and (b) SAGA; the reference frame is the ITRF2005om the drift observation and the sailing observation, respectively.hnique) and the 90 % two-sided confidence intervals are shown withcurrence time of the 2011 Tohoku-oki earthquake (M9.0)

Table 2 Estimated relative site positions
Epoch (year) Eastward (m) Northward (m)
(a) BOSS
2007.712a 0.0160 0.0015
2008.704 0.0000 0.0000
2009.309 −0.0272 −0.0270
2009.542 0.0131 −0.0089
2009.939 −0.0095 0.0019
2010.893 −0.0206 0.0194
2011.301 0.0059 0.0165
2012.706 −0.0184 0.0219
2013.526 0.0030 0.0426
2013.879 −0.0311 0.0763
(b) SAGA
2005.076a −0.0005 −0.0458
2006.027a −0.0039 −0.0123
2007.084a −0.0110 −0.0296
2007.731a −0.0304 −0.0252
2008.284a −0.0405 −0.0287
2008.517 0.0000 0.0000
2008.520a −0.0006 0.0160
2009.539 −0.0243 0.0037
2010.589 −0.0381 0.0203
2010.942 −0.0200 0.0069
2011.164 −0.0396 0.0301
2011.347 0.0639 0.0602
2011.463 0.0491 0.0731
2012.101 0.0793 0.0887
2012.712 0.1067 0.1207
2012.901 0.0704 0.0572
2013.534 0.0684 0.0740
2013.876 0.0650 0.0702
2014.073 0.0907 0.0991
2014.463 0.0881 0.0907
2015.208 0.0911 0.0773
2015.326 0.0752 0.0991
Reference frame is the ITRF2005 (Altamimi et al. 2007). Reference position isthe first sailing observation epochaEpoch with drift observation
Watanabe et al. Earth, Planets and Space (2015) 67:184 Page 4 of 9
GPS. During the thousands shots of the acoustic ranging,the sound speed profile measurements are performedevery several hours to calculate the distances between theunits from the travel time.We estimated positions of seafloor transponders based
on the least squares formulation, simultaneously esti-mating the time variation of the sound speed (Fujitaet al. 2006). In this method, we assume the horizontallylayered structure for the sound speed profile. The positionof the observation site is defined as the centroid of thetransponder positions. In the analysis, we constrained therelative positions of the transponders to be those esti-mated from the data of all the sailing observation epochsin order to reduce estimation parameters in the leastsquares formulation (Matsumoto et al. 2008). The samestrategy of analysis was also used in Watanabe et al.(2014) and Yokota et al. (2015).Figure 2 and Table 1 show two observation sites used
in this study. BOSS is located 50 km southern off CapeNojima-saki, while SAGA is located in the Sagami Bay,10 km eastern off Cape Kawana-saki. Both sites hadbeen installed on the flat seafloor of the PHS alongthe Sagami Trough, distant from the active volcanoes(Izumi et al. 2013). We have performed 10 and 22 cam-paign observations at BOSS and SAGA during the periodsfrom September 2007 to November 2013 and fromJanuary 2005 to April 2015, respectively.
ResultsFigure 3 plots the estimated coordinates of the observa-tion sites represented in the International TerrestrialReference Frame 2005 (ITRF2005; Altamimi et al. 2007)by setting those of the first sailing observation epoch ateach site as a reference. The relative positions of eachepoch are shown in Table 2.Linear fittings to each component of the displacement
using the M estimation method (a robust regressiontechnique) are also shown in Fig. 3, with the blue hyper-bolic lines indicating the 90 % two-sided confidenceintervals. Before the Tohoku-oki earthquake (M9.0),we obtained the velocity of 1.0 ± 1.1 cm/year westwardand 0.5 ± 1.1 cm/year northward and the velocity of0.5 ± 0.3 cm/year westward and 1.1 ± 0.3 cm/yearnorthward in the ITRF2005 with the 90 % confidenceat BOSS and SAGA, respectively. The linear fitting forBOSS after the Tohoku-oki earthquake is unavailabledue to the uncertainty of estimation from only fourepochs of observation. Meanwhile, at SAGA, apparentlyconstant displacement rate of 0.3 ± 0.7 cm/year eastwardand 0.4 ± 0.9 cm/year northward in the ITRF2005 was ob-tained after 2012. Moreover, from the discontinuous stepof positions between just before and after the Tohoku-okiearthquake, eastward coseismic displacement of about10 cm was detected at SAGA.
Figure 4 and Table 3 show the velocities before theTohoku-oki earthquake, adjusted to values relative tothe stable part of the EU, on the basis of the angularvelocity presented by Altamimi et al. (2007). The el-lipses in Fig. 4 indicate the 90 % confidence level.The velocities at the terrestrial sites deployed by theGeospatial Information Authority of Japan are alsoshown in Fig. 4, which were derived from the dailycoordinates of the GNSS Earth Observation Network

Fig. 4 Horizontal velocities relative to the Eurasian plate before the Tohoku-oki earthquake in the Kanto district; the red arrows and the brown arrowsindicate the velocities at the seafloor sites detected in this paper and by Yokota et al. (2015), respectively, with 90 % CL (ellipses). The terrestrial velocitiesare estimated using the GEONET sites for the period from January 2008 to July 2009 (blue arrows). The black dotted lines indicate the boundaries of theblock, though some boundaries are uncertain (e.g., the PHS-IM and the PHS-IA boundaries). The green regions (a) and (b) indicate the areas for the crosssection shown in Fig. 5
Watanabe et al. Earth, Planets and Space (2015) 67:184 Page 5 of 9
System (GEONET) F3 solution from January 2008 toJuly 2009 (Nakagawa et al. 2009). The consistency ofseafloor results with the regional velocity field of theGEONET in Fig. 4 supports for the validation of ourseafloor results.The reason why the confidence interval of the rate
at SAGA is smaller than that at BOSS is due to notonly the number of the observation epochs but alsothe oceanographic condition. The condition was usuallybetter in the Sagami Bay than off the Boso Peninsulawhere the Kuroshio Current would affect the soundspeed.
Table 3 Velocities with respect to the Eurasian plate with compone
Site name Epochs Velocity (cm/year)
E-ward N-
BOSS Sep 2007–Nov 2010 −3.5 ± 1.1 1.8
SAGA Jan 2005–Mar 2011 −3.1 ± 0.3 2.4
Feb 2012–Apr 2015 −2.2 ± 0.7 1.7
DiscussionFirst, we compared the result at BOSS before the Tohoku-oki earthquake with the plate kinematics models. BecauseBOSS is located in the trench side of the volcanic frontand away from block boundaries, slip deficits on the plateboundaries cause no significant deformation at BOSS ex-cept on the PAC-PHS boundary. In fact, a southward dis-placement of up to 0.1 cm/year is expected at BOSS fromthe slip deficit on the PHS-NA boundary faults listed inNishimura (2011), whereas the PAC-PHS boundary haspossibility to cause a westward displacement of approxi-mately 1–2 cm/year. However, the geodetic observations
nt variances and covariances
Variance and covariance (cm2/year2)
ward Var(E) Var(N) Cov (E, N)
± 1.1 1.11 1.26 0.06
± 0.3 0.10 0.10 0.01
± 0.9 0.44 0.85 0.10

Watanabe et al. Earth, Planets and Space (2015) 67:184 Page 6 of 9
on the islands have little resolution in the slip deficit onthe PAC-PHS boundary. We therefore made the assump-tion that the deficit rate is zero tentatively.The Euler vector of the rigid PHS had been evaluated
in several models. Estimated values of velocity at BOSSare shown in Table 4. Seno et al. (1993) determined thevelocities of the PHS using the earthquake slip vectorsincluding northern boundaries of the PHS. It led to theNUVEL-1A model (DeMets et al. 1994), in which thePHS is expected to move at a rate of 0.7 cm/yearwestward and 0.7 cm/year northward relative to theITRF at BOSS. On the contrary, the MORVEL modeland the REVEL model were proposed from geodetic databy DeMets et al. (2010) and Sella et al. (2002), respect-ively. According to these models, BOSS moves relativeto the ITRF at a rate of 2.4 cm/year westward and1.3 cm/year northward and a rate of 2.2 cm/year west-ward and 1.3 cm/year northward, respectively. The re-siduals of the observed velocity to the models arestatistically significant. The eastward component of theresiduals is unaccountable even if the PAC-PHS inter-face is assumed to be locked. That is because the slipdeficit on the PAC-PHS interface would cause the west-ward deformation at BOSS, as Sella et al. (2002) hadalready pointed out at the islands in the Izu-Bonin arc.They thus considered the residuals as non-rigid platedeformation such as spreading of the back-arc basin.Whereas these models had estimated the motion of the
PHS from geodetic data at only several sites far from itsboundaries, Nishimura (2011) used additional sites nearthe boundaries to estimate rigid velocities and elastic de-formation of the tectonic blocks simultaneously. In thisblock kinematics model, back-arc rift along the Izu-BoninTrench was taken account as well. The fore-arc along theIzu-Bonin Trench is considered as a rigid block separatedfrom the PHS, called Izu arc block (IA). At BOSS, the IAis calculated to move at a rate of 1.3 cm/year westwardand 1.4 cm/year northward relative to the ITRF.Although our result is quantitatively consistent with
the velocities derived from both the NUVEL-1A andNishimura’s model, the difference between these modelsis emphasized in the easternmost part of the NankaiTrough. In this region, the strong coupling on the plate
Table 4 Comparison of observed velocities at BOSS with modelvelocities relative to the ITRF2005
Observation/model Velocity at BOSS (cm/year)
E-ward N-ward
Observation (this study) −1.0 ± 1.1 0.5 ± 1.1
PHS in NUVEL-1A −0.7 0.7
PHS in MORVEL −2.4 1.3
PHS in REVEL −2.2 1.3
IA in Nishimura (2011) −1.3 1.4
boundary was indicated by Yokota et al. (2015) from theobserved displacement rates at the seafloor sites TOK1and TOK2. According to them, the velocity obtained atTOK2 was significantly larger than the velocity of thePHS in the NUVEL-1A model. Thus, they pointed outthat the motion of the IM should be considered. On thebasis of Nishimura’s model, the velocity at TOK2 is al-most as large as that of both the PHS and the IM, des-pite the uncertainty about the location of the PHS-IMboundary. It supports the Nishimura’s model, thoughmore direct evidences by seafloor observation in thesouthwestern part of the IM are needed to clarify thetectonics of the subducting IM.On the other hand, SAGA is located near two block
boundaries. One is the Sagami Trough and the otherdivides the IM from the IA in the west side of the SagamiBay. Figure 5 plots the cross section of the observed dis-placement rates relative to the EU. Along the SagamiTrough, the IA subducts northward (Fig. 5a), almost per-pendicular to the trough (No et al. 2014). In the westernboundary between the Sagami Bay (on the IA) and the IzuPeninsula (on the IM), the left lateral strike slip fault isindicated (Fig. 5b), as the 1980 Izu-Hanto-Toho-oki earth-quake (M6.7) had occurred on a portion of the boundary(e.g., Takeo, 1988; Nishimura et al. 2007).In order to estimate the slip deficit rate on the IM-IA
boundary fault, we calculated the northward component ofthe surface deformation in an elastic half-space by themethod of Okada (1992), applying back slip model (Savage,1983). The geometry and location of the faults are thesame as the IM-IA boundary faults indicated in Table 2of Nishimura (2011), but depth is set to 0 km. The fourgreen lines in Fig. 5a indicate the result with the coup-ling rate of 0, 50, 80, and 100 %. The results suggestthat deformation with 50–80 % coupling fits to theobserved data, the same consequence as Nishimura’sestimation. Therefore, the fault in the western side ofthe Sagami Bay is coupled with the deficit rate of a fewcentimeters per year, and thus, strain is accumulated.After the Tohoku-oki earthquake, we performed four
epochs of the observation at BOSS. The change of thedisplacement rates before and after the earthquake isnot significant. Thus, we assumed that the postseismicdeformation of the Tohoku-oki earthquake would causeno significant movement at BOSS. Then, comparing theaverage positions relative to the IA before and after theTohoku-oki earthquake, we derived the eastward coseis-mic displacement of 3.9 ± 2.0 cm at BOSS. We also de-tected the eastward coseismic displacement of about10 cm at SAGA. According to the coseismic slip model es-timated by Iinuma et al. (2012), coseismic displacementsof 4.5 cm eastward and of 12 cm east-southeastward wereestimated at BOSS and SAGA, respectively, which areboth consistent with our results.

a
b
Fig. 5 Velocity profiles in (a) the westward and (b) the northward directions from SAGA. Red squares and blue circles indicate the velocities atSAGA and the GEONET sites in the green area in Fig. 4, respectively. The water blue dashed lines indicate the location of the block boundaries. Thegreen lines indicate the profiles of the northward component of the surface velocity calculated by the method of Okada (1992), applying back slipmodel, with 0, 50, 80, and 100 % coupling
Watanabe et al. Earth, Planets and Space (2015) 67:184 Page 7 of 9
The displacement rate at SAGA after the earthquake(specifically 2012–2015) slightly changed from the rate be-fore the earthquake, though the difference of 0.8 ± 0.7 cm/year eastward and 0.7 ± 0.9 cm/year southward is almostas small as the confidence level. The change is consideredto be caused by the postseismic deformation of the event(e.g., Wang et al. 2012), like other geodetic sites in Japan(e.g., Ozawa et al. 2012; Watanabe et al. 2014). At theGEONET sites Niijima and Toshima on the islands in theIA, the difference between the displacement rates before(from January 2008 to July 2009) and after the Tohoku-okiearthquake (from January 2013 to January 2015) was ap-proximately 0.9 cm/year eastward and 0.2–0.3 cm/yearsouthward, which is consistent with SAGA.
ConclusionsWe have performed the GPS-acoustic observations atBOSS and SAGA, and detected the movements before andafter the Tohoku-oki earthquake. Because almost all partof the PHS is covered with ocean and many islands on thisplate are volcanic, geodetic data at the non-volcanic sea-floor sites provided an essential role to investigate the kine-matics in the southern Kanto area. The result at BOSSbefore the Tohoku-oki earthquake suggested that the mo-tion of the fore-arc of the PHS along the Izu-Bonin Trenchis different from the rigid PHS, which is in good agreementwith the model by Nishimura (2011). It thus contributedto clarify the velocity of the PHS (or the IA) subductingalong the Sagami Trough in an oblique direction, which
leads to more concrete understandings of the strain accu-mulation on the PHS-NA interface. Meanwhile, the resultat SAGA before the earthquake provided the evidence ofthe slip deficit of a few centimeters per year on the IM-IAboundary fault from the oceanic plate.From the observations after 2011, significant coseismic
displacements associated with the Tohoku-oki earth-quake were detected at both sites, whose values are con-sistent with the slip distribution model. Comparing thepostseismic displacement rate after 2012 with that beforethe Tohoku-oki event, the significant postseismic move-ment toward the east was detected at SAGA.While this paper determined the velocity of the PHS
along the Sagami Trough, the subducting velocity alongthe Nankai Trough still has ambiguity. The ambiguityof the kinematics models will be reduced by further ob-servations near the troughs, e.g., around the ZenisuRidge, simultaneously determining the location of theIM-IA boundary.
AbbreviationsCL: confidence level; CTD: conductivity temperature depth profiler;EU: Eurasian plate; GEONET: GNSS Earth Observation Network System;GNSS: global navigation satellite system; GPS: global positioning system;IA: Izu arc block; IM: Izu microplate; ITRF: International Terrestrial ReferenceFrame; JCG: Japan Coast Guard; NA: North American plate; PAC: Pacific plate;PHS: Philippine Sea plate; XCTD: expendable conductivity temperature depthprofiler; XBT: expendable bathythermograph.
Competing interestsThe authors declare that they have no competing interests.

Watanabe et al. Earth, Planets and Space (2015) 67:184 Page 8 of 9
Authors’ contributionsSW, TI, and YY proposed the topic, carried out the observation, processed thedata, and evaluated the accuracy of the results. SW interpreted the data andwrote the manuscript. All authors read and approved the final manuscript.
AcknowledgementsWe thank the Geospatial Information Authority of Japan (GSI) for providingus with the GPS data as terrestrial reference sites for kinematic GPS analysisand releasing daily coordinates of the sites on GSI’s website. We also thankDr. Oscar L. Colombo of the NASA Goddard Space Flight Center forproviding us with the kinematic GPS software IT (InterferometricTranslocation) (Colombo, 1998). We wish to express gratitude to ProfessorAkira Asada of Institute of Industrial Science, University of Tokyo, and Dr.Masashi Mochizuki of National Research Institute for Earth Science andDisaster Prevention for the continuous collaboration to develop the GPS-Atechnique; Dr. Takeshi Iinuma of the Japan Agency for Marine-Earth Scienceand Technology for calculating the coseismic displacements at our sites; andDr. Azusa Nishizawa of Japan Coast Guard for the valuable comments. A lotof staff members of the Hydrographic and Oceanographic Department ofJapan Coast Guard, including the crew of S/Vs Shoyo, Takuyo, Meiyo, andKaiyo, have been supporting us in observations and data analyses. Commentsfrom Professor Jack Loveless of the Smith College and an anonymous reviewerhave improved the paper substantially. Some figures were produced with theGMT software (Wessel and Smith, 1991).
Received: 20 August 2015 Accepted: 29 October 2015
ReferencesAltamimi Z, Collilieux X, Legrand J, Garayt B, Boucher C (2007) ITRF2005: a new
release of the international terrestrial reference frame based on time series ofstation positions and earth orientation parameters. J Geophys Res 112,B09401. doi:10.1029/2007JB004949
Ando M (1975) Source mechanism and tectonic significance of historicalearthquakes along the Nankai Trough, Japan. Tectonophysics 27:119–140.doi:10.1016/0040-1951(75)90102-X
Asada A, Yabuki T (2001) Centimeter-level positioning on the seafloor. Proc JpnAcad Ser B 77:7–12
Colombo OL (1998), Long-distance kinematic GPS. In: Teunissen PJG, Kleusberg A(ed) GPS for Geodesy, 2nd Edition. Springer-Verlag Berlin Heidelberg NewYork, pp 537–567.
DeMets C, Gordon RG, Argus DF, Stein S (1994) Effect of recent revisions to thegeomagnetic reversal time scale on estimates of current plate motions.Geophys Res Lett 21:2191–2194
DeMets C, Gordon RG, Argus DF (2010) Geologically current plate motions.Geophys J Int 181:1–80. doi:10.1111/j.1365-246X.2009.04491.x
Fujita M, Ishikawa T, Mochizuki M, Sato M, Toyama S, Katayama M, Matsumoto Y,Yabuki T, Asada A, Colombo OL (2006) GPS/Acoustic seafloor geodeticobservation: method of data analysis and its application. Earth Planets Space58:265–275. doi:10.1186/BF03351923
Iinuma T, Hino R, Kido M, Inazu D, Osada Y, Ito Y, Ohzono M, Tsushima H, SuzukiS, Fujimoto H, Miura S (2012) Coseismic slip distribution of the 2011 off thePacific Coast of Tohoku Earthquake (M9.0) refined by means of seafloorgeodetic data. J Geophys Res 117:B07409. doi:10.1029/2012JB009186
Izumi N, Nishizawa A, Horiuchi D, Kido Y, Nakata T, Goto H, Watanabe M, Suzuki Y(2013) 3D bathymetric image along the Sagami Trough and the Boso TripleJunction area deduced from 150 meter grid DEM (in Japanese). Rep HydrogrOceanogr Res 50:126–139
Kido M, Fujimoto H, Miura S, Osada Y, Tsuka K, Tabei T (2006) Seafloordisplacement at Kumano-nada caused by the 2004 off Kii Peninsulaearthquakes, detected through repeated GPS/acoustic surveys. Earth PlanetsSpace 58:911–915
Kido M, Osada Y, Fujimoto H, Hino R, Ito Y (2011) Trench-normal variation inobserved seafloor displacements associated with the 2011 Tohoku-Okiearthquake. Geophys Res Lett 38, L24303. doi:10.1029/2011GL050057
Matsumoto Y, Fujita M, Ishikawa T, Mochizuki M, Yabuki T, Asada A (2006)Undersea co-seismic crustal movements associated with the 2005 Off MiyagiPrefecture Earthquake detected by GPS/Acoustic seafloor geodeticobservation. Earth Planets Space 58:1573-1576. doi:10.1186/BF03352663
Matsumoto Y, Fujita M, Ishikawa T (2008) Development of multi-epoch methodfor determining seafloor station position (in Japanese). Rep HydrogrOceanogr Res 26:16–22
Nakagawa H, Toyofuku T, Kotani K, Miyahara B, Iwashita C, Kawamoto S, HatanakaY, Munekane H, Ishimoto M, Yutsudo T, Ishikura N, Sugawara Y (2009)Development and validation of GEONET new analysis strategy (Version 4) (inJapanese). J Geographical Survey Inst 118:1–8, http://www.gsi.go.jp/REPORT/JIHO/vol118-main.html
Nishimura T (2011) Back-arc spreading of the northern Izu-Ogasawara (Bonin) Islandsarc clarified by GPS data. Tectonophysics 512:60–67. doi:10.1016/j.tecto.2011.09.022
Nishimura T, Sagiya T, Stein RS (2007) Crustal block kinematics and seismicpotential of the northernmost Philippine Sea plate and Izu microplate,central Japan, inferred from GPS and leveling data. J Geophys Res 112,B05414. doi:10.1029/2005JB004102
No T, Takahashi N, Miura S, Yamashita M, Kido Y, Kodaira S (2014)Deformation of the Manazuru Knoll in Sagami Bay, central Japan,associated with subduction of the Philippine Sea plate. Earth PlanetsSpace 66:109. doi:10.1186/1880-5981-66-109
Okada Y (1992) Internal deformation due to shear and tensile faults in a half-space.Bull Seism Soc Am 75:1135-1154
Ozawa S (2014) Shortening of recurrence interval of Boso slow slip events inJapan. Geophys Res Lett 41:2762–2768. doi:10.1002/2014GL060072
Ozawa S, Nishimura T, Munekane H, Suito H, Kobayashi T, Tobita M, Imakiire T(2012) Preceding, coseismic, and postseismic slips of the 2011 Tohokuearthquake, Japan. J Geophys Res 117, B07404. doi:10.1029/2011JB009120
Sagiya T (1999) Interplate coupling in the Tokai District, Central Japan, deducedfrom continuous GPS data. Geophys Res Lett 26:2315–2318
Sato M, Ishikawa T, Ujihara N, Yoshida S, Fujita M, Mochizuki M, Asada A (2011a)Displacement above the hypocenter of the 2011 Tohoku-oki earthquake.Science 332:1395. doi:10.1126/science.1207401
Sato M, Saito H, Ishikawa T, Matsumoto Y, Fujita M, Mochizuki M, Asada A (2011b)Restoration of interplate locking after the 2005 Off-Miyagi prefectureearthquake, detected by GPS/acoustic seafloor geodetic observation.Geophys Res Lett 38, L01312. doi:10.1029/2010GL045689
Sato M, Fujita M, Matsumoto Y, Saito H, Ishikawa T, Asakura T (2013a) Improvementof GPS/acoustic seafloor positioning precision through controlling the ship’strack line. J Geod 87:825–842. doi:10.1007/s00190-013-0649-9
Sato M, Fujita M, Matsumoto Y, Ishikawa T, Saito H, Mochizuki M, Asada A (2013b)Interplate coupling off northeastern Japan before the 2011 Tohoku-okiearthquake, inferred from seafloor geodetic data. J Geophys Res 118:1–10.doi:10.1002/jgrb.50275
Savage JC (1983) A dislocation model of strain accumulation and release at asubduction zone. J Geophys Res 88:4984–4996. doi:10.1029/JB088iB06p04984
Sella GF, Dixon TH, Mao A (2002) REVEL: a model for recent plate velocities fromspace geodesy. J Geophys Res 107(B4):2081. doi:10.1029/2000JB000033
Seno T, Stein S, Gripp AE (1993) A model for the motion of the Philippine Seaplate consistent with NUVEL-1A and geological data. J Geophys Res98:17941–17948
Spiess FN, Chadwell CD, Hildebrand JA, Young LE, Purcell GH Jr, Dragert H (1998)Precise GPS/Acoustic positioning of seafloor reference points for tectonicstudies. Phys Earth and Planet Inter 108:101–112. doi:10.1016/S0031-9201(98)00089-2
Tadokoro K, Ikuta R, Watanabe T, Ando M, Okuda T, Nagai S, Yasuda K,Sakata T (2012) Interseismic seafloor crustal deformation immediatelyabove the source region of anticipated megathrust earthquake alongthe Nankai Trough, Japan. Geophys Res Lett 39, L10306. doi:10.1029/2012GL051696
Takeo M (1988) Rupture process of the 1980 Izu-Hanto-Toho-Oki earthquakededuced from strong motion seismograms. Bull Seism Soc Am 78(3):1074–1091
Taylor B, Klaus A, Moore GF, Murakami F, Okamura Y (1991) Structural developmentof the Sumisu Rift, Izu-Bonin Arc. J Geophys Res 96(B10):16113–16129
Wang K, Hu Y, He J (2012) Deformation cycles of subduction earthquake in aviscoelastic Earth. Nature 484:327–332. doi:10.1038/nature11032
Watanabe S, Sato M, Fujita M, Ishikawa T, Yokota Y, Ujihara N, Asada A (2014)Evidence of viscoelastic deformation following the 2011 Tohoku-okiearthquake revealed from seafloor geodetic observation. Geophys Res Lett41:5789–5796. doi:10.1002/2014GL061134
Wessel P, Smith WHF (1991) Free software helps map and display data. Eos TransAGU 72:441. doi:10.1029/90EO00319
Yasuda K, Tadokoro K, Ikuta R, Watanabe T, Nagai S, Okuda T, Fujii C, Sayanagi K(2014) Interplate locking condition derived from seafloor geodetic data at

Watanabe et al. Earth, Planets and Space (2015) 67:184 Page 9 of 9
the northernmost part of the Suruga Trough, Japan. Geophys Res Lett41:5806–5812. doi:10.1002/2014GL060945
Yokota Y, Ishikawa T, Sato M, Watanabe S, Saito H, Ujihara N, Matsumoto Y,Toyama S, Fujita M, Yabuki T, Mochizuki M, Asada A (2015) Heterogeneousinterplate coupling along the Nankai Trough, Japan, detected by GPS-acoustic seafloor geodetic observation. Prog Earth Planet Sci 2:10.doi:10.1186/s40645-015-0040-y
Submit your manuscript to a journal and benefi t from:
7 Convenient online submission
7 Rigorous peer review
7 Immediate publication on acceptance
7 Open access: articles freely available online
7 High visibility within the fi eld
7 Retaining the copyright to your article
Submit your next manuscript at 7 springeropen.com