Embed Size (px)
Citation preview
processes
Article
Non-Viral Transfection of Human T Lymphocytes
Simon A. B. Riedl 1, Patrick Kaiser 1 , Alexander Raup 1,2, Christopher V. Synatschke 3,Valérie Jérôme 1 and Ruth Freitag 1,*
1 Process Biotechnology, University of Bayreuth, 95440 Bayreuth, Germany;[email protected] (S.A.B.R.); [email protected] (P.K.);[email protected] (A.R.); [email protected] (V.J.)
2 Agap2—HIQ Consulting GmbH, 60323 Frankfurt am Main, Germany3 Department Synthesis of Macromolecules, Max Planck Institute for Polymer Research, 55128 Mainz,
Germany; [email protected]* Correspondence: [email protected]; Tel.: +49-921-55-7371
Received: 10 September 2018; Accepted: 9 October 2018; Published: 11 October 2018�����������������
Abstract: The genetic modification of human T lymphocytes with established non-viral methods isinefficient. Linear polyethylenimine (l-PEI), one of the most popular non-viral transfection agents formammalian cells in general, only achieves transfection rates in the single digit percentage range forthese cells. Here, a well-defined 24-armed poly(2-dimethylamino) ethyl methacrylate (PDMAEMA)nanostar (number average of the molecular weight: 755 kDa, polydispersity: <1.21) synthesizedvia atom transfer radical polymerization (ATRP) from a silsesquioxane initiator core is proposed asalternative. The agent is used to prepare polyplexes with plasmid DNA (pDNA). Under optimalconditions these polyplexes reproducibly transfect >80% of the cells from a human T-cell leukemiacell line (Jurkat cells) at viabilities close to 90%. The agent also promotes pDNA uptake when simplyadded to a mixture of cells and pDNA. This constitutes a particular promising approach for efficienttransient transfection at large scale. Finally, preliminary experiments were carried out with primaryT cells from two different donors. Results were again significantly better than for l-PEI, althoughfurther research into the response of individual T cells to the transfection agent will be necessary,before either method can be used to routinely transfect primary T lymphocytes.
Keywords: non-viral gene delivery; Jurkat cells; human T lymphocytes; primary cells;poly(2-dimethylamino) ethyl methacrylate; polycation; nanostar
1. Introduction
Genetically engineered primary human T lymphocytes (T cells) have their place in basic researchand increasingly also in medical therapy [1]. A pertinent example is the generation of chimericantigen receptor (CAR) T cells as basis for an FDA-approved adoptive cell therapy (ACT) to treatacute lymphoblastic leukemia (ALL) [2,3]. Primary T cells are isolated from the patient’s blood andare genetically modified to recognize the cancer cells. The T cells are then expanded and given backto the patient. In this case, the cells are permanently transfected, i.e., the recombinant DNA is stablyintegrated into the genome and passed on to the daughter cells during cell division (expansion).Alternatively, it has been proposed to first expand the T cells and then transfect them transiently. In thiscase, the DNA remains episomal, gene expression is transitory and will cease as the DNA is dilutedduring further cell division. Although not yet accepted by the regulatory authorities, transientlytransfected cells are thought to show less cross reactivity and be less of a burden on the patient [4].
In nearly all cases of efficient T cell transfection discussed in the literature, viruses were used totransduce the cells. Although very efficient, viruses have some drawbacks, mostly related to theirimmunogenicity and a limitation in the amount of DNA to be transferred. Physical methods, such as
Processes 2018, 6, 188; doi:10.3390/pr6100188 www.mdpi.com/journal/processes
Processes 2018, 6, 188 2 of 17
electroporation, have been suggested as alternative [5]. However, electroporation requires prohibitorylarge numbers of cells, since survival is low, while important cellular functions may be perturbed [6,7].Chemical transfection methods, such as lipofection or polyfection, which are standard alternativesfor many mammalian cells, are less popular in the case of T cells, due to an extremely low efficiency.T cells have for instance, shown resistance to common lipofection reagents [8]. Gene transfer usingpolycations is also more difficult in the case of T cells. Several groups including our own have, e.g.,shown that polyethylenimine (PEI), the current “gold standard” in non-viral chemical transfectionusing polycations, only reaches transfection efficiencies in the single digit range, which is much toolow for most applications [9–11]. The reason for this inefficiency is not quite clear. However, in vitrotransfection begins with an interaction of the polyplexes with the cellular membrane. It is thought thatin the case of PEI, this interaction takes place primarily with negatively charged membrane proteins,such as sulfated proteoglycans [12–15]. Some studies with PEI indicate that these interactions are alsodecisive for polyplex internalization [16,17]. T cells and in particular some of their subpopulations,are known to have unusually high or low proteoglycan contents in their cellular membranes [18].The same is true for the Jurkat cells [19], i.e., cells from a human leukemia cell line, which are commonlyused as model cells for the T cells. A low proteoglycans content may therefore be partly responsiblefor a resistance to PEI as a transfection agent.
In the past, we have proposed poly-2-(dimethylamino)ethyl methacrylate (PDMAEMA) asan efficient transfection agent in a wide range of cell lines including some that are hardlytransfectable with PEI [11] which have led us to speculate about a different uptake mechanism [20].Well-defined, multi-armed nanostars based on the polycation poly-2-(dimethylamino)ethylmethacrylate (PDMAEMA) outperformed linear PEI (l-PEI) for the transfection of Jurkat cells. However,elevated transfection efficiencies (up to 50%) were linked to a low viability (≤40%) in these cases [11].In the previous experiments, the PDMAEMA nanostars had been used in a manner similar to thatproposed for PEI in standard transfection protocols. The plasmid DNA (pDNA) and a defined surplusof the polycation were mixed and incubated for polyplex formation. Afterwards, the polyplexeswere added to the cells under static conditions (cells settled at the bottom of a Petri dish or wellplate). After another incubation step, the cells were separated from the transfection cocktail throughcentrifugation and placed into fresh culture medium for recovery.
Debatably, electroporation and, in particular, nucleofection [21] are at present the most efficientnon-viral methods for the genetic modification of T cells. Both call for the pre-mixing of the cellsand the pDNA at high cell density (between 1 × 10⁷ cells mL−1 and 8 × 10⁷ cells mL−1) prior tothe high voltage treatment [22]. Taking this into consideration, we argue that the chemical high celldensity (HCD) transfection protocol developed 14 years ago by the group of Florian Wurm [23–25] forproduction cell lines like Chinese hamster ovary (CHO) and human embryonic kidney 293 (HEK293)cells, might also be suitable to transiently deliver pDNA into T cells, even though to the best of ourknowledge it has never been tried for this purpose before. For HCD transfection, the pDNA is directlymixed into a highly concentrated cell suspension (≥2 × 10⁷ cells mL−1), followed by the additionof a polycation (PEI in most previous experiments), a short incubation and then a dilution of thetransfection cocktail by at least an order of magnitude. The transfection agent is thus not removed, butsimply diluted in this approach.
The present study summarizes the systematic optimization of nanostar-based transfectionstrategies for genetic engineering of human T cell, both at the research and at the therapeutic scale.Jurkat cells were used as model cells for human primary T cells in the development of the procedures,which were then applied in a preliminary proof-of-concept study to human primary T lymphocytesfrom two different donors.
Processes 2018, 6, 188 3 of 17
2. Materials and Methods
2.1. Materials
If not otherwise indicated, we used Greiner bio-one (Greiner Bio-One International GmbH,Frickenhausen, Germany) as supplier for cell culture materials and Sigma-Aldrich for chemicals(Sigma-Aldrich, Taufkirchen, Germany). Linear PEI (l-PEI, 25 kDa) was from Polysciences (PolysciencesEurope GmbH, Eppelheim, Germany). Trypan blue solution (0.4%) was from VWR (VWR International,Ismaning, Germany). Recombinant human interleukin 2 (rhIL-2) was from BD Biosciences (BectonDickinson, Heidelberg, Germany). Fetal calf serum (FCS), L-glutamine, penicillin, and streptomycinwere from Biochrom (Biochrom AG, Berlin, Germany). Dulbecco’s Phosphate-Buffered Saline withoutCa2+ and Mg2+ (DPBS) was from Lonza (Lonza Group AG, Visp, Switzerland). Hepes-buffered glucosesolution (HBG, 20 mM Hepes, 5 wt% glucose, pH 5.5) was prepared in house and sterilized by filtration(0.2 µm Minisart, regenerated Cellulose, Sartorius, Göttingen, Germany). Cell culture media R10 (RoswellPark Memorial Institute (RPMI) 1640 without glutamine, add 10 vol% fetal calf serum, 2 mM L-glutamine,100 IU mL−1 penicillin and 100 µg mL−1 streptomycin) and Opti-MEM were from Biochrom AG (Berlin,Germany) and Thermo Fisher Scientific (Dreieich, Germany), respectively. LymphoGrow medium (LG,containing 2 mM L-glutamine and undisclosed amounts of antibiotics) was from Cytogen (CytogenGmbH, Sinn, Germany). LG stimulates the growth of peripheral blood lymphocytes and contains alsoproprietary amounts of pre-tested fetal bovine serum (FBS) and phytohemaglutinin (PHA-P,≤10 µg mL−1
mitogenic activity). For pre-equilibration, media were incubated for at least 1 h in a standard mammaliancell culture incubator (37 ◦C, 5% CO2, 95% humidity, Steri-Cult, Thermo Forma, Fisher Scientific GmbH,Schwerte, Germany). Blood was obtained from the Bavarian Red Cross.
2.2. Cells and Maintenance
The Jurkat cells (TIB-152, American Type Culture Collection (ATCC), human leukemia T cells,suspension cells) were maintained in R10, as recommended by the supplier; a seeding density of1 × 105 cells mL−1 was used during passaging and the maximal cell density was never allowed toexceed 3 × 10⁶ cells mL−1. Cells were cultivated at 37 ◦C in humidified 5% CO2 atmosphere.
Peripheral blood mononuclear cells (PBMCs) were isolated from the blood of healthy donors byFicoll gradient centrifugation with a lymphocyte separation medium (LSM1077, PAA Laboratories,Pasching, Austria) according to the supplier’s instructions. The freshly isolated PBMCs were seeded at2.5 × 106 cells mL−1 in Lymphogrow (LG) medium in 75 cm2 T-flasks. After 24 h cultivation, the cellsuspension was transferred to a new flask, to separate the PBMCs from adherent growing immunecells. PBMCs were cultivated for a further 24 h before transfection.
2.3. Plasmid
pEGFP-N1 (4.7 kb) encoding for the enhanced green fluorescent protein (EGFP) driven by thecytomegalovirus (CMV) immediate early promoter was from Clontech Laboratories, Inc. (MountainView, CA, USA). The plasmid was amplified in E. coli (LB medium) using standard laboratorytechniques. The EndoFree Plasmid Kit (Giga Prep/Maxi Prep) from QIAGEN (QIAGEN GmbH,Hilden, Germany) was used for purification (quality control: >80% supercoiled topology (agarosegel; 1% TAE) and A260/A280 ≥1.8). Purified plasmids were solubilized (1.7 mg mL−1) in sterileultrapure-water (Sigma-Aldrich, Taufkirchen, Germany).
2.4. Transfection Agent
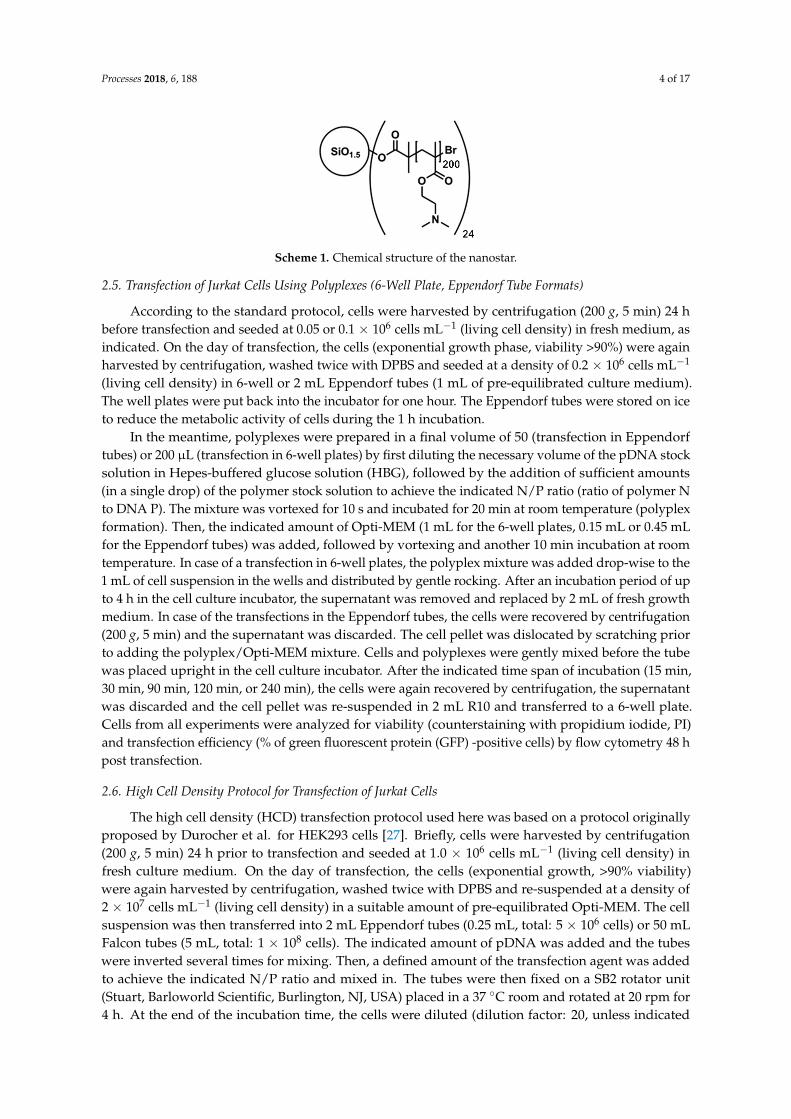
The transfection agent was a well-defined 24-armed PDMAEMA nanostar (number average ofthe molecular weight: 755 kDa, polydispersity: <1.21) synthesized as previously described [26] viaatom transfer radical polymerization (ATRP) from a silsesquioxane initiator core. Each arm of thenanostar contained an average of 200 monomeric units, Scheme 1. A stock solution (1.82 mg mL−1)was prepared in sterile ultrapure PCR-water (Sigma-Aldrich).
Processes 2018, 6, 188 4 of 17Processes 2018, 6, x FOR PEER REVIEW 4 of 17
Scheme 1. Chemical structure of the nanostar.
2.5. Transfection of Jurkat Cells Using Polyplexes (6-Well Plate, Eppendorf Tube Formats)
According to the standard protocol, cells were harvested by centrifugation (200 g, 5 min) 24 h before transfection and seeded at 0.05 or 0.1 × 10⁶ cells mL−1 (living cell density) in fresh medium, as indicated. On the day of transfection, the cells (exponential growth phase, viability >90%) were again harvested by centrifugation, washed twice with DPBS and seeded at a density of 0.2 × 10⁶ cells mL−1 (living cell density) in 6-well or 2 mL Eppendorf tubes (1 mL of pre-equilibrated culture medium). The well plates were put back into the incubator for one hour. The Eppendorf tubes were stored on ice to reduce the metabolic activity of cells during the 1 h incubation.
In the meantime, polyplexes were prepared in a final volume of 50 (transfection in Eppendorf tubes) or 200 µL (transfection in 6-well plates) by first diluting the necessary volume of the pDNA stock solution in Hepes-buffered glucose solution (HBG), followed by the addition of sufficient amounts (in a single drop) of the polymer stock solution to achieve the indicated N/P ratio (ratio of polymer N to DNA P). The mixture was vortexed for 10 s and incubated for 20 min at room temperature (polyplex formation). Then, the indicated amount of Opti-MEM (1 mL for the 6-well plates, 0.15 mL or 0.45 mL for the Eppendorf tubes) was added, followed by vortexing and another 10 min incubation at room temperature. In case of a transfection in 6-well plates, the polyplex mixture was added drop-wise to the 1 mL of cell suspension in the wells and distributed by gentle rocking. After an incubation period of up to 4 h in the cell culture incubator, the supernatant was removed and replaced by 2 mL of fresh growth medium. In case of the transfections in the Eppendorf tubes, the cells were recovered by centrifugation (200 g, 5 min) and the supernatant was discarded. The cell pellet was dislocated by scratching prior to adding the polyplex/Opti-MEM mixture. Cells and polyplexes were gently mixed before the tube was placed upright in the cell culture incubator. After the indicated time span of incubation (15 min, 30 min, 90 min, 120 min, or 240 min), the cells were again recovered by centrifugation, the supernatant was discarded and the cell pellet was re-suspended in 2 mL R10 and transferred to a 6-well plate. Cells from all experiments were analyzed for viability (counterstaining with propidium iodide, PI) and transfection efficiency (% of green fluorescent protein (GFP) -positive cells) by flow cytometry 48 h post transfection.
2.6. High Cell Density Protocol for Transfection of Jurkat Cells
The high cell density (HCD) transfection protocol used here was based on a protocol originally proposed by Durocher et al. for HEK293 cells [27]. Briefly, cells were harvested by centrifugation (200 g, 5 min) 24 h prior to transfection and seeded at 1.0 × 10⁶ cells mL−1 (living cell density) in fresh culture medium. On the day of transfection, the cells (exponential growth, >90% viability) were again harvested by centrifugation, washed twice with DPBS and re-suspended at a density of 2 × 10⁷ cells mL−1 (living cell density) in a suitable amount of pre-equilibrated Opti-MEM. The cell suspension was then transferred into 2 mL Eppendorf tubes (0.25 mL, total: 5 × 10⁶ cells) or 50 mL Falcon tubes (5 mL, total: 1 × 10⁸ cells). The indicated amount of pDNA was added and the tubes were inverted several times for mixing. Then, a defined amount of the transfection agent was added to achieve the indicated N/P ratio and mixed in. The tubes were then fixed on a SB2 rotator unit (Stuart, Barloworld Scientific, Burlington, NJ, USA) placed in a 37 °C room and rotated at 20 rpm for 4 h. At the end of the incubation time, the cells were diluted (dilution factor: 20, unless indicated otherwise) in R10 and
Scheme 1. Chemical structure of the nanostar.
2.5. Transfection of Jurkat Cells Using Polyplexes (6-Well Plate, Eppendorf Tube Formats)
According to the standard protocol, cells were harvested by centrifugation (200 g, 5 min) 24 hbefore transfection and seeded at 0.05 or 0.1 × 10⁶ cells mL−1 (living cell density) in fresh medium, asindicated. On the day of transfection, the cells (exponential growth phase, viability >90%) were againharvested by centrifugation, washed twice with DPBS and seeded at a density of 0.2 × 10⁶ cells mL−1
(living cell density) in 6-well or 2 mL Eppendorf tubes (1 mL of pre-equilibrated culture medium).The well plates were put back into the incubator for one hour. The Eppendorf tubes were stored on iceto reduce the metabolic activity of cells during the 1 h incubation.
In the meantime, polyplexes were prepared in a final volume of 50 (transfection in Eppendorftubes) or 200 µL (transfection in 6-well plates) by first diluting the necessary volume of the pDNA stocksolution in Hepes-buffered glucose solution (HBG), followed by the addition of sufficient amounts(in a single drop) of the polymer stock solution to achieve the indicated N/P ratio (ratio of polymer Nto DNA P). The mixture was vortexed for 10 s and incubated for 20 min at room temperature (polyplexformation). Then, the indicated amount of Opti-MEM (1 mL for the 6-well plates, 0.15 mL or 0.45 mLfor the Eppendorf tubes) was added, followed by vortexing and another 10 min incubation at roomtemperature. In case of a transfection in 6-well plates, the polyplex mixture was added drop-wise to the1 mL of cell suspension in the wells and distributed by gentle rocking. After an incubation period of upto 4 h in the cell culture incubator, the supernatant was removed and replaced by 2 mL of fresh growthmedium. In case of the transfections in the Eppendorf tubes, the cells were recovered by centrifugation(200 g, 5 min) and the supernatant was discarded. The cell pellet was dislocated by scratching priorto adding the polyplex/Opti-MEM mixture. Cells and polyplexes were gently mixed before the tubewas placed upright in the cell culture incubator. After the indicated time span of incubation (15 min,30 min, 90 min, 120 min, or 240 min), the cells were again recovered by centrifugation, the supernatantwas discarded and the cell pellet was re-suspended in 2 mL R10 and transferred to a 6-well plate.Cells from all experiments were analyzed for viability (counterstaining with propidium iodide, PI)and transfection efficiency (% of green fluorescent protein (GFP) -positive cells) by flow cytometry 48 hpost transfection.
2.6. High Cell Density Protocol for Transfection of Jurkat Cells
The high cell density (HCD) transfection protocol used here was based on a protocol originallyproposed by Durocher et al. for HEK293 cells [27]. Briefly, cells were harvested by centrifugation(200 g, 5 min) 24 h prior to transfection and seeded at 1.0 × 10⁶ cells mL−1 (living cell density) infresh culture medium. On the day of transfection, the cells (exponential growth, >90% viability)were again harvested by centrifugation, washed twice with DPBS and re-suspended at a density of2 × 107 cells mL−1 (living cell density) in a suitable amount of pre-equilibrated Opti-MEM. The cellsuspension was then transferred into 2 mL Eppendorf tubes (0.25 mL, total: 5 × 10⁶ cells) or 50 mLFalcon tubes (5 mL, total: 1 × 10⁸ cells). The indicated amount of pDNA was added and the tubeswere inverted several times for mixing. Then, a defined amount of the transfection agent was addedto achieve the indicated N/P ratio and mixed in. The tubes were then fixed on a SB2 rotator unit(Stuart, Barloworld Scientific, Burlington, NJ, USA) placed in a 37 ◦C room and rotated at 20 rpm for4 h. At the end of the incubation time, the cells were diluted (dilution factor: 20, unless indicated
Processes 2018, 6, 188 5 of 17
otherwise) in R10 and the suspensions transferred to either a 10 cm tissue culture dish (Eppendorftube) or a 100 mL spinner flask (Falcon tube). For further scale up, 2 × 10⁹ cells were transferred intotwo 50 mL Falcon tubes (25 mL each, 4× 10⁷ cells mL−1), pDNA and polymer were added sequentiallyas described above. Thereafter, the mixtures were immediately combined in a 100 mL spinner flaskand placed for incubation in the cell culture incubator for 4 h (70 rpm, CELLSPIN stirrer, INTEGRABiosciences AG, Biebertal, Germany). At the end of that time, the cells were diluted in R10 (dilutionfactor: 20) and transferred to a 1 L spinner flask for further cultivation of the cells. Cells from allexperiments were again analyzed for viability (PI) and transfection efficiency (EGFP) by flow cytometry48 h post transfection.
2.7. Transfection of Primary T Cells
After two days of cultivation of the PBMCs in LG medium, mainly CD3+ cells with blastedmorphology (“activated T cells”) were obtained as determined by flow cytometry. Transfections wereperformed in Opti-MEM using polyplexes and HCD protocols both in Eppendorf tube format asdescribed above, excluding the cell seeding step 24 h before transfection. For the polyplexes-basedtransfection (0.2 × 10⁶ cells, N/P 10, transfection volume 0.5 mL), two batches of polyplexes wereprepared in parallel (experimental replicates) but added sequentially to the cells implicating that forthe second replicate, polyplexes incubation at room temperature and storage of the cells on ice wassomewhat longer (15 min to 20 min). After 90 min incubation with the polyplexes, the cells wererecovered by centrifugation, the supernatant was discarded and the cell pellet was re-suspendedin 2 mL LG medium supplemented with 11 ng mL−1 rhIL-2 to improve T cells proliferation [28]and transferred into 6-well plates. For HCD transfection, 5 × 10⁶ cells were incubated with 3 µgpolymer per 106 cells for 4 h (N/P 10, 0.25 mL). Thereafter, the cells were diluted (dilution factor: 80)in LG medium supplemented with 11 ng mL−1 rhIL-2 and the suspension transferred into a 10 cmtissue culture dish. Cells from all experiments were again analyzed for viability (PI) and transfectionefficiency (EGFP) by flow cytometry 48 h post transfection.
2.8. Analytics
Jurkat cell numbers and viabilities during passaging and seeding steps were evaluated by trypanblue exclusion assay with a hemocytometer (Neubauer Improved, VWR International, Ismaning,Germany). Cell number and viability of primary T cells were evaluated using the automatedfluorescence cell counter Luna (Logos Biosystems, Gyeonggi-do, Korea). A 2 µL sample of cellculture was mixed with 18 µL Staining-Mix (Acridin Orange and Propidium iodide, proprietaryconcentrations, Logos Biosystems) and loaded into the chamber of a PhotonSlide (Logos Biosystems).Afterwards, the slide was inserted into the slide port of the counter and the cells were counted. If thecell concentration was above 5 × 10⁶ cells mL−1 the sample was diluted with DPBS (10-fold).
Zeta potentials and hydrodynamic radii of the polyplexes were determined using a Zetasizer NanoZS (Malvern Instruments, Herrenberg, Germany). For zeta potential measurements polyplexes wereproduced in 200 µL HBG using 15 µg of pDNA and varying amounts of the nanostar stock solution toreach the indicated N/P ratio. Mixtures were vortexed for 10 s and incubated at room temperaturefor polyplex formation and maturation. After 20 min of incubation, the preparation was diluted with1 mL Opti-MEM. The size of the polyplexes was determined by noninvasive back scattering in thesame instrument utilizing a He–Ne laser (λ = 633 nm, max power = 5 mW). Hydrodynamic radiiwere followed for 20 min in HBG. Then, polyplexes were diluted 6-fold with Opti-MEM and furthermonitored. All incubations and measurements were performed at room temperature.
For the gel retardation assay, polyplexes were produced in 200 µL HBG using 15 µg of pDNAand varying amounts of the nanostar stock solution to reach the indicated N/P ratio. Mixtureswere vortexed for 10 s and incubated at room temperature for polyplex formation and maturation.After 20 min of incubation, 20 µL 6X loading buffer (60% glycerol—10 mM Tris-HCl pH 7.6—60 mMEDTA—0.03% bromophenol blue) were added and 15 µL of these mixtures were analyzed in 1%
Processes 2018, 6, 188 6 of 17
(w/v) agarose gels with Tris-acetate-EDTA as running buffer (running time 90 min, applied voltage90 V). Gels were stained with ethidium bromide (EtBr, 10 µg mL−1) and the DNA visualized underultraviolet (UV) light (254 nm).
For phenotyping of the primary T lymphocytes, cell surface markers CD3 and CD25 were assessedby staining the cells with specific antibodies (mouse-anti human CD3-PE # 555340, mouse-anti humanCD25-PE-Cy5, # 555433; both from BD Bioscience, Becton Dickinson, Heidelberg, Germany) accordingto the manufacturer’s instructions and analyzed by flow cytometry.
For flow cytometry (Cytomics FC500 equipped with a 488 nm argon-ion laser, Beckman Coulter,Krefeld, Germany), cells were recovered by centrifugation (200 g, 5 min) and re-suspended in 500 µLDPBS containing PI (1 µg mL−1). Forward scatter (FSC), side scatter (SSC), green fluorescence (EGFP,em 510 nm), and red fluorescence (PI, em 620 nm; PE, em 575 nm; PE-Cy5, em 655 nm) were recorded.Scatter properties (FSC/SSC) were used to select a region representing single, non-apoptotic cells,while disregarding dead cells, debris, and cellular aggregates. Cells “transfected” at N/P = 0, i.e., inthe absence of the transfection agent, were used to set the measurement parameters. Histogram plotsof the respective fluorescence intensities (log scale) were used to estimate the percentage of transfectedcells and the expression level distribution according to: low producers (L): fluorescence intensitybetween 1 a u and 10 a u.; middle producers (M): fluorescence intensity between 10 a u and 100 a u.;high producers (H): fluorescence intensity >100 a u., in the non-apoptotic cell population. Dead cells,counterstained by PI, were evaluated in the total measured cell population. Flow cytometry data wereevaluated using FlowJo software v 10.5.0 (Tree Star, Stanford University, Stanford, CA, USA, 2016).
2.9. Statistical Analyses
Group data are reported as mean ± standard deviation (SD). If not otherwise stated, n representsthe number of independent experiments. Sigma Plot software (version 11.0, Systat software Inc.,San Jose, CA, USA, 2008) was used for One-way ANOVA with Bonferoni multiple comparisons teststo determine whether data groups differed significantly from each other. Statistical significance wasdefined as p < 0.05.
3. Results and Discussion
3.1. Physicochemical Characterization of the Polyplexes
In the standard transfection protocol, polyplexes are initially formed between the pDNA anda surplus of the polycationic transfection agent, which are then added to the cells. A surplus oftransfection agent is required to overcompensate the negative charge of the pDNA and give thepolyplexes the positive net-charge required for attractive electrostatic interaction with the cellularmembrane. In addition, the size (hydrodynamic radius) of the polyplexes should ideally range between50 nm and 200 nm [29].
The zeta potential was measured for the polyplexes as a function of the N/P ratio (ratio ofpolymer N to DNA P), Table 1. Hepes-buffered glucose solution (HBG) was used as matrix forpolyplex formation, because in our hands, this buffer originally proposed by Van Gaal et al. [30] hadpreviously been more efficient in transfecting mammalian cells that the commonly used unbuffered150 mM NaCl [31].
Table 1. Zeta potentials of polyplexes at the indicated N/P-ratios.
N/P Ratio Zeta Potential Values (mV)
3 −30.7 ± 2.15 −0.4 ± 4.0
10 7.4 ± 1.820 10.1 ± 1.2
The zeta potential of the non-complexed DNA is −26.9 ± 3.2 mV. Shown are mean values ± standard deviation(SD), n = 3.
Processes 2018, 6, 188 7 of 17
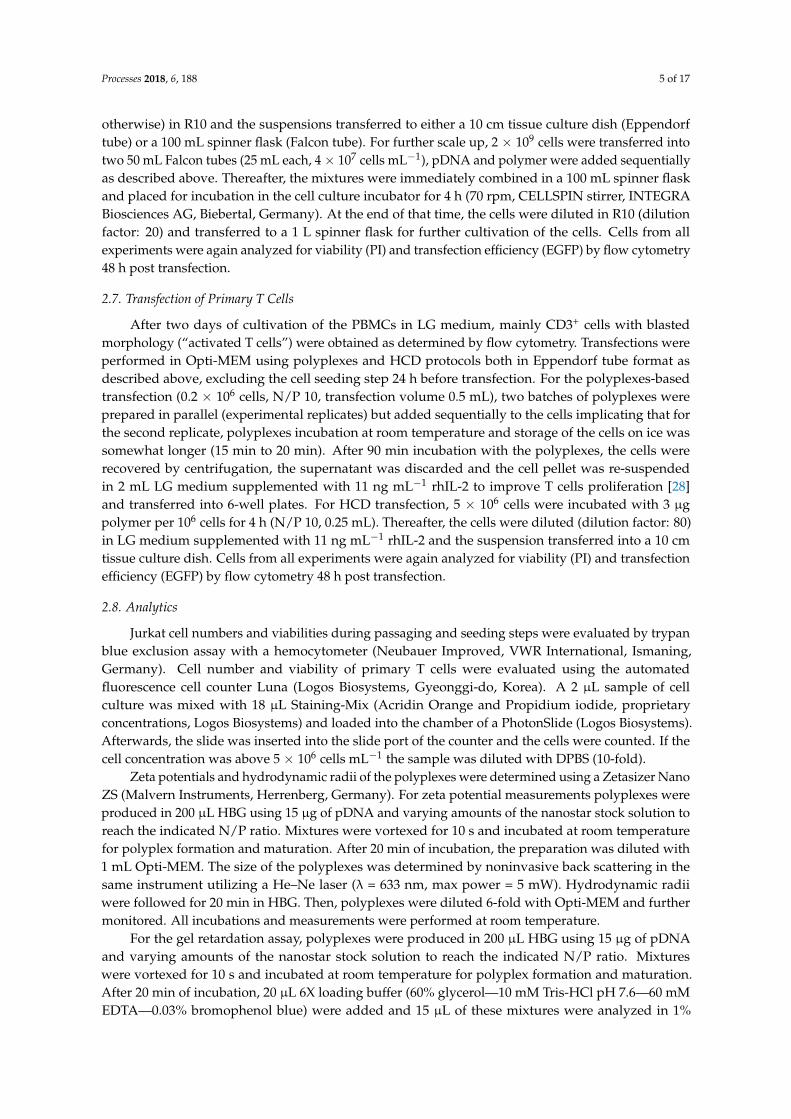
As expected, the zeta potential of the polyplexes increases with increasing N/P ratio. An N/Pratio of at least 5 is required for a full charge compensation of the DNA. When the N/P ratio isincreased further, the zeta potential reaches a final value of +10 mV. As shown as example for N/P 20in Figure 1, the hydrodynamic radius of the polyplexes changed little with incubation time. Moreover,with a value of 70.4± 4.5 nm the polyplexes should be well suited to transfect mammalian cells. This isdifferent from the results shown for l-PEI polyplexes in HBG which initially was much smaller 33 nmand then increase to 130 nm after dilution [20].
Processes 2018, 6, x FOR PEER REVIEW 7 of 17
As expected, the zeta potential of the polyplexes increases with increasing N/P ratio. An N/P ratio of at least 5 is required for a full charge compensation of the DNA. When the N/P ratio is increased further, the zeta potential reaches a final value of +10 mV. As shown as example for N/P 20 in Figure 1, the hydrodynamic radius of the polyplexes changed little with incubation time. Moreover, with a value of 70.4 ± 4.5 nm the polyplexes should be well suited to transfect mammalian cells. This is different from the results shown for l-PEI polyplexes in HBG which initially was much smaller 33 nm and then increase to 130 nm after dilution [20].
Figure 1. Development of the hydrodynamic radius of the polyplexes with incubation time. White symbols: initial incubation in Hepes-buffered glucose solution (HBG), black symbols: after dilution with Opti-MEM (1 mL), N/P ratio: 20.
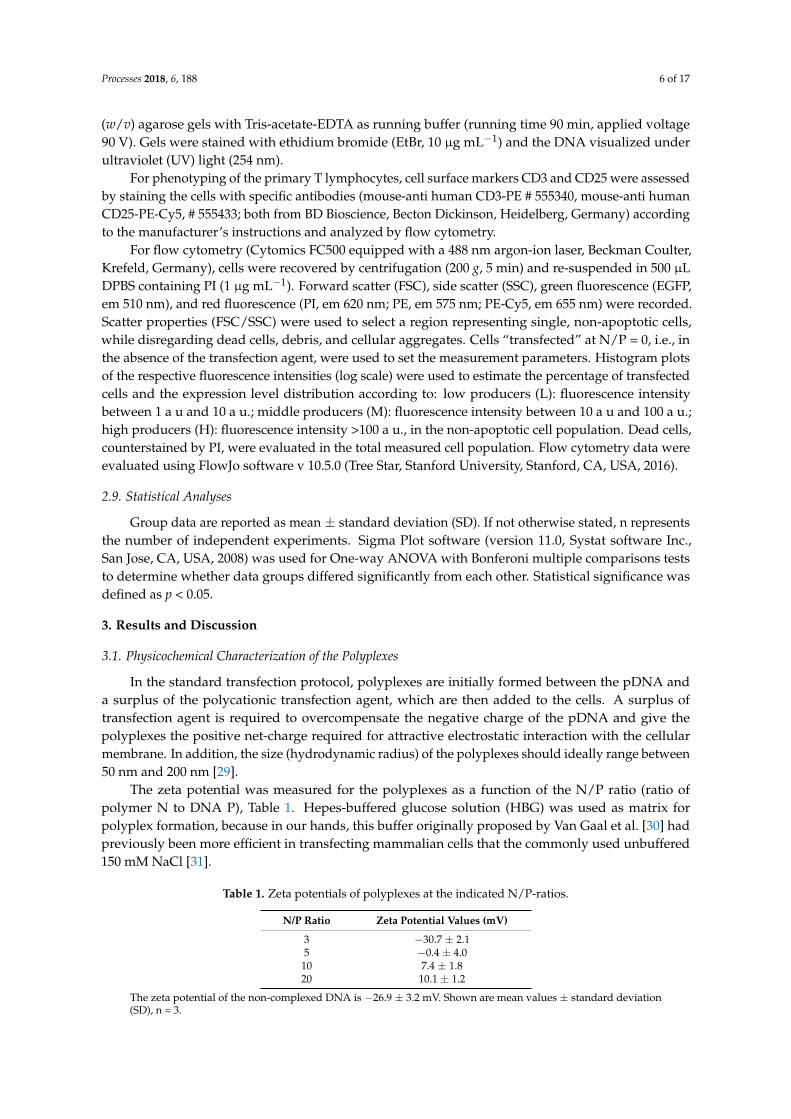
While the zeta potential gives an idea of the N/P ratio required for charge compensation, a direct evaluation of the polyplexes’ net-charge is possible in the gel retardation assay, Figure 2. According to this assay, polyplexes with an N/P ratio >3 (Nanostar) no longer move towards the anode in an electrical field, i.e., have a zero or positive net-charge. For comparison, similar observations are already made for l-PEI at N/P ratio >2.
Figure 2. Gel retardation of the polyplexes as a function of the N/P ratio (indicated on the top of the respective lanes).
3.2. Optimization of the Standard Transfection Protocol for Jurkat Cells
The polyplexes formed with the nanostars were then used in comparison to l-PEI as standard to transfect Jurkat cells, which served here as model cells for primary human T lymphocytes. For optimal transfection results, the cells should be rapidly dividing and in the exponential phase of growth. To assure this, standard transfection protocols call for passaging of the cells into fresh
Figure 1. Development of the hydrodynamic radius of the polyplexes with incubation time. Whitesymbols: initial incubation in Hepes-buffered glucose solution (HBG), black symbols: after dilutionwith Opti-MEM (1 mL), N/P ratio: 20.
While the zeta potential gives an idea of the N/P ratio required for charge compensation, a directevaluation of the polyplexes’ net-charge is possible in the gel retardation assay, Figure 2. Accordingto this assay, polyplexes with an N/P ratio >3 (Nanostar) no longer move towards the anode inan electrical field, i.e., have a zero or positive net-charge. For comparison, similar observations arealready made for l-PEI at N/P ratio >2.
Processes 2018, 6, x FOR PEER REVIEW 7 of 17
As expected, the zeta potential of the polyplexes increases with increasing N/P ratio. An N/P ratio of at least 5 is required for a full charge compensation of the DNA. When the N/P ratio is increased further, the zeta potential reaches a final value of +10 mV. As shown as example for N/P 20 in Figure 1, the hydrodynamic radius of the polyplexes changed little with incubation time. Moreover, with a value of 70.4 ± 4.5 nm the polyplexes should be well suited to transfect mammalian cells. This is different from the results shown for l-PEI polyplexes in HBG which initially was much smaller 33 nm and then increase to 130 nm after dilution [20].
Figure 1. Development of the hydrodynamic radius of the polyplexes with incubation time. White symbols: initial incubation in Hepes-buffered glucose solution (HBG), black symbols: after dilution with Opti-MEM (1 mL), N/P ratio: 20.
While the zeta potential gives an idea of the N/P ratio required for charge compensation, a direct evaluation of the polyplexes’ net-charge is possible in the gel retardation assay, Figure 2. According to this assay, polyplexes with an N/P ratio >3 (Nanostar) no longer move towards the anode in an electrical field, i.e., have a zero or positive net-charge. For comparison, similar observations are already made for l-PEI at N/P ratio >2.
Figure 2. Gel retardation of the polyplexes as a function of the N/P ratio (indicated on the top of the respective lanes).
3.2. Optimization of the Standard Transfection Protocol for Jurkat Cells
The polyplexes formed with the nanostars were then used in comparison to l-PEI as standard to transfect Jurkat cells, which served here as model cells for primary human T lymphocytes. For optimal transfection results, the cells should be rapidly dividing and in the exponential phase of growth. To assure this, standard transfection protocols call for passaging of the cells into fresh
Figure 2. Gel retardation of the polyplexes as a function of the N/P ratio (indicated on the top of therespective lanes).
3.2. Optimization of the Standard Transfection Protocol for Jurkat Cells
The polyplexes formed with the nanostars were then used in comparison to l-PEI as standard totransfect Jurkat cells, which served here as model cells for primary human T lymphocytes. For optimal
Processes 2018, 6, 188 8 of 17
transfection results, the cells should be rapidly dividing and in the exponential phase of growth.To assure this, standard transfection protocols call for passaging of the cells into fresh medium 24 hprior to transfection. For Jurkat cells, a seeding density of 0.1 × 10⁶ cells mL−1 is recommendedby the supplier (ATCC). Transfection efficiencies improved, however, by 1.8-fold (~17% to ~30%),when the cells were instead seeded at 0.05 × 10⁶ cells mL−1 and transfected 12 h afterwards.Low seeding cell densities in this range are, incidentally, also recommended in nucleofection protocolsfor T lymphocytes.
Under these conditions, the nanostar was more efficient in transfecting the Jurkat cells than l-PEI,but also significantly more toxic, Table 2. The different N/P ratios (20 for l-PEI, 10 for the nanostar)used in these experiments were chosen because they had previously been identified to be the mostsuitable for Jurkat cells in experiments involving a variant of the nanostar with 20 arms and l-PEI asreference material [11].
Table 2. Transfection of Jurkat cells from exponentially growing cultures using nanostars in comparisonto l-PEI (PEI: polyethylenimine).
Viability (%) Transfection Efficiency (%)
Total Low Producers Middle Producers High Producers
PEI 83.1 ± 3.8 7.9 ± 0.7 2.6 ± 0.1 2.4 ± 0.1 2.9 ± 0.6Nanostar 31.3 ± 11.2 57.7 ± 8.9 24.6 ± 7.8 17.3 ± 2.1 15.9 ± 1.0
Transfection volume 2.2 mL. l-PEI: 5 µg polymer, 1.9 µg pDNA, N/P 20; nanostar: 10 µg polymer, 2.1 µg pDNA,N/P 10. Shown are mean values ± SD, n ≥ 2.
In term of transfection efficiency, the results obtained here for the nanostars are better thanthe ones previously determined for nanostars of similar chemistry, [11] including some micellarconstructs [31,32], while viabilities were lower. The l-PEI results are in the expected single digit range.l-PEI was chosen because in the past it showed in our hands less cytotoxicity at equal transfectionefficiency in various cell lines. However, similar low transfection efficiency in Jurkat cells has beenreported for bPEI [9].
The typical correlation between the efficiency and the toxicity of a non-viral transfectionagent [33,34] is therefore also found in our case. It is generally considered difficult to uncouplethe two effects. However, in a recent paper [31], we have shown that independent of the N/P ratio thecytotoxicity of the transfection cocktail depends strongly on the absolute amount of polymer added.This phenomenon has been obscured in most previous investigations by the fact that the N/P ratio isadjusted by keeping the pDNA amount constant while increasing that of the polycation.
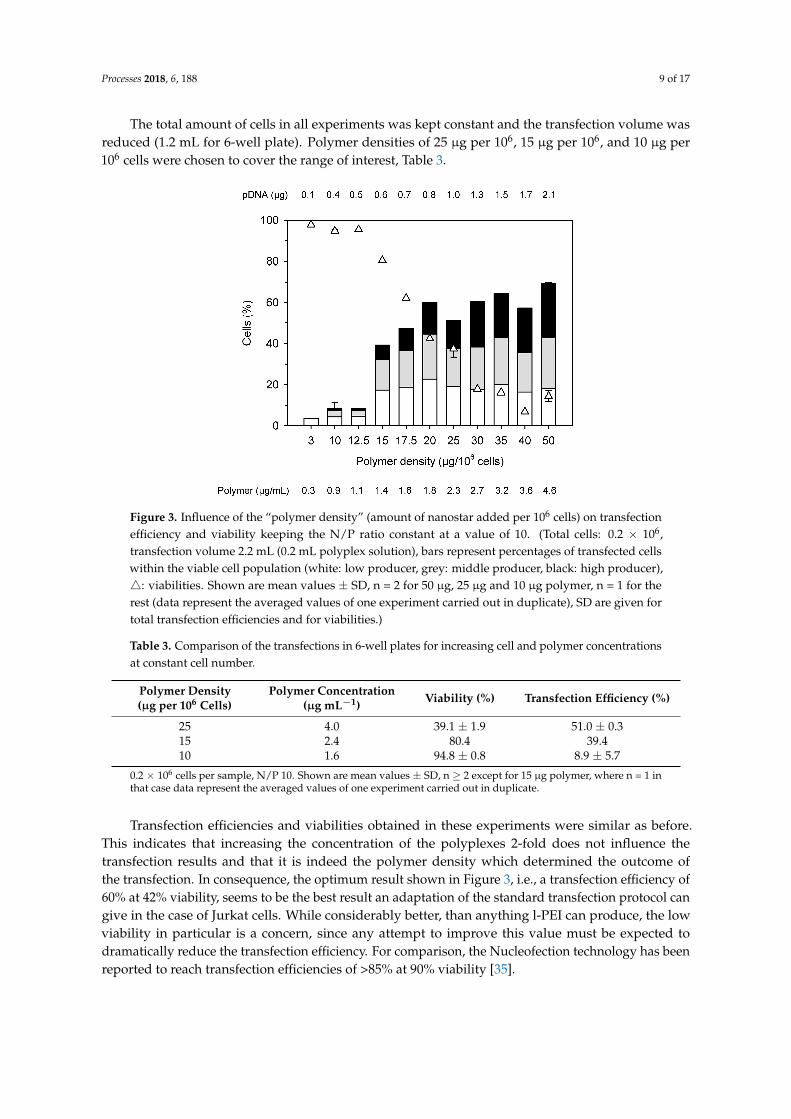
Polymer concentrations and N/P ratios in the standard protocol used here had been establishedand used with success for various mammalian cells [11]. However, in view of the low viability, Jurkatcells were subsequently transfected keeping a N/P ratio of 10 constant, but reducing the amountof added polyplex and thus the amount of polymer per cell (“polymer density”), Figure 3. Startingconditions in Figure 3, i.e., 2.1 µg pDNA per well and a polymer density of 50 µg per 106 cellscorrespond to the values in the standard protocol.
Transfection efficiency and viability show differences in their dependency on the polymer density.An optimum with >40% viable cells and a transfection efficiency of approximately 60% is reachedat N/P 10 for a polymer density of 20 µg per 106 cells. Any further reduction of the polymerdensity (at N/P 10) would increase viability at the price of significantly reducing the transfectionefficiency. Reduction of the polymer density (per cell) is linked with a dilution of the polyplexes in thetransfection volume. We can speculate that, less polyplexes (i.e., lower concentration) will lower theirfrequency of contact with the surface of cells, and thus their transfection effectiveness under normalgravitational conditions. Therefore, it was next tested whether a reduction of the transfection volume(i.e., an increase in cells and polyplexes concentration) under otherwise identical conditions wouldimprove the transfection efficiency while keeping the cytotoxicity unaffected.
Processes 2018, 6, 188 9 of 17
The total amount of cells in all experiments was kept constant and the transfection volume wasreduced (1.2 mL for 6-well plate). Polymer densities of 25 µg per 106, 15 µg per 106, and 10 µg per106 cells were chosen to cover the range of interest, Table 3.Processes 2018, 6, x FOR PEER REVIEW 9 of 17
Figure 3. Influence of the “polymer density” (amount of nanostar added per 106 cells) on transfection efficiency and viability keeping the N/P ratio constant at a value of 10. (Total cells: 0.2 × 10⁶, transfection volume 2.2 mL (0.2 mL polyplex solution), bars represent percentages of transfected cells within the viable cell population (white: low producer, grey: middle producer, black: high producer), : viabilities. Shown are mean values ± SD, n = 2 for 50 µg, 25 µg and 10 µg polymer, n = 1 for the rest (data represent the averaged values of one experiment carried out in duplicate), SD are given for total transfection efficiencies and for viabilities.)
Table 3. Comparison of the transfections in 6-well plates for increasing cell and polymer concentrations at constant cell number.
Polymer Density (µg per 106 cells)
Polymer Concentration (µg mL−1) Viability (%) Transfection Efficiency (%)
25 4.0 39.1 ± 1.9 51.0 ± 0.3 15 2.4 80.4 39.4 10 1.6 94.8 ± 0.8 8.9 ± 5.7
0.2 × 10⁶ cells per sample, N/P 10. Shown are mean values ± SD, n ≥ 2 except for 15 µg polymer, where n = 1 in that case data represent the averaged values of one experiment carried out in duplicate.
Transfection efficiencies and viabilities obtained in these experiments were similar as before. This indicates that increasing the concentration of the polyplexes 2-fold does not influence the transfection results and that it is indeed the polymer density which determined the outcome of the transfection. In consequence, the optimum result shown in Figure 3, i.e., a transfection efficiency of 60% at 42% viability, seems to be the best result an adaptation of the standard transfection protocol can give in the case of Jurkat cells. While considerably better, than anything l-PEI can produce, the low viability in particular is a concern, since any attempt to improve this value must be expected to dramatically reduce the transfection efficiency. For comparison, the Nucleofection technology has been reported to reach transfection efficiencies of >85% at 90% viability [35].
3.3. High Cell Density Transfection of Jurkat Cells
The high cell density (HCD) protocol developed here for the transfection of Jurkat cells was based on a protocol originally developed for CHO and HEK293 cells [25]. One major difference for HCD protocol is that a high density cell suspension and the pDNA are premixed and then the polycation is added. In a first condition screening experiment, the cells were transfected in Eppendorf tubes at a density of 20 × 106 cells mL−1 in Opti-MEM varying again the absolute amount of pDNA and polymer added, while keeping an N/P ratio of 10, Figure 4. The transfections were performed at
Figure 3. Influence of the “polymer density” (amount of nanostar added per 106 cells) on transfectionefficiency and viability keeping the N/P ratio constant at a value of 10. (Total cells: 0.2 × 10⁶,transfection volume 2.2 mL (0.2 mL polyplex solution), bars represent percentages of transfected cellswithin the viable cell population (white: low producer, grey: middle producer, black: high producer),4: viabilities. Shown are mean values ± SD, n = 2 for 50 µg, 25 µg and 10 µg polymer, n = 1 for therest (data represent the averaged values of one experiment carried out in duplicate), SD are given fortotal transfection efficiencies and for viabilities.)
Table 3. Comparison of the transfections in 6-well plates for increasing cell and polymer concentrationsat constant cell number.
Polymer Density(µg per 106 Cells)
Polymer Concentration(µg mL−1) Viability (%) Transfection Efficiency (%)
25 4.0 39.1 ± 1.9 51.0 ± 0.315 2.4 80.4 39.410 1.6 94.8 ± 0.8 8.9 ± 5.7
0.2 × 10⁶ cells per sample, N/P 10. Shown are mean values ± SD, n ≥ 2 except for 15 µg polymer, where n = 1 inthat case data represent the averaged values of one experiment carried out in duplicate.
Transfection efficiencies and viabilities obtained in these experiments were similar as before.This indicates that increasing the concentration of the polyplexes 2-fold does not influence thetransfection results and that it is indeed the polymer density which determined the outcome ofthe transfection. In consequence, the optimum result shown in Figure 3, i.e., a transfection efficiency of60% at 42% viability, seems to be the best result an adaptation of the standard transfection protocol cangive in the case of Jurkat cells. While considerably better, than anything l-PEI can produce, the lowviability in particular is a concern, since any attempt to improve this value must be expected todramatically reduce the transfection efficiency. For comparison, the Nucleofection technology has beenreported to reach transfection efficiencies of >85% at 90% viability [35].
Processes 2018, 6, 188 10 of 17
3.3. High Cell Density Transfection of Jurkat Cells
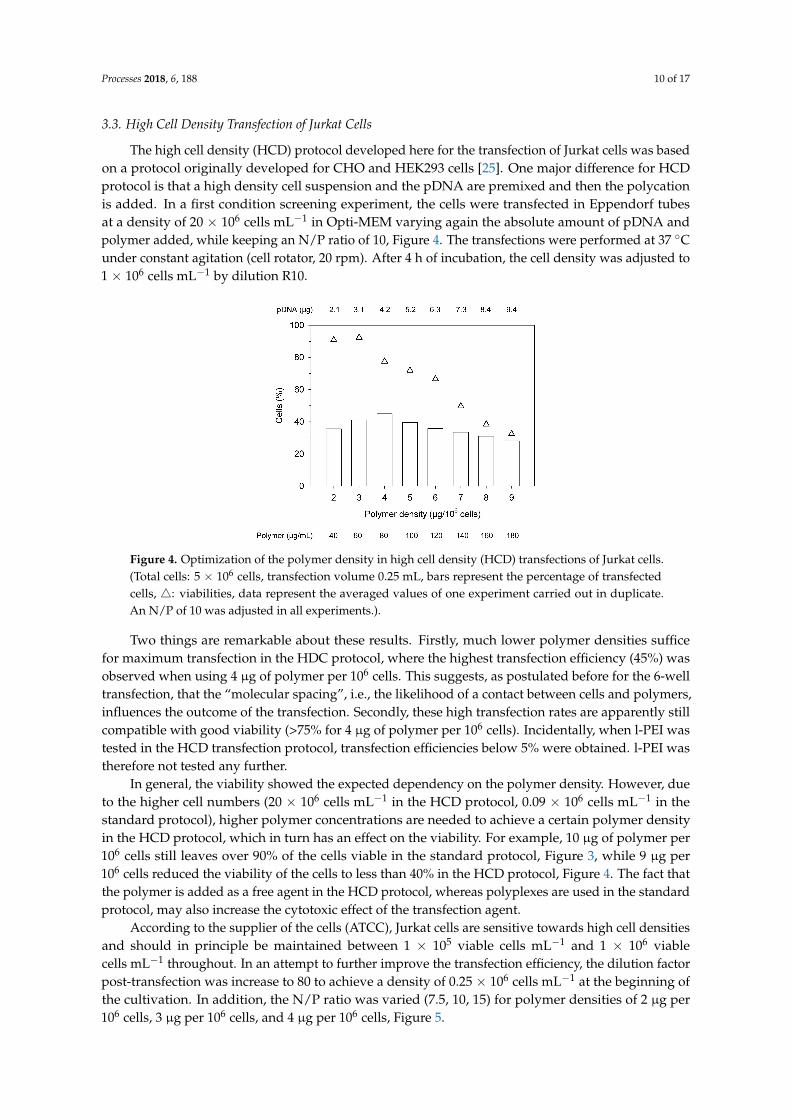
The high cell density (HCD) protocol developed here for the transfection of Jurkat cells was basedon a protocol originally developed for CHO and HEK293 cells [25]. One major difference for HCDprotocol is that a high density cell suspension and the pDNA are premixed and then the polycationis added. In a first condition screening experiment, the cells were transfected in Eppendorf tubesat a density of 20 × 106 cells mL−1 in Opti-MEM varying again the absolute amount of pDNA andpolymer added, while keeping an N/P ratio of 10, Figure 4. The transfections were performed at 37 ◦Cunder constant agitation (cell rotator, 20 rpm). After 4 h of incubation, the cell density was adjusted to1 × 106 cells mL−1 by dilution R10.
Processes 2018, 6, x FOR PEER REVIEW 10 of 17
37 °C under constant agitation (cell rotator, 20 rpm). After 4 h of incubation, the cell density was adjusted to 1 × 10⁶ cells mL−1 by dilution R10.
Figure 4. Optimization of the polymer density in high cell density (HCD) transfections of Jurkat cells. (Total cells: 5 × 10⁶ cells, transfection volume 0.25 mL, bars represent the percentage of transfected cells, : viabilities, data represent the averaged values of one experiment carried out in duplicate. An N/P of 10 was adjusted in all experiments.).
Two things are remarkable about these results. Firstly, much lower polymer densities suffice for maximum transfection in the HDC protocol, where the highest transfection efficiency (45%) was observed when using 4 µg of polymer per 106 cells. This suggests, as postulated before for the 6-well transfection, that the “molecular spacing”, i.e., the likelihood of a contact between cells and polymers, influences the outcome of the transfection. Secondly, these high transfection rates are apparently still compatible with good viability (>75% for 4 µg of polymer per 106 cells). Incidentally, when l-PEI was tested in the HCD transfection protocol, transfection efficiencies below 5% were obtained. l-PEI was therefore not tested any further.
In general, the viability showed the expected dependency on the polymer density. However, due to the higher cell numbers (20 × 106 cells mL−1 in the HCD protocol, 0.09 × 10⁶ cells mL−1 in the standard protocol), higher polymer concentrations are needed to achieve a certain polymer density in the HCD protocol, which in turn has an effect on the viability. For example, 10 µg of polymer per 106 cells still leaves over 90% of the cells viable in the standard protocol, Figure 3, while 9 µg per 106 cells reduced the viability of the cells to less than 40% in the HCD protocol, Figure 4. The fact that the polymer is added as a free agent in the HCD protocol, whereas polyplexes are used in the standard protocol, may also increase the cytotoxic effect of the transfection agent.
According to the supplier of the cells (ATCC), Jurkat cells are sensitive towards high cell densities and should in principle be maintained between 1 × 10⁵ viable cells mL−1 and 1 × 10⁶ viable cells mL−1 throughout. In an attempt to further improve the transfection efficiency, the dilution factor post-transfection was increase to 80 to achieve a density of 0.25 × 10⁶ cells mL−1 at the beginning of the cultivation. In addition, the N/P ratio was varied (7.5, 10, 15) for polymer densities of 2 µg per 106 cells, 3 µg per 106 cells, and 4 µg per 106 cells, Figure 5.
The transfection efficiencies measured 48 h post-transfection showed no statistically relevant variation in these experiments (p < 0.05), while they were higher than the ones in Figure 4. This might eventually be ascribed to a better fitness of the cells due to the lower seeding cell density post-transfection. The distribution over low, middle, and high producers is also similar. Cell viabilities were generally high (≥60%). Again, observable differences were not statistically relevant.
Figure 4. Optimization of the polymer density in high cell density (HCD) transfections of Jurkat cells.(Total cells: 5 × 10⁶ cells, transfection volume 0.25 mL, bars represent the percentage of transfectedcells, 4: viabilities, data represent the averaged values of one experiment carried out in duplicate.An N/P of 10 was adjusted in all experiments.).
Two things are remarkable about these results. Firstly, much lower polymer densities sufficefor maximum transfection in the HDC protocol, where the highest transfection efficiency (45%) wasobserved when using 4 µg of polymer per 106 cells. This suggests, as postulated before for the 6-welltransfection, that the “molecular spacing”, i.e., the likelihood of a contact between cells and polymers,influences the outcome of the transfection. Secondly, these high transfection rates are apparently stillcompatible with good viability (>75% for 4 µg of polymer per 106 cells). Incidentally, when l-PEI wastested in the HCD transfection protocol, transfection efficiencies below 5% were obtained. l-PEI wastherefore not tested any further.
In general, the viability showed the expected dependency on the polymer density. However, dueto the higher cell numbers (20 × 106 cells mL−1 in the HCD protocol, 0.09 × 10⁶ cells mL−1 in thestandard protocol), higher polymer concentrations are needed to achieve a certain polymer densityin the HCD protocol, which in turn has an effect on the viability. For example, 10 µg of polymer per106 cells still leaves over 90% of the cells viable in the standard protocol, Figure 3, while 9 µg per106 cells reduced the viability of the cells to less than 40% in the HCD protocol, Figure 4. The fact thatthe polymer is added as a free agent in the HCD protocol, whereas polyplexes are used in the standardprotocol, may also increase the cytotoxic effect of the transfection agent.
According to the supplier of the cells (ATCC), Jurkat cells are sensitive towards high cell densitiesand should in principle be maintained between 1 × 10⁵ viable cells mL−1 and 1 × 10⁶ viablecells mL−1 throughout. In an attempt to further improve the transfection efficiency, the dilution factorpost-transfection was increase to 80 to achieve a density of 0.25 × 10⁶ cells mL−1 at the beginning ofthe cultivation. In addition, the N/P ratio was varied (7.5, 10, 15) for polymer densities of 2 µg per106 cells, 3 µg per 106 cells, and 4 µg per 106 cells, Figure 5.

Processes 2018, 6, 188 11 of 17
Processes 2018, 6, x FOR PEER REVIEW 11 of 17
Figure 5. HCD transfection as a function of the N/P ratio and the polymer density. (Total cell number: 5 × 10⁶ cells, transfection volume 0.25 mL, 2 mL Eppendorf tube, amount of pDNA is given per sample. Bars represent the percentage of transfected cells, with white: low producers, grey: middle producers, black: high producers; : viabilities. Shown are mean values ± SD, n ≥ 3, SD given for total transfection efficiencies and for viabilities.)
The scale of the HCD protocol was subsequently increased to 108 cells (Falcon tube, 5 mL transfection volume) as well as to 2 × 10⁹ cells (Falcon tubes, 2 × 25 mL), all the time adjusting a polymer density of 3 µg polymer per 106 cells. To accommodate the largest transfection volume (50 mL), only the addition of the polymer to the DNA/cell mixture took place in Falcon tubes (assumed to allow more rapid mixing), while the subsequent incubation was already performed in a 100 mL spinner flask stirred continuously at 70 rpm. Only a N/P of 10 was investigated for the largest scale. Results are summarized in Table 4.
Table 4. Large scale high cell density (HCD) transfection of Jurkat cells.
Cells N/P Ratio pDNA (µg) Viability (%) Transfection Efficiency (%)
Total Low Producers
Middle Producers
High Producers
1 × 10⁸ 7.5 83.5 67.2 ± 13.9 52.7 ± 0.7 21.2 ± 3.9 20.0 ± 2.2 11.5 ± 6.9 10 62.6 72.9 ± 9.4 58.2 ± 10.9 27.6 ± 7.3 21.3 ± 4.8 9.3 ± 3.0 15 41.8 68.8 ± 20.3 50.6 ± 7.0 25.8 ± 13.9 16.9 ± 1.3 7.9 ± 5.6
2 × 10⁹ 10 1252 58.2 ± 2.1 70.0 ± 1.9 38.4 ± 0.6 23.7 ± 1.2 7.9 ± 0.5 1 × 10⁸ cells, transfection volume 5 mL, 50 mL Falcon tubes. 2 × 10⁹ cells, transfection volume 50 mL, 100 mL spinner flask. Polymer density: 3 µg per 106 cells. Polymer concentration: 60 µg mL−1. Dilution factor post-transfection: 20. Amount of pDNA is given as per sample. Shown are mean values ± SD, n ≥ 2.
Transfection efficiencies and viabilities obtained at larger scale were similar to those obtained in the corresponding small-scale experiments, Figure 5, but higher than the ones obtained during the conditions screening experiment Figure 4. Throughout, approximately 70% of the cells remained viable, out of which 70% were also transfected. The distribution over low, middle, and high producers was also similar to that of the small-scale experiments. An HCD transfection of Jurkat cells can thus be used to efficiently transfect at least up to 2 × 10⁹ Jurkat cells at a time with tolerable mortality and should easily be scalable beyond this point by keeping the polymer density at 3 µg per 106 cells. This approach may hence be convenient in the context of T cells therapy, where large number of cells need to be transiently transfected.
Figure 5. HCD transfection as a function of the N/P ratio and the polymer density. (Total cell number:5 × 10⁶ cells, transfection volume 0.25 mL, 2 mL Eppendorf tube, amount of pDNA is given persample. Bars represent the percentage of transfected cells, with white: low producers, grey: middleproducers, black: high producers; 4: viabilities. Shown are mean values ± SD, n ≥ 3, SD given fortotal transfection efficiencies and for viabilities.)
The transfection efficiencies measured 48 h post-transfection showed no statistically relevantvariation in these experiments (p < 0.05), while they were higher than the ones in Figure 4.This might eventually be ascribed to a better fitness of the cells due to the lower seeding cell densitypost-transfection. The distribution over low, middle, and high producers is also similar. Cell viabilitieswere generally high (≥60%). Again, observable differences were not statistically relevant.
The scale of the HCD protocol was subsequently increased to 108 cells (Falcon tube, 5 mLtransfection volume) as well as to 2 × 10⁹ cells (Falcon tubes, 2 × 25 mL), all the time adjustinga polymer density of 3 µg polymer per 106 cells. To accommodate the largest transfection volume(50 mL), only the addition of the polymer to the DNA/cell mixture took place in Falcon tubes (assumedto allow more rapid mixing), while the subsequent incubation was already performed in a 100 mLspinner flask stirred continuously at 70 rpm. Only a N/P of 10 was investigated for the largest scale.Results are summarized in Table 4.
Table 4. Large scale high cell density (HCD) transfection of Jurkat cells.
Cells N/P Ratio pDNA (µg) Viability (%) Transfection Efficiency (%)
Total LowProducers
MiddleProducers
HighProducers
1 × 10⁸ 7.5 83.5 67.2 ± 13.9 52.7 ± 0.7 21.2 ± 3.9 20.0 ± 2.2 11.5 ± 6.910 62.6 72.9 ± 9.4 58.2 ± 10.9 27.6 ± 7.3 21.3 ± 4.8 9.3 ± 3.015 41.8 68.8 ± 20.3 50.6 ± 7.0 25.8 ± 13.9 16.9 ± 1.3 7.9 ± 5.6
2 × 10⁹ 10 1252 58.2 ± 2.1 70.0 ± 1.9 38.4 ± 0.6 23.7 ± 1.2 7.9 ± 0.5
1× 10⁸ cells, transfection volume 5 mL, 50 mL Falcon tubes. 2× 10⁹ cells, transfection volume 50 mL, 100 mL spinnerflask. Polymer density: 3 µg per 106 cells. Polymer concentration: 60 µg mL−1. Dilution factor post-transfection: 20.Amount of pDNA is given as per sample. Shown are mean values ± SD, n ≥ 2.
Transfection efficiencies and viabilities obtained at larger scale were similar to those obtainedin the corresponding small-scale experiments, Figure 5, but higher than the ones obtained duringthe conditions screening experiment Figure 4. Throughout, approximately 70% of the cells remained

Processes 2018, 6, 188 12 of 17
viable, out of which 70% were also transfected. The distribution over low, middle, and high producerswas also similar to that of the small-scale experiments. An HCD transfection of Jurkat cells can thusbe used to efficiently transfect at least up to 2 × 10⁹ Jurkat cells at a time with tolerable mortalityand should easily be scalable beyond this point by keeping the polymer density at 3 µg per 106 cells.This approach may hence be convenient in the context of T cells therapy, where large number of cellsneed to be transiently transfected.
3.4. Adaptation of the Standard Protocol to Eppendorf Tubes
Finally, the standard protocol, originally developed for a plate-based geometry, was adapted to theEppendorf tube format. In this case, the harvested cells (stored on ice) were directly suspended in thepolyplex-in-medium suspension (0.25 mL). As a result, the polymer concentration during transfectionis 4.8-fold to 8.8-fold higher in the tubes than in the plates with 1.2 mL and 2.2 mL transfection volumes,respectively. Polymer densities of 50 µg per 106 cells, 25 µg per 106 cells, 15 µg per 106 cells, and 10 µgper 106 cells were adjusted in these experiments to cover the range of interest. The N/P ratio wasagain set to 10.
When the standard incubation time of 4 h was chosen, cells did not survive. When the incubationtime with the polyplexes was lowered to 2 h, better results were obtained, Table 5. Moreover, in allcases, a polymer density of 50 µg polymer/106 cells was too toxic for the cells.
Table 5. Transfection in Eppendorf tubes as a function of the polymer density.
Polymer Density(µg per 106 Cells)
Polymer Concentration(µg mL−1) Viability (%) Transfection Efficiency (%)
25 20 11.0 ± 9.7 64.5 ± 2.115 12 6.1 74.410 8 17.0 ± 5.5 65.4 ± 14.0
0.2 × 10⁶ cells per sample; N/P 10; incubation with polyplexes 2 h. Shown are mean values ± SD, n ≥ 2 except for15 µg polymer, where n = 1 (data represent the averaged values of one experiment carried out in duplicate).
Compared to the results for the 6-well plates (Figure 3), higher transfection efficiencies werereached, but viabilities were low. This supports our assumption that the molecular spacing during thetransfection is a relevant parameter to consider. Doubling the transfection volume to 0.5 mL, whilekeeping the polymer density constant (15 µg per 106 cells), led to an increase in viability by a factorof 7.4 (45.1%) while the transfection efficiency increased to 90.9% (12% low producer, 45% middleproducer, 34% high producer), arguing that the polymer concentration, which had served well in the6 well plate format, was too high in case of the Eppendorf tube format. Indeed, when the polymerdensity was lowered to values more typical of the HCD transfection protocol (see above), viabilitiesand transfection efficiencies improved, in particular, when the incubation time was further reduced(90 min, 30 min, 15 min), Figure 6.
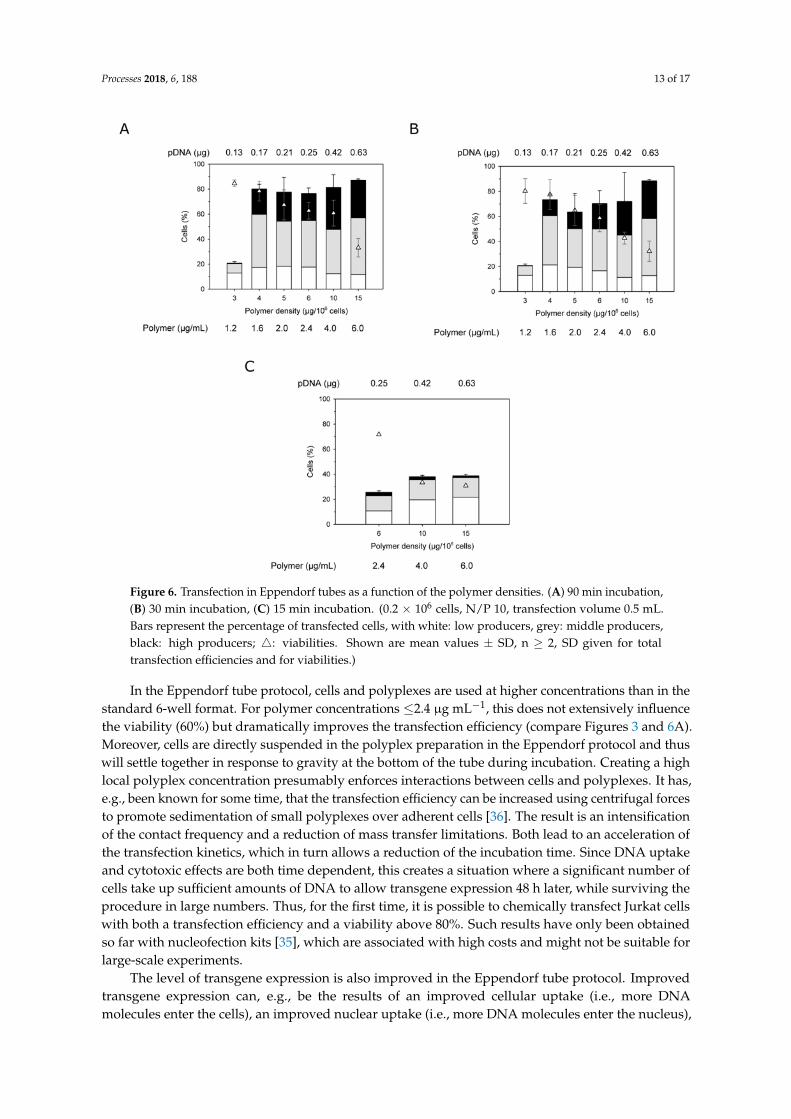
At incubation times of 30 and in particular 90 min (Figure 6A,B), low polymer densities of 5 and4 µg per 106 of cells resulted in excellent transfection efficiencies of ≥80% at viabilities of more than80%. However, an incubation time of only 15 min was obviously too short to achieve transfection,Figure 6C. The cytotoxic response, on the other hand, is very fast and can be already be detected withinthe first 15 min of incubation and might be due to plasma membrane permeabilization. Moreover,in comparison to the experiments in 6-well plates, the level of transgene expression was shiftedtowards middle and high producers, when the cells were transfected in Eppendorf tubes. Interestingly,the transfection efficiency but not the viability seemed to pass through a minimum in these experiments.Low polymer densities thus achieve good transfection efficiency, while being gentle on the cells.
Processes 2018, 6, 188 13 of 17
Processes 2018, 6, x FOR PEER REVIEW 13 of 17
Figure 6. Transfection in Eppendorf tubes as a function of the polymer densities. (A) 90 min incubation, (B) 30 min incubation, (C) 15 min incubation. (0.2 × 10⁶ cells, N/P 10, transfection volume 0.5 mL. Bars represent the percentage of transfected cells, with white: low producers, grey: middle producers, black: high producers; : viabilities. Shown are mean values ± SD, n ≥ 2, SD given for total transfection efficiencies and for viabilities.)
In the Eppendorf tube protocol, cells and polyplexes are used at higher concentrations than in the standard 6-well format. For polymer concentrations ≤2.4 µg mL−1, this does not extensively influence the viability (60%) but dramatically improves the transfection efficiency (compare Figures 3 and 6A). Moreover, cells are directly suspended in the polyplex preparation in the Eppendorf protocol and thus will settle together in response to gravity at the bottom of the tube during incubation. Creating a high local polyplex concentration presumably enforces interactions between cells and polyplexes. It has, e.g., been known for some time, that the transfection efficiency can be increased using centrifugal forces to promote sedimentation of small polyplexes over adherent cells [36]. The result is an intensification of the contact frequency and a reduction of mass transfer limitations. Both lead to an acceleration of the transfection kinetics, which in turn allows a reduction of the incubation time. Since DNA uptake and cytotoxic effects are both time dependent, this creates a situation where a significant number of cells take up sufficient amounts of DNA to allow transgene expression 48 h later, while surviving the procedure in large numbers. Thus, for the first time, it is possible to chemically transfect Jurkat cells with both a transfection efficiency and a viability above 80%. Such results have only been obtained so far with nucleofection kits [35], which are associated with high costs and might not be suitable for large-scale experiments.
The level of transgene expression is also improved in the Eppendorf tube protocol. Improved transgene expression can, e.g., be the results of an improved cellular uptake (i.e., more DNA molecules enter the cells), an improved nuclear uptake (i.e., more DNA molecules enter the nucleus), or improved transcription (i.e., the transcriptional activity of the CMV promoter is upregulated). The cellular uptake can be enhanced due to the increased frequency of contact between cells and
Figure 6. Transfection in Eppendorf tubes as a function of the polymer densities. (A) 90 min incubation,(B) 30 min incubation, (C) 15 min incubation. (0.2 × 10⁶ cells, N/P 10, transfection volume 0.5 mL.Bars represent the percentage of transfected cells, with white: low producers, grey: middle producers,black: high producers; 4: viabilities. Shown are mean values ± SD, n ≥ 2, SD given for totaltransfection efficiencies and for viabilities.)
In the Eppendorf tube protocol, cells and polyplexes are used at higher concentrations than in thestandard 6-well format. For polymer concentrations ≤2.4 µg mL−1, this does not extensively influencethe viability (60%) but dramatically improves the transfection efficiency (compare Figures 3 and 6A).Moreover, cells are directly suspended in the polyplex preparation in the Eppendorf protocol and thuswill settle together in response to gravity at the bottom of the tube during incubation. Creating a highlocal polyplex concentration presumably enforces interactions between cells and polyplexes. It has,e.g., been known for some time, that the transfection efficiency can be increased using centrifugal forcesto promote sedimentation of small polyplexes over adherent cells [36]. The result is an intensificationof the contact frequency and a reduction of mass transfer limitations. Both lead to an acceleration ofthe transfection kinetics, which in turn allows a reduction of the incubation time. Since DNA uptakeand cytotoxic effects are both time dependent, this creates a situation where a significant number ofcells take up sufficient amounts of DNA to allow transgene expression 48 h later, while surviving theprocedure in large numbers. Thus, for the first time, it is possible to chemically transfect Jurkat cellswith both a transfection efficiency and a viability above 80%. Such results have only been obtainedso far with nucleofection kits [35], which are associated with high costs and might not be suitable forlarge-scale experiments.
The level of transgene expression is also improved in the Eppendorf tube protocol. Improvedtransgene expression can, e.g., be the results of an improved cellular uptake (i.e., more DNAmolecules enter the cells), an improved nuclear uptake (i.e., more DNA molecules enter the nucleus),
Processes 2018, 6, 188 14 of 17
or improved transcription (i.e., the transcriptional activity of the CMV promoter is upregulated).The cellular uptake can be enhanced due to the increased frequency of contact between cells andpolyplexes as postulated above and might in turn lead to higher amounts of pDNA in the nucleus.The transcriptional activity of the CMV promoter used here to drive EGFP expression is sensitiveto a variety of environmental stresses (e.g., osmotic shock, oxidative stress) and can be upregulatedvia an intracellular stress-activated Mitogen-Activated Protein (MAP) kinase pathway [37]. In thepast, PEI-based polyplexes have been shown to induce the generation of reactive oxygen species(ROS) [38,39]. A similar effect by the polyplexes used in this study on the generation of ROS, couldtherefore have activated transcription via the CMV promoter. Further, the adaptation of the standardprotocol to the Eppendorf format required several changes in the cell manipulation (i.e., extendedstorage on ice, centrifugation steps), which might also influence the cell physiology.
3.5. Transfection of Primary Human T Cells
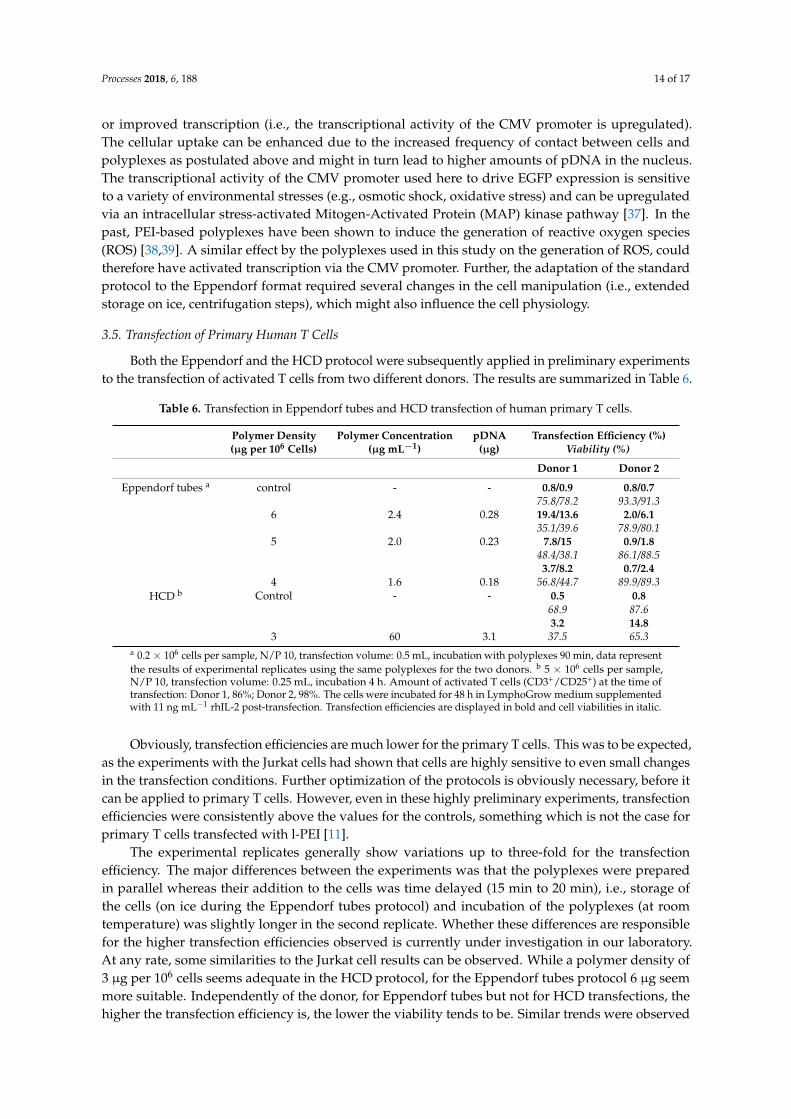
Both the Eppendorf and the HCD protocol were subsequently applied in preliminary experimentsto the transfection of activated T cells from two different donors. The results are summarized in Table 6.
Table 6. Transfection in Eppendorf tubes and HCD transfection of human primary T cells.
Polymer Density(µg per 106 Cells)
Polymer Concentration(µg mL−1)
pDNA(µg)
Transfection Efficiency (%)Viability (%)
Donor 1 Donor 2
Eppendorf tubes a control - - 0.8/0.9 0.8/0.775.8/78.2 93.3/91.3
6 2.4 0.28 19.4/13.6 2.0/6.135.1/39.6 78.9/80.1
5 2.0 0.23 7.8/15 0.9/1.848.4/38.1 86.1/88.53.7/8.2 0.7/2.4
4 1.6 0.18 56.8/44.7 89.9/89.3HCD b Control - - 0.5 0.8
68.9 87.63.2 14.8
3 60 3.1 37.5 65.3a 0.2 × 10⁶ cells per sample, N/P 10, transfection volume: 0.5 mL, incubation with polyplexes 90 min, data representthe results of experimental replicates using the same polyplexes for the two donors. b 5 × 10⁶ cells per sample,N/P 10, transfection volume: 0.25 mL, incubation 4 h. Amount of activated T cells (CD3+/CD25+) at the time oftransfection: Donor 1, 86%; Donor 2, 98%. The cells were incubated for 48 h in LymphoGrow medium supplementedwith 11 ng mL−1 rhIL-2 post-transfection. Transfection efficiencies are displayed in bold and cell viabilities in italic.
Obviously, transfection efficiencies are much lower for the primary T cells. This was to be expected,as the experiments with the Jurkat cells had shown that cells are highly sensitive to even small changesin the transfection conditions. Further optimization of the protocols is obviously necessary, before itcan be applied to primary T cells. However, even in these highly preliminary experiments, transfectionefficiencies were consistently above the values for the controls, something which is not the case forprimary T cells transfected with l-PEI [11].
The experimental replicates generally show variations up to three-fold for the transfectionefficiency. The major differences between the experiments was that the polyplexes were preparedin parallel whereas their addition to the cells was time delayed (15 min to 20 min), i.e., storage ofthe cells (on ice during the Eppendorf tubes protocol) and incubation of the polyplexes (at roomtemperature) was slightly longer in the second replicate. Whether these differences are responsiblefor the higher transfection efficiencies observed is currently under investigation in our laboratory.At any rate, some similarities to the Jurkat cell results can be observed. While a polymer density of3 µg per 106 cells seems adequate in the HCD protocol, for the Eppendorf tubes protocol 6 µg seemmore suitable. Independently of the donor, for Eppendorf tubes but not for HCD transfections, thehigher the transfection efficiency is, the lower the viability tends to be. Similar trends were observed

Processes 2018, 6, 188 15 of 17
for Jurkat cells during the optimization experiments. Finally, cells from donor 1 performed well inthe Eppendorf tube, but not in the HCD protocol, while the opposite was the case for cells fromdonor 2. Here, one should notice that the level of activation of the cells was slightly different forboth donors, Table 6. We cannot exclude that the level of activation of the T lymphocytes might beresponsible for the observed results. Beside the activation status of the T lymphocytes, cell density,pDNA dose, supplementation of the post-transfection cultivation medium with cytokines have beenrecently proposed as additional parameters that should be optimized during the development oftransfection protocols for human primary T cells [9].
4. Conclusions
It has been speculated that the inability of PEI to transfect blood cells such as T lymphocytesmight be partly related to uptake and intracellular trafficking. The polycationic transfection agentPDMAEMA, is indeed more suitable to transfect the human leukemia T cells (Jurkat cells) chosen in thisstudy as model cells for primary T lymphocytes. This might be related to a different uptake mechanismas speculated recently by our group [20]. However, in the standard transfection protocol, transfectionefficiencies >70% could only be achieved at severely reduced viabilities. Better results were obtained ina high cell density (HCD) transfection protocol, where the transfection agent (PDMAEMA-nanostar) isadded directly to the cell/pDNA mixture and where transfection efficiencies >70% are easily combinedwith viabilities >70%. Even better results (>80% transfected cells at >80% viability) were obtained in aprotocol where polyplexes were used to transfect the cells in an Eppendorf tube. Both protocols usehigher cell densities. This intensifies the interaction with the polyplexes and accelerates the transfectionkinetics, which inter alia allows lowering the amounts of polymer per 106 cells used and in consequencethe cytotoxicity of the process. Whereas the Eppendorf tube protocol could in future be used toeffectively transfect cells at small scale for research purposes, the HCD protocol has excellent scaleup potential and thus could eventually become the basis for medical applications of T cell therapies.Both protocols were tested for the transfection of primary T cells from two different donors. In thesepreliminary experiments, the obtained transfection efficiencies were lower than for the Jurkat cells,but significantly better than with l-PEI. Moreover, the cells from the two donors showed distinctdifferences in their reaction to the conditions of the protocols, which presents the starting point forfurther optimizations currently under way in our laboratory.
Author Contributions: S.A.B.R., A.R., V.J., and R.F. conceived and designed the experiments; S.A.B.R., A.R., andP.K. performed the experiments; S.A.B.R., A.R., P.K., V.J., and R.F. analyzed the data; C.V.S. synthesized andcharacterized the nanostar; V.J. and R.F. wrote the paper.
Funding: This work was funded by the Upper Franconian Trust (Oberfrankenstiftung, Bayreuth, Germany) grantP-Nr.: 03847.
Acknowledgments: Andrea Schott supported this study by purifying the plasmid. Daniel Manco andMax Puhlmann supported this study by performing some of the transfections in 6-well plates and all thepolyplexes-based transfections in Eppendorf tubes. Oliver Riester supported this study by performing some ofthe HCD transfections.
Conflicts of Interest: The authors declare no conflict of interest. The founding sponsor had no role in the designof the study; in the collection, analyses, or interpretation of data; in the writing of the manuscript, and in thedecision to publish the results.
References
1. Fischbach, M.A.; Bluestone, J.A.; Lim, W.A. Cell-based therapeutics: The next pillar of medicine. Sci. Transl. Med.2013, 5, 179ps7. [CrossRef] [PubMed]
2. Fesnak, A.D.; June, C.H.; Levine, B.L. Engineered T cells: The promise and challenges of cancer immunotherapy.Nat. Rev. Cancer 2016, 16, 566–581. [CrossRef] [PubMed]
3. Su, S.; Hu, B.; Shao, J.; Shen, B.; Du, J.; Du, Y.; Zhou, J.; Yu, L.; Zhang, L.; Chen, F. CRISPR-Cas9 mediatedefficient PD-1 disruption on human primary T cells from cancer patients. Sci. Rep. 2016, 6, 20070. [CrossRef][PubMed]
Processes 2018, 6, 188 16 of 17
4. Hardee, C.L.; Arévalo-Soliz, L.M.; Hornstein, B.D.; Zechiedrich, L. Advances in Non-Viral DNA Vectors forGene Therapy. Genes 2017, 8, 65–87. [CrossRef] [PubMed]
5. Morgan, R.A.; Boyerinas, B. Genetic Modification of T Cells. Biomedicines 2016, 4, 9–23. [CrossRef] [PubMed]6. Kanthou, C.; Kranjc, S.; Sersa, G.; Tozer, G.; Zupanic, A.; Cemazar, M. The endothelial cytoskeleton as a
target of electroporation-based therapies. Mol. Cancer Ther. 2006, 5, 3145–3152. [CrossRef] [PubMed]7. Pehlivanova, V.N.; Tsoneva, I.H.; Tzoneva, R.D. Multiple effects of electroporation on the adhesive behaviour
of breast cancer cells and fibroblasts. Cancer Cell Int. 2012, 12, 9–23. [CrossRef] [PubMed]8. McManus, M.T. Small interfering RNA-mediated gene silencing in T lymphocytes. J. Immunol. 2002, 169,
5754–5760. [CrossRef] [PubMed]9. Olden, B.R.; Cheng, Y.; Yu, J.L.; Pun, S.H. Cationic polymers for non-viral gene delivery to human T cells.
J. Control. Release 2018, 282, 140–147. [CrossRef] [PubMed]10. O’Neill, M.M.; Kennedy, C.A.; Barton, R.W.; Tatake, R.J. Receptor-mediated gene delivery to human
peripheral blood mononuclear cells using anti-CD3 antibody coupled to polyethylenimine. Gene Ther.2001, 8, 362–368. [CrossRef] [PubMed]
11. Schallon, A.; Synatschke, C.V.; Jérôme, V.; Müller, A.H.E.; Freitag, R. Nanoparticulate nonviral agent forthe effective delivery of pDNA and siRNA to differentiated cells and primary human T lymphocytes.Biomacromolecules 2012, 13, 3463–3474. [CrossRef] [PubMed]
12. Kjellen, L.; Lindahl, U. Proteoglycans: Structures and interactions. Annu. Rev. Biochem. 1991, 60, 443–475.[CrossRef] [PubMed]
13. Hess, G.T.; Humphries, W.H.T.; Fay, N.C.; Payne, C.K. Cellular binding, motion, and internalization ofsynthetic gene delivery polymers. Biochim. Biophys. Acta 2007, 1773, 1583–1588. [CrossRef] [PubMed]
14. Payne, C.K.; Jones, S.A.; Chen, C.; Zhuang, X. Internalization and trafficking of cell surface proteoglycansand proteoglycan-binding ligands. Traffic 2007, 8, 389–401. [CrossRef] [PubMed]
15. Ruponen, M.; Yla-Herttuala, S.; Urtti, A. Interactions of polymeric and liposomal gene delivery systems withextracellular glycosaminoglycans: Physicochemical and transfection studies. Biochim. Biophys. Acta 1999,1415, 331–341. [CrossRef]
16. Paris, S.; Burlacu, A.; Durocher, Y. Opposing Roles of Syndecan-1 and Syndecan-2 in Polyethyleneimine-mediatedGene Delivery. J. Biol. Chem. 2008, 283, 7697–7704. [CrossRef] [PubMed]
17. Mozley, O.L.; Thompson, B.C.; Fernandez-Martell, A.; James, D.C. A mechanistic dissection of polyethyleniminemediated transfection of CHO cells: To enhance the efficiency of recombinant DNA utilization.Biotechnol. Prog. 2014, 30, 1161–1170. [CrossRef] [PubMed]
18. Fadnes, B.; Husebekk, A.; Svineng, G.; Rekdal, Ø.; Yanagishita, M.; Kolset, S.O.; Uhlin-Hansen, L.The proteoglycan repertoire of lymphoid cells. Glycoconj. J. 2012, 29, 513–523. [CrossRef] [PubMed]
19. Verdurmen, W.P.; Wallbrecher, R.; Schmidt, S.; Eilander, J.; Bovee-Geurts, P.; Fanghanel, S.; Burck, J.;Wadhwani, P.; Ulrich, A.S.; Brock, R. Cell surface clustering of heparan sulfate proteoglycans by amphipathiccell-penetrating peptides does not contribute to uptake. J. Control. Release 2013, 170, 83–91. [CrossRef][PubMed]
20. Raup, A.; Wang, H.; Synatschke, C.V.; Jérôme, V.; Agarwal, S.; Pergushov, D.V.; Müller, A.H.E.; Freitag, R.Compaction and Transmembrane Delivery of pDNA: Differences between l-PEI and Two Types ofAmphiphilic Block Copolymers. Biomacromolecules 2017, 18, 808–818. [CrossRef] [PubMed]
21. Huls, M.H.; Figliola, M.J.; Dawson, M.J.; Olivares, S.; Kebriaei, P.; Shpall, E.J.; Champlin, R.E.; Singh, H.;Cooper, L.J.N. Clinical Application of Sleeping Beauty and Artificial Antigen Presenting Cells to GeneticallyModify T Cells from Peripheral and Umbilical Cord Blood. J. Vis. Exp. 2013, 72, e50070. [CrossRef] [PubMed]
22. Potter, H.; Heller, R. Transfection by Electroporation. Curr. Protoc. Mol. Biol. 2003, 121, 9.3.1–9.3.13. [CrossRef]23. Backliwal, G.; Hildinger, M.; Hasija, V.; Wurm, F.M. High-density transfection with HEK-293 cells allows
doubling of transient titers and removes need for a priori DNA complex formation with PEI. Biotechnol. Bioeng.2008, 99, 721–727. [CrossRef] [PubMed]
24. Baldi, L.; Hacker, D.L.; Meerschman, C.; Wurm, F.M. Large-scale transfection of mammalian cells.Methods Mol. Biol. 2012, 801, 13–26. [CrossRef] [PubMed]
25. Derouazi, M.; Girard, P.; Van Tilborgh, F.; Iglesias, K.; Muller, N.; Bertschinger, M.; Wurm, F.M. Serum-freelarge-scale transient transfection of CHO cells. Biotechnol. Bioeng. 2004, 87, 537–545. [CrossRef] [PubMed]

Processes 2018, 6, 188 17 of 17
26. Chen, B.; Synatschke, C.V.; Jérôme, V.; Müller, A.H.E.; Freitag, R.; Wu, C. Co-transfection of star-shapedPDMAEMAs enhance transfection efficiency of protamine/pDNA complexes in the presence of serum.Eur. Pol. J. 2018, 103, 362–369. [CrossRef]
27. Durocher, Y.; Perret, S.; Kamen, A. High-level and high-throughput recombinant protein production bytransient transfection of suspension-growing human 293-EBNA1 cells. Nucleic Acids Res. 2002, 30, E9.[CrossRef] [PubMed]
28. Jérôme, V.; Werner, M.; Kaiser, P.; Freitag, R. Creating a Biomimetic Microenvironment for the Ex VivoExpansion of Primary Human T Lymphocytes. Macromol. Biosci. 2017, 17, 1700091. [CrossRef] [PubMed]
29. dos Santos, T.; Varela, J.; Lynch, I.; Salvati, A.; Dawson, K.A. Effects of transport inhibitors on the cellularuptake of carboxylated polystyrene nanoparticles in different cell lines. PLoS ONE 2011, 6, e24438. [CrossRef][PubMed]
30. Van Gaal, E.V.; Spierenburg, G.; Hennink, W.E.; Crommelin, D.J.; Mastrobattista, E. Flow cytometry for rapidsize determination and sorting of nucleic acid containing nanoparticles in biological fluids. J. Control. Release2010, 141, 328–338. [CrossRef] [PubMed]
31. Raup, A.; Stahlschmidt, U.; Jérôme, V.; Synatschke, C.V.; Müller, A.H.E.; Freitag, R. Influence of polyplexformation on the performance of star-shaped polycationic transfection agents for mammalian cells. Polymers2016, 8, 224–240. [CrossRef]
32. Raup, A.; Jérôme, V.; Freitag, R.; Synatschke, C.V.; Müller, A.H.E. Promoter, transgene, and cell line effects inthe transfection of mammalian cells using PDMAEMA-based nano-stars. Biotechnol. Rep. 2016, 11, 53–61.[CrossRef] [PubMed]
33. Breunig, M.; Lungwitz, U.; Liebl, R.; Goepferich, A. Breaking up the correlation between efficacy and toxicityfor nonviral gene delivery. Proc. Natl. Acad. Sci. USA 2007, 104, 14454–14459. [CrossRef] [PubMed]
34. Synatschke, C.V.; Schallon, A.; Jérôme, V.; Freitag, R.; Müller, A.H.E. Influence of polymer architecture andmolecular weight of poly(2-(dimethylamino)ethyl methacrylate) polycations on transfection efficiency andcell viability in gene delivery. Biomacromolecules 2011, 12, 4247–4255. [CrossRef] [PubMed]
35. Chicaybam, L.; Barcelos, C.; Peixoto, B.; Carneiro, M.; Limia, C.G.; Redondo, P.; Lira, C.; Paraguassú-Braga, F.;Vasconcelos, Z.F.M.D.; Barros, L.; et al. An Efficient Electroporation Protocol for the Genetic Modification ofMammalian Cells. Front. Bioeng. Biotechnol. 2016, 4, 99. [CrossRef] [PubMed]
36. Boussif, O.; Lezoualc’h, F.; Zanta, M.A.; Mergny, M.D.; Scherman, D.; Demeneix, B.; Behr, J.P. A versatilevector for gene and oligonucleotide transfer into cells in culture and in vivo: Polyethylenimine. Proc. Natl.Acad. Sci. USA 1995, 92, 7297–7301. [CrossRef] [PubMed]
37. Bruening, W.; Giasson, B.; Mushynski, W.; Durham, H.D. Activation of stress-activated MAP proteinkinases up-regulates expression of transgenes driven by the cytomegalovirus immediate/early promoter.Nucleic Acids Res. 1998, 26, 486–489. [CrossRef] [PubMed]
38. Lee, M.S.; Kim, N.W.; Lee, K.; Kim, H.; Jeong, J.H. Enhanced transfection by antioxidative polymeric genecarrier that reduces polyplex-mediated cellular oxidative stress. Pharm. Res. 2013, 30, 1642–1651. [CrossRef][PubMed]
39. Wang, L.-H.; Wu, T.; Wu, D.-C.; You, Y.-Z. Bioreducible Gene Delivery Vector Capable of Self-Scavengingthe Intracellular-Generated ROS Exhibiting High Gene Transfection. ACS Appl. Mater. Interfaces 2016, 8,19238–19244. [CrossRef] [PubMed]
© 2018 by the authors. Licensee MDPI, Basel, Switzerland. This article is an open accessarticle distributed under the terms and conditions of the Creative Commons Attribution(CC BY) license (http://creativecommons.org/licenses/by/4.0/).


