Embed Size (px)
Citation preview

Non-Invasive Scanning and Subtle Energy Testing Lab
© Psy-Tek Labs | 741 Garden View Court | Suite 209 | Encinitas, CA 92024 | 760.733.6000 P: 1
Pilot Project on the effects of Biofield Healing on Participant Suffering
from Fibromyalgia
Dates of Study: January 31 – February 2, 2018
Location: Psy-Tek Labs Encinitas, California
Investigators: Gaétan Chevalier, Ph.D., Research Director (Bio in Appendix A)
Cheryl Corhn, Subtle Energy Researcher (Bio in Appendix B)
Abstract:
One older female was tested on the EPI/GDV (Electro-Phonic Imaging/Gas Discharge
Visualization) device before and after Biofield Healing and for the next two days after
the healing. Parameters looked at were: Area, Symmetry, Activation Coefficient, Radial
Charts and Virtual Chakras.
Based on the preliminary information obtained on one subject suffering from
fibromyalgia with the EPI/GDV, the conclusion is that the Sponsor’s Biofield Healing
technique, as used by the Sponsor, was successful at improving the subject’s biofield
energy by at least 50% and improving biofield symmetry by 18%, both significant results
(10% being considered the threshold for significance). Improvement in biofield balance
continued to improve the next day.

Non-Invasive Scanning and Subtle Energy Testing Lab
© Psy-Tek Labs | 741 Garden View Court | Suite 209 | Encinitas, CA 92024 | 760.733.6000 P: 2
1. GOAL
To determine the effects of Biofield Healing as practiced by the Sponsor on the biofield of a person suffering from severe fibromyalgia that did not respond well to allopathic medical treatments. The biofield was measured using Electro-Photon Imaging/Gaseous Discharge Visualization (EPI/GDV). 2. BIOFIELD MEASURING SYSTEM
The Electro-Photon Imaging (EPI), also known as Gas Discharge Visualization (GDV),
is an advanced form of Kirlian photography device developed by Dr. Konstantin
Korotkov. This technology produces an electric impulse, which generates a response of
the subject in the form of electron & photon emission. The glow of the photon radiation
owing to the gas discharge generated from the electromagnetic field is captured by a
digital camera and processed by sophisticated software where a report can be
generated. Subjects were required to put each fingertip on a quartz plate and an image
displaying the photons emissions is then analyzed according to notions from the Korean
Su Jok meridian system as well as Mendel system. Figure 1 shows a picture of the GDV
device used in this study to measure each finger separately. Figure 2 shows an image
of a fingerprint and the corresponding “aura” or glow around the body as processed by
the GDV/EPI software from the fingers’ glow. The software takes the photonic emission
of the each of the ten fingertips and divided it in many sectors according to these
meridian systems for further analysis as shown in Figure 3.
Figure 1: Photograph of GDV Camera pro version 3 designed for measuring one finger at a time.

Non-Invasive Scanning and Subtle Energy Testing Lab
© Psy-Tek Labs | 741 Garden View Court | Suite 209 | Encinitas, CA 92024 | 760.733.6000 P: 3
Figure 2: Example of EPI/GDV image captures: A) photonic emissions captured from a fingertip; B)
photonic emission interpretation by GDV software; C) biofield analysis based on photonic discharge and
the Korean Su Jok meridian system.
Figure 3: Software analysis of photonic emissions with respect to Su Jok and Mendel systems.
1R1L
2R2L
3R3L
4R4L
5R5L
Head Zone Head Zone
Eye Eye
Nose, Ear
Jaw Jaw
Eye
Jaw
Eye
Jaw
Throat, Tonsils, TharoidThroat, Tonsils, Tharoid
Transverse Transverse
Ascending
Appendix
Ceccum
Coccyx
SacralSacral
Lumbar Spine
Dorsal Spine
Cervical SpineDescending
Sigmoid
Rectum
Head Zone Head Zone
Thorax Zone
Lymph
Abdominal Zone
Kidney Liver
Heart
Blood
CirculationBlood
Circulation
Heart
Pineal Gland Pineal Gland
Endocrine
System
SpleenSpleen
Uro-Genital System Uro-Genital System
Coronary Vessels Coronary Vessels
Ileum DuodenumHeart
KidneyJejunum
Respiratory System
Small intestineHeart
Kidney
Respiratory System
Kidney Liver

Non-Invasive Scanning and Subtle Energy Testing Lab
© Psy-Tek Labs | 741 Garden View Court | Suite 209 | Encinitas, CA 92024 | 760.733.6000 P: 4
3. SUBJECT & TEST PROTOCOL
a) Subject:
The subject was a 69 years female enrolled into this project by the Sponsor. Before the
Biofield Healing session, she complained of aches and pains moving from location to
location all over the body and of very low energy.
b) Experimental Protocol:
The subject signed an informed consent form explaining the project in detail before her
participation. Then both the subject and the Sponsor were measured on the GDV before
the Biofield Healing session. These measurements were repeated immediately after the
healing session. The subject came back the next day and the day after at the same time
of the day to be measured again with the GDV.
The GDV measurements provided the following biofield parameters from the photonic
emissions measured around the fingers:
1. Area
Area definition: The Area represents the overall strength and coherence of
the energy emissions of the biofield as emitted from the corona discharge
around the finger tips. The normative range is considered healthy above
14,000; and a change of more than 10% is considered significant.
2. Symmetry
Symmetry definition: The Symmetry of the emission area measures the
uniformity of the biofield as emitted from the left and right sides. The
normative ranges for Symmetry are: > 80%; and Left and Right difference
of less than 10%.
3. Activation Coefficient:
AC definition: AC is the measure of physical stress of the body -- the
higher the number the greater the stress in the body. The normative
ranges for low, average and highs of the Activation Coefficients are as
follows:
Pink range = 0 – 2.0
Green range = > 2.0 – 4.0

Non-Invasive Scanning and Subtle Energy Testing Lab
© Psy-Tek Labs | 741 Garden View Court | Suite 209 | Encinitas, CA 92024 | 760.733.6000 P: 5
Yellow range = > 4.0
Also results from radial charts and virtual chakras are presented. Explanations about
these are provided in figures’ captions.
4. RESULTS
The 4 images of Figure 4 show the subject’s Energy Field (biofield) of each finger as a
composite image of colors (light blue = most intense glow; golden yellow = least intense
glow) around the body before the Biofield Healing session. Information in Figure 4 was
taken without filter and so it includes contributions to the biofield made by the physical
body and psycho-emotional/spiritual information of the subject. Figure 4 presents values
of Area and Symmetry before the Biofield Healing session, immediately after the
session, the next day and the day after the next day. The subject came in with an Area
of 13,493 which is considered low. Not surprisingly the subject was not feeling good and
complain of pain and aches at different locations on the body.
Immediately after the treatment a 50% improvement in the Energy Field picture
(correlating with the biofield) and 18% improvement in symmetry were observed. These
changes are very significant especially in light of the fact that 10 % is considered
significant. Both the Energy Field and symmetry continued to improve the next day, the
Area becoming 67% greater than it was at the beginning and symmetry improving by
21%. The next day (2 days after the Biofield Healing session), the Area remained
excellent (47% larger than at the beginning) and the symmetry remained excellent at
92%.

Non-Invasive Scanning and Subtle Energy Testing Lab
© Psy-Tek Labs | 741 Garden View Court | Suite 209 | Encinitas, CA 92024 | 760.733.6000 P: 6
Baseline After Session
One Day Two Days
Figure 4: Subject’s baseline frontal body Area values taken without filter (including components of the
physical body and psycho-emotional/spiritual information from the subject). The Energy Field (biofield)
picture on the upper left side, taken before the session, has an Area of 13,493 (in camera pixels) and a
Symmetry of 76%. The picture on the upper right side has an Area of 20,248 (an increase by 50%) and a
Symmetry of 90% (an increase by 18%). The lower left picture was taken the next day at the same time
Non-Invasive Scanning and Subtle Energy Testing Lab
© Psy-Tek Labs | 741 Garden View Court | Suite 209 | Encinitas, CA 92024 | 760.733.6000 P: 7
while the picture on the lower right side was taken 2 days later, also at the same time of the day. The
lower left picture has an Area of 21,122 (an increase by 57% from the picture taken before the session)
and a symmetry of 93% (an increase in symmetry by 22% from the picture taken before the session)
while the picture on the lower right side has an Area of 18,491 (an increase by 37% from the picture taken
before the session) and a symmetry of 90% (an increase in symmetry by 18% from the picture taken
before the session). Area presents the overall strength and coherence of the biofield as emitted from the
corona discharge around the finger tips. The normative range is considered healthy above 14,000; and a
change of more than 10% is considered significant. The normative range for Symmetry is greater than
80%.
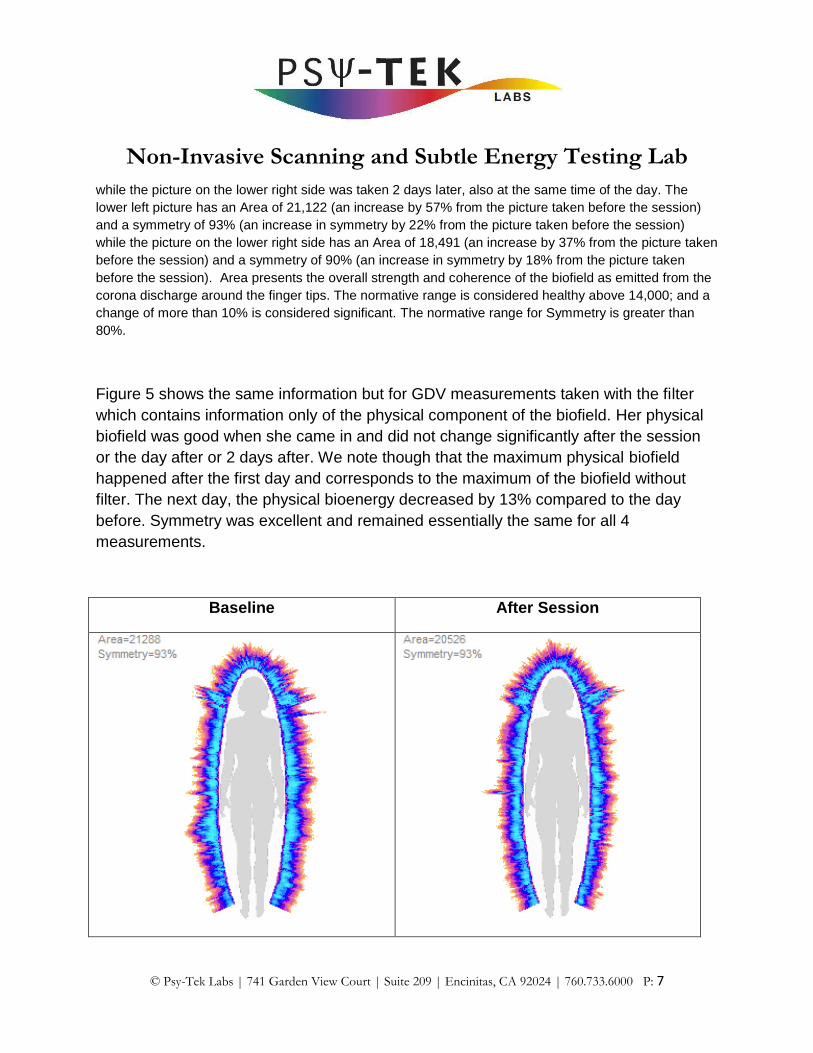
Figure 5 shows the same information but for GDV measurements taken with the filter
which contains information only of the physical component of the biofield. Her physical
biofield was good when she came in and did not change significantly after the session
or the day after or 2 days after. We note though that the maximum physical biofield
happened after the first day and corresponds to the maximum of the biofield without
filter. The next day, the physical bioenergy decreased by 13% compared to the day
before. Symmetry was excellent and remained essentially the same for all 4
measurements.
Baseline After Session

Non-Invasive Scanning and Subtle Energy Testing Lab
© Psy-Tek Labs | 741 Garden View Court | Suite 209 | Encinitas, CA 92024 | 760.733.6000 P: 8
One Day Two Days
Figure 5: Subject’s baseline frontal body Area values taken with filter (keeping only the physical
component information of the biofield from the subject). The Energy Field (biofield) picture on the upper
left side, taken before the session, has an Area of 21,288 (in camera pixels) and a Symmetry of 93%. The
picture on the upper right side has an Area of 20,526 (a decrease by 4%) and the Symmetry remained at
93%. The lower left picture was taken the next day at the same time while the picture on the lower right
side was taken 2 days later, also at the same time of the day. The lower left picture has an Area of 22,551
(an increase by 6% from the picture taken before the session) and a symmetry of 92% (a decrease in
symmetry by 1% from the picture taken before the session) while the picture on the lower right side has
an Area of 19,921 (a decrease by 6% from the picture taken before the session) and a symmetry of 92%
(a decrease in symmetry by 1% from the picture taken before the session). Area presents the overall
strength and coherence of the biofield as emitted from the corona discharge around the finger tips. The
normative range is considered healthy above 14,000; and a change of more than 10% is considered
significant. The normative range for Symmetry is greater than 80%.

Non-Invasive Scanning and Subtle Energy Testing Lab
© Psy-Tek Labs | 741 Garden View Court | Suite 209 | Encinitas, CA 92024 | 760.733.6000 P: 9
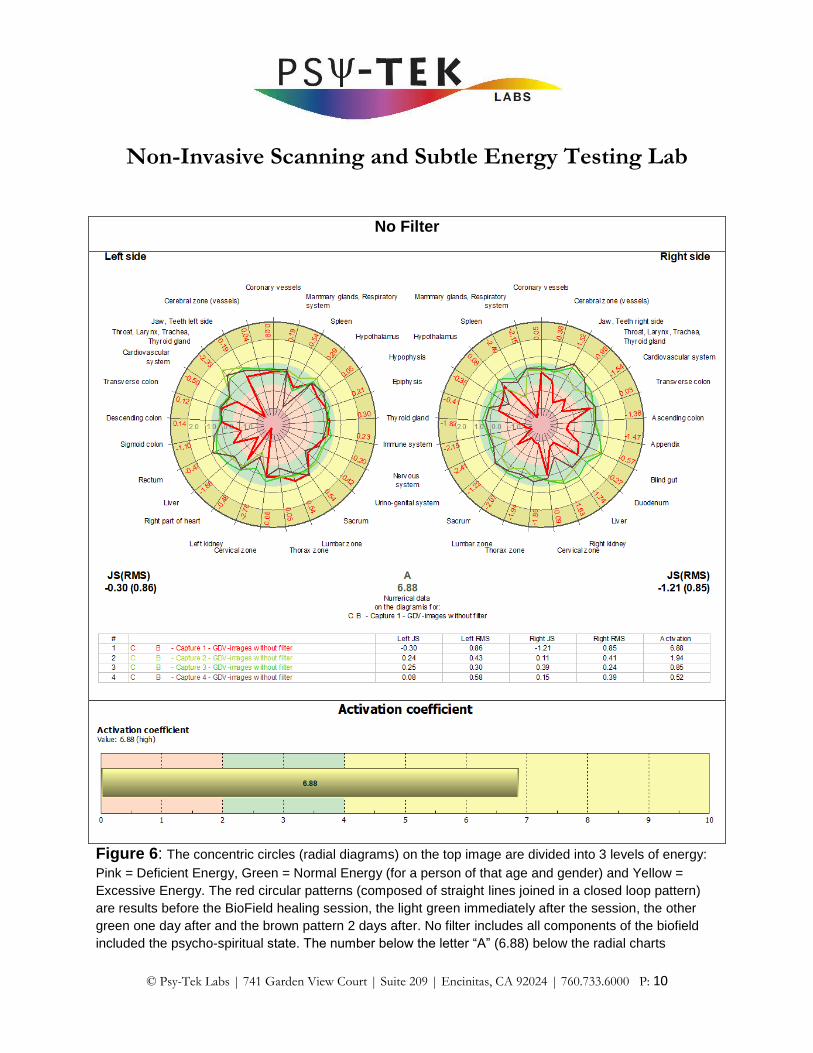
The two radial diagrams (Left side and Right side) in each of Figures 6 and 7 show
subject’s energy levels for many organs before, immediately after, and one and two
days after a Biofield Healing session without filter (Figure 6) and with filter (Figure 7).
On Figure 6, the bar graph below the radial diagrams is an example of the range of the
activation coefficient (number below the letter A in the middle, below the radial charts)
which is a measure of stress.
It can be observed from Figure 6 that initially the subject’s biofield was very low on the
left radial chart for several regions such as the throat (including larynx, trachea and
thyroid gland), sigmoid colon, liver, and left kidney. On the right side there was low
biofield for mammary glands (including the respiratory system), the spleen, the thyroid
gland, the immune system, the sacrum, the lumbar zone, the thorax zone, the right
kidney, the liver, the appendix, the ascending colon, the cardiovascular system, the
region of the throat (including larynx, trachea and thyroid gland) the jaw (which includes,
teeth on the right side). We see from Figure 6 that the biofield of these regions became
normal (in the green zone) or even above normal (yellow zone) for some body regions
such as the throat (including larynx, trachea and thyroid gland) on both sides. Then on
the second day, two regions became low again (spleen on the left side; and right and
left kidneys). Since these readings were taken without filter, they reflect mainly the
psycho-spiritual and emotional condition of the subject at the time of measurement and
not her physical condition which is shown in Figure 7. That figure shows her physical
biofield was normal or in excess all the time. The excess was quite obvious on the left
side for the throat (including larynx, trachea and thyroid gland). This indicates that
biofield energy accumulate because it is blocked or needed.
Non-Invasive Scanning and Subtle Energy Testing Lab
© Psy-Tek Labs | 741 Garden View Court | Suite 209 | Encinitas, CA 92024 | 760.733.6000 P: 10
No Filter
Figure 6: The concentric circles (radial diagrams) on the top image are divided into 3 levels of energy:
Pink = Deficient Energy, Green = Normal Energy (for a person of that age and gender) and Yellow =
Excessive Energy. The red circular patterns (composed of straight lines joined in a closed loop pattern)
are results before the BioField healing session, the light green immediately after the session, the other
green one day after and the brown pattern 2 days after. No filter includes all components of the biofield
included the psycho-spiritual state. The number below the letter “A” (6.88) below the radial charts

Non-Invasive Scanning and Subtle Energy Testing Lab
© Psy-Tek Labs | 741 Garden View Court | Suite 209 | Encinitas, CA 92024 | 760.733.6000 P: 11
presents the Activation Coefficient and is a measure of stress. The numbers immediately below the
activation coefficient “A” are data for each of the 4 measurements. The bar graph at the bottom shows as
an example that the A value of 6.88 is well above the normal range (green area between 2 and 4). We
can see that the red pattern had many deficiencies (i.e. many lines in the pink regions) that changed to be
in the normal region after the session and remained in that normal region one day and 2 days after the
session. There were a few lines touching slightly the yellow region which is a minor excess that would
need more data to determine if this is temporary or a permanent pattern.
With Filter
Figure 7: The concentric circles (radial diagrams) on the top image are divided into 3 levels of energy:
Pink = Deficient Energy, Green = Normal Energy (for a person of that age and gender) and Yellow =
Excessive Energy. The blue circular patterns (composed of straight lines joined in a closed loop pattern)
are results before the BioField healing session, the light brown immediately after the session, the purple
one day after and the brown pattern 2 days after. With filter includes only components of the biofield from
the physical body. The number below the letter “A” (6.88) below the radial charts presents the Activation
Coefficient and is a measure of stress. The numbers immediately below the activation coefficient “A” are
data for each of the 4 measurements. We can see no deficiencies except a small deficiency for the

Non-Invasive Scanning and Subtle Energy Testing Lab
© Psy-Tek Labs | 741 Garden View Court | Suite 209 | Encinitas, CA 92024 | 760.733.6000 P: 12
spleen on the left side (brown line in the pink region) that is minor and may be a temporary condition.
There were a few lines going into the yellow region, the most obvious being throat, larynx, trachea and
thyroid gland on the left side which. However, this could be a temporary situation that would need to be
checked periodically for persistence in order to consider this a region of interest.
The next 4 figures present subject’s chakras energy levels and balance before (Figure
8) and immediately after (Figure 9) the Biofield Healing session, and 1 day (Figure 10)
and 2 days (Figure 11) after the session. As expected (from her biofield reading of
Figure 4 and her radial diagrams of Figure 6 before the session) her chakras have
below normal energy activity (except for Ajna and Sahasrara or Crown) and they are out
of balance (except for the 3 upper chakras). These results indicate poor energy and a
lot of imbalances in her energy.
Figure 8: For all three graphs in the image above, the normal position is contained within the green
regions. The size of the balls in the larger left diagram indicates the relative energy activity level from
each chakra (the values determining the ball sizes are shown in the upper right graph entitled “Energy

Non-Invasive Scanning and Subtle Energy Testing Lab
© Psy-Tek Labs | 741 Garden View Court | Suite 209 | Encinitas, CA 92024 | 760.733.6000 P: 13
activity level”). Balance is represented by the position of the balls in the left diagram. In this diagram,
when the balls are left of the middle-dotted line (representing the right side of the subject), this position
indicates a physical, masculine focus and when the balls are on the right (left side of the subject), an
emotional, feminine focus is indicated. The values determining the position of the chakras in the left
diagram are plotted on the lower right graph entitled “Psychological priority”. In the case of this subject
before the Biofield Healing session, her chakras were out of balance except for the 3 upper chakras
Sahasrara (crown chakra), the Ajna (third eye, relates to mental focus) and Vishuddha (throat chakras).
After the session her chakras’ activity (energy) and balance improved markedly (Figure 9) with
all chakras having normal activity levels and all but one (Vishuddha or Throat chakra) being in
the normal region for balance.
Figure 9: After the Biofield Healing session, there is a marked improvement in balance for most of the
chakras (except the Vishuddha) and the energy activity level has increased for most chakras (except the
Ajna which became more similar to the others).
The next day, the chakra alignment improved to the point of being close to perfect (the
most out of balance, the Manipura – the navel chakra being only at 11% out of balance)

Non-Invasive Scanning and Subtle Energy Testing Lab
© Psy-Tek Labs | 741 Garden View Court | Suite 209 | Encinitas, CA 92024 | 760.733.6000 P: 14
and this excellent balance continued the next day, except for Svadhisthana which was
at 58% of the line where balance would be considered abnormal. For those days,
chakras’ bioenergy (Energy Activity Level) was in the normal (green) region.
Figure 10: One day after the Biofield session, the balance became almost perfect and the energy
activity became similar in all chakras an indication of optimal flow of energy between the chakras.
Non-Invasive Scanning and Subtle Energy Testing Lab
© Psy-Tek Labs | 741 Garden View Court | Suite 209 | Encinitas, CA 92024 | 760.733.6000 P: 15
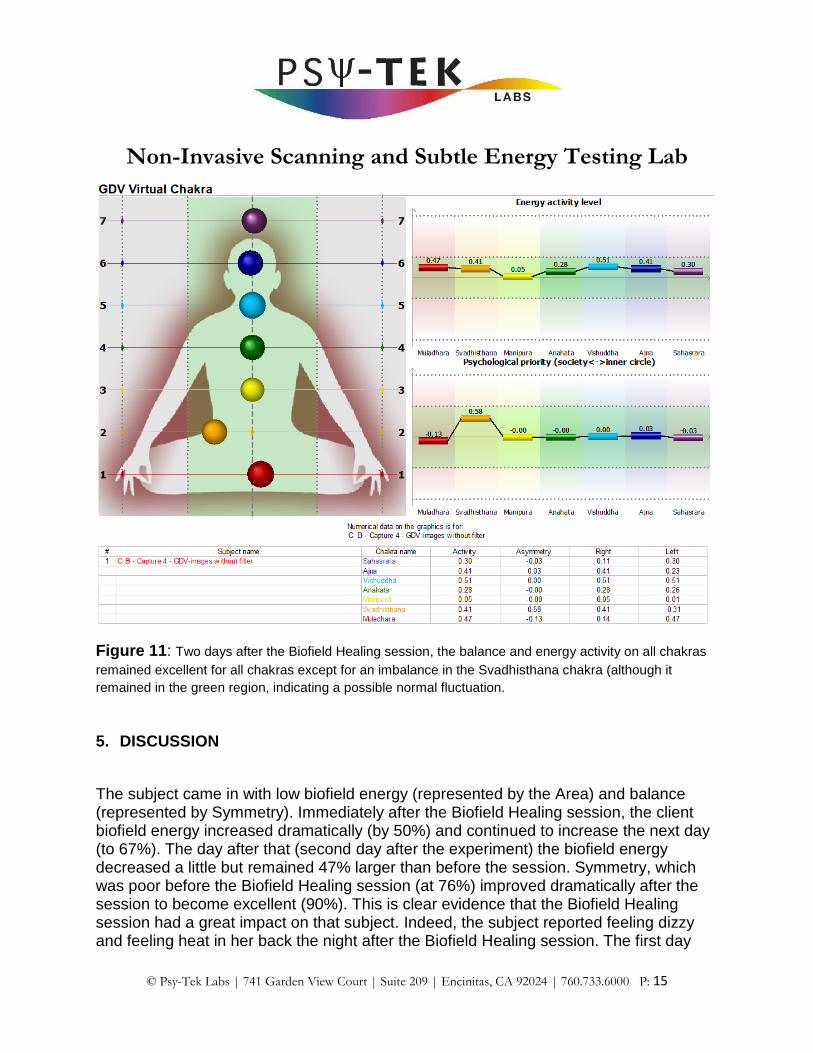
Figure 11: Two days after the Biofield Healing session, the balance and energy activity on all chakras
remained excellent for all chakras except for an imbalance in the Svadhisthana chakra (although it
remained in the green region, indicating a possible normal fluctuation.
5. DISCUSSION
The subject came in with low biofield energy (represented by the Area) and balance (represented by Symmetry). Immediately after the Biofield Healing session, the client biofield energy increased dramatically (by 50%) and continued to increase the next day (to 67%). The day after that (second day after the experiment) the biofield energy decreased a little but remained 47% larger than before the session. Symmetry, which was poor before the Biofield Healing session (at 76%) improved dramatically after the session to become excellent (90%). This is clear evidence that the Biofield Healing session had a great impact on that subject. Indeed, the subject reported feeling dizzy and feeling heat in her back the night after the Biofield Healing session. The first day

Non-Invasive Scanning and Subtle Energy Testing Lab
© Psy-Tek Labs | 741 Garden View Court | Suite 209 | Encinitas, CA 92024 | 760.733.6000 P: 16
after the session, the subject reported having a detox reaction all day – feeling very sore muscles and fatigue as well as pain in her back and knees and feeling continued heat in her back. This is the day where the alignment of the chakras was the best and the flow of biofield energy was at its maximum. The second day, she felt great, very little back pain, feeling energized and a slight itchy rash on her chest when she woke up.
6. CONCLUSIONS
Based on the results obtained with one subject, the preliminary information obtained
with the EPI/GDV, the Sponsor’s Biofield Healing technique, as used by the Sponsor,
was successful at improving the subject’s biofield energy by at least 50% and improving
biofield symmetry by 18%, both significant results (10% being considered the threshold
for significance). Improvement in biofield energy balance continued for one day after the
Biofield Healing session.
The results of this pilot project are very encouraging and warrant the design of a larger
study with more subjects and perhaps additional variables and equipment. For example,
we can look at the effect on the autonomic nervous system using heart rate variability
(HRV) and at the cardiovascular system using sophisticated digital pulse analysis.
Another possibility is to monitor brain function before, during, and after the Biofield
Healing session using neuroimaging. A third possibility is to monitor changes in
inflammation using medical thermal imaging.

Non-Invasive Scanning and Subtle Energy Testing Lab
© Psy-Tek Labs | 741 Garden View Court | Suite 209 | Encinitas, CA 92024 | 760.733.6000 P: 17
APPENDIX A
Gaétan Chevalier, Ph.D.,
Biographical Sketch
Dr. Gaétan Chevalier received his Ph.D. from the University of Montréal in Atomic Physics and Laser Spectroscopy in 1988. After 4 years of research at UCLA in the field of nuclear fusion, he became professor and Director of Research at the California Institute for Human Science (CIHS) in 1993 where, for 10 years, he conducted research projects on human physiology and electrophysiology as well as being Director of the Life Physics Department and Research Director. Dr. Chevalier is currently Lead Faculty at CIHS, Visiting Scholar in the Department of Family Medicine and Public Health at UCSD, and he has been Director of Research at Psy-Tek Labs since June 2010.

Non-Invasive Scanning and Subtle Energy Testing Lab
© Psy-Tek Labs | 741 Garden View Court | Suite 209 | Encinitas, CA 92024 | 760.733.6000 P: 18
APPENDIX B
Cheryl Corhn, BS,
Subtle Energy Researcher
Cheryl Corhn received her Bachelor’s degree from Purdue University in Psychology with a specialization in the Psychobiology of Addictions. After college, she performed EEG’s in the medical research field and then advanced onto pharmaceutical research. After spending more than a decade in these fields, she is now very passionate about understanding alternative medicine and therapies that are rarely utilized due to the western medicine practices. She is currently a Subtle Energy Research Assistant at Psy-Tek Subtle Energy Laboratory performing brain mapping, thermography and conducting research to provide the scientific evidence on alternative medicine practices.