Embed Size (px)
Citation preview

Study No. 91
NON FARM EMPLOYMENT IN MADHYA PRADESH
Ashutosh Shrivastava
AGRO ECONOMIC RESEARCH CENTRE FOR MADHYA PRADESH AND CHHATTISGARH
JNKVV,JABALPUR
1
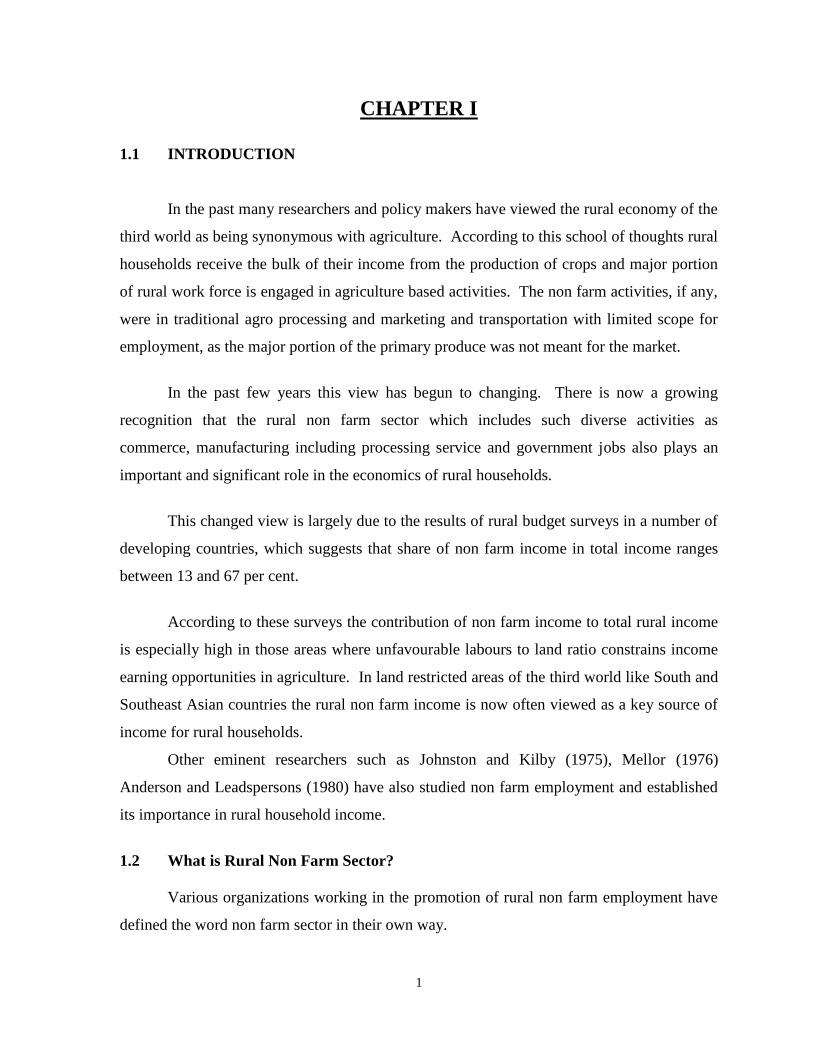
CHAPTER I
1.1 INTRODUCTION
In the past many researchers and policy makers have viewed the rural economy of the
third world as being synonymous with agriculture. According to this school of thoughts rural
households receive the bulk of their income from the production of crops and major portion
of rural work force is engaged in agriculture based activities. The non farm activities, if any,
were in traditional agro processing and marketing and transportation with limited scope for
employment, as the major portion of the primary produce was not meant for the market.
In the past few years this view has begun to changing. There is now a growing
recognition that the rural non farm sector which includes such diverse activities as
commerce, manufacturing including processing service and government jobs also plays an
important and significant role in the economics of rural households.
This changed view is largely due to the results of rural budget surveys in a number of
developing countries, which suggests that share of non farm income in total income ranges
between 13 and 67 per cent.
According to these surveys the contribution of non farm income to total rural income
is especially high in those areas where unfavourable labours to land ratio constrains income
earning opportunities in agriculture. In land restricted areas of the third world like South and
Southeast Asian countries the rural non farm income is now often viewed as a key source of
income for rural households.
Other eminent researchers such as Johnston and Kilby (1975), Mellor (1976)
Anderson and Leadspersons (1980) have also studied non farm employment and established
its importance in rural household income.
1.2 What is Rural Non Farm Sector?
Various organizations working in the promotion of rural non farm employment have
defined the word non farm sector in their own way.

2
The National Bank of Agriculture and Rural Development (NABARD) was the first agency
which used the word “Rural Non Farm Sector” in the year 1992. It defined the term by
listing small, cottage, tiny and village industries in 22 major categories of activities. This list
was expanded periodically and ultimately included almost all the rural industries and
services. The Planning Commission, Government of India includes Khadi and Village
industries, handicrafts, handlooms and power looms, coir and sericulture and small scale
industries under village and small industries. Another important agency “The Ministry of
Rural Development, Government of India in the context of Integrated Rural Development
Programmers uses the term “Industries, Service and Business” (ISB) sector for the economic
activities similar to Rural Non Farm Sector (RNFS). The Commercial Banks often involved
in the IRDP, therefore, use the term ISB and RNFS interchangeably.
Considering these illustrations about the rural non farm sector one can infer that the
RNFS encompasses all the non agricultural activities such as mining, and quarrying,
household and non household manufacturing, processing, repairs, construction, trade and
commerce, transport and other services in villages and rural towns undertaken by enterprises
varying in size from household own account enterprises to big manufacturing units in
villages and rural towns of up to 50,000 population.
Some of the researchers advocated that the best way to approach this issue is to base
the definition of the rural on the linkage approach to rural development. As argued by Saith
(1992), linkage approach is meaningful, as what is important is not the location of activities
per se, but whom do they benefit in terms of output, input, and demand linkages. If an
activity primarily services rural people irrespective of its location, it must be treated as rural.
As per the linkage approach, there could be four types of non-farm enterprises: rural located-
rural linked, rural located-urban linked, urban located-rural linked, and urban located- urban
linked. The first three of these are meaningful in terms of their linkage with the rural sector,
and therefore can be categorised as rural non-farm sector.
1.3 Rural Non farm Employment in India:
In India rural non farm sector has attracted importance and attention of researchers
and policy makers in the recent past due to its vast potential in rural employment and income
generation.
3
In view of the rigid and traditional structure of the agriculture it has been increasingly
realized that agriculture or crop based economy can not be absorb the burden of the growing
workforce any more due to adoption of new technology which requires lesser number of
labour force, burgeoning need of cost cutting methods and limitations of agriculture to absorb
labour force. Similarly organized sector specially private industries does not offer much
hope to growing labour force because of the increasing demand of capital in this sector and
government policy of disinvestment in public sector.
In this perspective the burden of employing ever growing rural labour force falls on
the unorganized sector like manufacturing including processing, service etc. At the all India
level the growth in employment declined from 2.9 per cent per year in 1977 to 1.5 per cent in
1988. This fall was more prominent in rural areas and further for women (Singh 94). The
rural employment situation worsened in 1980s when its annual growth rate declined to 0.95
per cent compared to that of 2.52 per cent in 1970s. Despite various programme of rural
industrialisation, only 7.1 per cent of rural population was reported to be engaged in
industrial activities in 1988 as against 6.8 per cent in 1983 (Bhushan 1996), further, the post
regime and new economic policy adopted and advocated by government the rural
entrepreneurs and artisans were left with not much scope to grow in the environment of the
tough competition, less state support, changing consumers preference and widening choices.
Their survival would mostly depend on their ability to adopt and compete in this critical
environment.
1.4 Importance of the Study:
Rural Non Farm income accounts for 32 per cent of the total income which is same as
the Asian average (FAO 1998) and the RNF employment is 20 per cent of the total rural
employment (Samal 1997). By 1999-2000, the share of rural non-farm sector rose to 23.8
per cent of the total rural employment. The higher share of this sector in income as against in
employment reflects its higher productivity. Further, the RNF activity affects the
performance of agriculture and vice-versa. The households are motivated to undertake RNF
activities due to the push or pull factors. There are also production, consumption and
investment linkages between farm and non-farm activities. The magnitude of these linkages
4
was found to be so high that a hundred-rupee increase in agricultural income led to Rs.64
increase in rural non farm income. 40 per cent of which went to rural areas and 60 per cent to
rural towns.
Among the various determinants of rural non farm activities, like relative prices,
credit availability, education or level of agricultural development, infrastructure figures as an
important one as the nature and quantity of infrastructure determine how much one can rely
on local RNF activity as opposed to migration to cities (FAO 98).
Thus, the non farm sector is positioned as a potential sector for absorption of rural
labour in a more productive manner. Also, off-farm activities are regarded as logical
extension from crop production in the process of diversification of the rural economy.
Moreover, it is generally argued that rural non farm activities are linked with agricultural
development of the region (Mellor 1976). By supporting local livelihoods, they prevent the
migration of workers from rural to the urban areas. Over the last two decades, non-farm
sector grew quite significantly in India. The employment in the non-farm sector grew at an
annual rate of 4.7 per cent during 1972/73 to 1987/88 as against only one per cent in the case
of agricultural employment. Further, even the female employment in this sector has risen at
a much higher rate (4.6 per cent per annum) compared to that in the agricultural sector (only
1.5 per cent) (Visaria 1995). Though there is no doubt that this sector has been growing at a
significant rate during the past decade and has made significant contribution to employment
generation in general, the performances of various rural activities have been different. The
NSSO estimates related to rural employment during the 80s and 90s indicate that-
i) in agriculture (field crops and agricultural services) usual status of workers has
decelerated
ii) the plantation, livestock, forestry and fishing have witnessed negative rate of
employment growth,
iii) in agro based industry employment has gone up; but in non-agro-based industry
this has gone down,
iv) the mining has recorded negative rate of growth in employment, where as in rural
construction activities this has been positive and is also increasing. In trade
employment growth decelerated, however, in transport and communication sector
employment growth has accelerated,
5
v) the employment growth has decelerated in the service sector in aggregate; growth
has, however, increased in specific services, such as administration, defence,
education and scientific services.
These trends in employment further highlighted importance of rural non farm
employment in general and specific rural non farm employment in particular. Agro
processing, construction, storage and transport sectors have registered positive growth in
employment. Government has also undertaken efforts to connect all the villages by all
weather roads. These sectors would therefore, continue to provide impetus to non farm
employment in the coming years.
However, at micro level, very little is known about the nature, dynamics,
determinants, and problems and prospects of various kinds of activities within this sector.
The state specific studies on this sector are still few and far between. Any attempt at
improving the quantity and quality of activities in this sector requires more area specific data
and analysis in order to gain better understanding of the dynamics of this sector. Such
research is also imperative to validate, document and analyse the ongoing changes suggested
by the macro data.
1.5 Objectives:
The main objectives were:
I. To study the pattern of rural non farm employment diversification, at
the house hold level.
II. To estimate the determinants of employment in the selected non farm
rural activities.
III. To asses region specific constraints in the growth of the livestock
based agro processing, draw the policy implications.
1.6 Sampling Design
This study was conducted in Jhabua and Damoh districts of Madhya Pradesh. All the
districts were arranged according to the concentration of the rural non farm workers* and two
extreme districts (one having highest and another having lowest concentration of rural non
farm workers thus, Damoh district with highest and Jhabua district with lowest concentration
of rural non farm workers were selected. In the second stage of the sampling, two village
clusters (each of 3 villages) from each of the selected district were selected on the basis of
6
level of employment diversification in the villages. Available literature indicate proximity to
town as the most important determinant of non farm employment diversification in a specific
region therefore two village clusters, one cluster within 3 km of town** and another more
than 10 km away from town were selected in each district
.
The concentration of rural non farm workers is the proportion of rural non farm workers
to the rural population of district
In Damoh and Jhabua district no class II town (having population between 50,000 to
1,00,000) was exists, therefore, class III towns (having population between 25,000 to
50,000) hatta in Damoh district and Jhabua in Jhabua district were selected.
In the Final stage of sampling, households in each village clusters were stratified into
following categories
Small and marginal farmers dependent on non farm sector for employment
Rural households working in manufacturing, processing, servicing and repairs
Rural households involved in private construction activities
Rural households involved in government aided construction activity and
agricultural labourers.
Rural households having wholesale trading as primary occupation
Rural households having retail trading as primary occupation, and
Rural households involved in transportation, storage and communication
activities
A sample of 30 rural households was selected randomly from each of the village
clusters. Thus, a total of 120 farmers were selected from the four village clusters of
Damoh and Jhabua districts in order to achieve the first and second objectives.
The third objective of this study was to assess prospects of increasing employment
through livestock based processing units. Madhya Pradesh was selected for milk based
processing activities and for this purpose 15 manufacturing units with their distribution as
OAME: NDME: DME: Factories*: 6: 4: 3: 2 were selected.
7
The enterprise classifications typical of non farm sector are i) OAME are the household
manned enterprise which at times may engage other family members to run the
enterprise; I) NDMEs are the enterprises which employ up to 5 workers, of whom at
least one is hired; iii) DMEs are the enterprises employing 6-9 workers with or without
using power and 10-19 workers without using power.
It is to be noted that in both the districts, there were problems in collection of data due
to absence of milk producing units (factories). In Damoh district there were no such unit
exist and in Jabua, only a small milk processing plant could be located.
1.7 Reference Year
The survey was conducted during February and March 2003 and the primary data was
collected for the year 2001-2002 (Rabi 2001 and Kharif 2002)
1.8 The data
The household data was collected with the help of questionnaire and guidelines
provided by coordinator. The data related to selected villages and Districts was collected
from Gram panchayats / Patwari records /Block Offices and District offices respectively.
As for as the secondary data is concerned, in spite the best efforts many of the
required data particularly related to processing industries could not be collected from the
state head quarter.
8
CHAPTER II
Rural Non Farm Employment in Madhya Pradesh
2.1 Basic Profile of the State:
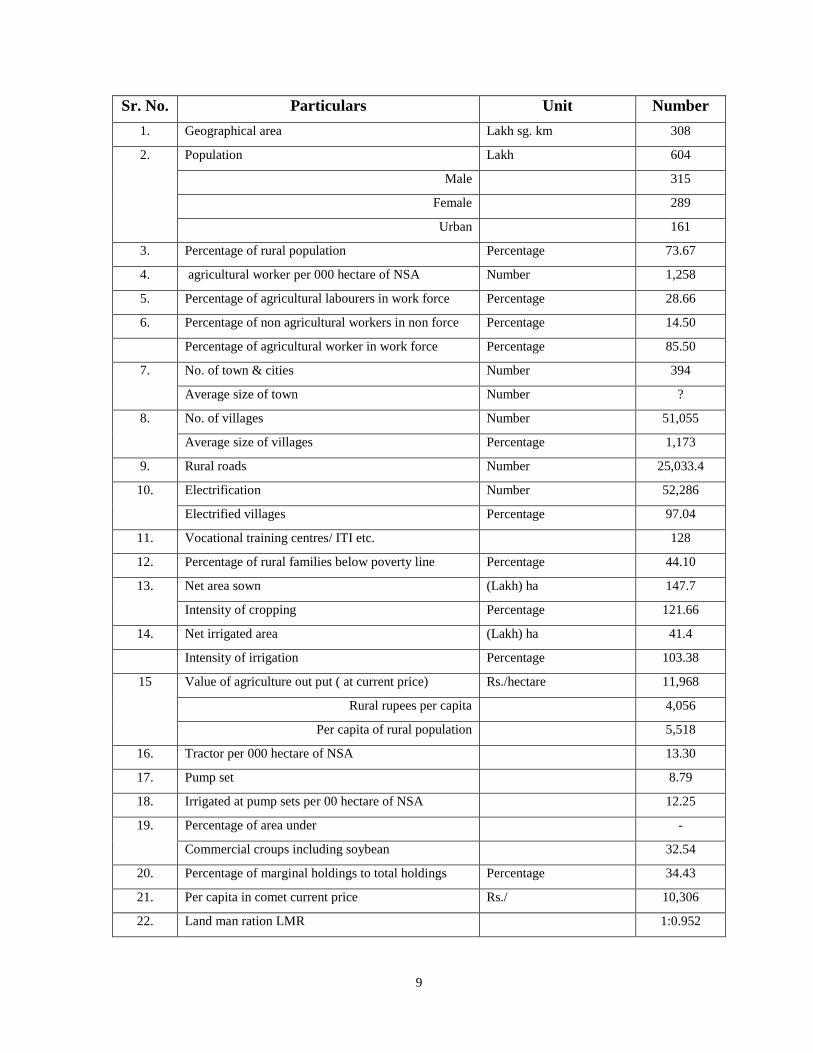
Madhya Pradesh “the second largest state” occupies 308 lakh sq km with a population
of 604 lakhs people in 2000-2001. Of this, male population was 52.15 per cent and female
population, 47.85per cent. Rural population occupied 73.34 per cent. Economy of the state is
still agrarian or agriculture centric and a large share of rural population depends on
cultivation for its livelihood. The percentage of agricultural workers and non agricultural
workers to total workers was 85.5 and 14.50 respectively.
Infrastructure is a key factor for development and the availability of roads,
electrification, power supply, literacy etc. play important role in the development of the
region as well as in generating employment. It can be noted from the table that almost all the
villages (97.04 per cent) were electrified. The state has 25033 km rural roads and the rural
literacy percentage was significantly high (57.84 per cent).
In Madhya Pradesh, most of the cultivated area was rainfed and therefore under single
crop regime. Only 21.44 per cent area was under double cropped. The irrigation intensity was
only 103.38 per cent. During 2000-2001, state had 147.7 lakh hectares of gross cropped area,
and of this, commercial crops including soybean, cotton fodder, sugarcane etc. which
established itself as a commercial preposition, commanded 32.54 per cent. The area under
non food grain crop was 40.04 per cent. However, the availability of tractors and pumpsets
was not very high.
During 2000-2001 the per hectare value of agricultural out put at current prices was
Rs. 11,968. The per capita value was Rs.4, 056 and rural per capita value was Rs.5, 518.
In 2001 a large proportion (44.10 per cent) of rural families was living below poverty
line. This high incidence of rural poverty along with the higher percentage of marginal
holdings (34.43%) indicated a poor economic development and low avenues of employment
in agricultural sector which compelled the increasing population to seek employment else
where particularly in non farm sector (Table 2.1).
Table 2.1 Basic Profile of Madhya Pradesh, 2001 Number
9
Sr. No. Particulars Unit Number
1. Geographical area Lakh sg. km 308
2. Population Lakh 604
Male 315
Female 289
Urban 161
3. Percentage of rural population Percentage 73.67
4. agricultural worker per 000 hectare of NSA Number 1,258
5. Percentage of agricultural labourers in work force Percentage 28.66
6. Percentage of non agricultural workers in non force Percentage 14.50
Percentage of agricultural worker in work force Percentage 85.50
7. No. of town & cities Number 394
Average size of town Number ?
8. No. of villages Number 51,055
Average size of villages Percentage 1,173
9. Rural roads Number 25,033.4
10. Electrification Number 52,286
Electrified villages Percentage 97.04
11. Vocational training centres/ ITI etc. 128
12. Percentage of rural families below poverty line Percentage 44.10
13. Net area sown (Lakh) ha 147.7
Intensity of cropping Percentage 121.66
14. Net irrigated area (Lakh) ha 41.4
Intensity of irrigation Percentage 103.38
15 Value of agriculture out put ( at current price) Rs./hectare 11,968
Rural rupees per capita 4,056
Per capita of rural population 5,518
16. Tractor per 000 hectare of NSA 13.30
17. Pump set 8.79
18. Irrigated at pump sets per 00 hectare of NSA 12.25
19. Percentage of area under -
Commercial croups including soybean 32.54
20. Percentage of marginal holdings to total holdings Percentage 34.43
21. Per capita in comet current price Rs./ 10,306
22. Land man ration LMR 1:0.952
10
2.2 Classification of Rural Workers According to Sex
In any work, both, male and female workers play a vital role though the males always
dominate their counter parts and table 2.2 presents the similar picture. It can be seen that in
all the decades the male dominance was very noticeable however; its share has been steadily
declining from 76.43 per cent in 1971 to 58.45 per cent in 2001.Conversely, the proportion of
female workers registered a significant increase over the decades. This phenomenon was
particularly more prominent in agricultural sector, where the share of female workers
increased from 24.61 per cent in 1971 to 43.77 per cent in 2001. Similar growth can be seen
in non farm sector but not at the same pace and that might be because the employment base
of rural female workers remains heavily tagged with agriculture; moreover, in rural areas
female workers generally prefer agriculture and allied sectors for employment (Table 2.2).
2.3 Rural Non Farm Workers
The census data on rural workers revealed that in the State share of rural non farm
workers in total rural workers has been witnessing increasing growth over the years. The
percentage of rural non farm workers increased from 10.19 in 1971 to 11.69 in 1981 and then
further to 14.50 in 2001. However, there was a slight decline in rural non farm workers
during 1981 to 1991 period from 11.69 per cent to 11.33 per cent.
In absolute terms the number of rural non farm workers increased by more than 3 fold
(21 lakh) over the period from 1971 to 2001 (Table 2.3)
2.4 Sect oral and Gender Composition of Rural Non Farm Workers
In this section we seek to examine the percentage share of different sectors in the total
rural non farm workers during the period of 1971, 1981, 1991 and 2001. Composition of sub
sectoral data is not available for the year 2001, therefore, we attempted to analyse the data for
1971, 1981 and 1991. This will indicate the major sub sectors within non farm employment
sectors that are relatively more important from the point of view of generating non farm
employment and changes of employment across the division one the decades (Table 2.3 &
2.4)
11
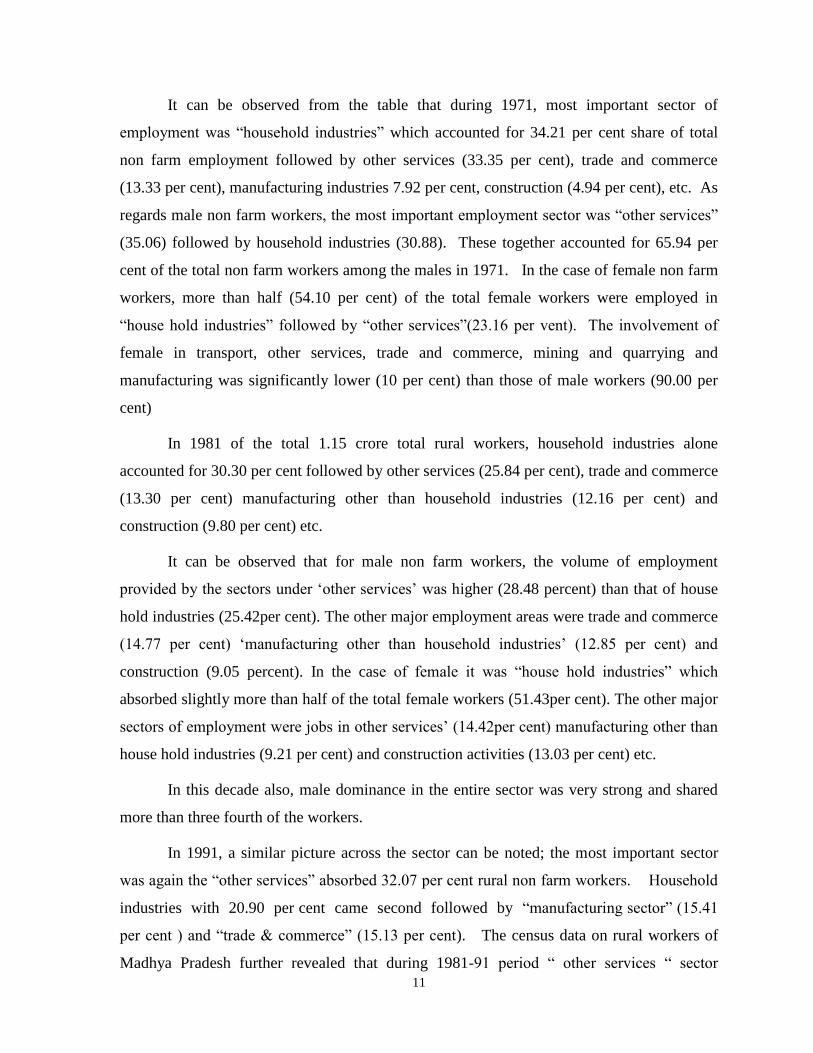
It can be observed from the table that during 1971, most important sector of
employment was “household industries” which accounted for 34.21 per cent share of total
non farm employment followed by other services (33.35 per cent), trade and commerce
(13.33 per cent), manufacturing industries 7.92 per cent, construction (4.94 per cent), etc. As
regards male non farm workers, the most important employment sector was “other services”
(35.06) followed by household industries (30.88). These together accounted for 65.94 per
cent of the total non farm workers among the males in 1971. In the case of female non farm
workers, more than half (54.10 per cent) of the total female workers were employed in
“house hold industries” followed by “other services”(23.16 per vent). The involvement of
female in transport, other services, trade and commerce, mining and quarrying and
manufacturing was significantly lower (10 per cent) than those of male workers (90.00 per
cent)
In 1981 of the total 1.15 crore total rural workers, household industries alone
accounted for 30.30 per cent followed by other services (25.84 per cent), trade and commerce
(13.30 per cent) manufacturing other than household industries (12.16 per cent) and
construction (9.80 per cent) etc.
It can be observed that for male non farm workers, the volume of employment
provided by the sectors under ‘other services’ was higher (28.48 percent) than that of house
hold industries (25.42per cent). The other major employment areas were trade and commerce
(14.77 per cent) ‘manufacturing other than household industries’ (12.85 per cent) and
construction (9.05 percent). In the case of female it was “house hold industries” which
absorbed slightly more than half of the total female workers (51.43per cent). The other major
sectors of employment were jobs in other services’ (14.42per cent) manufacturing other than
house hold industries (9.21 per cent) and construction activities (13.03 per cent) etc.
In this decade also, male dominance in the entire sector was very strong and shared
more than three fourth of the workers.
In 1991, a similar picture across the sector can be noted; the most important sector
was again the “other services” absorbed 32.07 per cent rural non farm workers. Household
industries with 20.90 per cent came second followed by “manufacturing sector” (15.41
per cent ) and “trade & commerce” (15.13 per cent). The census data on rural workers of
Madhya Pradesh further revealed that during 1981-91 period “ other services “ sector
12
regained its lost ground and engaged one third of the total rural workers. Manufacturing
sector with 15.41 per cent emerged as third most important rural non farm sector after other
services and household industries sector. As regards female non farm workers, “household
industries” accounted for 46.34 per cent followed by “other services” (21.88 per cent)
manufacturing (16.83 per cent) and trade and commerce (6.61 per cent).
In 2001 although the sectoral information was not available, census data revealed that
non farm sector registered an increasing trend and absorbed 14.50 per cent of the rural
worker. The share of male non farm worker and female non farm workers also increased
significantly over the period.
It can be concluded from the above observation that-
1. Over the period, non farm employment sector has emerged as a strong avenue for
rural employment and registered and increasing trend.
2. Sector wise- “household industry” and “other services” were the major sources of
rural non farm employment and had been absorbing more than half of the total
employment when grouped together.
3. With the changing scenario and growing economy the new sectors like construction,
trade & commerce and manufacturing emerged as other important rural non farm
sectors.
4. In almost all the industries, dominance of male workers was witnessed and
participation of female workers was very low. However an increasing trend in female
participation in rural non farm employment is observed.
---
13
CHAPTER III
Distribution of Rural Non farm Workers of Selected Districts
In this subsection we will give the distribution of rural workers by 2 Categories 1: agriculture
workers and, 2: non Agricultural worker or non farm workers. The non farm worker class
includes 7 sub sections.
In Damoh district, in 1971 the number of total workers was 1, 75,282. Of this,
86.17 percent were agriculture workers and the remaining 13.83 percent were the non farm
workers. Among the non agricultural workers the highest percentage 53.64 belonged to
houses hold industries. The second important category, although far below the category of
the household industry (24.10) belonged to other services. The third worth mentioning
category is trade and commerce wherein 11.26 percent workers come from. The other
categories claimed less than 5 percent each of the total non farm workers.
In 1981, while the percentage of workers in house hold industries remained
highest (64.09) the percentage of persons belonged to other services. The second important
category was 12.15 per cent. Among the categories manufacturing other than household
industries became more important other than household industries became more important
category and claiming 7.76 per cent of the non farm workers.
In 1991, the picture changed significantly. Although the household industries
claimed the highest percentage of 47.01 the relative importance of category declined .The
second importance of category was manufacturing other than household industries and
claimed a very significant (26.35) percentage of the total workers. It has also become the
second important category replacing the other services category. The other categories as in
the previous two decades had relatively less importance.
In the year 2001 the picture has Suddenly changed due to the fact that the data
on categories other than household industries and other services was not available, it seems
that the smaller and less important categories were either grouped under the household
industries or other services category of then, like cashier censuses the category of household
industry, the most important one. Comprise sing 64.05 per cent of the non farm workers and
the other services category, the remaining 32.95 per cent.
14
If we study the weight age of different categories of non farm workers across the four
censuses it is noted that the proportion of workers belonging to the category or
manufacturing
Other than household industries increased from 1971 to 1981 by 327 per cent and
furl her from 1981 to 1991 by 297 per cent. This might be due to heavy absorption of
workers in the industries of Bide and cement. Among the categories in trade and commerce
the percentage of workers declined from 11.26 in 1971 to 9.50 in 1981 and further to 9.36 in
1991. Another category which recorded lower percentage of workers in 3 census years was
transportation, storage and communication. Were the percentage of workers declined from
2.63 in 1971 to 1.79 in 1981 and still lower (1.74) in 1991 .in category other services
although then was a net in percentage of workers from 1971 to 2001 the category recorded
decline in the 2nd and 3rd census year.
As for as the main categories of non farm workers and agricultural workers the
trends were similar to those observed elsewhere in the county due to gradual urbanisation,
proportion of agricultural workers in general have declined and that of non farm workers has
increased. The increased in the percentage of non farm workers from one census to another
even in the present rural workers show the gradual increasing importance of non farm
employment workers in the rural areas.
In Jhabua district in 1971, the total rural workers numbered 1, 84,889 of there, 94.73
per cent were agricultural workers and the remaining 5.27 per cent non farm workers. The
number of total rural workers registered an increase of 275 per cent in 2001 over 1971.
Among the non farm workers other services category was most important and claimed 39.24
per cent of the non farm workers. The second important category was household industries
and formed 23.66 per cent of the total non farm workers. Trade and commerce closely
followed the second category and the workers in that category formed 22.54 per cent. The
other categories of workers were less important except .The transport, storage and
communication category forming 7.76 per cent. The movement of different categories of
workers across the four census year showed that there was an increase in percentage in the
category mining and quarrying from 0.16 to 4.46 per cent and construction category from
2.25 to 8.14 per cent and furl her to 9.45 per cent in the 1991 census on the other hand the
percentage of workers declined from 23.68 in 1971 to 18.01 in 1981 and furl her to 12.99 in
1991. In the care of trade and commerce category the percentage declined from 22.54 in

15
1971 to 17.76 in 1981however.There was a marginal increase to 18.35 in 1991. Jhabua
district still basically an agricultural district and a tribal dominated district where we do not
find perceptible change in the composition of agricultural workers and non agricultural or
non farm workers.
In the first 3 censuses the percentage of agricultural workers hovered around 94 per
cent but declined to 91.23 per cent in 2001. Conversely, the percentage of non farm workers
moves around 5 per cent in the first 3 census year and increased marginally to 8.77 per cent
in the year 2001 due to methodological problems as given in the description of Damoh
district there was a sudden increase in the percentage in the category of other services from
around 40 per cent in 1971 to 92.34 per cent in 2001. Due to this same reason the percentage
of workers in house hold industries suddenly dropped to 7.66 from 12.99 in the year
2001.Thus as compared to Damoh district Jhabua seems lower impact of urbanisation (table
3.1 & 3.2)
3.2 Basic Profile of the Selected Districts
3.2.1 Demographic Structure:
In Damoh district the total population in 1971 was 5, 73,263 ill in creased by 25.85 per
cent in 1981. On 1991 the increase registered was 24.48 per cent. However in 2001 the rate of
increase declined to 20.46 per cent. The proportion of male and female population remained
about same in all the 4 census years while male population formed between 49 to47 per cent.
The percentage of rural population was 86.22 in 1971 ill declined to 85.58 in 1981 to 81.86 in
1991 and to 81.12 in 2001. Thus, there was a very gradual decline in the percentage of rural
population of the district one size of the villages in terms of the member of persons expended
during four censuses. The result between 1971 to 2001 was nearly double (84.04 per cent) .
Similarly, the member of agricultural workers per thousand of net sown area increased from
545 to 927 in the same census year or an increase of 70 per cent. These two indicators us to
way that the pressure of population on agricultural land is increasing continuously.
The percentage of agricultural labourers in work force declined from 31.16 to 23.21
in 1981 but increased to 26.07 in 1991. In 2001 the increase was gradual the net decrease from
census of 1971 to 2001 from 31.26 to 29.68. The percentage of rural population below poverty
line as arrived in 1998 was 51.88 .The rural literacy reel increased from 19.20 per cent in 1971
16
to 25.22 per cent in 1981 to 31.73 un 1991 to 46.82 per cent in 2001.This is in line with the
overall increase in literacy rate in all districts of the state of Madhya Pradesh.
In Jhabua district the total population in 1971 was 6, 67,845 in 1981 it increased by
19.06 per cent in the census of 1991, the increase was 42.16 over the census of 1981.On 2001,
however, the rate of increase declined to 23.35 per cent one net increase from 1971 to 2001
was 108 per cent. The proportion of male population remained around 51 per cent in all the 4
census year .The percentage of rural population was 92.69 in 1971 and declined slightly to
91.33 in 2001, The size of villages in terms of member of persons increased from 504 to 1044
in the four reference years then by registering a growth of 107 per cent .The member of
agricultural workers per thousand hectares of net sown area (N.S.A.) increased from 533 in
1971 to 1794 in 2001, there by showing an increase of 236 per cent. These two indicators show
the extent of pressure of population on agricultural land .One percentage of agricultural labours
in work force although showed increase from the first year (1971) to the last year (2001) .The
increase was not uniform and fluctuate in between the census Year, The net result was 5.4 per
cent increase in the agricultural work force,
In Jhabua district, the rural literacy rate increased from one census Year to another
and was 5.09, 7.17, 10.42 and 24.79 per cent respectively in the 4 census Years. The
percentage of rural people living between poverty line was 54.37
The above the analysis goes to prove that:
1. The population growth in both the district during the earlier period (1971-2001) was
about same.
2. The proportion of male to female was also about same in both the districts.
3. Both the districts are rural in character but of them Jhabua in more rural.
4. The pressure of population on land in both the district is quite high, but in between
the two districts it is higher in Jhabua district.
5. The percentage of agricultural labour force was higher in Damoh district
than Jhabua district.
6. The percentage of rural people living below poverty line was higher in
both the district but was marginally higher in Jhabua district than Damoh district.
(Table 3.3)

17
3.2.2 Agricultural Development
The net area sown in Damoh district in 4 reference years ranged between 273 to 302
thousand hectares and the gross area sown ranged between 296 and 378 hectares. The
intensity of cropping in the first 2 reference years was 108 per cent and 125 per cent
respectively. Both net irrigated area and gross irrigated area increased from one reference
year to another. In the first reference year it was 10 & 14 thousand hectares respectively
these also increased from on reference year to other and were 88 and 90 thousand hectares
respectively in the last reference year. The irrigation intensity was 140 per cent in 1971 and
decreased from one census year to another to be 102 per cent in the year2001. However, the
percentage of area under commercial crops increased from year to year from 0.05 thousand
hectares in 1971 to 1588 in 2001. For measuring the mechanization, the indicators used were
no of tractors and pump sets per units of area. It was noticed that the member of tractors
increased from 0.19 per thousand hectares of net sown area in 1971 to 11.42 per thousand
hectares of net sown area in 2001. Similarly, the member of pump sets per hundred hectares
of net sown area was 0.358 in 1971 and it increased from year to year and was 1.230, 2.601
and 6.735 in 3 subsequent censuses.
In Jhabua district the net sown area in 1971 was 331 thousand hectares, it increased in
general from year to year and was 356 thousand we tares in 2001. Gross cropped area also
increased from 1971 to 2001 with the passing of every census year. It in thus, clear that both
net and gross cropped area of Jhabua district was higher than Damoh district indicating there
by that the Jhabua district has larger net and gross cropped area. However, the better measure
of knowing the development of agriculture in the cropping intensity. In this respect, Damoh
district was better placed. In both the first 2 reference years (i.e. 1971 &1981). In the
subsequent years, however, the cropping intensity in Damoh increased at a higher rate than
Jhabua district.
As for as irrigation on intensity is concerned, Damoh district had percentage of
irrigation intensity of 140 in the year 1971 where as Jhabua district had percentage of
intensity of irrigation was 104. However, in the case of Damoh district the percentage of
irrigation intensity decreased in all the 3 subsequent reference years. In Jhabua district, on the
other hand, it showed a very gradual and marginal increase in subsequent 3 year.
The commercialization of agriculture in more pronounced in Jhabua district as the
percentage of area under commercial crops gradually increased from below 1 per cent in
18
1971 to 22.28 per cent in the year 2001. As regards mechanization of farming in Damoh
district the number of tractors per thousand hectares of net sown area increased from 0.19 in
1971 to 1.23 in 1981 to 3.84 in 1991 and to 11.42 in 2001. In Jhabua district, on the other
hand, the number of tractor increased from 0.060 in 1971 to 0.198 in 0.586 and 3.100 in the
subsequent years of censuses respectively. This shows that mechanization was more in
Damoh district than Jhabua district and the pace of increase was very significant from 1991
to 2001.
The percentage number of marginal holding showed that in Damoh district it
increased from 33.29 in 1971 to 34.76 in 1981 furl her to 42.88 in 1991. in 2001 it only
marginally decreased to 42.36.
In Jhabua district, on the other hand, has the percentage of number of marginal
holding been lower in the census years. It ranged between 16.12 in 1971 to 30.09 in 2001
with an increasing trend during the years between. The higher percentage of marginal
holdings in Damoh district is probably one of the reasons for opting the non farm
employment avenues particularly for this group of farmer.
The value of agriculture for the districts was not available for the 1971. In Damoh
district the value per hectare was Rs. 1,733 in 1981 and increased to 4,039 in 1991 and furls
her to Rs. 9,880 in 2001. Similarly the precipitate agriculture income from Rs. 711 to 1,448
and Rs. 3,498 respectively in the 3censuses.The indicator of value of agriculture out put, per
rural population was Rs. 831 in 1971 and Rs. 1769 and 4,312 in the subsequent two census
years of 1991 and 2001 respectively.
In this respect the values were lower in Jhabua district. These could be due to higher
intensity of cropping and higher irrigation intensity in Damoh district than Jhabua district.
We may add mechanization as one more factor for the higher out put in Damoh district than
Jhabua district we presumed that high income from agriculture in the farm of value of
agriculture out put results in higher rural non farm employment.(Table 3.4)
3.2.3 Infrastructural Development
The criterion of infrastructure development used in this study of the selected districts
were, number of towns & cities, average size of towns (average population of the village),
length of the roads electrification, availability of vocational training centers & bank branches
etc.
19
It was noted that the urban agglomerations in Damoh district were 3 in number in the
first 3 censuses and increased to 4 in the last census. Where as the number of uniformly 6 in
Jhabua district. The average of size of towns however was quit large in Damoh district than
Jhabua district .One availability of road length was higher in Jhabua district as compared to
Damoh district. The reason may be two 1:Jhabua being a tribal district government efforts
were more concentrated on improving the infrastructural facilities including higher road
available, secondly: the higher road length per hundred sq 1 km might be due to the fact that.
The total area of district itself was smaller than that of Damoh district any smaller
development on this regard might have been got magnified.
As for as electrification is concerned both the districts have progressed tremendously
since 1981and practically all the villages stand electrified as of today.
The number of vaccination centers and ITI‘s in Damoh district was 4 and that in
Jhabua was 6 as per the latest census.(Table 3.5)
20
Chapter IV
Socio Economic States non farm Activities of Simple Villages and Households
This Chapter consists of 2 sections the first section gives the socio- economic
character and the second part diatribes the extent of rural non farm employment level of the
selected households.
4.1 Socio- Economic Characters:
As mentioned in subsection methodology for this study Damoh and Jhabua district
were selected. This basis of selection of Damoh was high concentration of rural non farm
workers and Jhabua, low concentration of rural non farm workers further, in each district,
2villages cluster had to be selected in Damoh district there was no class II town having
population of between 50,000 to 99,999 thousand there fore we had to settle for the selection
of town having population below 50,000. It happened to be town Hatta . The villages within
3 km distance from Hatta were selected and termed as cluster I, another cluster of villages
was at a distance beyond 10 kms from Hatta. The villages in cluster I were borikala,
borikhurd and Khejarikhurd that is cluster II were hinota, sakore and mangawan
In Jhabua district, there was also no town having population between 50,000 t o
99.999. There fore, we had to settle for town that had population below 50,000 thousand. It
happened to be Jhabua town itself. The village cluster I in Jhabua districts comprised of
villages gopalpura, kasrawad and mindal, and that of cluster II comprised of kalyanpura
sandla and barkhera.
The population of cluster I at Damoh district was 3168 and that of cluster Ii had 3852.
Cluster I of Jhabua district had a total population of 9781 and cluster Ii had 5168. It will thus,
be observed the average population of villages of Jhabua district was higher than that of
Damoh district the proportion of male to female was 52 to 48 in Damoh and 51 to 49 in
Jhabua district, thus the slightly high edge of male population over female population was
observed in both the district
Of the two districts Jhabua was tribal district and therefore, the percentage of
schedule tributes in cluster I was as high as 80.83 in clusters II the percentage was 57.82. In
Damoh district, on the other hand, in both the village clusters the schedule tribes’ population
21
formed warily 29 per dent, of the two village clusters first had no schedule castes population
and second had movably 1.25 per cent Scheduled Castes population.
In Jhabua district in the first cluster the percentage of schedule castes population was
0.70 but in the second cluster it was quite high (28.70).
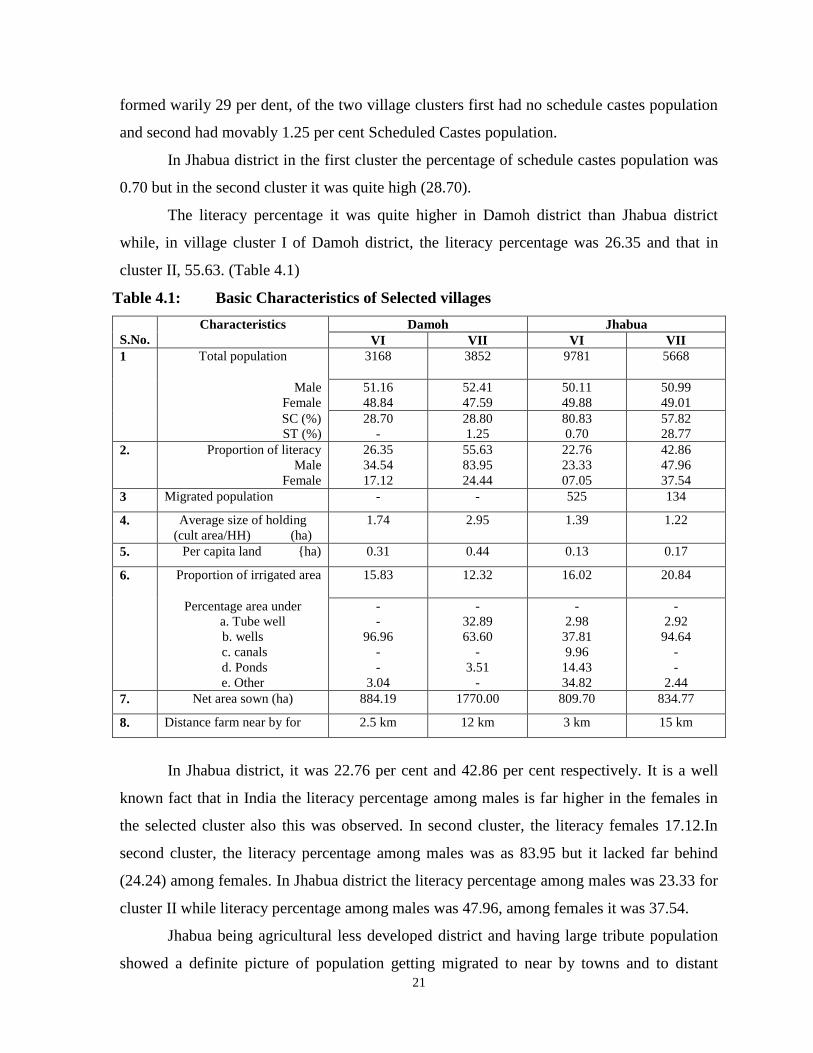
The literacy percentage it was quite higher in Damoh district than Jhabua district
while, in village cluster I of Damoh district, the literacy percentage was 26.35 and that in
cluster II, 55.63. (Table 4.1)
Table 4.1: Basic Characteristics of Selected villages
S.No.
Characteristics Damoh Jhabua
VI VII VI VII
1 Total population
3168 3852 9781 5668
Male
Female
51.16
48.84
52.41
47.59
50.11
49.88
50.99
49.01
SC (%)
ST (%)
28.70
-
28.80
1.25
80.83
0.70
57.82
28.77
2. Proportion of literacy
Male
Female
26.35
34.54
17.12
55.63
83.95
24.44
22.76
23.33
07.05
42.86
47.96
37.54
3 Migrated population - - 525 134
4. Average size of holding
(cult area/HH) (ha)
1.74 2.95 1.39 1.22
5. Per capita land {ha) 0.31 0.44 0.13 0.17
6. Proportion of irrigated area
15.83 12.32 16.02 20.84
Percentage area under
a. Tube well
b. wells
c. canals
d. Ponds
e. Other
-
-
96.96
-
-
3.04
-
32.89
63.60
-
3.51
-
-
2.98
37.81
9.96
14.43
34.82
-
2.92
94.64
-
-
2.44
7. Net area sown (ha) 884.19 1770.00 809.70 834.77
8. Distance farm near by for 2.5 km 12 km 3 km 15 km
In Jhabua district, it was 22.76 per cent and 42.86 per cent respectively. It is a well
known fact that in India the literacy percentage among males is far higher in the females in
the selected cluster also this was observed. In second cluster, the literacy females 17.12.In
second cluster, the literacy percentage among males was as 83.95 but it lacked far behind
(24.24) among females. In Jhabua district the literacy percentage among males was 23.33 for
cluster II while literacy percentage among males was 47.96, among females it was 37.54.
Jhabua being agricultural less developed district and having large tribute population
showed a definite picture of population getting migrated to near by towns and to distant
22
places like the state. It was customary for the tributes of Jhabua district to migrate to distant
places like Kota, Ahmedabad, Indore, etc in search of menial jobs like stone cutting and
polishing and agricultural and non agricultural labours. In village cluster I of Jhabua district
525 people
reported to have migrated to such places as distribute above and in cluster II such persons
numbered 135.
As regards average size of holding it was noted that the size was larger in Damoh
district cluster then Jhabua district cluster wail in cluster I of Damoh district the average size
was 1.74 hectares and that in cluster II, 2.59 hectare. The average size in Jhabua district was
1.39 for cluster I and 1.22 in cluster II. This is also reflected from other criterion of land per
capital. The land available per capital in cluster I of Damoh district was 0.31 hectare and 0.44
hectare in cluster II where as the corresponding figure for Jhabua district was (0.13 and 0.1)
hectare respectively. The percentage of irrigated area was higher in Jhabua district (16.02 for
cluster I and 20.84 for cluster II) as compared to Damoh district (15.83 and 12.32).
As regards sources of irrigation it was noted that in both the district tube wells and
wells were the main source on in cluster I of Jhabua district there seemed to be some mark
(Table 4.1).
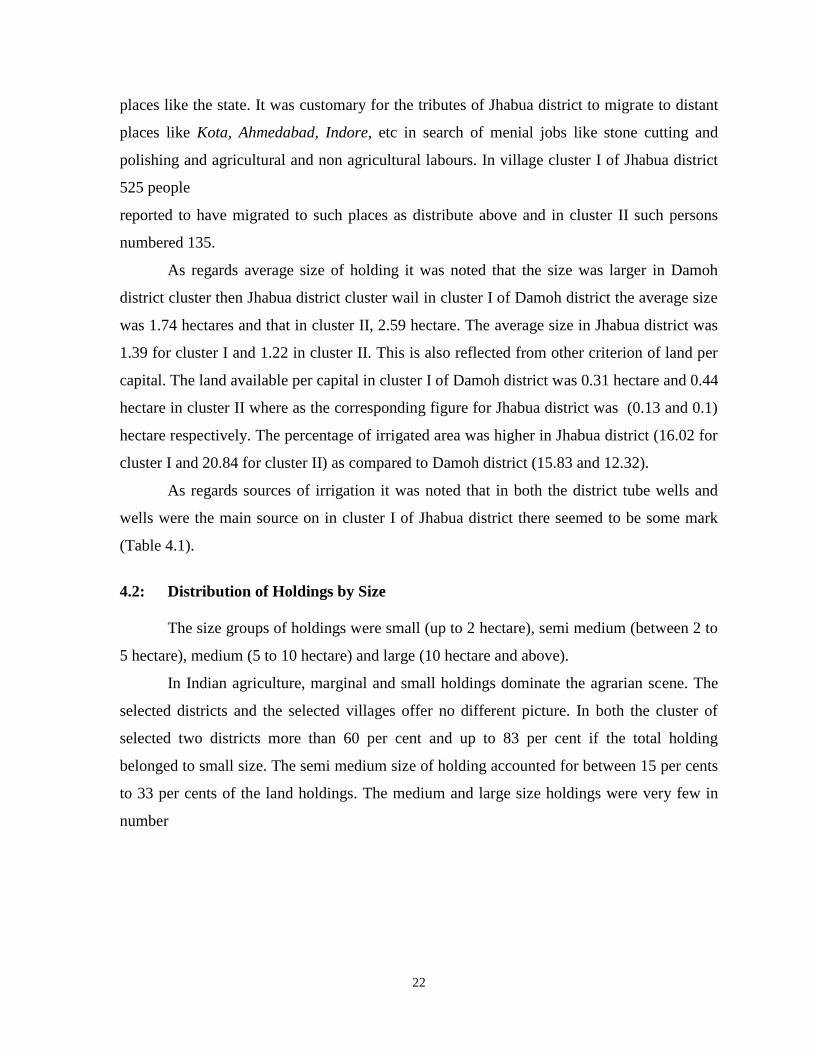
4.2: Distribution of Holdings by Size
The size groups of holdings were small (up to 2 hectare), semi medium (between 2 to
5 hectare), medium (5 to 10 hectare) and large (10 hectare and above).
In Indian agriculture, marginal and small holdings dominate the agrarian scene. The
selected districts and the selected villages offer no different picture. In both the cluster of
selected two districts more than 60 per cent and up to 83 per cent if the total holding
belonged to small size. The semi medium size of holding accounted for between 15 per cents
to 33 per cents of the land holdings. The medium and large size holdings were very few in
number
23
Table 4.2 Distribution of Households by size of Operational Land Holdings in the
Village Group
Land Holding Districts
Damoh Jhabua VI VII VI VII
1. Small
up to 2 hectares
468 385 668 523
(82.54) (61.40) (71.60) (73.04)
2. Semi medium
2 to 5 hectares
80 206 250 190
(14.11) (32.85) (26.80) (26.53)
3. Medium
5 to 10 hectares
14 32 15 3
(2.47) (5.10) (1.60) (0.43)
4. Large
10 hectares & above
5 4 - -
(0.88) (0.67) - -
Total 567 627 933 716
(100.00) (100.00) (100.00) (100.00)
( Figure in parentheses are percentage to total)
4.3 Proportion of Own Account Enterprises
The proportion of holdings having some enterprises running on self owner ship were
6.88 per cent in cluster and 9.63 in cluster II of Damoh district. In Jhabua district 7.78 per
cent such enterprises II.
Of the self owner ship enterprises; larger population were found either in
manufacturing processing inclusive of rural artisans and service sector trade and shop
keeping also found for med important enterprises particularly in cluster distance from the
selected town. This is because in there for off areas the need for shops selling general and
other felt move. In cluster near to the town these needs are met by the shop keepers are
traders 10 canted within 3 km of the cluster. This is true with the enterprises of services and
transport.
The proximity of the town within 3 km tosses the specialized persons in the villages
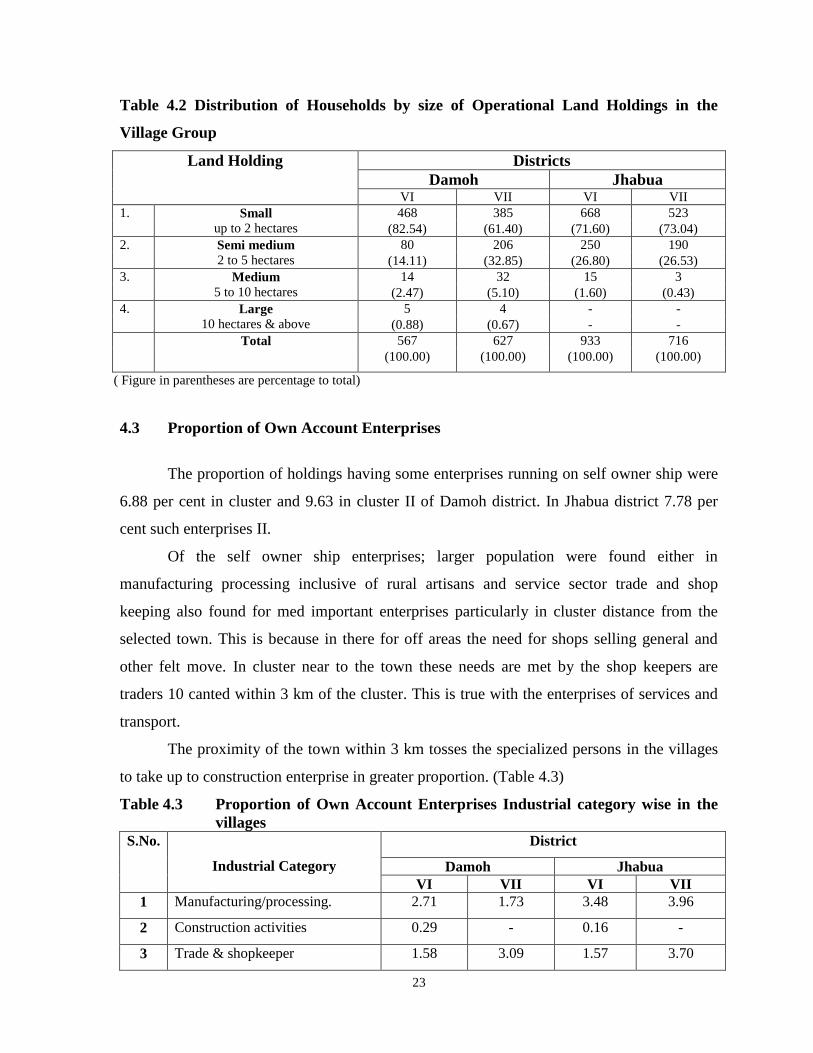
to take up to construction enterprise in greater proportion. (Table 4.3)
Table 4.3 Proportion of Own Account Enterprises Industrial category wise in the
villages S.No.
Industrial Category
District
Damoh Jhabua
VI VII VI VII
1 Manufacturing/processing. 2.71 1.73 3.48 3.96
2 Construction activities 0.29 - 0.16 -
3 Trade & shopkeeper 1.58 3.09 1.57 3.70
24
4 Transport/storage/communication 0.29 0.62 0.16 0.26
5 Repair/service sector 2.01 4.19 2.40 2.43
6 Total 6.88 9.63 7.78 10..36
4.4 Proportion of Casual workers
The proportion of casual workers in the total population has 50.33 in cluster I of
Damoh district. In cluster II it was 43.27. Jhabua district, the percentages of casual workers
to total population in both the cluster were higher (53.19 and 63.24 respectively) then the
Damoh district.
The class of casual workers consisted mainly of argil labour with land and the
proportion of this category in the two cluster of Damoh district was 17.99 & 19.25 per cent
respectively. This category also had the larger proportion of casual workers in both the
village cluster in Jhabua district then Damoh district. The fingers for the two clusters were
29.00 and 32.00 per cent respectively. The second important category with respect to higher
proportion of casual worker was that of agricultural labour (exclusive). The percentages in
two village cluster of Damoh district were 15.72 and 12.85 respectively. This percentage
stood at 14.25 and 17.15 for two villages’ cluster of Jhabua district.
The third category although constituled less than 4 per cent of the casual workers in
the selected 4 villages’ cluster of two district it had some significance in cluster away from
the selected towns. While in Damoh district the percentage of self casual labourers was 2.95
in Damoh district, it was 3.75 in Jhabua district, Allied activities mainly include dairying
actively and in the casual of Jhabua district piggery by schedule castes house holds.
In the case of non farm categories in Damoh district manufacturing, processing and rural
artisanship was important and formed 5.69 and 4.28 per cent in the 2 villages cluster
respectively. This high percentage in mainly due to household bidi industry in which a large
number of family member of all age groups and sexes work. Construction is another non
farm casual workers category. This is particular important in cluster I of Damoh district and
cluster II of Jhabua district while in Damoh district 3.58 per cent of sad casual worker get
employment in the nearby hatta town 3.86 per cent of casual worker of Jhabua district get
such an opportunity in near by districts and in the states of Gujarat and Rajasthan which are
in proximity to the village cluster. (Table 4.4)

25
Table 4.4 Proportion of Casual Workers to Total Population Industrial Category
Nice in the Selected Villages Cluster
Industrial categories Damoh Jhabua
VI VII VI VII
1. Argil labour ( Excusing) 15.72 12.85 14.25 17.25
2. Argil labour with land 17.99 19.25 29.00 32.00
3. Argil laborer without land but with allied activity 3.28 2.01 1.57 0.70
4. Argil labour with land and allied activity 2.15 2.95 2.80 3.75
5. Manufacturing prominent intrusive of rural artisan 5.69 4.28 1.12 0.48
6. Construction 3.58 0.52 1.89 3.86
7. Trade 0.69 0.65 0.79 3.32
8. Transport 0.53 0.13 0.61 0.35
9. Service 0.69 0.88 0.98 2.68
10. Total 50.33 43.27 52.19 63.29
4.5 Infrastructure Facilities
Infrastructure facilities here mean facilities like education institutions, health centers,
veterinary centers, Motor able roads financial and non financial instituted. As has been
already stated financial village cluster in Damoh district is within a distance of 3 km from
town. All above mentioned infrastructure facilities for this cluster were available in the town
and therefore cluster did not need non had the facilities within any of the villages cluster.
In cluster II of both the districts there facilities were available as the clusters were
away from the towns. In the care of Jhabua district how ever cluster I which is closer to
Jhabua town the tribute were available due to intensive efforts of the tribute development
department to make available the small activities within the reach of tribute villages although
were not for farm the town. (Table 4.5)
-------

26
Table 4.5 Comparative Account of Available Infrastructure within the Village
Groups
Infrastructure Damoh Jhabua
VI VII VI VII
1. Primary School Available Available Available Available
- Available - Available
- Available - Available
Nil Available Available Available
Nil Available Available Available
Available in
good condition
Available in good
condition
Available Available
6. Financial institutes
Post Not available Available Available Available
Bank Not available Available Available Available
Other Not available Available Not available Available
7. Non financial list
(a) Private farm centre Not available Not available Not available Available
(b) Government Not available Not available Not available Available
(c) K.V.I.C Not available Not available Not available Not
available
(d) Other Not available Not available Not available Not
available
8. Non GOvt. institution
(a) Coop Not available Available Not available Available
(b) SHGS. Not available Available Not available Available
© NGOs for rural level Not available Not available Not available Available
9. Post harvest facility
(a) Cold storage Not available Not available Not available Not
available
(b) Exists Not available Available Not available Available
10. Industries etc. Not available Available Not available Available
11. Mandi (regulated market) Not available Available Not available Available
12 PD5/ CoOp Soc. Available Available Available Available
13. Market ( local) Not available Available Not available Available
27
Chapter IV (b)
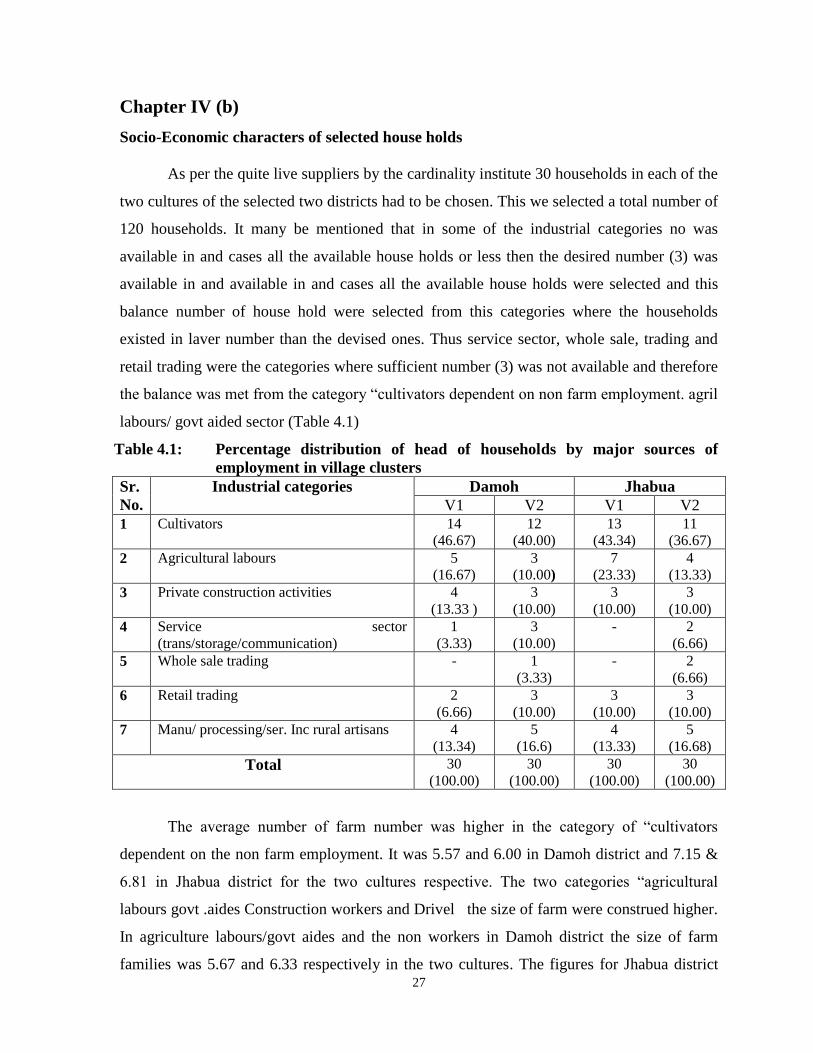
Socio-Economic characters of selected house holds
As per the quite live suppliers by the cardinality institute 30 households in each of the
two cultures of the selected two districts had to be chosen. This we selected a total number of
120 households. It many be mentioned that in some of the industrial categories no was
available in and cases all the available house holds or less then the desired number (3) was
available in and available in and cases all the available house holds were selected and this
balance number of house hold were selected from this categories where the households
existed in laver number than the devised ones. Thus service sector, whole sale, trading and
retail trading were the categories where sufficient number (3) was not available and therefore
the balance was met from the category “cultivators dependent on non farm employment. agril
labours/ govt aided sector (Table 4.1)
Table 4.1: Percentage distribution of head of households by major sources of
employment in village clusters
Sr.
No.
Industrial categories Damoh Jhabua
V1 V2 V1 V2
1 Cultivators 14
(46.67)
12
(40.00)
13
(43.34)
11
(36.67)
2 Agricultural labours 5
(16.67)
3
(10.00)
7
(23.33)
4
(13.33)
3 Private construction activities 4
(13.33 )
3
(10.00)
3
(10.00)
3
(10.00)
4 Service sector
(trans/storage/communication)
1
(3.33)
3
(10.00)
- 2
(6.66)
5 Whole sale trading - 1
(3.33)
- 2
(6.66)
6 Retail trading 2
(6.66)
3
(10.00)
3
(10.00)
3
(10.00)
7 Manu/ processing/ser. Inc rural artisans 4
(13.34)
5
(16.6)
4
(13.33)
5
(16.68)
Total 30
(100.00)
30
(100.00)
30
(100.00)
30
(100.00)
The average number of farm number was higher in the category of “cultivators
dependent on the non farm employment. It was 5.57 and 6.00 in Damoh district and 7.15 &
6.81 in Jhabua district for the two cultures respective. The two categories “agricultural
labours govt .aides Construction workers and Drivel the size of farm were construed higher.
In agriculture labours/govt aides and the non workers in Damoh district the size of farm
families was 5.67 and 6.33 respectively in the two cultures. The figures for Jhabua district
28
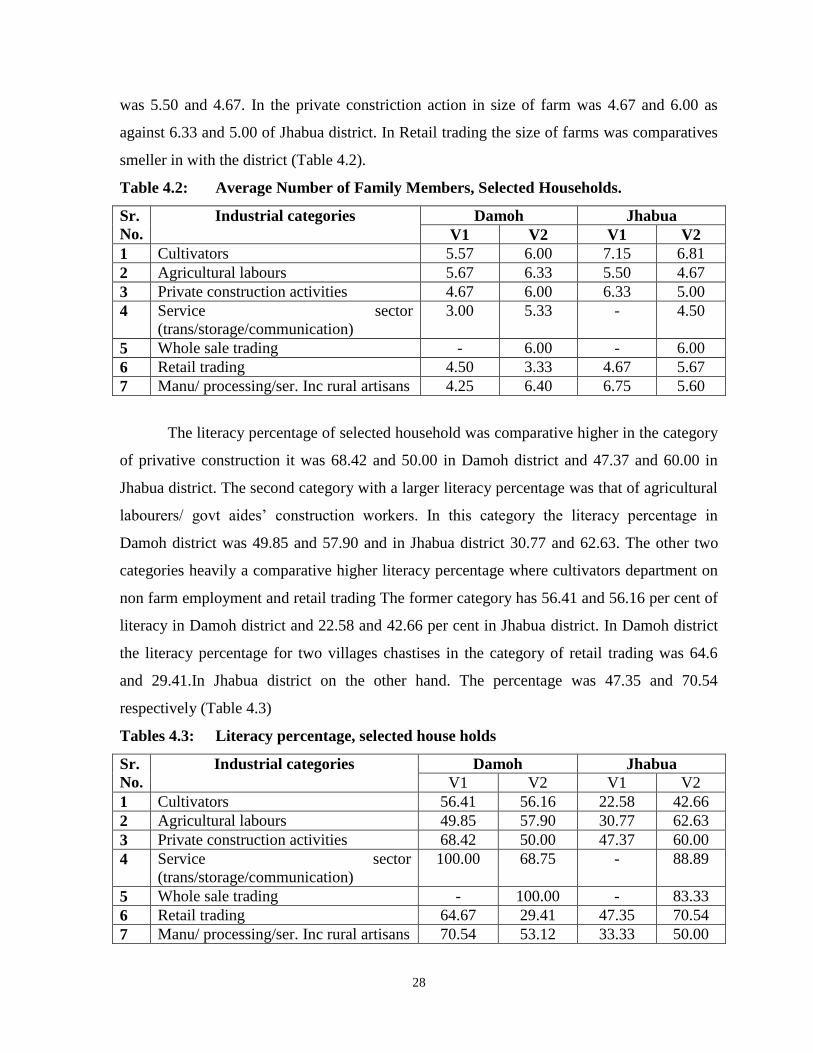
was 5.50 and 4.67. In the private constriction action in size of farm was 4.67 and 6.00 as
against 6.33 and 5.00 of Jhabua district. In Retail trading the size of farms was comparatives
smeller in with the district (Table 4.2).
Table 4.2: Average Number of Family Members, Selected Households.
Sr.
No.
Industrial categories Damoh Jhabua
V1 V2 V1 V2
1 Cultivators 5.57 6.00 7.15 6.81
2 Agricultural labours 5.67 6.33 5.50 4.67
3 Private construction activities 4.67 6.00 6.33 5.00
4 Service sector
(trans/storage/communication)
3.00 5.33 - 4.50
5 Whole sale trading - 6.00 - 6.00
6 Retail trading 4.50 3.33 4.67 5.67
7 Manu/ processing/ser. Inc rural artisans 4.25 6.40 6.75 5.60
The literacy percentage of selected household was comparative higher in the category
of privative construction it was 68.42 and 50.00 in Damoh district and 47.37 and 60.00 in
Jhabua district. The second category with a larger literacy percentage was that of agricultural
labourers/ govt aides’ construction workers. In this category the literacy percentage in
Damoh district was 49.85 and 57.90 and in Jhabua district 30.77 and 62.63. The other two
categories heavily a comparative higher literacy percentage where cultivators department on
non farm employment and retail trading The former category has 56.41 and 56.16 per cent of
literacy in Damoh district and 22.58 and 42.66 per cent in Jhabua district. In Damoh district
the literacy percentage for two villages chastises in the category of retail trading was 64.6
and 29.41.In Jhabua district on the other hand. The percentage was 47.35 and 70.54
respectively (Table 4.3)
Tables 4.3: Literacy percentage, selected house holds
Sr.
No.
Industrial categories Damoh Jhabua
V1 V2 V1 V2
1 Cultivators 56.41 56.16 22.58 42.66
2 Agricultural labours 49.85 57.90 30.77 62.63
3 Private construction activities 68.42 50.00 47.37 60.00
4 Service sector
(trans/storage/communication)
100.00 68.75 - 88.89
5 Whole sale trading - 100.00 - 83.33
6 Retail trading 64.67 29.41 47.35 70.54
7 Manu/ processing/ser. Inc rural artisans 70.54 53.12 33.33 50.00

29
As in absented else where in the country. The literacy in general inferred to be
information and up to primary leveling thru villages the concentration of literacy in the
selected villages also indicates to this fact. Seem to impurely and primary level literacy was
the class of literates who were educated up to middle school level comparatives laver
percentage of literates have indicted to the having literacy level of higher education
graduation. Post graduate and technical education a level of literacy was foam to be very
insignificant in the selected villages. It is not warily the service sector and communication
this level of education. (Table 4.4).
It was observed that all the households in this category of service sector and
wholesale trading had work account optionally then were better. It household economically
and for then opening of account in a bank was more of a necessity than luxury. Amount other
categories agricultural labourers and those working on government aided construction
workers had 66.67 per cent bank account holders this was so became in many of the
government workers payment of wipes etc. in made through banks and individual has to open
bank account (table 4.5).
.Tables 4.5 Percentage of Households with Bank Account
Sr.
No.
Industrial categories Damoh Jhabua
V1 V2 V1 V2
1 Cultivators 35.71 25.00 30.76 45.45
2 Agricultural labours 20.00 100.00 0.00 6.67
3 Private construction activities 0.00 100.00 33.33 25.00
4 Service sector
(trans/storage/communication)
100.00 33.33 - 100.00
5 Whole sale trading - 100.00 - 100.00
6 Retail trading 50.00 0.00 0.00 33.33
7 Manu/ processing/ser. Inc rural artisans 50.00 60.00 0.00 60.00
The average number of animals per household was highest (3.00) in the category of
cultivators size then had some land and since the mechanization has not reached the marginal
and small hold. They have to keep some draught animals for famines purpose (table 4.6).
.Tables 4.6: Average Animal per Household
Sr.
No.
Industrial categories Damoh Jhabua
V1 V2 V1 V2
1 Cultivators 1.86 3.50 1.15 3.00
2 Agricultural labours 2.33 4.75 7.00 1.50

30
3 Private construction activities 1.00 2.33 0.50 2.25
4 Service sector
(trans/storage/communication)
- 1.00 - 2.00
5 Whole sale trading - - 1.00 1.50
6 Retail trading - 1.00 - 1.00
7 Manu/ processing/ser. Inc rural artisans 1.00 2.00 - 3.00
All the selected households except two had own houses. In service sector of Damoh
district, 1 out of 3 and same cluster in the category of manufacturing/ processing etc had
hired a house (Table 4.7).
Tables 4.7: total Frequency and Percentage of Household Ownerships
Sr.
No.
Industrial categories Damoh Jhabua
VI V2 V1 V2
H H H H
1 Cultivators - 14
(100)
- 12
(100)
- 13
(100)
- 11
(100)
2 Agricultural labours - .5
(100)
- 8
(100)
- 7
(100)
- 4
(100)
3 Private construction activities - 4
(100)
- 3
(100)
- 3
(100)
- 3
(100)
4 Service sector
(trans/storage/communication)
- 1
(100)
1
(33.3)
2
(66.67)
- - - 2
(100)
5 Whole sale trading - - - 1
(100)
- - - 2
(100)
6 Retail trading - 2
(100)
- 3
(100)
- 3
(100)
- 3
7 Manu/ processing/ser. Inc rural
artisans
- 4
(100)
1
(20)
4
(100)
- 4
(100)
- 5
(100)
When the houses of the selected house holds were categories as thatched, filed or
concrete it was observed that majority of them has filed roof. One for houses had roof made
of concrete although the type of roof does not direct relate with the economic condition of an
individual households the person who could spare the retro income would spurt it on
concretization the roof which in some places is a symbol of prosperity. (Table 4.8)
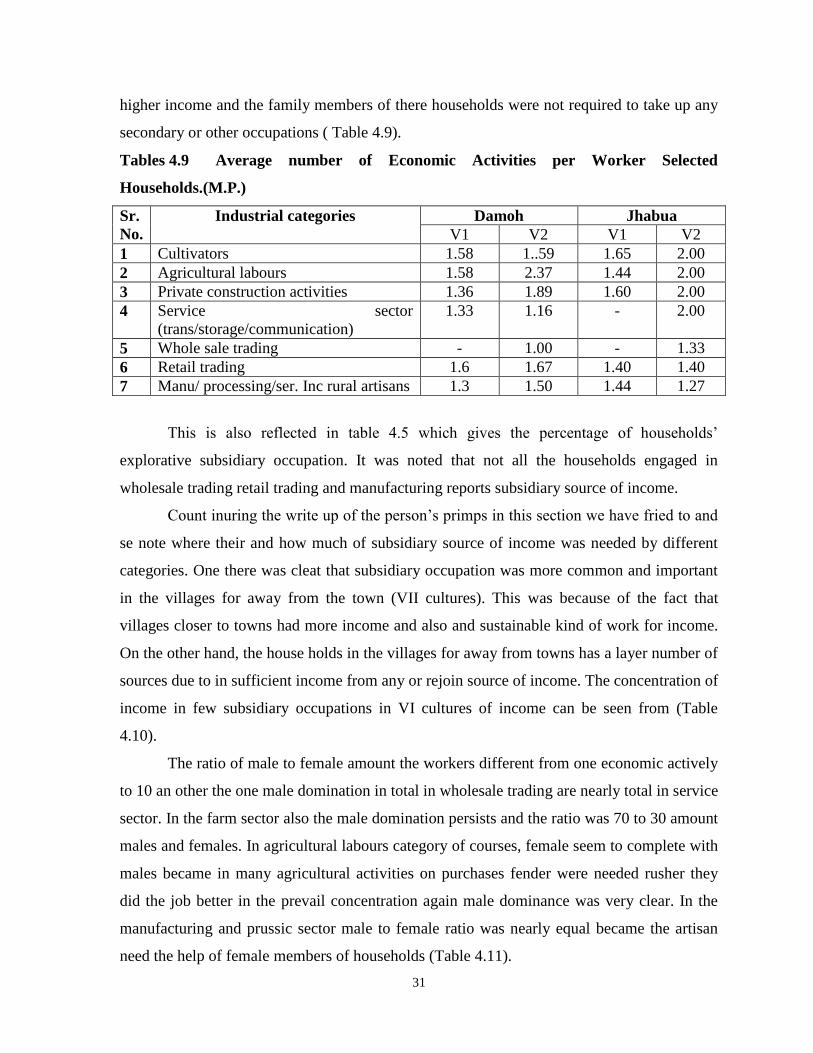
The average number of economic activities showed 2 things firstly in both the
districts. The village clustered which is move than 10 kms away had larger number of
activities per worker than those in villages nearer to him towns. This was necessary because
the persons away from towns had to find out larger number of means of livelihood because of
restricted income from the main activity which the households perform second some of the
occupations-------------------------------------------------------------- –. a move had inherent
31
higher income and the family members of there households were not required to take up any
secondary or other occupations ( Table 4.9).
Tables 4.9 Average number of Economic Activities per Worker Selected
Households.(M.P.)
Sr.
No.
Industrial categories Damoh Jhabua
V1 V2 V1 V2
1 Cultivators 1.58 1..59 1.65 2.00
2 Agricultural labours 1.58 2.37 1.44 2.00
3 Private construction activities 1.36 1.89 1.60 2.00
4 Service sector
(trans/storage/communication)
1.33 1.16 - 2.00
5 Whole sale trading - 1.00 - 1.33
6 Retail trading 1.6 1.67 1.40 1.40
7 Manu/ processing/ser. Inc rural artisans 1.3 1.50 1.44 1.27
This is also reflected in table 4.5 which gives the percentage of households’
explorative subsidiary occupation. It was noted that not all the households engaged in
wholesale trading retail trading and manufacturing reports subsidiary source of income.
Count inuring the write up of the person’s primps in this section we have fried to and
se note where their and how much of subsidiary source of income was needed by different
categories. One there was cleat that subsidiary occupation was more common and important
in the villages for away from the town (VII cultures). This was because of the fact that
villages closer to towns had more income and also and sustainable kind of work for income.
On the other hand, the house holds in the villages for away from towns has a layer number of
sources due to in sufficient income from any or rejoin source of income. The concentration of
income in few subsidiary occupations in VI cultures of income can be seen from (Table
4.10).
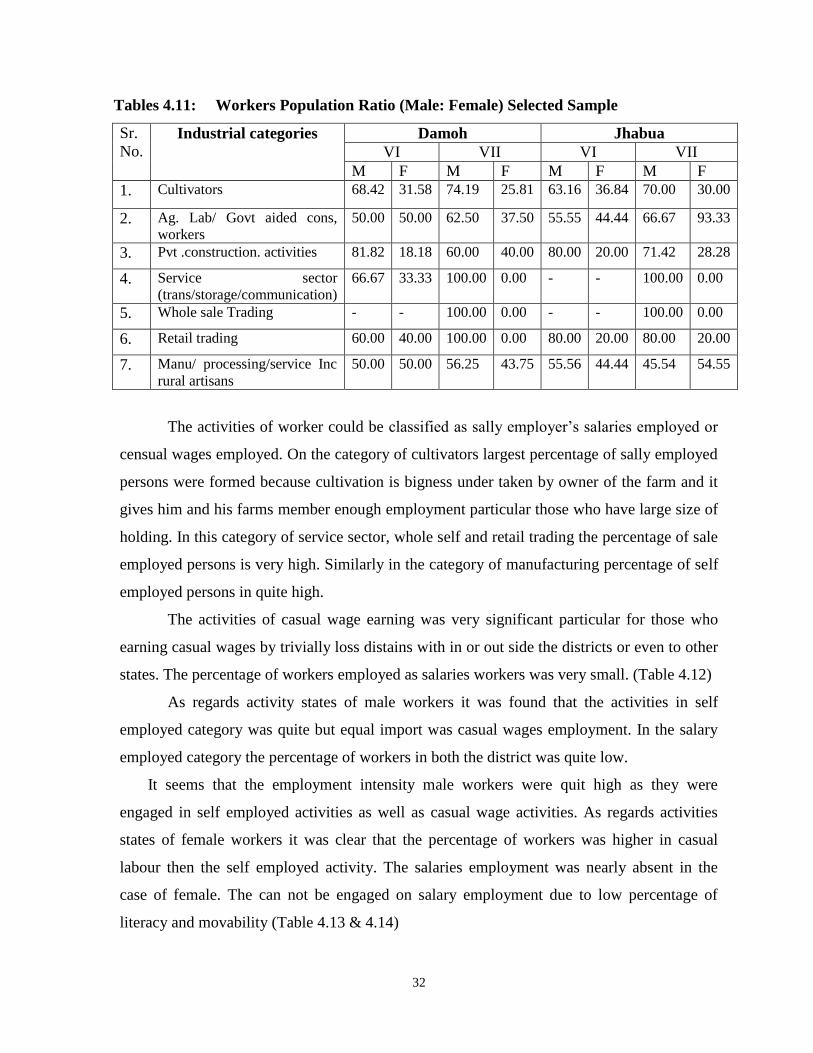
The ratio of male to female amount the workers different from one economic actively
to 10 an other the one male domination in total in wholesale trading are nearly total in service
sector. In the farm sector also the male domination persists and the ratio was 70 to 30 amount
males and females. In agricultural labours category of courses, female seem to complete with
males became in many agricultural activities on purchases fender were needed rusher they
did the job better in the prevail concentration again male dominance was very clear. In the
manufacturing and prussic sector male to female ratio was nearly equal became the artisan
need the help of female members of households (Table 4.11).
32
Tables 4.11: Workers Population Ratio (Male: Female) Selected Sample
Sr.
No. Industrial categories Damoh Jhabua
VI VII VI VII
M F M F M F M F
1. Cultivators 68.42 31.58 74.19 25.81 63.16 36.84 70.00 30.00
2. Ag. Lab/ Govt aided cons,
workers
50.00 50.00 62.50 37.50 55.55 44.44 66.67 93.33
3. Pvt .construction. activities 81.82 18.18 60.00 40.00 80.00 20.00 71.42 28.28
4. Service sector
(trans/storage/communication)
66.67 33.33 100.00 0.00 - - 100.00 0.00
5. Whole sale Trading - - 100.00 0.00 - - 100.00 0.00
6. Retail trading 60.00 40.00 100.00 0.00 80.00 20.00 80.00 20.00
7. Manu/ processing/service Inc
rural artisans
50.00 50.00 56.25 43.75 55.56 44.44 45.54 54.55
The activities of worker could be classified as sally employer’s salaries employed or
censual wages employed. On the category of cultivators largest percentage of sally employed
persons were formed because cultivation is bigness under taken by owner of the farm and it
gives him and his farms member enough employment particular those who have large size of
holding. In this category of service sector, whole self and retail trading the percentage of sale
employed persons is very high. Similarly in the category of manufacturing percentage of self
employed persons in quite high.
The activities of casual wage earning was very significant particular for those who
earning casual wages by trivially loss distains with in or out side the districts or even to other
states. The percentage of workers employed as salaries workers was very small. (Table 4.12)
As regards activity states of male workers it was found that the activities in self
employed category was quite but equal import was casual wages employment. In the salary
employed category the percentage of workers in both the district was quite low.
It seems that the employment intensity male workers were quit high as they were
engaged in self employed activities as well as casual wage activities. As regards activities
states of female workers it was clear that the percentage of workers was higher in casual
labour then the self employed activity. The salaries employment was nearly absent in the
case of female. The can not be engaged on salary employment due to low percentage of
literacy and movability (Table 4.13 & 4.14)

33
It was observed that casual workers were mainly engaged as agriculture labours and to some
extent government aided construction work and Perivale construction activities. Fewer
persons were engaged as casual labourers in transport and manufacturing. There was a case
each in selected district wherein the labourers were in activity related to trade. There was an
important category group under “others” which generally meant non agricultural labour and
formed significant percentage. These were the persons who were engaged in some kind of
menial activities such as rickshaw pulling, part time agricultural labours, household work and
a very significant portion of work days in breaking of stones. (Table 4.15)
The wages were highest in the private construction activities and the category of
transport, communication and storage. In this category also, wages were comparatively
higher for the worker near to the town than for those 10 km away from the town. Similarly,
the wage range was lower for these categories of worker. It can thus be concluded that wage
earning was more lucrative for those who were residing near to town. Next to private
construction activities and transport/ storage the wages were second high in the care of
agriculture. The wages were lowest in the manufacturing percentage etc. mains due to the
feel that this category consists of bidi workers who where quite low paid not they were l
exported to the largest extent. The another reason for low wages of this category was
existences of large number of female workers and males who had no opposing if working
other than doing bidi making as it was a part time job. (Table 4.16)
34
Chapter V
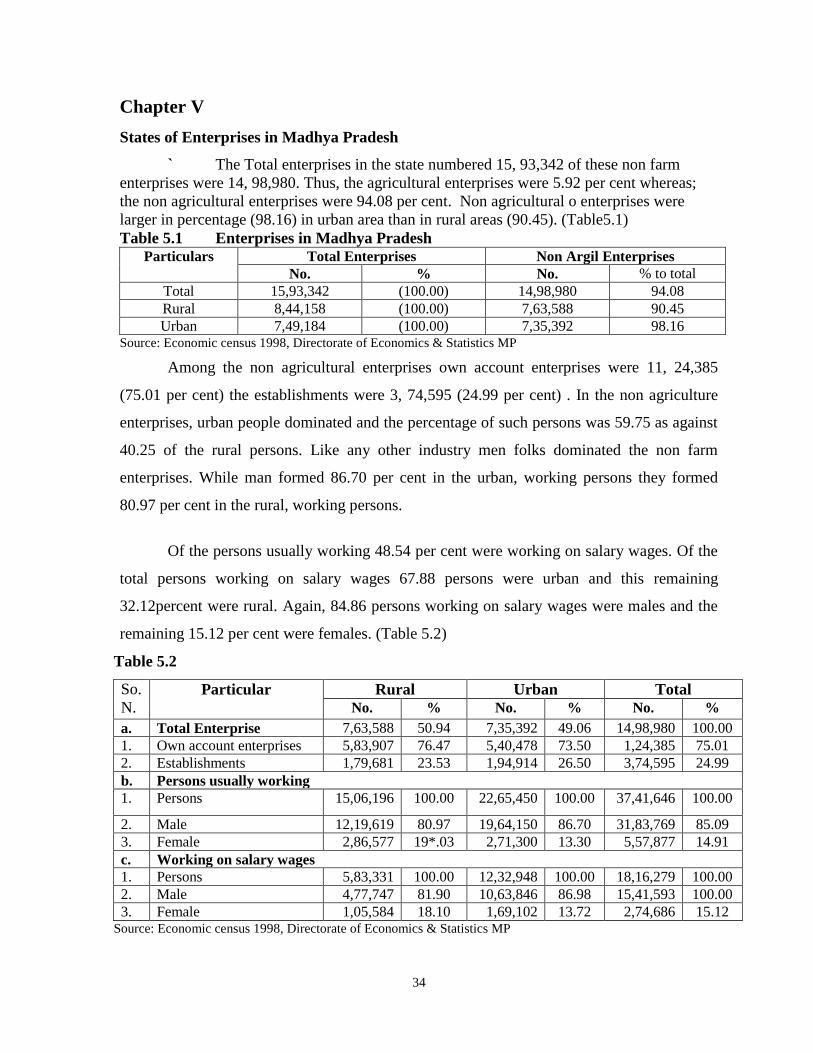
States of Enterprises in Madhya Pradesh
` The Total enterprises in the state numbered 15, 93,342 of these non farm
enterprises were 14, 98,980. Thus, the agricultural enterprises were 5.92 per cent whereas;
the non agricultural enterprises were 94.08 per cent. Non agricultural o enterprises were
larger in percentage (98.16) in urban area than in rural areas (90.45). (Table5.1)
Table 5.1 Enterprises in Madhya Pradesh
Particulars Total Enterprises Non Argil Enterprises
No. % No. % to total
Total 15,93,342 (100.00) 14,98,980 94.08
Rural 8,44,158 (100.00) 7,63,588 90.45
Urban 7,49,184 (100.00) 7,35,392 98.16 Source: Economic census 1998, Directorate of Economics & Statistics MP
Among the non agricultural enterprises own account enterprises were 11, 24,385
(75.01 per cent) the establishments were 3, 74,595 (24.99 per cent) . In the non agriculture
enterprises, urban people dominated and the percentage of such persons was 59.75 as against
40.25 of the rural persons. Like any other industry men folks dominated the non farm
enterprises. While man formed 86.70 per cent in the urban, working persons they formed
80.97 per cent in the rural, working persons.
Of the persons usually working 48.54 per cent were working on salary wages. Of the
total persons working on salary wages 67.88 persons were urban and this remaining
32.12percent were rural. Again, 84.86 persons working on salary wages were males and the
remaining 15.12 per cent were females. (Table 5.2)
Table 5.2
So.
N. Particular Rural Urban Total
No. % No. % No. %
a. Total Enterprise 7,63,588 50.94 7,35,392 49.06 14,98,980 100.00
1. Own account enterprises 5,83,907 76.47 5,40,478 73.50 1,24,385 75.01
2. Establishments 1,79,681 23.53 1,94,914 26.50 3,74,595 24.99
b. Persons usually working
1. Persons 15,06,196 100.00 22,65,450 100.00 37,41,646 100.00
2. Male 12,19,619 80.97 19,64,150 86.70 31,83,769 85.09
3. Female 2,86,577 19*.03 2,71,300 13.30 5,57,877 14.91
c. Working on salary wages
1. Persons 5,83,331 100.00 12,32,948 100.00 18,16,279 100.00
2. Male 4,77,747 81.90 10,63,846 86.98 15,41,593 100.00
3. Female 1,05,584 18.10 1,69,102 13.72 2,74,686 15.12 Source: Economic census 1998, Directorate of Economics & Statistics MP
35
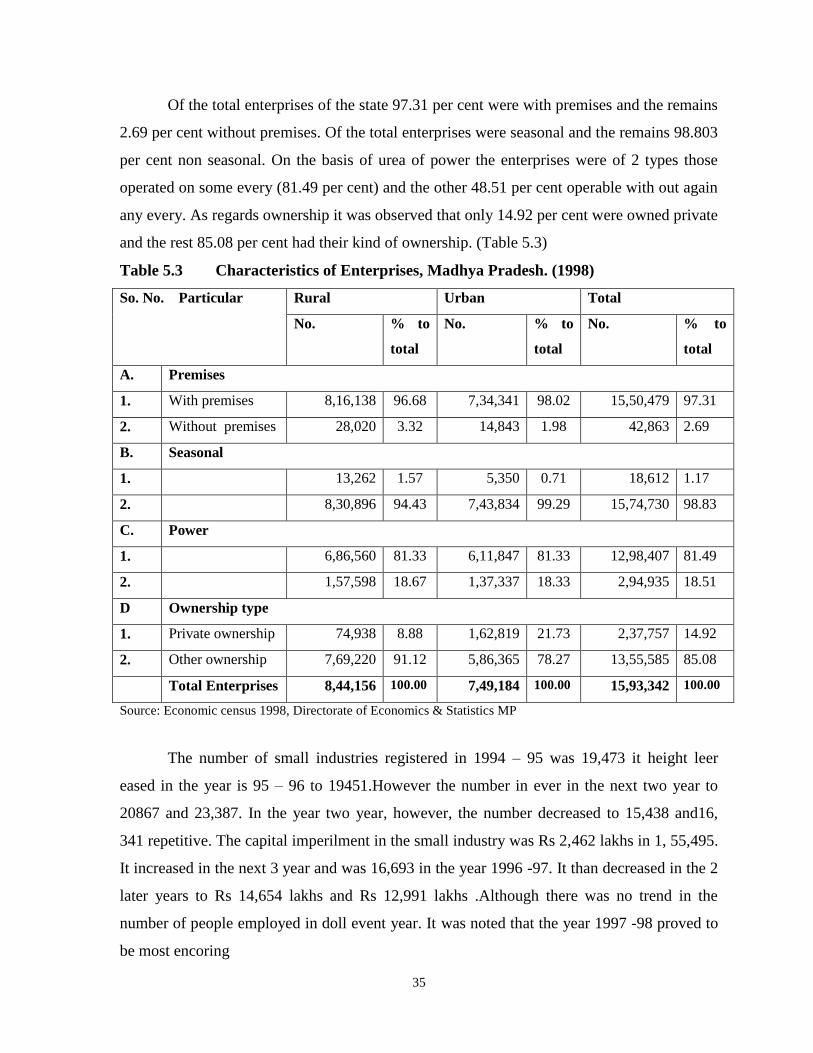
Of the total enterprises of the state 97.31 per cent were with premises and the remains
2.69 per cent without premises. Of the total enterprises were seasonal and the remains 98.803
per cent non seasonal. On the basis of urea of power the enterprises were of 2 types those
operated on some every (81.49 per cent) and the other 48.51 per cent operable with out again
any every. As regards ownership it was observed that only 14.92 per cent were owned private
and the rest 85.08 per cent had their kind of ownership. (Table 5.3)
Table 5.3 Characteristics of Enterprises, Madhya Pradesh. (1998)
So. No. Particular Rural Urban Total
No. % to
total
No. % to
total
No. % to
total
A. Premises
1. With premises 8,16,138 96.68 7,34,341 98.02 15,50,479 97.31
2. Without premises 28,020 3.32 14,843 1.98 42,863 2.69
B. Seasonal
1. 13,262 1.57 5,350 0.71 18,612 1.17
2. 8,30,896 94.43 7,43,834 99.29 15,74,730 98.83
C. Power
1. 6,86,560 81.33 6,11,847 81.33 12,98,407 81.49
2. 1,57,598 18.67 1,37,337 18.33 2,94,935 18.51
D Ownership type
1. Private ownership 74,938 8.88 1,62,819 21.73 2,37,757 14.92
2. Other ownership 7,69,220 91.12 5,86,365 78.27 13,55,585 85.08
Total Enterprises 8,44,156 100.00 7,49,184 100.00 15,93,342 100.00
Source: Economic census 1998, Directorate of Economics & Statistics MP
The number of small industries registered in 1994 – 95 was 19,473 it height leer
eased in the year is 95 – 96 to 19451.However the number in ever in the next two year to
20867 and 23,387. In the year two year, however, the number decreased to 15,438 and16,
341 repetitive. The capital imperilment in the small industry was Rs 2,462 lakhs in 1, 55,495.
It increased in the next 3 year and was 16,693 in the year 1996 -97. It than decreased in the 2
later years to Rs 14,654 lakhs and Rs 12,991 lakhs .Although there was no trend in the
number of people employed in doll event year. It was noted that the year 1997 -98 proved to
be most encoring

36
became in that year the number of units and the capital investment were highest this was
regretted in the number of employment which stood at 57,094 (highest ) in that very. In the
year 1998 and 1999 – 2000 the employment also declined as were the number of unit and the
capital investment. (Table 5.4)
Table 5.4 Permanents Registration of Small Industries
Period Units Capital investment/Lakhs Rs Employment
1994-95 19,473 2,462 46,057
1995-96 19,451 8,796 54,230
1996-97 20,867 11,021 50,824
1997-98 23,387 16,693 57,094
1998-99 19,438 14,654 46,232
1999-2000 16,341 12,991 40,093
Source: www.mp.nic.in
While for small industries the year 1997-98 proved to be good for the large and
medium industries year 1996- 97 proved to be better than all the year. In that a fixed capital
of 3,948.96 crore was invested the number was also highest (12,178) in that year. Yearling to
1996-97 the number of manufacturing with were 46 & 43. In the year which followed 1996-
97 the peak year the manufacturing with generally declined the fixed capital till 96-97
showed variation but the year latter for 1996-97 definitely proved to be shy of capital. The
same can be said to be true for the employment. On both sired of the year 1996-97 the
employment was not as good. (Table 5.5)
Table 5.5 Large &Medium Industries Established
Period Number of manufacturing
industries established during the
year
Fixed capital crore Rs
( 31st March )
Employment (Nos)
(31 st March)
1994-95 46 1,756.14 7,553
1995-96 43 1,479.86 8,448
1996-97 68 3,948.96 12,178
1997-98 44 968.94 5,651
1998-99 15 337.00 1,812
1999-2000 18 313.00 2,223
Source: www.mp.nic.in

37
5.2 Gross State Domestic Product
With a growth of 7.47 per cent during the year, gross state domestic product of
Madhya Pradesh at constant (1993-94) prices has been estimated at Rs. 53,179 crores in
2000-01. At current [price with a growth of 11.10 per cent it has been estimated at Rs. 81,286
crores in 2001-02 as against Rs. 73,165 crores in 2001-02. At the national level, in the new
series, gross domestic product for all- India during this period registered a growth of 5.57 per
cent at constant (1993-94) prices and 9.19 per cent at current prices, which is less than the
states growth. (Table 5.6)
Table 5.6 Gross Domestic Product, All India and Madhya Pradesh
Year
Comparative figures (Crore Rs.) Percentage increase over previous year
All India Madhya Pradesh All India Madhya Pradesh
At
current
prices
At
constant
prices
At
current
Prices
At
constant
prices
At
current
Prices
At
constant
prices
At
current
prices
At
constant
prices
1993-94 7,81,345 7,81,345 37,971 37,971 - - - -
1994-95 9,17,058 8,38,031 42,339 39,070 17.37 7.25 11.50 2.89
1995-96 10,73,271 8,99,563 47,841 41,464 17.03 7.34 13.00 6.13
1996-97 12,43,546 9,70,083 55,049 44,170 15.87 7.84 15.07 6.53
1997-98 13,90,148 10,16,594 60,062 46,380 11.79 4.79 9.11 5.00
1998-99 15,98,127 10,82,278 69,216 49,342 .14.96 6.51 15.24 6.38
1999-00 17,61,932 11,48,442 77,804 54,425 10.25 6.07 12.41 10.30
2000-01 19,17,724 11,98685 73,165 49,482 8.84 4.37 -5.96 -9.08
2001-02 20,94,013 12,65,429 81,286 53,179 9.19 5.57 11.10 7.47
5.3 Net State Domestic product
With a growth of 8.20 per cent during the year net state domestic product of Madhya
Pradesh at constant (1993-94) prices has been estimated at Rs 46646 crores in 2001-02 as
against Rs 43112 crores in 2000-01. At current prices with a growth of 12.06 per cent, it has
been estimated at Rs. 71,594 crores in 2001-02 as against Rs 63,890 crores in 2000-01. Net
domestic product for all India during this period registered a growth of 5.73 per cent at
constant (1993-94) prices and 9.13 per cent at current prices. (Table 5.7)
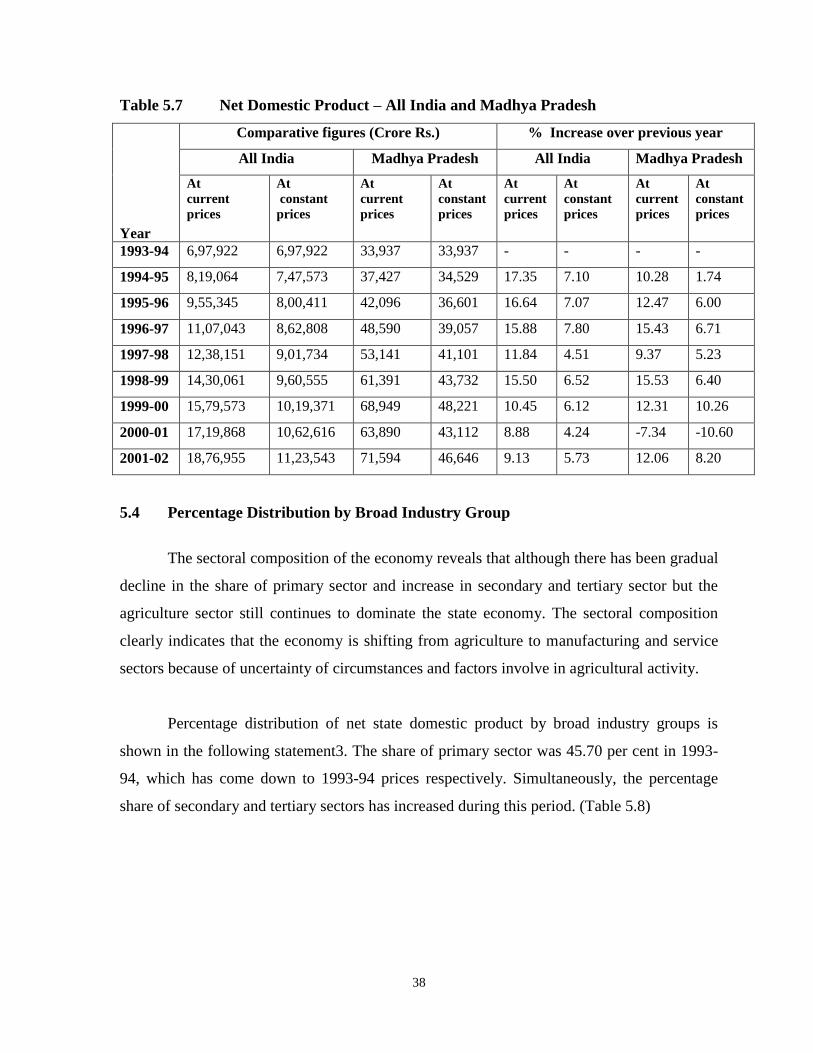
38
Table 5.7 Net Domestic Product – All India and Madhya Pradesh
Year
Comparative figures (Crore Rs.) % Increase over previous year
All India Madhya Pradesh All India Madhya Pradesh
At
current
prices
At
constant
prices
At
current
prices
At
constant
prices
At
current
prices
At
constant
prices
At
current
prices
At
constant
prices
1993-94 6,97,922 6,97,922 33,937 33,937 - - - -
1994-95 8,19,064 7,47,573 37,427 34,529 17.35 7.10 10.28 1.74
1995-96 9,55,345 8,00,411 42,096 36,601 16.64 7.07 12.47 6.00
1996-97 11,07,043 8,62,808 48,590 39,057 15.88 7.80 15.43 6.71
1997-98 12,38,151 9,01,734 53,141 41,101 11.84 4.51 9.37 5.23
1998-99 14,30,061 9,60,555 61,391 43,732 15.50 6.52 15.53 6.40
1999-00 15,79,573 10,19,371 68,949 48,221 10.45 6.12 12.31 10.26
2000-01 17,19,868 10,62,616 63,890 43,112 8.88 4.24 -7.34 -10.60
2001-02 18,76,955 11,23,543 71,594 46,646 9.13 5.73 12.06 8.20
5.4 Percentage Distribution by Broad Industry Group
The sectoral composition of the economy reveals that although there has been gradual
decline in the share of primary sector and increase in secondary and tertiary sector but the
agriculture sector still continues to dominate the state economy. The sectoral composition
clearly indicates that the economy is shifting from agriculture to manufacturing and service
sectors because of uncertainty of circumstances and factors involve in agricultural activity.
Percentage distribution of net state domestic product by broad industry groups is
shown in the following statement3. The share of primary sector was 45.70 per cent in 1993-
94, which has come down to 1993-94 prices respectively. Simultaneously, the percentage
share of secondary and tertiary sectors has increased during this period. (Table 5.8)

39
Table 5.8: Percentage Distribution of Net State Domestic Product, Madhya
Pradesh,
Industry groups Base
year
At current prices At constant 1993-94
prices
93-94 99-00 00-01(P) 01-02 99-00 00-01 01-02
Primary Sector
Agriculture ,Forestry etc. 45.70 38.99 31.79 33.83 37.28 31.13 33.12
Secondary Sector
Manufacturing,
Construction
18.60 22.93 26.78 25.60 25.71 29.06 28.11
Tertiary Sector
Transport &
Communication
16.51 17.12 17.17 17.13 16.59 16.97 17.01
Banking & Insurance, real 8.58 8.26 9.89 9.73 8.45 9.52 8.87
Community Services 10.61 12.70 14.37 13.71 11.97 13.32 12.89
Net State Domestic
Product
100.00 100.00 100.00 100.00 100.00 100.00 100.00
5.5 Organized and Un- organized Sector
Percentage share of organized and un- organized sectors by broad industry a group is
shown below in statement 7. The share of organized sector in gross state domestic product (at
factor cost ) at current price increased from 35.43 per cent of the base year 1993-94 to 40.31
per cent in the year 2001-02, where as during the same period share of unorganized sector
reduced from 64.57 per cent to 59.69 per cent. (Table 5.9)
Table 5.9: Percentage Share of Organized and Un- organized Sectors
Industry group 1993-94 2000-2001 (P) 2001-2002 (Q)
Org. Un-org Org. Un-org Org. Un-org
Primary sector 11.85 88.15 15.77 84.23 14.52 85.48
Manufacturing, Construction
etc.
67.93 32.07 70.00 30.00 70.30 29.70
Transport, communication,
Trade
35.29 64.71 39.40 60.60 37.87 62.13

40
Banking, Insurance, Real
Estate,
26.77 73.23 34.18 65.82 33.12 66.88
Community & Personal services 78.01 21.99 76.92 23.08 75.91 24.09
Gross state domestic product 35.43 64.57 42.10 57.90 40.31 59.69
Note: Organized sector includes public sector, registered manufacturing, registered societies, etc.
5.6 Enterprises in Selected District
The number of register working enterprises was lager in number in Jhabua district
than Damoh district. So was the number of employments. In Jhabua district in 1991 the
number of registered working enterprises was 68 as against 52 in Damoh. Similarly the
number of employment in Jhabua district was 2519 against 1598 in Damoh. In the year 2000
also against the 87 register working industries in Jhabua the number was 65 in Damoh
district. The number of employed was higher in Jhabua (4,229) than Damoh (3,196).
(Table5.10)
Table 5.10: Enterprises in Selected District
So.
No.
1991 2000
Damoh Jhabua MP. Damoh Jhabua MP.
1. 52 68 10,427 65 87 10,895
2. 6 6 16 6 6 18
3. 1,598 2,519 3,90,766 3,196 4,229 6,31,825
4. 178 223 590 292 272 1,044
In 1980 the total number of enterprises in Damoh district was 4,175 and that in
Jhabua district 9,784. In 1990 the number in Damoh district increased to 60,400 and that in
Jhabua district increased to 14,875. In both the districts the number increased furls her in
1998. While it stood as 67,291 in Damoh district it was 18,019 in Jhabua district. Thus, there
has been increased in the number of enterprises in the 3 year of 1980- 1990 and but the
increase was much larger in Damoh district than Jhabua district.
In Damoh district the number of units working persons increased for 84,225 in 1980
to 1, 29,166 in 1990 and furl her to 1, 34,983 in 1998. For the same year the number of
persons working in Jhabua district was 23,344 in 36,843 and 43,763 inspective. Jhabua, both

41
the number of enterprises and the person’s surely working in then were higher in Damoh
district as comp roved Jhabua district. However the index surely working in then increased
at a higher rate in Jhabua district than Damoh district. (Table 5.11)