Embed Size (px)
Citation preview

Non-exclusion separation techniques for polyamides
Citation for published version (APA):Mengerink, Y. (2001). Non-exclusion separation techniques for polyamides. Eindhoven: Technische UniversiteitEindhoven. https://doi.org/10.6100/IR549993
DOI:10.6100/IR549993
Document status and date:Published: 01/01/2001
Document Version:Publisher’s PDF, also known as Version of Record (includes final page, issue and volume numbers)
Please check the document version of this publication:
• A submitted manuscript is the version of the article upon submission and before peer-review. There can beimportant differences between the submitted version and the official published version of record. Peopleinterested in the research are advised to contact the author for the final version of the publication, or visit theDOI to the publisher's website.• The final author version and the galley proof are versions of the publication after peer review.• The final published version features the final layout of the paper including the volume, issue and pagenumbers.Link to publication
General rightsCopyright and moral rights for the publications made accessible in the public portal are retained by the authors and/or other copyright ownersand it is a condition of accessing publications that users recognise and abide by the legal requirements associated with these rights.
• Users may download and print one copy of any publication from the public portal for the purpose of private study or research. • You may not further distribute the material or use it for any profit-making activity or commercial gain • You may freely distribute the URL identifying the publication in the public portal.
If the publication is distributed under the terms of Article 25fa of the Dutch Copyright Act, indicated by the “Taverne” license above, pleasefollow below link for the End User Agreement:www.tue.nl/taverne
Take down policyIf you believe that this document breaches copyright please contact us at:[email protected] details and we will investigate your claim.
Download date: 21. Jun. 2020
Non-exclusion separation techniques for polyamides
Proefschrift
ter verkrijging van de graad van doctor aan deTechnische Universiteit Eindhoven, op gezag van
de Rector Magnificus, prof.dr. R.A. van Santen, voor eencommissie aangewezen door het College voor
Promoties in het openbaar te verdedigenop maandag 26 november 2001 om 16.00 uur
door
Ynze Mengerink
geboren te Wierden

Dit proefschrift is goedgekeurd door de promotoren:
prof.dr.ir. C.A.M.G. Cramersenprof.dr. C.E. Koning
Co-promotor:dr. Sj. van der Wal
The support of DSM-Research is gratefully acknowledged

Aan Chantalle en Josh

CIP-DATA LIBRARY TECHNISCHE UNIVERSITEIT EINDHOVEN
Mengerink, Ynze
Non-exclusion separation techniques for polyamides / by Ynze Mengerink. –Eindhoven : Technische Universiteit Eindhoven, 2001.Proefschrift. – ISBN 90-386-2573-1NUGI 813Trefwoorden: analytische chemie / polyamiden ; nylon / vloeistof chromatografie ;HPLCSubject headings: analytical chemistry / polyamides ; nylon / liquid chromatography ;HPLC
© DSM Research; 2001-16796 ROmslag idee: J. SeijenOmslag en ontwerp: Paul Verspaget & Carin BruininkVoorkant: Uit DSM research 50 jaar, Interieur van de analytische afdeling 1947Druk: Universiteitsdrukkerij, TUE

Contents
1. GENERAL INTRODUCTION AND SCOPE
2. HISTORY AND SYNTHESIS OF POLYAMIDES AND SEPARATIONTECHNIQUES TO CHARACTERIZE POLYMERS IN GENERAL ANDPOLYAMIDES IN PARTICULAR2.1. History and synthesis of polyamide-62.2. Solubility of polymers and polyamides2.3. Separation techniques to characterize and quantify polymers
2.3.1. Exclusion based separation techniques2.3.2. Non-exclusion based chromatographic separation techniques2.3.2.a Normal-phase high-performance liquid chromatography2.3.2.b Reversed-phase high-performance liquid chromatography2.3.2.c Oligomers2.3.2.d Polymers2.3.3. Liquid chromatography, independent on molecular mass2.3.3.a Critical chromatography2.3.3.b Liquid chromatography at limiting conditions
2.4. Electrically driven systems2.4.1. CZE2.4.2. MEKC2.4.3. CGE2.4.4. CEC2.4.5. Electrophoretic separations of polyamides
3. ANALYSIS OF LINEAR AND CYCLIC OLIGOMERS IN POLYAMIDE-6WITHOUT SAMPLE PREPARATION BY LIQUID CHROMATOGRAPHYUSING THE SANDWICH INJECTION METHODPART I: INJECTION PROCEDURE AND COLUMN STABILITY3.1. Introduction3.2. Experimental3.3. Results and discussion
3.3.1. Sample introduction3.3.2. Column stability
3.4. Discussion / conclusions
4. ANALYSIS OF LINEAR AND CYCLIC OLIGOMERS IN POLYAMIDE-6WITHOUT SAMPLE PREPARATION BY LIQUID CHROMATOGRAPHYUSING THE SANDWICH INJECTION METHODPART II: METHODS OF DETECTION AND QUANTIFICATION ANDOVERALL LONG-TERM PERFORMANCE4.1. Introduction4.2. Experimental4.3. Results and discussion
4.3.1. Detection4.3.2. Method performance
4.4. Conclusions
1
9 10 11 12 13 16 17 18 20 24 29 29 31 32 34 34 35 36 36
41 42 44 46 46 55 57
61 62 64 65 65 72 75

5. ANALYSIS OF LINEAR AND CYCLIC OLIGOMERS IN POLYAMIDE-6WITHOUT SAMPLE PREPARATION BY LIQUID CHROMATOGRAPHYUSING THE SANDWICH INJECTION METHODPART III: SEPARATION MECHANISM AND GRADIENT OPTIMIZATION5.1. Introduction5.2. Experimental5.3. Results and discussion
5.3.1. Retention mechanism and modeling of the cyclic monomer and cyclic dimer5.3.2. Removal of the retained polyamide polymer5.3.3. Optimization of the oligomers separation5.3.3.a. Linear solvent strength model5.3.3.b. Gradient optimization
5.4. Conclusions
6. THE ANALYSIS OF HIGHER POLYAMIDE-6 OLIGOMERS ON ASILICA BASED REVERSED-PHASE COLUMN WITH GRADIENT OFFORMIC ACID AS COMPARED WITH HEXAFLUORO ISOPROPANOL6.1. Introduction6.2. Experimental6.3. Results and discussion6.4. Conclusions
7. NEW STATIONARY PHASES WITH IMPROVED KINETICPERFOMANCE FOR THE SEPERATION OF POLYAMIDE-6OLIGOMERS7.1. Introduction
7.1.1. NPS (Non-porous silica) column7.1.2. Monolithic column7.1.3. Pellicular column
7.2. Experimental7.3. Results and discussion
7.3.1. Porous 5 µm particles7.3.2. NPS7.3.3. Monoliths7.3.4. Poroshell
7.4. Conclusion
8. SEPARATION AND QUANTIFICATION OF THE LINEAR AND CYCLICSTRUCTURES OF POLYAMIDE-6 AT THE CRITICAL POINT OFADSORPTION8.1. Introduction8.2. Theory8.3. Experimental8.4. Results and discussion
8.4.1. Separation at critical conditions8.4.2. Identification by electrospray ionization mass spectrometry (ESI-MS)8.4.3. Identification by matrix-assisted laser desorption ionization time-of-flight mass spectrometry (MALDI-TOF-MS)
79 81 87 88
88 95 95 96104107
111113114116123
127128133133135136137137138141143145
147148151153154154
156
158

8.4.4. Quantification with the ELSD8.5. Conclusions
9. ENDGROUP-BASED SEPARATION AND QUANTIFICATION OFPOLYAMIDE-6 USING CRITICAL CHROMOTOGRAPHY9.1. Introduction9.2. Experimental9.3. Results and discussion
9.3.1. Optimization9.3.2. Strategy to check recovery9.3.3. Quantification
9.4. Conclusions
10. CAPILLARY ZONE ELECTROPHORESES AS A TOOL FOR THEANALYSIS OF POLYAMIDES; POSSIBILITIES AND PITFALLS10.1. Introduction10.2. Experimental10.3. Results and discussion
10.3.1. Influence of pH on system stability10.3.2. Capillary gel electrophoreses10.3.3. Potential power of CE10.3.4. Possibilities to separate polyamide-6,6 series
10.4. Conclusions / remarks
Summary
Samenvatting
Dankwoord
Curriculum vitae
Bibliography
160166
169170173174174182184186
189190192193200202203205205
207
213
219
221
223


General introduction and scope 1
Chapter 1General introduction and scope

Chapter 12
1. General Introduction and scope
It is impossible to imagine life today without polymers. They are a major part of our
consumer society and a day without these synthetic macromolecules is almost
unthinkable in human life. Polymers can be found everywhere e.g. in clothes, as
floor covering or as packaging material. Observing a car one may think that metal is
the major part of it, but polymers can be found inside (dashboard, upholstering etc.),
in front and at the rear (bumpers), left and right (trims), below (tires), after a crash
(airbags), around windows and at all kind of other places of the vehicle. Even the
initially observed metal appears to be paint, composed of polymers. It is even harder
to list parts of the automobile that do not contain polymers at all.
Obviously different properties are necessary to fulfill the different demands of the
enormous and still growing range of applications. Some polymers need to be rigid,
others need to be transparent, elastic or flexible. Some polymers need to be cheap
for disposable articles or for filling material to protect goods during transportation.
Other polymers need to be long lasting or stable at elevated temperatures. There
are many different polymers, all with different properties. Some polymers are
produced on a few kilogram scale and have very unique properties and
architectures, like dendrimers (figure 1.1).
Figure 1.1: Polypropyleneamine dendrimer Astramol-Am-64 dendrimer, also known as DAB-PA64.(Reprinted from [1] with permission from Wiley-VCH Verlag GmbH).

General introduction and scope 3
Other polymers are produced on a megaton scale. An approximation of the
abundance of some of these polymers, based on consumption volume per year, is
given in figure 1.2. To convey the annual amount of PE with road transport, a row of
trucks is needed longer than the circumference of the earth.
Figure 1.2: Overview of the world consumption of some major polymers in kTon/year. PE =PolyEthylene, PVC = PolyVinylChloride, PP = PolyPropylene, PET = PolyEthylTerephthalate, PA =PolyAmide 6 and 6,6 [2-5].
A polymer is a molecule, which is made from a large number of small molecules
(monomers). The simplest form is illustrated in figure 1.3.
X + X → XX (= X2) XX + X → XXX (= X3) ……….. Xn-1 + X → Xn
Figure 1.3: Simplified synthesis of polymers.
Two monomers X can react with each other and form the dimer XX. A third monomer
X reacts with the dimer to form a trimer XXX. This process can continue to very large
molecules containing millions of monomers. Polyamide-6 is such a polymer. The
monomer caprolactam can react by a ring opening polymerization reaction to form a
linear chain consisting of approximately 100 to 500 monomers. This polymerization
reaction is given in figure 1.4 [6].
world polymer consumption in kton/year
50000
25000 2500020000
100005000
PE PP PET PVC PS PA

Chapter 14
Figure 1.4: Polymerization reaction of the cyclic monomer caprolactam to polyamide 6.
Due to the continuous driving forces to improve and control polymer performances
and to broaden their range of applications, improved analytical tools are needed to
support these goals. Polyamide filaments with approximately 20 µm thickness are
spun with a speed of 4-6 km/min. This implies that after 24 hours a filament over
7200 km is produced. Breaking should be minimized to increase this speed.
Chemical analysis can be used to help improving this process. Additives and / or
residual amounts of oligomers will positively and negatively influence polymer
performance, chemical analysis can detect them. If a certain product discolors,
chemical analysis can help to identify the cause or find the structure of the coloring
agent. Different properties of a certain polymer could be caused by different
morphological characteristics, but could also be explained by chemical differences.
Besides enormous efforts in the field of spectroscopic techniques (e.g. NMR, IR or
MALDI-MS) [7] new ideas in separation techniques gave a better understanding of
the polymer. Classical interaction chromatography can reveal chemical properties of
polymers and low-molecular-mass oligomers and additives. Moreover, completely
new separation techniques, such as critical chromatography were developed to
analyze polymers in more detail. The coupling of different chromatographic systems
with each other and / or with spectrophotometric techniques will give new
possibilities to unravel a polymer.
Most separation techniques start from a dissolved state. However, most polymers
are not easily soluble in common chromatographic solvents like water, methanol,
acetonitrile or tetrahydrofuran. From a consumer point of view this is often essential
(rain should not dissolve your automobile), but from a chromatographic point of view,
this is unfavorable and one of the main reasons why most new separation
techniques are demonstrated and investigated by using polymers which easily match
H2NNH
HN
O
O
COOHNH
O
H2NNH
COOH
O
+

General introduction and scope 5
chromatographic demands. The overwhelming amount of articles published to
demonstrate separations of polystyrene bears no relation to the world polystyrene
consumption or the demands of the polymer scientists, but is easily explained by the
advantageous combination of available standards, tetrahydrofuran as a solvent and
the UV absorbance of the polymer above λ = 240nm [8-23].
Besides the molecular-mass distribution, which can be determined by size-exclusion
techniques, most attention in literature is focussed on qualitative aspects of the
polymer. Questions of tacticity, microstructure, blocklength in blockcopolymers or
endgroup functionality can be answered by chromatographic separation techniques.
This thesis interrelates the use of non-exclusion based separation techniques of not
easily dissolvable polyamides and the quantification of the obtained data,
demonstrating that separation techniques can play a major role in the determination
of different properties of the polymer. In chapter 2 an overview is given of the role of
different separation techniques to support polymer scientists in a better
understanding of the properties of their polymers. The separation and quantification
of low-molecular-mass polyamide oligomers (n = 1-6) is discussed in chapters 3-5. It
is demonstrated that common chromatographic solvents, like water and acetonitrile
(which are non-solvents for polyamide) in combination with the injection of a non-
pretreated polyamide solution can be used as mobile-phase constituents.
Chapter 3 focuses on a new injection procedure, where the polyamide solution is
injected directly into the HPLC system without pretreatment of the sample. The
obtained data were compared with extraction and dissolution / precipitation
procedures. Besides this injection procedure also column stability was studied.
Chapter 4 describes the different detection modes, which can be used to determine
the relatively large amounts of cyclic oligomers (UV detection) alongside to small
amounts of linear oligomers (post-column derivatization). Also, long-term
performance results obtained are discussed.
Chapter 5 discusses the irregular elution mechanism of the cyclic monomer and
cyclic dimer. It also focuses on the elution mechanism of the polymer and
optimization of separation conditions of the first six linear and cyclic oligomers of
polyamide-6.

Chapter 16
In chapter 6 and 7 the possibilities to determine higher-molecular-mass oligomers of
polyamide-6 are discussed. Due to the inherent poor solubility of these higher
oligomers, exotic mobile phases are necessary. Although 1,1,1,3,3,3-hexafluoro
isopropanol seems the most obvious choice as it has good UV transparency in the
low-UV region, formic acid turned out to be a good alternative. In chapter 6 a
comparison between these two mobile phases is made.
During chromatographic separations of higher-molecular-mass components, the
mass transfer of these molecules between the mobile and stationary phase is an
important issue. Chapter 7 outlines new stationary phases, which can be used to
separate higher oligomers. These new phases became recently available and are
characterized by the minimization of mass-transfer problems. Non-porous silica with
a particle diameter of 1.5 µm, a monolith column and a pellicular column were
tested.
Chapter 8 and 9 focuses on a new chromatographic technique, where the total
polymer is separated solely based on differences of endgroup functionalities.
Chapter 8 describes the use of this so-called critical chromatography to separate the
different macromolecules present in polyamide-6. The linear macromolecules were
separated from the cyclics, independent of their molecular mass. Using formic acid /
1-propanol as the mobile phase both classes of macromolecules gave different peak
widths at optimum separation conditions, making a correction method necessary to
perform quantification using the non-linear evaporative light-scattering detector
(ELSD).
In chapter 9 the end-group separation optimization of polyamide-6,6 using critical
chromatography in combination with UV detection is discussed. To perform
endgroup based separations of such high-molecular-mass polymers, conditions
turned out to be really critical. Besides mobile-phase composition and temperature,
also flow rate and pore width turned out to be important parameters for optimal
separation conditions. It was also demonstrated that gradients could be used,
without losing critical conditions. Using this feature selectivity could be influenced.
In analogy to separations accomplished for multiple charged macromolecules like
DNA, chapter 10 discusses the possibility to use electrophoretic techniques to
separate monocharged polyamide-6 macromolecules.
General introduction and scope 7
References
1. J.C. Hummelen, J.L.J. van Dongen, E.W. Meijer, Chem. Eur. J. 3(1997)1489-14932. K. Scheidl, PP Industry report, PP’99 polypropylene’99 8th Annual world congress, Zurich, 19993. E. Stoelzel Polyester polymer, World congress polyester ’98, Zurich, 19984. F. Charaf, Review of the global polyamide chain, Polyamide 2000, Zurich, 20005. Chemical Economics Handbook, SRI international, Menlo Park, CA, 19986. Aharoni, n-Nylons: Their Synthesis, Structure and Properties, Wiley, New York, 19977. P.B. Smith, A.J. Pasztor, M.L. McKelvy, D.M. Meunier, S.W. Froelicher, F.C.Y. Wang, Anal.
Chem. 71(1999)61R-80R8. H.C. Lee, T. Chang, Polymer 37(1996)5747-57499. G. Glockner, H. Engelhardt, D. Wolff, R. Schultz, Chromatographia 42(1996)185-19010. B. Klumperman, P. Cools, H. Philipsen, W. Staal, Macromol. Symp. 110(1996)1-1311. J.P. Larmann, J.J. DeStefano, P. Goldberg, R.W. Stout, L.R. Snyder, M.A. Stadalius, J.
Chromatogr. 255(1983)163-18912. R. Schultz, H. Engelhardt, Chromatographia 29(1990)205-21313. R.A. Shalliker, P.E. Kavanagh, I.M. Russel, J. Chromatogr. A 679(1994)105-11414. R.A. Shalliker, P.E. Kavanagh, I.M. Russel, J. Chromatogr. A 543(1991)157-16915. M. A. Quarry, M.A. Stadalius, T.H. Mourey, L.R. Snyder, J. Chromatogr. 358(1986)1-1616. M. Petro, F. Svec, I. Gitsov, J.M.J. Frechet, Anal. Chem. 68(1996)315-32117. T.L. Pang, P.E. Kavanagh, Chromatographia 46(1997)12-1618. P. Jandera, J. Rozkosna, J. Chromatogr. 362(1986)325-34319. C.H. Lochmuller, M.B. McGranaghan, Anal. Chem. 61(1989)2449-245520. L.R. Snyder, M.A. Stadalius, M.A. Quarry, Anal. Chem. 55(1983)1413A21. U. Just, H. Much, Int. J. Pol. Anal. Char. 2(1996)173-18422. H.J.A. Philipsen, B. Klumperman, A.M. Herk, A.L. German, J. Chromatogr. A 727(1996)13-2523. M.A. Stadalius, M.A.Quarry, T.H. Mourey, L.R. Snyder, J. Chromatogr. 358(1986)17-37

Chapter 18

History and synthesis of polyamide and polymer separation techniques 9
Chapter 2History and synthesis of polyamides and separation
techniques to characterize polymers in general and
polyamides in particular
Summary
In this introductory chapter a general overview is presented of different separation
techniques to characterize polymers. After a brief description of the history and
synthesis of polyamide-6, the use of different separation techniques for the
determination of different properties of polymers in general and polyamides in
particular is reviewed.

Chapter 210
2.1 History and synthesis of polyamide-6
W.H. Carothers patented in 1931 the synthesis of polyamide-6,6 fibers, which are
based on the polycondensation reaction between the two monomers
hexamethylenediamine and adipic acid [1]. Eight years later P. Schlack patented the
synthesis of polyamide-6, which is based on the monomer 6-aminocaproic acid [2].
In 1940 the first polyamide stockings where introduced on the American market. Up
till 1950 almost the total polyamide market consisted of polyamide-6,6. Thereafter
polyamide-6 slowly but surely found its place (figure 2.1).
Figure 2.1: Consumption of polyamide-6 versus polyamide-6,6.
Polyamide-6 is synthesized from the cyclic monomer caprolactam by a ring opening
reaction [3]. The hydrolytic polymerization given in figure 2.2 is the most common
reaction [4-7]. However, other routes to synthesize polyamides are known, for
example the cationic or anionic polymerization [6,7].
1950 1960 1970 1980 1990 20000
20
40
60
80
100
% PA-6
PA-6,6

History and synthesis of polyamide and polymer separation techniques 11
Step 1: Ring opening :
+H2O H2N COOH
Step 2: Ring opening polymerisation of caprolactam:
NH2
NH
O
+
HN
NH2
O
NH
O
Step 3: Polycondensation
COOH + H2N NH
O
Figure 2.2: Hydrolytic polymerization of polyamide-6: Open chains, without an acid or amine endgrouprepresent a part of a polyamide chain.
2.2 Solubility of polymers and polyamides
The inherent bad solubility of many industrially synthesized polymers is the main
problem to use separation techniques. Although a large number of macromolecules
are soluble in aqueous solutions (proteins, polyethylene glycol, polypropylene amine
dendrimers etc.) an even larger number do not dissolve at all in this polar
amphiprotic solvent. The polymers mentioned in figure 1.2 (polyethylene,
polypropylene, polyethylene, polystyrene, polyvinylchloride and polyamide) do not
dissolve in water, methanol or acetonitrile. The poor solubility of polyamides is
caused by strong intermolecular H-bound donor / acceptor interactions of the amide
functions, resulting in fairly high crystallinities. To dissolve the polyamide, these
interactions have to be disturbed. Four different polyamide solvent classes can be
distinguished (see table 2.1) [8-13].

Chapter 212
Table 2.1: Different solvents for polyamide.
Protogenic Alcohols Strong Acids Specific amideinteraction solvent
Salt saturatedmethanolic solutions
HFIP (1,1,1,3,3,3-hexafluoro isopropanol)TFE (2,2,2-trifluoroethanol)Cresol
Formic acidPhosphoric acidSulfuric acidConc. hydrochloricacid in waterDichloroacetic acid
Hexamethylphosporotriamide
CaCl2 in methanol
Typical for the separation of polyamides, but also for lots of other polymers, is the
dissolution / mobile phase problem; if the solvent has to act as the mobile phase,
certain drawbacks exist. For example, from a chromatographic point of view, HFIP
and TFE are the most interesting solvents for polyamide-6, as their viscosity is not
extremely high and they have sufficient UV transparency. However, a liter of these
fluorinated solvents with a well-defined UV transmission often costs 1000-3000
US$/L and information available on long-term health effects is missing. From a
practical point of view, operating temperature, price, viscosity, UV transmission or
volatility (if UV or evaporative light-scattering detector (ELSD) is used as detector),
reactivity, smell, safety and, of course, solubility and elution power are the most
important parameters to choose a solvent to dissolve and separate the polymer.
2.3 Separation techniques to characterize and quantify polymers.
To characterize a polymer or certain specific aspects of a polymer, different
separation techniques are available. Separation techniques can be based on all kind
of different physical properties such as hydrodynamic volume, chemical composition,
endgroup functionality or architecture. The distribution of a molecule between the
mobile phase and the stationary phase, is given by equation 2.1:
φφr
rRT
G
m
s
ttt
kecc
K 0−====
∆−
<2.1>

History and synthesis of polyamide and polymer separation techniques 13
where K is the distribution coefficient of the molecules between the stationary and
mobile phase, c is the concentration of a component in the stationary or mobile
phase, T the temperature in K, R the gas constant, ∆G the transfer Gibbs free
energy, k is the retention factor, tr is the retention time, to is the retention time of an
unretained component with the same hydrodynamic volume and φ is the phase ratio
(mobile phase / stationary phase).
In chapter 2.3.1 separations based on the hydrodynamic volume of the polymer are
discussed (K<1). To determine the chemical structure or oligomeric contents,
adsorption or partition based separation techniques can be used, which are
discussed in chapter 2.3.2 (K>1). Critical chromatography, which balances both
previous described mechanisms, is discussed in chapter 2.3.3. Chapter 2.3.4
discusses electrophoretic separation techniques.
2.3.1 Exclusion based separation techniques.
Large molecules (Mw>100kDalton) can be separated based on differences in their
hydrodynamic volume with a laminar flow, which is known as hydrodynamic
chromatography (HDC). Smaller macromolecules can diffuse further towards the wall
of the column (open tubular HDC, see figure 2.3) or the surface of non-porous
particles (packed column HDC) and experience a lower average flow velocity
resulting in longer elution times [14].
Figure 2.3: Separation of molecules with different hydrodynamic volumes, due to the laminar flowprofile.

Chapter 214
Field flow fractionation (FFF) uses the same principle [15]. However, an external
field influences the diffusion towards the wall. Different fields can be applied, such
as a cross flow (FFFF) or a thermal field (ThFFF).
Size-exclusion chromatography (SEC) is another separation technique, which also
performs separations based on the hydrodynamic volume. It is certainly the
separation technique applied most in polymer characterization. A column with
porous particles is used and molecules, which diffuse into these pores, are retained,
as they experience more stagnant mobile phase. Larger molecules cannot enter
these pores so effectively and will elute in a smaller volume. In figure 2.4 a size-
exclusion chromatogram is given for different generations of water soluble
polypropylene amine dendrimers [16]. The first generation has the smallest
hydrodynamic volume and will elute last. The highest generation (DAB-PA64 see also
figure 1.1) has the largest hydrodynamic volume and will elute first. Due to non-
optimized synthesis, dimers where formed which elute just in front of the
corresponding monomer (e.g. peak 6 is the dimer of the first generation).
Figure 2.4: SEC of dendrimers: Analysis of successive generations of polypropylene aminedendrimers. Columns: eight 250*4 mm Nucleosil 120-5C18 columns in series, thermostatted at 60oC.Injection 20 µl of 0.5 mg/ml amino-terminated dendrimer in eluent. Eluent: 0.5 ml/min 1% formic acidin water, ∆P 210 Atm. 1 = DAB(PA)4, 2 = DAB(PA)8, 3 = DAB(PA)16, 4 = DAB(PA)32, 5 = DAB(PA)64, 6= dimer of DAB(PA)4.

History and synthesis of polyamide and polymer separation techniques 15
Almost all polymers which are sufficient soluble in some kind of solvent, have been
analyzed by SEC. For example, the molecular-mass distributions of almost insoluble
polyethylene and polypropylene were determined using SEC although high
operating temperatures were needed. Rao et al. used methylcyclohexane at 90oC
[17] and Xu et al. used dichlorobenzene up to 170oC [18]. Although special
chromatographic equipment is available to perform separation at these high
temperatures, stability of the polymers at these extreme conditions should be
investigated to obtain accurate quantitative information about molecular-mass
distributions. However, temperature must be high enough to ensure complete
dissolution of the polymer and to prevent interaction with the stationary phase.
Stegeman et al. gave a nice theoretical comparison of the resolving power and
separation times of ThFFF, OT-HDC, PC-HDC and SEC. Among other things, they
calculated that the fastest separation with unity resolution of two molecules with a
molecular mass of 90.000 and 110.000 Dalton could be obtained with OT-HDC (0.1
second). SEC could perform a similar separation in 7 seconds, while PC-HDC took
30 seconds and ThFFF 1750 seconds. The authors also stated that the obtained
conditions are often not realistic (e.g. for OT-HDC a capillary with an internal
diameter of an impractical small tube radius of 50 nm was required) and they
concluded that SEC is the most appropriate method for the separation of these and
also lower-molecular-mass polymers [19].
The molecular mass of polyamides is usually in the range of 10-50 kDalton and SEC
of polyamide has already extensively been investigated. In the seventies different
mobile phases were used to determine the molecular-mass distribution of polyamide-
6. These methods utilized elevated temperatures in combination with very
unpleasant mobile phases, such as o-chlorophenol [20], benzylalcohol [21] or m-
cresol [22]. However, polyamides proved to be unstable in m-cresol at the
temperature used (130oC) as the relative viscosity dropped from 2.57 to 2.43 within 4
hours. By mixing the m-cresol with chlorobenzene and small amounts of benzoic
acid, lower operating temperature (43oC) prevented degradation of the polymer [23].
In 1971 Provder et al. used 2,2,2-trifluoro ethanol (TFE) at 50oC to analyze
polyamides [24]. In 1977, Drott introduced 1,1,1,3,3,3-hexafluoro isopropanol (HFIP)
as a mobile phase at ambient temperature for SEC, to determine the molecular-mass
distribution of polymers having hydrogen-bonding sites [25]. The acid hydroxygroup

Chapter 216
of the polar protogenic HFIP forms strong hydrogen bonds with the carbonyls of
polyamide (figure 2.5) [11,26,27].
Figure 2.5: Specific interaction of HFIP with the carbonyl function of the (poly)amides.
By adding sodium trifluoro acetate to the mobile phase, the formation of polyamide
aggregates could be suppressed [25,28,29]. The latter system [29] is nowadays
often utilized to determine the molecular-mass distribution of polyamide, but is also
applicable for other polymers such as polyethylene terephthalate [28-31]. However,
probably due to the extremely high price of HFIP, other systems are still being
investigated. Mourey [32] et al. found that a mixture of methylene chloride / dichloro
acetic acid could be used at room temperature and Robert et al. even described a
round-robin test for polyamide-11 using m-Cresol at 130oC [33].
2.3.2 Non-exclusion based chromatographic separation techniques
If the enthalpy of a given chromatographic system controls retention, exclusion
mechanisms still will be part of the separation. However, interaction of the solute
molecules with the stationary phase is the driving force of the separation.
Very specific interactions can be accomplished by for example ion-exchange
phases, where a stationary phase with a fixed cation exchanger (e.g. a sulfonic acid)
or anion exchanger (e.g. a quaternary amine) selectively retains oppositely charged
NH
O
NH
O
OHHN
O
HN
CF3F3C
O

History and synthesis of polyamide and polymer separation techniques 17
ions. [34,35]. Another chromatographic separation technique, called affinity
chromatography, is often used to retain a specific biomolecule (see figure 2.6).
Figure 2.6: Subsequent steps in the elution of biomolecules using affinity chromatography. Reprintedfrom ref [36] with permission from Phenomenex.
However, separations of oligomers and polymers are often accomplished using
normal-phase or reversed-phase high-performance liquid chromatography (NP- or
RP-HPLC), where oligomers or polymers are separated by different interactions with
the stationary phase.
2.3.2.a Normal-phase high-performance liquid chromatography
In normal-phase chromatography the stationary phase is polar, for example bare
silica or diol-, amino- or cyano-modified silica. The mobile phase is often a non-polar
solvent, like i-octane, modified with a more polar solvent, like 1-propanol. To
describe the retention mechanism of NP-HPLC Snyder introduced the competition
model [37]. Retention occurs by competition of the solute and solvent molecules,
which adsorb on the active sites of the polar stationary phase and can be described
using equation 2.2:

Chapter 218
( )εαβ so
a AGVk −++= 'logloglog <2.2>
where k is the retention factor, Va the volume of the adsorbed solvent monolayer per
unit weight of adsorbent, β the phase ratio in weight adsorbent / void volume, α is a
characteristic measure for the activity of the adsorbent, Go is a dimensionless
parameter representing the free energy of adsorption of the solute with n-pentane as
a mobile phase, As is the surface of the adsorbent, which is occupied by the solute
and ε is the solvent strength of the mobile phase.
At higher polar solvent concentrations also Scott’s interaction model is used to
describe retention [38]. Besides the adsorption of the solvent on the polar stationary
phase, intermolecular solvent interactions will create a bilayer of solvent molecules.
Solute retention occurs by displacement of molecules from the second solvent layer.
Retention is described using equation 2.3:
CAAk
10
1+
= <2.3>
where A0 and A1 are constants and C the concentration of the polar solvent. The
NP-HPLC mechanisms are also known as adsorption chromatography.
2.3.2.b Reversed-phase high-performance liquid chromatography
In RP HPLC, the phases are reversed with respect to polarity. The stationary phase
is non-polar, for example octyl- or octadecyl-modified silica. The mobile phase is
often an aqueous mixture with a polar organic solvent. Sporadically, totally organic
mobile phases have been used, which are known as NARP systems (non-aqueous
reversed-phase).
The separation mechanism is a partitioning process as the stationary phase is seen
as a liquid phase of alkylchains and eluent molecules. The energy required for a
molecule to transfer from the mobile phase to the stationary phase is the difference
in the free energy of solvation of the molecule between both phases. After the

History and synthesis of polyamide and polymer separation techniques 19
formation of a cavity, the solute molecule has to interact with the surrounding solvent
molecules (figure 2.7) [39].
Figure 2.7: Chromatographic solvation process: 1st step formation of cavity in the stationary phase(∆G = ∆Gcav>0) and 2nd step interaction with surrounding solvent molecules (∆G = (∆Gint+∆V)<0),reproduced from ref. [39] with permission from Preston Publications, A Division of Preston Industriesof Preston Industries, Inc.
This process is described in equation 2.4:
VPRT
RTGGGGGGGo
mobstatmobcavstatcavmobsolvstatsolv ln.int.int.... +∆−∆+∆−∆≈∆−∆=∆ <2.4>
where ∆G is the Gibbs free energy to form a cavity in the stationary or mobile phase
and the Gibbs free energy to interact with the surrounding solvent of the stationary
and mobile phase. The last term accounts for the entropy change arising from the
change in free volume, where R is the gasconstante, T is the temperature, V is the
mole volume of the solvent and Po is the atmospheric pressure. The retention factor
can be estimated using Horvath’s [39] equation:
( )VP
RTZWNAaNA
RTk
o
es ln)1(
1ln +
∆
−+−++∆+=ε
κγγφ <2.5>
where ∆A is the area of the solute (S) and the ligand (L) minus the area of the
complex (SL), N is Avogadro’s number, γ is the surface tension of the bulk liquid, κe
is an adjustment factor to correct for the macroscopic surface tension to molecular
dimensions, As is the area of the solute cavity, a and W are solvent dependent
parameters, ∆Z/ε is the Gibbs free energy of electrostatic interactions, where Z

Chapter 220
represents different factors, such as the molecular size, charge distributions etc. and
ε the dielectric constant. Po represent the pressure of 1 Atm, R is the gas constant, T
the temperature, V the mole volume of the solvent and φ the phase ratio. Galushko
deduced this complex equation to a much simpler form and described different
columns with different mobile phase compositions using equation 2.6 [40]:
abVGck es ++∆= 3/2ln <2.6>
where a, b and c represent three constants for a given mobile phase and column
combination, V is the molar volume of the solute and ∆Ges is the difference of the
electrostatic Gibbs free energy of the solute in the mobile and stationary phase,
neglecting Van der Waals interactions.
Reversed-phase packings are among the most stable and reproducible columns,
they yield state of the art efficiencies and are compatible with a wide range of mobile
phase compositions to control retention [41]. As different test procedures are
nowadays available and used to characterize the enormous number of different
reversed-phase packings, specific interactions can be predicted [42]. At present
approximately 70-80% of all liquid chromatographic separations are performed with
reversed stationary phases [43].
2.3.2.c. Oligomers
For the analysis of oligomers, interaction chromatography is superior when
compared to SEC, with respect to selectivity and peak capacity. For the tetramer of
polystyrene the selectivity factor α obtained with RP-HPLC was 15 times higher than
necessary and even isomeric oligomers could be separated [44].
A very nice comparison between RP and NP-HPLC can be made by observing the
elution pattern of alkylethoxylated oligomers (CxH2x+1-(OC2H4)y-OH) (figure2.8a and
b). Using, NP-HPLC very good selectivities were obtained for the increasing number

History and synthesis of polyamide and polymer separation techniques 21
of the ethoxylation, but poor selectivities were obtained for molecules with different
alkylchain length with an identical degree of ethoxylation (figure 2.8a) [45]. Using
RP-HPLC opposite results were observed (figure 2.8b) [46].
Enormous selectivity was gained by increasing the alkylchain lengths. Although
somewhat longer retention times were needed, all ethoxylated molecules with a
certain alkylchain length could be separated, before the next group with an
increasing alkylchain length eluted. Within the separation of C12 and C14 chains, the
total distribution of the ethoxylated oligomers could be determined. From the
reversal of elution order with respect to the degree of ethoxylation in the RP-HPLC it
can be concluded that at the condition used, the alkylchain dominates retention and
the repeating ethoxy groups promote elution. This elution mechanism is almost
identical to the elution order of derivatized polyamide-4,6 oligomers on a reversed-
phase system using aqueous acetonitrile as a mobile phase, but in contrast with the
elution order in methanol [44]. Retention of oligomers can be modeled using the
Martin rule (equation 2.7):
10ln naak += <2.7>
where ao represents the retention contribution of the endgroups of the oligomer, aI
represents the retention contribution of one backbone unit and n is the number of
backbone units. In this model, a particular group of a molecule will give a fixed
contribution to the retention of the oligomer or polymer as long as the mobile and
stationary phase do not change [47].
Already in 1970, Mori separated cyclic oligomers of polyamide-6 using SEC [48].
Barkby used an aqueous mobile phase and compared octadecyl-modified silica with
normal-phase LC for the separation of polyamide oligomers and received similar
chromatograms [49]. Guaita obtained very good separations of the oligomers of PA-
6 and PA-66 using RP-HPLC with trifluoro ethanol / water as a mobile phase [50].

Chapter 222
Figure 2.8a: NP–HPLC: 2.5% solution of ethoxylated alkyl chains (C12 / C14) in hexane. Gradient t0min
= 100% n-hexane t55min = 37% n-hexane / 60% 2-propanol and 3% water). Flow rate 1 ml/min; column250*4.6 mm Zorbax-NH2 (5µm) at 40oC; detection ELSD. Reprinted from ref [45] with permission fromElsevier Science.
Figure 2.8b: RP–HPLC: Ethoxylated alkyl chains (C12 / C14). Gradient t0min = 35% 0.1% formic acid inwater and 65% acetonitrile t38min = identical as t0min t48min = 10% 0.1% formic acid in water and 90%acetonitrile, t75min identical as t48min. Flow rate 1 ml/min, injection 20 µl, 1.2 mg sample, column:2*250*4 mm Nucleosil 120-5C18 and ELSD detection [46].

History and synthesis of polyamide and polymer separation techniques 23
He used the same mobile phase on octyl-modified silica and compared it with a non-
modified silica with a mobile phase consisting of butanol, acetic acid and water. The
RP-system gave better results, although he also received baseline separation under
NP-conditions. Both systems gave superior results compared to a third system,
which was identical to Mori’s SEC system (Sephadex column, mobile phase: 0.1n
HCl) [51]. Soto-Valdez separated a methanolic extract containing PA-6 and PA-6,6
oligomers, using a RP-system with a water to methanol gradient [52]. Good
separation was obtained, although the cyclic dimer of polyamide-6 coeluted with the
cyclic monomer (= diamide) of polyamide-6,6. However, the cyclic tetramer and
hexamer of polyamide-6 were baseline separated from the isomers of polyamide-6,6.
It has been demonstrated that oligomers are much better soluble in much broader
ranges of non-solvent / solvent mixtures compared to polymers [53]. As can be seen
in figure 2.9 oligomers elute at conditions where the polymers are not soluble. To
circumvent the mobile phase / solvent problem (see 2.2), different sample
preparation methods were used to transfer the oligomers from the polymer to a more
appropriate matrix. Different techniques are available [54].
Extraction.
This technique is often used to analyze additives in polymers. It is also the most
important tool to determine the migration of oligomers or additives from polymer to
specific matrices, which is often important if polymers are used in for example food
and beverage packaging. An advantage of the extraction method is the possibility to
concentrate the extract, change to another more appropriate solvent or even to use
the extract for another pretreatment step. Nikolov et al. concentrated the aqueous
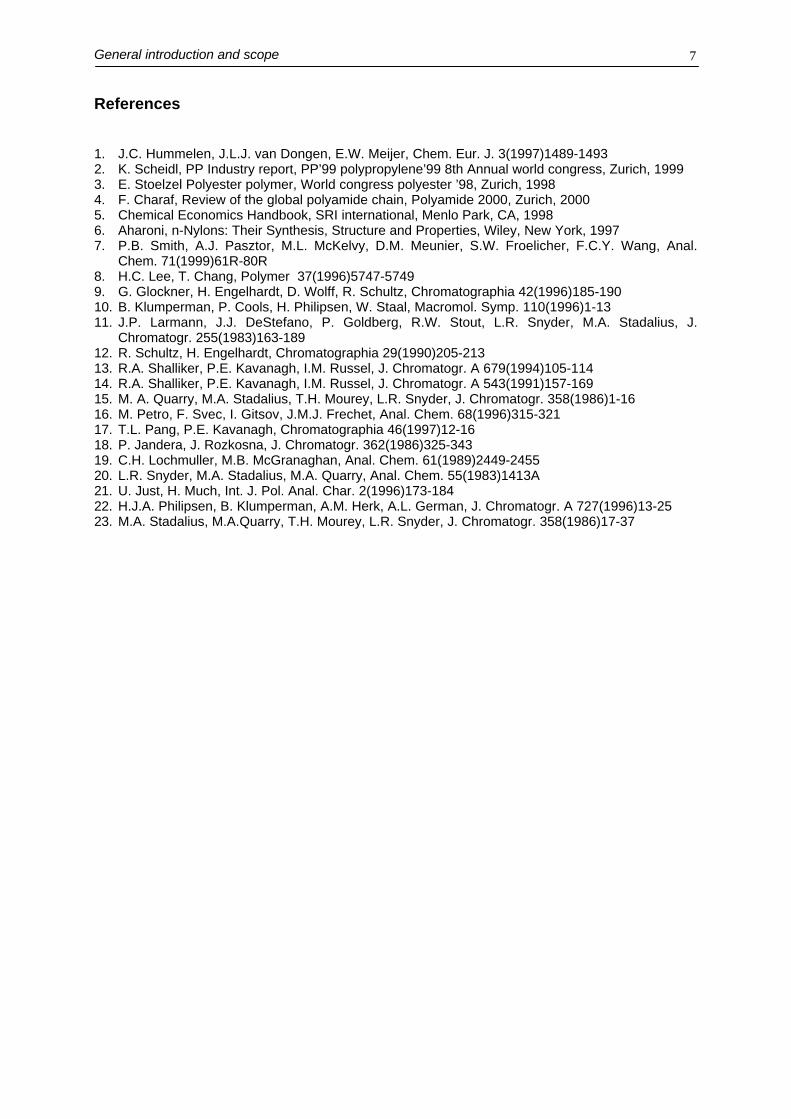
extract of polyamide-6 and extracted the cyclic monomer caprolactam from the cyclic
oligomers with benzene [55]. Due to the absence of caprolactam faster separations
of the oligomers could be obtained. However, some major shortcomings are attached
to quantitative extractions. Besides the laborious extraction procedures, the stability
of the polymer has to be investigated. The solubility of the extracted oligomers at
higher temperatures often exceeds the solubility in the extract at room temperature.
However, recovery of the oligomers is probably the most important issue. Barkby

Chapter 224
found that contacting a polyamide film once (1-5 hr) with boiling water, the extraction
time and film thickness influences recovery of the oligomers [56]. Venema et al.
compared soxhlet extraction with supercritical fluid extraction (SFE) and found better
recoveries of the polyamide-6 oligomers with the latter extraction method [57].
Precipitation / dissolution.
By dissolving the polymer in a solvent and subsequent precipitation of the polymer
with a non-solvent, low-molecular-mass components, like oligomers or additives
often stay in solution and can be isolated from the precipitant by filtration or
centrifugation. The main advantage of this approach is the simple way to check
recovery. The precipitated polymer can easily be re-dissolved in a fresh solvent and
the whole procedure can be repeated. The main disadvantage of this method is the
labor-intensive procedure, as the precipitation of the polymer must be controlled to
circumvent entrapment of the oligomers. (Cleaning up the laboratory glassware is
also labor-intensive, as the precipitated polymer has to be dissolved again). Begley
et al. dissolved an oven baking bag produced from polyamide 6 / 6,6 in HFIP /
methylene chloride mixture and used methanol to precipitate the polymer. They also
performed migration experiments in a food-simulating liquid (a triglyceride fraction of
coconut oil) and concluded that only 43% of the oligomers migrated out of the
polymer into the oil [58].
2.3.2.d Polymers
Chromatographic separation techniques for polymers are a highly interesting field. In
contrast to SEC, the polymer is not only separated due to its hydrodynamic volume,
but also on its chemical structure. The mobile phase is a mixture of a so-called
solvent and non-solvent [53,59]. By slowly changing the mobile phase conditions the
polymer elutes from the column. In a simplified model, three stages can be
distinguished (table 2.2). First, after injecting the polymer into the mobile phase, the
mobile phase can promote precipitation (non-solvent) or dissolution (solvent). The
mobile phase also promotes elution or is insufficiently strong to overcome the

History and synthesis of polyamide and polymer separation techniques 25
interaction (adsorption or partition) between the solute and the stationary phase.
Berek called these latter mobile phases desorli or adsorli [60]. The mechanisms
interrelate, as given in table 2.2. A combination of these occurs with exception of the
precipitating mobile phase, which cannot exist during elution.
Table 2.2: Different stages during polymer elution using interaction chromatography.
Solubility
Mobile / stationary phase interaction
Precipitation(non-solvent)
Dissolution(solvent)
Interaction (adsorli) 1:Polymer precipitates and
will not elute
2:Polymer dissolves, but
will not eluteElution (desorli) 3:
Polymer dissolves andwill elute
If the polymer is injected into the mobile phase, which is a non-solvent and an
adsorli, the injected polymer precipitates and will not elute. The chromatographic
process can also start at point 2 of table 2.2. It is not necessary for the polymer to
precipitate. If the polymer is injected in a mobile phase, which is a solvent and an
adsorli, the polymer will stay at the top of the column and will elute when mobile
phase conditions change to desorption promoting conditions. However, the process
of precipitation / dissolution, interaction / desorption and elution is molecular mass
dependent and low-molecular-mass oligomers will already elute at conditions where
higher-molecular-mass components precipitate.
Besides gradient elution chromatography, different specific nomenclatures were
used for the elution of polymers. As the starting conditions of a gradient could
promote precipitation of the polymer, Glockner called this technique high-
performance precipitation liquid chromatography (HPPLC) [61,62]. He also used the
term non-exclusion chromatography, as the separation is not based on size-
exclusion mechanisms [63]. Staal, Philipsen and Cools called this technique gradient
polymer elution chromatography (GPEC) [53,64,65].

Chapter 226
Figure 2.9: Influence of solvent / non-solvent composition and molecular mass of the polymer on its(chromatographic) behavior.
Different mechanisms were proposed. Snyder suggested that the conventional linear
solvent strength (LSS) model can also be used to understand the retention behavior
of polymers [41]. Retention for an RP-HPLC system is given with equation 2.8:
φSkk w −= lnln <2.8>
where φ represents the volume fraction of the strong solvent, k w the retention factor
at 100% non-solvent and S is a constant, which roughly equals half of the square
root of the molecular mass (measured for peptides on a octadecyl-modified
stationary phase using water / acetonitrile as a mobile phase) [66]. As S increases
with increasing molecular mass, exclusion effects cause the mobile phase to move
with a slower average linear velocity through the column compared to the polymer.
Glockner suggested a continuous precipitation and redissolution model, if the
polymer elutes in a mixture corresponding to the cloud-point conditions. Due to
exclusion effects the macromolecules move faster than the mobile phase conditions
at which the polymer initially started to elute and it will reach the non-solvent
conditions where it will precipitate again. This mechanism can repeat itself several
times during elution [59,67].
Mourey produced extremely good separations of a very high-molecular-mass
polyethylhexylacrylate, polybutylacrylate, polyethylacrylate and polymethytacrylate
0 10 20 30 40 50 60 70 80 90
mobile phase composition
0
10
20
30
40
50
(Thousands)
Mw
precipitation
dissolution/interaction
desorption/elution
100% non-solvent 100% solvent

History and synthesis of polyamide and polymer separation techniques 27
(Mw = 30-300 kDalton) [68]. As a high-molecular mass results in a high S value, the
elution range of high-molecular-mass polymers is small. Small changes in separation
conditions easily change a completely retained macromolecule into a completely
unretained macromolecule.
Thermal gradients are also based on this principle. Small changes in temperature
can change a completely retained polymer into a completely unretained polymer. For
polystyrene these thermal gradients appeared to be superior compared to SEC
separations [35,69-71].
Another alternative polymer elution system is Glockner’s so-called sudden-transition
gradient [72]. In a NP-HPLC system, with a gradient from i-octane to methanol, he
suddenly increased the amount of a third solvent (THF) to a fixed percentage of the
total composition. This third solvent is a good solvent for the polymer, but due to the
intermediate polarity not strong enough to elute the polymer completely. It can also
not be used in the starting mobile phase, as this will disturb good sample
introduction. At higher methanol concentrations, the polarity of the mobile phase
increases to conditions, where the polymer will elute. On an RP-C18 column with a
gradient from 100% acetonitrile to 100% dichloromethane low recoveries were
observed. In a gradient of 100% acetonitrile to heptane and a sudden transition with
dichloromethane directly after injection better recoveries where obtained [73]. A NP-
HPLC system with a cyanopropyl column and a gradient from 100% heptane to
acetonitrile and a sudden transition with dichloromethane directly after injection gave
similar results, with respect to resolution of some PS / PMMA standards with
different chemical-composition distributions.
Using gradient elution of polymers, information about the chemical-composition
distribution can be gathered. With a 10 mM phosphoric acid in water to HFIP
gradient on an RP-HPLC system, a blend of polyamide-4,6 (based on the monomers
1,4-diaminobutane and adipic acid) and polyamide-6,I (based on the monomers
hexamethylediamine and isophthalic acid) was analyzed [74]. At λ = 195 nm both
polymers could be detected simultaneously (figure 2.10, left 1st trace), but at λ = 235
nm, only the aromatic PA-6I shows UV absorption (figure 2.10, middle 1st trace).
Correcting the λ = 195 nm signal with the λ = 235 nm signal results in the pure PA-
4,6 signal (figure 2.10, right 1st trace). Due to this selective detection,
transamidation could be studied as a function of the extrusion time (2nd, 3rd and 4th

Chapter 228
trace) [75]. Assuming that the signal at a certain elution time stems solely from the
transamidated polymer, with the observed 46 / 6I ratio, quantitative data could be
obtained concerning the transamidation of the polyamide blend (figure 2.11).
Figure 2.10: Separation of polyamide 4,6 and 6,I.
Figure 2.11:Mass distribution of PA-6,I due to transamidation of PA-4,6 and PA-6,I as a function of theextrusion time.

History and synthesis of polyamide and polymer separation techniques 29
2.3.3. Liquid chromatography, independent on molecular mass
Using SEC, separation is solely based on the molecular-size distribution of the
polymer. Using interaction chromatography also separations due to differences in
chemical composition or architecture can be accomplished. However, the latter
technique also shows molecular-mass dependency. To perform separations without
molecular-mass dependency, identical backbone units of a molecule should not
influence retention of the polymer. Two techniques are available.
2.3.3.a Critical chromatography
Entelis et al. described the basic principles of so-called critical conditions, to perform
separations independent of the number of identical backbone units [76]. At very
specific conditions, where the pore width is larger than the radius of gyration of the
molecules, conditions can be found where for a non-, mono- and bi-functional
polymer elutes at conditions independent of the molecular mass as given in equation
2.9-2.11:
( ) 10 =dK <2.9>
( ) ( )12
11 −+=− cfe
Da
K dθθ <2.10>
( ) ( ){ } ( ){ }'112ddd KKK = <2.11>
where Kd is the distribution constant of a non-, mono- or bi-functional polymer, a is
the segment size of one backbone unit, D is the pore size, θf is the interaction
energy of the functional group with the pore wall. θc is the interaction energy at
critical conditions of one segment of the backbone unit with the pore wall. For a non-
functional linear polymer, the critical conditions can be obtained at zero Gibbs free
energy, using equation 2.1, this results in equation 2.12:
RS
RTH
RTG
K∆
+∆
−=∆
−=== 0)1ln(ln <2.12>

Chapter 230
Thus, for non-functional homologous linear polymers, the critical conditions are
reached if the entropy term T∆S of a certain backbone equals the enthalpy ∆H of the
same backbone. Separation is solely based on differences in interaction energy of
the endgroup or deviating backbone units.
At critical conditions, macrocyclic molecules experience a molecular-mass
dependency [77]. Gorbunov et al. deduced that for optimal separation conditions, the
linear macromolecules should elute slightly in the exclusion mode and consequently
the cyclic molecules will elute slightly in the adsorption mode [78]. The distribution
coefficients at optimal separation conditions for wide-pore systems are given in
equation 2.13 and 2.14:
dR
K l 81
π−= <2.13>
dR
K c 41
π+= <2.14>
where K is the distribution coefficient of the linear (l) and cyclic (c) macromolecules,
R is the radius of the macromolecule and d is the diameter of the pore.
This molecular-mass independent separation technique is known as critical
chromatography. The chromatographic conditions are not robust with respect to
mobile phase conditions and column temperature. Small changes of the interaction
energy will favor the entropy or enthalpy term, which will influence separation
efficiency of the system. Other names are also used, such as liquid chromatography
at the critical adsorption point (LC-CAP) [79], assuming adsorption as the main
interaction model, however, this name is also used for critical separation using
partitioning as the main separation mechanism [60]. Gorbunov called this technique
also phase transition chromatography [77]. Besides separations based on endgroup
deviations [80-84], the technique is also used for other kinds of separation.
Jandera exhaustively studied the retention behavior of the ethylene oxide-propylene
oxide copolymers Slovanik (EO)n-(PO)m-(EO)n and Novanik (PO)m-(EO)n-(PO)m [85].
In an RP-system, the selectivity factor αEO of the polar ethylene-oxide unit was
approximately 2 orders of magnitude lower than the selectivity factor αPO of the non-
polar propylene oxide unit. It was also observed that this selectivity factor αEO was

History and synthesis of polyamide and polymer separation techniques 31
one to two orders of magnitude lower for the Novanik samples than for the Slovanik
samples. At critical conditions for the EO-block the selectivity factor αPO was
approximately equal for the Slovanik and Novanik samples. The difference in
interaction energy at critical conditions for a EO backbone unit and PO backbone
unit (θc,EO-θc,PO) is larger for the Novanik samples and separation based on the
number of PO units was feasible with this samples, but much more difficult to
achieve for the Slovanik sample. In the normal-phase mode, opposite results were
obtained and at critical conditions for PO, separation based on the number of EO-
backbone units was only accomplished for the Slovanik sample.
Another field to utilize critical chromatography was demonstrated by Kitayama et al.
[86]. At critical conditions, polyethylmethacrylate batches with different tacticity could
be separated and characterized using on-line continuous-flow 750-MHz 1H-NMR.
Using this mode of operation a better understanding of stereo-specific
polymerizations could be obtained.
2.3.3.b. Liquid Chromatography at limiting conditions
Berek introduced liquid chromatography at limiting conditions. Different modes can
be distinguished [55,87]. Operating in the mode LC-LCA (Liquid chromatography at
the limiting conditions of adsorption) the mobile phase slightly promotes adsorption.
The polymer is injected in a strong desorli. This injection zone has to act as a barrier
and the macromolecules can only leave this zone by exclusion. Once the
macromolecule has left the barrier injection zone, it will adsorb to the stationary
phase and elutes again if the barrier injection zone catches up with the adsorbed
macromolecule. By choosing the appropriate mobile phase conditions and within a
certain molecular-mass range, the macromolecule will elute independent of the
molecular mass. With this technique, a blend or a copolymer can be separated due
to differences in chemical-composition distribution. Separations based on
differences in endgroup functionality have not been reported yet. Berek also
mentioned the LC-LCS mode (Liquid chromatography at the limited conditions of

Chapter 232
solubility). Identical to Glockners precipitation / redissolution model the polymer
precipitates in the mobile phase as it has left the barrier injection zone due to
exclusion. It will precipitate again, if the barrier injection zone catches up with the
precipitated macromolecule. In the LC-LCD mode (Liquid chromatography at the
limiting conditions of desorption) the mobile phase promotes desorption of the
macromolecule. The barrier injection zone is now an adsorli and directly after
injection the macromolecule will adsorb to the stationary phase. When the mobile
phase reaches the adsorbed macromolecule, it will desorb and due to exclusion
mechanisms will come within the reach of the adsorption promoting barrier injection
zone. Again a substantial part of the molecular-mass distribution will elute in a
molecular-mass independent way.
Liquid chromatography at critical conditions does not work for low-molecular-mass
polymers and has to be seen as a microgradient comparable to gradient elution,
described in chapter 2.3.2d.
2.4 Electrically driven systems
Capillary electrophoresis is a separation technique, in which high efficiencies can be
obtained due to the absence of a laminar flow profile. A charged molecule with an
electrophoretic mobility will migrate in an electric field to the oppositely charged
electrode. The same molecule will also encounter an electroosmotic flow, which has,
due to the electric double layer on the capillary wall, a flat profile as given in figure
2.12 [88,89].
Figure 2.12: Principle of capillary electrophoresis. A positively charged molecule will migrate to theoppositely charged electrode. It will also encounter an electoosmotic flow, which influences theapparent mobility.
+ -EOF+ EP
+ + + + + + + + + + + + + + + + + + + + + + + + + + + + + + + + + + + + + + +
+ + + + + + + + + + + + + + + + + + + + + + + + + + + + + + + + + + + + + + + + + + + +

History and synthesis of polyamide and polymer separation techniques 33
The apparent mobility (µapp) of a certain (charged) molecule equals the sum of the
electrophoretic mobility (µep) and the mobility of the electroosmotic flow (µeof) and can
be measured using equation 2.15:
tV
ll
tE
l toteffeffeofepapp ==+= µµµ <2.15>
where µ is the mobility in m2.s-1.V-1, leff is the length of the capillary from injection to
detector in m, ltot is the total length of the capillary in m, t is the elution time of the
component in s, E is the electric field strength and V is the voltage applied in V.
A charged molecule experiences an electric force Ezq, where z is the charge of the
molecule and q the elementary charge. This force is counteracted by a friction force,
which is given by Stokes equation ρ = 6πηR, where η is the viscosity of the buffer
and R is the radius of a rigid spherical unit [90]. The mobility can now be calculated
using equation 2.16:
Rzq
πηµ
6= <2.16>
It has been demonstrated that oligo- and polypeptides in a acidified aqueous HFIP
buffer follow a typical peptide migration pattern [91,92], which is given in equation
2.17 [91]:
3/2~
Mz
µ <2.17>
Different modes of operation can be distinguished.

Chapter 234
2.4.1. CZE
In capillary zone electrophoresis (CZE), molecules are separated in free solution.
Upto 30 mono derivatized Jeffamines (amine-terminated polyethylene-oxide
oligomers) with a molecular mass of 600-2000 Dalton could be separated using CZE
[93]. A copolymer of the monomers 2-acrylamido-2-methyl-propanesulfonate (AMPS)
and acrylamide (AAm) could be separated due to differences in chemical
composition as the number of AMPS backbone units influence the total charge of the
macromolecule [94]. Much larger particles, like silica sols with size ranges from 5 to
500 nm were also separated and characterized using CZE.
In contradiction to the above-mentioned electrophoretic separations, a total aqueous
buffer can often not be used to separate synthetic polymers. NACE (non-aqueous
capillary electrophoresis) or organic CE is the only choice if water insoluble
polymers have to be separated. However, interactions in NACE differ strongly from
aqueous interactions [95]. Cottet used THF to separate N-phenylaniline oligomers.
To ensure oligomeric ionization in such a non-dissociating solvent with small
dielectric constants, amphiprotic methanol was added. Perchloric acid was chosen
as an additive, as it showed strong acidic properties [96].
2.4.2. MEKC
Micellar electro kinetic chromatography (MEKC) was introduced by Terabe to
separate uncharged species [97,98]. Charged micelles act as a pseudo stationary
phase. Uncharged molecules interact with the charged surfactant or the micelle and
separation is accomplished due to different distribution constants. Instead of
micelles, dendrimers were also used as a pseudo stationary phase [99-102]. Kok et
al. separated non-charged phenyl-isocyanate derivatized PEG 600 on a MEKC
system. The mobility of the different oligomers could be controlled through the type
and concentration of the micelles and the type and concentration of the organic
modifier [103]. Gallardo determined the chemical-composition distribution of the
uncharged copolymer of N-vinylpyrrolidone and hydroxyethylmethacrylate using a

History and synthesis of polyamide and polymer separation techniques 35
buffer consisting of 50mM boric acid / sodium tetraborate at pH = 9.5 and 35mM
sodiumdodecanesulfate (SDS) in 50% water and 50% methanol [104].
2.4.3. CGE
Capillary gel electrophoresis (CGE) can be used to separate multiple charged
macromolecules. Separations based on the molecular mass to charge ratio can be
obtained, using a sieving matrix. The Ogston theory assumes that the
macromolecules behave as unperturbed spheres, similar in size as sieving pores
[105,106]. However, migration of even larger biopolymers were reported to migrate
through the pores, suggesting reptation of the molecule (see figure 2.13) [106,107].
Figure 2.13: Different mechanisms of a sieving matrix (n is degree of polymerization).
To read the human genome, capillary gel electrophoresis (CGE) is the separation
technique of choice. Zhou and Karger used gel filled capillaries to separate 1300
0 10 20
log n
-20.00
-15.80
-11.60
-7.40
-3.20
1.00
logµ/µ o
Ogston-sieving
reptation without stretching
reptation withstretching

Chapter 236
DNA basepairs in two hours [108]. Such a performance has not been described for
synthetic polymers yet.
Bullock used creatinine and indirect detection to separate and determine the
oligomeric distribution of Jeffamines (amine-terminated polyethylene oxide) and
used 1 mg/ml polyethylene oxide as a sieving matrix. He also used this
concentration PEO to determine the molecular-mass distribution of PEO (Mw =
1000-4000 Dalton), which was charged by pre-capillary derivatization with phthalic
anhydride [109]. Poli et al. used hydroxyethylcellulose (HEC) to separated
polystyrenesulphonates. The CGE method was found to be favorably compared with
SEC in terms of resolution, selectivity and efficiency. The CGE method was also
three times faster [110]. Grosche et al. investigated the separation selectivity of
different concentrations PEG with different molecular masses as a sieving matrix to
perform SEC-like separations of poly-2-vinylpyridine and poly-4-vinylpyridine [111].
Grosche and Kok also mentioned the possibility to use charged sieving gels to
separate uncharged polymers [112].
2.4.4. CEC
Capillary electrochromatography (CEC) is a relatively new separation technique. It is
a hybrid of liquid chromatography and capillary electrophoresis. By using a packed
capillary and an electric field, an electroosmotic flow is generated. Due to the
absence of pressure, smaller particles could be used and therefore higher
efficiencies could be obtained. Kok et al. used this mode to demonstrate the use of
SEEC (Size-exclusion electrochromatography). Due to electrically generated pore
flow, efficiency of four polystyrene standards increased, but selectivity decreased. It
turned out that a combination of pressure and electrical potential gave the best
result [103].

History and synthesis of polyamide and polymer separation techniques 37
2.4.5 Electrophoretic separations of polyamides
Already in 1960 Rothe used high-voltage paper electrophoreses to separate the first
six linear oligomers of an aqueous polyamide-6 extract [113]. After hydrolysis of the
polyamide and derivatization of the primary amine group of the linear monomer
using fluorescamine, CZE was used as a separation technique to characterize and
to quantify the backbone units of different polyamides [114-116]. To the best of our
knowledge, these are the only examples of electrophoretic separations of low-
molecular-mass polyamide species.
References
1. W.H. Carothers patented (U.S.P. 2.071.2501/1) in H.J. Koslowski (editor), “Dictionary of Man-Made Fibers”, International Business Press Publishers, Frankfurt an Main, Germany, 1998
2. P. Schlack (DRP.748253) in H.J. Koslowski (editor), “Dictionary of Man-Made Fibers”,International Business Press Publishers, Frankfurt an Main, Germany, 1998
3. S.L.Jain, N.D. Sharma, Man-Made Textiles in India 40(1997)19-274. S.L.Jain, N.D. Sharma, Man-Made Textiles in India 40(1997)245-2545. S.L.Jain, N.D. Sharma, Man-Made Textiles in India 40(1997)286-296 6. Aharoni, “n-Nylons: Their Synthesis, Structure and Properties”, Wiley, New York, 19977. R. Puffr, V. Kubanek, “Lactam-Based Polyamides Vol I”, CRC Press, Boston, 1990.8. J.J. Burke, T.A. Orofino, J. Pol. Sci.: part A2 7(1969)1-25 9. A. Mattiussi, G.B. Gechele, R. Francesconi, J. Pol. Sci.: Part A2 7(1969)411-42210. M. Evstatiev, Plast. Eng., Handbook of thermoplastics 41(1997)641-66311. l. Valentine, J. Pol. Sci. 23(1957)297-31412. Z. Tuzar, P. Kratochvil, M. Bohdancky, “Advances in Polymer Science 30”, Springer Verlag,
Heidelberg, Germany, 197913. D. Petit, R. Jerome, Ph. Teyssie, J. Polym. Sci., Polym. Chem. Ed. 17(1979)2903-291614. J. Bos, R. Tijssen, J. Chromatogr. Libr. 56(1995)95-12615. M. Martin in P.R. Brown and E. Grunsha (editors), “Advances in Chromatography 39”, Marcel
Dekker, New York, 1998, p1-13816. Y. Mengerink, M. Mure, E. de Brabander and Sj. van der Wal, J. Chromatogr. A 730(1996)75-
8117. B. Rao, S.T. Balke, T.H. Mourey, T.C.C. Schunk, J. Chromatogr. A 755(1996)27-3518. J. Xu, P. Ji, J. Wu, M. Ye, L. Shi, C. Wan, Macromol. Rapid Comm. 19(1998)115-11819. G. Stegeman, A.C. v. Asten, J.C. Kraak, H. Poppe, R. Tijssen, Anal. Chem. 66(1994)1147-116020. E.K. Walsh, J. Chromatogr. 55(1971)19321. G. Pastuska, U. Just, Angew. Makromol. Chem. 81(1979)11-1822. P.S. Ede, J. Chromatogr. Sci. 9(1971)275-28023. M.A. Dudley, J. Appl. Polymer Sci. 16(1972)493-50424. T. Provder, J.C. Woodbrey, J.H. Clark, Sep. Sci. 6(1971)101-13625. E.E. Drott, in J. Cazes(editor), “Chromatographic Science Series, Vol. 8 Liquid Chromatography
of polymers and related Materials”, Marcel Dekker, New York (1977)41-5126. M. Narita, S. Honda, H. Umeyama, S. Obana, Bull. Chem. Soc. Jpn. 61(1988)281-284 27. G. Costa, S. Russo, J. Macromol. Sci. Chem. Ed. A18(1982)29928. D.J. Goedhart, J.B. Hussem, B.P.M. Smeets, in J. Cazes and X. Delamare (editor)
“Chromatographic Science Series, Vol. 13 Liquid Chromatography of polymers and relatedMaterials II”, Marcel Dekker, New York, 1977, 203-213
29. S. Mori, Y. Nishimura, J. Liq. Chromatogr. 16(1993)3359-3370

Chapter 238
30. A. Moroni, T. Havard, Polym. Mater. Sci. Eng. 77(1997)14-1631. P.J. Wang, Chromatogr. Sci. Ser. 69(1995)161-18332. T.H. Mourey, T.G. Bryan, J. Chromatogr. A 679(1994)201-20533. E. Robert, J. Fichter, N. Godin, Y. Boscher, Int. J. Polym. Anal. Char. 3(1997)351-35834. P. Hajos, O. Horvath, G. Revesz in P.R. Brown and E. Grunsha (editors), “Advances in
chromatography 39”, Marcel Dekker, New York, 1998, p311-35035. Q. Liu, “Fundamental and practicle studies of polymer separations by HPLC: I. Thermal
gradients; II. Interparticle size exclusion; III ion exchange separations of DNA oligomers”, thesisDuke University, 1998
36. T.P. Bradshaw, “Introduction to Peptide and Protein HPLC”, Phenomenex 1(2000)4737. L.R. Snyder, “Principles of Adsorption Chromatography”, Marcel Dekker, New York, 196838. R.P.W. Scott, Adv. Chromatogr. 20(1982)16739. C. Horvath, W. Melander, J. Chromatogr. Sci. 15(1977)393-40440. S.V. Galuskho, J. Chromatogr. 552(1991)19-10241. J.P. Larmann, J.J. DeStefano, A.P. Goldberg, R.W. Stout, L.R. Snyder, M.A. Stadalius, J.
Chromatogr. 255(1983)163-18942. H.A. Claessens, “Characterization of stationary phases for Reversed-Phase Liquid
Chromatography”, Thesis, University of Eindhoven, 199943. U.D. Neue, “HPLC columns, Theory, Technology and Practice”, Wiley, New York, 199744. Sj. van der Wal, LC-GC int. 5(1992)36-4145. G.R. Bear, J. Chromatogr. 459(1988)91-10746. Y. Mengerink, H.C.J de Man, Sj. van der Wal, J. Chromatogr. 552(1991)593-60447. L. R. Snyder, in E. Heftmann (editor), J. of Chromatogr. Library vol 51A; “chromatography 5th
edition, fundamentals and applications of chromatography and related differential migrationmethods. Part A: fundamentals and techniques”, 1992, A1-A68
48. S. Mori, T. Takeuchi, J. Chromatogr. 49(1970)230-23849. C.T. Barkby, G. Lawson, Food Addit. Contam. 10(1993)541-55350. C. Guaita, Makromol. Chem. 185(1984)459-46551. C. Guaita, Conv. Ital. Sci. Macromol. 5th (1981)295-29852. H. Soto-Valdez, J.W. Gramshaw, H.J. Vandenburg, Food Addit. Contam. 14(1997)309-31853. W.J. Staal, “Gradient Polymer Elution Chromatography”, Thesis, University of Eindhoven, 199554. J.C.J. Bart, “Additives in Polymers”, Elsevier science, Amsterdam, in preparation.55. R.N. Nikolov, N.I. Angelova, D.I. Pishev, Khim. Volokna 1992(5)57-5956. C.T. Barkby, G. Lawson, Food Addit. Contam. 10(1993)541-55357. A. Venema, H.J.F.M. van de Ven, F. David, P. Sandra, J. High Resol. Chrom. 16(1993)522-52458. T. H. Begley, M.L. Gay, H.C. Hollifield, Food Addit. Contam. 12(1995)671-67659. G. Glockner, “Gradient HPLC of Copolymers and Chromatographic Cross-Fractionation”,
Springer Verlag, Berlin, 199160. D. Berek, Prog. Polym. Sci. 25(2000)873-90861. G. Glockner, TrAC, 4(1985)214-21762. R. Schultz, H. Engelhardt, Chromatographia 29(1990)205-21363. G. Glockner, Adv. Pol. Sci. 79(1986)159-21464. H.J.A. Philipsen, “Mechanism of Gradient Polymer Elution Chromatography and its Application
to (Co)polyesters”, Thesis, University of Eindhoven, 199865. P.J.C.H. Cools, “Characterization of Copolymers by Gradient Polymer Elution
Chromatography”, Thesis, University of Eindhoven, 199966. L.R. Snyder, J.W. Dolan in P.R. Brown, E. Grunsha (editors), “Advances in chromatography
38”, Marcel Dekker, New York, 1998, p116-18767. G. Glockner, J.H.M. van den Berg, Chromatographia 19(1984)55-6168. T.H. Mourey, J. Chromatogr. 357(1983)101-10669. H.C. Lee, T. Chang, Polymer 37(1996)5747-574970. H.C. Lee, T. Chang, Macromol. Symp. 118(1997)261-26571. H.C. Lee, T. Chang, Macromolecules 29(1996)7294-729672. G. Glockner, Chromatographia 37(1993)7-1273. G. Glockner, D. Wolff, H. Engelhardt, Chromatographia 39(1994)557-56374. K.L.L. Eersels, G. Groeninckx, Y. Mengerink, Sj. van der Wal, Macromolecules 29(1996)6744-
674975. K. Eersels, “Aliphatic / aromatic Polyamide Blends”, Thesis, University of Leuven, 199676. S.G. Entilis, V.V. Evreinov, A.V. Gorshkov, Adv. Polym. Sci. 76(1986)129-175 77. A.A. Gorbunov, A.M. Skvortsov, PTC Int. Lab. Oct (1995)8J-8R

History and synthesis of polyamide and polymer separation techniques 39
78. A.A. Gorbunov, A.M. Skvortsov, Polymer Sci. U.S.S.R. 29(1987)1025-103179. H. Pasch, B. Trathnigg, “HPLC of Polymers”, Springer Verlag, Berlin, 199980. G. Schultz, H. Much, H. Kruger, C. Wehrstedt, J. Liq. Chromatogr. 13(1990)1745-176381. A.V. Gorshkov, H. Much, H. Becker, H. Pasch, V.V. Evreinov, S.G. Entelis, J. Chromatogr.
523(1990)91-10282. B. Trathnigg, M. Kollroser, Int. J. Pol. Anal. Char. 1(1995)301-31383. H. Yun, S.V. Olesik, E.H. Marti, J. Microcolumn Sep. 11(1999) 53-6184. R. Kruger, H. Much, G. Schultz, J. Liq. Chromatogr. 17(1994)3069-309085. P. Jandera, M. Holcapek, L. Kolarova, J. Chromatogr. 869(2000)65-8486. T. Kitayama, M. Janco, K. Ute, R. Niimi, K. Hatada, Anal. Chem. 72(2000)1518-152287. A. Bartkowiak, D. Hunkeler, D. Berek, T. Spychaj, J. Appl. Polym. Sci 69(1998)2549-255788. M.G. Khaledi, “High Performance Capillary Electrophoresis”, Wiley, New York, 199889. N.A. Guzam, “Capillary Electrophoresis Technology”, Marcel Dekker, New York, 199390. H. Poppe in P.R. Brown, E. Grunsha (editors), “Advances in chromatography 38”, Marcel
Dekker, New York, 1998, p233-30091. A. Bossi, P.G. Righetti, J. Chromatogr. A 840(1999)117-12992. I. Hamrikova, I. Miksik, M. Uhrova, Z. Deyl, Anal. Chim. Acta 371(1998)257-27293. L. N. Amankwa, J. Scholl, W.G. Kuhr, Anal. Chem. 62(1990)2189-219394. J.Y. Gao, P.L. Dubin, T. Sato, Y. Morishima, J. Chromatogr. A 766(1997)233-23695. M.T. Bowser, A.R. Kranack, D.D.Y. Chen, TrAC 17(1998)424-43496. H. Cottet, M.P. Struijk, J.L.J. van Dongen, H.A. Claessens, C.A. Cramers, J. Chromatogr.
915(2001)241-25197. S. Terabe, K. Otsuka, K. Ichikawa, A. Tsuchiya, T. Ando, Anal. Chem. 56(1984)11198. S. Terabe, K. Otsuka, T. Ando, Anal. Chem. 57(1985)83499. P. Muijselaar, “Micellar Electrokinetic Chromatography”, Thesis, University of Eindhoven, 1996100. C.P. Palmer, J. Chromatogr. A 780(1997)75-92101. C. Stathakis, E.A. Arriaga, N.J. Dovichi, J. Chromatogr. A 817(1998)233-238102. P.G. Muijselaar, H.A. Claessens, C.A. Cramers, J.F.G.A. Jansen, E.W. Meijer, E.M.M. de
Brabander-van den Berg, Sj.van der Wal, J. High Resol. Chromatogr. 18(1995)121-123103. W. Th. Kok, R. Stol, R. Tijssen, Anal. Chem. (2000)469A-476A104. A. Gallardo, A.R. Lemus, J.S. Roman, A. Cifuentes, J.C. Diez-Masa, Macromolecules
32(1999)610-617105. A.G. Ogston, Trans Faraday Soc. 54(1958)1754 in ref[106]106. A. Guttman, K.J. Ulfelder in P.R. Brown, E. Grunsha (editors), “Advances in Chromatography
38”, Marcel Dekker, New York, 1998, p301-340107. O.J. Lumpkin, P. Dejardin, B.H. Zimm, Biopolymers 24(1985)1573 in ref [106]108. H. Zhou, A.W. Miller, Z. Sosic, B. Buchholz, A.E. Barron, L. Kotler, B.L. Karger, Anal. Chem.
72(2000)1045-1052109. J. Bullock, J. Chromatogr. 645(1993)169-177110. J. B. Poli, M.R. Schure, Anal. Chem. 64(1992)896-904111. O. Grosche, J. Bohrisch, U. Wendler, W. Jaeger, H. Engelhardt, J. Chromatogr 894(2000)105-
116112. Discussion at HPCE 2000, Saarbrucken, Germany.113. M. Rothe, W. Dunkel, Polymer letters 5(1967)589-593114. H.M. McNair, X. Sun, J. Cap. Elect. 3(1996)51-53115. X. Sun, “The Study of CE: Polyimids, Nylon and Non-Aqueous Analysis”, Thesis, University of
Virginia, 1996116. H.M.M. McNair, X. Sun, Int. Symp. Chromatogr. 35th Anniv. Res Group Liq. 1995(17-25)

Chapter 240

Oligomers of polyamide-6, Part I: Injection and column stability 41
Chapter 3Analysis of linear and cyclic oligomers in polyamide-6
without sample preparation by liquid chromatography
using the sandwich injection method
Part I: Injection procedure and column stability
Summary
A method is reported for reliable routine polymer sample introduction with minimal
bias, a separation method of the first six linear and cyclic oligomers by liquid
chromatography, quantification using group equivalents and long-term method
performance. Injecting a polymer sample in a mobile phase containing an aqueous
non-solvent often results in blocked systems as the polymer precipitates in the
connecting capillaries. In this chapter we focus on a new injection technique, in
which the dissolved polyamide is placed between two zones of formic acid,
preventing the polymer to precipitate before it reaches the column. Development of
this sandwich injection method makes direct injection of the polymer into an aqueous
acetonitrile gradient feasible. The oligomeric polyamide recovery of this technique,
extraction, dissolution / precipitation and direct injection on a 1,1,1,3,3,3-hexafluoro
isopropanol (HFIP) gradient were compared. With the sandwich injection method the
polymer remains on the column, slowly changing the stationary phase. The influence
of this on resolution and retention was studied. Column stability allows sixty
injections before cleaning or replacing the column is necessary.
Y. Mengerink, R. Peters, M. Kerkhoff, J. Hellenbrand, H. Omloo, J. Andrien, M. Vestjens and Sj. vander Wal, J. Chromatogr. A 876(2000)37-50

Chapter 342
3.1. Introduction
Polyamide-6 (PA-6), also known as nylon-6, is a polycondensate based on the
monomer caprolactam. Polyamide-6 has achieved the widest commercial use of all
the polyamides produced and together with polyamide-6,6 it is the most commonly
used polyamide, finding broad application in the areas of textiles, floor coverings and
engineering plastics [1,2].
During the manufacture of polyamide-6, the quantities of cyclic and linear monomers
and oligomers (figure 3.1) are important parameters in production management and
process control. The residual trace amounts of the oligomers present in polyamide-6
can have a major impact on the properties of the final polymer. Although usually only
a few percent of the oligomers are linear, they are of importance for the physical
properties and the investigation of the polymerization mechanism of the polyamide
[3-5].
HONH
H
On
Linear oligomer of 6-aminocaproic acid: L n
NH
O
Cyclic oligomer of caprolactam: C n
n
Figure 3.1: The chemical structure of the linear and cyclic oligomers of polyamide-6.
Analysis methods for the separation of the polyamide-6 oligomers have evolved
through the years. The cyclic oligomers were first determined by the use of fractional
sublimation in 1956, followed by paper chromatography a few years later [6,7]. In
1970, Mori reduced the cyclic oligoamides to cyclic oligoamines, so analysis by gas

Oligomers of polyamide-6, Part I: Injection and column stability 43
chromatography became feasible [8]. At the same time size-exclusion
chromatography (SEC) was developed, where with the use of fluorinated modifiers
the molecular-mass distribution of the polymer could be analyzed [9-14]. In addition
to this, polymers were extracted to determine the different cyclic oligomers [15-18]
and Mori et al. derivatized the extract to determine the linear oligomers [19].
Next, normal-phase and reversed-phase high-performance liquid chromatography
became available, with superior selectivities with regard to the oligomers [4,20-27].
Polymers are hard to handle on reversed-phase liquid chromatographic systems.
Monomers and oligomers often elute at aqueous conditions where the polymer
precipitates instantaneously. Because of this, often only extracted polyamide
samples were investigated. This time consuming procedure is satisfactory when
determining extractable amounts or the migration of oligomers into a specific matrix
[4,25-27], but it is inadequate to determine the true amount of oligomers in the
polyamide material.
Although separations of the linear oligomers were also performed with thin-layer
chromatography (TLC) and SEC, as reviewed [5], no straightforward quantitative
method for the determination of as well the cyclic as the linear oligomers has been
published. In this chapter a method for routine use is described, in which the first six
cyclic and linear oligomers in a polyamide-6 matrix were separated and determined
simultaneously.
When injecting a polyamide sample dissolved in formic acid in a reversed-phase
high-performance liquid chromatography (RP-HPLC) system, the mobile phase acts
as a precipitant for the polymer, which results in a plugged system. Precipitation and
concomitant plugging can be prevented by direct sandwich injection of the dissolved
polymer on the column and no further sample preparation is necessary. The polymer
solution is sandwiched between two zones of formic acid, preventing the polymer
from precipitating in the surrounding aqueous mobile phase. The separation of the
various cyclic and linear oligomers takes only 33 minutes, including column
equilibration for the next injection [28].
The new method with sandwich injection was compared with the more traditional
intermittent extraction and with off-line precipitation of the polymer, all followed by an
aqueous acidified water to acetonitrile gradient and with direct injection in an

Chapter 344
aqueous acidified water to 1,1,1,3,3,3-hexafluoro isopropanol (HFIP) gradient. This
fluorinated alcohol is a good-solvent for polyamide-6 [9-14], but for routine use the
absence of fluorinated solvents like trifluoro ethanol (TFE) or HFIP is preferable with
respect to UV transparency, price and safety [29].
3.2. Experimental
All polyamides used were synthesized at DSM. Cyclic and linear oligomers are
obtained by preparative (HPLC) experiments. The linear oligomers are abbreviated
by Ln, the cyclic oligomers by Cn, where n is the number of (COC5H10NH)-units. The
cyclic oligomers are pure, but the linear oligomers are contaminated with the
corresponding carboxylic acid amide oligomers: HO(OC-C5H10N)nH-CO-H. The purity
of the oligomers was determined with H-NMR.
The dissolution of the polyamides in formic acid (98-100% p.a., Merck, Darmstadt,
Germany) was performed in a Bransonic ultrasonic cleaner model 5210 (Danburry,
Connecticut, USA). The sandwich injection method was developed on an HP1090
DR5 solvent delivery system equipped with an autosampler with a 25 µl syringe and
a diode-array detector (DAD), all from Agilent (Waldbronn, Germany) and controlled
by a PASCAL workstation. For routine analysis a HP1050 quaternary pump and an
HP1050 variable injector with an extended capacity of 115 vials (Agilent) was used.
The aqueous (MilliQ, Waters, Milford, MA, USA) mobile phase A contained 1%
acetonitrile (Lichrosolve, gradient grade, Merck) and 10mM phosphoric acid (made
with phosphoric acid 85%, p.a. Baker, Deventer, The Netherlands) and mobile phase
B was pure acetonitrile. With a programmed gradient the pump changed the
percentage mobile phase B from 0 to 50 in 22 min. with a flow rate of 1.2 ml/min. The
pressure drop (∆P) along the 250*4 mm Nucleosil 120-5C18 column (Machery-
Nagel, Düren, Germany) was approximately 200 Atm. UV detection at λ = 200 and
220 nm was performed with a Linear 204 programmable dual-wavelength detector
(Linear Instruments, Reno, Nevada, USA). Capillaries to connect the injector device
with the column were as short as possible and had an internal diameter of 0.25 mm.
Post-column reagents were prepared as follows: 50 g boric acid (p.a., Merck) was

Oligomers of polyamide-6, Part I: Injection and column stability 45
dissolved in 1 liter MilliQ water by adding potassium hydroxide pellets (p.a., Merck),
until a pH of 10 was reached. 0.8 g of o-phthalic dicarboxaldehyde (OPA p.a., Acros
Chemica, Geel, Belgium) was dissolved in 10 ml ethanol (Lichrosolve, gradient
grade for liquid chromatography, Merck) and together with 1 ml 3-mercaptopropionic
acid (Fluka Chemika, Buchs, Switzerland) the solutions were added to the borate
buffer solution. The post-column flow rate obtained with a Gilson 302 pump with a 5
WSC pump-head and a Gilson 802 pulsation-damping unit (all from Gilson, Villiers-
le-Bel, France) was 0.5 ml/min. The fluorescence signal was generated with a
Waters 474 fluorescence detector, 6 µl detector cell, λex = 330 nm, λem = 420 nm,
excitation and emission bandwidth 18 nm (Waters). The UV- and fluorescence-
detector signals were collected with an X-Chrom/Windows NT 3.51 version 2.11b
data management system (LAB-systems, Manchester, U.K.).
All experiments with 1,1,1,3,3,3-hexafluoro isopropanol (HFIP, Chemosynthia,
Ingelmunster, Belgium) were carried out in a fume hood on an HP1090 PV5 solvent
delivery system equipped with an autosampler with a 25 µl syringe and a diode-array
detector (DAD) all from Agilent and controlled with a Windows95 workstation LC-3D
version A.05.04. Mobile phase A contained 10 mM phosphoric acid in MilliQ water
and mobile phase B was pure HFIP. During the gradient the pump changed the
percentage mobile phase B form 10 to 90 in 80 min. at a flow rate of 0.2 ml/min. The
programmed injection volume was 2 µl and the pressure drop along the 125*2.1 mm
Nucleosil 120-5C18 column (Machery-Nagel) was approximately 100 Atm. HFIP was
purified by double distillation.
Intermittent extractions were performed on a homemade extraction device. The water
(MilliQ) and the methanol (Biosolve b.v., Valkenswaard, The Netherlands) were
intermittently heated for 3 minutes and cooled during 1 minute. The original
particles (8 mm ID) were cryogenically ground to obtain 0.1 mm particles. All
experiments were performed in duplicate.
To precipitate the polymer off-line, the total sample was prepared in a volumetric
flask followed by separation of the oligomers from the polymer by centrifugation of
the 60% formic acid and 40% water mixtures for 60 min. at 6000 r.p.m. (Labofuga
6000, Heraeus-Christ, Osterode, Germany) or by filtration with a Dynagard 0.2 µm
PP syringe filter (Spectrum Microgon, Laguna Hills, CA, USA). The speed of

Chapter 346
precipitation of the polymer is hard to control, yet it is likely that poor mixing of the
non-solvent with the solute could influence recovery. As the cloud point of
polyamide-6 is just above 60% formic acid in water, a 100% formic acid / polyamide
solute was slowly diluted under continuous vortex mixing with water until the
precipitation conditions at 40% water were reached. Some samples, which were not
cloudy within a day, were cooled down to 0oC to increase precipitation. After the
filtration or centrifugation of the precipitated mixtures, the solutions stood for another
day as post precipitation could occur, which makes repetition of the filtration or
centrifugation necessary. The obtained polymer-free solutions were analyzed using
the acetonitrile gradient.
3.3. Results and discussion
3.3.1 Sample introduction
Extraction or dissolution / precipitation is generally used for the analysis of oligomers
in polyamides to provide adequate sample preparation. However, direct injection of
the polymer in an RP-HPLC system would decrease sample preparation time and is
therefore economically attractive and, moreover, may leave less opportunity for
biased results.
In RP-HPLC some polyamide oligomers do elute in mobile phase conditions which
are classified as so-called non-solvents for the polyamide polymer, like acetonitrile
or a mixture of aqueous 0.01 M phosphoric acid and 1% acetonitrile. When a
polyamide is injected in such a mobile phase, it precipitates and blocks the injector
or the connecting capillaries. To avoid blocking at the inlet of the column a special
flow distributor was proposed [30]. In our experiments the special flow distributor is
inadequate to solve the sample introduction problem. It does of course not prevent
the polymer from precipitating before reaching the column.

Oligomers of polyamide-6, Part I: Injection and column stability 47
With the sandwich injection method this precipitation can be avoided and therefore a
direct polymer injection is possible. The principle of this injection procedure is given
in figure 3.2.
Figure 3.2: Schematic view of the sandwich injection principle. Zone one and zone three: each 2 µlformic acid, zone two: 6 µl polyamide-6 sample dissolved in formic acid.
As formic acid is a good solvent for polyamide, 2 µl of formic acid is aspired into a
by-passed injection needle. Directly after this step, 6 µl sample in formic acid and
finally again 2 µl of formic acid is aspired in the needle. The polyamide solute is
sandwiched between two formic-acid zones, preventing precipitation of the polymer
in the injector or the connecting capillaries. Precipitation does not take place before
the polyamide reaches the column. At the top of the column the geometry and the
large surface to volume ratio cause almost instant precipitation [30].
This sandwich injection procedure can only be performed on a suitable injection
device, by which the sample is not transferred through injector tubing, but can be
stacked in the needle straight away. After by-passing the injector, the needle moves
up from its seat, and the formic acid and solute vials are one after another
transported, as programmed, to the needle, which aspirates the established volumes
from these vials. At the end of this sub-program, the needle moves back to the
injector seat, the injector valve is turned to the inject position and the stacked zones

Chapter 348
in the needle are swept to the column by the mobile phase. Evidently with the
injector used here, the two 2 µl formic-acid zones are large enough to prevent the
polymer to precipitate before entering the column and the total volume of 10 µl
formic acid is small enough to not induce unwanted extra column band broadening
and to maintain a uniform pH in the post-column reactor, as the response of the first
eluting component 6-aminocaproic acid is constant yet decreases when larger zones
are used. In figure 3.3 the dependence on injected mass is given by varying
concentrations at fixed injection volumes.
0 10 20 30 40 50
polymer conc. in formic acid (g/L)
0.00
0.08
0.16
0.24
0.32
0.40
mea
sure
d c
on
cen
trat
ion
in %
(m
/m)
Figure 3.3: Dependence of the measured concentration of the cyclic oligomers on the polymerconcentration in the sample. Cyclic pentamer (9), cyclic hexamer (s) and cyclic nonamer (l).
Approximately 200 mg of polymer dissolves in 10 milliliter formic acid within an hour
by ultrasonic agitation. Up to the cyclic heptamer, no mass dependence is observed.
For the cyclic nonamer on the other hand a mass dependence and a reproducibility
problem could be observed. In routine use we prefer to work with a 20 g.l-1
polyamide-6 solution in formic acid, but for the first six cyclic oligomers there is no
mass-loss found up to 40 g.l-1 polyamide, although it takes longer to dissolve those
amounts and the polyamide / formic acid mixtures are not so easy to handle, as they
become viscous. Full recovery was observed with standard additions of 2.5-40 g

Oligomers of polyamide-6, Part I: Injection and column stability 49
polymer to a fixed concentration of 750 mg.l-1 cyclic or linear oligomers in formic acid
and with standard additions of 75–1250 mg cyclic or linear oligomers to a fixed
concentration of 20 g polymer.l-1 (in formic acid, data not shown here). Inasmuch as
the polyamide does not elute with the acetonitrile gradient, because this mobile
phase acts as a non-solvent, the higher oligomers (n>6) remain partially on the
column, eluting again partially during the next run and many consecutive runs.
These partial eluted oligomers (n = 7-approx. 20) can be effectively removed from
the column by injecting an extra 50 µl formic acid plug at the end of the gradient.
Again, not all commercially available autosamplers are capable to perform such an
injection, as software often does not allow injecting twice during one
chromatographic run. The injection procedure described above is given in table 3.1.
Table 3.1: Procedure of the sandwich injection method
Time (min) Action0000.0123
Draw 2 µl formic acid into needleDraw 5 µl sample into needleDraw 2 µl formic acid into needleInject and start gradient time programInject 50 µl formic acid onto column
By not utilizing the extra injection plug, it is very easy to study recovery of the
polyamide oligomers qualitatively. All the oligomers, which elute in the next run of a
blank formic-acid injection, are not completely recovered in the previous run. Figure
3.4a and 3.4b demonstrate this. It gives some typical chromatograms of a polyamide
sample in which, for illustrative purpose, a known amount of linear oligomers has
been added. The first not fully recovered cyclic oligomer is the heptamer. To validate
the entire method, the results of the sandwich injection method using an acetonitrile
gradient for HPLC separation were compared with three other methods.
Because of the solubility of polyamide-6 in HFIP it is essentially better to use HFIP
instead of acetonitrile. However, HFIP is not attractive as a routine mobile phase
modifier (price / performance) [29]. Nevertheless it can serve as a comparative tool
in research investigations. In figure 3.5, three representative polyamide samples are
compared.

Chapter 350
Figure 3.4: Influence of a non-50 µl formic-acid plug injection at the end of the chromatographic run ata relatively high acetonitrile concentration. (A) UV chromatogram (λ = 200 nm) of a polyamide samplewith linear oligomers added and a subsequent blank injection both without the 50 µl formic-acid plug(B) selective fluorescence detection of the post-column derivatized linear oligomers from the samechromatographic runs. Gradient: 1 to 50.5% acetonitrile in 22 min, aqueous phase: 10 mM H3PO4 inwater, flow rate 1.2 ml/min.

Oligomers of polyamide-6, Part I: Injection and column stability 51
With the HFIP and acetonitrile gradient the recovery of the oligomers up till the cyclic
heptamer is the same, as there are no significant differences measured in the
summated total amount of the first six cyclic oligomers. Higher oligomers are
recovered to a higher degree with the HFIP gradient. The total summated amounts
of the first nine cyclic oligomers of all three polyamides with the HFIP gradient minus
that with the acetonitrile gradients start to deviate from zero. This cumulative
recovery deficit is defined as:
∑=
−=n
isandwichHFIP CC
1
<3.1>
where n is the number of backbone units in a cyclic oligomer, CHFIP is the
concentration of the first n cyclic oligomers, obtained with the HFIP gradient and
Csandwich is the concentration of the first n cyclic oligomers, obtained with the
sandwich injection method and acetonitrile gradient. The deviation from zero is in
good agreement with the results of figure 3.4. Although figure 3.4 indicates full
recovery of all linear oligomers, this is hard to prove with most real samples as they
contain only low concentrations of these oligomers. The post-column OPA / 3-MPA
reactor does not work properly with a HFIP gradient, probably due to the pH
gradient. With two standard addition samples we could prove that the first six linear
oligomers are also fully recovered, as can be seen in table 3.2.
Table 3.2: Recovery of the linear oligomers in a synthetic sample containing a high concentration oflinear oligomers.
Linearoligomer
Added amounts of Linearoligomers in mg with 20g
polymer/lin duplicate
Averagerecover with theHFIP method
in % (w/w)
Average recovery with thesandwich injection method
in %(w/w)
123456
112.1 and 150.868.6 and 92.042.6 and 56.941.5 and 55.092.9 and 123.870.0 and 90.4
*10010099101102
9610010210310098
* With the HFIP gradient and the UV detector the 6-ACA is hard to determine as it elutes just after theformic-acid peak.

Chapter 352
0 4 8 12 16 20
Cyclic oligomer n
-0.10
0.12
0.34
0.56
0.78
1.00
Cum
ulat
ive
reco
very
def
icit
in %
(m
/m)
Figure 3.5: Summated difference of recovery between the hexafluoro isopropanol system and thesandwich injection method of three (cross, triangle and circle) representative polyamide samples.
Besides the direct injection and HFIP gradient, our method was compared with two
off-line methods for the pre-separation of the polyamide and its oligomers. As far as
practicability concerns the two easiest and commonly used alternatives are
extraction and off-line dissolution and precipitation of the polymer. As the linear
oligomers are only present at very low levels in the polyamide samples, only the
content of the cyclic oligomers is compared here.
Extraction with water [ref. 20 conditions not given and ref. 23 temperature 90oC 6 hr]
or with methanol [ref. 4 conditions not given, ref. 24 reflux 1 hr] are the most widely
used methods to pre-separate the oligomers from the polymer. As extraction
experiments are time consuming, it is an inconvenient way to determine the real (and
not the extracted) amount of oligomers in the polymer samples. Another problem
with extraction is the bad solubility of the higher oligomers, which is even worse
when the temperature of the liquid decreases to ambient after the extraction.

Oligomers of polyamide-6, Part I: Injection and column stability 53
Therefore the whole extracted sample should be analyzed. Although the higher
extraction temperature could influence sample stability, polyamide oligomers are
inert till at least 100oC and the polyamide-6 itself is stable even above 200 oC. To
duplicate and compare different extracts made of polyamide samples, extraction
efficiencies have to be determined. Figure 3.6 shows the extraction recovery with
water and methanol, both with 8 and 0.1 mm particles.
0 1 2 3 4 5 6 7 8 9 10
Cyclic oligomer n
-0.10
0.16
0.42
0.68
0.94
1.20
Cum
ulat
ive
reco
very
def
icit
in %
(m/m
)
Figure 3.6: Relative extraction efficiency of the oligomers with methanol (filled marker) or water (blank)and 8 mm diameter particle (triangle) or 0.1 mm particle diameter (square) expressed as thecumulative deficit relative to the HFIP gradient.
The samples were analyzed using the acetonitrile gradient. It is rather surprising that
extraction with water or methanol are the most widely used methods to pre-separate
the oligomers from the polymer as only the cyclic monomer, dimer and trimer are
extracted effectively. A specification of the particle diameter is often not given, but
figure 3.7 shows clearly that this is an important parameter. It is without doubt that
the smaller the particles are, the better is the extraction efficiency. Extraction is of
course the best choice if the migration of the oligoamides in certain food simulating
matrices have to be studied [26,27,31].
Chapter 354
Figure 3.7. Extraction efficiency for the cyclic hexamer with methanol (filled marker, s dp = 8 mm andu dp = 0.1 mm) and water (blank marker, � dp = 8 mm and ∇ dp = 0.1 mm).
Dissolution / precipitation is a method infrequently used to pre-separate the
oligomers from the polymer. Begley et al. [31] used methylene chloride and HFIP to
dissolve and methanol to precipitate, but checked the recovery only with the cyclic
monomer caprolactam, in spite of the fact that the recoveries of the higher oligomers
are more critical.
However, dissolution / precipitation is an easier and better method to use than
extraction. With the acetonitrile gradient, no dependence of the initial polymer mass
was observed in the given range for the first eight cyclic oligomers. In table 3.3 the
results of these precipitation experiments are compared with the sandwich injection
and the HFIP method. With eight experiments performed, no differences are
observed for the first six or seven cyclic oligomers compared to the sandwich
injection method and the HFIP gradient. Dissolution / precipitation is an alternative
for the sandwich injection method although it is time consuming.
0 20 40 60 80 100
extraction time in hours
0.00
0.06
0.12
0.18
0.24
0.30re
cove
red
amou
nt in
% m
/m
total amount cyclic Hexamer present in polyamide

Oligomers of polyamide-6, Part I: Injection and column stability 55
Table 3.3: Determination of the cyclic oligomers in polyamide-6 with different sample preparationtechniques.
Samplepreparation→
SandwichInjection
Normal injection
Dissolution in formic acidprecipitation with water
centrifugation
Dissolution in formic acidprecipitation with water
filtrationGradient → Acetonitrile HFIP Acetonitrile Acetonitrile
Cyclicoligomer
% (w/w) % (w/w) % (w/w) % (w/w)
123456789
0.130.060.170.220.270.320.250.240.18
0.110.040.140.210.260.290.280.240.24
0.130.060.170.230.270.330.310.180.12
0.130.060.180.230.270.320.300.140.11
3.3.2 Column Stability
With each polymer injection 100 µg polyamide and volumes of 10 and 50 µl pure
formic acid enter the column. This demands good chromatographic interpretation of
the chromatogram. When only polyamide oligomers are injected with the sandwich
injection method given in table 3.1, a slight shift of the retention times during the first
50-60 injections is observed, after which stable retention times are obtained (figure
3.8a).
The resolution of the most critical pair (the cyclic monomer and the cyclic dimer)
shows the same trend, as it drops from 4.0 to 3.0 within the first 60 oligomer
injections and stays above 2.5 during the next 60 injections, although it is still slightly
decreasing (figure 3.9). When instead of an oligomeric mixture a real polyamide-6
polymer is injected, retention time shifts are the same in comparison with oligomer
mixture (figure 3.8b), indicating a slight irreversible modification of the stationary
phase. Resolution, however, decreases much faster. After 60 polymer injections it is
reduced from 4.0 to 1.0 (figure 3.9). In routine use we replace the column, but in
figure 3.9 it is demonstrated that the resolution after the first sixty polymer injections
does not decrease at the same rate anymore. Instead of replacing the column, it can
be cleaned by removing the polyamide with 15 ml of HFIP, which constitutes a trade-
off in price (column 150 $, 15 ml HFIP: approx. 30 $), time and safety.

Chapter 356
Figure 3.8: Retention time stability of the cyclic oligomers, (A, first plot) without polymer injected onthe column and (B, lower plot) with polymer injection on the column. Cyclic dimer(+), cyclic monomercaprolactam (∆), cyclic trimer(O), cyclic tetramer (9), cyclic pentamer ( s) and cyclic hexamer (l).
Figure 3.9: Resolution between cyclic monomer caprolactam and its cyclic dimer with (s) and without(9) polymer injection on the column.
0 3 2 6 4 9 6 1 2 8 1 6 0
i nj ect i on
7 . 0 0
8 . 6 0
1 0 . 2 0
1 1 . 8 0
1 3 . 4 0
1 5 . 0 0
rete
nti
on
ti
me
(m
in)
0 32 64 96 128 160
injection (1,2 oligomers; 3-20 polymers)
7.00
8.60
10.20
11.80
13.40
15.00
rete
nti
on
tim
e (m
in)
0 30 60 90 120 150
Injections with or without polymer
0
1
2
3
4
5
Rs

Oligomers of polyamide-6, Part I: Injection and column stability 57
It is clear that the presence of polymer on the column particles creates secondary
interaction. In figure 3.10 the elution of the cyclic oligomers of polyamide-6 is shown
after 150 polymer injections and after a subsequent backflush of the column with 15
ml HFIP. The resolution of the cyclic monomer and the cyclic dimer returns to 2.75,
which is approximately the same resolution which was obtained after the injections of
150 non-polymer containing oligomer samples. This indicates that the modification of
the stationary phase by the polyamide is reversible.
Figure 3.10: Chromatograms of cyclic oligomers. a) First injection on a new column, b) an injection ofan oligomeric mixture after 60 polymer injections, c) an injection of an oligomeric mixture after 130polymer injections and d) an oligomeric mixture after 130 polymer injections and subsequent backflushof the column with 15 ml HFIP. Injection 5 µl sample, sandwiched between twice 2 µl of formic acid.Injection of 50 µl formic acid at 23 min.
3.4 Discussion / conclusions
It can be anticipated that the sandwich injection method as applied here, is
applicable to many systems where analysis of monomers, oligomers, additives or
compatibilizers in a polymer matrix is necessary. Usually the lower-molecular-mass
components of a polymer mixture are more soluble in common organic solvents,

Chapter 358
which thus can be used for chromatography, and chromatography method
development as well as routine use will be greatly facilitated.
The sandwich injection method is an accurate, reliable and convenient way to
determine the first six cyclic and linear oligomers in polyamide-6. With an acetonitrile
gradient, the recovery of these linear and cyclic oligomers is the same as with an
HFIP gradient. The more labor-intensive method of dissolution and precipitation of
the polymer gives the same results with respect to cyclic oligomer recovery.
Intermittent extraction with methanol or water does not give complete recovery, as
only the cyclic monomer, dimer and trimer are fully recovered. By duplicating the
time consuming extraction method the particle diameter and the total extraction time
were shown to be important parameters, as they influence the extraction efficiency.
With a straightforward acetonitrile gradient the cyclic oligomers are well separated,
although the separation between the cyclic monomer and dimer is just sufficient, as
on octadecyl-modificated silica the cyclic dimer elutes directly before its monomer.
After approximately 60 injections of 5 µl (60*100 µg polyamide-6 is on the column)
the resolution of this critical separation approaches 1, indicating that the column has
to be cleaned or replaced.
References
1. S.M. Aharoni, n-Nylons: Their Synthesis, Structure and Properties, Wiley, New York, 19972. S.L. Jain, N.D. Sharma, Man-Made text India 40(1997)245-2543. H.K. Reimschissel, J. Polym. Sci. Macromol. Rev. 12(1977)654. C. Guaita, Makromol. Chem. 185(1984)459-4655. R. Puffr, V. Kubanek, “Lactam-Based Polyamides Vol I”, CRC Press, Boston, 1990.6. D. Heikens, Recl. Trv. Chim. Pays-Bas 75(1956)11997. M. Rothe, Makromol. Chem. 35(1960)1838. S. Mori, M. Furusawa, T. Takeuchi, Anal. Chem. 42(1970)661-6629. S. Mori, Y. Nishimura, J. Liq. Chromatogr. 16(1993)3359-337010. H. Schorn, R. Kosfeld, M. Hess, J. Chromatogr. 282(1983)579-58711. E.E. Drott, in J. Cazes (editor), Chromatographic Science Series, Vol. 8 Liquid
Chromatography of polymers and related Materials, Marcel Dekker, New York, 1977, p41-5112. A. Moroni, T. Havard, Polym. Mater. Sci. Eng. 77(1997)14-1613. W.W. Yau, J.J. Kirkland, D.D. Bly, Wiley, New York , 197914. D.J. Goedhart, J.B. Hussem, B.P.M. Smeets, in J. Cazes, X. Delamare (Editors),
“Chromatographic Science Series, Vol.13, Liquid Chromatography of polymers and relatedMaterials II”, New York ,1977, p203-213
15. S. Mori, T. Takeuchi, J. Chromatogr. 49(1970)230-23816. J.M. Andrews, F.R. Jones, J.A. Semlyen, Polymer 15(1974)15,420-42417. Y. Fujiwara, S.H. Zeronian, J. Appl. Pol. Sci. 23(1979)3601-361918. J.L. Mulder, F.A. Buytenhuis, J. Chromatogr. 51(1970)459-477

Oligomers of polyamide-6, Part I: Injection and column stability 59
19. S. Mori, T. Takeuchi, J. Chromatogr. 50(1970)419-42820. J. Brodilova, J. Rotschova, J. Pospisil, J. Chromatogr. 168(1979)530-53221. R. Kulkarni, P. Kanekar, Process Control and Quality 9(1997)31-3722. R.N. Nikolov, N.I. Angelova, D.I. Pishev, Khim. Volokna 5(1992)57-5923. K. Tai, T. Tagawa, J. Appl. Pol. Sci. 27(1982)2791-279624. V. Krajnik, P. Bozek, J. Chromatogr. 240(1982)539-54225. C. Guaita, Conv. Ital. Sci. Macromol. 5th (1981)295-29826. C.T. Barkby, G. Lawson, Food Addit. Contam. 10(1993)541-55327. H. Soto-Valdez, J.W. Gramshaw, H.J. Vandenburg, Food Addit. Contam. 14(1997)309-31828. M. Vestjens, M. Kerkhoff, Y. Mengerink, J. Hellenbrand, H. Omloo, H. Linssen, Sj. van der
Wal, poster presented at HPLC ’96, Los Angeles29. Y. Mengerink, Sj. van der Wal, H.A. Claessens, C.A. Cramers, J. Chromatogr. A
871(2000)259-268, chapter 6 of this thesis30. W.J. Staal, P. Cools, A.M. Herk, A.L. German, Chromatographia 37(1993)218-22031. T. H. Begley, M.L. Gay, H.C. Hollifield, Food Addit. Contam. 12(1995)671-676

Chapter 360

Oligomers of polyamide-6, Part II: Detection and column stability 61
Chapter 4Analysis of linear and cyclic oligomers in polyamide-6
without sample preparation by liquid chromatography
using the sandwich injection method
Part II: Methods of detection and quantification and overall
long-term performance
Summary
By separating the first six linear and cyclic oligomers of polyamide-6 on a reversed-
phase high-performance liquid chromatographic system after sandwich injection,
quantitative determination of these oligomers becomes feasible. Low-wavelength UV
detection of the different oligomers and selective post-column reaction detection of
the linear oligomers with o-phthalic dicarboxaldehyde (OPA) and 3-
mercaptopropionic acid (3-MPA) are discussed. A general methodology for
quantification of oligomers in polymers was developed. It is demonstrated that the
empirically determined group-equivalent absorption coefficients and quench factors
are a convenient way for the quantification of linear and cyclic oligomers of
polyamide-6. The overall long-term performance of the method is studied by
monitoring a reference sample and the calibration factors of the linear and cyclic
oligomers.
Y. Mengerink, R. Peters, M. Kerkhoff, J. Hellenbrand, H. Omloo, J. Andrien, M. Vestjens and Sj. vander Wal, J. Chromatogr. 878(2000)45-55.

Chapter 462
4.1. Introduction
Polyamide-6 is produced by hydrolytic polymerization of caprolactam [1]. Due to its
stability, the cyclic monomer is present in unwashed polyamide-6 at relatively large
amounts [2]. Higher cyclic oligomers are present at lower levels and the amounts of
linear oligomers are even less. The structures of these oligomers are depicted in
figure 4.1.
HONH
H
On
Linear oligomer of 6-aminocaproic acid: L n
NH
O
Cyclic oligomer of caprolactam: C n
n
Figure 4.1: The chemical structure of the linear and cyclic oligomers of polyamide-6.
The amount of oligomers present in unwashed polyamide-6 can be minimized by
hot-water extraction or vacuum heating [3-5]. The residual amount of oligomers
influences the molecular-mass distribution and physical properties and for some
fields of application, the amount of oligomers in the end product is of major
importance [4,5].
In order to develop a quantitative analytical method, the linear and cyclic oligomers
of polyamide-6 have to be detected selectively. When the polyamide sample is
injected with the sandwich injection method on a reversed-phase column, the cyclic
and linear oligomers can be separated and detected selectively in the mobile phase
[6,7].
As linear oligomers are only present at relatively low concentrations compared to the

Oligomers of polyamide-6, Part II: Detection and column stability 63
cyclic oligomers, selective detection of the linear oligomers after separation
enhances accuracy. The most selective detection method is mass spectrometry (MS)
and this is the first choice for identification purposes [8]. Soto et al. [9] used off-line
LC-MS to identify the cyclic oligomers and Barkby et al. [10] demonstrated the
presence of extracted cyclic oligomers in a water matrix with an on-line LC-FAB-MS
configuration.
Selective detection can also be performed by pre-column derivatization of a
functional group of a particular oligomeric series. The linear oligomers of polyamide-
6, polyamide-6,6 and polyamide-12 were derivatized with 2,4-dinitrofluorobenzene
[11]. The well known o-phthalic dicarboxaldehyde was used to derivatize Versamid,
which is a polyamide based on di- or tri-ethylene polyamines and dimerized diacids
[12]. Both derivatizations were performed prior to a size-exclusion chromatographic
(SEC) separation. Pre-column derivatization of the amine-terminated linear
polyamide-4,6 oligomers with naphthalene dicarboxaldehyde was performed prior to
a reversed-phase separation in order to amplify the sensitivity and to study the
influence of this attached group on chromatographic behavior [13].
Other less-selective detectors have been used. With isocratic reversed-phase HPLC
conditions, the refractive index detector [14-16] and low-wavelength UV detector [14-
23] were applied. Using multiple detection techniques simultaneously is very popular
in SEC. UV and RI detection [24-26] and also an RI detector with a viscometer and a
multi-angle light-scattering detector have been used in SEC analysis of polyamides
[27-28].
Although the evaporative light-scattering detector can detect the oligomers of
polyamide-4,6 [29], UV-absorbance detection is the first choice for the determination
of polyamide oligomers in combination with gradient elution [9,30]. The cyclic and
linear oligomers do not have specific chromophore groups, but the amide function
absorbs some energy in the low-wavelength UV region. We present a dual-detection
system with a UV-absorbance detector in combination with a post-column reactor
where the relatively high levels of cyclic oligomers are detected with UV and the low
amounts of linear oligomers are derivatized post-column with o-phthalic
dicarboxaldehyde and determined with a fluorescence detector. We then
demonstrate the long-term performance of the sandwich injection method in
combination with UV detection and post-column derivatization.

Chapter 464
4.2. Experimental
All polyamides used were synthesized at DSM. Cyclic and linear oligomers were
obtained by preparative (HPLC) experiments. The linear oligomers are abbreviated
by Ln, the cyclic oligomers by Cn, where n is the number of (COC5H10NH)-units
(figure 4.1). The cyclic oligomers are pure, but the linear oligomers are contaminated
with the corresponding carboxylic acid amide oligomer: HO(OC-C5H10N)nH-CO-H.
The purity of the oligomers was determined with H-NMR.
Dissolution of the polyamides in formic acid (98-100% p.a., Merck, Darmstadt,
Germany) was performed in a Bransonic ultrasonic cleaner model 5210 (Danbury,
CT, USA).
The HPLC system consists of a HP1050 quartenary pump and a HP1050 variable
injector with an extended capacity of 115 vials (Agilent, Waldbronn, Germany). All
samples were injected using the sandwich injection procedure [6,7]. 6 µl of the
polyamide solution in formic acid was sandwiched between two zones of 2 µl formic
acid to prevent the polymer to precipitate before the column. The aqueous (MilliQ,
Waters, Milford, MA, USA) mobile phase A contained 1% acetonitrile (Lichrosolve,
gradient grade, Merck) and 10mM phosphoric acid (made with phosphoric acid 85%,
p.a. Baker, Deventer, The Netherlands) and mobile phase B was pure acetonitrile.
Using a programmed gradient the pump changed the percentage mobile phase B
from 0 to 50 in 22 min. with a flow rate of 1.2 ml/min. The pressure drop (∆P) along
the 250*4 mm Nucleosil 120-5C18 column (Machery-Nagel, Düren, Germany) was
approximately 200 Atm. UV detection at λ = 200 and 220 nm was performed with a
Linear 204 programmable dual-wavelength detector (Linear Instruments, Reno, NV,
USA) and the fluorescence signal was generated with a Waters 474 fluorescence
detector (Waters, 16 µl detector cell, λex = 330 nm, λem = 420 nm, excitation and
emission bandwidth 18 nm). Post-column reagents were prepared as follows: 50g
boric acid (p.a., Merck) was dissolved in 1 l MilliQ water by adding potassium
hydroxide pellets (p.a. Merck), until a pH of 10 was reached. 0.8 g of o-phthalic
dicarboxaldehyde (OPA p.a. Acros Chemica, Geel, Belgium) was dissolved in 10 ml
ethanol (Lichrosolve, gradient grade for liquid chromatography, Merck) and together
with 1 ml 3-mercaptopropionic acid (Fluka Chemika, Buchs, Germany) the solutions
Oligomers of polyamide-6, Part II: Detection and column stability 65
were added to the borate-buffer solution. The post-column flow rate obtained with a
Gilson 302 pump, a 5 WSC pump-head and a Gilson 802 pulsation damping unit (all
from Gilson, Villiers-le-Bel, France) was 0.5 ml/min. The UV- and fluorescence-
detector signals were collected with the X-Chrom/Windows NT 3.51 version 2.11b
data management system (LAB-systems, Manchester, U.K).
4.3. Results and discussion
4.3.1 Detection
Oligomers of polyamide-6 are hard to detect as they do not have strongly conjugated
groups. The amide function absorbs some energy in the low-UV region (λ≤220 nm).
The cyclic oligomers do not have any specific functional groups other than the amide
to be derivatized, so an eluent with very good UV transparency have to be used to
perform UV detection. The wavelength where the cyclic oligomers are usually being
detected is λ = 200 nm, however when very high concentrations of caprolactam are
present, dual-wavelength detection could be used at λ = 200 and λ = 220 nm
(εcaprolactam at 200 nm/ε caprolactam at 220 nm = 9.7).
The linear oligomers are commonly present at relatively low levels, but they have, in
addition to the carboxylic-acid group, a primary-amine group, which opens the
possibility of easy, selective and sensitive post-column reaction detection. A set of
chromatograms from a typical polyamide-6 sample is given in figure 4.2.
Ramert-Lucas et al. found that if two or more methylene groups separate
chromophores the absorption spectrum is just a summation of the two chromophores
[31]. Roa called this principle insulation of chromophores [32]. Many researchers
studied the UV absorbance of the cyclic oligomers before [16,17,20] and stated that
only the amide-function contributes to the total UV absorption [33].

Chapter 466
Figure 4.2: Typical set of chromatograms of a polyamide-6 sample. (a) UV detection of the cyclicoligomers (λ = 200 nm). (b) Fluorescence detection of the derivatized linear oligomers. Gradient: 1 to50.5% acetonitrile in 22 min. Aqueous phase: 10 mM H3PO4 in water, flow rate 1.2 ml/min.
By defining the boundary conditions, this could be captured in an equation by using
an equivalent absorption. If conjugated groups are separated by non-conjugated
alkyl chains, when the influences of intramolecular interactions are negligible
compared with intermolecular interactions with the surrounding environment and if
gradient changes of the mobile phase do not modify group-equivalent absorption
coefficients, the equivalent absorption of a given oligomer can be summed. For the
cyclic oligomer Cn with n equivalent amide groups this results in:
eqinamideinchaCC lcnlcA
nnεε == <4.1>
where ACn is the absorbance of a cyclic oligomer (absorbance units, Au), c is the
concentration of the oligomer (mol.l-1), l is the length of the detector cell (m), n is the
number of backbone units, εCn is the molar-absorption coefficient of the cyclic
oligomer (Au.mol-1.l.m-1) and εeqamide in chain is the equivalent absorption coefficient of
an amide-group in a chain (Au.eq-1.l.m-1). For the higher cyclic oligomers (with n>2)

Oligomers of polyamide-6, Part II: Detection and column stability 67
equation 4.1 gives a reasonable fit. However, when our results (table 4.1) and the
results of other research groups [16,17,20,33] are fitted in equation 4.1, UV
absorbance for caprolactam and the cyclic dimer do not fit so well: the absorbance
for caprolactam is much higher and the absorbance for the cyclic dimer is a little
lower than expected.
Table 4.1: Calibration factors at λ = 200 nm in mAu.l.m-1.g-1 for the cyclic and linear oligomers.
CyclicOligomer
ε‘ (200 nm) Linearoligomer
ε‘(200 nm)Theoreticalwith eq. 3
ε‘ (200 nm)Experimental
C1
C2
C3
C4
C5
C6
50503050337534753475
3475(= C5)
L1
L2
L3
L4
L5
L6
-16252300250027002825
<1517252300245024502600
The discrepancies in UV absorbance for the cyclic dimer can be explained by the
fact that a very stable intramolecular H-bond is possible [34]. The rigid ring or the
absence of intramolecular interactions of the cyclic monomer caprolactam could
explain its relatively high UV absorbance.
A direct consequence of equation 4.1 is that the calibration factor is the same for all
higher cyclic oligomers (n>2) if it is expressed in absorbance units divided by
concentration in g.l-1 (ε' ) instead of dividing it by the molarity (ε), as the molecular
mass is directly proportional to the equivalent amount of amides (c.f. table 4.1). The
number of amide functions divided by the molecular mass is constant for all cyclic
molecules.
Although post-column reaction is used for the determination of the linear oligomers,
it is interesting to look at the UV absorbance for these kinds of oligomers. In ref. [18]
the linear oligomers elute unretained and the total peak area was thought to indicate
the total linear oligomeric content, ignoring the fact that the UV absorbance for each
linear oligomer is different. Contrary to the cyclic oligomers the amount of amide
functions divided by the molecular mass is not constant for the linear oligomers. The
UV absorbance can be reformulated as:

Chapter 468
( ){ }inamideinchaeq
eaeq
acideq
L ncln
εεεε 1.. min −++= <4.2>
where ALn is the absorbance of the linear oligomer Ln (Au), c is the concentration of
the oligomer (mol.l-1) and εeq is the equivalent absorbance coefficient (Au.eq-1.l.m-1)
of the carboxylic-acid group, the primary-amine group and the amide group in the
chain, respectively.
The response of the acid and amine group is very low and it could be neglected, but
it can also be determined by injecting commercially available 6-aminocaproic acid,
the monomer of this series of linear oligomers. The εeqamide in chain is the same as for
the higher cyclic oligomers, so the absorption coefficient for a linear oligomer is
given by:
( )( )1113131
'131'1113' 6
−+
+−= −
n
n acaCL
n
n
εεε <4.3>
where ε‘Ln,Cn,6-ACA are the absorption coefficients of a linear oligomer, a higher cyclic
oligomer and the linear monomer 6-aminocaproic acid respectively (Au.g-1.l.m-1),
113 is the molecular mass of one backbone unit (g.mol-1) and 131 is the molecular
mass of the monomer 6-aminocaproic acid (g.mol-1).
To validate equation 4.3, the absorption coefficients of the linear oligomers were
calculated with the absorption coefficients of the cyclic oligomers and compared with
the experimental data. The results, given in table 4.1, correlate well.
Because the linear oligomers are commonly present at low levels compared to the
cyclic oligomers we coupled a post-column reactor behind the UV detector. With the
use of the well-known OPA-3MPA (o-phthalic dicarboxaldehyde and 3-
mercaptopropionic acid) [35-40] reaction, primary amines are derivatized into
isoindoles, which can be selectively detected with fluorescence, as the coeluting
cyclic oligomers do not interfere.
The material of and the reaction time in the capillary were investigated, by changing
the length, the volume and the material of the post-column reactor. With three
different reactors and a total flow rate of 1.7 ml.min-1 (coiled stainless-steel capillary
1 (5 m*0.25 mm = 0.5 ml = 0.3 min. reaction time), coiled stainless-steel capillary 2
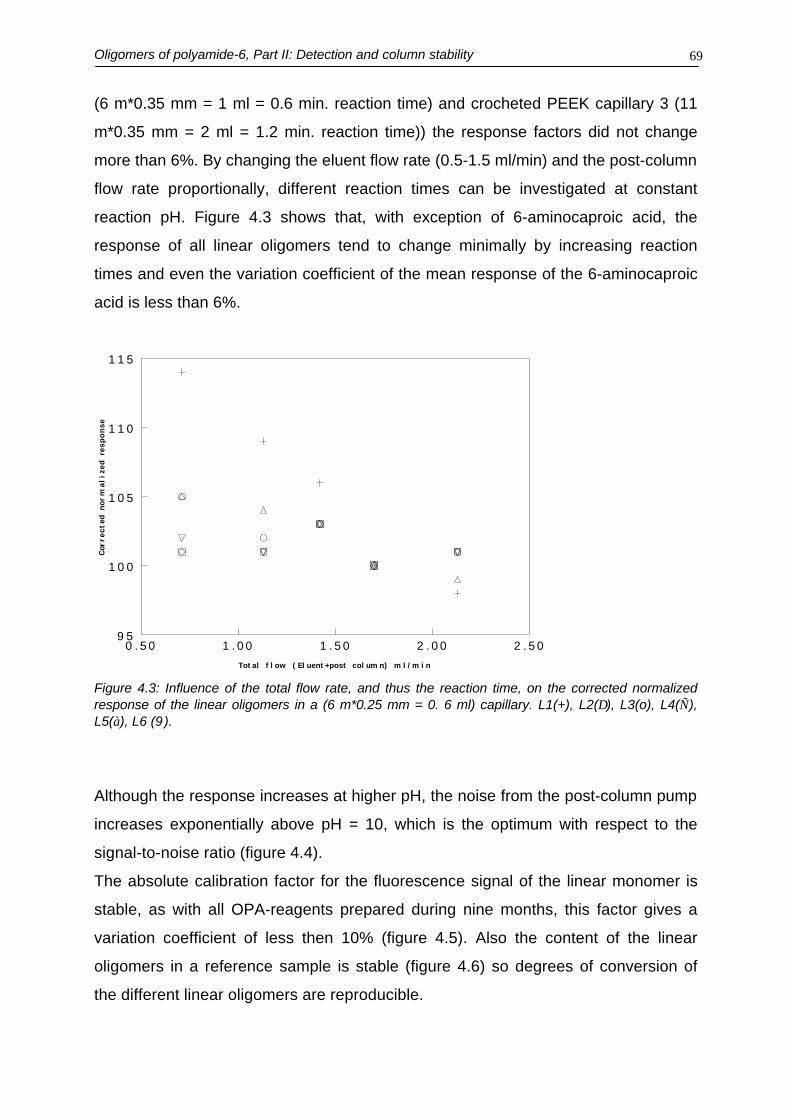
Oligomers of polyamide-6, Part II: Detection and column stability 69
(6 m*0.35 mm = 1 ml = 0.6 min. reaction time) and crocheted PEEK capillary 3 (11
m*0.35 mm = 2 ml = 1.2 min. reaction time)) the response factors did not change
more than 6%. By changing the eluent flow rate (0.5-1.5 ml/min) and the post-column
flow rate proportionally, different reaction times can be investigated at constant
reaction pH. Figure 4.3 shows that, with exception of 6-aminocaproic acid, the
response of all linear oligomers tend to change minimally by increasing reaction
times and even the variation coefficient of the mean response of the 6-aminocaproic
acid is less than 6%.
Figure 4.3: Influence of the total flow rate, and thus the reaction time, on the corrected normalizedresponse of the linear oligomers in a (6 m*0.25 mm = 0. 6 ml) capillary. L1(+), L2(∆), L3(o), L4(∇),L5(◊), L6 (9).
Although the response increases at higher pH, the noise from the post-column pump
increases exponentially above pH = 10, which is the optimum with respect to the
signal-to-noise ratio (figure 4.4).
The absolute calibration factor for the fluorescence signal of the linear monomer is
stable, as with all OPA-reagents prepared during nine months, this factor gives a
variation coefficient of less then 10% (figure 4.5). Also the content of the linear
oligomers in a reference sample is stable (figure 4.6) so degrees of conversion of
the different linear oligomers are reproducible.
0 . 5 0 1 . 0 0 1 . 5 0 2 . 0 0 2 . 5 0
Tot al f l ow ( El uent +post col um n) m l / m i n
9 5
1 0 0
1 0 5
1 1 0
1 1 5
Cor
rec
ted
no
rm
ali
zed
re
sp
on
se

Chapter 470
Figure 4.4: Influence of the pH of the OPA / 3-MPA substrate on the post-column reaction. Bufferconcentration, 0.4 M boric acid; pH adjusted with KOH to establish pH. Linear monomer L1(∆) andlinear hexamer L6(o). Filled symbols indicate normalized fluorescence response; empty symbolsindicate signal-to-noise ratio.
A small drawback of this post-column reactor is the long-term instability of the OPA-
reagents as recently described by Molnar-Perl et al. [35]. After several days an as
yet unknown precipitate appears. When the reaction capillary is not cleaned well
after each analysis sequence with the aqueous mobile phase, a precipitate builds up
inside the capillary, which causes a small but broad peak in the chromatogram,
making integration at low levels of the eluting linear oligomer derivatives harder to
perform correctly (see figure 4.2 fluorescence signal).
Without good calibration standards the same assumptions as with UV detection
could be made. Only the isoindole group is responsible for the fluorescence intensity
and this would mean that 1 mol.l-1 of linear oligomer would give a constant response,
independent of the specific oligomer. As 6-aminocaproic acid is commercially
available this is a convenient way to calculate the calibration factors of the higher,
non-available, linear oligomers.

Oligomers of polyamide-6, Part II: Detection and column stability 71
Although the fluorescence intensity is defined as [32,41-43]:
( )clF
ε−−ΙΦ=Ι 101. 0 <4.4>
where ΙF is the fluorescence response in quanta per second, Φ the quantum yield, Ιo
the intensity of the incident light in quanta per second, ε the molar-absorption
coefficient (Au.l.mol-1.m-1), c the concentration (mol.l-1) and l the path length of the
cell (m), the use of the intrinsic fluorescence sensitivity (IFS) was proposed [42,44].
This IFS can be defined as Φε/BW. For εcl <0.02, (1-10-εcl) ≈ 2.3εcl and equation 4.4
can be reformulated as:
lCBWIFS acaF ...'..3.2 60 −Ι=Ι <4.5>
where, IFS’6-aca is the intrinsic fluorescence (Au.g-1.l), BW is the band width at half
height of the emission spectrum (m-1), C is the concentration (g.l-1) and l is the path
length of the detector cell (m). Due to this reformulation, units of equation 4.5 do not
fit. With the insulation of chromophores rule in mind, the intrinsic fluorescence of the
higher linear oligomers can be given by:
( ){ }1113131'.131
' 6
−+= −
nIFS
IFS acaLn
<4.6>
Where IFS’Ln is the intrinsic fluorescence of linear oligomer Ln and IFS’6-aca is the
intrinsic fluorescence of 6-aminocaproic acid. In equation 4.6 it is assumed that the
degrees of conversion of all linear oligomers are the same and that the quantum
yield of all linear oligomers is the same. This is unlikely, so equation 4.6 is improved
by the introduction of an empirical quench factor:
( ){ }1113131
'.131.' 6
−+= −
n
IFSQIFS acaL
Ln
n<4.7>

Chapter 472
where QLn is the quench factor. To determine these empirical quench factors for the
respective linear oligomers we isolated a few mg of each linear oligomer by
preparative HPLC. The results are given in table 4.2.
Table 4.2: Quench factors for the linear oligomers.
LinearOligomer
Quenchfactor
L1
L2
L3
L4
L5
L6
10.80.660.660.660.66
As the isolated linear oligomers are scarce, for routine use, equation 4.7 is utilized
with the quench factors of table 4.2 to calculate the calibration factor with the
experimentally determined calibration factor of the linear monomer 6-aminocaproic
acid.
A comparison of the detection principles yields that with UV absorbance the
detection limit of he cyclic oligomers is approximately 100 mg.kg-1 and with the post-
column OPA / 3-MPA reactor the detection limits of the derivatized linear oligomers
are in the range of 5-20 mg/kg. For the cyclic oligomers the detection limit does not
increase by increasing backbone units, as it does for the linear oligomers in
polyamide-6.
4.3.2 Method performance
With the sandwich injection method polyamide can be injected into an HPLC system
without problems. About one hundred injections can be made, before the column has
to be cleaned or replaced [6]. With the use of the absolute calibration factor in a
control chart and a reference sample, instrument performance can easily be
monitored (figure 4.5 and 4.6).

Oligomers of polyamide-6, Part II: Detection and column stability 73
Figure 4.5: Control chart of the calibration factors of 6-aminocaproic acid (L1) and the first five cyclicoligomers (C1-C5).
0
5000
10000
15000
20000
25000
30000
35000
60 62 64 66 68 70 72 74 76 78 80 82 84 86 88 90 92 94 96 98 100
102
104
106
108
110
112
abso
lute
cal
ibra
tion
fact
or
C1
C2
C3
C4
C5
L1

Chapter 474
Figure 4.6: Precision of the content of linear and cyclic oligomers in a reference sample.
Cyclic monomer caprolactam Linear monomer 6-aminocaproic acid0.127 ± 0.001% w/w s=0.005 n=79 "< 4 mg/kg"
Cyclic Dimer C2 Linear dimer L20.287 ± 0.002% w/w s=0.01 n=79 22 ± 1% mg/kg s=3 n=79
Cyclic trimer C3 Linear trimer L30.267 ± 0.003% w/w s=0.013 n=79 37 ± 1 mg/kg s=4 n=79
Cyclic tetramer C4 Linear tetramer L40.299 ± 0.004% w/w s=0.019 n=79 70 ± 2 mg/kg s=9 n=79
Cyclic pentamer C5 Linear pentamer L50.322 ± 0.004% w/w s=0.019 n=79 135 ± 3 mg/kg s=13 n=79
Cyclic hexamer C6 Linear hexamer L60.341 ± 0.005% w/w s=0.023 n=79 207 ± 4 mg/kg s=16 n=79
0
0.05
0.1
0.15
0.2
0 20 40 60 80n
%w/w
0
0.1
0.2
0.3
0.4
0 20 40 60 80n
%w/w
00.050.1
0.150.2
0.250.3
0.35
0 10 20 30 40 50 60 70 80n
%w/w
0
0.1
0.2
0.3
0.4
0 20 40 60 80n
%w/w
00.10.20.30.40.5
0 20 40 60 80n
%w/w
0
0.1
0.2
0.3
0.4
0.5
0 20 40 60 80n
%w/w
05
1015202530
0 10 20 30 40 50 60 70 80n
mg/kg
01020304050
0 20 40 60 80n
mg/kg
0
50
100
150
0 20 40 60 80n
mg/kg
050
100150200250
0 20 40 60 80n
mg/kg
0
100
200
300
0 20 40 60 80n
mg/kg

Oligomers of polyamide-6, Part II: Detection and column stability 75
When the calibration factors of the linear and cyclic oligomers drift to the same
direction, this is probably caused by a pump or injection problem. Only once did we
observe a slow increase of all calibration factors, finally up till 20% higher than the
normal values, which could be traced back to injector problems (figure 4.5, n = 74-
86). When only the calibration factors of the linear or cyclic oligomers drift, this is
obviously caused by the corresponding detection system. In figure 4.6 the precision
of the contents of the linear and cyclic oligomers is given in a control chart of a
representative reference polyamide sample [6]. As expected, the above mentioned
deviation of the injection volume did not affect the contents of the reference sample
(figure 4.6; compare exp. 1-73 with 74-80). For the representative polyamide-6
reference sample with low oligomer concentrations the variation coefficient of the
cyclic oligomers is 3-7% and for the linear oligomers this variation coefficient is 8-
13%. At higher concentrations the variation coefficient decreases. For an unwashed
polyamide-6 reference sample the variation coefficient of caprolactam (amount 8%)
is less as 1%.
With the described method, the oligomer content of a polyamide-6 sample can be
analyzed by dissolving the polymer in formic acid (during one hour with ultrasonic
agitation), and analysis, including column equilibration for the next injection, takes
33 minutes. As more samples can be dissolved simultaneously and calibration and
reference samples have to be run also, approximately 60 polymer samples can
effectively be analyzed within 2.5 days. This does not include data analysis if not
fully automated, which is strongly dependent on available hardware and software.
4.4. Conclusion
Applying the equivalent group absorbance concept is very useful for research
purposes and in semi-quantitative analysis of the oligomeric determination of all
kinds of different polymers. When the chromophores of these oligomers are
insulated, the calibration factor of many higher non-available oligomers can easily be
estimated.
The concentration of linear oligomers in our samples was much lower than the
concentration of cyclic oligomers, the latter being detected properly by low-UV

Chapter 476
absorbance detection. Because UV absorbance is mainly governed by the amide
function, absorption coefficients of non-available oligomers can be calculated. At the
usual low level of the linear oligomers compared to the cyclic oligomers, UV
detection is not feasible for these linear oligomers, but they can be selectively
determined with a post-column reaction detector. Their primary-amine group reacts
with o-phthalic dicarboxaldehyde and 3-mercaptopropionic acid to form a fluorescent
isoindole. Again, the calibration factors can be calculated, although an empirical
correction factor, the so-called quench factor, is necessary to improve accuracy.
Detection limits of 100 mg of each cyclic oligomer and 5-20 mg of each linear
oligomer in 1 kg polyamide are obtained. In real polyamide-6 samples precision of
the cyclic oligomers is approximately 6% and for the linear oligomers the precision is
10% or better.
References
1. S.L. Jain, N.D. Sharma, Man-Made textiles in India 40(1997)245-2542. S.M. Aharoni, n-Nylons: Their Synthesis, Structure and properties, Wiley, New York, 19973. M. Evstatiev, Plast. Eng. (N.Y.), Handbook of thermoplastics 41(1997)641-6634. S.L. Jain, N.D. Sharma, Man-Made textiles in India 40(1997)286-2965. H.K. Reimschissel, J. Polym. Sci. Macromol. Rev. 12(1977)656. Y. Mengerink, R. Peters, M. Kerkhoff, J. Hellenbrand, H. Omloo, J. Andrien, M. Vestjens, Sj. van
der Wal, J. Chromatogr. 876(2000)37-50, chapter 3 of this thesis7. M. Vestjens, M. Kerkhoff, Y. Mengerink, J. Hellenbrand, H. Omloo, H. Linssen, Sj. van der Wal,
"Determination of cyclic and linear oligomers of Nylon-6", poster presented at HPLC ’96, 1996,San Francisco.
8. D. Barcello, “Applications of LC-MS in environmental chemistry”, J. Chromatogr. Libr. 59, 19969. H. Soto-Valdez, J.W. Gramshaw, H.J. Vandenburg, Food Addit. Contam. 14(1997)309-31810. C.T. Barkby, G. Lawson, Food Addit. Contam. 10(1993)541-55311. S. Mori, T. Takeuchi, J. Chromatogr. 50(1970)419-42812. J.J. Broersen, H. Jansen, C. de Ruiter, U.A.Th. Brinkman, R.W. Frei, F.A. Buijtenhuis, F.P.B. van
der Maeden, J. Chromatogr. 436(1988)39-4613. Sj. van der Wal, LC-GC Int. 5(1992)36-4214. J. Brodilova, J. Rotschova, J. Pospisil, J. Chromatogr. 168(1979)530-53215. C. Guaita, Conv. Ital. Sci. Macromol. 5th (1981)295-29816. L. Bonifaci, D. Frezzotti, G. Cavalca, E. Malaguti, G.P. Ravanetti, J. Chromatogr. 585(1991)333-
33617. C.T. Barkby, G. Lawson, Food Addit. Contam. 10(1993)541-55318. R.N. Nikolov, N.I. Angelova, D.I. Pishev, Khim. Volokna 5(1992)57-5919. V. Krajnik, P. Bozek, J. Chromatogr. 240(1982)539-5420. C. Guaita, Makromol. Chem. 185(1984)459-46521. N. Yagoubi, C. Guignot, D. Ferrier, J. Liq. Chrom. 21(1998)2633-264322. K. Tai, T. Tagawa, J. Appl. Pol. Sci. 27(1982)2791-279623. R. Kulkarni, P. Kanekar, Process Control and Quality 9(1997)31-3724. E.E. Drott, in J. Cazes (editor), “Chromatographic Science Series, Vol. 8 Liquid Chromatography
of polymers and related Materials.”, Marcel Dekker, New York, 1977, p41-51

Oligomers of polyamide-6, Part II: Detection and column stability 77
25. D.J. Goedhart, J.B. Hussem, B.P.M. Smeets, in J. Cazes (editor), “Chromatographic ScienceSeries, Vol. 13 Liquid Chromatography of polymers and related Materials II”, Marcel Dekker, NewYork, 1977, p203-213
26. P. Sysel, J. Kralicek, Pr. Nauk. Politech. Szczecin 513(1994)45-5227. A. Moroni, T. Havard, Polym. Mater. Sci. Eng. 77(1997)14-1628. C. Jackson, H. Barth, M.C. Han, Polym. Mater. Sci. Eng. 69(1996)270-27129. Y. Mengerink, H.C.J. de Man, Sj. van der Wal, "Use of an evaporative light-scattering detector for
HPLC of oligomeric surfactants", poster presented at 18th ISC, 1990, Amsterdam.30. T.H. Begley, M.L. Gay, H.C. Hollifield, Food Addit. Contam. 12(1995)671-67631. M. Ramart-Lucas, Bull. Soc. Chim. 51(1932)289-338 & 965-96832. C.N.R. Rao, “Ultra-violet and Visible Spectroscopy, Chemical Applications”, Butterworths,
London, 197533. S. Mori, T. Takeuchi, J. Chromatogr. 49(1970)230-23834. P.H. Hermans, Nature, 21(1956)127-12835. I. Molnar-Perl, I. Bozor, J. Chromatogr. A 798(1998)37-4636. P. Lindroth, K. Mopper, Anal. Chem. 51(1979)1667-167437. H. Godel, P. Seitz, M. Verhoef, LC-GC int. 5(1994)44-4938. S.S. Simons Jr., D.F. Johnson, J. Org. Chem. 43(1978)2886-289139. L. Purst, L. Pollack, T.A. Graser, H. Godel, P. Stehle, J. Chromatogr. A 499(1990)557-56940. G. Schwedt, Anal. Chim. Acta 92(1977)337-34441. R.P.W. Scott, “Chromatographic Detectors, Chromatographic Science Series vol. 73”, Marcel
Dekker, New York, 199642. H. Lingeman, W.J. M. Underberg, A. Takadate, A. Hulshoff, J. Liq. Chrom. 8(1985)789-87443. C.A. Parker, W.T. Rees, The Analyst 85(1960)58744. J.B.F. Lloyd, J. Chromatogr. 178(1979)249-25

Chapter 478

Oligomers of polyamide-6, Part III: Separation mechanism and gradient optimization. 79
Chapter 5Analysis of linear and cyclic oligomers in polyamide-6
without sample preparation by liquid chromatography
using the sandwich injection method
Part III: Separation mechanism and gradient optimization
Summary
The first six linear and cyclic oligomers of polyamide-6 can be quantitatively
determined in the polymer using HPLC with the sandwich injection method and an
aqueous / acetonitrile gradient. In this final part of the triptych concerning the
determination of the oligomers in polyamide-6, the irregular elution behavior of the
cyclic monomer compared to the cyclic oligomers was investigated. We also
optimized the separation of the involved polyamide oligomers, by varying gradient
steepness, stationary phase, column temperature and mobile phase pH.
The irregular elution behavior of the cyclic monomer could be contributed to its
relatively large exposed / accessible hydrophobic surface, which permits relatively
easy penetration into the hydrophobic stationary phase giving extra retention. The
dipole moment of the different oligomers was used as a measure for this exposed /
accessible hydrophobic area to correlate the retention factors using quantitative
structure retention relation (QSRR).
We also studied the retention behavior of the polyamide-6, which is injected in each
run directly onto the column and modifies the stationary phase. Using a 250 µl post-
gradient injection of formic acid on a 3*250 mm Zorbax SB-C18 column, the

Chapter 580
polyamide could be effectively removed from the stationary phase after each
separation.
The linear solvent strength (LSS) model was used to optimize the separation of the
first six linear and cyclic oligomers. As the LSS model assumes a linear correlation
between the volume fraction of the modifier and the logarithm of the retention factor
and the cyclic monomer and dimer show extreme curvation of this relation in the
eluting region, we investigated different models to predict gradient elution from
isocratic data. A direct translation of the isocratic data to gradient retention times did
not yield adequate retention times using the LSS model. It was found that the LSS
model worked acceptably if gradient retention times were used as input data. Even if
fast non-linearly eluting components were included, an average error of 0.4
resolution units (of 4σ) was obtained. Using the LSS model in combination with
different column temperatures and mobile phase pH’s a separation of the first six
linear and cyclic oligomers was accomplished.
Y. Mengerink, R. Peters, Sj. van der Wal, H.A. Claessens, C.A. Cramers, J. Chromatogr. accepted.

Oligomers of polyamide-6, Part III: Separation mechanism and gradient optimization. 81
5.1 Introduction
Polyamide-6 (nylon-6) is a synthetic polymer with a hexane amide backbone.
Besides the linear polymer with a carboxylic-acid and a primary-amine endgroup,
cyclic structures exist (figure 5.1).
NH
O
Cyclic monomer of PA-6 Cyclic dimer of PA-6(Caprolactam)
HN NH
O
O
NH
O
NH
O
NH
NH
O
O
Cyclic trimer of PA-6
Cyclic monomer of PA-4(2-Pyrrolidone)
H2N COOH
Linear monomer of polyamide-6(6-Aminocaproic acid)
H2N NH2
S
Thiourea
Figure 5.1: Structures.
To determine the linear and cyclic oligomers (including up to n = 6) in polyamide-6
the sandwich injection method and group equivalent detection were described in
chapter 3 and 4, respectively [1,2].
Elution behavior of oligomeric series often obeys simple elution characteristics,
where the monomer elutes first and the higher oligomers succeed each other. The
linear oligomers of polyamide-6 follow this elution pattern (figure 5.2a fluorescence
signal (L1-L6)). For isocratic chromatographic conditions, this can be described by
the Martin-equation [3]:

Chapter 582
Figure 2a: Fluorescence signal of the linear oligomers of polyamide-6 (L1 = linear monomer, L2 =linear dimer etc). A n a l y s i s : y 1 0 1 2 5 o l i g o , 5 6 , 1 P r o j e c t : d u m m y I n s t r u m e n t : c h a n 3 8 0 M e t h o d : 4 5 m i n
S t a n d a r d 1
A c q u i s i t i o n T i m e : 3 0 J a n 2 0 0 1 a t 0 5 : 2 2 . 4 2
R e s p o n s e ( m V )
T i m e ( m i n u t e s )
7 0 0
7 1 0
7 2 0
7 3 0
7 4 0
7 5 0
7 6 0
7 7 0
7 8 0
7 9 0
8 0 0
8 1 0
8 2 0
8 3 0
8 4 0
8 5 0
8 6 0
8 7 0
0 5 1 0 1 5 2 0 2 5 3 0 3 5 4 0
L 1
L 2
L 3
L 4L 5
L 6
U n w a s h e d p o l y a m i d e - 6 : F l u o r e s c e n c e d e t e c t i o n
Figure 2b: UV signal of the linear and cyclic oligomers (C1 = cyclic monomer, C2 = cyclic dimer etc). A n a l y s i s : y 1 0 1 2 5 o l i g o , 5 6 , 1 P r o j e c t : d u m m y I n s t r u m e n t : c h a n 3 7 8 M e t h o d : 4 5 m i n
S t a n d a r d 1
A c q u i s i t i o n T i m e : 3 0 J a n 2 0 0 1 a t 0 5 : 2 2 . 4 1
R e s p o n s e ( m V )
T i m e ( m i n u t e s )
1 0 0 0
1 0 0 5
1 0 1 0
1 0 1 5
1 0 2 0
1 0 2 5
1 0 3 0
1 0 3 5
1 0 4 0
1 0 4 5
1 0 5 0
1 0 5 5
1 0 6 0
1 0 6 5
1 0 7 0
1 0 7 5
1 0 8 0
0 5 1 0 1 5 2 0 2 5 3 0 3 5 4 0
C 2
C 3
C 5
C 6
L 2L 3
L 4
L 6L 5
C 1C 4
2 5 0 u l F o r m i c a c i d z o n e
U V d e t e c t i o n
F o r m i c a c i d
S a n d w i c h i n j e c t i o n
Figure 5.2: Optimized HPLC conditions and chromatogram: 20 mg unwashed polyamide-6/ml formicacid injected using the sandwich injection (2 µl formic-acid zone / 3 µl sample / 2 µl formic-acid zone).Column: 250*3 mm Zorbax SB-C18 (5 µm particles, 80 Å pores, column temperature = 40oC). Mobilephase A: 10 mM H3PO4 pH = 2.6 (NaOH); B: Acetonitrile, Gradient t0 min 99%A / 1% B t36 min 68%A /32% B. Flow rate 0.51 ml/min. UV detection λ = 200 and 220 nm. At t31 min a post-gradient injection of250 µl formic acid cleans the stationary phase. Post-column reaction detection: Reagent 38 gsodiumtetraborate, 3 g sodiumhydroxide and 1 ml 3-mercaptopropionic acid dissolved in 1 liter waterwhereto 0.8 g o-phthalic dicarboxaldehyde in 20 ml methanol is added. Post-column flow rate 0.25ml.min-1, PEEK capillary 0.25 mm*3 m, fluorescence detection λex = 330 nm λem = 420 nm.

Oligomers of polyamide-6, Part III: Separation mechanism and gradient optimization. 83
naak o 1ln += <5.1>
where k is the retention factor (k = (tr-to)/to, where tr is the retention time of the
oligomers and to is the retention time of an unretained component with the same
hydrodynamic volume), ao and al are constants and n is the number of backbone
units of the oligomeric series.
When the endgroup of an oligomeric series promotes retention and the backbone
promotes elution a reversed elution pattern will be obtained, where the monomer
elutes last (al<0). Again, the elution order of the higher oligomers succeeds each
other [4,5]. However, as have been observed in chapter 3 and 4 and by other
authors also, the cyclic oligomers of polyamide-6 show a deviant elution behavior on
a reversed stationary phase (see figure 5.2b UV signal and figure 5.3a) [1,2,6-9].
The cyclic dimer (C2) elutes first, the cyclic monomer (C1) thereafter and the cyclic
trimer (C3) elutes third. From hereon the successive higher cyclic oligomers succeed
each other. No satisfactory explanation has been given in the literature for this
irregular elution behavior of the cyclic oligomers of polyamide-6.
Different models are available to predict retention in reversed-phase HPLC based on
molecular characteristics. Galushko describes a simple and straightforward model
based on Horvath’s chromatographic solvation model [10-14] to estimate retention,
which is given in equation 5.2:
cGbaVk es +∆+= 3/2ln <5.2>
a, b and c represent three constants for a given mobile phase / stationary phase
combination [11,12], ∆Ges is the difference of the electrostatic Gibbs free energy of
the solute in the mobile and stationary phase and V is the molar volume of the
solute. The molar volume of the molecule can be estimated using the partial molar
volumes of the fragments. The same holds for the electrostatic Gibbs free energy.
Some of these values, which are of interest for the cyclic molecules investigated, are
given in Table 5.1 [10]. The Galushko equation is already a start to a more
chemometric approach, which is also known as quantitative structure retention
relationship (QSRR), as recently

Chapter 584
Figure 5.3: a: Elution characteristics of the cyclic monomer (C1), cyclic dimer (C2) and cyclic trimer(C3) of polyamide-6 oligomers on Nucleosil-120-5C18 at RT, b: elution characteristics of the cyclicoligomers of polyamide-6 on Nucleosil-120-5C4 at RT.
Table 5.1: Contribution of different molecule fragments on the molar volume and electrostatic freeGibbs energy, based on ref. [10-12].
Fragment Vi
(m3.mol-1)∆Ge.s. H2O
(J.mol-1)CH2
C=ONH
0.0000160.0000130.000007
2.8432.2019.20
A: Elution characteristics on Nucleosil 120-5C18 at RT
-2
-1
0
1
2
3
4
0 10 20 30 40 50 60
% acetonitrile in 10 mM H3PO4
ln kC1
C2
C3
B: Elution char acteristics of Nucleosil 120-5C4 column atRT
-2
-1
0
1
2
3
4
0 10 20 30 40 50 60
% acetonitrile i n 10 mM H3PO4
ln kC1
C2
C3

Oligomers of polyamide-6, Part III: Separation mechanism and gradient optimization. 85
reviewed by Kaliszan [15]. This approach in principle applies all kind of relevant
molecular descriptors to model retention. QSRR was used in combination with
different experimental conditions to investigate the irregular elution behavior of the
first eluting cyclic oligomers.
Using the sandwich injection method the complete polyamide-6 sample is injected on
the stationary phase [1]. As most of the polyamide remains on the stationary phase,
it gets more or less modified, resulting in bad peak shapes of the separated
oligomers. Therefore, we also investigated the retention mechanism of this injected
polyamide on the stationary phase using an aqueous / acetonitrile mobile phase and
multiple injections of formic-acid zones to try to circumvent this stationary phase
modification problem.
In a typical polyamide-6 sample the amount of linear oligomers is an order of
magnitude smaller than the amount of cyclic oligomers. For such samples it is not
important if a linear oligomer coelutes with a cyclic oligomer as the linear oligomers
are selectively detected by post-column derivatization. However, an optimization of
the separation would open the possibility to analyze all oligomeric mixtures, even
with equal amounts of linear and cyclic oligomers. To perform such an optimization
the use of a computer program is unavoidable [16]. Commercially available gradient
optimization programs use solely the so-called linear solvent strength (LSS) theory
to optimize gradient separations from gradient input data [17-20]. To predict gradient
separation from isocratic data quadratic or higher models are also available. The
LSS model assumes a linear relation between the logarithm of the retention factor k
and the organic modifier concentration. To optimize complex mixtures a combination
of gradient optimization and a second optimization parameter, such as the column
temperature, can be used [21-29]. As the separation of 6 linear and 6 cyclic
oligomers is very complex we investigated the accuracy and precision of this LSS-
model. The first problem which has been described is the non-linear retention
behavior (ln-k versus ϕmodifier) [23,30,31]. Especially of the retention factor of the
cyclic monomer and dimer, which elute in the low-organic-modifier concentration
region, show a significantly non-linearity. Comparing the non-linearity study of
Schoenmakers, where a quadratic solvent strength (QSS) model was investigated
(ln k = A0+A1ϕ+A2ϕ2), the investigated A2 value lies below 20, whereas for a the
cyclic monomer and dimer at a C18 bonded phase with acetonitrile as a modifier A2

Chapter 586
values of 50-70 were obtained [31] (figure 5.3a). No data were found in literature to
prove a good fit of the LSS-model for gradient optimization of such kind of rapid non-
linearly eluting components. Other in-column factors could influence the accuracy of
the LSS-model also [30]. Some important in-column factors (dead time and
equilibration and modifier uptake) were investigated. The dead-time determination of
the column is not straightforward. The to-value of a selected marker is assumed to be
constant during the gradient run. However, especially with octadecyl-modified silica
the measured elution time of a to-marker is strongly influenced by mobile-phase
composition [32]. Besides this dead-volume problem the LSS model assumes an
instantaneous equilibration of the organic modifier on the stationary phase. After the
dwell time of the system the percentage modifier is assumed to increase
immediately. However, due to preferential uptake of the modifier onto the octadecyl-
modified silica a kind of extra dwell time is introduced. Kazakevich et al. investigated
both effects exhaustively which are related due to the excess adsorption of the
modifier on the reversed stationary phase. A maximum excess adsorption of
10µmol.m-2 of acetonitrile on a reversed stationary phase was measured at an initial
concentration of 30% acetonitrile in an aqueous mobile phase [33].
To investigate these possible sources of error, we calculated the gradient elution
retention time of the cyclic monomer and cyclic dimer directly from the isocratic data,
investigated the role of the curvation of the ln k / modifier concentration plot,
determined the influence of the dead time and its change with organic modifier
concentration and studied the role of modifier equilibration. These calculated
gradient retention times from isocratic data were compared with the gradient
retention times from experimental data.
In this paper we attempted to elucidate the irregular elution behavior of the cyclic
monomer compared to the higher cyclic oligomers. We also studied the retention
behavior of the polyamide, which modifies the stationary phase. To investigate
accuracy of the LSS model, we studied the non-linear behavior of the cyclic
monomer and cyclic dimer, the influence of the stationary phase stabilization and the
influence of the dead volume of the system. The LSS model, but also different
stationary phases and the influence of pH was used to optimize the separation of the
first six linear and cyclic oligomers.

Oligomers of polyamide-6, Part III: Separation mechanism and gradient optimization. 87
5.2 Experimental
All experiments were carried out without the sandwich injection method and without
post-column reaction of the primary amines (unless otherwise notified) using an
HP1090 liquid chromatograph (Agilent, Waldbronn, Germany). However, the
chromatograms given in figure 5.2 and the data of figure 5.12 were obtained using a
quaternary pump system, a 900 µl autosampler, a column thermostat module, a DAD
detector, an isocratic pump and a fluorescence detector (all Agilent1100, Agilent).
RT (room temperature) is approximately 20oC. All oligomeric test samples used were
home made. Specific conditions of the optimized chromatographic conditions are
given in the legend of figure 5.2. An overview of the investigated stationary phases
is given in table 5.2. The other experimental conditions are described in chapter 4
and 5 [1,2].
Table 5.2: Overview of the columns used.
dp(µm)
Poresize(Å)
Porevol.
(ml/g)
Surf.Area
(m2/g)
%C
SurfaceCoverage(µMol/m2)
BondedGroup
Endcapping
Nucleosil 120-5C4 5 120 0.65 200 C4H9
Nucleosil 120-5C18 5 120 0.65 200 11 3.6 C18H37 Si(CH3)2
Nucleosil 50-5 5 50 0.80 420 0 0 - -Zorbax RX C18 5.2 80 0.45 180 12 3.3 C18H37
(CH3)2
no
Zorbax SB C18 5.2 80 0.45 180 10 C18H37
(C3H7)2
no
Zorbax Eclipse 5.2 0.45 9.5 3.4 C18H37
(CH3)2
Si(CH3)3
Zorbax SB C3 5.2 80 0.45 180 4 (C3H7)3 noZorbax Bonus 5.2 80 0.45 180 9.5 C3H6-NHCO-C13H27
(C3H7)2
Si(CH3)3
Multiple regression equations were solved using the Winstat add ins (R. Fitch
software) of EXCEL97 (Microsoft, Seattle, USA). Gradient optimization programs
used were Chromsword version 1.1 (Merck, Darmstadt, Germany) and Drylab
version 2.05 (LC-resources, Orinda, CA, USA). All other calculations were performed
using EXCEL97 spreadsheets. The cyclic oligomers of polyamide-6 are abbreviated
as Cn and the linear oligomers of polyamide-6 are abbreviated as Ln, where n

Chapter 588
represents the number of backbone units –[CO-C5H10-NH]-. The cyclic oligomers of
other polyamides are abbreviated as Cn-PA-y, where y represents the number of
carbon atoms, which are present in one backbone unit. The cyclic monomer of
polyamide-4, which is given in figure 5.1 should be abbreviated as C1-PA-4.
5.3 Results and discussion
5.3.1 Retention mechanism and modeling of the cyclic monomer and cyclic
dimer
The elution behavior of the cyclic monomer compared with the higher cyclic
oligomers is irregular (figure 5.2b). At the given conditions the cyclic monomer is
more retained than the cyclic dimer, but less than the cyclic trimer (figure 5.2b and
5.3a). No fundamental explanation has been given for this anomalous retention
behavior. Nikolov et al. postulated that only the cyclic monomer was able to
penetrate between the C18-chains, gaining extra retention at higher percentages of
modifier [7]. At first sight this is an easy elucidation of the observed retention.
However, when the cyclic monomers of different polyamides are injected on a
reversed-phase system, they elute at aqueous acetonitrile conditions in a very
normal order (figure 5.4, viz. C1-PA-4 elutes 1st, C1-PA-5 elutes 2nd etc.). These
results are in contradiction with Nikolov’s elucidation. To investigate the interactions
of the cyclic monomer and the cyclic dimer with the packing material, different
stationary phases were compared (table 5.2). All alkylchain-modified phases show
co-elution at higher acetonitrile concentrations of the cyclic dimer with the cyclic
trimer, but a substantial retention of the cyclic monomer comparable to the results in
figure 5.3a.

Oligomers of polyamide-6, Part III: Separation mechanism and gradient optimization. 89
Figure 5.4: Elution characteristics of the cyclic monomers of different polyamides on Nucleosil 120-5C18 at RT.
However, on less hydrophobic stationary phases (Nucleosil 120-5C18, Nucleosil
120-5C4, Zorbax Bonus-RP and the Zorbax SB-C3) [34], the elution order of the
cyclic monomer and cyclic dimer reverses at lower percentages modifier. On the
Zorbax RX-C18, the Zorbax Exclipse XDB and the Zorbax SB C18 the cyclic dimer
still elutes before the cyclic monomer even at 1% acetonitrile. All higher cyclic
oligomers (n = 3-6) elute at higher percentages modifier before the cyclic monomer
and these higher cyclic oligomers are more retained than the cyclic monomer at
lower percentages modifier. The Nucleosil 120-5C4 and the Nucleosil 120-5C18
columns show normal elution order at low modifier concentration (cyclic monomer
elutes before the cyclic dimer, see figure 3a and 3b). On the C18 phase reversal of
this elution order appears at much lower modifier concentrations than on the C4
column. On the C18 column coelution of the cyclic monomer and cyclic dimer occurs
at approximately 6% acetonitrile or 10% methanol. At the C4 column this coelution
occurs at 10% acetonitrile or 20% methanol. By using a non-modified bare-silica
column (Nucleosil 50-5) an opposite retention behavior was observed (figure 5.5). At
higher percentages of acetonitrile a normal retention behavior is observed, where
the cyclic monomer elutes before the cyclic dimer. However, when the mobile phase
monomers of different polyamides
-3
-2
-1
0
1
2
3
4
0 20 40 60 80 100
% acetonitrile
ln k
C1 PA-4C1 PA-5C1 PA-6C1 PA-7C1 PA-8C1 PA-12
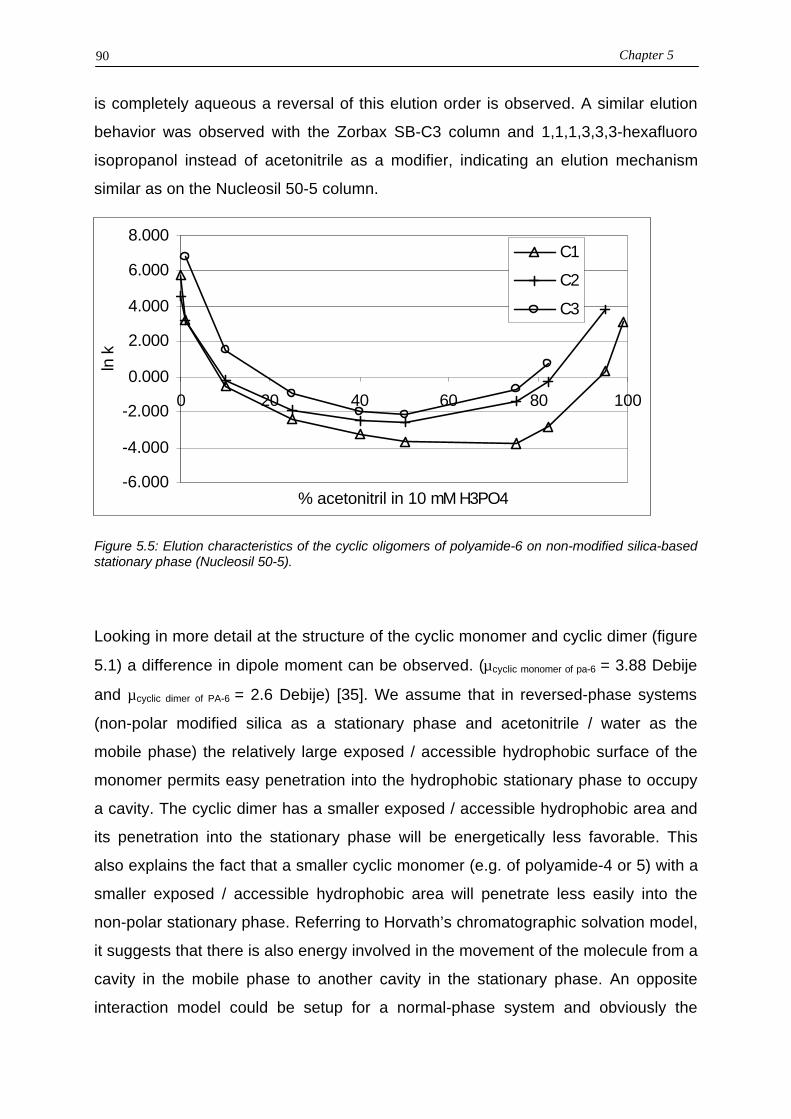
Chapter 590
is completely aqueous a reversal of this elution order is observed. A similar elution
behavior was observed with the Zorbax SB-C3 column and 1,1,1,3,3,3-hexafluoro
isopropanol instead of acetonitrile as a modifier, indicating an elution mechanism
similar as on the Nucleosil 50-5 column.
Figure 5.5: Elution characteristics of the cyclic oligomers of polyamide-6 on non-modified silica-basedstationary phase (Nucleosil 50-5).
Looking in more detail at the structure of the cyclic monomer and cyclic dimer (figure
5.1) a difference in dipole moment can be observed. (µcyclic monomer of pa-6 = 3.88 Debije
and µcyclic dimer of PA-6 = 2.6 Debije) [35]. We assume that in reversed-phase systems
(non-polar modified silica as a stationary phase and acetonitrile / water as the
mobile phase) the relatively large exposed / accessible hydrophobic surface of the
monomer permits easy penetration into the hydrophobic stationary phase to occupy
a cavity. The cyclic dimer has a smaller exposed / accessible hydrophobic area and
its penetration into the stationary phase will be energetically less favorable. This
also explains the fact that a smaller cyclic monomer (e.g. of polyamide-4 or 5) with a
smaller exposed / accessible hydrophobic area will penetrate less easily into the
non-polar stationary phase. Referring to Horvath’s chromatographic solvation model,
it suggests that there is also energy involved in the movement of the molecule from a
cavity in the mobile phase to another cavity in the stationary phase. An opposite
interaction model could be setup for a normal-phase system and obviously the
-6.000
-4.000
-2.000
0.000
2.000
4.000
6.000
8.000
0 20 40 60 80 100
% acetonitril in 10 mM H3PO4
ln k
C1
C2
C3

Oligomers of polyamide-6, Part III: Separation mechanism and gradient optimization. 91
propyl-modified silica column with HFIP as an organic modifier acts like a normal-
phase system.
Attempting to model the retention of the first six cyclic oligomers of polyamide-6 (C1-
PA-6 till C6-PA6) and six monomers of different polyamides (C1-PA-4 till C1-PA-8 and
C1-PA-12), Chromsword was used to estimate the molar volume and the electrostatic
Gibbs free energy (see table 5.1 and 5.3). A good correlation between the retention
factors calculated with Galushko’s model given in equation 5.2 and the experimental
values was not found (figure 5.6, abc values see table 5.4). Using the column
parameters abc, which were obtained using Galushko’s testset [11,12] a rough
approximation of the elution window can be obtained, however a deviation of
approximately 2 (ln k)-units was measured. Even when the abc-values were
calculated from the retention factors of the cyclic oligomers using multiple regression
and although a reasonable correlation was obtained for the cyclic monomers of the
different polyamides, the cyclic oligomers of polyamide-6 did not fit the equation
(figure 5.6).
Table 5.3: Molecular parameters of polyamide monomers and polyamide-6 oligomers.
V ∆G H-boundAcceptor/ donor
Dipolemoment
Ln kExperimental onZorbax SB-C18% acetonitrileCompound M3.mol-1 J.mol-1 Amide-
functionsDebye
10 25 40C1 – PA-6 1.03E-04 -68000 1 3.88 1.04 -0.39 -1.07C2 – PA-6 1.96E-04 -136100 2 2.6 0.47 -1.45 -2.06C3 – PA-6 2.89E-04 -204100 3 2.5* 1.83 -0.83 -2.06C4 – PA-6 3.83E-04 -272100 4 2.5* 3.04 -0.47 -2.06C5 – PA-6 4.76E-04 -340200 5 2.5* >> -0.12 -2.06C6 – PA-6 5.69E-04 -408200 6 2.5* >> 0.22 -2.06C1 – PA-4 7.27E-05 -62350 1 3.55 -0.84 -1.76 -2.29C1 – PA-5 8.78E-05 -65190 1 3.83 0.06 -1.16 -1.67C1 – PA-6 1.03E-04 -68000 1 3.88 1.04 -0.39 -1.07C1 – PA-7 1.18E-04 -70870 1 3.86 1.62 -0.01 -0.80C1 – PA-8 1.33E-04 -73700 1 3.85 2.41 0.61 -0.72
C1 – PA-12 1.94E-04 -85070 1 3.65 3.38 3.18 1.56* Indicates the estimated dipole moment of the cyclic trimer, tetramer, pentamer and hexamer ofpolyamide-6, as these values were not available. They were used as a measure for the exposed /accessible hydrophobic surface, see also text.

Chapter 592
In QSRR in general, additional parameters could give a better fit. The number of
amide functions was chosen to study this influence. The Galushko model was
modified resulting in equation 5.3:
hHcGbaVk es ++∆+= 3/2ln <5.3>
where H is the number of amide functions and h is the corresponding QSRR
constant (table 5.3).
Figure 5.6: Experimental data at 25% acetonitrile on a Zorbax SB-C18 column (o), abc valuescalculated using the experimentally obtained ln k values (+) and abc values obtained using the testsetof Galushko (∆).
Although a better fit was obtained compared to the original model of Galushko, still
no good match for the elution characteristics could be found for the different
percentages acetonitrile. Especially the elution order of the cyclic monomer and
cyclic dimer did not fit in an acceptable way (compare in figure 5.7 the calculated
abch ln k value of C1-PA-6 and C2-PA-6 with the experimental ln k values).
ln k experimental versus calculated at 25% Acetonitril on a ZorbaxSB-C18
-3.0
-2.0
-1.0
0.0
1.0
2.0
3.0
4.0
5.0
6.0
7.0
C1-
PA
-6
C2-
PA
-6
C3-
PA
-6
C4-
PA
-6
C5-
PA
-6
C6-
PA
-6
C1-
PA
-4
C1-
PA
-5
C1-
PA
-6
C1-
PA
-7
C1-
PA
-8
C1-
PA
-12
oligomers of polyamde-6
ln k
ln k 25% Acn experimental
ln k abc
ln k abc data Galushko

Oligomers of polyamide-6, Part III: Separation mechanism and gradient optimization. 93
Table 5.4: Calculated results of different QSSR models at different acetonitrile concentrations usingmultiple regression, including the confidence limits at 95%. n = number of oligomers measured in theelution window, r is the correlation coefficient. c is a constant, a and b are the constant connected tothe molecular volume and the electrostatic Gibbs free energy, d is the constant connected to thedipole moment and h is the constant connected to the H-bond donor / acceptor function.
%acn
n r a b c d H
10 6140 6.46e-5 -5.6725 4124 5.55e-5 -3.31
Abc usingtest setGalushko 40 2797 4.59e-5 -2.07
10 9 0.898 3089±1728 3.80e-5±2.71e-5 -3.55±2.5225 11 0.817 3267±1883 4.48e-5±2.64e-5 -4.88±2.87
abc usingthe cyclicoligomers 40 11 0.868 2577±1409 3.96e-5±1.97e-5 -4.35±2.15
10 9 0.992 3545± 817 1.96e-5±1.09e-5 -12.1±3.1 2.09±0.7225 11 0.974 2789± 553 3.96e-5±1.15e-5 -13.1±3.4 2.02±0.77
abcd usingthe cyclicoligomers 40 11 0.984 2386± 527 3.57e-5±0.78e-5 -10.7±2.3 1.54±0.52
10 9 0.937 -2712±8837 -38.5e-5±9.87e-5 3.09±10.21 -22.0±33.025 11 0.990 -2381±1392 -28.4e-5±6.49e-5 2.21± 1.80 -23.8±5.5
abch usingthe cyclicoligomers 40 11 0.994 -1681± 916 -33.3e-5±14.4e-5 0.99± 1.18 -17.9±3.6
A substantially better fit for the cyclic monomer and cyclic dimer of polyamide-6 was
obtained when the dipole moment was used as an additional QSRR parameter for
the exposed / accessible hydrophobic area of the molecule. As the dipole moment of
the cyclic trimer, tetramer, pentamer and hexamer of polyamide-6 are not available
in literature, a rough estimation of 2.5 Debye was used (see also table 5.3). Although
not measured or calculated these seem obvious values as a measure of the exposed
/ accessible hydrophobic surface, which is thought to be responsible for the
deviating elution characteristic of the cyclic monomer. Galushko’s equation is now
modified to:
dDcGbaVk es ++∆+= 3/2ln <5.4>
where D is the dipole moment and d is the corresponding QSRR constant. Using this
set of molecular descriptors, very good fits were obtained between the experimental
and calculated data. Especially the elution prediction of the cyclic monomer and
dimer is exceptionally good. Comparing in figure 5.7 the calculated (abcd) and
experimental obtained ln-k value of C1-PA-6 and C2-PA-6 clearly show this improved
agreement.

Chapter 594
Figure 5.7: Retention model ln k = aV2/3 + b∆G + c + hH (∆) and ln k = aV2/3 + b∆G + c + dD (+) versusthe experimental values (o) of the cyclic oligomers of polyamide-6 and the cyclic monomers of PA-4,PA-5, PA-6, PA-7, PA-8 and PA-12 at 10, 25 and 40% acetonitrile. The abch and abcd constantswere calculated using multiple regression of the retention factors of the cyclic monomers andoligomers.
-2.00
-1.00
0.00
1.00
2.00
3.00
4.00
5.00
6.00
C1-P
A-6
C2-P
A-6
C3-P
A-6
C4-P
A-6
C5-P
A-6
C6-P
A-6
C1-P
A-4
C1-P
A-5
C1-P
A-6
C1-P
A-7
C1-P
A-8
C1-P
A-1
2
cyclic oligomers of polyamide
ln k
ln k 10% Acn experimental
ln k abcd
ln k abch
ln k values of cyclic polyamide oligomers calculated versus experimental at 10% acetonitrile on a Zorbax SB-C18
-3.00
-2.00
-1.00
0.00
1.00
2.00
3.00
4.00
C1-P
A-6
C2-P
A-6
C3-P
A-6
C4-P
A-6
C5-P
A-6
C6-P
A-6
C1-P
A-4
C1-P
A-5
C1-P
A-6
C1-P
A-7
C1-P
A-8
C1-P
A-1
2
cyclic oligomers of polyamide
ln k
ln k 25% Acn experimental
ln k abcd
ln k abch
ln k values of cyclic polyamide oligomers calculated versus experimental at 25% acetonitrile on a Zorbax SB-C18
-3.00
-2.50
-2.00
-1.50
-1.00
-0.50
0.00
0.50
1.00
1.50
2.00
C1-P
A-6
C2-P
A-6
C3-P
A-6
C4-P
A-6
C5-P
A-6
C6-P
A-6
C1-P
A-4
C1-P
A-5
C1-P
A-6
C1-P
A-7
C1-P
A-8
C1-P
A-1
2
oligomer of polyamide
ln k
ln k 40% Acn experimental
ln k abcd
ln k abch
ln k values of cyclic polyamide oligomers calculated versus experimental at 40% acetonitrile on a Zorbax SB-C18

Oligomers of polyamide-6, Part III: Separation mechanism and gradient optimization. 95
5.3.2 Removal of the retained polyamide polymer
In chapter 3 we studied the peak broadening of the linear and cyclic oligomers,
which occurred after several polymer injections on a new column using the sandwich
injection method [1]. By using an acetonitrile gradient, only the first six oligomers
eluted with full recovery. Higher oligomers stayed partially on the column and are
removed by injecting a formic-acid zone at the end of the gradient. However, high-
molecular-mass polyamide remains on the column. Due to the formic-acid zones
injected during the gradient runs, the polyamide does not stay at the top of the
column, but slowly moves through the column. Two Nucleosil-120-5C18 columns
were opened after sixty polymer injections and the packing material of the 25 cm
column was divided into 10 portions, each representing 2.5 cm of the column
packing material. These column fractions were hydrolyzed with heated 6 mol.l-1
hydrochloric acid during refluxing. 6-aminocaproic acid, the hydrolytic product of
polyamide-6, was found distributed along the entire column. It was demonstrated
that large amounts of formic acid could be used on a Zorbax SB-C18 column without
reducing the column performance [36]. The 250*3 mm Zorbax-SB column was
effectively cleaned with a 100 µl formic-acid post-gradient injection plug. However,
precipitation of the polymer in the post-column reactor occurred after approximately
60 injections. Using a 250 µl formic-acid post-gradient injection plug this
precipitation problem did not occur anymore. This indicates that there is no
efficiency loss if the Zorbax SB-C18 column and the post-column reactor are
effectively cleaned after each run. Figure 5.2 depicts the chromatogram after 200
injections of a typical polyamide sample. The chromatogram did not differ
significantly from the first injections.
5.3.3 Optimization of the oligomers separation
To optimize the separation of the first six linear and six cyclic oligomers, a framework
has to be defined, which fulfills three separation requirements.
Firstly, the polar 6-aminocaproic acid is difficult to separate from the excess formic

Chapter 596
acid used to dissolve and to inject the polyamide properly on an octadecyl-modified
silica-based column. To retain and separate this linear monomer very low-organic-
modifier concentrations should be used.
Secondly, for a fully selective determination of all oligomers the first six cyclic
oligomers should be separated from all linear oligomers within approximately 45
minutes. The first six linear oligomers do not need to be separated from all cyclic
oligomers (i.e. higher cyclic oligomers n>6), because the linear oligomers are
detected selectively with post-column reaction detection [2]. When the linear
oligomers could be retained selectively and elute after elution of the first six cyclic
oligomers, the first six linear and cyclic oligomers can selectively be determined. If
no selective retention of the linear oligomers is used, the first six cyclic oligomers
need to be separated from approximately eight linear oligomers.
Thirdly, the separation of the cyclic monomer and cyclic dimer is most important.
Even when a large amount of cyclic monomer is present in for example unwashed
polyamide-6 samples, a baseline separation with the cyclic dimer is necessary.
5.3.3.a Linear solvent strength model
To optimize a separation, varying the gradient steepness is probably the first choice.
Commercial software is available to perform this optimization (e.g. Drylab,
Chromsword). A linear correlation between the logarithm of the retention factor and
the modifier concentration, the so-called Soczewinski / Wachtmeister relation [37],
which is also known as the linear solvent strength (LSS) model is used for this
optimization purpose. However, as can be seen in figure 5.3a the relationship is in
this case not linear at all. Commercially available software also presumes a fixed
dead volume of the column and an instantaneous equilibration of the
chromatographic system during gradient elution. However, in reversed-phased
systems with octadecyl-modified silica the measured dead volume changes with the
amount of modifier. In table 5.5 the elution times of some often used dead-volume
markers are compared.

Oligomers of polyamide-6, Part III: Separation mechanism and gradient optimization. 97
Table 5.5: Elution time of different often used dead-volume markers. Measurements were performedon a 250*4 mm Nucleosil 120-5C18 column at room temperature with a flow rate of 1.0 ml.min-1.
ϕ Acetonitrile inaqueous 10 mM H3PO4
t uracil
in min.t thiourea
in min.t formamide
in min.t nitrate
in min.1%5%10%25%40%50%
4.052.812.382.051.911.86
2.462.342.252.091.971.93
2.312.202.142.021.911.89
2.092.052.001.871.721.64
From these results it is clear that different to-markers could yield different to-values.
Thiourea was used as a to-marker in all experiments as its UV spectrum deviates
clearly from the polyamide oligomers and its elution time at higher percentage
modifier equals the elution time of the higher cyclic oligomers of polyamide-6 (n = 2-
6). Observing the retention time of this marker at different experimental conditions,
again no fixed dead volume is obtained using an octadecyl-modified stationary
phase (table 5.6).
Table 5.6: Elution time of t0-marker thiourea at different experimental conditions.
250*4 mm Nucleosil 120-5C18 250*4 mm Nucleosil 120-5C4%
modifierAcetonitrile Methanol Acetonitrile Methanol
RT 40oC RT 40oC RT 40oC RT 40oCt0 in min t0 in min t0 in min t0 in min t0 in min t0 in min t0 in min t0 in min
1510254050
2.462.342.252.091.991.93
2.342.252.172.041.941.91
2.482.392.322.222.172.15
2.352.292.242.162.122.10
2.412.412.412.412.402.40
2.382.392.382.412.372.46
2.412.402.412.412.452.46
2.352.392.392.412.422.43
However, on butyl-modified silica, the dead volume is much more constant for the
different percentages modifier. The average dead time of this column was 2.41±0.01
min. (n = 24) with a standard deviation of 0.03 min. The dwell volume of a
chromatographic system is defined as the volume needed before the onset of the
gradient reaches the top of the column. This dwell volume can easily be determined
by tracking the mobile phase changes before the column. However, when this

Chapter 598
tracking of the mobile phase is performed at the column outlet, one could expect a
larger observed delay volume than just the summated to and dwell volume, as a part
of the organic modifier will be adsorbed to the stationary phase. By measuring the
conductivity of the eluent during the gradient at the end of the column this solvent
uptake was estimated for a gradient of 1% modifier to 75% modifier with a gradient
time of 10 minutes. No significant differences of the programmed and observed
gradient endtime were observed when the gradient time was changed to 60 minutes.
In table 5.8 the results of different experimental setups (see table 5.7) were
compared, which is graphically depicted in figure 5.8 for a Nucleosil 120-5C18
column with an acetonitrile gradient at ambient temperature.
Table 5.7: The conditions by which the gradient conditions were calculated. Aqueous part of themobile phase is 10 mM phosphoric acid. Flow rate 1.0 ml.min-1.
Experiment Modifier Column Column temperature1 Acetonitrile 250*4 mm Nucleosil 120-5C18 RT2 Acetonitrile 250*4 mm Nucleosil 120-5C18 40oC3 Methanol 250*4 mm Nucleosil 120-5C18 RT4 Methanol 250*4 mm Nucleosil 120-5C18 40oC5 Acetonitrile 250*4 mm Nucleosil 120-5C4 RT6 Acetonitrile 250*4 mm Nucleosil 120-5C4 40oC7 Methanol 250*4 mm Nucleosil 120-5C4 RT8 Methanol 250*4 mm Nucleosil 120-5C4 40oC
Table 5.8: Observed gradient time (Tg = 10 min, tdwell = 0.58 min), which is calculated as the observedendtime minus the to-value at 75% subtracted with the observed start time minus the to-value at 1%modifier ( = (12.40-1.93)-(3.80-2.46) = 9.13) and observed dwell time (= 3.80-2.46 = 1.34).
Column 250*4 mm Nucleosil 120-5C18 250*4 mm Nucleosil 120-5C4
Modifier Acetonitrile Methanol Acetonitrile Methanol
Column temperature RT 40oC RT 40oC RT 40oC RT 40oC
Observed start time(post column) in min
3.80 3.83 3.35 3.25 3.40 3.30 3.25 3.15
Observed end time(post column) in min
12.40 12.40 12.85 12.80 13.10 13.00 13.20 13.20
to (1% modifier) in min= start gradient
2.46 2.34 2.48 2.35 2.41 2.38 2.41 2.35
to (75% modifier) in min= end gradient
1.93 1.91 2.15 2.10 2.40 2.36 2.46 2.43
Observed / correctedGradient time in min
9.13 9.00 9.83 9.80 9.71 9.72 9.90 9.97
Observed / correcteddwell time in min
1.34 1.49 0.87 0.90 0.99 0.92 0.84 0.80

Oligomers of polyamide-6, Part III: Separation mechanism and gradient optimization. 99
Figure 5.8: Computerized model of the modifier concentration in 10 mM phosphoric acid as theaqueous part, measured using a conductivity detector at the end of the column (Nucleosil 120-5C18).Straight line: programmed gradient profile (flow rate 1.0 ml/min.), dashed line: observed linearizedgradient profile (measured at 0 and 100% modifier).
As can be seen the measured dwell volume of 0.58 ml increases in all experiments
due to the preferential solvent uptake. However, the difference of the post-column
observed end time and the programmed end time is in all cases smaller than the
difference observed between the post-column observed start time and the
programmed start time. This suggests a larger dwell volume than measured and a
steeper gradient than programmed. To calculate the gradient retention times from
isocratic data equation 5 has to be solved [20]:
xkt
dtrt
−=∫ 1
'
0 0
<5.5>
where to is the column dead time, t’r is the net retention time (retention time minus
the column dead time), k is the retention factor and x is the fraction of the column,
that has been past by the component before the gradient actually reaches the
column. x is defined as [20]:
00kt
tx D= <5.6>
0
1 0
2 0
3 0
4 0
5 0
6 0
7 0
8 0
0 . 0 2 . 0 4 . 0 6 . 0 8 . 0 1 0 . 0 1 2 . 0 1 4 . 0t im e ( m i n )
% m
odifi
er
to +
tdw
ell
to+
tdw
ell+
tg

Chapter 5100
where tD is the dwell time, which is the time necessary for the gradient to reach the
top of the column, and k0 is the retention factor of the component at the starting
conditions of the gradient with the starting modifier fraction ϕ0.
The LSS-model uses a linear relation between log k and the modifier concentration
(log k = log kw-Sϕ) and the retention time tr can be calculated using equation 5.7
[20]:
[ ] 000 )1(1)1(3.2log txxbkb
ttt Dr −++−+= <5.7>
where b = (t0∆ϕS/Tg) and log ko = log kw-Sϕo where kw is the retention factor at 100%
water, ∆ϕ is the difference of the starting (ϕo) and end concentration of the modifier
fraction during the linear gradient and Tg is the gradient time. For molecules, which
are partially excluded from the pores, the corresponding dead volume deviates from
the dead volume used to calculate gradient modifier changes. To account for this,
Quarry et al. used a slightly different equation [29].
When a second order polynomial relation is used (log k = A0+A1ϕ+A2ϕ2), the
integral is still solvable, but the second order polynomial constants cannot be
calculated from gradient data and iterative methods must be used [38,39]. However,
the polynomial constants can be calculated from isocratic data (1,5,10,25,40 and
50% modifier) and with easy numerical procedures retention times of gradient
elutions can be calculated. By using numerical procedures, it is also possible to use
higher polynomial models and to use drifting t0-values. In table 5.9 the calculated
data is given for the cyclic monomer on a Nucleosil 120-5C18 column at room
temperature with acetonitrile as a modifier. Besides the programmed gradient time
and standard dwell volume, also the post-column observed gradient time and dwell
volume have been used to calculate the retention time. Six different models were
used. Three different polynomials to describe the relation between the log k and
organic modifier concentration were used, each with fixed and variable to – values.

Oligomers of polyamide-6, Part III: Separation mechanism and gradient optimization. 101
Table 5.9: Calculated versus measured retention times of the cyclic monomer at different gradienttimes (Tg in min.) with a gradient from 1 to 75% acetonitrile. The calculated retention times wereobtained from the isocratic data (1, 5, 10, 25, 40 and 50% acetonitrile).
Programmed conditions Observed conditionsCorrected for acetonitrile uptake
Model
Polynomail
t0 Tdwell = 0.58 minTgprogrammed
Tdwell observed = 1.34minTgobserved
Tg=10 Tg=20 Tg=40 Tg=60 Tg=9.13 Tg=19.13 Tg=39.13 Tg=59.131 1 fixed 7.00 9.00 11.40 12.87 7.37 9.38 11.75 13.182 1 var. 6.46 8.42 10.80 12.28 6.85 8.83 11.18 12.623 2 fixed 6.30 8.08 10.60 12.44 6.77 8.58 11.11 12.934 2 var. 5.83 7.60 10.11 11.94 6.32 8.12 10.63 12.455 4 fixed 6.24 7.80 10.05 11.75 6.75 8.34 10.59 12.296 4 var. 5.75 7.32 9.57 11.28 6.26 7.86 10.12 11.82
Measured retentiontime (min.)
6.17 7.85 10.13 11.81 6.17 7.85 10.13 11.81
It can be seen that the calculated retention times with the fourth order polynomial
with changing t0-values but without the dwell-time and gradient corrections does not
give the best fit with the experimentally observed retention times (table 5.9).
However, when a correction for the acetonitrile uptake in the stationary phase is
made, this model does give the best results. These calculations where also
performed for the cyclic monomer and cyclic dimer under the different experimental
conditions of table 5.7. For every model given in table 5.9 four different gradient
retention times (Tg = 10, 20, 40 and 60 min) for the two components (cyclic
monomer and cyclic dimer of polyamide-6) were calculated using the eight
experimental conditions of table 5.7 giving 64 results per model. The percentile
deviations from the measured retention times are given in figure 5.9a for uncorrected
gradient times and dwell volumes. Figure 5.9b depicts the use of corrected gradient
times and dwell volumes. For the lower order models a bimodal distribution can be
observed. All results obtained on the Nucleosil 120-5C4 column show much better
fits for all models compared to the Nucleosil 120-5C18 column. This is easily
explained as the t0-values on the Nucleosil 120-5C4 column are not so much
influenced by the modifier concentration (the biggest difference of two measured to-
values in an experiment is always smaller as 0.08 min) and the ln k-ϕ relation
approaches a linear behavior, resulting in much better fits for all models.

Chapter 5102
By correcting the data for the modifier uptake on the stationary phase (assumed
linear), the calculated retention times increased approximately 0.5-2% for
experiment 3-8 of table 5.8. However for the experiments 1-2 of table 5.8 where
acetonitrile was used on a Nucleosil 120-5C18 phase the calculated retention times
increased 6-8%. From figure 5.9a and 5.9b it can be concluded, that higher
polynomials improve accuracy and also improve precision if gradient retention times
data are calculated from isocratic measurements. As the distribution of the fourth
order polynomial is smaller if variable to values are used this model seems to give
the best precision. However, a substantial number of calculated retention times with
the 4th order polynomial (variable to and corrected gradient and dwell times) deviated
more than 2% of the measured gradient retention time (see + in figure 5.9b).
Gradient retention times (with Tg = 20 and Tg = 40 min) were also calculated with
the LSS-model from two initial gradient runs (Tg = 10 and 60 min) utilizing
commercially available software. These results are given in table 5.10.
Table 5.10: Result of the calculated retention times versus the measured retention time ofprogrammed gradient times (Tg) of 20 and 40 minutes, using initial gradients with Tg = 10 and 60minutes. Negative resolution means reversal of the components.
Exp. retention timemeasured
retention timecalculated
Resolution
measured
ResolutionCalculated
ResolutionDifference
C1 C2 C1 C2 Chromsword Drylab Chromsword Drylab1 Tg=20 7.85 7.28 7.92 7.35 3.9 4.0 3.2 0.1 0.7
Tg=40 10.13 9.55 10.24 9.64 2.6 2.7 2.5 0.1 0.12 Tg=20 7.54 7.15 7.94 7.25 3.1 5.3 3.7 2.2 0.6
Tg=40 9.62 9.28 9.91 9.43 1.8 2.5 1.9 0.7 0.13 Tg=20 10.87 10.53 11.07 10.85 0.9 0.7 0.8 0.2 0.1
Tg=40 14.65 14.39 14.93 14.84 0.4 0.2 0.2 0.2 0.24 Tg=20 10.10 9.85 10.2 10.04 1.1 0.7 0.7 0.4 0.4
Tg=40 13.42 13.25 13.47 13.51 0.4 -0.1 -0.1 0.5 0.55 Tg=20 6.35 6.50 6.36 6.56 1.1 1.5 1.6 0.4 0.5
Tg=40 7.18 7.65 7.17 7.69 2.6 2.6 3.0 0.0 0.46 Tg=20 5.53 5.80 5.47 5.93 2.2 2.8 3.0 0.6 0.8
Tg=40 5.97 6.68 5.94 6.67 4.3 4.1 4.3 0.2 0.07 Tg=20 7.46 7.76 7.52 7.91 1.2 1.6 1.7 0.4 0.5
Tg=40 8.57 9.28 8.58 9.32 2.0 2.1 2.2 0.1 0.28 Tg=20 6.08 6.59 6.07 6.62 2.5 2.6 2.9 0.1 0.4
Tg=40 6.65 7.47 6.62 7.47 2.9 2.9 3.1 0.0 0.2average 0.4 0.4
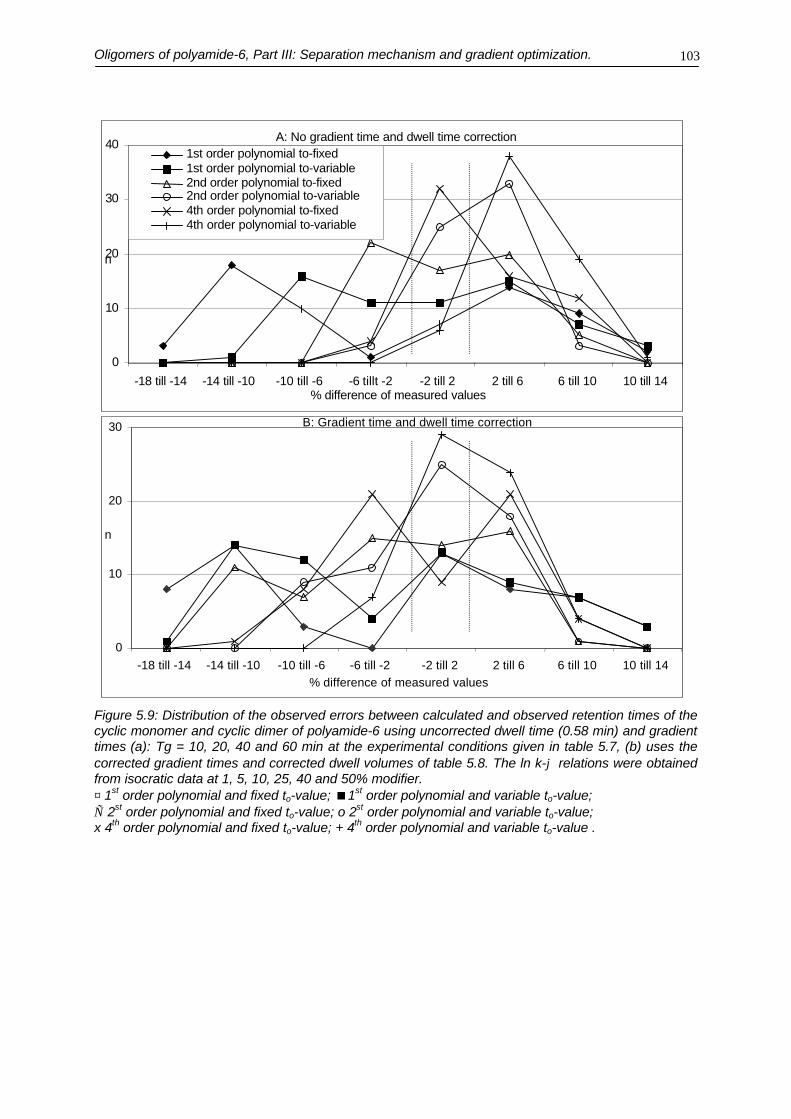
Oligomers of polyamide-6, Part III: Separation mechanism and gradient optimization. 103
Figure 5.9: Distribution of the observed errors between calculated and observed retention times of thecyclic monomer and cyclic dimer of polyamide-6 using uncorrected dwell time (0.58 min) and gradienttimes (a): Tg = 10, 20, 40 and 60 min at the experimental conditions given in table 5.7, (b) uses thecorrected gradient times and corrected dwell volumes of table 5.8. The ln k-ϕ relations were obtainedfrom isocratic data at 1, 5, 10, 25, 40 and 50% modifier.♦1st order polynomial and fixed to-value; <1st order polynomial and variable to-value;∇ 2st order polynomial and fixed to-value; o 2st order polynomial and variable to-value;x 4th order polynomial and fixed to-value; + 4th order polynomial and variable to-value .
A: No gradient time and dwell time correction
0
10
20
30
40
-18 till -14 -14 till -10 -10 till -6 -6 tillt -2 -2 till 2 2 till 6 6 till 10 10 till 14% difference of measured values
n
1st order polynomial to-fixed1st order polynomial to-variable2nd order polynomial to-fixed2nd order polynomial to-variable4th order polynomial to-fixed4th order polynomial to-variable
B: Gradient time and dwell time correction
0
10
20
30
-18 till -14 -14 till -10 -10 till -6 -6 till -2 -2 till 2 2 till 6 6 till 10 10 till 14% difference of measured values
n

Chapter 5104
Chromsword and Drylab calculate exactly the same retention times, however, they
calculate slightly different peak widths, resulting in some variations in the predicted
resolutions. For both programs an average deviation in the calculated resolution of
0.4 units was obtained. Although a linear behavior of the ln k-ϕ relation and a fixed
dead volume is assumed (both assumptions are not fulfilled in exp. 1-4) and no
corrections were made for excess solvent uptake by the stationary phase, it can also
be concluded that the deviation of the predicted resolution is almost always less as
0.8.
5.3.3.b Gradient optimization
To perform a good optimization of the separation of the first six linear and cyclic
oligomers, stable conditions with respect of retention time are necessary. It was
observed that the higher oligomers did not show constant retention times on the
Nucleosil 120-5C18 column at 40oC using 10 mM phosphoric acid in water as the
aqueous part of the mobile phase. This unstable retention behavior is hardly
detectable with low-molecular-mass components like the cyclic monomer. The
normalized retention times of the cyclic pentamer were compared with cyclic
monomer and the t0-marker thiourea (figure 5.10). The retention time stability did not
improve if 1 mM phosphoric acid was used. This unstable behavior of the Nucleosil
120-5C18 column for the higher oligomers of polyamide-6 made it impossible to
optimize the separation of the first six linear and cyclic oligomers on this column in
one gradient run. It turned out that other stationary phases, e.g. the symmetry C18,
the Zorbax SB-C18 and the platinum EPS, did not show this unstable behavior.
Another approach is to make use of selective retention of the linear oligomers, which
is possible on the Nucleosil 120-5C18 column. At a low ionic strength of the aqueous
part of the mobile phase the cyclic oligomers behave identically compared to high-
ionic-strength conditions. However, the linear oligomers are selectively retained at
low-ionic-strength conditions. A main advantage of this latter low-ionic-strength
approach is that the different oligomeric series are separately eluted, making the
chemical instability of the stationary phase less important.

Oligomers of polyamide-6, Part III: Separation mechanism and gradient optimization. 105
Figure 5.10: Retention stability of the cyclic pentamer (C5) compared to the cyclic monomer and the tomarker thiourea using a Nucleosil 120-5C18 at 40oC and a gradient (1 ml/min.) 1 - 37.5% acetonitrilein 30 min. with 10 mM phosphoric acid in water as the aqueous part of the mobile phase.
By starting with water instead of 10 mM phosphoric acid in water as the aqueous
part, the cyclic oligomers elute selectively. The linear oligomers remain on the
stationary phase. Ion-exchange interactions of the amine group with residual anionic
silanols are suspected to be responsible for this selective interaction. Figure 10.11
shows an example of this approach. However, switching from low ion strength / high
acetonitrile to high ion strength / low acetonitrile (t10 min – t20 min in figure 10.11) an
enormous baseline disturbance was observed in the fluorescence signal of the post-
column reactor, making it impossible to detect the linear monomer (chromatogram
not shown). This made us look for an alternative system. The only stationary phase
of our test series with the same selective retention of the linear oligomers, was the
Platinum EPS column. However, the peaks of the cyclic oligomers were already
extremely broad compared to the cyclic monomer and the same problem with the
post-column reactor could be expected.
stability of Nucleosil 120-5C18
96
97
98
99
100
0 500 1000 1500 2000 2500 3000 3500 4000
hours
norm
aliz
ed re
tent
ion
time
to (thiourea)
c1 (caprolactam)
c5 (cyclic pentamer)

Chapter 5106
min0 5 10 15 20 25
mAu
0
50
100
150
200
250
C2
C1
C3
C4
C5
C6
L2L3 L4
L5
L6
Figure 5.11: Separation of an oligomeric mixture with equal amounts of linear and cyclic oligomers.Conditions: column 250*4 mm Nucleosil 120-5C18 at RT, mobile phase A: water, B: 10 mM H3PO4, C:acetonitrile, gradient: to min 100% A; t10 min 72.5% A and 27.5% C; t11 min 100% A; t15 min 100% A; t15.1 min
100% B; t31min 62.5% B and 37.5% C. Flow-rate 1.0 ml/min, UV detection λ = 200 nm.
The main problem of all other columns tested, was the impossibility to sufficiently
retain the linear monomer at the starting conditions of the gradient (10mM H3PO4 in
water and 1% acetonitrile) to separate it from the formic acid, which has to be used
as a solvent of the polyamide. To increase the retention of this linear monomer, the
influence of ion-pair formation of the primary-amine group with the
dihydrogenphosphate ion was studied. In the pH range of 2.5-4.0 the linear
monomer can be retained due to this ion-pair formation (see figure 5.12) [40]. At
lower pH only phosphoric acid is present in the solution, which is not capable to form
an ion pair with the protonated amine of the linear monomer. By increasing the pH,
the negatively charged dihydrogenphosphate ion can interact with protonated
primary amine to form an ion-pair. At higher pH the dissociation of the carboxylic-
acid group of the linear monomer causes a decrease in retention.

Oligomers of polyamide-6, Part III: Separation mechanism and gradient optimization. 107
Figure 5.12: Influence of the pH on the retention factor of benzylamine and the linear monomer 6-aminocaproic acid, using a symmetry C18 column and a mobile phase of 25 mM phosphoric acid, pHadjusted using sodium hydroxide.
Benzylamine, which does not have this carboxylic-acid group, is even more retained
at higher pH. The separation was optimized using a Zorbax SB-C18 column. Besides
gradient steepness, column temperature was varied between room temperature and
40o C and the pH of the aqueous part of the mobile phase with 10 mM phosphoric
acid was set at 2.6, 2.9 and 3.2 respectively, using acetonitrile as a modifier. Figure
5.2 depicts the optimal separation and optimal separation conditions of the first six
cyclic and linear oligomers of polyamide-6.
5.4 Conclusions
Differences in the exposed / accessible hydrophobic area of the molecule could
account for the irregular elution behavior of the cyclic monomer compared to the
influence of [H2PO4-] conc. as a complexation agent on a symmetry C18column (pH adjustment by NaOH addition to 25 mM H3PO4)
0
0.5
1
1.5
2
2.5
2.00 2.50 3.00 3.50 4.00 4.50 5.00
pH
ln kbao
-0.7
-0.6
-0.5
-0.4
-0.3
-0.2
-0.1
0
ln k6Acax
ln k BA
ln k 6ACA

Chapter 5108
cyclic oligomers. It was also shown that a post-gradient injection of 250 µl formic
acid could be used to effectively remove all polyamide from the stationary phase,
resulting in stable retention times during a sequence of gradient runs.
It was demonstrated that gradient retention times could not be calculated accurately
with the LSS model using isocratic input data. Although higher polynomials gave
better fits, a direct translation of the isocratic data to gradient retention times did not
yield accurate retention times. However, the LSS model could be used for the
optimization of the separation of the first six linear and cyclic oligomers of
polyamide-6, although a significant non-linearity of the elution (ln k versus volume
fraction of the modifier) of the cyclic monomer and dimer was observed. The
prediction of the LSS model, using interpolation of the gradient data, resulted in an
average error of 0.4 resolution units.
References
1. Y. Mengerink, R. Peters, M. Kerkhoff, J. Hellenbrand, H. Omloo, J. Andrien, M. Vestjens, Sj. vander Wal, J Chromatogr. 876(2000)37-50, chapter 3 of this thesis
2. Y. Mengerink, R. Peters, M. Kerkhoff, J. Hellenbrand, H. Omloo, J. Andrien, M. Vestjens, Sj. vander Wal, J. Chromatogr. 878(2000)45-55, chapter 4 of this thesis
3. L.R. Snyder, in E. Heftmann (editor), J. Chromatogr. Library 51A; “Chromatography 5th edition,fundamentals and applications of chromatography and related differential migration methods.Part A: fundamentals and techniques”, 1992, pA1-A68
4. Sj. van der Wal, LC-GC int. 5(1992)36-425. Y. Mengerink, H.C.J. de Man, Sj. van der Wal, J. Chromatogr. 552(1991)593-6046. R. Kulkarni, P. Kanekar, Process Control and Quality 9(1997)31-377. R.N. Nikolov, N.I. Angelova, D.I. Pishev, Khim. Volokna 5(1992)57-598. C. Guaita, Makromol. Chem. 185(1984)459-4659. C.T. Barkby, G. Lawson, Food Addit. Contam. 10(1993)541-55310. S.V. Galushko, J. Chromatogr. 552(1991)19-102 11. S.V. Galushko, I. Shishkina, Chromatographia 36(1993)39-4212. S.V. Galushko, A.A. Kamenchuk, G.L. Pit, J. Chromatogr. 660(1994)47-5913. C. Horvath, W. Melander, I. Molnar, J. Chromatogr. 125(1976)129-15614. C. Horvath, W. Melander, J. Chrom. Sci. 15(1977)393-40415. R. Kaliszan, “Structure and Retention in Chromatography, A Chemometric Approach”, Harwood
academic publishers, Australia, 199716. P. Schoenmakers in E. Katz, R. Eksteen, P. Schoenmakers (editors), “Handbook of HPLC”,
Chromatographic Science Series vol. 78, Marcel Dekker, New York, 1998, p193-231.17. L.R. Snyder, J. Chromatogr. 13(1964)415-43418. L.R. Snyder, J.W. Dolan, J.R. Gant, J. Chromatogr. 165(1979)3-3019. L.R. Snyder, J.W. Dolan, J.R. Gant, J. Chromatogr. 165(1979)31-5820. L.R. Snyder, J.W. Dolan in P.R. Brown, E. Grushka (Editors), “Advances of Chromatography vol.
38”, Marcel Dekker, New York, 1998, p115-18721. J.W. Dolan, L.R. Snyder, N.M. Djordjevic, D.W. Hill, T.J. Waeghe, J. Chromatogr. A 857(1999)1-
2022. J.W. Dolan, L.R. Snyder, N.M. Djordjevic, D.W. Hill, T.J. Waeghe, J. Chromatogr. A
857(1999)21-39

Oligomers of polyamide-6, Part III: Separation mechanism and gradient optimization. 109
23. J.W. Dolan, L.R. Snyder, R.G. Wolcott, P. Haber, T. Baczek, R. Kaliszan, L.C. Sander, J.Chromatogr. A 857(1999)21-39
24. P.L. Zhu, J.W. Dolan L.R. Snyder, N.M. Djordjevic, D.W. Hill, L.C. Sander, T.J. Waeghe, J.Chromatogr. A 756(1996)21-39
25. P.L. Zhu, J.W. Dolan, L.R. Snyder, J. Chromatogr. A 756(1996)41-5026. P.L. Zhu, L.R. Snyder, J.W. Dolan, D.W. Hill, L. van Huekelem, T.J. Waeghe, J. Chromatogr. A
756(1996)51-62 27. P.L. Zhu, L.R. Snyder, J.W. Dolan, N.M. Djordjevic, D.W. Hill, J.T. Lin, L.C. Sander, T.J.
Waeghe, J. Chromatogr. A 756(1996)63-72 28. R.G. Wolcott, J.W. Dolan, LC-GC int. 13(2000)14-16 29. P.J. Schoenmakers, H.A.H. Billiet, L. de Galan, J. Chromatogr. 205(1981)13-3030. M.A. Quarry, R.L. Grob, L.R. Snyder, J. Chromatogr. 285(1984)19-5131. P.J. Schoenmakers, H. A. H. Billiet, L. de Galan, J. Chromatogr. 185(1979)179-19532. Y.V. Kazakevich, H.M. McNair, J. Chromatogr. Sci. 31(1993)317-32233. Y.V. Kazakevich, H.M. McNair, J. Chromatogr. Sci. 33(1995)321-32734. H. Engelhardt, M. Arangio, T. Lobert, LC-GC int. 10(1997)80335. R. Puffr, V. Kubanek, “Lactam-Based Polyamides Vol I”, CRC Press, Boston, 199036. Y. Mengerink, Sj. van der Wal, H.A. Claessens, C.A. Cramers, J. Chromatogr. 871(2000)259-
268, chapter 6 of this thesis37. E. Soczewinski, C.A. Wachtmeister, J. Chromatogr. 7(1962)311-32038. P.J. Schoenmakers, H.A.H. Billiet, R. Tijssen, L. de Galan, J. Chromatogr. 149(1978)519-53739. M. Abramowitz, I. Stegum, "Handbook of Mathematical Functions", Dover publications, New
York, 1970, p.303.40. R. LoBrutto, A. Jones, Y.V. Kazakevich, H.M. McNair, J. Chromatogr. A 913(2001)173-187

Chapter 5110
Analysis of higher polyamide-6 oligomers: HFIP vs. Formic acid 111
Chapter 6The analysis of higher polyamide-6 oligomers on a silica-
based reversed-phase column with a gradient of formic
acid as compared with hexafluoro isopropanol
Summary
The analysis of polyamide-6 oligomers and polymer is usually performed with
expensive fluorinated alcohols like 2,2,2-trifluoro ethanol (TFE) or 1,1,1,3,3,3-
hexafluoro isopropanol (HFIP). Formic acid is well known as a mobile phase additive
to adjust pH in reversed-phase high-performance liquid chromatography (RP-HPLC).
However, formic acid is seldom used as a modifier to perform gradient elution
chromatography on octadecyl-modified silica-based columns. The determination of
cyclic and linear polyamide-6 oligomers using formic acid as a modifier on an
octadecyl-modified silica-based column is demonstrated. This column was shown to
be stable for more than 5000 column volumes, even when a mobile phase of 65-95%
formic acid in water at a flow rate of 1 ml/min is applied. With formic acid at the
conditions used (65-95% formic acid in water) the oligomers are retained on the
column, while the polymer does not precipitate. In comparison, during adsorption
and separation with a HFIP gradient, precipitation of the polymer occurs. The
implications of the different separation mechanisms i.e. interaction vs. precipitation
chromatography are discussed.
Selectivity is better with HFIP as a modifier. Loadability is shown to be much better
with the formic acid system. However, with formic acid as a modifier UV detection
below 250 nm is not feasible. The less sensitive evaporative light-scattering detector
(ELSD) is used to detect the polyamide oligomers in the formic acid phase. In
addition it is shown that CZE with UV-absorbance detection using HFIP is an

Chapter 6112
attractive combination as HFIP is UV transparent and CZE allows low modifier
consumption.
Y. Mengerink. Sj. van der Wal, H.A. Claessens, C.A. Cramers, J. Chromatogr. A 871(2000)259-268

Analysis of higher polyamide-6 oligomers: HFIP vs. Formic acid 113
6.1 Introduction
Polyamide-6, also known as nylon-6, is a polycondensate based on the monomer
caprolactam. Although low-molecular-mass cyclic structures exist, the majority of the
condensation reaction product is linear (figure 6.1) [1].
Figure 6.1: Reaction scheme; formation of linear and cyclic structures.
As the higher oligomers and the polymer itself are not soluble in common
chromatographic solvents, the use of exotic mobile-phase modifiers is necessary to
determine the oligomers and polymer [2]. m-Cresol [3], o-chlorophenol [4],
benzylalcohol [5-6], m-cresol / chlorobenzene [7], hexamethylphosphorotriamide [8]
and methyl chloride / dichloroacetic acid [9] have been used to determine the
molecular-mass distribution of polyamides. 1,1,1,3,3,3-Hexafluoro isopropanol
(HFIP), introduced by Drott, simplified the determination of the molecular-mass
distribution of the polyamide, as the analysis could be performed at room
temperature [10]. Nowadays, HFIP is commonly used in size-exclusion
chromatography (SEC) [11-17] and even special SEC columns for fluorinated
alcohols are available. Other fluorinated alcohols, like 2,2,2-trifluoro ethanol (TFE)
have been used in combination with SEC and reversed-phase high-performance
liquid chromatography to determine the oligomers of polyamide-6 [18-23].
Van der Maeden et al. demonstrated the separation of high-molecular-mass
poly(ethylene terephthalate) oligomers with a water / HFIP gradient and UV-
absorbance detection at 270 nm [24]. HFIP is also used in combination with gradient
NH
C
O
(n+m) + H2OHO
HN
NH
O
O
O
NH2
(n-2)
Caprolactam Linear oligomers and polymer
C NH
O
C
O
HN
Cyclic oligomers
(m-1)

Chapter 6114
elution and detection at low wavelengths (200 and 230 nm) to determine the
chemical-composition distribution of a transamidated polyamide blend [25].
Some disadvantages of HFIP (price / performance and purity) made us look for
alternative solvents which could be used in combination with gradient elution
reversed-phase high-performance liquid chromatography (RP-HPLC).
Formic acid is a very good and inexpensive solvent for polyamides at room
temperature [1,26-28]. In RP-HPLC it is a common additive for the aqueous mobile
phase where it is used at low concentrations (typically 0.1-1%). Heukeshoven et al.
demonstrated the use of high concentrations formic acid in the mobile phase to
enhance solubility of poliovirus polypeptides, although they needed 2-propanol to
elute the polypeptides [29]. We investigated the use of high concentrations formic
acid (65-95% in water) as a gradient modifier in combination with an octadecyl-
modified silica-based column and an evaporative light-scattering detector (ELSD)
and compared it with HFIP with low-UV-wavelength detection to determine the
higher linear oligomers (L6-L40) of polyamide-6.
6.2. Experimental
The polyamide-6 and the oligomeric samples were all synthesized at DSM. The
HFIP method combined with UV detection was performed on an HP 1090 DR5
solvent delivery system (flow rate 0.2 ml/min) equipped with an autosampler with a
25 µl syringe (injected volume 5 µl) and a diode-array detector (DAD, primary
wavelength λ = 200 nm), all from Agilent (Waldbronn, Germany) and controlled by a
Windows 95 workstation LC-3D version A.06.01. Mobile phase A contained 40%
HFIP (Chemosyntia, Ingelmunster, Belgium) and 60% 10 mM phosphoric acid (made
with phosphoric acid 85% p.a., Baker, Deventer, The Netherlands) in water (MilliQ,
Millipore, Milford, MA, USA) and mobile phase B contained 85% HFIP and 15% 10
mM phosphoric acid in water. The column used was a 250*2.1 mm Zorbax SB300
C18 column (Agilent, Newport, DE, USA) at room temperature (RT).
The formic acid system, combined with an ELSD was made up of an HP 1100
quaternary pump (Agilent, flow rate 1.0 ml/min), a Midas autosampler (Spark,
Emmen, The Netherlands) equipped with a 250 µl syringe and a 20 µl fixed loop.
Analysis of higher polyamide-6 oligomers: HFIP vs. Formic acid 115
Detection with the ELSD SEDEX 55 (Sedere, Vitry / Seine, France) was performed
with an optimized drift tube temperature of 550C and 1.9 Atm. air pressure. The
detector signal was collected with an X-Chrom/Windows NT 3.51 version 2.11b data
management system (LAB-systems, Manchester, U.K.). Mobile phase A contained
65% formic acid (Merck, Darmstadt, Germany) and 35% water and mobile phase B
contained 95% formic acid and 5% water. The column used was a 250*4.6 mm
Zorbax SB300 C18 column at RT. Both gradient timetables were identical. The initial
100% premixed mobile phase A was changed to 100% premixed mobile phase B in
240 min. The linear eluent velocity was in both systems 0.25 cm/sec and the injected
volume was approximately 1.5% of the column volume. A fume hood should be used
with both formic acid and HFIP containing HPLC systems. Acute health effects of
formic acid and HFIP are comparable (table 6.1). However, as long-term health
effects of HFIP are not well known, HFIP is considered to be very toxic.
Measurements of the number of theoretical plates of the 150*4.6 mm Zorbax SB300
C18 column were performed with a test mixture (p-nitroaniline, o-dinitrobenzeen, 2-
nitrotolueen, 1-chloro-3-nitrobenzeen) on an HP1090 PV5 solvent delivery system
equipped with an autosampler with a 25 µl syringe (injected volume 5 µl) and a
diode-array detector (DAD, primary wavelength λ = 278 nm), all from Agilent and
controlled by a Windows 95 workstation LC-3D version A.06.01. The mobile phase
consisted of 50% acetonitrile (Merck, Darmstadt, Germany) and 50% 10 mM
phosphoric acid in water. The number of theoretical plates was calculated as the
inverse slope of the squares of the retention times versus the squares of the
corresponding standard deviation of the four peaks [30]. The standard deviation was
measured at half height.
Capillary zone electrophoretic experiments were performed on a Prince instrument
(Lauerlabs, Emmen, Netherlands). The capillary (60 cm*50 µm ID*365 µm OD fused
silica, J&W, Ieff = 50 cm) was rinsed for 5 min at 2000 mbar with buffer prior to
hydrodynamic injection (0.1 min, 15 mbar, samples were dissolved in buffer), after
which during 120 min 15 kV was applied. UV detection was performed at 190 nm
with a Spectra 200 (Spectra Physics, Reno, NV, USA). The buffer was HFIP and 25
mM H3PO4 in water (65:35% v/v).
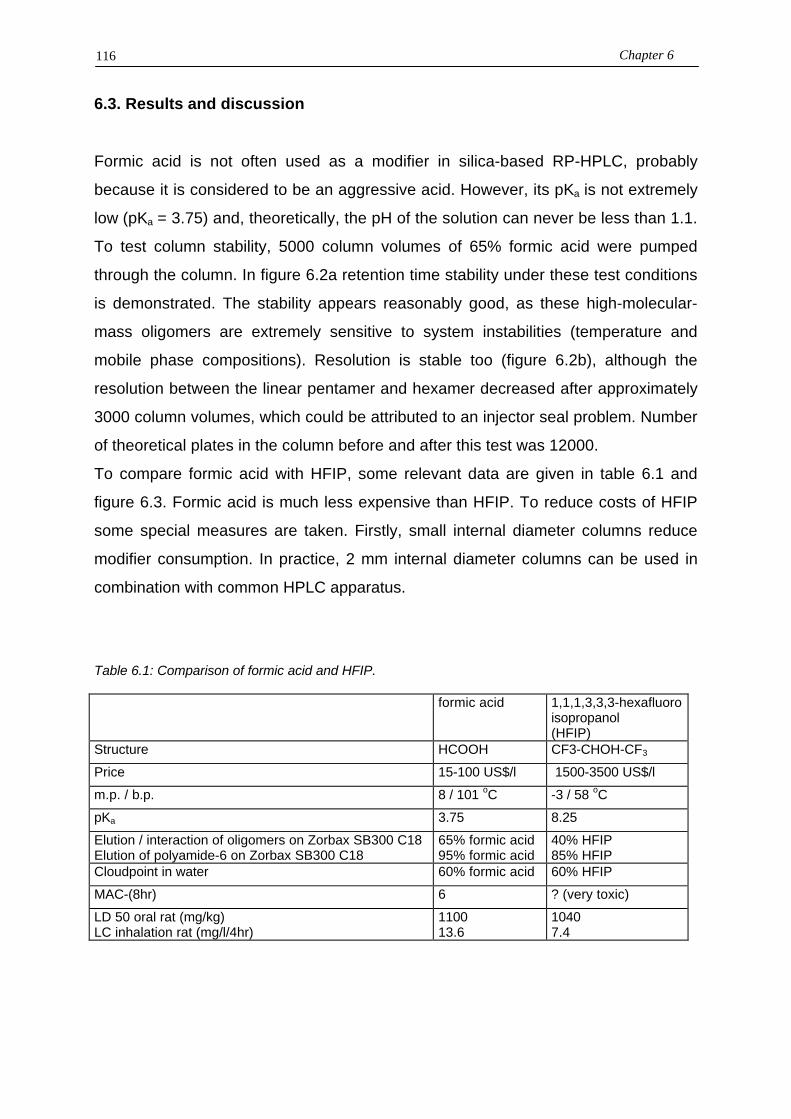
Chapter 6116
6.3. Results and discussion
Formic acid is not often used as a modifier in silica-based RP-HPLC, probably
because it is considered to be an aggressive acid. However, its pKa is not extremely
low (pKa = 3.75) and, theoretically, the pH of the solution can never be less than 1.1.
To test column stability, 5000 column volumes of 65% formic acid were pumped
through the column. In figure 6.2a retention time stability under these test conditions
is demonstrated. The stability appears reasonably good, as these high-molecular-
mass oligomers are extremely sensitive to system instabilities (temperature and
mobile phase compositions). Resolution is stable too (figure 6.2b), although the
resolution between the linear pentamer and hexamer decreased after approximately
3000 column volumes, which could be attributed to an injector seal problem. Number
of theoretical plates in the column before and after this test was 12000.
To compare formic acid with HFIP, some relevant data are given in table 6.1 and
figure 6.3. Formic acid is much less expensive than HFIP. To reduce costs of HFIP
some special measures are taken. Firstly, small internal diameter columns reduce
modifier consumption. In practice, 2 mm internal diameter columns can be used in
combination with common HPLC apparatus.
Table 6.1: Comparison of formic acid and HFIP.
formic acid 1,1,1,3,3,3-hexafluoroisopropanol(HFIP)
Structure HCOOH CF3-CHOH-CF3
Price 15-100 US$/l 1500-3500 US$/l
m.p. / b.p. 8 / 101 oC -3 / 58 oC
pKa 3.75 8.25
Elution / interaction of oligomers on Zorbax SB300 C18Elution of polyamide-6 on Zorbax SB300 C18
65% formic acid95% formic acid
40% HFIP85% HFIP
Cloudpoint in water 60% formic acid 60% HFIP
MAC-(8hr) 6 ? (very toxic)
LD 50 oral rat (mg/kg)LC inhalation rat (mg/l/4hr)
110013.6
10407.4

Analysis of higher polyamide-6 oligomers: HFIP vs. Formic acid 117
Figure 6.2: Column stability. Retention time stability (2a) and resolution stability (2b) of the linearoligomers on a silica-based C18 column with 65% formic acid in water as the mobile phase.
0.0
1.0
2.0
3.0
4.0
5.0
6.0
7.0
8.0
9.0
0 1 2 3 4 5 6Volume mobile phase in L
(65% Formic acid / 35% water)
Rs
Rs L5-L6
Rs L10-L11
Rs L15-L16
Rs L20-L21
Rs L30-L31
Rs L40-L41
0
20
40
60
80
100
120
140
160
180
200
0 1 2 3 4 5 6Volume mobile phase in L
( 65% Formic acid in water)
Ret
entio
n tim
e (m
in)
Rt L5
Rt L10
Rt L15
Rt L20
Rt L30
Rt L40

Chapter 6118
Secondly, used HFIP can be purified by distillation as its boiling point (58oC) is low
and no azeotropes are formed with water. Normally HFIP is doubly distilled and
recoveries up till 80% are possible. Even with these precautionary measures, HFIP
is economically unattractive.
Figure 6.3: UV spectra (3a) and viscosity (3b) of formic acid and HFIP.
In figure 6.4a-d representative chromatograms are given for a polyamide-6 (a, b) and
a linear oligomeric (c, d) sample, both with a formic acid (a, c) and a HFIP (b, d)
gradient. Selectivity is better with HFIP as a modifier. Loadability is much better with
formic acid as a modifier. Band spreading is worse with HFIP too. At the same
oligoamide concentrations injected, peaks are narrower with formic acid (figure 6.4c,
d), which may be caused by better wetting of the stationary phase. In figure 6.5 the
peak width is given as a function of the injected concentration of the linear
docosamer (L22). The addition of polyamide-6 to the injected sample does not
influence peak width to a large extend.
To study recovery, different amounts of an oligomeric mixture (L6-L50) were added to
a polyamide-6 solution. Recovery can be calculated with the use of this oligomeric
mixture without the polyamide. The composition of this oligomeric mixture is
calculated with the assumption of a constant contribution of the amide function to the
UV absorbance [31]. It is well possible to integrate the peaks up to the linear
tetracontamer (L40).
190 200 210 220 230 240 250 260 270
Wavelength (nm)
0.00
0.20
0.40
0.60
0.80
1.00
Ab
sorb
ance
(Au
)
95% Formic acid / 5% water
85% HFIP/ 15% 10 mM H3PO4 in water
0 20 40 60 80 100
% modifier
0
25
50
75
100
125
150
175
200
rela
tive
visc
osity
HFIP/10 mM H3PO4
formic acid/water

Analysis of higher polyamide-6 oligomers: HFIP vs. Formic acid 119
A: PA-6 and formic acid gradientR e s p o n s e ( m V )
T i m e ( m i n )
0
1
2
3
4
5
6
7
0 2 0 4 0 6 0 8 0 1 0 0 1 2 0 1 4 0 1 6 0 1 8 0 2 0 0 2 2 0
L1
1C
9 L2
2
L4
0 L5
0
B: PA-6 and HFIP gradient
m in0 2 5 5 0 7 5 1 0 0 1 2 5 1 5 0 1 7 5 2 0 0 2 2 5
m A U
0
2 0
4 0
6 0
8 0
L1
3
C1
2
L2
2
L4
0
L5
0
C: Linear oligomers of PA-6 and formic acid gradient
D: Linear oligomers of PA-6 and HFIP gradient
Figure 6.4: Chromatograms of a representative polyamide-6 sample (a and b) and a linear oligomersstandard (c and d). (a) 32.5 g/L PA-6 dissolved in 65% formic acid / 35% water, (b) 27 g/L PA-6dissolved in 65% HFIP / 35% 10 mM H3PO4 in water and (c and d) 6 g/L linear oligomers (L6-L50) ofPA-6 dissolved in 65% formic acid / 35% water. (a and c) Gradient elution with formic acid of 65 to95% in water in 240 min., 20 µl injection on a 150*4.6 mm Zorbax 300SB C18 column and ELSDdetection at 55oC. (b and d) Gradient elution with HFIP of 40 to 85% in 10 mM phosphoric acid in 240min., 5 µl injection on a 150*2.1 mm Zorbax 300SB C18 column and UV detection at 200 nm.
R e s p o n s e ( m V )
T i m e ( m i n )
0
1
2
3
4
5
6
7
8
0 2 00
4 0 6 0 8 0 1 0 0 1 2 0 1 4 0 1 6 0 1 8 0 2 0 0 2 2 0
m i n0 2 5 5 0 7 5 1 0 0 1 2 5 1 5 0 1 7 5 2 0 0 2 2 5
m A U
0
2 0
4 0
6 0
8 0

Chapter 6120
In table 6.2 and 6.3 the recoveries are given.
Table 6.2: Average recovery of oligomers L6-L40 at different additions.
ConcentrationPolyamide-6
in g/l
Concentration oligomers L6-L50
added in g/l
Average recovery L6-L40
HFIP formic-acidgradient gradient% w/w % w/w
16221621231923
3239
0.050.21.01.22.02.67.2
2.50.4
10610110010398
10182
99101
102909292909097
8395
Table 6.3: Average recovery of additions for different oligomers
group of oligomers Average recovery of differentadditions
HFIP formic acid gradient gradient % w/w % w/w
L6-L10L11-L15L15-L20L20-L25L25-L30L30-L35L35-L40
10611095878898
110
1181089177788589
Compared to the formic acid gradient, the recovery of the HFIP gradient looks even
better, despite the deviant mechanisms of precipitation versus adsorption.
Precipitation of the polymer occurs at a concentration below 60% of each modifier.
With formic acid at the conditions used (65-95% formic acid in water) the oligomers
are retained on the column, while the polymer does not precipitate. In comparison,
during adsorption and separation with a HFIP gradient (40-85% HFIP), precipitation
of the polymer occurs. However, probably due to the good solubility of the higher
oligomers (L6-L50) in 40% HFIP the recovery with the HFIP gradient is at least as
good as with the formic acid gradient.
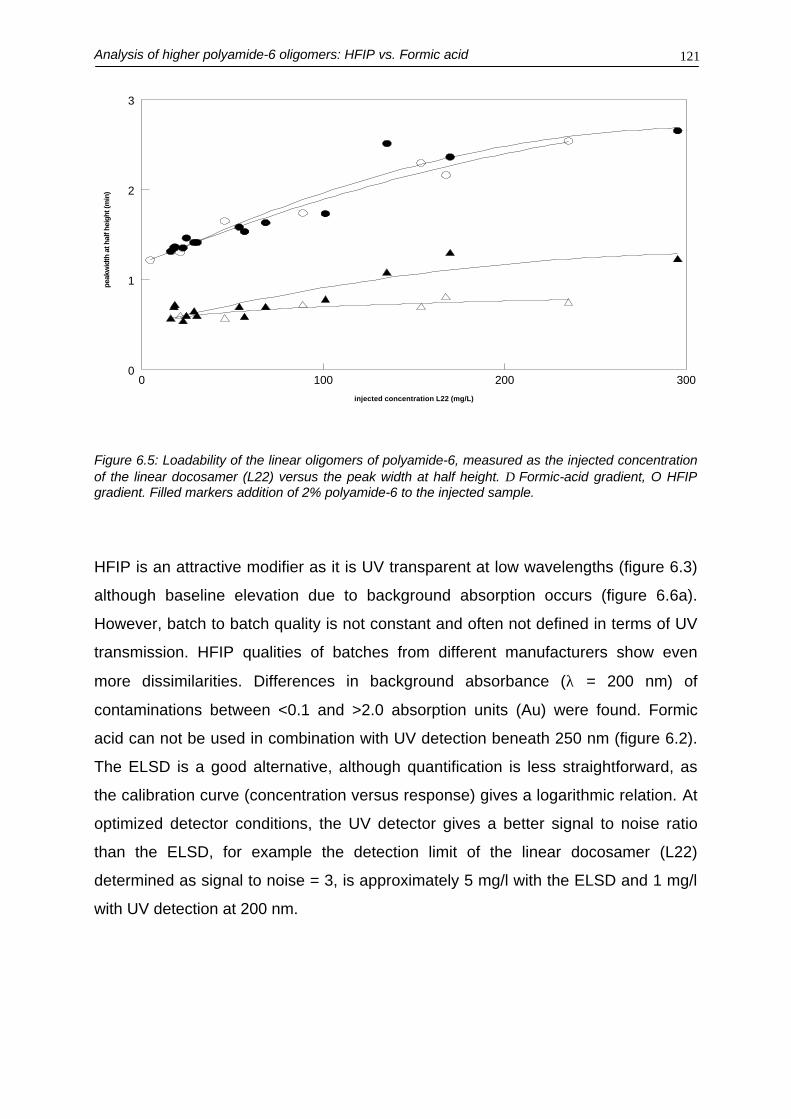
Analysis of higher polyamide-6 oligomers: HFIP vs. Formic acid 121
Figure 6.5: Loadability of the linear oligomers of polyamide-6, measured as the injected concentrationof the linear docosamer (L22) versus the peak width at half height. ∆ Formic-acid gradient, O HFIPgradient. Filled markers addition of 2% polyamide-6 to the injected sample.
HFIP is an attractive modifier as it is UV transparent at low wavelengths (figure 6.3)
although baseline elevation due to background absorption occurs (figure 6.6a).
However, batch to batch quality is not constant and often not defined in terms of UV
transmission. HFIP qualities of batches from different manufacturers show even
more dissimilarities. Differences in background absorbance (λ = 200 nm) of
contaminations between <0.1 and >2.0 absorption units (Au) were found. Formic
acid can not be used in combination with UV detection beneath 250 nm (figure 6.2).
The ELSD is a good alternative, although quantification is less straightforward, as
the calibration curve (concentration versus response) gives a logarithmic relation. At
optimized detector conditions, the UV detector gives a better signal to noise ratio
than the ELSD, for example the detection limit of the linear docosamer (L22)
determined as signal to noise = 3, is approximately 5 mg/l with the ELSD and 1 mg/l
with UV detection at 200 nm.
0 100 200 300
injected concentration L22 (mg/L)
0
1
2
3pe
akw
idth
at h
alf h
eigh
t (m
in)

Chapter 6122
Figure 6.6: Detectability of oligomers of polyamide-6. Chromatograms of a linear oligomers standard(500 mg/l in 65% formic acid / 35% water), (a) 5 µl injection with HFIP as the mobile phase, (b) 20 µl(upper trace) en 100 µl (lower trace) injection with formic acid as the mobile phase. (a) Gradientelution with 40 to 85% HFIP in 10 mM phosphoric acid in 240 min, column: 150*2.1 mm Zorbax300SB C18 at RT and UV detection at 200 nm and (b) gradient elution with 65 to 95% formic acid inwater in 240 min., column: 150*2.1 mm Zorbax 300SB C18 at RT and ELSD detection at 55oC.
However, the detectability of the oligomers during a formic acid gradient can be
improved as preconcentration of the sample on the top of the column is applicable,
since the formic acid concentration of the injected solution and the starting
conditions of the gradient are identical (figure 6.6b). An injection volume of 100 µl
appears optimal. At these volumes the system gets already overloaded when high
concentrations of oligomers / polymers are injected, resulting in a rapid decrease of
column performance.
Project: bcan_fcocb02Method: ymmz
Acquisition Time: 09 Mar 1999 at 14:17.33
Response(mV)
Time(minutes)
0
1
2
3
4
5
6
7
8
9
10
11
12
13
0 20 40 60 80 100 120 140 160 180 200 220
20ul : 500mg/L Linear oligomers
100ul : 500mg/L Linear oligomers
min0 25 50 75 100 125 150 175 200 225
mAU
0
2.5
5
7.5
10
12.5
15
17.5

Analysis of higher polyamide-6 oligomers: HFIP vs. Formic acid 123
To improve performance of the HFIP system, a ternary system could be suggested.
However, the usability of most common UV-transparent co-modifiers is questionable.
Acetonitrile is not miscible with most water-HFIP compositions, although all binary
combinations mix. Both methanol and ethanol forms azeotropes with HFIP-water,
making the distillation to recycle HFIP troublesome.
Another way to improve performance is the use of capillary zone electrophoreses
(CZE), which can be used to determine the linear oligomers selectively. At low pH
the electroosmotic flow is negligible and the linear polyamide molecules bear a
positive charge on the amine endgroup. Due to the difference in charge to mass
ratio, they can be separated (figure 6.7). HFIP and UV detection is an attractive
combination in CZE, as HFIP is UV transparent and CZE allows low modifier
consumption.
Figure 6.7: Capillary zone electrophoresis of a linear oligomeric standard, 1 mg/ml dissolved in buffer(HFIP / 25 mM H3PO4 (65%:35% v/v)). Applied voltage 15kV, capillary ltot = 60 cm, leff = 50cm, ID =50µm, fused silica (J&W Scientific). Hydrodynamic injection 0.1 min and 15 mbar.
6.4 Conclusions
High concentrations of formic acid can be used on C18-modified RP-columns.
Compared to expensive fluorinated alcohols, formic acid is an important alternative
to separate the higher oligomers of polyamide-6 as octadecyl-modified silica-based
columns are stable for at least 5000 column volumes at 65-95% formic acid in water.
Response(mAu)
Time(minutes)
0.2
0.4
0.6
0.8
1.0
1.2
0 10 20 30 40 50 60 70 80 90 100 110 120 130
L5

Chapter 6124
Selectivity is better with HFIP. Loadability is much better with formic acid. Band
spreading is worse with HFIP too. At the same concentration injected, the peaks with
the HFIP gradient are twice as broad as with the formic acid gradient.
As HFIP is a strong modifier, the oligomers elute at HFIP conditions where
precipitation of the polymer occurs. With formic acid as a modifier, the oligomers
elute and the polyamide-6 does not precipitate on the column. However, this does
not influences recovery of the linear oligomers from the linear hexamer (L6) up till
the linear tetracontamer (L40). HFIP does not absorb much UV energy at low
wavelengths, making UV detection at 200 nm feasible. To detect the oligoamides
with formic acid as the mobile phase, the less sensitive ELSD detector has to be
used. Fortunately, preconcentration, to improve detectability, is applicable here. Due
to the non-linear relation between concentration and response, calibration with the
ELSD is less straightforward.
It is shown that CZE in aqueous H3PO4 with HFIP using UV detection at 190 nm can
be an attractive alternative for the selective separation of the linear oligomers of
polyamide-6.
References
1. H.K. Reimschuessel, J. Pol. Sci: Macromol. Review 12(1977)65-1392. P.J. Wang, Chromatogr. Sci. Ser. 69(1995)161-1833. M.A. Dudley, J. Appl. Polym. Sci. 16(1972)493-5044. E. K. Walsh, J. Chromatogr. 55(1971)1935. G. Pastuska, U. Just, H. August, Angew. Makromol. Chem. 107(1982)173-1846. G. Pastuska, U. Just, Angew. Makromol. Chem. 81(1979)11-187. P.S. Ede, J. Chromatogr. Sci. 9(1971)275-2808. D. Petit, R. Jerome, Ph. Teyssie, J. Polym. Sci. Polym. Chem. Ed. 17(1979)2903-29169. T.H. Mourey, T.G. Bryan, J. Chromatogr. A 679(1994)201-20510. E.E. Drott, in J. Cazes (Editor), “Liquid Chromatography of polymers and related Materials
Chromatographic Science Series, Vol.8”, Marcel Dekker, New York, 1977, p41-5111. S. Mori, Y. Nishimura, J. Liq. Chromatogr. 16(1993)3359-337012. H. Schorn, R. Kosfeld, M. Hess, J. Chromatogr. 282(1983)579-58713. D.J. Goedhart, J.B. Hussem, B.P.M. Smeets, in J. Cazes, X. Delamare (Editor), “Liquid
Chromatography of polymers and related Materials II Chromatographic Science Series, Vol.13”,Marcel Dekker, New York, 1977, p203-213
14. A. Moroni, T. Havard, Polym. Mater. Sci. Eng. 77(1997)14-1615. C.Jackson, H. Barth, M.C. Han, Polym. Mater. Sci. Eng. 69(1996)270-27116. E. Robert, J. Fichter, N. Godin, Y. Boscher, Int. J. Polym. Anal. Char. 3(1997)351-35817. S.R. Samanta, J. Appl. Polym. Sci. 45(1992)1635-164018. C. Guaita, Makromol. Chem. 185(1984)459-46519. C. Guaita, Conv. Ital. Sci. Macromol. 5th (1981)295-29820. C.A. Veith, R.E. Cohen, Polymer 30(1989)942-948

Analysis of higher polyamide-6 oligomers: HFIP vs. Formic acid 125
21. P.J. Wang, R.J. Rivard, J. Liq. Chromatogr. 10(1987)3059-307122. M. Matzner, L.M. Robeson, R.J. Greff, J.E. McGrath, Angew. Makromol. Chem. 26(1972)137-15323. G. Costa, S. Russo, J. Macromol. Sci. Chem. Ed. A 18(1982)29924. F.P.B. van der Maeden, M.E.F. Biemond, P.C.G.M. Janssen, J. Chromatogr. 149(1978)539-55225. K.L.L. Eersels, G. Groeninckx, Y. Mengerink, Sj. van der Wal, Macromolecules 29(1996)6744-
6749, see also chapter 2.3.2.d of this thesis26. J.J. Burke, T.A. Orofino, J. Polym. Sci: part A2 7(1969)1-2527. M. Evstatiev, Plast. Eng. (N.Y.), Handbook of thermoplastics 41(1997)641-66328. l. Valentine, J. Polym. Sci. 23(1957)297-31429. J. Heukeshoven, R. Dernick, J. Chromatogr. 252(1982)241-25430. W.Th. Kok, U.A.Th. Brinkman, R.W. Frei, H.B. Hanekamp, F. Nooitgedacht, H. Poppe, J.
Chromatogr. 237(1982)357-36931. Y. Mengerink, R. Peters, M. Kerkhoff, J. Hellenbrand, H. Omloo, M. Vestjens, Sj. van der Wal, J.
Chromatogr. A 878(2000)45-55, chapter 4 of this thesis.

Chapter 6126

New stationary phases 127
Chapter 7New stationary phases with improved kinetic performance
for the separation of polyamide-6 oligomers
Summary
Three new stationary phases were tested for the separation of polyamide-6
oligomers/polymers in combination with 1,1,1,3,3,3-hexafluoro isopropanol (HFIP).
The phases were chosen as they could improve efficiency for higher-molecular-mass
components at higher flow rates. Non-porous silica (NPS) with a particle diameter of
1.5 µm, a monolith column and a pellicular column were tested. Both NPS and
monolith could be used at high flow rates to decrease separation time. The potential
of the pellicular column could not be investigated properly due to hardware problems.

Chapter 7128
7.1 Introduction
Polyamide-6 macromolecules have a molecular mass in the range of 10-100 kDalton.
A single backbone unit (6-aminocaproic acid with a loss of water due to the
condensation reaction) has a molecular mass contribution of 113 Dalton. The
endgroups can be determined using critical chromatography [1,2]. To determine the
molecular-mass distribution of these kinds of synthetic polymers, size-exclusion
chromatography (SEC) is often used [3]. To determine low-molecular-mass oligomers
(1-6 backbone units), the sandwich injection method was developed [4-6]. The
influence of the mobile phase solvents using octadecyl-modified porous-silica
particles on the separation of higher oligomers up to approximately 40-50 backbone
units were investigated earlier [7].
A separation (of polyamide oligomers) can be quantified using equation 7.1 [8]:
( )( )
( )1
1
4
2
21 +−
=+∆
=k
kNww
tR r
s αα
<7.1>
where Rs is the resolution, ∆tr the difference in retention time of component 1 and 2, w
is the peak width at 4σ of component 1 or 2, N is the number of theoretical plates, α is
the selectivity factor k2/k1 and k is the retention factor (see equation 2.1). The
retention factor k is optimal at approximately 2-10. However, the elution of
macromolecules is not straightforward during gradient elution. As described in chapter
2.3.2.d, their retention varies dramatically with the composition of the mobile phase.
Consequently the observed k-value during gradient elution changes very quickly from
very high to extremely low, i.e. the retention of the macromolecule changes from fully
retained to totally unretained. For this particular reason, high flow rates during
gradient elution are favorable. The selectivity α can be influenced by changing for
example the stationary or mobile phase. The efficiency of the system is determined by
measuring the number of theoretical plates N. This study focuses on the efficiency
factor N, which is defined as the square of the column length L divided by the
variance σ2 of the gaussian distribution of the molecules, i.e. the peak, as given in
equation 7.2 [9]:
New stationary phases 129
HLL
N ==2
2
σ <7.2>
where H is the Height of one Equivalent Theoretical Plate (HETP). The variance of the
peak is a measure for the peak broadening, which is generated by different sources.
Van Deemter introduced the concept to summate the peak-broadening effects from
different independent sources (A, B and C-term) [9,10].
A-term: Molecules do not use exactly the same path, when moving through a packed
column. Due to this convective dispersion, also known as Eddy diffusion or random
walk, peak broadening occurs. The velocity independent A-term equals λidp, where dp
is the particle diameter and λi is a factor describing the bed uniformity. Normally this
factor is approximately 1.5.
B-term: Due to diffusion, the initially narrow injected sample zone will be broadened.
As the diffusion decreases due to the presence of solid particles, the variance for a
packed bed is given as σD2 = 2Dt/γ, where σD
2 is the variance of the distribution, D is
the effective diffusion coefficient, t is the time and γ is the obstruction factor. This
factor is approximately 1-2 and describes the amount and nature of the obstruction of
the packing to diffusion.
C-term: The mobile phase inside the pores is stagnant and solute molecules will
diffuse into these pores. At high mobile-phase velocity the molecules in the pores will
move slower than the solute molecules, which did not diffused into the pores. This
peak-broadening effect is also known as the mass-transfer problem. Three stages of
the diffusion process can be distinguished. The molecule first needs to be transported
from the moving mobile phase to the surface of the particle. Thereafter it has to move
from the moving mobile phase to the stagnant mobile phase inside the pores and
finally it interacts with the stationary phase. The C-term is proportional to the diameter
of the particle and inversely proportional to the diffusion coefficient of the solute
molecule. Especially for macromolecules, which have low diffusion coefficients, mass
transfer can play an important roll with respect to column efficiency.
The HETP of a conventional packed bed of porous particles can be estimated using
an approximation of the Van Deemter equation, solely using the mass transfer in the

Chapter 7130
stagnant mobile phase, neglecting the retention effect and the mass transfer in the
stationary and mobile phase [9]:
uD
d
u
DdCu
uB
AHm
pmp 6
5.12
++=++= <7.3>
where A, B, C are the constants, dp is the particle diameter, Dm is the diffusion
coefficient and u is the linear velocity of the mobile phase through the column. Other
hydrodynamic models have been proposed also, to describe the HETP-curve [9,11].
In the low and high velocity range the Van Deemter equation does not provide the
most accurate fit. However, this is of minor importance for the illustration of the
molecular-mass dependency on the optimum flow conditions with respect to minimum
theoretical plate height and maximum number of theoretical plates.
The influence of the molecular mass on the HETP on porous particles is simulated in
figure 7.1.
Figure 7.1: Simulated Van Deemter plot, with porous particles of 5 µm particle diameter. Diffusioncoefficient in the mobile phase of molecules with molecular mass M = 100 D, (Dm = 1e-9 m2.s-1), 1 kD(DM = 0.75e-9 m2.s-1), M = 10 kD (DM = 0.375e-9 m2.s-1) and M = 100 kD (DM = 0.25e-9 m2.s-1).
Van Deemter equation for dp=5um (porous particles)
10
12
14
16
18
20
22
24
26
0.00 0.02 0.04 0.06 0.08 0.10linear velocity (cm/s)
HET
P (u
m)
M100
M1000
M10000
M100000

New stationary phases 131
Minimum plate height for higher-molecular-mass polymers can be found at low linear
velocities due to the mass-transfer phenomenon. However, the maximum number of
theoretical plates does not correspond with the optimum linear velocity and the
corresponding minimum plate height of figure 7.1. Bisecting the optimum linear
velocity does not result in a doubled HETP. This means that at lower flow rates, the
column length can be increased to maintain the same pressure drop. Consequently
the total number of plates increases. The maximum column length is related to the
maximum pressure and the linear velocity using equation 7.4 [9]:
u
dP
u
dP
F
rdPL p
i
pi
i
pi
φηηε
ε
ηε
πε 2max
2
22max
2
223max
max )1(180)1(180
∆=
−
∆=
−
∆= <7.4>
where Lmax is the maximum column length in cm at a certain pressure drop across the
column ∆P in Pa and the applied flow rate F (= uεiπr2) of the mobile phase in cm3/s. εi
is the interstitial porosity (which represents the part of the column which can be
occupied by the moving mobile phase), dp is the particle diameter in cm, r is the
column radius in cm, η is the viscosity of the mobile phase in Pa.s and φ is the column
resistance factor (= εi2/180(1-εi)
2).
According to Poppe [12,13] the ultimate plate height, which can be realized at a given
pressure, is determined by the particle size (dp) and diffusion coefficient of the
macromolecule in the mobile phase (Dm) as given in equation 7.5:
φηγ
2
maxmax 2p
m
d
DPN ∆= <7.5>
where Nmax is the maximum number of plates using particles with a diameter dp (in cm)
and applying the maximum pressure drop across the column ∆Pmax in Pa, γ is the
obstruction factor, Dm is the diffusion coefficient of the solute in cm2/s, η is the
viscosity of the mobile phase in Pa.s and φ is the column resistance factor, which
equals 400 for an interstitial porosity εi of 0.4 or 1000 for an interstitial porosity of 0.3.
Poppe simplified this equation for typical separation conditions (∆Pmax = 4.107 Pa, η

Chapter 7132
=0.01 Pa.s, εi = 0.4 and γ = 2) to Nmax = dp2/Dm, where dp is the particle diameter in µm
and Dm the diffusion coefficient in cm2/s [13].
Large numbers of plates can be generated for large molecules (i.e. low diffusion
coefficients) using large particle diameters at a given pressure, however the prize to
be paid is time. For instance, using 5 µm particles and a macromolecule with a
diffusion coefficient of 3.75e-6 cm2/s equation 7.5 gives 6.6e+6 plates. The t0 value
would be almost 300 years (log t0≈10 sec), the column length would be 5 km with a
flow rate of 0.3 nl/s using a 4 mm ID column. Obviously, nobody has proven these
values in practice (yet). As also shown by Poppe in the same articles, small particles
are needed to obtain a reasonable separation time [12,13]. Figure 7.2 demonstrates
the relation of the maximum number of theoretical plates and the corresponding t0-
values as a measure for the analysis time. Using practical to-values (t0<1000 sec→ log
t0<3 sec), smaller particles are to be preferred.
Figure 7.2: Influence of the maximum number of theoretical plates at a pressure drop ∆P = 400 Atm.with the corresponding t0-values for a macromolecule with M = 10 kD (DM = 0.375.5e-9 m2.s-1).
Today, a major part of liquid chromatographic science is devoted to the development
of new stationary phases [14]. Besides the suppression of unwanted silanol
interactions, the reduction of the mass-transfer problem is an important research field.
Maximum number of plates related to the dead-time
-2.00
0.00
2.00
4.00
6.00
8.00
10.00
-2.00 0.00 2.00 4.00 6.00 8.00 10.00 12.00 14.00 16.00 18.00 20.00
Log to(s)
log
Nm
ax a
t 400
Atm
dp=25umdp=10umdp=5umdp=2umdp=1um
New stationary phases 133
Here we will discuss some new stationary phases with improved kinetic performance,
which were recently introduced on the market:
1. Non-porous silica (NPS) particles
2. Monoliths
3. Pellicular particles
7.1.1 NPS (non-porous silica) column
Using NPS is the easiest way to eliminate the mass-transfer problem in the stagnant
mobile phase. Macromolecules cannot diffuse into the particle interior. In this type of
column there is no surface area inside the particle available, reducing the total
interaction area to a great extent. However, decreasing the particle diameter
increases the surface area moderately.
NPS columns have often been used for the separation of higher-molecular-mass
components [15-20]. Bullock compared the use of a column with non-porous particles
(30*4.6 mm Hytach C18 column based on 2 µm non-porous silica support) with a
perfusion column (30*4.6 mm Poros R/H column based on a macroporous perfusion
type support, pore size 800-1500 Å and 6000-8000 Å, dp not given) and a
conventional normal porous column (150*4.6 mm Capcell PAK C18 SG column based
on normal porous 120 Å silica support, dp not given) [21]. For the separation of higher-
molecular-mass oligomers the non-porous particles clearly provided the best
separation efficiency with respect to the total number of separated oligomers, while
the conventional porous particles gave the worst results. The results obtained with the
perfusion column were intermediate between both these columns.
7.1.2 Monolithic column
This is a new column design. Instead of a particle packed column, a continuous
skeleton is used (figure 7.3). This rod-like column can be prepared by the hydrolysis
and polycondensation of alkoxysilanes [22,23]. The main advantage of these types of

Chapter 7134
columns is the high porosity, so high flow rates can be used. This is due to the
existence of macro (2 µm) and meso (13 nm) pores in such columns.
Figure 7.3: Reprinted from http://www.chromatography.co.uk/TECHNIQS/HPLC/ref13.htm, with kindpermission of Merck KGgA.
In contrast to conventional packed-bed columns with 5 µm porous particles, column
efficiency did not decreased to the same extent at higher flow rates [23-25]. Tanaka
observed separation efficiencies for polypeptides for the monolithic columns,
comparable to 1.5-2.5 µm non-porous particles [26].

New stationary phases 135
7.1.3 Pellicular column
The idea to decrease the pore depth by using a porous layer on impenetrable cores
was described from a theoretical point of view by Golay and Purnell [27,28]. Kirkland
et al. used this concept already in 1969 for fast liquid chromatographic separations
[29-31]. Different nomenclatures were used for these types of columns, like CSP
(controlled surface porosity) support or PLB (porous layer beads). Recently, Kirkland
reintroduced this idea, by developing the so-called Poroshell column [32,33]. A
schematic representation of this material is given in figure 7.4.
Figure 7.4: Poroshell particle, reprinted from [33] with permission from Elsevier Science.
A real comparison between these three stationary phases is difficult to make. The
Poroshell was tested as a prototype. Besides that, the different octadecyl
modifications and the residual polar interactions will also have a major impact on peak
shapes of the linear polyamide chains. The intention of this study was to make a
preliminary investigation of the separation potential of the various columns with
respect to the higher polyamide oligomers. The columns were all tested using a high
flow rate, which was maximized with respect to backpressure.

Chapter 7136
7.2 Experimental
All experiments were performed using an HP 1090 DR5 solvent delivery system,
equipped with an autosampler with a 25 µl syringe, a column thermostatting unit and a
diode-array detector (DAD, primary wavelength λ = 195nm) and controlled by a
Windows 95 workstation LC-3D version A.08.01 (Agilent, Waldbronn, Germany).
Water (MilliQ, Millipore, Milford, MA, USA), 1,1,1,3,3,3-hexafluoro isopropanol (HFIP,
Biosolve, Valkenswaard, the Netherlands) and 10 mM phosphoric acid (made with
phosphoric acid 85% p.a., Baker, Deventer, The Netherlands) were used as mobile
phase constituents. The L45-fraction was obtained by a preparative isolation of a pure
linear polyamide-6 sample during a formic-acid gradient, conditions described in ref
[7]. The L45 fraction contains linear polyamide-6 chains, with approximately 45-50
backbone units: HOOC-C5H10-(NH-CO-C5H10-)n-NH2 (with n ≈ 45-50).
The chromatographic columns tested were from Agilent (Newport, Delaware, USA),
Eichrom Technologies (Darien, Illinois, USA) and Merck (Darmstadt, Germany) (see
table 7.1). The numbers of plates after the experiments were tested using different
chlorobenzenes [34].
Table 7.1: Overview of the columns tested.
ColumnTypeManufacturerCharacteristics
Porous 5µmZorbax SBC3Agilent
PellicularPoroshellAgilent
NPSMicra-ODS-1Eichrom
monolithChromolithMerck
Dimensions (mm*mm)Surface area (m2/g)Maximum back pressure (Atm)Surface coverage (%C)Density (g/ml)Bonded phase
EndcappedNumber of plates manufacturerNumber of plates afterexperiments
150*4.61804009.5
-(C3H7)3
No
75*2.14.5400
-C18
-(C3H7)2
No2500-6000*
4000
33*4.6<340062-C18
No110009000
100*4.630020017
-C18
Yes1100011000
* According to the plate height given in [33]

New stationary phases 137
7.3 Results and discussion
7.3.1 Porous 5 µµm particles
Porous-silica particles with a diameter of 5 µm are more or less standard nowadays.
They provide a good compromise between a high surface area and the obtained
backpressure. Figure 7.5a depicts a chromatogram of the preparatively isolated L45
fraction, which contained only linear polyamide-6 chains with approximately 45-50
backbone units.
Figure 7.5a: Chromatographic conditions: 150*2.1 mm Zorbax SB C3 80A (T = 55oC), flow rate 0.5ml/min dP = 250 Atm., mobile phase isocratic 57% HFIP in 10 mM H3PO4, injection 5 µl prep. isolatedfraction L45 in 40% HFIP.
By decreasing the flow rate, the mass-transfer term can be suppressed and these
higher-molecular-mass oligomers can be separated as shown in figure 7.5b.
Approximately 10 hours were needed to separate the involved synthetic
macromolecular fraction. Theoretically, this separation could be improved with respect
to resolution, by increasing the column length, however analysis times would increase
proportionally.
min2.5 5 7.5 10 12.5 15 17.5 20 22.5
mAU
-5
0
5
10
15
20
DAD1 A, Sig=200,4 Ref=225,10 (E:\Y9100443\T58C0014.D)

Chapter 7138
Figure 7.5b: Influence of the flow rate using a 150*2.1 mm Zorbax SB C3 80A (T = 55oC) column. Flowrate 0.5; 0.2; 0.1; 0.05 and 0.01 ml/min. Isocratic 57% HFIP in 10 mM H3PO4, injection: 5 µl prep.isolated fraction L45 in 40% HFIP.
7.3.2 NPS
The same sample (L45 fraction) could be separated within 10 minutes using 1.5 µm
ODS-1 non-porous silica (NPS) particles (figure 7.6).
Figure 7.6: 33*4.6 mm NPS column ODS-1 Micra (T = 55oC), flow rate 1.0 ml/min, dP = 250 Atm., 30%HFIP in 10 mM H3PO4, injection: 5 µl prep. isolated fraction L45 in 40% HFIP.
min0 100 200 300 400 500 600 700 800
mAU
0
10
DAD1 A, Sig=200,4 Ref=225,10 (E:\Y9100443\T58C0014.D)
min0 100 200 300 400 500 600 700 800
mAU
0
10
DAD1 A, Sig=200,4 Ref=225,10 (E:\Y9100443\T58C0010.D)
min0 100 200 300 400 500 600 700 800
mAU
05
1015
DAD1 A, Sig=200,4 Ref=225,10 (E:\Y9100443\T58C0012.D)
min0 100 200 300 400 500 600 700 800
mAU
0
10
20
DAD1 A, Sig=200,4 Ref=225,10 (E:\Y9100443\T58C0013.D)
min0 100 200 300 400 500 600 700 800
mAU
0
10
20
DAD1 A, Sig=200,4 Ref=225,10 (E:\Y9100443\T58CX016.D)
0.5 ml/min (see also figure 7.5a)
0.2 ml/min
0.1 ml/min
0.05 ml/min
0.01 ml/min
min2 4 6 8 10 12 14
mAU
0
5
10
15
20
25
30
35
DAD1 A, Sig=200,4 Ref=225,10 (E:\Y912164M\FL1PO000.D)
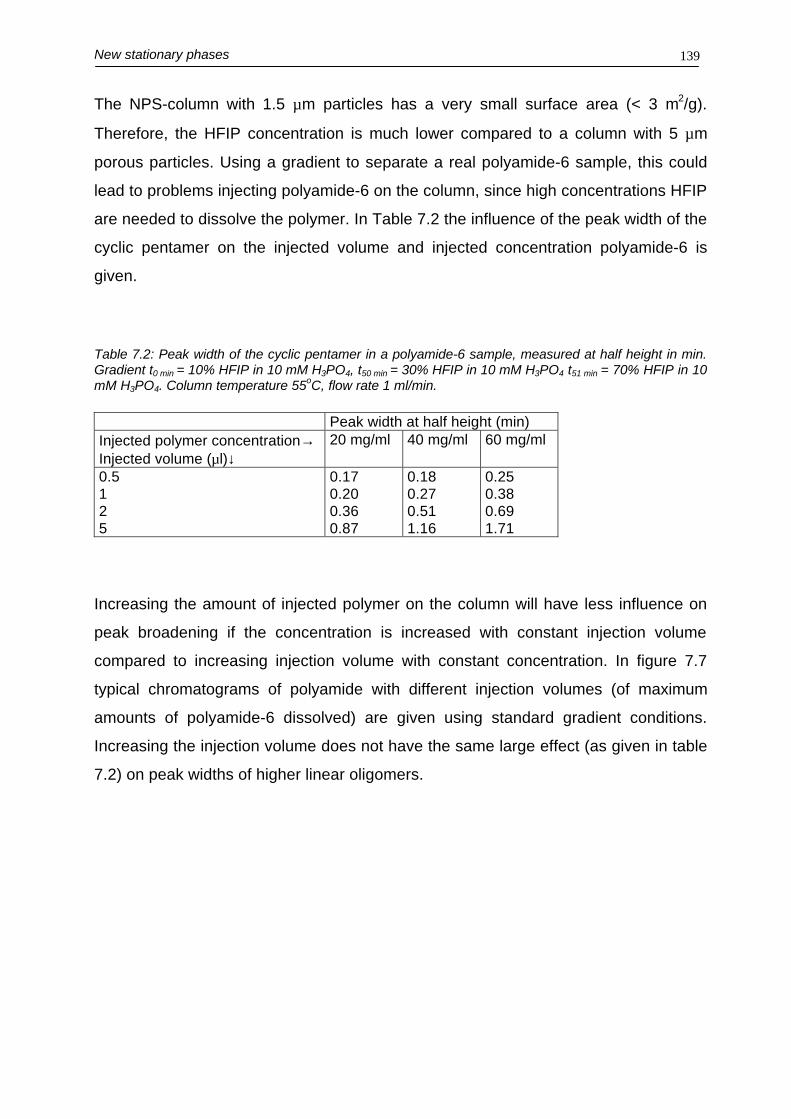
New stationary phases 139
The NPS-column with 1.5 µm particles has a very small surface area (< 3 m2/g).
Therefore, the HFIP concentration is much lower compared to a column with 5 µm
porous particles. Using a gradient to separate a real polyamide-6 sample, this could
lead to problems injecting polyamide-6 on the column, since high concentrations HFIP
are needed to dissolve the polymer. In Table 7.2 the influence of the peak width of the
cyclic pentamer on the injected volume and injected concentration polyamide-6 is
given.
Table 7.2: Peak width of the cyclic pentamer in a polyamide-6 sample, measured at half height in min.Gradient t0 min = 10% HFIP in 10 mM H3PO4, t50 min = 30% HFIP in 10 mM H3PO4 t51 min = 70% HFIP in 10mM H3PO4. Column temperature 55oC, flow rate 1 ml/min.
Peak width at half height (min)Injected polymer concentration→Injected volume (µl)↓
20 mg/ml 40 mg/ml 60 mg/ml
0.5125
0.170.200.360.87
0.180.270.511.16
0.250.380.691.71
Increasing the amount of injected polymer on the column will have less influence on
peak broadening if the concentration is increased with constant injection volume
compared to increasing injection volume with constant concentration. In figure 7.7
typical chromatograms of polyamide with different injection volumes (of maximum
amounts of polyamide-6 dissolved) are given using standard gradient conditions.
Increasing the injection volume does not have the same large effect (as given in table
7.2) on peak widths of higher linear oligomers.

Chapter 7140
1 µl injection
min50 100 150 200 250
mAU
-10
0
10
20
30
40
*DAD1 C, Sig=195,4 Ref=450,80 (F:\01MIQ05\Y105081M\010-0701.D) - DAD1 C, Sig=195,4 Ref=450,80 (F:\01MIQ05\Y105081M\007-
5 µl injection
min50 100 150 200 250
mAU
0
20
40
60
80
100
120
140
*DAD1 C, Sig=195,4 Ref=450,80 (F:\01MIQ05\Y105081M\010-0601.D) - DAD1 C, Sig=195,4 Ref=450,80 (F:\01MIQ05\Y105081M\007-
25 µl injection
min50 100 150 200 250
mAU
0
100
200
300
400
*DAD1 C, Sig=195,4 Ref=450,80 (F:\01MIQ05\Y105081M\010-0901.D) - DAD1 C, Sig=195,4 Ref=450,80 (F:\01MIQ05\Y105081M\007-
Fr L45 5 µl injection
min50 100 150 200 250
mAU
-10
-8
-6
-4
-2
0
2
4
6
8
*DAD1 C, Sig=195,4 Ref=450,80 (F:\01MIQ05\Y105081M\011-0902.D) - DAD1 C, Sig=195,4 Ref=450,80 (F:\01MIQ05\Y105081M\007-
Figure 7.7: NPS-Micra column (T = 60oC), flow rate 1 ml/min, 5→ 80% HFIP in 10mM H3PO4 in 240min. Blank subtracted, dPstart = 150 Atm., max. 300 Atm., sample: a mixture of low- and high-molecular-mass polyamide-6 (approx. 60 mg/ml) 1 µl injection.

New stationary phases 141
7.3.3 Monoliths
The separation of the L45-fraction on a monolith column is depicted in figure 7.8.
Figure 7.8: 100*4.6 mm Chromolith column (T = 35oC), flow rate = 1.75 ml/min, dP = 180 Atm., 56.5%HFIP in 10 mM H3PO4, injection 5 µl prep. isolated fraction L45 in 40% HFIP.
Different oligomers can be distinguished, however a complete baseline separation
could not be accomplished within 10 minutes. Typical separations of a polyamide-6
sample using standard gradient conditions are given in figure 7.9. Due to its high
surface area, larger volumes of polyamide-6 samples in HFIP can be injected and
higher percentages of HFIP are needed to elute the different polyamide-6
oligomers/polymer. Figure 7.10 depicts a typical chromatogram of a polyamide-6
sample with a modified gradient. Approximately 90-100 linear polymeric linear chains
could be separated on this column, which was not accomplished on any other system
used so far.
min2 4 6 8 10 12 14
mAU
0
2
4
6
8
DAD1 B, Sig=195,4 Ref=450,80 (Y101264M\L45FR017.D)

Chapter 7142
1 µl injection
min50 100 150 200 250
mAU
-10
-5
0
5
10
15
20
25
30
*DAD1 C, Sig=195,4 Ref=450,80 (F:\01MIQ05\Y105091C\010-0201.D) - DAD1 C, Sig=195,4 Ref=450,80 (F:\01MIQ05\Y105091C\007-
5 µl injection
min50 100 150 200 250
mAU
0
20
40
60
80
100
120
*DAD1 C, Sig=195,4 Ref=450,80 (F:\01MIQ05\Y105091C\010-0301.D) - DAD1 C, Sig=195,4 Ref=450,80 (F:\01MIQ05\Y105091C\007-
25 µl injection
min50 100 150 200 250
mAU
0
100
200
300
400
500
600
*DAD1 C, Sig=195,4 Ref=450,80 (F:\01MIQ05\Y105091C\010-0101.D) - DAD1 C, Sig=195,4 Ref=450,80 (F:\01MIQ05\Y105091C\007-
Fr L45
min50 100 150 200 250
mAU
-2
0
2
4
6
*DAD1 C, Sig=195,4 Ref=450,80 (F:\01MIQ05\Y105091C\011-0501.D) - DAD1 C, Sig=195,4 Ref=450,80 (F:\01MIQ05\Y105091C\007-
Figure 7.9: Chromolith column (T = 35oC), flow rate 1.75 ml/min, 5→ 80% HFIP in 10mM H3PO4 in 240min. Blank subtracted, ∆Pstart = 85 Atm, max. 185 Atm.
Figure 7.10: Gradient 20→ 80% HFIP in 10 mM H3PO4 in 240 min, 2 ml/min, dPstart = 120 Atm., max.200 Atm., 100*4.6 mm Chromolith column (T = 35oC).
min25 50 75 100 125 150 175 200 225
mAU
0
10
20
30
40
50
60
70
80
DAD1 B, Sig=195,4 Ref=450,80 (F:\00MIQ11\Y011274P\040-0101.D)
L30
L20
L10
L40 L5
0 L60
L70
L80 L90

New stationary phases 143
7.3.4 Poroshell
Some problems with the hardware of the column, probably related to the use of HFIP
made it impossible to investigate the performance of this column correctly. The main
problem was a continuous increase of the backpressure. After changing the guard
column the pressure dropped to the original values but started to increase
immediately again. This was not observed when systems without HFIP were used. As
a blocked column could be used in the opposite direction for a few runs, this problem
seems to be related to the inlet frits of the column. Figure 7.11 depicts the separation
of the L45 fraction. No baseline separation could be accomplished at the conditions
used. Typical separations of a polyamide-6 sample using standard gradient conditions
are given in figure 7.12.
5 µl injection
min0 2 4 6 8 10 12 14
mAU
-2.5
0
2.5
5
7.5
10
12.5
15
17.5
DAD1 F, Sig=195,4 Ref=450,80 (F:\01MIQ04\Y104091P\POROSH08.D)
1 µl injection
min0 2 4 6 8 10 12 14
mAU
0
1
2
3
4
5
DAD1 C, Sig=195,4 Ref=450,80 (Y105081P\FR900002.D)
Figure 7.11: Chromatographic conditions: 100*2.1 mm Poroshell 300 SB C18 80A (T = 80oC), flow rate1.5 ml/min, dP = 340 Atm., mobile phase isocratic 42.5% HFIP in 10 mM H3PO4, 5 µl injection of prep.isolated fraction L45 in 40% HFIP.

Chapter 7144
0.2 µl injection
min50 100 150 200 250
mAU
-2
0
2
4
6
8
10
*DAD1 C, Sig=195,4 Ref=450,80 (Y105081P\010-0501.D) - DAD1 C, Sig=195,4 Ref=450,80 (Y105081P\007-0401.D)
1 µl injection
min50 100 150 200 250
mAU
-10
0
10
20
30
40
*DAD1 C, Sig=195,4 Ref=450,80 (F:\01MIQ05\Y105091P\010-0201.D) - DAD1 C, Sig=195,4 Ref=450,80 (F:\01MIQ05\Y105091P\007-
5 µl injection
min50 100 150 200 250
mAU
0
20
40
60
80
100
120
140
*DAD1 C, Sig=195,4 Ref=450,80 (F:\01MIQ05\Y105091P\010-0301.D) - DAD1 C, Sig=195,4 Ref=450,80 (F:\01MIQ05\Y105091P\007-
25 µl injection
min50 100 150 200 250
mAU
0
100
200
300
400
*DAD1 C, Sig=195,4 Ref=450,80 (F:\01MIQ05\Y105091P\010-0501.D) - DAD1 C, Sig=195,4 Ref=450,80 (F:\01MIQ05\Y105091P\007-
Fraction L45 5 µl injection + 2 µl injection
min50 100 150 200 250
Norm.
-2
-1
0
1
2
3
4
5
6
*DAD1 C, Sig=195,4 Ref=450,80 (F:\01MIQ05\Y105091P\011-0601.D) - DAD1 C, Sig=195,4 Ref=450,80 (F:\01MIQ05\Y105091P\007-
min50 100 150 200 250
mAU
-2
-1
0
1
2
3
*DAD1 C, Sig=195,4 Ref=450,80 (Y105081P\011-0301.D) - DAD1 C, Sig=195,4 Ref=450,80 (Y105081P\007-0401.D)
Figure 7.12: Poroshell column (T = 80oC), flow rate 1 ml/min, 5→ 80% HFIP in 10mM H3PO4 in 240min.Blank subtracted, dP = not identical during different gradient runs.

New stationary phases 145
7.4 Conclusion
The NPS column and the monolith column have the potential to increase the
separation power of high-molecular-mass polyamide-6, due to their improved kinetic
performance. Both columns can be used at high flow rates to decrease separation
time. The potential of the Poroshell column could not be investigated properly due to
hardware problems.
Acknowledgments
I would like to thanks Dr. J.J. Kirkland, for giving me the opportunity to test a poroshell
prototype column.
References
1. Y. Mengerink, R. Peters, C.G. de Koster, Sj. van der Wal, H.A. Claessens, C.A. Cramers, J.Chromatogr. A 914(2001)131-145, chapter 8 of this thesis
2. Y. Mengerink, R. Peters, Sj. van der Wal, H.A. Claessens, C.A. Cramers, J. Chromatogr.submitted, chapter 9 of this thesis
3. S. Mori, Y. Nishimura, J. Liq. Chromatogr. 16(1993)3359-33704. Y. Mengerink, R. Peters, M. Kerkhoff, J. Hellenbrand, H. Omloo, J. Andrien, M. Vestjens, Sj. van
der Wal, J Chromatogr. 876(2000)37-50, chapter 3 of this thesis5. Y. Mengerink, R. Peters, M. Kerkhoff, J. Hellenbrand, H. Omloo, J. Andrien, M. Vestjens, Sj. van
der Wal, J. Chromatogr. 878(2000)45-55, chapter 4 of this thesis6. Y. Mengerink, R. Peters, Sj. van der Wal, H.A. Claessens, C.A. Cramers, J. Chromatogr. accepted,
chapter 5 of this thesis7. Y. Mengerink, Sj. van der Wal, H.A. Claessens, C.A. Cramers, J. Chromatogr. A 871(2000)259-
268, chapter 6 of this thesis8. J.J. Kirkland, “Modern practice of liquid chromatography”, Wiley, New York, 19719. U.D. Neue, “HPLC columns”, Wiley, New York, 199710. J.J. van Deemter, F.J. Zuiderweg, A. Klinkenberg, Chem. Eng. Sci. 5(1956)27111. Y.J. Yang, M.L. Lee, J. Micro. Sep. 11(1999)131-14012. H. Poppe, J. Chromatogr. A 778(1997)3-2113. H. Poppe, J.C. Kraak, GIT-lab. J. 4(1998)261-26314. R.E. Majors, LC-GC Europe 14(2001)284-30115. T. Issaeva, A. Kourganov, K. Unger, J. Chromatogr. A 846(1999)13-2316. N. Nimura, H. Itoh, T. Kinoshita, N. Nagae, M. Nomura, J. Chromatogr. 585(1991)207-21117. F. Honda, H. Honda, M. Koishi, J. Chromatogr. 609(1992)49-5918. J.E. Macnair, G.J. Opiteck, J.W. Jorgenson, M.A. Mosely III, Rapid Comm. MS 11(1997)1279-128519. C.G. Huber, P.J. Oefner, G.K. Bonn, Chromatographia 37(1993)653-65820. K. Rissler, J. Chromatogr. A 871(2000)243-35821. J. Bullock, J. Chromatogr. A 694(1995)415-42322. K. Cabrera, G. Wieland D. Lubda, K. Nakanishi, N. Soga, H. Minakuchi, K.K. Unger, TrAC
17(1998)50-53

Chapter 7146
23. N. Ishizuka, H. Minakuchi, K. Nakanishi, N. Soga, N. Tanaka, J. Chromatogr. A 797(1998)133-13724. B. Bidlingmaier, K.K. Unger, N. van Doehren, J. Chromatogr. A, 832(1999)11-1625. H. Minakuchi, K. Nakanishi, N. Soga, N. Ishizuka, N. Tanaka, J. Chromatogr A 762(1997)135-14626. H. Minakuchi, N. Ishizuka, K. Nakanishi, N. Soga, N. Tanaka, J. Chromatogr A 828(1998)83-9027. M.J.E. Golay, in R.P.W. Scott(editor), “Gas Chromatography, 1960”, Butterworths, London, from
ref [8]28. J. Bohemen, J.H. Purme, J. Chem. Soc. (1961) from ref [8]29. J.J. Kirkland, J.J. DeStefano, J. Chromatogr. Sci. 8(1970)309-31430. J.J. Kirkland, J. Chromatogr. Sci. 7(1969)7-1231. J.J. Kirkland, J. Chromatogr. Sci. 7(1969)361-36532. J.J. Kirkland, F.A. Truskowski, C.H. Dilks, G.S. Engel, “Superficially-porous silica microspheres for
fast HPLC of macromolecules”, L / 072 HPLC ’99 Granada, 199933. J.J. Kirkland, F.A. Truskowski, C.H. Dilks, G.S. Engel, J. Chromatogr. A 890(2000)3-1334. W. Th. Kok, U.A.Th. Brinkman, R.W. Frei, H.B. Hanekamp, F. Nooitgedacht, H. Poppe, J.
Chromatogr. 237(1982)357-369

Critical separation of polyamide-6 147
Chapter 8Separation and quantification of the linear and cyclic
structures of polyamide-6 at the critical point of adsorption
Summary
The linear and cyclic structures of polyamide-6 were separated by liquid
chromatography at the critical conditions (LCCC) and identified with different mass
spectrometric (MS) techniques and quantified by LCCC with evaporative light-
scattering detection (ELSD). Electrospray ionization MS (ESI-MS) was not suitable
to identify the higher cyclic structures. For this purpose, matrix-assisted laser
desorption ionization time-of-flight mass spectrometry (MALDI-TOF-MS) performed
better and cyclic and linear structures were oligomerically resolved and separately
identified in the mass spectrometer. The highest cyclic structure present and
detected was the cyclic pentacontamer. It could be demonstrated that cyclic and
linear oligomers follow different ionization and fragmentation routes / patterns.
Quantification with the ELSD of the components separated by LCCC using a
universal calibration curve or an iterative procedure was developed. An area-
correction to account for different peak widths of coeluting components improves
precision of the calibration curve and improves precision and accuracy of the
samples analyzed. With these corrected values, no molecular-mass dependency
was observed for the cyclic and linear structures. Under critical conditions the linear
and cyclic structures of polyamide-6 were separated, identified and quantified.
Y. Mengerink, R. Peters, C.G. de Koster, Sj. van der Wal, H.A. Claessens and C.A. Cramers, J.Chromatogr A 914(2000)131-145

Chapter 8148
8.1 Introduction
Polyamide-6 is a nylon, based on the monomer caprolactam, which is capable of
polymerizing by ring opening at elevated temperatures. Cyclic structures of
polyamides can be generated due to intramolecular condensation or to backbiting
mechanisms (figure 8.1) [1].
.
C N H
O
C
O
H N
+H O OC
HN
N H 2
O
H OO C N HN H
N HN H 2
O
O
O
NH
HN
NH
O
NH
O
O O
Figure 8.1: Creation of cyclic structures from the linear tetramer. a) Formation of cyclic dimer due tobackbiting and b) formation of cyclic tetramer due to intramolecular condensation.
Theoretically, an indication of the amount of cyclic structures in a linear
homopolymer can be calculated by comparing the number average molecular mass
(Mn), obtained e.g. by size-exclusion chromatography [2] with titration for specific

Critical separation of polyamide-6 149
endgroup determination [3] or with nuclear magnetic resonance [3,4] for endgroup
versus number of backbone units, using equation 8.1:
∑ ∑
∑
∑∑
∑
∑ ∑
∑ ∑∞
=
∞
=
∞
=∞
=
∞
=
∞
=∞
=
∞
=
∞
=
∞
=−
+=
++
+=
1 1
1
11
1
1 1
1 1 **
i iiLiC
iLi
iCiCi
iLiLi
iLi
i iiLiC
i iiCiCiLiL
n
nn
n
MnMn
n
nn
MnMnEM <8.1>
where Mn is the number average molecular mass in g.mol-1, E is the concentration of
a particular endgroup (acid or amine) in eq.g-1, n is the number of linear (L) or cyclic
(C) molecules with i backbone units and M is the molecular mass of a linear (L) or
cyclic (C) molecule with i backbone units. However, in practice this method is not
used as it is indirect, only applicable for very well defined homopolymers and only an
average number is obtained which does not open the possibility to determine the
distributions of the different series. Another technique, with the potential to identify
all molecules is MALDI-TOF-MS, however direct quantification of polymer species
from MS-spectra is questionable [5,6] and the assessment, whether cyclic structures
are present or not, could be complicated by the formation of [linear-H2O] ions by
post-ionization decay of linear oligomers in the ion source of the mass spectrometer.
It has been shown that upon MALDI of hyperbranched polyesteramides a substantial
in-source metastable decay of the protonated molecules occurs. This in-source
decay led initially to the conclusion that a substantial part consisted of cyclic
oligomers [7].
In 1986 Entelis et al. demonstrated liquid chromatography at the critical conditions
LCCC [8]. In the size-exclusion mode the higher-molecular-mass polymer is
excluded from the pores and will therefore elute before the lower-molecular-mass
polymer (see figure 8.2, left curve). However, at adsorption conditions, the higher-
molecular-mass polymer will elute after the lower-molecular-mass polymer, because
the high-molecular-mass polymer contains more backbone units, which can interact
with the stationary phase (figure 8.2 right curve). Under certain conditions, which are
critical with respect to temperature and mobile phase composition, both effects
compensate each other and retention becomes independent of the molecular mass
and is solely governed by endgroup functionality (figure 8.2, middle curve).

Chapter 8150
Figure 8.2: The three modes of chromatography. a) Size exclusion (s), where higher-molecular-masspolymer will give decreased elution times, b) adsorption (l), where the higher-molecular-masspolymer will give increased elution times and c) critical conditions (�), where retention is independentof the molecular mass.
A number of papers have been published to demonstrate the use [9-17] and
problems [18,19] of this technique. As given in chapter 2.3.3.a, the critical conditions
of linear structures are not exactly the same as for cyclic structures [8], but the
feasibility to separate these kinds of macromolecules independent of their molecular
mass has been demonstrated for polyethers [8,20-22] and polyesters [23,24]. Since
standards of higher cyclic oligomers of polyamide-6 are not available to characterize
the peak, identification of this group of components is necessary. Due to its
simplicity, on-line LC-ESI-MS is the first choice to verify if a particular group of
components is cyclic. However, due to its inherent higher mass range and ability to
generate singly charged ions, MALDI-TOF could be used to characterize higher
oligomeric and polymeric structures [25,26]. Some experimental set-ups
demonstrated the possibility of on-line coupling of an MALDI-TOF-MS with an LC
system [27-29]. However, in practice MALDI-TOF-MS is usually coupled off-line to
critical systems [21].
Although ESI-MS and MALDI-TOF-MS are very suitable for identification purposes,
they are unsuitable for quantitative analyses in critical chromatography. If UV
detection can be used, this is of course the method of choice, as often the
contribution of a monomeric unit can be used to calculate the weight percentages of
the different functional polymers [30]. However, if no chromophores are available or
2.00
2.50
3.00
3.50
4.00
4.50
5.00
0.00 1.00 2.00 3.00 4.00 5.00Rt
Log M
adsortion
critical
size exclusion

Critical separation of polyamide-6 151
if background absorption is too high, the evaporative light-scattering detector (ELSD)
can be used instead, although its non-linear behavior gives some bias.
Quantification after a critical separation is not straightforward. Especially for
coeluting low-molecular-mass molecules within a particular series, but also for
different separated series, as all available molecules could give different response
factors. Quantification methods are often not given in literature and the problem
described above is usually ignored [20,23,31,32]. Pasch et al. compared refractive
index detection after a critical separation with the summed amount measured with
supercritical fluid chromatography and found good quantitative correlations between
the different techniques [21]. However, this is not in agreement with the molecular-
mass dependence of response, as given by the same author [21]. Besides, the
refractive index detector is not very sensitive and suffers from baseline disturbances
in the elution window of the critical separation [21]. For some examples, Pasch et al.
also mentioned the best, but most tedious way to calibrate: preparative isolation of
the separated peaks to use them as standards [21]. This time consuming procedure
can only be used when the recovery of the work-up procedure is investigated. For
another sample, the distribution of the particular series should be investigated or
another preparative isolation should be performed.
Here we demonstrate the potential power of LCCC for the separation of linear and
cyclic structures of polyamide-6 (figure 8.1). Furthermore we discuss the use of
different MS techniques for identification purposes and develop a method to use an
ELSD for quantification.
8.2 Theory
One of the major drawbacks of the ELSD is its non-linear behavior. An exponential
calibration curve as given in equation 8.2 is often used:
1*'0AinjmAArea = <8.2>
where the area is correlated to the injected mass with the constants A'0 and A1.

Chapter 8152
If the response of different compounds (for example the linear versus cyclic
structures) is similar and the peak widths are uniform, equation 8.2 can be used for a
universal calibration. However, due to differences in peak widths at optimum
separation conditions a correction should be made to increase accuracy.
Fundamentally, the response equation should be written as:
1)(*)( 0AtcAtresponse = <8.3>
where response(t) and c(t) are the detector response and the concentration of the
solute at time t. For a gaussian peak, the concentration at time t is given as [33]:
2
2
2
)(
**2
)( σ
σπ
rttinj e
F
mtc
−−
∗= <8.4>
where c(t) is the concentration at time t, minj is the injected mass, F is the flow rate, tr
and σ are the retention time and the standard deviation of the peak. To obtain the
area of a peak, the response c(t) must be integrated over the time (zero to infinity)
and in combining with equations 8.3 and 8.4 this yields [34]:
( ) ( )
−−
−∞
∗= rr
A
injo t
Aerf
At
Aerf
AF
mAArea 0
2222*2 21
12
1
1
21
σσπ
σπσ
σπ <8.5>
This equation can be simplified dramatically and it can be easily deducted that:
( )
( )1
1
1
*2*
*2 1
1
AinjA
A
o mFA
AAreaπ
σπ −
= <8.6>
Equation 8.6 gives the peak-width dependence of the area-injected mass correlation.
It can also be seen that the power-constant A1 used in equation 8.2 and 8.3 is the
same. However, A'0 of equation 8.2 is not equal to A0 in equation 8.3. Their
correlation is given by [35]:

Critical separation of polyamide-6 153
( )
( ) 1
1
2**
2 1
1
'0 A
A
oFA
AAπ
σπ −
= <8.7>
In practice two peaks can be compared, or the area of multiple peaks can be
converted to normalized peak areas with a standard deviation of for example unity.
To correct for peak-width dissimilarities, the area of a peak should be corrected to a
normalized area with a standard peak width. Combining equation 8.2 and 8.6 can
perform this correction:
( )11
)()(A
b
abAreaaArea−
=
σσ
<8.8>
where area(a) is the normalized area(b), σa is the standard deviation of the
normalized peak, which can be set arbitrarily, σb is the standard deviation of the
peak which has to be normalized and A1 is the constant of the calibration curve (see
equation 8.2 and 8.3).
8.3 Experimental
All experiments were performed on a HP1100 quartenary pump, including a
degasser and a control module (Agilent, Waldbronn, Germany). The mobile phase,
formic acid and 1-propanol (81.6% / 18.4% w/w), was premixed and pumped with a
flow rate of 0.65 ml/min. Two 200*4 mm Nucleosil 50-5 (Machery-Nagel, Düren,
Germany) columns were used to perform the critical separation.
The endurance autosampler (Spark, Emmen, Netherlands), were the injector
(Rheodyne, Cotati, CA, USA), equipped with a 55 µl loop, was mounted inside the
column oven at 38oC (Mistral, Spark). Approximately 6 m of 0.25 mm I.D. capillary
was used in this oven to thermostat the mobile phase before it reached the injector.
Detection with the SEDEX 55 ELSD (Sedere, Vitry / Seine, France) was performed
with an optimized drift tube temperature of 550C and 1.9 Atm. air pressure. The
detector signal, areas and peak width were all collected with an X-Chrom/Windows

Chapter 8154
NT 3.51 version 2.11b data management system (LAB-systems, Manchester, U.K.).
Data calculations were performed in a spreadsheet program (EXCEL 97, Microsoft,
Seattle, USA). Default values of the "SOLVER" (Excel97 subroutine), to solve
problems iteratively, are max time: 100 s; iterations: 100; precision: 0.000001;
tolerance: 5%; convergence: 0.001%; estimates: tangent; derivatives: forward;
search: Newton.
LC-ESI(+)MS was performed on a HP1100 quaternary pump, including a degasser
and a Chemstation (A.06.03) (Agilent); m/z range 100-1500 Dalton (step: 0.1, data
storage: full), fragmentor = 100 V, Vcap = 3 kV, drying gas 10.0 l.min-1 N2, nebulisation
pressure 50 psig.
MALDI-TOF mass spectrometry was carried out using a Perkin-Elmer / Perseptive
Biosystems Voyager-DE-RP MALDI-TOF mass spectrometer [PerSeptive Biosytems,
Framingham, MA, USA] equipped with delayed extraction [36]. A 337nm UV-Nitrogen
laser producing 3 ns pulses was used and the mass spectra were obtained in the
linear and reflectron mode. Samples were prepared by mixing 10 µL of 1,1,1,3,3,3-
hexafluoro isopropanol (HFIP) solution of the polyamide fractions with 30 µL of a
solution of 3 mg/l 2,5-dithranol in HFIP. 1 µL of that solution was loaded on the gold-
sample plate. The solvent was removed in warm air.
All oligomers and polyamides used were synthesized at DSM, except PA-6 16 kD,
PA-6 24 kD and PA-6 35 kD, which where purchased from Polysciences Inc.
(Warrington, PA, USA). The linear oligomers are abbreviated by Ln, the cyclic
oligomers by Cn, where n is the number of (COC5H10NH)-units (figure 8.1). All
samples were dissolved in the mobile phase. The dissolution of the polyamides was
performed in a Bransonic ultrasonic cleaner model 5210 (Danbury, CT, USA).
8.4 Results and discussion
8.4.1 Separations at critical conditions
Critical conditions are often not easy to find. The availability of well-defined polymers
having different molecular masses will simplify this task. Although laboratory-made

Critical separation of polyamide-6 155
linear oligomers and polymers of 6-aminocaproic acid are available at all kinds of
different molecular masses, their cyclic forms are only available at low molecular
masses (n = 1-10). With the use of a low- and a high-molecular-mass linear polymer,
conditions have to be found where both samples coelute. If the higher-molecular-
mass sample elutes before the lower-molecular-mass sample (i.e. the SEC mode)
the strong solvent concentration should be decreased. If the retention times match
each other quit good, temperature can be used for fine-tuning. Again, in the SEC-
mode, temperature should be decreased to approach the critical conditions. As true
critical conditions are hard to obtain it is advisable to work at very slight exclusion
conditions for the linear chains, as this will enhance recovery and increases
selectivity (see also chapter 2.3.3.a). A representative chromatogram is given in
figure 8.3. Analysis: y90305cr,49,1 Project: dummy Instrument: chan399 Method: pa6criti
Standard 1
Acquisition Time: 29 Mar 1999 at 08:46.17
Response(mV)
Time(minutes)
500
502
504
506
508
510
512
514
516
518
520
522
524
526
528
530
532
534
536
0 0.5 1 1.5 2 2.5 3 3.5 4 4.5 5 5.5 6 6.5 7 7.5 8 8.5
Linear
Cyclic
Figure 8.3: Chromatography under near critical conditions: Mobile phase: 0.65 ml.min-1 of 81.6%formic acid in 1-propanol (w/w). Endgroup functional separation on 2*(200*4 mm) Nucleosil 50-5 at38oC, 55 µl injected of a PA-6 sample dissolved in mobile phase. Detector: ELSD, 55oC 1.9 Atm.nebulisation air pressure (total permeation volume was 3.9 ml).

Chapter 8156
The chosen conditions are based on a normal-phase system, with formic acid as a
good solvent for polyamide-6. 1-Propanol was used as a relative non-polar non-
solvent. With the available lower cyclic components, the second peak was identified
as cyclic polyamide-6 components. However, higher cyclic structures where not
available, making selective MS identification of the second peak necessary to
demonstrate true critical conditions for all cyclic structures.
8.4.2. Identification by electrospray ionization mass spectrometry (ESI-MS)
With an on-line coupled LC-ESI-MS the low-molecular-mass cyclic structures (n<11)
could easily be identified. Figure 8.4 depicts the deviating elution behavior of the
cyclic monomer, which can be explained by its high dipole moment [37,38].
m in2 4 6 8 10 12
Cy c lic m o n o m e r C 1 ; [ M H ]+ =114
m in2 4 6 8 10 12
Cy c lic dim e r C 2 ; [ M H ]+ =227
m in2 4 6 8 10 12
Cy c lic trim e r C 3 ; [ M H ]+ =340
m in2 4 6 8 10 12
Cy c l ic tet ramer C 4 ; [ M H ]+ =453
m in2 4 6 8 10 12
Cy c l ic pentamer C 5 ; [ M H ]+ =566
Figure 8.4: Chromatography under critical conditions: Mobile phase: 0.65ml.min-1 of 81.6% formic acidin 1-propanol (w/w). Endgroup functional separation on 2*(200*4 mm) Nucleosil 50-5 at 38oC, 1 µlinjected of different cyclic pa-6 oligomers (approx. 0.1 mg/ml), dissolved in mobile phase. Detector:ESI(+)MS.
In figure 8.5a the ESI-MS spectrum of the second (cyclic) peak is given. However,
mass resolving power problems arise for higher-molecular-mass structures, as can
be seen in the MS-spectrum of the first (linear) peak (figure 8.5b).

Critical separation of polyamide-6 157
m/z500 1000
Abundance
453.5 566.7
114.3
340 .5 679.8 510.1
397.0
792.8 623.3
227.4
906.0
m/z500 1000
Ab
un
dan
ce
114.3
564.5
228.4
341.5
Figure 8.5: LC-ESI-MS spectra of the cyclic (left,a) and linear (right,b) structures.
Electrospray ionization of polyamides generates multiply charged molecules with a
broad charge distribution. The maximum of the charge distribution of such a
molecule depends on the number of basic sites for protonation and for example a
500-mer may have a distribution with a range from one up to five-hundred positive
charges. A 500-mer with five-hundred charges will yield a nominal-mass peak at m/z
114 in the mass spectrum. This nominal peak has to be convoluted with the natural
isotope distribution of a 500 fold protonated 500-mer [39-41]. As high-molecular-
mass components can only be characterized by multiply charged ions, it can be
anticipated that deconvolution is almost impossible for broadly distributed polymers
in the same mass range. At the higher range of the molecular-mass distribution of a
representative polyamide, the molecular-mass distribution of a single linear 500-mer
molecule (containing 3000 carbon atoms) is, due to the C13-contribution, already
very broad (figure 8.6).
Figure 8.6: Distribution of molecular mass of a molecule containing 3000 C12-atoms. (M = 12000).
M o l e c u l a r M a s s D i s t r i b u t i o n o f C 3 0 0 0
0 .0000
0 .0100
0 .0200
0 .0300
0 .0400
0 .0500
0 .0600
0 .0700
0 .0800
M M + 2 M + 4 M + 6 M + 8 M + 1 0 M + 1 2 M + 1 4 M + 1 6 M + 1 8 M + 2 0 M + 2 2 M + 2 4 M + 2 6 M + 2 8 M + 3 0 M + 3 2 M + 3 4 M + 3 6 M + 3 8 M + 4 0 M + 4 2 M + 4 4 M + 4 6 M + 4 8
Chapter 8158
If this molecule contains 500 protons [MH500]500+ it will give a signal not only at
[(M+500)/500] and the corresponding C13-isotopes, but also at all decimal masses in
between. In the m/z-range of 500-1000 and z = 56-113 this molecule with the mean
mass of 56580 g.mol-1 will already give approximately 1500 different abundances in
the mass spectrum. In conclusion, multiply charging leads to a molecular mass
distribution which is convoluted by numerous charge distributions and isotope
distribution. Thus, peaks at almost every m/z value of the mass spectrum are
obtained. As can be seen in figure 8.5b an understandable but unreadable spectrum
appears.
8.4.3 Identification by matrix-assisted laser desorption ionization time-of-flight
mass spectrometry (MALDI-TOF-MS)
For the identification of higher-molecular-mass polyamides MALDI-TOF-MS is more
suitable than ESI-MS. Generally MALDI produces singly charged oligomers /
polymer and as a result the molecular-mass distribution is not convoluted by a
charge distribution leading to mass resolving resolution problems as observed in the
ESI spectra (see above). Moreover, the TOF mass analyzer allows detection of high-
molecular-mass singly charged oligomer species. Improvements in matrix and sample
preparation strategies have extended the molecular mass range for analysis of synthetic
polymers by MALDI up to 1.5 million Dalton [42].
With preparative LCCC the two peaks of figure 8.3 were fractionated. The purity of
the collected fractions was determined by gradient elution liquid chromatography
[43,44]. No cross-contamination of the linear and cyclic components was observed.
The collected fractions were analyzed with MALDI-TOF-MS. In figure 8.7 the MALDI-
MS spectrum (linear mode) of the second cyclic peak is given. The corresponding
spectra of fractions of the first peak showed a small mass dependence, indication
near critical conditions (data not shown here). It can also be concluded that the
MALDI efficiency of a single protonated cyclic molecule is much higher than the ESI.

Critical separation of polyamide-6 159
Figure 8.7: MALDI-MS spectrum (linear mode) of the second peak (cyclic structures).
A series of structurally related homologous oligomers could be discerned on the
basis of the MALDI-TOF-MS spectrum. The strategy used for the identification of the
protonated / cationized oligomers and for determination of the chemical composition
of the individual oligomers by extrapolation to zero oligomers has been discussed
elsewhere [45,46]. This strategy has been applied in this study without any
modification. One series of pseudomolecular ions in the spectrum of the first peak in
the chromatogram with a mass increment of 113 confirms the caprolactam repeating
unit. Extrapolation to zero monomers gives a residual mass of 19. This residual
mass is the summation of the end-group mass and the mass of the ionizing species.
The end-group and ionizing species for this series of homologous oligomers are a
hydroxy group connected to the carbonyl function as a carboxylic acid, a hydrogen
atom connected to the amine (-OH and –H is 18 Daltons) and a proton, respectively.
The spectrum is characteristic for PA-6 linear oligomers. Analogous results are
obtained for the oligomer distribution of the second peak (depicted in figure 8.7). In
this case, extrapolation to zero oligomers leads to the identification of protonated
oligomers with a zero end-group mass, i.e. protonated cyclic oligomers.
To investigate the spectra of the two series of oligomeric peaks in more detail,
MALDI in the reflectron mode was used to study the linear (figure 8.8a) and cyclic
nonamer (figure 8.8b).

Chapter 8160
A B
Figure 8.8: MALDI-MS spectrum (reflection mode) of the first peak (A (left): focussed on the linearlinear nonamer) and the second peak (B (right): focussed on the cyclic nonamer).
Mass analysis in reflectron mode was carried out to obtain spectra with sufficient
resolution to resolve the individual 13C isotopes. The dominant mode of ionization of
the polyamide oligomers under the experimental conditions applied is metal ion
attachment. Sodium cationization of the linear nonamer leads to the formation of m/z
1058 [M+Na]+ pseudo molecular ions. Potassium cationized species are observed at
m/z 1074 [M+K]+. Protonation yields cations at m/z 1036 [M+H]+. The
pseudomolecular ions of the polyamide oligomers are readily recognized by this
characteristic m/z [M+H]+, m/z [M+Na]+ and m/z [M+K]+ peak pattern. The m/z 1040
is formed by metastable fragmentation of the cationized linear nonamer in the mass
spectrometer [7]. The peaks in the MALDI spectrum of the cyclic nonamer are
assigned as m/z 1018 [M+H]+, m/z 1040 [M+Na]+ and m/z 1056 [M+K]+.
8.4.4. Quantification with the ELSD
The evaporative light-scattering detector (ELSD) could be sensitive to molecular-
mass and chemical-composition as both may influence the time to complete

Critical separation of polyamide-6 161
evaporation, as indicated by Charlesworth [47]. However, in practice it is almost
impossible to use a calibration standard with the same molecular-mass distribution
as the investigated polymer. To investigate the validity of equation 8.8 and the
possibility of molecular-mass dependence, a universal calibration curve was
constructed by injecting ten different kinds of polyamides on the critical system. Five
samples of cyclic oligomers and five samples of linear oligomers / polymers with
different molecular masses were investigated. Only samples with no significant
contamination of the opposite structure were used (table 8.1). Due to its relatively
low melting and boiling point (table 8.2), the cyclic monomer (caprolactam) did not
yield any response.
Table 8.1: Overview of the calculated and peak-width corrected injected masses of ten differentspecies. "∆s in %" is the difference in % of σ, which is the mean value of the converted values of peakwidth at half height and at 4σ.
minj
(µg)Area
countsin mV.s
σ(sec)
[∆s in%]
minj calc withuniversal
calibration(µg)
∆(minj)in % w/w
Areacorrected
To σ=1
minj calc withcorrectedarea (µg)
∆(minj)correcedin %w/w
C (n=2) 3.42 1050 6 [-4] 3.99 17 1450 3.54 3C (n=2) 7.02 2700 5 [0] 8.76 25 3600 7.61 8C (n=2) 38.0 19000 6 [9] 47.0 24 26500 40.5 6C (n=3) 5.34 1500 7 [-3] 5.30 -1 2050 4.79 -10C (n=3) 2.08 470 7 [-5] 1.98 -5 655 1.84 -12C (n=4) 3.51 895 8 [-7] 3.43 -2 1300 3.24 -8C (n=4) 11.7 4350 8 [-2] 13.0 13 6200 12.0 2C (n=4) 31.0 14500 7 [-2] 37.2 20 20500 32.6 5C (n=2-10) 1.79 345 14 [11] 1.52 -15 540 1.57 -13C (n=2-10) 11.1 4400 12 [6] 13.3 20 6700 12.8 16C (n=2-10) 25.2 12500 11 [5] 32.3 29 18500 30.2 20C (n=2-10) 67.0 34000 11 [23] 77.3 15 52000 71.5 7L 1 2.86 1500 5 [0] 5.31 86 1950 4.61 61L 1 11.0 7700 5 [-4] 21.5 95 10000 18.2 65L(Mw=2000) 2.34 0625 10 [-1] 2.51 7 925 2.45 5L(Mw=2000) 25.8 11000 12 [-4] 28.6 11 16500 27.2 5L(Mw=2000) 46.1 21500 12 [-2] 51.5 12 32500 48.3 5L(Mw=5000) 1.64 415 30 [30] 1.78 9 745 2.04 25L(Mw=5000) 14.0 3800 25 [5] 11.7 -16 6550 12.6 -10L(Mw=5000) 75.2 32000 28 [1] 72.2 -4 56500 76.3 1L(Mw=8000) 6.41 1600 39 [4] 5.60 -13 2950 6.51 2L(Mw=8000) 27.2 8850 33 [-3] 24.2 -11 16000 26.7 -2L(Mw=8000) 63.6 22800 38 [3] 54.5 -14 42500 60.5 -5L(Mw=15000) 2.48 535 33 [-54] 2.20 -11 970 2.55 3L(Mw=15000) 12.0 2750 37 [-16] 8.97 -25 5100 10.3 -14L(Mw=15000) 23.0 5950 39 [-7] 17.3 -24 11000 19.7 -14L(Mw=15000) 85.0 27900 48 [-3] 64.6 -24 54100 73.8 -13
s(∆(minj)) 17 s(∆(minj,corr) 10

Chapter 8162
Table 8.2: Compound versus molecular mass and melt temperature.
Compound Molecular massD
Melt tempoC
Boiling tempoC
C1 : cyclic monomerC2 : cyclic dimerC3 : cyclic trimerC4 : cyclic tetramerC5 : cyclic pentamerL1 : linear monomerPA-6 : polyamide 6
113226339452565131
104-105
69.5348247261253202220
139
On the other hand, the linear monomer was more sensitive than the other
components and therefore both monomers were excluded from the calculation of the
universal calibration curve. In practice, this is a minor problem, as the linear
monomer is only present in the low ppm range (often <5 mg/kg polyamide-6) [30].
The amount of cyclic monomer is relatively high in unwashed polyamide and should
be determined separately [30,37,43]. In figure 8.9 the natural logarithm of the
injected mass is plotted against the natural logarithm of the area and the corrected
area.
Figure 8.9: Influence of peak-width correction on the precision of the universal calibration curve.Uncorrected data (+) and corrected data (∆).
-14 -12 -10
ln mass injected
6
8
10
ln areacounts

Critical separation of polyamide-6 163
The subsequent statistical data are given in table 8.3.
Table 8.3: Statistical data of the universal calibration curve with and without corrected areas.
Universal calibrationcurve
Without area correction
Universal calibrationcurve
With area correctionLn A'0
A1
R
21.541.170.991
22.31.190.997
From figure 8.9, together with the correlation coefficients (table 8.3) and the
standard deviation of the ∆minj-values (table 8.1), it can be concluded that peak
width-area correction improves precision of the universal calibration curve. The
different distributions of these samples do not influence this curve. From figure 8.10
it can also be concluded that the accuracy improves, as due to the area-peak width
correction the deviation in weighted amount versus calculated amount decreases.
Figure 8.10: Influence of peak-width correction on accuracy of the calibration curve. Uncorrected data(line and l) versus corrected data (dashed line and s).
It can be anticipated that a peak width / area correction of a real sample will improve
accuracy. Four different polyamides were analyzed under critical conditions with the
ELSD as a universal detector. To determine the percentage cyclic (%C) different
- 3 0
- 2 0
- 1 0
0
10
20
30
0.0 10.0 20.0 30.0 40.0 50.0
peakw idth ( σ in s )
%m
ass
diffe
recn
e fr
om u
nive
rsal
calib
ratio
n cu
rve

Chapter 8164
procedures can be followed. First the universal calibration curve as discussed
above, can be used to determine the absolute amount of linear polymer and cyclics.
The amount of cyclics can now be calculated compared to the original mass of the
sample or compared to the sum of the percentages linear polymer and cyclics
calculated. In table 8.4 the concentration of cyclic components is given by using the
universal calibration curve. Recoveries of 94% or more are obtained with all
samples, except for the PA-6 24 kD, where recovery is only 84%. A high content of a
volatile component or the presence of non-eluting contaminations may cause this.
From the results of table 8.1 and the recoveries of table 8.4 no significant molecular-
mass dependence was observed. If standard samples are not available to construct
such a universal calibration curve the total normalized area sum can be considered
as the total amount of polymer. With different concentrations injected, an iterative
process can be used to determine the different unknowns (A'0, A1 and %C). With an
iterative procedure, one should be aware of the strategy used. The starting values
are important.
Table 8.4: Conversion of the areas of the linear and cyclic peak with the standard deviation σ to acorrected area with σ = 1. With these areas and the universal calibration curve the percentage ofcyclic oligomers present in the polymer were calculated.
PA-6 minj
(µg)Area L(mV.s)
Area C(mV.s)
σ(L)s
σ(C)s
CorrArea L
CorrAreaC
m (L)calc.(µg)
m (C)calc.(µg)
% cyclic100* m(C)/
{m(L)+m(C)}
% cyclic100*
m(C)/minj
Recovery
(%)
16 kD(a)
19.159.059.0125226
4750190001850047000
100000
96345330865
1950
4449485153
1613121311
99504100039000
100000215000
16557554014003150
17.958.356.2124236
0.581.641.563.506.83
3.132.742.692.752.81
3.012.792.642.813.02
9610298102108
Mean 2.82 2.85 10116 kD
(b)170300470
64000130000
>>
140029505450
5153
141311
136862282914
235048508700
161295
5.329.8016.0
3.203.22
3.113.313.40
97103
Mean 3.21 3.28 10024 kD 88
220530
2250071500
>>
905255011500
5149
141413
48652152329
15004300
18500
67.6176
3.718.8730.3
5.204.81
4.204.125.74
8186
Mean 5.01 4.69 8435 kD 110
2203350088400
9652350
4544
1313
69971185167
15973854
91.6207
3.878.09
4.053.76
3.553.75
87100
Mean 3.90 3.65 94

Critical separation of polyamide-6 165
An easy way to obtain these initial values is to construct curves of the natural
logarithm of the injected polymer mass minj versus the natural logarithm of the non-
corrected areas of the linear and cyclic peaks. The slope of these two curves (= A1)
will approximately be the same. The average value can be used as the initial A1
value to start the iteration process. The intercept of the linear regression curve of the
linear oligomers / polymer (= ln A'0) can be used to calculate the initial value of A'0.
Predictions about the percentage cyclic (%C) can be made, by comparing the areas
of the chromatogram. In our iterative optimization procedures, different initial %C
values were used. A good optimization value is the summated χ2-value [48]. We
defined χ2 as:
( )( )∑ −
−−
−− −=
peaksallcalculatedinjpredictedinj
calculatedinjpredictedinj
mmaverage
mm
;
2
2χ <8.9>
minj-predicted is the predicted value, which can be obtained by multiplication of the minj
with the predicted percentage of the linear (100-%C) or cyclic (%C). minj-calculated is the
calculated amount of the linear or cyclics components, using the normalized areas
(equation 8.8) and the predicted A'0 and A1 values. Thus, if the %C, A'0 and A1 are
predicted, the χ2-value of all peaks can be calculated. The iterative optimization
procedure works best, if all optimization values (A'0, A1 and %C) are in the same
order of magnitude. This is not the case and for this reason, the A'0 value is divided
by 1010 and the χ2-squared value is multiplied by 1010. Calculations have to be
corrected for A'0, which is not necessary for the χ2 value. First A'0 and A1 were
optimized by minimizing the χ2. Thereafter, a fine-tuning of %C, A'0 and A1 yields the
final iteratively calculated values. Plotting minj-predicted versus minj-calculated yields one
curve of all linear and cyclic injected mass values. The obtained regression and
correlation coefficient of this curve should approach unity, indicating a good fit of the
model. If not, other starting values should be tried. In table 8.5 the results of this
optimization procedure are given. As this χ2-optimization procedure works best with
a large number of experiments, this procedure is probably less precise than the
external universal calibration curve.

Chapter 8166
Table 8.5: Calculation of the percentage cyclic oligomers present in four different polyamides by usingthe iterative procedure.
Polyamide-6 Initial values
%C
Calculated
A'0
CalculatedA1
χ2
*1010r2 Slope %C
PA-6 16kD(a) A'0 :3.06E10A1average :1.227
05
10
1.20E101.21E101.20E10
1.2631.2631.263
993993993
0.999880.999880.99988
1.000651.000611.00065
4.14.14.1
PA-6 16kD(b) A'0 :2.45E10A1average :1.302
05
10
1.17E72.23E101.22E16
0.7031.3202.389
370655136
86892
0.955010.999990.97959
1.027911.001050.93599
0.14.07.5
PA-6 24kD A'0 :1.00E10A1average :1.336
05
10
Error2.24E102.26E10
Error1.3331.334
Error48014801
Error0.999320.99931
Error0.989180.98899
Error6.96.9
PA-6 35kD A'0 :5.24E10A1average :1.360
05
10
5.28E106.94E107.05E10
1.3981.4131.414
253155155
0.999930.999990.99999
1.003831.001011.00090
5.35.55.5
8.5 Conclusions
Under critical conditions the linear and cyclic structures of polyamide-6 were
separated, identified and quantified. It was observed that an electrospray interface
produced an unusable highly complex MS spectrum, due to multiply charged ions.
Using MALDI-TOF-MS, the different series could be identified. Excellent separations
of the linear and cyclic structures were obtained at near critical conditions.
With a direct spectrum of the polyamide, without preseparation of the linear and
cyclic structures, doubts could arise about presence of the cyclics in the original
sample, as they are generated in the mass spectrometer upon ionization. To the best
of our knowledge, this is the first time that the cyclic pentacontamer (C50) is
detected and identified.
It was shown that quantification of an ELSD chromatogram obtained at critical
conditions is not straightforward and a peak width / area correction must be made to
improve precision and accuracy. Furthermore no molecular-mass dependence was
observed for the oligomers and polymers of the different series, although the
provided calculations excludes the cyclic and linear monomer since their response
deviated strongly from the higher oligomers. All polyamide samples analyzed
contained a total of less than 7% cyclic oligomers.

Critical separation of polyamide-6 167
Acknowledgements
We gratefully acknowledge the Institute for Mass spectrometry of the University of
Amsterdam (Prof.dr. N.M.M. Nibbering and R. Fokkens) for acquisition of the MALDI
spectra.
References
1. S. M. Aharoni, "n-Nylons: Their Synthesis, Structure and Properties", Wiley, New York, 19972. S. Mori, Y. Nishimura, J. Liq. Chromatogr. 16(1993)3359-33703. Z. Tuzar, P. Kratochvil, M. Bohdancky, Adv. Polym. Sci. 30(1979)118-1584. G. van der Velden, J. Beulen, H. de Keijzer, Recl. Trav. Chim. Pays-Bas 110(1991)516-5255. G.J. van Rooy, M.C. Duursma, C.G. de Koster, R.M. Heeren, J.J. Boon, P.J. Wijnand Schuyl,
E.R.E. van der Hage, Anal. Chem. 70(1998)843-8506. M.W.F. Nielen, Mass Spectrom. Rev. 18(1999)309-3447. D. Muscat, H. Henderickx, G. Kwakkenbos, R. van Benthem, C.G. de Koster, R. Fokkens, N.N.M.
Nibbering, J. Am. Soc. Mass Spectrom. 11(2000)218-2278. S.G. Entelis, V.V. Evreinov, A.V. Gorshkov, Adv. Polym. Sci. 76(1986)129-1759. A.V. Gorshkov, H. Much, H. Becker, H. Pasch, V.V. Evreinov, S.G. Entelis, J. Chromatogr. A
523(1990)91-10210. D. Berek, Macromol. Symp. 110(1996)33-5611. V.V. Evreinov, A.V.Gorshkov, T.N. Prudskova, V.V. Guryanova, A.V. Pavlov, A.Y. Malkin, S.G.
Entelis, Polym. Bull. 14(1985)131-13612. B. Trathnigg, B. Maier, D. Thamer, J. Liq. Chromatogr 17(1994)4285-430213. V.V.Guryanova, A.V. Pavlov, J. Chromatogr. 365(1986)197-20414. A.V. Gorskov, V.V. Jevreinov, B. Lausecker, H. Pasch, H. Becker, G. Wagner, Acta Polymerica
37(1986)740-74115. H. Pasch, Macromol. Symp. 110(1996)107-12016. H. Pasch, K. Rode, Polymer 39(1998)6377-638317. D. Braun, E. Esser, H. Pasch, Int. J. Pol. Anal. Char. 4(1998)501-51618. H.J.A. Philipsen, B. Klumperman, A.M. Herk, A.L. German, J. Chromatogr. A 727(1996)13-2519. D. Berek, M. Janco, G.R. Meira, J. Polym. Sci. A: Polym. Chem. 36(1998)1363-137120. G. Schultz, H. Much, R. Kruger, C. Wehrstedt, J. Liq. Chromatogr. 13(1990)1745-176321. H. Pasch, B. Trathnigg, "HPLC of Polymers", Springer-Verlag, Berlin, 199922. H. Pasch, H. Kruger, H. Much, U. Just, Polymer 33(1992)3889-389223. R. Kruger, H. Much, G. Schultz, Int. J. Pol. Anal. Char. 2(1996)221-23524. R. Kruger, H. Much, G. Schultz, J. Liq. Chromatogr. 17(1994)3069-309025. K. J. Wu, R.W. Odom, Anal. Chem. 70(1998)456A-461A26. R. Ghahary, M. Resch, H. Pasch, GIT lab. J. 2(1997)96-10027. R.M. Whittal, L.M. Russon, L. Li, J. Chromatogr. A 794(1998)367-37528. M.W.F. Nielen, Anal. Chem. 70(1998)1563-156829. H. Yun, S.V. Olesik, E.H. Marti, J. Microcol. Sep. 11(1999)53-6130. Y. Mengerink, R. Peters, M. Kerkhoff, J. Hellenbrand, H. Omloo, J. Andrien, M. Vestjens, Sj. van
der Wal, J. Chromatogr. 878(2000)45-55, chapter 4 of this thesis.31. A.V. Gorshkov, S.S. Verenich, V.V. Evreinov, S.G. Entelis, Chromatographia 26 (1988) 338-34232. A.V. Gorshkov, T. Overeem, V.V. Evreinov, H.A.A. van Aalten, Polym. Bull. 18(1987)513-51633. L.R. Snyder, "Theory of chromatography" in: E. Heftmann (Ed) "Chromatography 5th edition, J.
Chromatogr. Library vol 51A”, Elsevier, Amsterdam, 199234. M. Abramowitz, I. Stegum, in "Handbook of mathematical functions", Dover, New York, 1970,
p30335. A. Stolyhwo, H. Colin, M. Martin, G. Guiochon, J. Chromatogr. 288(1984)253-27536. M.L. Vestal, P. Juhasz, S.A. Martin, Rapid Commun. Mass Spectrom. 9(1995)1044-1050.
Chapter 8168
37. Y. Mengerink, R. Peters, Sj. van der Wal, H. Claessens and C.A. Cramers, J. Chromatogr.accepted, chapter 5 of this thesis.
38. R. Puffr, V. Kubanek, "Lactam based polyamides Vol. 1”, CRC Press, Boston, 199139. J.A. Loo, C.G. Edmonds, H.R. Udseth, R.D. Smith, Anal. Chem. 62(1990)69340. R.D. Smith, J.A. Loo, R.R.O. Loo, M. Busman, H.R. Udseth, Mass Spectrom. Rev. 10(1991)35941. R.D. Smith, J.A. Loo, C.G. Edmonds, C.J. Baringa Loo, H.R. Udseth, Anal. Chem. 62(1990)88242. D.C. Schriemer, L. Liang, Anal. Chem. 68(1996)2721-272543. Y. Mengerink, R. Peters, M. Kerkhoff, J. Hellenbrand, H. Omloo, J. Andrien, M. Vestjens, Sj. van
der Wal, J Chromatogr. 876(2000)37-50, chapter 3 of this thesis44. Y. Mengerink, Sj. van der Wal, H.A. Claessens, C.A. Cramers, J. Chromatogr. 871(2000)259-
268, chapter 6 of this thesis45. C.G. de Koster, M.C. Duursma. G.J. van Rooij, R.M.A. Heeren, J.J. Boon, Rapid Commun. Mass
Spectrom. 9(1995)957-96246. G.J. van Rooij, M.C. Duursma, R.M.A. Heeren, J.J. Boon, C.G. de Koster, J. Am. Soc. Mass
Spectrom. 7(1996)449-45747. J.M. Charlesworth, Anal. Chem. 50(1978)1414-141948. J.C. Miller, J.N. Miller, “Statistics for analytical chemistry”, Ellis Horwood, New York, 1993

Critical separation of polyamide-6,6 169
Chapter 9Endgroup-based separation and quantification of
polyamide-6,6 using critical chromatography.
Summary
Polyamide-6,6 is a polycondensation product of the two monomers adipic acid and
1,6-hexamethylenediamine. Depending on the reacted amount of these monomers,
different ratios of primary-amine and carboxylic-acid endgroups can be formed.
Besides linear chains also cyclic polyamides will be made.
Using critical chromatography polyamide-6,6 can be separated independently of
molecular mass. Retention is solely based on endgroup functionality. It is
demonstrated that high-molecular-mass polyamide-6,6 (Mw approx. 20-30 kD) can
be separated using this approach. The separation was optimized by using different
parameters, such as percentage modifier, temperature and pressure. The
concentration of phosphoric acid was used for selective retention of the different
end-group functionalities. Using this property, critical gradient chromatography was
performed where the mobile phase is changing from a weak to a strong solvent with
respect to the endgroup functionality, while retaining the critical conditions of the
backbone unit. Quantification using UV detection is discussed.
Y. Mengerink, R. Peters, Sj. van der Wal, H.A. Claessens and C.A. Cramers, Submitted to Journal ofChromatography

Chapter 9170
9.1 Introduction
Polyamide-6,6 was the first commercially available polyamide. It is synthesized by
polycondensation of the monomers adipic acid and 1,6-hexamethylenediamine
(figure 9.1) [1].
HOOCCOOH + H2N
NH
COOH
O
H2NNH2 + H2O
Figure 9.1: Condensation of adipic acid and 1,6-hexamethylenediamine to the linear dimer.
Its molecular-mass distribution can be determined using size-exclusion
chromatography [2]. Another important property of the polymer is its endgroup
functionality. Besides the amount of carboxylic-acids and primary-amine endgroups,
the total amount of cyclic structures, which can be formed during intramolecular
condensation reactions could influence the polymer performance. Titration is the
most commonly applied technique to determine the amount of carboxylic-acid and
primary-amine endgroups [3]. However, this technique does not distinguish between
mono- or bi- functional carboxylic-acid or primary-amine terminated chains, it does
not give the possibilitiy to determine deviating terminations of the chain and it does
not account for possible cyclic molecules. A relatively new separation technique,
which is known as critical chromatography, could fulfill these demands. The
theoretical aspects of this separation technique were intensively investigated by
Gorbunov and Gorshkov [4-8].
The distribution constant K of a molecule between the stationary and mobile phase,
which also holds for a polymer, is given in equation 9.1:
RT
G
o
or
m
s et
ttk
c
cK
∆−
=
−=== ϕϕ <9.1>
where cs and cm are the concentration of the polymer in the stationary and mobile
phase, respectively; k is the retention factor; ϕ is the phase ratio; tr is the retention

Critical separation of polyamide-6,6 171
time; t0 is the elution time of an unretained polymer with the same hydrodynamic
volume, ∆G is the Gibbs free energy, R is the gas constant and T is the temperature.
According to the Martin rule the molar Gibbs free energy (∆G) of transfer of a
polymer from the mobile to the stationary phase is a summation of the Gibbs free
energy of the endgroups and the backbone units, as given in equation 9.2 [9]:
unitbackboneendgroupendgrouppolymer GnGGG −∆+∆+∆=∆ 21 <9.2>
At critical conditions polymer retention is independent of the number of backbone
units, i.e. the Gibbs free energy term n∆Gbackbone becomes zero. This can be
accomplished by compensating the enthalpic interaction effects (∆H) with the
entropic exclusion effects (∆S) at a certain temperature T as given in equation 9.3
[10]:
unitbackboneunitbackboneunitbackboneunitbackboneunitbackbone STHSTHG −−−−− ∆=∆⇒=∆−∆=∆ 0 <9.3>
Differences in the enthalpies of the endgroups at critical conditions are needed to
obtain a good separation of synthetic linear macromolecules, with identical
backbone units, but with different terminating functionalities.
To achieve this, one approach is the use of bare silica or polar modified silica, which
can interact with (polar) functional groups. Substantial interactions were obtained for
the carboxylic-acid endgroups of polyester [11].
Another approach is the use of available column test data to predict specific
interactions with the endgroups. Different test procedures are available, such as the
Engelhardt, the Walters, the Tanaka and the Galushko tests [12,13]. Although these
tests were primarily developed to specify packing materials, functional group
interactions with different molecules can be quantified too.
A number of papers have been published demonstrating the possibilities of critical
chromatography to separate polymers based on their endgroup functionality,
independent of the number of repeating backbone units. Most of these investigations
discuss the separation of low-molecular-mass oligomers, which do not exceed 10
kDalton [14-18].

Chapter 9172
Critical chromatography is also used for higher-molecular-mass polymers. However,
these kinds of separations are often not focussed on endgroup functionality but on
deviating backbone units. When the Gibbs free energy of a certain backbone unit
becomes zero, the remaining deviating backbone can be determined as this part of
the chain will promote exclusion or interaction. Using these conditions, degree of
grafting of polystyrene-graft-poly(ethylene oxide) [19] and tacticity of
poly(ethylmethacrylate) [20] were determined. Using this technique it is also possible
to determine a chemical-composition distribution of a block copolymer (e.g. styrene
and butadiene Mw = 100 kD) [21] or to separate blends (e.g. different
polyalkylacrylates (Mw approx. 200 kD) [22].
Some problems with this technique have been reported. Philipsen encountered
problems to obtain critical conditions of higher-molecular-mass polymers [23]. Berek
et al. summarized the demands of and problems with critical chromatography [24].
He observed recovery problems at critical conditions [25] and started to promote
liquid chromatography at limiting conditions [26].
Critical conditions are often found after optimization of the mobile phase constituents
and the column temperature [23,27]. However, other chromatographic conditions
could influence critical conditions also. It has been reported that due to pressure one
of the mobile phase constituents can preferentially be adsorbed to the stationary
phase [28]. For small molecules, such very small changes in the stationary phase
composition will influence retention factors to a small extent. Retention factors of
approximately 5 units for some low-molecular-mass aromatic compounds increased
roughly linearly 0.03 – 0.15 retention factor units due to steps of 100 bar pressure
increase [29]. It can be anticipated that preferential adsorption of mobile phase
constituents will influence high-molecular-mass polymers to a much greater extent.
Besides percentage strong solvent, temperature and pressure, the choice of the
stationary and mobile phase is important also.
Here we present a study of the critical separation of polyamide-6,6, to perform a
separation solely based on differences in endgroup functionality. A normal-phase
and a reversed-phase system were tested. A procedure is proposed to verify the
recovery. Different parameters were used to obtain true critical conditions and to
optimize the separation. Besides the role of modifier concentration and stationary
phase, temperature, flow rate (as a pressure regulator) and additive concentration

Critical separation of polyamide-6,6 173
were investigated to optimize the critical separation. Quantification using UV
detection is discussed also.
9.2 Experimental
Two different chromatographic set ups were used. The standard set up is an HP
1090 liquid chromatograph including a solvent delivery system, an autosampler, a
column thermostat unit and a diode-array detector to measure the UV absorbance
(Agilent, Waldbronn, Germany). Data collection was performed using Agilent
A.08.01 software (Agilent). If isocratic conditions were used, the mobile phase was
always premixed to circumvent mixing problems.
The second chromatographic set up was used for the formic acid / 1-propanol
experiments and, for extremely-controlled-temperature experiments. The mobile
phase was premixed and pumped using an Agilent 1100 quaternary pump, including
a degasser and a control module (Agilent).
The injector (Rheodyne, Cotati, CA, USA), equipped with a 55 µl loop, was mounted
inside the column oven (Mistral, Spark, Emmen, The Netherlands), which was
connected with an Endurance autosampler (Spark, Emmen, The Netherlands).
Approximately 6 meters of 0.25 mm ID capillary tubing was used in this oven to
thermostat the mobile phase before it reached the injector. UV detection was
performed using a Linear 204 detector (Linear instruments, Reno, USA). The
detector signal was collected with an X-Chrom/Windows NT 3.51 version 2.11b data
management system (LAB-systems, Manchester, U.K.).
The mobile phase constituents used were 1,1,1,3,3,3-hexafluoro isopropanol (HFIP,
Biosolve, Valkenswaard, The Netherlands), 10 mM phosphoric acid (made with
phosphoric acid 85% p.a., Baker, Deventer, The Netherlands) in water (MilliQ,
Millipore, Milford, MA, USA), formic acid (Merck, Darmstadt, Germany) and 1-
propanol (Baker, Deventer, the Netherlands). All stationary phases used (Nucleosil)
were purchased as packed columns from Machery-Nagel (Düren, Germany).
Two different kinds of polyamide-6,6 test samples were used for this investigation.
Firstly, a commercially available polyamide-6,6 sample was purchased from Aldrich

Chapter 9174
(Aldrich, Milwaukee, WI, USA). Secondly, six polyamide-6,6 samples were specially
prepared for this investigation to obtain different molecular-mass polyamide-6,6
samples with different endgroup functionalities. SEC data were obtained similar as
described in ref. [2].
9.3 Results and discussion
9.3.1 Optimization
Critical conditions of oligomeric species can easily be approximated using two low-
molecular-mass fractions with different molecular masses (e.g. Mw = 750 D and Mw
= 1500 D). Elution times of these samples must be equalized by adjusting the
composition of the mobile phase (i.e. the percentage of the modifier concentration)
as described in chapter 8 [27]. To obtain true critical conditions a third high-
molecular-mass polymer with well-defined properties is needed. Conditions often
need to be slightly re-adjusted.
The chromatographic normal-phase conditions used for the critical separation of
linear and cyclic polyamide-6 [27] were not applicable for functional endgroup
separation of polyamide-6,6. Using such conditions, the separation of three low-
molecular-mass polyamide-6,6 fractions, which significantly differ in endgroup
functionality due to different initial ratios of both monomers during synthesis, is
depicted in figure 9.2. No baseline separation of the different endgroup
functionalities was obtained.
From different column test procedures we observed a very strong amine interaction
with Nucleosil 120-5C18 columns. Using this reversed-phase column and HFIP and
10mM phosphoric acid in water a baseline separation could be accomplished as
shown in figure 9.3 for different polyamide-6,6 samples. During optimization of this
critical separation the HFIP concentration is the first optimization parameter.
Thereafter, temperature can be used as a first fine-tuning regulator to obtain critical
conditions as given in figure 9.4. Increasing temperature diminishes interaction. The
temperature within thermostatting modules, like the Mistral oven, are only adjustable

Critical separation of polyamide-6,6 175
to one degree centigrade. The thermostatting module of the HP1090 is adjustable to
a tenth of a degree which is already more favorable for optimization of critical
separations. Although different peaks could be observed on a Nucleosil 120-5C18
column at 42-43oC true critical conditions could not be accomplished. At 43oC the
system was slightly entropically driven, while at 42oC a slightly enthalpically driven
system was observed.
2.a PA-66 sample (Mw = 3 kD) with equal amounts of amine and carboxylic-acid terminating groups Ana lys is : y00725grad ient ,80 ,1 Pro jec t : m iq ls03 I ns t rument : chan388 Method : e l sd Standard 1
Acqu is i t ion T ime: 01 Aug 2000 a t 10 :39 .56
R e s p o n s e ( m V )
Time(minu tes ) 1 0 0 0 1 0 0 1 1 0 0 2 1 0 0 3 1 0 0 4 1 0 0 5 1 0 0 6 1 0 0 7 1 0 0 8 1 0 0 9 1 0 1 0 1 0 1 1 1 0 1 2 1 0 1 3 1 0 1 4 1 0 1 5
0 0 .5 1 1 .5 2 2 .5 3 3 .5 4 4 .5 5 5 .5 6 6 .5 7 7 .5 8 8 .5
2.b PA-66 sample (Mw = 8 kD) with excess amine terminating groups A n a l y s i s : y 0 0 7 2 5 g r a d i e n t , 8 3 , 1 P r o j e c t : m i q l s 0 3
I n s t r u m e n t : c h a n 3 8 8 M e t h o d : e l s d
S t a n d a r d 1
A c q u i s i t i o n T i m e : 0 1 A u g 2 0 0 0 a t 1 1 : 1 9 . 0 9
R e s p o n s e ( m V )
T i m e ( m i n u t e s )
1 0 0 0
1 0 0 5
1 0 1 0
1 0 1 5
1 0 2 0
1 0 2 5
1 0 3 0
1 0 3 5
1 0 4 0
1 0 4 5
0 0 . 5 1 1 . 5 2 2 . 5 3 3 . 5 4 4 . 5 5 5 . 5 6 6 . 5 7 7 . 5 8 8 . 5
2.c PA-66 sample (Mw = 3 kD) with excess carboxylic-acid terminating groups A n a l y s i s : y 0 0 7 2 5 g r a d i e n t , 8 5 , 1 P r o j e c t : m i q l s 0 3
I n s t r u m e n t : c h a n 3 8 8 M e t h o d : e l s d
S t a n d a r d 1
A c q u i s i t i o n T i m e : 0 1 A u g 2 0 0 0 a t 1 1 : 4 5 . 1 8
R e s p o n s e ( m V )
T i m e ( m i n u t e s )
8 6 5
8 7 0
8 7 5
8 8 0
8 8 5
8 9 0
8 9 5
9 0 0
9 0 5
9 1 0
9 1 5
9 2 0
9 2 5
9 3 0
9 3 5
0 0 . 5 1 1 . 5 2 2 . 5 3 3 . 5 4 4 . 5 5 5 . 5 6 6 . 5 7 7 . 5 8 8 . 5
Figure 9.2: Critical separation of low-molecular-mass polyamide-6,6. Column 2*(250*4 mm): nucleosil50-5 (T = 39oC), flow-rate 0.75 ml.min-1 injection volume 50µl polyamide concentration 1 mg/ml mobilephase 80% formic acid and 20% (w/w) 1-propanol. Detection ELSD at 55oC 1.9 Atm. air nebulisationpressure.

Chapter 9176
min0 2.5 5 7.5 10 12.5 15 17.5 20 22.5
mAU
0
50
100
150
200
250
DAD1 B, Sig=195,4 Ref=300,20 (D:\U-DRIVE\HPDATA\Y101144C\004-1201.D)
Amine rich polyamide-6
amine-amine
cycl
amine-acid
acid-acid
min0 2.5 5 7.5 10 12.5 15 17.5 20 22.5
mAU
0
200
400
600
800
DAD1 B, Sig=195,4 Ref=300,20 (D:\U-DRIVE\HPDATA\Y101144C\006-1401.D)
Acid rich polyamide-6,6amine-acid
cycl
amine-amine
acid-acid
min0 2.5 5 7.5 10 12.5 15 17.5 20 22.5
mAU
0
50
100
150
200
250
DAD1 B, Sig=195,4 Ref=300,20 (D:\U-DRIVE\HPDATA\Y101144C\059-2101.D)
Cyclic oligomers of polyamine-6,6cyclics
Figure 9.3: Some special polyamide-6,6 samples at critical conditions: upper trace primary-amine richpolyamide-6,6 (Mw ≈ 10 kD), mid trace carboxylic-acid rich polyamide-6,6 (Mw ≈ 3 kD), lower tracecyclic oligomers of polyamide-6,6 (Mw = 700 D). Column 2*(250*4) mm Nucleosil 300-5C18. 89.5%(w/w) HFIP and 10.5% (w/w) 10mM H3PO4, flow rate 0.3 ml/min, column temperature 39oC.
min2 4 6 8 10 12 14
mAU
0
25
50
75
100
DAD1 B, Sig=195,4 Ref=300,20 (D:\U-DRIVE\HPDATA\Y101174C\T4200005.D)
Column Temp= 44C
min2 4 6 8 10 12 14
mAU
0
25
50
75100
125
DAD1 B, Sig=195,4 Ref=300,20 (D:\U-DRIVE\HPDATA\Y101174C\T4200002.D)
Column Temp= 43C
min2 4 6 8 10 12 14
mAU
0
25
50
75
100
DAD1 B, Sig=195,4 Ref=300,20 (D:\U-DRIVE\HPDATA\Y101174C\T4200001.D)
Column Temp= 42C
min2 4 6 8 10 12 14
mAU
0
20
40
60
DAD1 B, Sig=195,4 Ref=300,20 (D:\U-DRIVE\HPDATA\Y101174C\FL0P0007.D)
Column Temp= 41C
Figure 9.4: Influence of the temperature on the critical separation of polyamine-6,6 (Mw ≈ 30 kD).Conditions Column 2*(250*4 mm) Nucleosil 120-5C18, flow rate 0.5 ml.min-1, mobile phase 89.5%HFIP (w/w) and 10.5% (w/w) 10 mM phosphoric acid. Injection volume = 2.5 µl ∆P = 295 Atm.

Critical separation of polyamide-6,6 177
Another optimization parameter for these kinds of high-molecular-mass polymers is
the pressure drop across the column. Figure 9.5 demonstrates the influence of
pressure on a Nucleosil 300-5C18 column by adjusting the flow rate.
min2.5 5 7.5 10 12.5 15 17.5 20 22.5
mAU
0
20
40
DAD1 B, Sig=195,4 Ref=300,20 (E:\Y101174C\FL0P0000.D)
Flow 0.5 ml/min dp = 320 Atm.
min2.5 5 7.5 10 12.5 15 17.5 20 22.5
mAU
0
50
100
150
DAD1 B, Sig=195,4 Ref=300,20 (E:\Y101174C\FL0P0002.D)
Flow 0.3 ml/min dp = 190 Atm.
acid
-aci
d
amin
e-am
ine
acid
-am
ine
cycl
ics
min2.5 5 7.5 10 12.5 15 17.5 20 22.5
mAU
025
50
75100
125
DAD1 B, Sig=195,4 Ref=300,20 (E:\Y101174C\FL0P0006.D)
Flow 0.275 ml/min dp = 175 Atm.
min2.5 5 7.5 10 12.5 15 17.5 20 22.5
mAU
020406080
100
DAD1 B, Sig=195,4 Ref=300,20 (E:\Y101174C\FL0P0004.D)
Flow 0.25 ml/min dp = 160 Atm.
Figure 9.5: Critical separation influence of flow rate on the critical separation, conditions as in figure9.4, column temperature 39oC.
Although, in principle, flow rate could influence column efficiency (HETP-curve), the
observed peak broadening cannot be explained by these small changes. As flow
rate may also influence the real column temperature [30], we studied this effect
using two different chromatographic systems. The temperature control of the
HP1090 system is rather limited. Injection of the sample takes place before the
column thermostatting module and the mobile phase is only preheated during a short
time interval to reach column temperature. A second chromatographic system
(HP1100 / Edurance / Mistral) was equipped with an injection module inside the
column oven and the mobile phase was preheated in the same oven using
approximately 6 meters of 0.25 mm ID capillary tubing. An identical influence of the
flow rate and temperature on the critical point was found on both systems as shown
in figure 9.6.

Chapter 9178
Figure 9.6: Relation between the flow rate and temperature on the critical point of polyamide-6,6 on aNucleosil 300-5C18 stationary phase and HFIP / 10mM H3PO4 as a mobile phase.
Critical temperatures were not exactly the same on both systems, indicating small
deviations in the thermostatting modules. By decreasing the flow rate, critical
conditions disappeared and reappeared after adding an extra column behind the
detector, to create the original pressure drop across the first two columns. Figure 9.7
shows a general optimization graph, interrelating the HFIP percentage, the
temperature and the pressure (regulated by the flow rate). At exclusion conditions, a
decrease of the percentage HFIP in the mobile phase, a decrease of the
temperature or an increase of the flow rate (= pressure) will increase the interaction
of the polymer with the stationary phase, which may result in critical conditions. We
also investigated the influence of the pore width on critical conditions. Gorshkov
predicted that the critical conditions would not changed with the pore widths and he
promoted small-pore packings [4]. However, applying different pore sizes of the
stationary phase Nucleosil x-C18 (x = 50, 120 or 300 Å) critical conditions did not
appear at exactly the same conditions (figure 9. 8).
20
25
30
35
40
45
0.1 0.2 0.3 0.4 0.5 0.6flow (ml/min)
Tem
p (
C )
HP1090
HP1100Endurance/mistral

Critical separation of polyamide-6,6 179
Figure 9.7: General optimization chart, which interrelates the influence of the percentage HFIP, flowrate (= pressure drop) and the column temperature on the critical point.
min0 2.5 5 7.5 10 12.5 15 17.5 20 22.5
mAU
0
100
200
300
400
DAD1 B, Sig=195,4 Ref=450,80 (F:\01MIQ03\Y103191C\005-0201.D)
2*(250*4mm) Nucleosil 50-5C18 : 50 A pores
acid-acid
acid-amine
amine-amin
min0 2.5 5 7.5 10 12.5 15 17.5 20 22.5
mAU
0
20
40
60
80
100
120
140
DAD1 B, Sig=195,4 Ref=450,80 (F:\01MIQ03\Y103081C\001-1001.D)
2*(250*4mm) Nucleosil 120-5C18 : 120 A pores
acid-acid
acid-amine
amine-amin
min0 2.5 5 7.5 10 12.5 15 17.5 20 22.5
mAU
0
100
200
300
400
500
600
DAD1 A, Sig=195,4 Ref=450,80 (F:\01MIQ01\Y101094C\001-1301.D)
2*(250*4mm) Nucleosil 300-5C18 : 300 A pores
acid-acid
acid-amine
amine-amin
Figure 9.8: Influence of different pore diameters of the same stationary phases on the criticalconditions of polyamide-6,6 (Mw ≈ 3kD). Critical conditions for different stationary phases:
a. Upper trace : Nucleosil-50C18 (50 Å pores), column temperature 42oC flow rate 0.3 ml/minmobile phase 85% HFIP / 15% 10 mM H3PO4 in water (w/w%) ∆P = 180 Atm.
b. Mid trace : Nucleosil-120C18 (120 Å pores), column temperature 42oC flow rate 0.3 ml/minmobile phase 88.5% HFIP / 11.5% 10 mM H3PO4 in water (w/w%) ∆P = 145 Atm.
c. Lower trace : Nucleosil-300C18 (300 Å pores), column temperature 39oC flow rate 0.3 ml/minmobile phase 89% HFIP / 11% 10 mM H3PO4 in water (w/w%) ∆P = 170 Atm.

Chapter 9180
Column test results with low-molecular-mass analytes with different functionalities
[12,13] showed also deviating interaction properties, concluding that not only the
pore diameter is changed (see table 9.1). This is consistent with other results [31],
that by varying the pore size of a RP-stationary phase also other properties may
change, like polarity.
Table 9.1: Column test data using the Tanaka test, amyl = amylbenzeen, butyl = butylbenzeen, triph =triphenyl, o-terph = o-terphenyl, caf = caffeine, exchang = exchange.
Test Measure Nucleosil50-5C18
Nucleosil120-5C18
Nucleosil300-5C18
Nucleosil120-5C8
HydophobicityAmount alkylchainsStericH-boundcation-exchng pH>7cation-exchng pH<3anion-exchng pH>7anion-exchng pH<3
kamyl/kbutyl
kamyl
ktriph/ko-terph
kcaf/kfenol
kbenzylamine/kfenol
kbenzylamine/kfenol
kbenzoic acid/kfenol
kbenzoic acid/kfenol
1.486.201.770.390.400.39-0.040.94
1.433.561.780.470.400.41-0.060.95
1.431.621.870.470.460.47-0.101.07
1.270.631.570.750.420.42-0.161.00
Using the column with 300 Å pores a nice separation is obtained between the cyclic
structures (at 16.5 min), the linear chains with two terminating dicarboxylic-acid
chains, the linear chains with one terminating carboxylic acid and one primary amine
and the linear chains with two terminating primary amines (figure 9.8). With the 50Å
and 120Å columns the cyclics cannot be distinguished.
A main problem, which was not discussed in the literature so far, is the possibility to
manipulate the selectivity at critical conditions. If a separation at critical conditions is
not satisfactory, it is very difficult to change a parameter to improve selectivity to a
major extent. Changing one parameter will almost automatically imply the loss of
critical conditions, making it necessary to change another parameter at the same
time also. Although small improvements could be obtained, it can be anticipated that
the selectivity will not change dramatically if for example temperature and modifier
concentration are changed while retaining critical conditions. During the construction
of figure 9.6, no selectivity changes were observed. The most obvious way to
improve selectivity is to change the stationary phase as demonstrated in figure 9.8,
where besides the stationary phase also other column properties changed (see table

Critical separation of polyamide-6,6 181
9.1). Changing the stationary phase automatically implies the change of the mobile
phase composition.
Another way to improve the separation efficiency can be accomplished by changing
the mobile phase composition. As the interaction of the polyamide-6,6 series is
probably based on ion-exchange interactions of the primary amines with silica-based
cation-exchange sites on the stationary phase, the influence of the phosphoric-acid
concentration in the aqueous part of the stationary phase was investigated (figure
9.9). It is clearly demonstrated that the phosphoric-acid concentration can be used to
influence selectivity of the different endgroup functional polymeric series, without
losing the critical conditions.
Figure 9.9: Influence of the phosphoric-acid concentration in the aqueous part of the mobile phase.Critical isocratic chromatographic conditions: 84% HFIP and 16% aqueous solution. The mobile phaseis prepared by on-line mixing of three different stock solutions a) water b) 50 mM H3PO4 and c) HFIP.The phosphoric-acid concentration of the aqueous part is given in the separate chromatograms.Injection 1 µl containing 1-2.5 mg/ml PA-66 (3 kD) dissolved in 84% (v/v) HFIP and 16% (v/v) water.84% HFIP (v/v) equals 89.5% HFIP (w/w). Flow rate 0.3 ml/min, column 2*(250*4) mm Nucleosil 300-5C18. Detection is performed at λ = 200 nm.
Using this feature, a phosphoric-acid gradient can be applied, where the different
polymeric series elute independently of their number of backbone units, but will be
min10 20 30 40 50
mAU
0
50
100
DAD1 A, Sig=200,4 Ref=450,80 (Y105041C\001-8101.D)
0 mM H3PO4
acid-acid
min10 20 30 40 50
mAU
0
50
100
DAD1 A, Sig=200,4 Ref=450,80 (Y105041C\001-8701.D)
0.6 mM H3PO4
acid-acid
min10 20 30 40 50
mAU
0
50
100
DAD1 A, Sig=200,4 Ref=450,80 (Y105041C\001-9301.D)
2 mM H3PO4
acid-acidacid-amine
amine-amine
min10 20 30 40 50
mAU
0
50
100
DAD1 A, Sig=200,4 Ref=450,80 (Y105041C\001-9901.D)
11 mM H3PO4acid-acid
acid-amine
amine-amine
min10 20 30 40 50
mAU
0
50
100
DAD1 A, Sig=200,4 Ref=450,80 (Y105041C\001-A501.D)
50 mM H3PO4

Chapter 9182
separated due to a gradual decrease of interactions of the endgroup with the
stationary phase (figure 9.10).
Figure 9.10: Critical gradient chromatographic conditions: 84% HFIP and 16% water (v/v). The mobilephase is prepared by on-line mixing of three different stock solutions, a) water b) 50 mM H3PO4 andc) HFIP. The phosphoric-acid concentration of the aqueous part is gradually changed from 0 to 50 mMin 40 min. Injection 1µl 1-2.5 mg/ml 3 kD PA-66 (1st trace), 8 kD amine-rich PA-66 (2nd trace), 3 kDacid-rich PA-66 (3th trace) and 678 D cyclic PA-66 (4th trace) dissolved in 84% (v/v) HFIP and 16%(v/v) water (84% HFIP (v/v) equals 89.5% HFIP (w/w)). Flow rate 0.3 ml/min, column 2*(250*4) mmNucleosil 300-5C18. Detection is performed at λ = 200 nm.
9.3.2 Strategy to check recovery
A chromatographic run during method development should consist of two
consecutive parts to obtain critical conditions and to control recovery: first critical
isocratic conditions followed by a gradient to full exclusion conditions.
An example of this approach is shown in figure 9.11. A low- and a high-molecular-
mass polyamide-6,6 (Mw ≈ 3 kD and Mw ≈ 20 kD) were injected on a Nucleosil 120-
5C8 column and conditions turned out to be near critical. The high-molecular-mass
polymer with a specific endgroup eluted significantly a few seconds faster than the
low-molecular-mass polymer peak, indicating a slightly entropically driven system.
Although conditions were not exactly critical, a separation based on the different
functionalities is obtained. As the system was slightly entropically driven it was very
min0 5 10 15 20 25 30 35
mAU
0
50
100
150
*DAD1 A, Sig=200,4 Ref=450,80 (Y105041C\001-1501.D) - DAD1 A, Sig=200,4 Ref=450,80 (Y105041C\000-1301.D)
acid-amine
min0 5 10 15 20 25 30 35
mAU
0
50
100
150
*DAD1 A, Sig=200,4 Ref=450,80 (Y105041C\003-1701.D) - DAD1 A, Sig=200,4 Ref=450,80 (Y105041C\000-1301.D)
amine-amine
min0 5 10 15 20 25 30 35
mAU
0
50
100
150
*DAD1 A, Sig=200,4 Ref=450,80 (Y105041C\004-1801.D) - DAD1 A, Sig=200,4 Ref=450,80 (Y105041C\000-1301.D)
acid-acid
min0 5 10 15 20 25 30 35
mAU
0
50
100
150
*DAD1 A, Sig=200,4 Ref=450,80 (Y105041C\005-1401.D) - DAD1 A, Sig=200,4 Ref=450,80 (Y105041C\000-1301.D)
cyclic
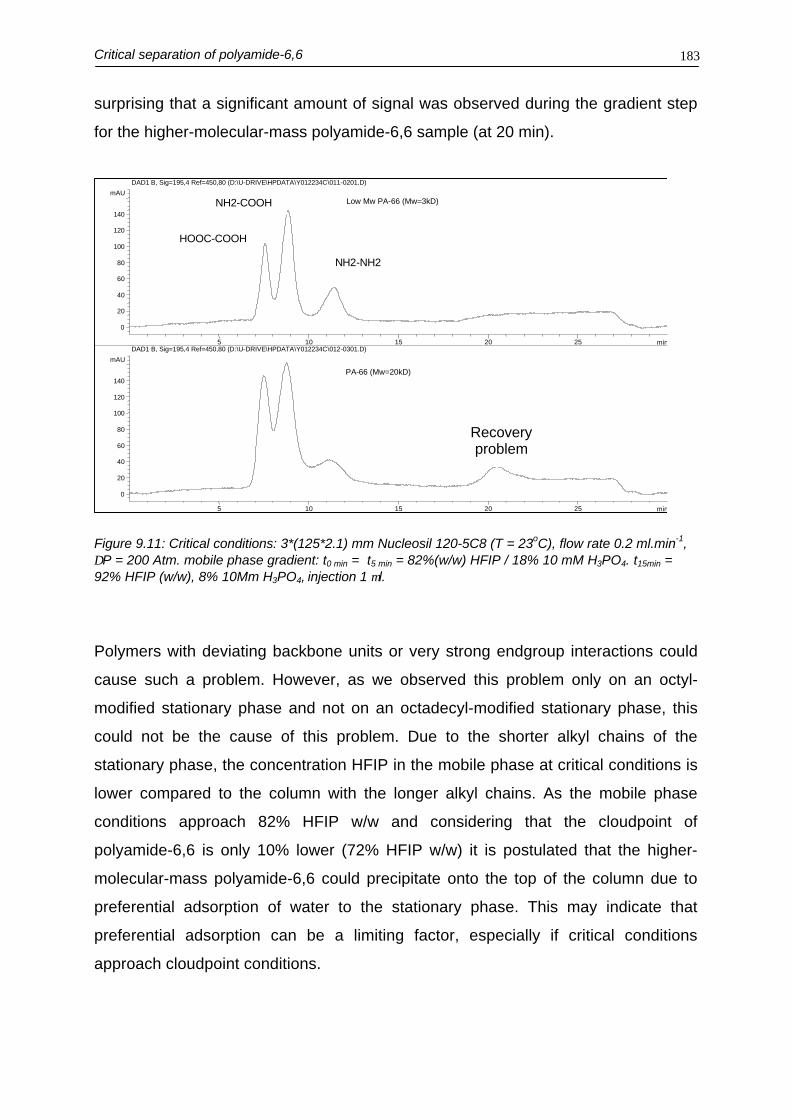
Critical separation of polyamide-6,6 183
surprising that a significant amount of signal was observed during the gradient step
for the higher-molecular-mass polyamide-6,6 sample (at 20 min).
min5 10 15 20 25
mAU
0 20 40 60 80
100 120 140
DAD1 B, Sig=195,4 Ref=450,80 (D:\U-DRIVE\HPDATA\Y012234C\011-0201.D) Low Mw PA-66 (Mw=3kD)
min5 10 15 20 25
mAU
0 20 40 60 80
100 120 140
DAD1 B, Sig=195,4 Ref=450,80 (D:\U-DRIVE\HPDATA\Y012234C\012-0301.D)
PA-66 (Mw=20kD)
HOOC-COOH
NH2-NH2
NH2-COOH
Recovery problem
Figure 9.11: Critical conditions: 3*(125*2.1) mm Nucleosil 120-5C8 (T = 23oC), flow rate 0.2 ml.min-1,∆P = 200 Atm. mobile phase gradient: t0 min = t5 min = 82%(w/w) HFIP / 18% 10 mM H3PO4. t15min =92% HFIP (w/w), 8% 10Mm H3PO4, injection 1 µl.
Polymers with deviating backbone units or very strong endgroup interactions could
cause such a problem. However, as we observed this problem only on an octyl-
modified stationary phase and not on an octadecyl-modified stationary phase, this
could not be the cause of this problem. Due to the shorter alkyl chains of the
stationary phase, the concentration HFIP in the mobile phase at critical conditions is
lower compared to the column with the longer alkyl chains. As the mobile phase
conditions approach 82% HFIP w/w and considering that the cloudpoint of
polyamide-6,6 is only 10% lower (72% HFIP w/w) it is postulated that the higher-
molecular-mass polyamide-6,6 could precipitate onto the top of the column due to
preferential adsorption of water to the stationary phase. This may indicate that
preferential adsorption can be a limiting factor, especially if critical conditions
approach cloudpoint conditions.

Chapter 9184
9.3.3 Quantification
Seven different polyamide-6,6 samples were separated at the optimized critical
conditions. A small influence of the molecular-mass dependency on the total UV-
detector response could be expected when detecting linear polyamide chains [32].
As the amide function is the only UV-absorbing group, the monomers adipic acid or
hexamethylene diamine will not contribute to the total detector response, and a
linear dimer (the reaction product of figure 9.1) will only absorb UV light due to one
amide function. UV absorbance of a linear polyamide-6,6 chain can be estimated
using the equivalent absorption coefficient of an amide function as given in equation
9.4:
)1(113131
)1('
−+−
≈n
n amidel
εε <9.4>
where ε’L is the absorption coefficient of a linear polyamide-6,6 chain with n
backbone units in Au.g-1.l.m-1 and εamide is the UV absorbance of an amide function in
Au.eq-1.l.m-1
131 and 113 are the average molecular mass of a PA-6,6 backbone unit with (M =
131) and without water (M = 113) in g.mol-1. Due to this deviation the number of
amide functions is not exactly equal to the number of backbone units, but for
polyamides with a molecular mass higher than 1 kD this effect is smaller than 10%
(figure 10.12). Nevertheless, if the molecular-mass distribution of the polyamide is
not significantly influenced by the terminating endgroups, the ratio of the endgroup
functionality of the linear chains can be calculated directly from the UV response. In
table 9.2 the results for 7 different polyamide 6,6 samples were compared. The high-
molecular-mass polyamide-6,6 (30 kD) is used as an external standard by dividing
the total area by the injected mass. Three different concentrations were injected as
depicted in figure 9.13.

Critical separation of polyamide-6,6 185
Figure 9.12: Influence of molecular mass of polyamide-6,6 on the relative response, defined asrelative UV absorbance divided by injected mass.
Table 9.2: Calculated results, using the PA-6,6 sample (Aldrich) as a calibration sample (total area is100%). Rec is recovery calculated (using the SEC curve and equation 4, linear monomers notincluded!) and measured (meas), minj is the injected mass.
PA-66 Mw
(kD)minj
(µg)Rec
Calc %Rec.Meas
%
Acid-acid%
Acid-amine% w/w
Amine-amine% w/w
Cyclic%w/w
1 : Acid / amine2 : Acid / amine3 : Amine rich4 : Amine rich5 : Acid rich6 : Acid rich
3258
103
10
7.288.655.783.106.9810.9
919695969196
919884948292
23321
176336
434214441641
22206831113
251212
7 : PA-66 Aldrich
Average
303030
2.375.7810.9
969696
9910199
37373737
44434344
13161515
5545
Inf luence of molecular mass of polyamide-6,6 on UV response.
0
0.25
0.5
0.75
1
100 1000 10000 100000Molar mass
reco
very
theoretical curve based on M
Calc recovery based on Mw of sample
measured recovery

Chapter 9186
min10 20 30 40 50
mAU
0
100
200
300
400
500
600
DAD1 B, Sig=195,4 Ref=300,20 (D:\U-DRIVE\HPDATA\Y101094C\007-1901.D)
4mg PA-6,6/ml
2mg PA-6,6/ml
1mg PA-6,6/ml
HOOC~COOH
HOOC~NH2
NH2~NH2
blanc
DAD1 B, Sig=195,4 Ref=300,20 (D:\U-DRIVE\HPDATA\Y101094C\008-2001.D) DAD1 B, Sig=195,4 Ref=300,20 (D:\U-DRIVE\HPDATA\Y101094C\009-2101.D)
Figure 9.13: Influence of injected mass, 2.5 µl injection of three different concentrations polyamide-6,6(Mw = 30 kD) of approx. 1,2 and 4 mg/ml. Mobile phase time table t0 min = 89.5% (w/w) HFIP / 10.5%(w/w) 10 mM H3PO4 t20 min = idem t0 min, t25 min 95% (w/w) HFIP / 5% (w/w) 10 mM H3PO4 t35 min idem ast = 25 min,t36 min idem as t0 min. Flow rate 0.3 ml/min, column temperature 390C.
For the amine rich and acid rich low-molecular-mass polyamide-6,6 recovery is 10
percent less than expected from the calculated recovery. This could be due to an
excess of unreacted monomers (which were used to prepare these low-molecular-
mass polyamides) or to the presence of other low-molecular-mass components like
water.
9.4 Conclusions
It is demonstrated that a baseline separation of polyamide-6,6 solely based on
endgroup functionality can be accomplished. Optimization was performed using the
percentage HFIP, the column temperature and the flow-rate, which regulated the
pressure. At critical conditions the flow rate cannot be optimized separately, because
critical conditions shift due to preferential adsorption of one of the mobile phase
constituents. Critical gradient chromatography can be used to increase resolution

Critical separation of polyamide-6,6 187
while retaining critical conditions. Using a gradient step after the isocratic conditions,
recovery could be checked.
UV detection turned out to work well for quantification of higher-molecular-mass
distributions. However, for lower-molecular-mass distributions (n < 10; M < 1 kD) this
may result in a decreased accuracy.
Acknowledgement
I would like to thank J. Hermans, A. van Geenen and A. Nijenhuis for the synthesis
of some special polyamide-6,6 samples with respect to molecular-mass distribution
and endgroup functionality.
References
1 H.J. Koslowski, “Dictionary of Man-Made Fibers”, Int. Business Press Publishers, Frankfurt anMain, 1998
2 S. Mori, Y. Nishimura, J. Liq. Chromatogr. 16(1993)3359-33703 A. Horbach, in L. Bottenbruch, R. Binsack (editor), “Polyamide, kunststoff Handbuch”, Carl
Hanser Verlag, Munchen, 19984 S.G. Entilis, V.V. Evreinov, A.V. Gorshkov, Adv. Polym. Sci. 76(1986)129-1755 A.A. Gorbunov, A.M. Skvortsov, Polymer Sci. USSR 29(1987)1025-1031 (= Vysokomol Soyed
(Russ) A29(1987)926-9316 A.M. Skvortsov, A.A. Gorbunov, Polymer Sci. USSR 28(1986)1878-1885 (= Vysokomol Soyed
(Russ) A28(1986)1686-16927 A.A. Gorbunov, A.M. Skvortsov, Polymer Sci. USSR 28(1986)2412-2419 (= Vysokomol Soyed
(Russ) A28(1986)2170-21768 A.A. Gorbunov, A.M. Skvortsov, Polymer Sci. USSR 28(1986)2722-2729 (= Vysokomol Soyed
(Russ) A28(1986)2447-24539 L.R. Snyder, in E. Heftmann (editor), “J. Chromatogr. Library 51A; Chromatography 5th edition,
fundamentals and applications of chromatography and related differential migration methods.Part A: fundamentals and techniques” 1992, A1-A68
10 H. Pasch, B. Trathnigg, “HPLC of Polymers”, Springer-Verlag, Berlin, 199811 P.J.C.H. Cools, “Characterization of Copolymers by Gradient Polymer Elution Chromatography”,
Thesis, University of Eindhoven, 1999, p5912 K. Kitama, K. Iwaguchi, S. Onishi, H. Jinno, R. Eksteen, K. Hosoya, M. Araki, N. Tanaka, J.
Chromatogr. Sci. 27(1989)72113 R. Peters, Ing. thesis, Hogeschool Limburg, The Netherlands (in dutch), 199614 G. Schultz, H. Much, H. Kruger, C. Wehrstedt, J. Liq. Chromatogr. 13(1990)1745-176315 A.V. Gorshkov, H. Much, H. Becker, H. Pasch, V.V. Evreinov, S.G. Entilis, J. Chromatogr. A
523(1990)91-10216 B. Trathnigg, M. Kollroser, Int. J. Pol. Anal. Char. 1(1995)301-313 17 H. Yun, S.V. Olesik, E.H. Marti, J. Microcolumn Sep. 11(1999)53-6118 R. Kruger, H. Much, G. Schultz, J. Liq. Chromatogr. 17(1994)3069-309019 R. Murgasova, I. Capek, E. Lathova, D. Berek, S. Florian, Eur. Polym. J. 34(1998)659-66320 T. Kitayama, M. Janco, K. Ute, R. Niimi, K. Hatada, Anal. Chem. 72(2000)1518-1522

Chapter 9188
21 D. Braun, E. Esser, H. Pasch, Int. J. Pol. Anal. Char. 4(1998)501-51622 H. Pasch, K. Rode, Polymer 39(1998)6377-638323 H.J.A. Philipsen, B. Klumperman, A.M. Herk, A.L. German, J. Chromatogr. A 727(1996)13-2524 D. Berek, Macromol. Symp. 110(1996)33-56 25 D. Berek, M. Janco, G.R. Meira, J. Polym. Sci. A: Polym. Chem. 36(1998)1363-137126 D. Berek, Prog. Polym. Sci. 25(2000)873-90827 Y. Mengerink, R. Peters, C.G. de Koster, Sj. van der Wal, H.A. Claessens, C.A. Cramers, J.
Chromatogr. A 914(2000)131-145, chapter 8 of this thesis28 D. Berek, M. Chalanyova, T. Macko, J. Chromatogr 286(1984)185-19229 Sj. van der Wal, Chromatographia 22(1986)81-8730 H. Poppe, J.C. Kraak, J. Chromatogr. 282 (1983) 399-41231 H. Claessens, “Characterization of stationary phases for reversed-phase liquid chromatography”,
thesis, University of Eindhoven, 199932 Y. Mengerink, R. Peters, M. Kerkhoff, J. Hellenbrand, H. Omloo, J. Andrien, M. Vestjens, Sj. van
der Wal, J. Chromatogr. 878(2000)45-55, chapter 4 of this thesis.
Capillary electrophoresis; Possibilities and pitfalls 189
Chapter 10Capillary zone electrophoreses as a tool for the analysis of
polyamides; possibilities and pitfalls
Summary
Linear polyamides are ionized at all pH levels. Below pH = 4 and above pH = 10
they are positively and negatively charged respectively. The possibility to use
capillary electrophoresis (CE) is investigated as a separation technique to analyze
these kinds of polymers and the potential of CE is demonstrated. However, problems
connected to unstable electrophoretic systems, using hydro-organic 1,1,1,3,3,3-
hexafluoro isopropanol (HFIP) systems, made it almost impossible to develop a
robust method. The observed problems are discussed.

Chapter10190
10.1 Introduction
Polyamide-6 and polyamide-6,6 are semi-crystalline polymers based on monomeric
units, which are connected by amide functions. Polyamide-6 is a linear chain, which
is based on the 6-aminocaproic acid based backbone, as given in figure 10.1.
Polyamide-6,6 is based on two different monomers (hexamethylene diamine and
adipic acid), which together form a slightly different backbone repeating unit as given
in figure 10.1.
H2NNH
HN
O
O
COOH
Polyamide-6
w
H 2NNH
HN
O
O
NH
C OOH
O
x
H 2NNH
HN
O
O
NH
O HN
N H2
O
y
polyamide-6,6 acid-amine:
polyamide-6,6 amine-amine:
HOOCHN
NH
HN
NHO
O
O
O
COOH
z
polyamide-6,6 acid-acid:
Figure 10.1: Structures of polyamide-6 and polyamide-6,6.
Polyamide-6 contains one primary-amine and one carboxylic-acid terminating
endgroup. Polyamide-6,6 contains also two terminating endgroups. However, this is
a distribution of two primary-amine endgroups, two carboxylic-acid endgroups and
like polyamide-6 one primary-amine and one carboxylic-acid endgroup.
Capillary zone electrophoresis is a relatively new separation technique, which
developed rapidly, after the introduction at the end of the 1970s by Everaerts [1-2]
and Jorgenson [3-5]. In theory, the separation of monocharged oligomeric /

Capillary electrophoresis; Possibilities and pitfalls 191
polymeric chains is almost unlimited, if extremely good control over the
electroosmotic flow (EOF) would be possible. Two linear chains with just one
monomeric unit differences can be separated if the EOF is exactly the opposite of
the average of the electrophoretic mobilities of both species:
( )2
1++−= LnLn
EOF
µµµ <10.1>
where µEOF is the electroosmotic mobility, µLn and µLn+1 are the mobilities of two linear
chains with n and n+1 backbone units. In a hypothetical case, with n = 500, the
linear chain with 500 backbone units (L500) will migrate to the negative pole, while a
linear chain with n = 501 will migrate to the positive pole. However, the analysis time
for such a separation would be over a month (µL500,L501 = 3.27e-10 and 3.265e-10
m2V-1s-1, Ltot = 0.3 m, Leff = 0.08 m and 30 kV). In this hypothetical case, the EOF
should be fixed at exactly –3.2675e-10 m2V-1s-1. However, if the height of the liquid
levels in capillary zone electrophoresis differ 0.01 mm, siphoning (calculated using
equation 10.2 [6]) will already influence the EOF more than the effective capillary
length in our example:
totsiphoning L
thdgl
ηρ32
2∆= <10.2>
where ρ is the buffer density in kg.m-3, g is the gravitational constant in m.s-2, ∆h is
the height difference in m, d is the capillary diameter in m, t is the time in s, η is the
viscosity in Pa.s-1 and L is the total capillary length in m.
Approximately 30 monocharged derivatized Jeff amines were separated using free
zone electrophoresis [7]. Bullock separated 80 doubly charged phthalic-anhydride-
derivatized polyethyleneglycol oligomers [8]. Separation of the oligomers and
polymer chains of a multiply charged polymer with equal charge densities is much
harder to perform with capillary zone electrophoresis. Cottet recently demonstrated
the separation of polyanilines with almost equal charge to mass ratios using non-
aqueous CE (NACE) [9]. However, to separate higher-molecular-mass oligomers
with an equal charge-to-mass ratio, the use of a sieving matrix is necessary [10].

Chapter10192
Schomburg used a chemical (cross-linked) gel to demonstrate the complete
separation of a poly(uridine 5’-phosphate) sample containing over 400 oligomers
[11-12]. Recently Zhou et al. separated up to 1300 multiply charged DNA chains
using a physical (non-cross-linked) gel, demonstrating the possibilities to read parts
of the human genome [13]. Separations of synthetic polymers have been
investigated much less frequently (see chapter 2.4).
As the linear polyamide-6 chains are ionized at all pH-levels, separation
mechanisms based on differences in electrophoretic migration behavior can be
investigated. Although liquid chromatography is the main separation technique to
characterize synthetic polyamides, capillary zone electrophoreses (CZE) and
capillary gel electrophoreses (CGE) have very high separation potentials for the
separation of such macromolecules.
In this chapter the results and observed problems of capillary electrophoresis with
1,1,1,3,3,3-hexafluoro isopropanol (HFIP) as a modifier are described. HFIP has
been used before in CE as a conductivity quencher [14]. However, no
electrophoretic problems with HFIP as a buffer modifier were reported.
10.2 Experimental
All presented results were obtained on an HP-3D instrument, equipped with a diode-
array detector (DAD, primary wavelength λ = 195 nm) and controlled by a Windows
98 workstation LC-3D version A.08.01 (Agilent, Waldbronn, Germany). Besides the
HP-3D, we also performed experiments using the PRINCE (Lauerlabs, Emmen, The
Netherlands) and the Biofocus 3000 (Biorad, Hercules, CA, USA). Water (MilliQ,
Millipore, Milford, MA, USA), HFIP (Biosolve, Valkenswaard, the Netherlands),
phosphoric acid (made with phosphoric acid 85% p.a., Baker, Deventer, The
Netherlands), formic acid (Merck, Darmstadt, Germany), lithium hydroxide (Sigma-
Aldrich, St. Louis, MO, USA), calciumchloride (Baker), methanol (Biosolve), hydroxy
ethyl cellulose (HEC 250 kD, Sigma-Aldrich) were used as buffer constituents.
Coated (CEµSILFC and µSIL-wax) and uncoated capillaries were purchased from
J&W (Flosom, CA, USA). All experiments were performed in a fume hood. In the
common polarity mode (normal-mode), polarity is defined as follows: inlet vial is

Capillary electrophoresis; Possibilities and pitfalls 193
positively charged and outlet vial is negatively charged (normal mode). At “switched
polarity” these are reversed (reversed-mode). To suppress EOF as much as
possible, capillaries were not pretreated. Tips of the polyimide coating of the
capillary were removed in all reported experiments. Capillaries were inspected
before and after experimentation using a microscope (Askania, Rathenow,
Germany).
10.3 Results and discussion
Besides some instrumental problems, non-reproducibility of all electrophoretic
systems used made it impossible to develop a robust analytical method. The
presented results were all obtained on an HP-3D system, but results obtained with
the Biofocus3000 and PRINCE were similar or worse with respect to instability.
Although sometimes a reason for unstable systems could be found, mostly we could
not give good fundamental reasons for this. Possible reasons for instability given in
the text should be seen as an initial attempt to clarify the results.
Polyamide-6 is positively charged below pH<4 and negatively charged above
pH>10. HFIP is an interesting, but very expensive solvent. Besides its excellent
solubility properties for polyamides and its UV transparency, only small amounts are
necessary. No peaks were seen using a non-aqueous separation medium of 100%
HFIP, even if perchloric acid was used as an additive. Although HFIP has a pKa
value of approximately 8.25, it seems that the polyamide is not getting charged in
this environment. This could probably be explained by the protogenic effect of HFIP.
Protons will not get stabilized as protophilic molecules are not available. An
alternative fluorinated solvent is 2,2,2-trifluoro ethanol (TFE), which is also a good
solvent for polyamide. As its boiling point is substantially higher compared to HFIP
(78 oC for TFE versus 58oC for HFIP), TFE will have more intermolecular
interactions. However, preliminary experiments revealed similar problems as for
HFIP as no peaks of polyamide-6 oligomers were obtained in a system with 80%
TFE and 20% 10mM phosphoric acid in water. Also other systems were investigated.
Saturated calciumchloride in methanol as a buffer yielded stable current, but again

Chapter10194
no peaks were obtained. Coated capillaries in combination with HFIP and acidified
phosphoric acid solution in water were also tried: again no peaks were observed.
The system investigated was water / HFIP. To obtain a good separation, the EOF
has to be zero or slightly opposite from to the migration direction of the charged
polyamides. The migration velocity of large monocharged polyamides will be small.
To obtain a low EOF and maintain protonated polyamides, low-pH values are
necessary. A typical example of this approach has been given for an HFIP / water
phosphoric acid system in figure 6.7 [15]. Some linear oligomers could be separated.
An identical result was obtained using an HFIP / water lithium-formate buffer as
given in figure 10.2a and 10.2b.
Figure 10.2a and b: Typical example of CZE of polyamide-6 at normal (a, first trace) and switchedpolarity (b, lower trace) 80% HFIP 20% water (2% formic acid / 15% 1 mM LiOH pH = 3.25). Capillary(uncoated), ID 50 µm, Ltot = 31 cm, Leff 8.5 cm, 30 kV, sample introduction: 6 s*50 mbar 1 mg (PA-6and oligomers and thiourea)/ml in 80%HFIP / 20% 2% formic acid.
min20 40 60 80 100 120 140 160 180
mAU
-10
-5
0
5
10
15
20
25
DAD1 B, Sig=195,4 Ref=300,20 (E:\Y00413AP\SAMPLE87.D)
min20 40 60 80 100 120 140 160 180
uA
-20
-17.5
-15
-12.5
-10
-7.5
-5
-2.5
HPCE1 C, Current (E:\Y00413AP\SAMPLE87.D)
min20 40 60 80 100 120 140 160 180
m A U
0
20
40
60
80
100
120
140
DAD1 B , S ig=195 ,4 Re f=300 ,20 (E : \Y00413AP\SAMPLE88 .D)
min20 40 60 80 100 120 140 160 180
uA
0
2.5
5
7.5
10
12.5
15
17.5
HPCE1 C , Cu r ren t (E : \Y00413AP\SAMPLE88 .D)
Figure 10.2a
Figure 10.2b

Capillary electrophoresis; Possibilities and pitfalls 195
Both electropherograms were recorded using the same conditions, but switched
polarities. The electrophoretic mobility of the polyamide-6 oligomers is given in
figure 10.3.
Figure 10.3: Mobility of the linear oligomers.
The current of a typical, but not reproducible problematic sequence run is given in
figure 10.4, where the influence of the pH was investigated by changing the lithium-
hydroxide concentration in the aqueous part of the buffer. Runs were not executed at
increasing pH-values, but 1st run = pH = 2.4, 2nd run pH = 2.6, 3rd run pH = 2.7, 4th
run pH = 3.0, 5th run pH = 2.1 and 6th run pH = 2.2 (figure 10.4b). Each normal mode
run was directly succeeded with a run at switched polarity at the same pH. Some
remarks about these experiments can be made.
mobility of linear oligomers
y = 5E-07x-0.7843
R2 = 0.9991
0.0E+00
1.0E-09
2.0E-09
3.0E-09
4.0E-09
5.0E-09
6.0E-09
7.0E-09
8.0E-09
0 2000 4000 6000 8000 10000 12000 14000
Mw
u (m
2.V
-1.s
-1)

Chapter10196
pH Current in normal mode Current in reversed mode
(switched polarity)
2.09
min100 200 300 400 500
uA
0
0.2
0.4
0.6
0.8
1
1.2
HPCE1 C, Current (E:\Y01207AP\037_1301.D)
min100 200 300 400 500
uA
-1.2
-1
-0.8
-0.6
-0.4
-0.2
0
HPCE1 C, Current (E:\Y01207AP\037_1401.D)
2.20
min100 200 300 400 500
uA
0
0.2
0.4
0.6
0.8
1
1.2
1.4
HPCE1 C, Current (E:\Y01207AP\038_1501.D)
min50 100 150 200 250 300 350
uA
-1.6
-1.4
-1.2
-1
-0.8
-0.6
-0.4
-0.2
0
HPCE1 C, Current (E:\Y01207AP\038_1601.D)
2.42
min100 200 300 400 500
uA
0
0.25
0.5
0.75
1
1.25
1.5
1.75
2
HPCE1 C, Current (E:\Y01207AP\039_0501.D)
min100 200 300 400 500
uA
-4.5
-4
-3.5
-3
-2.5
-2
-1.5
-1
-0.5
0
HPCE1 C, Current (E:\Y01207AP\039_0601.D)
2.57
min0 20 40 60 80 100 120
uA
0
0.5
1
1.5
2
2.5
HPCE1 C, Current (E:\Y01207AP\040_0701.D)
min100 200 300 400 500
uA
-4
-3.5
-3
-2.5
-2
-1.5
-1
-0.5
0
HPCE1 C, Current (E:\Y01207AP\040_0801.D)
2.66
min100 200 300 400 500
uA
0
0.5
1
1.5
2
2.5
3
HPCE1 C, Current (E:\Y01207AP\041_0901.D)
min100 200 300 400 500
uA
-3.5
-3
-2.5
-2
-1.5
-1
-0.5
0
HPCE1 C, Current (E:\Y01207AP\041_1001.D)
2.95
min100 200 300 400 500
uA
0
1
2
3
4
HPCE1 C, Current (E:\Y01207AP\042_1101.D)
min100 200 300 400 500
uA
-6
-5
-4
-3
-2
-1
0
HPCE1 C, Current (E:\Y01207AP\042_1201.D)
Figure 10.4: Influence of LiOH concentration (pHaq = 2.0-3.0), conditions (HP3D): 30 kV, buffer: 80%(v/v) HFIP / 20% water (1% formic acid). Capillary (uncoated), ID = 50 µm, Ltot = 26.5 cm, Leff = 34 cm,sample: 1.5 mg PA-6 mix and 0.3 mg thiourea/ml 80% HFIP / 20% water (0.1% formic acid). Flush 30min buffer, 30 sec*50 mbar sample and 10 sec*20 mbar buffer. Detection λ = 195 nm (polyamide andthiourea) and λ = 230 nm (thiourea).

Capillary electrophoresis; Possibilities and pitfalls 197
Looking at the electropherograms in the normal mode, peaks of the linear oligomeric
polyamide-6 chains were only obtained at a pH of 2.4, although the baseline and
current were not very stable (figure 10.5a and 10.5b). All other electropherograms of
the normal mode did not show any polyamide-6 oligomers or polymer at all. This is a
more or less repeatable unexplained problem as we sometimes observed that a first
run on a new capillary worked better (as described the pH = 2.4 run was the first
electropherogram recorded), compared to every consecutive run.
m i n0 5 0 1 0 0 1 5 0 2 0 0 2 5 0
m A U
-40
-20
0
2 0
4 0
D A D 1 B , S i g = 1 9 5 , 4 R e f = 3 0 0 , 2 0 ( E : \ Y 0 1 2 0 7 A P \ 0 3 9 _ 0 5 0 1 . D )
Figure 10.5a: pH = 2.4, conditions as in figure 10.4.
Looking at the reversed-mode experiments (switched polarities), it was observed that
the EOF was reversed, i.e. it moves from the negative pole to the positive pole. The
pH dependency of the EOF is not very stable, although the capillary was stabilized
at the experimental conditions for more than 10 hours (figure 10.5b and figure 10.6,
EOF measured with thiourea (at λ = 230 nm), which was present in the injected
polyamide-6 solution). At a pH > 2.4 and switched polarities, higher polyamides
become visible. However, no reasonable explanation can be given for this effect and
other CE-runs could not duplicate this effect. EOF was seen in all these reversed
mode experiments. Current in the normal mode does not look as stable as in the
reversed mode.

Chapter10198
Figure 10.5b: Switched polarities, conditions as in figure 10.4.
Figure 10.6: Influence of EOF on pH.
The polyamide has to migrate through the entire capillary in the reversed mode, but
leaves the capillary directly at the sample introduction side in the normal mode.
Therefore, the influence of the injected amount on the stability using the same
capillary of the previous experiments, was investigated. Again, results were not
consistent (figure 10.7).
min0 10 20 30 40 50 60 70 80 90
mAU
-20
-10
0
10
20
30
40
DAD1 B, Sig=195,4 Ref=300,20 (D:\U-DRIVE\HPDATA\Y01207AP\037-1401.D)
pH=2.09
min0 10 20 30 40 50 60 70 80 90
mAU
-20
-10
0
10
20
30
40
DAD1 B, Sig=195,4 Ref=300,20 (D:\U-DRIVE\HPDATA\Y01207AP\038-1601.D)
pH=2.20
min0 10 20 30 40 50 60 70 80 90
mAU
-20
-10
0
10
20
30
40
DAD1 B, Sig=195,4 Ref=300,20 (D:\U-DRIVE\HPDATA\Y01207AP\039-0601.D)
pH=2.42
min0 10 20 30 40 50 60 70 80 90
mAU
-20
-10
0
10
20
30
40
DAD1 B, Sig=195,4 Ref=300,20 (D:\U-DRIVE\HPDATA\Y01207AP\040-0801.D)
pH=2.57
min0 10 20 30 40 50 60 70 80 90
mAU
-20
-10
0
10
20
30
40
DAD1 B, Sig=195,4 Ref=300,20 (D:\U-DRIVE\HPDATA\Y01207AP\041-1001.D)
pH=2.66
min0 10 20 30 40 50 60 70 80 90
mAU
-20
-10
0
10
20
30
40
DAD1 B, Sig=195,4 Ref=300,20 (D:\U-DRIVE\HPDATA\Y01207AP\042-1201.D)
pH=2.95
m i g r a t i o n t i m e m in
5 . 0
1 0 . 0
1 5 . 0
2 0 . 0
2 5 . 0
2 2 . 2 2 . 4 2 . 6 2 . 8 3
p H (1 % f o r m i c a c i d -> L i O H to a d j u s t p H )
EO
F (
min
)

Capillary electrophoresis; Possibilities and pitfalls 199
Figure 10.7: Influence of injected sample. Conditions as in figure 10.4 (pH = 3.0).
m i n0 25 50 75 1 0 0 1 2 5 1 5 0 1 7 5 2 0 0 2 2 5
m A U
-5
0
5
10
15
D A D 1 B , S i g = 1 9 5 , 4 R e f = 3 0 0 , 2 0 ( D : \ U - D R I V E \ H P D A T A \ Y 0 1 2 1 3 A P \ 0 3 7 - 0 1 0 1 . D )
m i n0 25 50 75 1 0 0 1 2 5 1 5 0 1 7 5 2 0 0 2 2 5
uA
0
1
2
3
4
5
H P C E 1 C , C u r r e n t ( D : \ U - D R I V E \ H P D A T A \ Y 0 1 2 1 3 A P \ 0 3 7 - 0 1 0 1 . D )
10.7b: sample introduction 15 s* 30 mbar
min0 25 50 75 100 125 150 175 200 225
mAU
0
2
4
6
DAD1 B, Sig=195,4 Ref=300,20 (D:\U-DRIVE\HPDATA\Y01213AP\038-0301.D)
min0 25 50 75 100 125 150 175 200 225
uA
0
1
2
3
4
5
6
HPCE1 C, Current (D:\U-DRIVE\HPDATA\Y01213AP\038-0301.D)
10.7c: sample introduction 30 s* 30 mbar
min0 25 50 75 100 125 150 175 200 225
mAU
-2
0
2
4
6
8
10
DAD1 B, Sig=195,4 Ref=300,20 (D:\U-DRIVE\HPDATA\Y01213AP\038-0401.D)
min0 25 50 75 100 125 150 175 200 225
uA
0
1
2
3
4
5
6
HPCE1 C, Current (D:\U-DRIVE\HPDATA\Y01213AP\038-0401.D)
10.7d: sample introduction 30 s* 50 mbar
min50 100 150 200 250
mAU
-15
-10
-5
0
5
10
DAD1 B, Sig=195,4 Ref=300,20 (E:\Y01213AP\037_0201.D)
min50 100 150 200 250
uA
0
1
2
3
4
5
HPCE1 C, Current (E:\Y01213AP\037_0201.D)
10.7a: sample introduction 7.5 s* 30 mbar

Chapter10200
At the lowest sample introduction (30 s*7.5 mbar, figure 10.7a), peaks appeared in
the normal mode and current was more or less stable. At an increased sample
introduction (30 sec*15 mbar, figure 10.7b) no peaks appeared. No stable current
was obtained during this particular problematic electropherogram, which is also more
or less repeatable. Increasing the introduced sample amount again (30 sec*30 mbar,
figure 10.7c and 30 sec*50 mbar, figure 10.7d), normal peaks appeared. So it could
be concluded that the amount of sample introduced in the capillary was not the
primary problem. However, the main problem was not found.
10.3.1 Influence of pH on system stability
It was found that the pH in combination with the intensity of degassing played an
important role in system stability. Different amounts of trifluoroacetic acid were used
in the aqueous part of the buffer. Using 10% TFA in the aqueous part did not yield a
stable system. After a few seconds the current dropped as given in figure 10.8.
Figure 10.8: Influence of high TFA concentration on stability, Conditions HP3D: 30 kV, buffer: 80%HFIP, 20% water (10% trifluoroacetic acid), capillary (uncoated), ID = 50 µm, Leff = 24 cm, Ltot= 32.5cm, sample: 1.5 mg PA-6 mix and 0.3 mg thiourea/ml 80% HFIP / 20% water (0.1% formic acid): flush15 min buffer, 10 sec*50 mbar sample and 10 sec*50 mbar buffer, no degassing.
However, using lower concentrations of TFA the current did not drop so fast and this
problems was not observed if 0.01% TFA was used. 0.1% TFA could be used also,
but the buffer needed to be degassed with helium before use. A helium purge of
min0 2 4 6 8 10 12 14 16 18
mAU
-50
0
50
100
150
200
250
DAD1 B, Sig=195,4 Ref=300,20 (E:\Y00510AP\TFA00001.D)
20.
043
min0 2 4 6 8 10 12 14 16 18
uA
-25
-20
-15
-10
-5
HPCE1 C, Current (E:\Y00510AP\TFA00001.D)

Capillary electrophoresis; Possibilities and pitfalls 201
HFIP is not straightforward due its low boiling point (58oC). Figure 10.9 shows an
identical problem, where formic acid and HEC were used as additives.
Figure 10.9: Conditions HP3D: 30kV, buffer: 80% HFIP, 20% water 0.5% HEC; 5% formic acid and 6g/L LiOH, capillary: uncoated ID = 50 µm, Leff = 24 cm, Ltot = 32.5 cm, sample: 1.5 mg PA-6 mix and0.3 mg thiourea/ml 80% HFIP / 20% water (0.1% formic acid): flush 30 min buffer, 30sec*50mbarsample 10 sec*20 mbar buffer.
By degassing the buffer the current could be held constant. These air problems were
much more pronounced on the Biofocus 3000, probably due to presence of so-called
hot-spots [16], which are necessary for the liquid cooling of the capillary.
min0 2 4 6 8 10 12 14 16 18
mAU
-2.5
-2
-1.5
-1
-0.5
0
DAD1 B, Sig=195,4 Ref=300,20 (F:\00MIQ12\Y01228AJ\041-0101.D)
min0 2 4 6 8 10 12 14 16 18
uA
0
2
4
6
8
10
12
HPCE1 C, Current (F:\00MIQ12\Y01228AJ\041-0101.D)
min0 2 4 6 8 10 12 14 16 18
mAU
-50
0
50
100
150
200
DAD1 B, Sig=195,4 Ref=300,20 (F:\00MIQ12\Y01228AK\041-0101.D)
min0 2 4 6 8 10 12 14 16 18
uA
0
2
4
6
8
10
12
14
HPCE1 C, Current (F:\00MIQ12\Y01228AK\041-0101.D)
min100 200 300 400 500
mAU
0
10
20
30
40
50
DAD1 B, Sig=195,4 Ref=300,20 (F:\00MIQ12\Y01228AM\041-0101.D)
min100 200 300 400 500
mAU
0
2
4
6
8
DAD1 E, Sig=235,4 Ref=300,20 (F:\00MIQ12\Y01228AM\041-0101.D)
min100 200 300 400 500
uA
0
2.5
5
7.5
10
12.5
15
HPCE1 C, Current (F:\00MIQ12\Y01228AM\041-0101.D)
10.9a: no degassing
10.9b: 10 min ultrasonic agitation
10.9b: after Helium purge/reflux

Chapter10202
10.3.2 Capillary Gel Electrophoreses
In principle CGE will not yield any advantage to the ultimate separation power of
capillary electrophoresis as given in equation 10.1. However, it could be a tool to
improve system stability and to influence EOF. Agarose was not soluble in HFIP.
However, hydroxy ethyl cellulose (HEC 250 kD) could be used. Phosphate ions
were not compatible with HEC at high HFIP concentrations, but TFA or formic acid in
combination with lithium hydroxide could be used. As given in figure 10.10 the
amount of HEC influenced separation. When higher HEC concentrations were used,
the EOF approached zero. This effect in combination with hot spots [16] could be the
main problem for the worse looking electropherograms at high HEC concentrations.
System instability was also observed during these kinds of experiments.
Figure 10.10: First part: continuing on next page.
min0 50 100 150 200 250
mAU
0
20
DAD1 B, Sig=195,4 Ref=300,20 (F:\01MIQ01\Y10137AT\037-0101.D)
0% HEC 250 kD in water
min0 50 100 150 200 250
mAU
0
10
20
DAD1 B, Sig=195,4 Ref=300,20 (F:\01MIQ01\Y10137AT\038-0201.D)
0.1% HEC 250 kD in water
min0 50 100 150 200 250
mAU
0
10
20
DAD1 B, Sig=195,4 Ref=300,20 (F:\01MIQ01\Y10137AT\039-0301.D)
0.2% HEC 250 kD in water
min0 50 100 150 200 250
mAU
0
5
10
DAD1 B, Sig=195,4 Ref=300,20 (F:\01MIQ01\Y10137AT\040-0401.D)
0.3% HEC 250 kD in water
min0 50 100 150 200 250
mAU
-5
0
5
DAD1 B, Sig=195,4 Ref=300,20 (F:\01MIQ01\Y10137AT\041-0501.D)
0.4% HEC 250 kD in water

Capillary electrophoresis; Possibilities and pitfalls 203
Figure 10.10: Influence of HEC concentration, conditions: 80% HFIP / 20% water (0.1% TFA and x%HEC 250 kD, He-purge; capillary (uncoated), ID 50 µm, Leff = 24.5 cm, Ltot = 33 cm, 30 kV, sampleintroduction 1.5 mg PA-6 and oligomers/ml 80% HFIP / 20% 0.01% TFA, preconditioning: 30 minflush buffer; sample introduction: 25 mbar*20 s sample, 20 mbar*10 s buffer.
10.3.3 Potential power of CE
The potential power of capillary electrophoreses is demonstrated in figure 10.11.
Figure 10.11: Substructures, 80% HFIP / 20% water (1% formic acid / 2.5% 1 M LiOH; 0.02% HEC),capillary (uncoated) ID = 50 µm, Ltot = 31 cm, Leff = 22.5 cm, sample introduction: 15 min flush, 15 s*50mbar (1 mg PA-6 and oligomers/ml 80% HFIP / 20% 1% formic acid in water), 10 s*50 mbar buffer.
min100 200 300 400 500
mAU
-5
0
5
10
15
DAD1 B, Sig=195,4 Ref=300,20 (F:\01MIQ01\Y10137AT\042-0601.D)
0.4% HEC 250 kD in water
min100 200 300 400 500
mAU
0
2
4
6
DAD1 B, Sig=195,4 Ref=300,20 (F:\01MIQ01\Y10137AT\037-0701.D)
0.5% HEC 250 kD in water
min100 200 300 400 500
mAU
-5
0
5
DAD1 B, Sig=195,4 Ref=300,20 (F:\01MIQ01\Y10137AT\038-0801.D)
0.7% HEC 250 kD in water
min100 200 300 400 500
mAU
-10
-7.5
-5
-2.5
0
DAD1 B, Sig=195,4 Ref=300,20 (F:\01MIQ01\Y10137AT\037-0901.D)
1.0% HEC 250 kD in water
min0 25 50 75 100 125 150 175 200 225
mAU
0
2
4
6
8
10
12
14
DAD1 B, Sig=195,4 Ref=450,100 (E:\Y00324AH\HEC00009.D)
min0 25 50 75 100 125 150 175 200 225
uA
0
1
2
3
4
5
6
HPCE1 C, Current (E:\Y00324AH\HEC00009.D)

Chapter10204
65 linear polyamide-6 oligomers were separated and an unknown oligomeric series
could be determined in this polyamide-6 test sample (see the small peaks just in
front of the linear PA-6 oligomers between 20-30 min).
Figure 10.12: Rescaled electropherogram of figure 10.11.
The best separation performed during the experiments is given in figure 10.13a.
Approximately 90-100 linear polyamide-6 chains could be separated. Figure 10.13b
shows an attempt to duplicate the electropherogram of figure 10.13a.
Figure 10.13: Separation of 90 linear polyamide-6 oligomers / polymers, 80% HFIP / 20% water (50mM LiClO4), capillary (uncoated), ID = 50 µm, Ltot = 34 cm, Leff = 25.5 cm, sample 1.5 mg/ml in 80%HFIP / 20% water (5 mM LiClO4)+0.3 mg/ml thiourea. Preconditioning: 30 min flush buffer; 25mbar*20 s sample, 20 mbar*10 s buffer.
m i1 5 2 0 2 5 3 0 3 5 4 0 4 5
m AU
0
2
4
6
8
1 0
1 2
D A D 1 B , S i g = 1 9 5 ,4 R e f = 4 5 0 , 1 0 0( E : \ Y 0 0 3 2 4 A H \ H E C 0 0 0 0 9 . D )
min0 50 100 150 200 250 300 350
mAU
-5
-2.5
0
2.5
5
7.5
10
12.5
DAD1 B, Sig=195,4 Ref=300,20 (F:\01MIQ02\Y10207AP\037-0101.D)
min0 50 100 150 200 250 300 350
mAU
-1.2
-1
-0.8
-0.6
-0.4
-0.2
DAD1 E, Sig=235,4 Ref=300,20 (F:\01MIQ02\Y10207AP\037-0101.D)
min0 50 100 150 200 250 300 350
uA
0
1
2
3
4
5
6
HPCE1 C, Current (F:\01MIQ02\Y10207AP\037-0101.D)
min0 50 100 150 200 250 300 350
mAU
-5
0
5
10
15
DAD1 B, Sig=195,4 Ref=300,20 (F:\01MIQ02\Y10207AP\038-0301.D)
min0 50 100 150 200 250 300 350
mAU
-5
0
5
10
15
DAD1 E, Sig=235,4 Ref=300,20 (F:\01MIQ02\Y10207AP\038-0301.D)
min0 50 100 150 200 250 300 350
uA
-5
0
5
10
15
HPCE1 C, Current (F:\01MIQ02\Y10207AP\038-0301.D)
Figure 10.13a
Figure 10.13b: attempt to duplicate 10.12a

Capillary electrophoresis; Possibilities and pitfalls 205
10.3.4 Possibilities to separate polyamide-6,6 series
A very interesting feature of CE is the possibility to separate opposite charged
polymeric series, such as polyamide-6,6. At neutral pH the polyamide-6,6 chains
with two primary-amine endgroups will be double positively charged, chains with two
carboxylic-acid endgroups will be double negatively charged and linear chains with
one carboxylic-acid and on primary-amine endgroup will be neutrally charged. As
HFIP is an acid itself (pKa ≈ 8.25) large amounts of lithium hydroxide are necessary
to obtain neutral conditions. Figure 10.14 demonstrates a typical separation of
polyamide-6,6 at neutral pH.
min0 20 40 60 80 100 120
mAU
-5
0
5
10
15
20
25
DAD1 B, Sig=195,4 Ref=300,20 (E:\Y01204AP\020_0101.D)
Diacids of polyamide-6,6
Diamines of polyamide-6,6
Cyclics and Acid-amines of polyamide-6,6
min0 20 40 60 80 100 120
uA
-30
-25
-20
-15
-10
-5
HPCE1 C, Current (E:\Y01204AP\020_0101.D)
Figure 10.13: Separation of polyamide-6,6 at neutral pH, capillary (uncoated) ID = 50 µm, Ltot = 33 cm,Leff = 24 cm, 10 kV, buffer 80% HFIP / 20% water (1M LiOH) i = 28 µA, Sample low-Mw PA-66.
10.4 Conclusions / remarks
Capillary electrophoresis has a high potential to separate low- and high-molecular-
mass polyamides. Different series of polyamide 6,6 oligomers could be separated
based on endgroup functionality and number of backbone units. However, a stable
method for the separation of polyamide-6 oligomers / polymer could not be

Chapter10206
developed due to repeatability problems. Some remarks can be made, which could
possibly be part of the problems observed with respect to this system instability.
The polyamide leaves the capillary at the inlet vial if the reversed polarity is used
and the EOF is reversed. However, also experiments with normal EOF showed
unstable systems.
Systems at low pH are very sensitive to gas bubble formation. At low or zero EOF
the thermal heating on so-called hot spots can have a major impact on this bubble
formation.
The protogenic HFIP has a very low boiling point (b.p. ≈ 58oC), indicating that almost
no intermolecular interactions occur. However, an experiment with TFE (b.p.≈ 78oC)
did not yield consistent results either.
The first run on a new capillary showed lesser problems than the consecutive runs,
which could indicate unstable capillaries.
The best electropherograms were obtained if the current was stable.
References
1. F.E.P. Mikkers, F.M. Everaerts, T.P.E.M. Verheggen, J. Chromatogr 169(1979)1-102. F.E.P. Mikkers, F.M. Everaerts, T.P.E.M Verheggen, J. Chromatogr 169(1979)11-203. J.W. Jorgenson, K.D. Lukacs, Anal. Chem. 53(1981)1298-13024. J.W. Jorgenson, K.D. Lukacs, J. Chromatogr. 218(1981)209-2165. J.W. Jorgenson, K.D. Lukacs, J. High Resol. Chrom. 4(1981)230-2316. C.A. Lucy, K.K.C. Yeung, X. Peng, D.D.Y. Chen, LC-GC mar(1999)148-1567. L. N. Amankwa, J. Scholl, W. G. Kuhr, Anal. Chem. 62(1990)2189-21938. J. Bullock, J. Chromatogr. 645(1993)169-1779. H. Cottet, M.P. Struijk, J.L.J. van Dongen, H.A. Claessens, C.A. Cramers, J. Chromatogr. A
915(2001)241-25110. P. Shieh, N. Cooke, A. Gutman in M.G. Khaledi (editor), “High Performance Capillary
Electrophoresis”, Wiley, 1998, p185-22211. J.A. Lux, H-F Yin, G. Schomburg, J. High Resol. Chromatogr. 13(1990) 436-43712. J.A. Lux, H-F Yin, G. Schomburg, J. High Resol. Chromatogr. 13(1990) 624-62713. H. Zhou, A.W. Miller, Z. Sosic, B. Buchholz, A.E. Barron, L. Kotler, B.L. Karger, Anal. Chem.
72(2000)1045-105214. A. Bossi, P.G. Righetti, J. Chromatogr. A 840(1999)117-12915. Y. Mengerink, Sj. van der Wal, H.A. Claessens, C.A. Cramers, J. Chromatogr. A 871(2000)259-
268, chapter 6 of this thesis16. X. Xu, W. Th. Kok, H. Poppe, J. Chromatogr. A 786(1997)333-345

207
Summary
Polyamides form one of the major synthetic classes of polymers, with respect to
volume of consumption. Due to the continuously driving force of scientists to improve
and control the polymer performance and to broaden their range of applications,
better analytical tools are needed to support these goals. Separation techniques
coupled with spectrometric detectors are more and more used to elucidate complex
questions with respect to the chemical structure of the polymers.
Size-exclusion chromatography (SEC) is often used to determine the molecular-
mass distribution of all kinds of polymers. By using multiple detection techniques
other parameters, such as chemical-composition distributions can be determined.
Non-SEC based separation techniques, for example interaction chromatography,
critical chromatography and electrophoresis have been used to determine the
chemical composition distribution too. These latter techniques can also be used to
determine low-molecular-mass components, differences in architecture or endgroup
functionality. However, non-SEC based separation techniques have been mainly
used for easily soluble polymers.
Polyamides are a group of polymers, which are not soluble in commonly used
chromatographic solvents, such as water, acetonitrile, methanol or tetrahydrofuran.
Consequently, the literature contains few studies on non-SEC based separation
techniques for polyamides. This thesis describes these kinds of separation
techniques to analyze polyamides in more detail. New ideas are being suggested to
enhance the utility of non-SEC based separation techniques in general. Polyamide-6
is used as the polyamide of study, as it has well defined properties. Polyamide-6,6
was used to demonstrate the potential to separate a more complex polymeric
sample.
The separation power of interaction chromatography for low-molecular-mass
oligomers of polyamide-6 (n≤6) is demonstrated. These oligomers are often well
soluble in typical chromatographic solvents, such as water and acetonitrile.
Extraction or precipitation / redissolution is often used to maintain the typical
advantages of these chromatographic solvents. A new injection technique was

208
developed, the so-called sandwich injection, to circumvent the before mentioned
time consuming sample pretreatment steps. The polyamide is dissolved in formic
acid and directly injected into the mobile phase, which consists of an aqueous
phosphoric acid solution with 1% acetonitrile. As the polyamide is sandwiched
between two zones of formic acid, it will not precipitate in the connecting capillaries,
but in the chromatographic column. It turned out that the first six linear and cyclic
oligomers of polyamide-6 were fully recovered, as they gave identical results in a
hexafluoro-isopropanol (HFIP) gradient as with the precipitation / redissolution
pretreatment. Using just extraction as a pretreatment method, only the first three
cyclic oligomers were fully recovered. Partially eluting higher polyamide oligomers
could be removed from the column by applying a post-gradient injection zone of 50
µl formic acid. If a 250 µl formic acid zone was used, even the high-molecular-mass
polyamide-6 could be removed from the column, maintaining chromatographic
column performance.
Low-molecular-mass oligomeric cyclic polyamides were determined using UV
detection. As only the amide function is responsible for the UV absorbance, group-
equivalent UV absorbance could be used to quantitatively determine the
concentration of these cyclic oligomers. The linear oligomers are not so easily
determined in typical representative polyamide-6 samples. Their concentration is
significantly lower and therefore a post-column OPA (o-phthalic dicarboxaldehyde)
reaction is used to derivatize these molecules. As only the OPA-group contributes to
the total fluorescence intensity a similar approach as applied with UV detection was
used to predict the sensitivity. Although this approach is very useful for semi-
quantitative results, quench factors were needed to improve the accuracy.
Many authors observed the irregular elution behavior of the cyclic monomer
compared to the higher cyclic oligomers. However, no convincing explanation was
given so far. By comparing different columns and by comparing molecular
descriptors the large exposed / accessible hydrophobic surface of the cyclic
monomer could be established as the cause of this unexpected phenomenon.
Gradient optimization to separate the first six cyclic oligomers from the linear
oligomers was investigated, using the linear solvent strength model. The cyclic
monomer and the cyclic dimer turned out to be fast eluting components, with a
significant non-linear retention behavior. Resolution between the different

209
components could be predicted with an average error of approximately 0.4 resolution
units, using two initially programmed gradient runs.
Incomplete recoveries did not enable the determination of higher oligomers (n≥6) by
the sandwich injection. Thus, more exotic mobile phases are necessary to dissolve
and elute the polyamide. Every solvent for polyamide-6 has chromatographic, safety,
environmental or economic drawbacks. HFIP and formic acid are frequently applied
solvents for polyamides and were compared as mobile phase modifiers in
combination with octadecyl-modified silica-based stationary phases. Formic acid
turned out to be a better chromatographic solvent with respect to loadability and
efficiency. However, due to the lack of UV transparency, the non-linear evaporative
light-scattering detector (ELSD) had to be used. HFIP has much better UV
transparency and showed better selectivities at the applied gradient conditions with
respect to the separation of linear and cyclic oligomers. The major drawbacks of
HFIP are its high price (1000 – 3000 US$/l) and the lack of information on long term
health effects.
As the mass transfer of higher-molecular-mass compounds plays an important role in
column efficiency the utilities of some new octadecyl-modified stationary phases
were investigated. A non-porous silica (NPS) column with 1.5 µm particles, a
pellicular column with a 0.25 µm porous layer on a 5 µm impenetrable core and a
monolithic column were tested. In comparison with conventional columns packed
with totally porous micro particles, all these phases could give less mass transfer
problems at higher flow rates. Problems with the hardware of the pellicular column
made it impossible to obtain adequate results. Both the NPS as the monolith column
could be used for the separation of higher-molecular-mass oligomers. Although
higher oligomers could be separated, a complete separation of all molecules present
in the polyamide-6 sample could not be obtained. Approximately 90-100 polyamide-6
oligomers were separated.
Using critical chromatography, polyamide can be separated solely based on
endgroup functionality.
For the separation of the cyclic and linear chains of polyamide-6 a normal-phase
separation system was developed using formic acid and 1-propanol as the mobile

210
phase constituents. The ELSD detector turned out to give a response independent of
the molecular mass. However, due do different peak widths of the linear and cyclic
molecules and the non-linear character of the ELSD, a peak width / area correction
equation had to be developed to improve accuracy.
The separation based on differences in endgroup functionality of polyamide-6,6 was
more complex and was performed on a reversed-phase system with HFIP and 10
mM phosphoric acid in water. Three different optimization parameters were used to
obtain critical conditions. First the percentage HFIP and the column temperature
were optimized. Thereafter, flow was used as a pressure regulator. Pressure
influences the preferential adsorption of one of the mobile phase constituents and is
therefore a very suitable parameter to fine tune the mobile phase / stationary phase
equilibrium. Because there is a pressure drop across the column, this also implies
that there are no real critical conditions along the total column. At the top of the
column, the interaction is the main separation mechanism, which is counteracted at
the end of the column, where exclusion is the main separation mechanism. These
three parameters (%HFIP, T and ∆P) do not influence selectivity between the
endgroups to a great extent. Therefore, the phosphoric acid concentration in the
aqueous part of the mobile phase was investigated to modify selectivity, as the
endgroup interaction was probably based on ion-exchange effects. It turned out that
the phosphoric acid concentration solely influenced the amine interaction with the
stationary phase. This opened the possibility to perform a critical gradient, where the
phosphoric acid concentration changed from 0 to 50 mM within 40 minutes. During
this gradient the backbone units of the linear polyamide-6,6 chains behaved as they
would have done during isocratic critical chromatography.
An isocratic-gradient method development procedure is proposed to circumvent
polymer recovery problems. After the critical separation a gradient towards exclusion
conditions was used to check if all polymer had been eluted from the column.
Quantification of the critical separation of polyamide-6,6 is performed using UV
detection. As only the amide-function of the polyamide absorbs UV light, low-
molecular-mass polyamide will give less response compared to higher-molecular-
mass polyamide. For polyamide-6,6 with a molecular mass higher than 1 kD this
systematic error is less than 10%. To perform correct quantification, the molecular-
mass distribution underneath each peak of the linear chains with different

211
functionalities needs to be determined, unless the molecular-mass distribution of the
different linear chains is assumed to be identical.
Electrophoresis is the main separation technique for high-molecular-mass, multiply-
charged biomolecules, such as peptides, proteins or DNA. The possibilities to use
this separation technique for the determination of linear monocharged synthetic
polymers were investigated using aqueous HFIP. The potential of this separation
technique is extremely high and approximately 100 linear chain oligomers could be
separated. In theory this could be even extended, however, due to the lack of control
over the EOF this was impracticable. Moreover, the stability of the system was
insufficient, making it impossible to develop a robust method.
Summarizing, it can be concluded that non-SEC based chromatographic separation
techniques can be used to obtain important quantitative data of polyamide-6 for the
polymer scientist. Chromatographically favorable solvents such as water and
acetonitrile can be used to determine low-molecular-mass components like
oligomers (n≤6). More exotic mobile phase modifiers are necessary to determine
higher-molecular-mass parts of the polymer, including endgroup functionality.

212

213
Samenvatting
Polyamide is een van de meest gebruikte synthetische polymeren. Doordat
wetenschappers continue het polymeer trachten te verbeteren en breder toepasbaar
willen maken, zijn er betere analyse technieken nodig. Scheidingstechnieken
gekoppeld met spectrometrische detectoren worden steeds vaker gebruikt om
complexe vraagstellingen m.b.t. de chemische structuur van het polymeer te
verklaren.
Size exclusie chromatografie (SEC) wordt vaak gebruikt om de moleculaire massa
verdeling van veel verschillende soorten polymeren te bepalen. Door gebruik te
maken van meerdere detectie technieken kunnen ook andere parameters bepaald
worden, zoals b.v. de chemische samenstellingsverdeling.
Niet op exclusie gebaseerde scheidingstechnieken, zoals interactie chromatografie,
kritische chromatografie en electrophorese zijn ook reeds gebruikt om de chemische
samenstellingsverdeling te bepalen. Deze laatste technieken kunnen ook worden
gebruikt om laag moleculaire componenten te bepalen of om b.v. verschillen in
architectuur of eindgroep functionaliteiten aan te tonen. Deze niet op exclusie
gebaseerde scheidingstechnieken worden echter voornamelijk toegepast voor
eenvoudig oplosbare polymeren.
Polyamide is een polymeer dat niet oplosbaar is in normale chromatografische
oplosmiddelen, zoals water, acetonitrile, methanol of tetrahydrofuraan. Daardoor
geeft de literatuur maar weinig niet op exclusie gebaseerde scheidingstechnieken
voor polyamides. Dit proefschrift beschrijft deze vorm van scheidingstechnieken om
polyamides gedetailleerder te analyseren. Nieuwe ideeën worden aangedragen voor
verbeterde bruikbaarheid van deze scheidingstechnieken voor de analyse van
polymeren in het algemeen. Polyamide-6 is gebruikt als modelpolymeer, omdat het
een goed gedefinieerd polymeer is. Polyamide-6,6 werd gebruikt als voorbeeld voor
meer complexere polymeer scheidingen.
De mogelijkheden van interactie chromatografie voor de scheiding van de
oligomeren van polyamide-6 met een lage moleculaire massa zijn bestudeerd. Deze
oligomeren lossen goed op in normale chromatografische oplosmiddelen, zoals

214
water en acetonitril. Extractie of oplossen / neerslaan wordt vaak toegepast om de
inherente voordelen van deze chromatografische eluentia optimaal te benutten. De
nieuwe sandwich injectie methode werd ontwikkeld om de bovenstaande tijdrovende
monstervoorbewerking te omzeilen. Het polyamide wordt opgelost in mierezuur en
direct in de mobiele fase geï njecteerd welke bestaat uit een waterige fosforzuur
oplossing met 1% acetonitril. Omdat het polyamide is gesandwicht tussen twee
mierezuur zones, slaat het niet neer in het capillair tussen de injector en de kolom,
maar op de chromatografische pakking in de kolom. Het blijkt dat de eerste zes
lineaire en cyclische oligomeren van polyamide-6 volledig elueren, aangezien er
identieke resultaten werden verkregen in vergelijking met een hexafluoroisopropanol
(HFIP) gradiënt en met oplossen / neerslaan. Indien extractie wordt gebruikt als
monstervoorbewerking, kunnen alleen de eerste drie cyclische oligomeren
kwantitatief worden bepaald. Gedeeltelijk eluerende hogere polyamide oligomeren
kunnen van de kolom worden verwijderd m.b.v. een post-gradient injectie van 50 µl
mierezuur. Indien een 250 µl mierezuur zone wordt gebruikt kan zelfs het hoog
moleculaire polyamide-6 van de kolom worden verwijderd, zodat de kolom
eigenschappen niet verslechteren.
De cyclische oligomeren worden bepaald m.b.v. UV detectie. Aangezien alleen de
amide functie UV licht absorbeert, kan groep equivalente UV absorptie worden
gebruikt voor de kwantitatieve bepaling van deze cyclische oligomeren. De lineaire
oligomeren kunnen veel minder eenvoudig bepaald worden in normale polyamide-6
monsters. Hun concentratie is significant lager en daarom wordt post kolom een
OPA (orthoftaaldicarboxaldehyde) reactie uitgevoerd om deze moleculen te
derivatiseren. Omdat alleen de OPA groep bijdraagt aan de totale fluorescentie
intensiteit, kan een identieke benadering als bij de UV detectie worden gebruikt om
de gevoeligheid te voorspellen. Hoewel deze benadering erg handig is voor een
semi-kwantitatieve benadering, is het gebruik van quench-factoren nodig om de
juistheid te verbeteren.
Veel auteurs beschreven reeds het onregelmatige elutie gedrag van het cyclische
monomeer t.o.v. de hogere cyclische oligomeren. Een overtuigende verklaring voor
dit verschijnsel werd echter niet gegeven. Door verschillende kolommen en
verschillende moleculaire descriptoren te vergelijken kon de grootte van het vrij

215
toegankelijke hydrofobe oppervlak van het cyclisch monomeer als verklaring voor dit
onverwachte verschijnsel worden gegeven.
Om de eerste zes cyclische oligomeren te scheiden van de lineaire oligomeren is de
optimalisatie van de gradiënt onderzocht door gebruik te maken van het “linear
solvent strength model”. Het bleek dat het cyclische monomeer en het cyclische
dimeer twee snel eluerende componenten zijn, met een significant niet-lineair
retentie gedrag. De resolutie tussen de verschillende componenten kon worden
voorspeld met een gemiddelde fout van ongeveer 0.4 resolutie eenheden door
gebruik te maken van twee initieel geprogrammeerde gradiënten
De bepaling van hogere oligomeren (n>6) m.b.v. de sandwich injectie methode bleek
niet mogelijk door slechte recoveries. Meer exotische mobiele fasen zijn
noodzakelijk om het polyamide op te lossen en te elueren. Elk oplosmiddel voor
polyamide-6 is chromatografisch of economisch niet aantrekkelijk of geeft
veiligheids- en / of milieuproblemen. HFIP en mierezuur zijn veel gebruikte
oplosmiddelen voor polyamides en werden vergeleken als mobiele fase modifiers op
octadecyl gemodificeerde silica gebaseerde stationaire fasen. Met mierezuur bleek
de efficiëntie en de belaadbaarheid van het chromatografische systeem beter.
Doordat mierezuur niet UV transparant is, diende de niet lineaire evaporative light-
scattering detector (ELSD) te worden gebruikt. HFIP heeft een veel betere UV
doorlaatbaarheid en gaf bij de gebruikte gradiënt een betere scheiding tussen de
lineaire en cyclische oligomeren. De hoge prijs (1000-3000 US$/l) en het gebrek aan
informatie m.b.t. gezondheidseffecten op de langere termijn zijn echter belangrijke
nadelen van dit oplosmiddel.
Omdat de massa overdracht van moleculen met hogere moleculaire massa’s een
belangrijke rol speelt bij de kolom efficiëntie, werd de bruikbaarheid van enkele
nieuwe octadecyl gemodificeerde stationaire fasen onderzocht. Al deze fasen geven
in principe minder massa overdrachtsproblemen bij een hoger debiet. Een kolom met
niet poreuze 1.5 µm silica deeltjes (NPS), een kolom met een 0.25 µm poreuze laag
op een 5 µm niet poreuze kern en een monoliet kolom werden getest. Zowel de NPS
als de monoliet kolom konden worden gebruikt voor de scheiding van de hogere
oligomeren. Hoewel ongeveer 90-100 hogere polyamide-6 oligomeren konden

216
worden gescheiden bleek een complete scheiding van alle aanwezige moleculen in
het polyamide-6 monster met de gebruikte gradient niet mogelijk.
Door gebruik te maken van kritische chromatografie, kan een scheiding uitsluitend
op verschil in eindgroep functionaliteit worden bewerkstelligd.
Voor de scheiding van de cyclische en lineaire ketens in polyamide-6 is een
“normal-phase” systeem ontwikkeld, waarbij een mengsel van mierezuur en 1-
propanol werd gebruikt als mobiele fase. De response van de ELSD bleek niet
afhankelijk te zijn van de moleculaire massa. Door het niet lineaire gedrag van de
ELSD detector en door het verschil in piekbreedte van de lineaire en cyclische
moleculen werd een correctie vergelijking ontwikkeld om de juistheid te verbeteren.
De scheiding van de verschillende eindgroepen in polyamide-6,6 is complexer en
werd uitgevoerd op een “reversed-phase” systeem waarbij een mengsel van 10 mM
fosforzuur in water en HFIP werd gebruikt als mobiele fase. Drie verschillende
optimalisatie parameters werden gebruikt om de kritische condities te verkrijgen.
Eerst werden het percentage HFIP en de temperatuur geoptimaliseerd. Het debiet
kon daarna als druk regulator worden gebruikt. Druk beï nvloedt de samenstelling
van de geadsorbeerde mobiele fase en kan daarom worden gebruikt om het
evenwicht met de stationaire fase te optimaliseren. Door de drukval over de kolom
bestaan er dus eigenlijk geen echte kritische condities op de gehele kolom. Aan het
begin van de kolom speelt interactie de belangrijkste rol, terwijl exclusie op het eind
van de kolom deze scheiding weer opheft. De selectiviteit wordt echter niet erg
beï nvloed door deze drie parameters. De invloed van de fosforzuur concentratie in
de mobiele fase op de selectiviteit werd daarom onderzocht, omdat de eindgroep
interacties waarschijnlijk op ionen wisseling zijn gebaseerd. Het bleek dat de
fosforzuur concentratie enkel de amine interactie met de stationaire fase beï nvloedt.
Dit geeft de mogelijkheid om een kritische gradiënt uit te voeren, waarbij de
fosforzuur concentratie in 40 minuten opgevoerd wordt van 0 naar 50 mM.
Gedurende deze gradiënt gedroeg de polyamide-6,6 keten zich als tijdens
isocratische kritische chromatografie.
Een isocratisch / gradient methode werd voorgesteld om tijdens het ontwikkelen van
de methode recovery problemen te omzeilen. Na de kritische scheiding wordt een
gradiënt gebruikt om exclusie condities te bereiken om te controleren of het gehele

217
polymeer van de kolom is geëlueerd. De kritische scheiding werd gekwantificeerd
met UV detectie. Omdat alleen de amide groep UV licht absorbeert, geeft laag
moleculaire polyamide minder response vergeleken met hoger moleculaire
polyamide. De systematische fout is kleiner dan 10%, indien de moleculaire massa
van polyamide-6,6 hoger is dan 1 kD. Om een correcte kwantificering uit te voeren,
moet de moleculaire massaverdeling van de verschillende ketens worden bepaald of
er moet worden aangenomen dat de moleculaire massa verdeling van de
verschillende lineaire ketens gelijk is.
Electrophorese is de belangrijkste scheidingstechniek voor veelvoudig geladen,
hoog moleculaire biomoleculen, zoals b.v. peptiden, eiwitten of DNA. De
mogelijkheden om deze scheidingstechniek ook te gebruiken voor de bepaling van
enkelvoudig geladen lineaire synthetische polymeren is onderzocht door gebruik te
maken van waterige HFIP. De mogelijkheden van deze scheidingstechniek zijn
extreem hoog en oligomeren met ongeveer 100 backbone eenheden konden worden
gescheiden. In principe kan dit aantal nog worden verhoogd, maar door de slechte
controle van de EOF is dit praktisch niet uitvoerbaar. Daarnaast bleek ook de
stabiliteit van het systeem niet goed, zodat er geen robuuste methode ontwikkeld
kon worden.
Samenvattend kan er worden geconcludeerd dat niet op exclusie gebaseerde
chromatografische scheidingsmethoden kunnen worden gebruikt om belangrijke
kwantitatieve gegevens te verkrijgen van polyamide-6. Chromatografisch
aantrekkelijke vloeistoffen, zoals water en acetonitril kunnen worden gebruikt om
oligomeren met een lage moleculaire massa (n≤6) te bepalen. Exotischer mobiele
fase modifiers zijn nodig om hoger moleculaire massa's van het polymeer te
bepalen, inclusief eindgroep functionaliteit.

218

219
Dankwoord
Veel mensen hebben bijgedragen aan het tot stand komen van dit proefschrift. Mijn
promotor prof.dr.ir. Carel Cramers en dr. Henk Claessens wil ik graag bedanken
voor de interessante discussies tijdens de werkbesprekingen in Eindhoven en hun
hulp bij het tot stand komen van dit proefschrift. De medewerkers van de vakgroep
instrumentele analyse wil ik bedanken voor de prettige samenwerking. Marion van
Straten en Jan Jiskra voor de hulp bij menig (mislukt) CE experiment. Daarnaast wil
ik ook Denise Tjallema-Dekker bedanken voor het geregel van al die dingen waar ik
helemaal geen weet van had. Mijn tweede promotor prof.dr. Cor Koning wil ik graag
bedanken, aangezien hij één van de eerste personen was, toen nog werkzaam bij
DSM Research, die mij duidelijk wist te maken dat de analyse aan polyamide
belangrijk is voor een betere begripsvorming van het polymeer.
Prof.dr.ir Peter Schoenmakers wil ik graag bedanken voor zijn adviezen bij het
schrijven van dit proefschrift. Dr. Sergey Galushko, I gratefully acknowledge our
many fruitful discussions concerning gradient optimization.
Daarnaast wil ik DSM en DSM-Research bedanken voor de mogelijkheden die mij
geboden zijn om het werk uit te voeren en dit proefschrift te schrijven. Er zijn veel
mensen die hebben geholpen om steeds weer tijd en ruimte te genereren. In eerste
instantie Rein Pikaart, maar daarna ook Paul Brandts, Maurits van Tol en bovenal
Jan Ramaekers.
Mijn analytische collega’s binnen DSM, in het bijzonder de chromatografische en
massaspectrometrische werkgroepen van DSM–Research wil ik bedanken voor alle
hulp en medewerking die ik heb gekregen. Hoewel de samenstelling in de loop van
de tijd nogal eens veranderde bleef Jos Hellenbrand de rots in de analytische
branding. Een bijzonder woord van dank is voor mijn collega en kamergenoot Ron
Peters, voor de vele discussies die we vaak hadden en de hulp die hij bij menig
experiment heeft geboden. Sjoerd van der Wal, ik vind het maar moeilijk om jouw
bijdrage aan dit proefschrift onder woorden te brengen. Een woord van dank is
gewoon veel te weinig. De manier waarop jij mij geholpen hebt is niet te omschrijven.
Nimmer heb ik met iemand gewerkt, die inhoudelijk zoveel van de chromatografie
afweet als jij. Zonder jou was dit proefschrift nooit afgekomen. Ik ben dan ook zeer

220
vereerd, dat jij als co-promotor wilt optreden.
Natuurlijk de niet-analytici van DSM-research. Atze Nijenhuis, Cokki Versluis,
Martien Serné, Ruud Rulkens, Jan de Kroon, Ted Brink, Henk-Jan van de Berg
e.v.a. wil ik bedanken voor menige inhoudelijke discussie, het aanleveren van
interessante informatie en / of monsters en voor het synthetiseren van juist die
monsters die nodig waren om de analytische resultaten naar waarde te kunnen
schatten.
Als laatste wil ik mijn vrienden en familie bedanken. Mijn schaakvrienden, in het
bijzonder Frans en Rob, zonder hen was dit proefschrift waarschijnlijk een stuk
sneller klaar was geweest. Stelling 10 is voor jullie. Gerrit voor al die keren dat mijn
PC het weer eens niet deed. Mijn moeder, voor het begrip dat de bezoeken aan
Wierden gering zijn gebleven. Mijn schoonfamilie die menig keer insprong als ik
weer eens geen tijd had voor de aardse zaken. Dat ik tijdens mijn afstuderen
peetoom werd vervulde mij met trots. Tenslotte Chantalle en Josh, het aantal “vrije”
uren dat ik aan het uitwerken en schrijven heb besteed is wel heel erg veel geweest
en zonder jullie positieve ondersteuning was het nooit gelukt. Gelukkig wisten jullie
mij steeds te motiveren en te stimuleren om mijn tijd juist te doseren.

221
Curriculum Vitae
Ynze Mengerink werd geboren op 4 juli 1964 te Wierden. Hij volgde de middelbare
opleiding aan de Chr. MAVO te Almelo, waar hij in 1980 zijn diploma haalde. In
1986 werd aan de School voor Laboratorium Personeel te Hengelo het HLO diploma
(analytisch chemische afstudeer richting) behaald. Na zijn militaire diensttijd begon
hij in 1987 bij DSM-Research in de groep “vloeistof chromatografie speciale
onderwerpen” o.l.v. dr. Sj. van der Wal.
In 1998 startte hij zijn in dit proefschrift beschreven promotieonderzoek in de
vakgroep Instrumentele Analyse onder leiding van prof.dr.ir. C.A. Cramers. Dit
onderzoek naar de mogelijkheden van niet op exclusie gebaseerde
scheidingsmethoden van polyamide-6 werd in nauwe samenwerking met DSM-
Research uitgevoerd.

222

223
Bibliography
1. “Use of an evaporative light-scattering detector for HPLC of oligomeric surfactants”. Y.Mengerink, H.C.J. de Man and Sj. van der Wal, J. Chromatogr. 552(1991)593-604
2. “Optimization of the separation of the Rp and Sp diastereomers of phosphate-methylated DNAand RNA dinucleotides”, A.J.J.M. Coenen, L.H.G. Henckens, Y. Mengerink, Sj. van der Wal,P.J.L.M. Quaedflieg, L.H. Koole and E.M. Meijer, J. Chromatogr. 596(1992)59-66
3. “Exclusion chromatography of polypropylenamine dendrimers”, Y. Mengerink, M.Mure, E.M.M. deBrabander and Sj. van der Wal, J. Chromatography. A 730(1996)75-81
4. “Polypropylenimine dendrimers: improved synthesis and characterization”, E.M.M. de Brabander,J. Brackman, M. Mure-Mak, H. de Man, M. Hogeweg, J. Keulen, R. Scherrenberg, B. Coussens,Y. Mengerink and Sj. van der Wal, Macromol. Symp. 102(1996)6-17
5. “Transamidation in melt-mixed aliphatic and aromatic polyamides. 3. Molecular characterizationusing gradient elution chromatography (GEC)”, K.L.L. Eersels, G. Groeninckx, Y. Mengerink andSj. van der Wal, Macromolecules 29(1996)6744-6749
6. “Compositional analysis of nitril terminated polypropylenamine dendrimers by HPLC combinedwith electrospray mass spectrometry”, Sj. van der Wal, Y. Mengerink, E.M.M. de Brabander, C.M.Jeronimus-Stratingh and A.P. Bruins, J. of Chromatogr. A 825(1998)135-147
7. Plastics- Determination of caprolactam and its cyclic and linear oligomers by HPLC, ISO150333:2000(E) first edition 2000-4-1
8. “Analysis of higher polyamide-6 oligomers on a silica-based reversed-phase column with agradient of formic acid as compared with hexafluoro isopropanol”, Y. Mengerink, Sj. van der Wal,H.A. Claessens and C.A. Cramers, J. Chromatogr. 871(2000)259-268
9. "Analysis of linear and cyclic oligomers in polyamide-6 without sample preparation by liquidchromatography using the sandwich injection method, part I Injection procedure and columnstability”, Y. Mengerink, R. Peters, M. Kerkhoff, J. Hellenbrand, H. Omloo, J. Andrien, M.Vestjens and Sj. van der Wal, J Chromatogr. 876(2000)37-50
10. "Analysis of linear and cyclic oligomers in polyamide-6 without sample preparation by liquidchromatography using the sandwich injection method, part II Methods of detection andquantification and overall long-term performance", Y. Mengerink, R. Peters, M. Kerkhoff, J.Hellenbrand, H. Omloo, J. Andrien, M. Vestjens and Sj. van der Wal, J. Chromatogr.878(2000)45-55
11. "Analysis of linear and cyclic oligomers in polyamide-6 without sample preparation by liquidchromatography using the sandwich injection method, part III Elution mechanism and gradientoptimization", Y. Mengerink, R. Peters, Sj. van der Wal, H. Claessens and C.A. Cramers, J.Chromatogr. accepted
12. “Separation and quantification of the linear and cyclic structures of polyamide-6 at the criticalpoint of adsorption”. Y. Mengerink , R. Peters, C.G. de Koster, Sj. van der Wal, H.A. Claessensand C.A. Cramers, J. Chromatogr. A 914(2000)131-145
13. “Endgroup based separation of polyamide-6,6 using critical chromatography”, Y. Mengerink, R.Peters, Sj. van der Wal, H.A. Claessens and C.A. Cramers, J. Chromatogr. submitted
14. “Advances in the evaluation of the stability of the amino acid derivatives obtained with OPA / 3-mercaptopropionic acid and OPA / Acetyl-L-Cysteine reagents”, Y. Mengerink, F. Toth, D. Kutlanand I. Molnar-Perl, J. Chromatogr. accepted
15. “Quantification of the functionality of poly(methylmethacrylate) with critical chromatography usingthe evaporative light-scattering detector. A comparison with titration and NMR”, R. Peters, Y.Mengerink, J. v. Hes, S. Langereis and Sj. van der Wal, J. Chromatogr. accepted

224