Embed Size (px)
Citation preview

2015 International Energy Program Evaluation Conference, Long Beach
Non-Energy Impacts Provide Powerful Marketing Tools for Energy Efficiency
Programs
Marie Abdou, National Grid, Waltham, MA
Noel Stevens, DNV GL, Burlington, MA
Anthony Davis, DNV GL, Portland, ME
ABSTRACT
The value of energy efficiency investments extends beyond energy savings to include facility cost
savings and production/revenue increases, non-energy impacts (NEIs). While rigorous quantification of non-
energy impacts (NEIs) is becoming increasingly important for the evaluation of energy efficiency, NEIs can
also provide valuable information for program implementers, looking to market program-supported
technologies to end-users. This NEI marketing study demonstrates how NEI can help close the feedback loop
between program evaluation and implementation. The current NEI Marketing study utilizes NEI information
collected through a previous study, the 2012 Commercial and Industrial (C&I) Retrofit NEI Evaluation study
which was the most comprehensive NEI evaluation studies to date.i,
ii,
iii To obtain estimates of NEIs
associated with program sponsored measures, the 2012 C&I Retrofit NEI Evaluation study captured a robust
set of data through in-depth interviews regarding the specific facility cost and revenue changes resulting
from the installation of that provides insight to segment-specific marketing messages. The present NEI
marketing study leveraged this data to provide program sales and marketing staff with valuable selling points
to address the industry specific needs of customers, and increase the value proposition of participating in
efficiency programs. This study provided quantitative and qualitative evidence of the changes to internal and
external labor, parts and supplies, waste management, sales revenue, and other reported cost and revenue
changes that may result from installing energy efficient measures within various industries. It also captured
important respondent information necessary to characterize NEIs realized by different types of customers.
Introduction
While NEIs have historically been used in program evaluation to provide a stream of benefits used in
cost benefit analysis of existing programs, NEIs also provide an excellent way to create the feedback loop
from evaluation to implementation. This study a repurposed the data obtained through one of the most
comprehensive NEI evaluation studies to date to provide valuable marketing information regarding non-
energy benefits that may results from installing energy efficiency measures.
The overall goal of the NEI marketing study was to leverage data obtained from the Massachusetts
2012 C&I Retrofit NEI study to develop an industry-level analysis for program implementers, demonstrating
the value proposition of energy efficiency programs beyond energy savings. Specifically, the re-analysis of
the 2012 C&I Retrofit NEI study was used to:
Identify statistically significant NEI categories and sub-categories by industry and energy type
(electric, gas)
Identify non-significant NEIs that are logically sound for any specific industry
Review and summarize quantitative and qualitative descriptions of NEIs
Present prominent NEI themes by industry for use in sales and marketing.

2015 International Energy Program Evaluation Conference, Long Beach
The NEI marketing study was designed to assist program implementers, who are engaged in the
marketing of energy efficiency programs, to understand the specific cost and revenue changes reported by
customers within 13 separate industries. This study helps close the feedback loop between program
evaluation and implementation by leveraging data used to quantify NEIs for the evaluation of programs, and
then re-analyzing that information to provide program sales and marketing staff valuable selling points that
appeal to specific customer segments and increases the value proposition of participating in efficiency
programs. This information will benefit utility programs that are implementing targeted marketing
campaigns and niche programs to reach energy saving goals. We provide quantitative and qualitative
information of the changes to internal and external labor, parts and supplies, waste management, sales
revenue and other reported costs, and revenue changes that result from installation of energy efficient
measures within each industry.
Review of 2012 C&I Retrofit NEI study
In 2012, the Evaluation team conducted a NEI study that successfully captured data from more than
500 C&I program participants regarding NEIs resulting from 788 prescriptive and custom electric and gas
measures. While the purpose of the present NEI Marketing study was not to provide an extensive review of
the data collection process used in the 2012 C&I Retrofit NEI Evaluation study, the following summary of
the data collection process offers the necessary context to understand the approach used in the study. Our
approach to estimating NEIs broke impacts into mutually exclusive categories that reflect separate cost and
revenue (business impacts) resulting from the Program Administrators’ (PAs) program-sponsored installed
measures. Rather than rely on stated NEI estimates alone, we probed respondents for a deeper understanding
of the impacts on specific costs and revenues. The key components of the methodology were as follows:
For prescriptive measures, we selected the sample of 297 and 153 electric and gas target completes,
respectively, from the pool of respondents to the 2010 Massachusetts C&I Free-ridership/spillover study.
Of those targeted completes, we were successful in completing 302 and 99 NEI interviews. For custom
measures, due to the limited sample of custom projects in the 2010 Massachusetts C&I Free-
ridership/spillover study, we supplemented the pool of respondents to the 2010 Massachusetts C&I Free-
ridership/spillover study with additional sample from the population of custom measures installed in 2010.
The target number of completed interviews for custom measures was 276 and 112 custom electric and gas
completes of which we were successful in completing 310 and 151 NEI interviews.
Designed the research instruments, trained the interview staff, and oversaw quality control;
Experienced DNV GL energy analysts conducted the semi-structured interviews;
Collected data on NEI types and dollar values, and like and unlike spillover.
Used ratio-estimation to calculated NEIs by reporting measure category or end-use, as was needed by
the Massachusetts Program Administrators for their cost-benefit analysis.
The evaluation team captured NEI information for 789 prescriptive and custom electric and gas
measures. Positive NEIs or non-energy benefits were realized for 58% of measures, while 3% of measures
resulted in negative NEIs. An additional 40% of measures reported no positive or negative NEIs.
The NEI question battery was structured to prevent possible double counting across 13 NEI
categories by presenting related categories sequentially for easier respondent recall. The evaluation team
used additional closed-ended questions to assess whether the respondent experienced an increase or decrease
in each affected NEI (e.g., an increase or decrease in operations and maintenance costs). Next, we used open-
ended questions to ask respondents to provide the overall dollar impact associated with each NEI category.
In some instances, respondents were able to provide NEI values and articulate reasons for these values

2015 International Energy Program Evaluation Conference, Long Beach
without further probing. However, in most cases, interviewers needed to guide respondents through a series
of structured probes to determine whether respondents experienced any changes to various cost or revenue
centers associated with each NEI category. For example, internal labor and external labor are separate cost
centers associated with Operation and Maintenance (O&M) costs. Once the interviewer identified the
impacted cost and revenue centers, deeper probes were used to determine the nature of those changes and
specific metrics for quantifying the monetary and resource impacts of the installed measures. Table 1
presents the general probes for each NEI section.
Table 1. Non-Energy Impact Categories
NEI Category
Probes
Labor1
Parts /
Material
s
Traini
ng Fuel2 Water
Fees /
Permit
s Other
Operations &
maintenance
Administration
Materials handling
Materials movement
Other labor
Spoilage/Defects
Water usage
Waste disposal
Fees
Other costs
Sales
Rent revenues
Other revenues 1 Labor included internal and external labor and included probes for assessing fully loaded costs.
2 Fuel included: natural gas, no. 2 distillate, no. 4 fuel oil, propane, wood, and kerosene.
Examples of specific probes for each NEI category included the following:
Operations and maintenance: The interview guide included probes for internal labor, external labor,
parts, training, fuel saved, and other O&M costs. For the labor and training subcategories, the
interviewers attempted to get annual hours of increase or decrease and an hourly rate. For parts,
interviewers attempted to quantify the number and type of parts that increased or decreased, and the
unit cost of each. For training, interviewers attempted to quantify increases or decreases in training
costs and whether these were one-time costs or recurring costs. For fuel, interviewers attempted to
quantify specific changes (increase or decrease) in fuel usage. For other, interviewers asked the
respondent if there were any other O&M related costs that increased or decreased that we had not yet
covered.
Administrative or other labor: This section included probes for internal labor, external labor,
training, and other. The use of these specific probes was similar to their descriptions in the O&M
section, except they were applied to administrative rather than O&M costs.
Cost of supplies, materials and materials handling: This section included probes for internal labor,
external labor, and other. The use of these probes was similar to their descriptions in the O&M
section, except they were applied to materials handling rather than O&M costs.
2015 International Energy Program Evaluation Conference, Long Beach
Waste disposal costs: The section included probes for waste materials, waste handling, permits, and
other. For waste materials, the probes attempted to identify the type of material (e.g. carbon dioxide,
sulfur dioxide, etc.) and quantify in units the increase or decrease in emission. For waste handling,
the probes attempted to identify number of hours of labor, and the fully-loaded hourly costs for that
labor, just like the internal or external labor costs in the O&M section. In the event that the
respondent could not supply fully loaded hourly costs, interviewers attempted to gather enough
information to allow us to impute it.
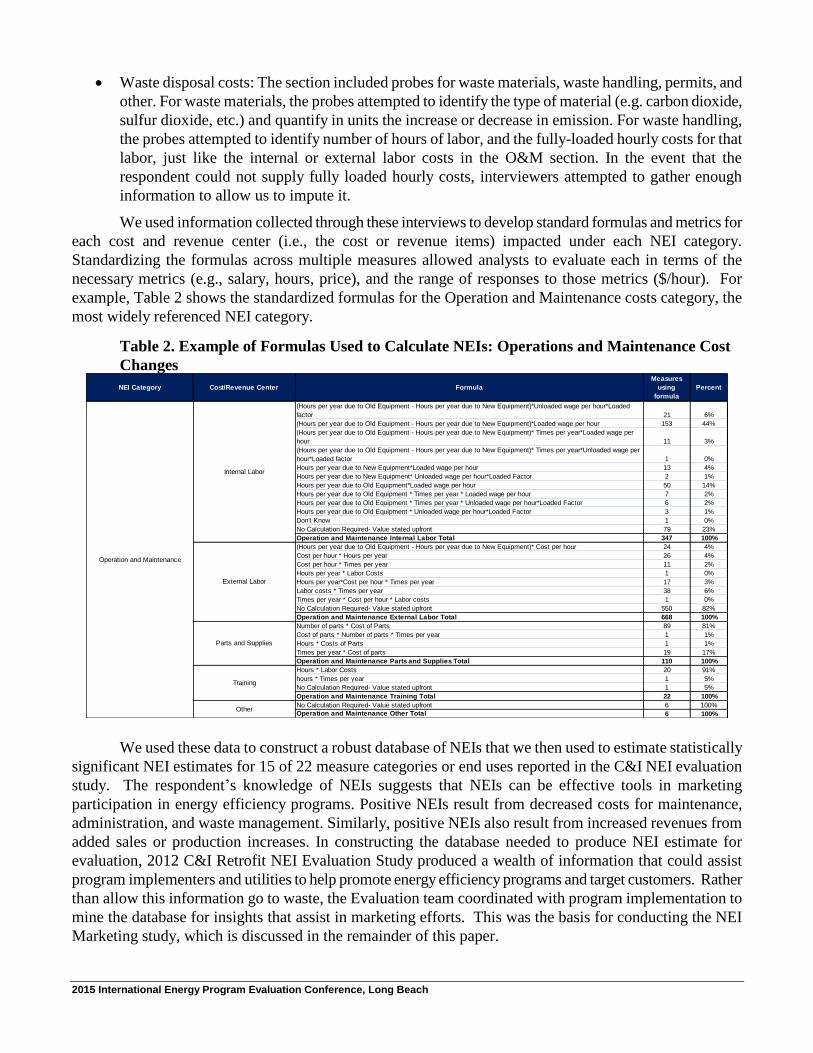
We used information collected through these interviews to develop standard formulas and metrics for
each cost and revenue center (i.e., the cost or revenue items) impacted under each NEI category.
Standardizing the formulas across multiple measures allowed analysts to evaluate each in terms of the
necessary metrics (e.g., salary, hours, price), and the range of responses to those metrics ($/hour). For
example, Table 2 shows the standardized formulas for the Operation and Maintenance costs category, the
most widely referenced NEI category.
Table 2. Example of Formulas Used to Calculate NEIs: Operations and Maintenance Cost
Changes
(Hours per year due to Old Equipment - Hours per year due to New Equipment)*Unloaded wage per hour*Loaded
factor 21 6%
(Hours per year due to Old Equipment - Hours per year due to New Equipment)*Loaded wage per hour 153 44%
(Hours per year due to Old Equipment - Hours per year due to New Equipment)* Times per year*Loaded wage per
hour 11 3%
(Hours per year due to Old Equipment - Hours per year due to New Equipment)* Times per year*Unloaded wage per
hour*Loaded factor 1 0%
Hours per year due to New Equipment*Loaded wage per hour 13 4%
Hours per year due to New Equipment* Unloaded wage per hour*Loaded Factor 2 1%
Hours per year due to Old Equipment*Loaded wage per hour 50 14%
Hours per year due to Old Equipment * Times per year * Loaded wage per hour 7 2%
Hours per year due to Old Equipment * Times per year * Unloaded wage per hour*Loaded Factor 6 2%
Hours per year due to Old Equipment * Unloaded wage per hour*Loaded Factor 3 1%
Don't Know 1 0%
No Calculation Required- Value stated upfront 79 23%
Operation and Maintenance Internal Labor Total 347 100%
(Hours per year due to Old Equipment - Hours per year due to New Equipment)* Cost per hour 24 4%
Cost per hour * Hours per year 26 4%
Cost per hour * Times per year 11 2%
Hours per year * Labor Costs 1 0%
Hours per year*Cost per hour * Times per year 17 3%
Labor costs * Times per year 38 6%
Times per year * Cost per hour * Labor costs 1 0%
No Calculation Required- Value stated upfront 550 82%
Operation and Maintenance External Labor Total 668 100%
Number of parts * Cost of Parts 89 81%
Cost of parts * Number of parts * Times per year 1 1%
Hours * Costs of Parts 1 1%
Times per year * Cost of parts 19 17%
Operation and Maintenance Parts and Supplies Total 110 100%
Hours * Labor Costs 20 91%
hours * Times per year 1 5%
No Calculation Required- Value stated upfront 1 5%
Operation and Maintenance Training Total 22 100%
No Calculation Required- Value stated upfront 6 100%
Operation and Maintenance Other Total 6 100%
NEI Category Cost/Revenue Center Formula
Internal Labor
Operation and Maintenance
External Labor
Parts and Supplies
Training
Measures
using
formula
Percent
Other
We used these data to construct a robust database of NEIs that we then used to estimate statistically
significant NEI estimates for 15 of 22 measure categories or end uses reported in the C&I NEI evaluation
study. The respondent’s knowledge of NEIs suggests that NEIs can be effective tools in marketing
participation in energy efficiency programs. Positive NEIs result from decreased costs for maintenance,
administration, and waste management. Similarly, positive NEIs also result from increased revenues from
added sales or production increases. In constructing the database needed to produce NEI estimate for
evaluation, 2012 C&I Retrofit NEI Evaluation Study produced a wealth of information that could assist
program implementers and utilities to help promote energy efficiency programs and target customers. Rather
than allow this information go to waste, the Evaluation team coordinated with program implementation to
mine the database for insights that assist in marketing efforts. This was the basis for conducting the NEI
Marketing study, which is discussed in the remainder of this paper.

2015 International Energy Program Evaluation Conference, Long Beach
Marketing Methodology
In this section we provide an overview of the steps in developing the marketing analysis. The
marketing analysis relied exclusively on repurposing of data collected through the 2012 C&I retrofit NEI
evaluation study. Prior to developing the marketing analysis, the Evaluation team solicited input from the
PAs implementation staff to ensure the analysis provided implementation staff with the most valuable
information for their marketing efforts. Through this effort we determined that the marketing NEI analysis
should reflect the following criteria for reporting results:
1. NEI results should be presented by industry segment rather than measure category or end use
– Implementation staff stressed the importance of industry-specific over measure messaging. To provide
analysis at the industry level, the NEI marketing study leveraged self-reported industry classification from
the obtained through the 2012 C&I retrofit interview process. Table 3 presents the number of measures used
in the analysis by industry segment.
Table 3. Number of Customers Used to Estimate NEIs by Industry Segment*
Building
Envelope Comprehensive
Compressed
Air HVAC Lighting
Motors
and
Drives Other Process Refrigeration
Water
Heater
Education 3 1 15 39 4 1 1 2 66
Food Sales 3 1 77 1 18 100
Food Service 1 1 1 5 8
Health Care 1 10 11
Lodging 25 31 12 2 23 93
Manufacturing 2 5 8 6 1 5 27
Mercantile 2 13 1 1 17
Office 2 1 1 14 25 5 2 1 2 53
Other 3 9 4 16
Public Assembly 3 5 1 2 11
Public Order and Safety 4 6 10
Religious Worship 1 2 1 1 5
Service 1 1 3 2 7
Unknown 5 1 6
Warehouse and Storage 1 1 3 17 22
Total 37 2 7 87 215 18 4 8 38 36 452
Enduse (Electric and Gas)
TotalIndustry Segment
* Note: Customers providing responses for prescriptive and custom, electric and gas measures are combined
2. The unit of analysis should reflect distinct customers rather than individual measures – The
unit of analysis for the 2012 study was the measure level because the PAs were interested in estimates of
NEI per unit of energy savings for various measure categories or end uses. This worked well for NEI
estimates used in the PA’s cost-effectiveness models that incorporate NEIs at that at level. However, for
marketing purposes, it is more appropriate to report NEIs at the customer level than the measure. From the
end-user’s perspective, customers within an industry are likely to make similar energy efficiency
investments, so the average cost and revenue changes resulting from that bundle of efficiency measures is
more likely to represent the expected NEIs across the average bundle of measures. From the implementer’s
perspective, rather than focus on a predetermined measure-level solution, implementation staff typically
approaches customers with the objective of saving energy for the customer. This often consists of a multi-
measure, custom, or comprehensive design approach. Therefore, the team determined that collapsing NEIs
from the measure-level to the customer level was more beneficial for marketing purposes. However, using
custom-level rather than measure-level results decreases the sample size and deflates the standard error from
the customer’s perspective. In making this change, the Evaluation team needed to re-assess the statistical
significance of NEI estimates at the customer level. As seen in Table 4, changing from the measure to the

2015 International Energy Program Evaluation Conference, Long Beach
customer level substantially reduced the number of observations in the analysis used to compute NEIs,
potentially reducing statistical significance of NEI estimates.
Table 4. Number of measures and customers with
non-zero NEIs by NEI sub-category
Electric Customers Measures
Internal Labor 120 180
External Labor 68 102
Parts and Materials 90 136
Training 1 2
Fuel 251 434
Gas Customers Measures
Internal Labor 33 90
External Labor 22 57
Parts and Materials 18 51
Training 3 18
Fuel 90 166
3. Presented NEIs in terms of the NEI sub-categories rather than NEI categories – The 2012 C&I
retrofit NEI study showed that subcategories (internal labor, external labor, parts and supplies, etc.) were
more recognizable to end-users than the NEI categories. While the latter were beneficial to ensure that
respondents did not double count cost and revenue changes realized in different business units, respondents
frequently conceptualized the NEIs in terms of the sub-categories. Table 4 below shows the relationship
between NEI categories and sub-categories. DNV GL re-organized the NEI estimates to provide estimates at
the sub-category level that more closely reflect meaningful facility changes for marketing purposes. While
other NEI sub-categories were also captured by the interviews, the frequency in which these categories were
reported was very limited. Therefore, our analysis focused on internal and external labor, parts and supplies,
and training cost changes.

2015 International Energy Program Evaluation Conference, Long Beach
Table 4. Mapping NEI Sub-categories to NEI categories
Materials Movement• Driver
• Mechanic
Waste Handling • Labor
Operations and
Maintenance
• Parts replacement
• Routine maintenance
• Equipment diagnostics & repair
• External labor coordination
• Customer calls/complaints
Administration
• Bill handling & remittance
• Administrative tasks
Materials Handling
• Loading dock labor
• Other materials handling labor
Other Labor • Any other labor
Other Costs• Any other labor
Administration• Contracted accounting
• Contracted administration
Operations and
Maintenance
• Contractor visits
Materials Handling• Contracted load dock staff
Other Labor• Other contractor visits
• Other external labor
Materials Movement• Contractor
• Mechanic
Operations and
Maintenance
• Parts replacement
• New equipment parts
• Avoided parts
Materials Movement
• Fleet repair/maintenance
• Fleet vehicle parts
Operations and
Maintenance
• External/internal classes
• Instructor labor
• Training materials
Other Labor
• External classes
• Instructors
• Training materials
Nature of Impact
External labor
Parts and supplies
Training
Internal labor
NEI CategoryNEI Sub-Category
4. Identify statistically significant or logically consistent NEIs by industry and NEI sub-category
We aggregated the NEI estimates to the industry, customer, and sub-category level then used the statistical
procedure of ratio estimation to develop estimates of NEI per kWh or per therm, for electric and gas
measures, respectively. We then expanded the sample results to the population of measures. This was
accomplished by calculating the ratio of NEI (in dollars) to reported savings for the sample for non-zero NEI
values. The calculation of the NEI adjustment factor used appropriate weights corresponding to the sampling
rate. The adjustment factor was calculated as a ratio estimator over the sample of interest (Cochran, 1977,
p.165). The formulas for these factors are given below. The NEI rate RI was calculated using:
j A Ij Aj
I
j A Tj Aj
G wR
G w
Where:
GTj = tracking estimate of gross savings for measure j
GIj = evaluation estimate of gross non energy impacts for measure j
wAj = weighting factor for measure j used to expand the sample to the full population

2015 International Energy Program Evaluation Conference, Long Beach
After calculating the average NEI per kWh and NEI per them and their respective standard errors, we
identified NEI sub-categories within each industry segment that were statistically significant at the 90%
confidence level. For those NEI subcategories that showed non-zero NEIs that were not statistically
significant, we reviewed the interview responses to determine whether the qualitative descriptions provided
logical explanations for changes a facility in a particular industry might expect.
5. Summarize NEI results by industry and NEI sub-category – Once we identified the statistically
significant NEI sub-categories within each industry, the next step was to summarize the survey data for those
sub-categories. For the NEI marketing analysis we summarized both quantitative and qualitative NEI results.
These are discussed below.
• Quantitative NEI results –We calculated the average NEI per kWh savings for electric measures
and average NEI per therm savings per customer for gas measures at the NEI sub-category level for each
industry. In order to show end-users the magnitude of the NEIs, we needed to impute a value for the energy
savings. Therefore, we estimated high-, medium-, and low-point estimates for expected NEIs by assuming
the 75th, 50th, and 25th percentile of energy savings.
• Qualitative NEI results – To assist sales and marketing personnel in “telling the story behind the
numbers,” DNV GL provided anecdotal information to support the quantified NEI estimates. During the
interview process, energy analysts captured detailed information concerning the nature of changes to
business operations resulting from the installed measures.
Results
Figure 1 and Figure 2 below present the median NEI for electric and gas measures, respectively by
industry. The figures also show the percent of each industry’s NEIs that are derived from internal labor,
external labor, parts and supplies, and training. From Figure 1, we see that the highest median NEIs are
reported by the public order/public safety, manufacturing and office segments. We also see that the sources
for those NEIs varies considerably across these three segments, parts and supplies make up the largest share
of the average NEI in the manufacturing sector, while internal labor constitutes nearly ½ of the NEIs from
the other two sectors. External labor constitutes a largest share of the NEI from public order as a greater
share of maintenance services for public institutions are likely outsourced compared to in the private sector.
Further, facility staff in manufacturing settings are more often skilled in repair and maintenance of
mechanical systems. Figure 2 shows that NEIs associated with gas measure NEIs range between $0.40 per
therm and $1.00 per therm. External labor cost savings are the primary source of NEIs within the Education,
Lodging, and Mercantile sectors. Figure 2 shows that statistically NEIs associated with gas measures were
limited to just two industries, religious worship and lodging.

2015 International Energy Program Evaluation Conference, Long Beach
Figure 1. Electric overview of industries with statistically significant NEIs*
$1,932
$119
$1,851 $1,875
$3,890
$1,396
$2,310
$5,541
$0
$1,000
$2,000
$3,000
$4,000
$5,000
$6,000
0%
10%
20%
30%
40%
50%
60%
70%
80%
90%
100%
Education Food Sales Health Care Lodging Manufacturing Mercantile Office Public Order/Safety
Ave
rage
NEI
Pe
rce
nt
of
Tota
l NEI
fo
r Ea
ch S
ub
-Cat
ego
ry
Average NEI per kWh Saved and Composition Breakdown*
External Labor (kwh) Internal Labor (kwh) Parts Operations and Maintenance (kwh) Training (kwh)
* Median NEI presented for each industry = NEI/kWh savings X Median Savings for the industry
Figure 2. Gas Overview of Industries with
Statistically Significant NEIs
$180
$1,888
$0
$200
$400
$600
$800
$1,000
$1,200
$1,400
$1,600
$1,800
$2,000
0%
10%
20%
30%
40%
50%
60%
70%
80%
90%
100%
Lodging Religious Worship
Ave
rage
NEI
Pe
rce
nt
of
Tota
l NEI
fo
r Ea
ch S
ub
-Cat
ego
ry
Average NEI per thm Saved and Composition Breakdown*
External Labor (thm) Internal Labor (thm)
Parts Operations and Maintenance (thm) Training (thm)
* Median NEI presented for each industry = NEI/therm savings X Median Savings for the industry
The following summarizes our analysis of the qualitative information captured by the 2012 C&I
Retrofit NEI study provides the following insights into the specific cost and revenue changes within a
number of industry sectors. We selected industries that were of particular interest to the PA’s implantation
staff.
Sources of NEIs in Education
The most prevalent NEIs in the Education sector resulted from following changes:
Parts and supplies –New fixture required fewer bulb purchases; new HVAC requires fewer spare
parts, saving on inventory and storage space; new windows led to no replacement of hardware on
windows; building shell improvements eliminated need to purchase new insulation on a yearly basis.
Internal labor – New lighting required less frequent replacement due to longer useful lives.
External labor – Occupancy sensors save from cleaners not having to turn off the lights; new HVAC
measures decrease the need for specialists to fix system; new equipment means few repairs.

2015 International Energy Program Evaluation Conference, Long Beach
Sources of NEIs in Healthcare
The most prevalent NEIs in the Healthcare sector resulted from following changes:
Parts and supplies – No more need to replace thermostats due to electronic sensors; fewer lighting
components needed on hand.
Internal labor – Staff spend less time coordinating with vendors; less time spent changing out
lighting ballasts and fixtures; fewer bills to pay which saves on invoicing time; less time receiving
and stocking equipment.
External labor – New system requires fewer contractor visits due to web monitoring.
Sources of NEIs in Lodging
The most prevalent NEIs in the Lodging sector resulted from following changes
Parts and supplies – New machines and systems require less day-to-day maintenance; Technological
improvements mean that issues can be solved remotely; new products last longer than old versions;
Motor belt lives increase from 6 months to 18 months.
Internal labor – Building shell improvements resulted in decrease time maintaining building and less
ice damage and leaks to deal with during the winter; new HVAC system requires less management
and repairs; HVAC controls eliminate the need for staff to set temperatures manually; problems can
be fixed remotely and there is no longer a need to send someone to the problem area.; newer lighting
last longer and do not need to be replaced as regularly.
Administration – Fewer issues require less paperwork to complete.
Sources of NEIs in Food Sales
The most prevalent NEIs in the Food Sales sector resulted from following changes
Parts and supplies –Less product spoilage/product loss.
Internal labor – Decrease restocking time, saved over 50% in costs, lower costs associated with
stocking shelves due to less spoilage, less general maintenance (Electric).
External labor – Decrease number of contractor visits.
Sources of NEIs in Manufacturing
The most prevalent NEIs in the Manufacturing sector resulted from following changes:
Internal labor – Electrician used to have to vacate 150 people for 30 minutes 6 times a month to
change out fixtures and ballasts(electric); no longer running around checking on equipment due to
complaints; less time spent maintaining lighting; fewer internal repairs with high end equipment;
overall increase in worker activity due to new lighting; less lost down time due to machines breaking
down.
Administration – Installed measures resulted in less time processing work orders.

2015 International Energy Program Evaluation Conference, Long Beach
Office
The most prevalent NEIs in the Office sector resulted from following changes:
Parts and supplies – Have not had to purchase any replacement bulbs since new installation.
Internal labor – New lighting has less fixtures to maintain and requires less time spent changing out
bulbs, this also results in less time filling out paperwork and processing complaints; controls do not
require maintenance of thermostats.
External labor – New HVAC system is more reliable which saves on maintenance.
Revenue – Increased comfort due to more consistent heating; decreased turnover of the building and
fewer tenant issues.
Summary
This paper presents a summary of research designed to provide sales and marketing representatives
with a tool for communicating possible NEIs that may result from installed measures. Our analysis
repurposed a robust dataset developed for the evaluation of energy-efficiency programs to provide program
implementers with industry-specific NEIs presented in terms that end users actually think about their
business needs. For many of the NEIs identified, the primary sources of value were derived from internal and
external labor cost savings, or reduced need for parts and supplies. These cost savings largely result from the
relatively high quality of energy efficient equipment. As programs incentivize participants to use energy
efficient appliances, fixtures, or controls, they are installing high-end equipment. That equipment tends to
last longer and requires less maintenance. This translates into direct cost savings for internal and external
labor, but also lower costs for parts and supplies, and reduces administrative costs for ordering and
processing invoices. This analysis clearly demonstrates that the value proposition for program implementers
and even equipment manufacturers extends far beyond energy savings. Finally, this analysis offers an
example of a successful feedback loop between program evaluation and implementation.
Limitations
We recognize the following limitations of this study that should be considered when leveraging
material contained in the presentation:
Values and anecdotal information presented in this study reflect the mix of measures and participants
contained in the 2011 program tracking data. The “types of changes reported” should serve as talking
points of what other participants have experienced, given the measures they installed and the specific
operating procedures at their facility.
Due to substantial variation in the magnitude of gas NEIs and the relatively limited sample size, this
study was not able to identify statistically significant NEIs for gas measures for most industry
sectors. However, the 2012 C&I retrofit NEI study did find statistically significant NEIs for a range
of prescriptive and custom measure categories. Further analysis would be required to combine NEIs
across similar industry segments to provide statistically significant results the at the most appropriate
level of industry segmentation.
The following factors may limit the applicability of NEI estimates in other jurisdictions:

2015 International Energy Program Evaluation Conference, Long Beach
o Values were specific to Massachusetts customers. For example, the general cost of labor in
Massachusetts may be higher than that in a Midwestern state.
o The mix of measures assumes C&I programs that are retrofits, which consisted of a mix of
early replacement and replace on failure measures. Additional steps should be taken to
address new construction.
Certain territories in Massachusetts that are demographically unique should consider adjusting NEI
estimates to reflect differences in the mix of measures within the territories relative to the state as a
whole.
References i Final Report – Commercial and Industrial Non-Energy Impacts Study. Prepared for the Massachusetts PAs. Prepared by DNV GL and
TETRA TECH. June 29, 2012. ii Stevens, Noel, Lindsay Foley, Susan Weber, Pam Rathbun, and Miriam Goldberg. Using In-depth Interviews to Estimate Non-energy
Impacts Resulting from Commercial and Industrial Energy Efficiency Measures. Paper presented at IEPEC. Chicago. 2013. iii
Stevens, Noel, Kimberly Crossman, Pam Rathbun, Miriam Goldberg, and Ben Jones. Non-energy impacts of C&I energy efficiency
measures provide substantial program benefits above carbon reduction. Paper presented at IEPPEC. Berlin. 2014.