Embed Size (px)
Citation preview

Seediscussions,stats,andauthorprofilesforthispublicationat:https://www.researchgate.net/publication/295097923
Non-DestructiveUltrasonicExaminationofRootDefectsinFrictionStirWeldedButt-Joints
Article·February2016
DOI:10.1016/j.ndteint.2016.02.007
CITATIONS
0
READS
183
4authors:
MortezaTabatabaeipour
UniversityofLeuven
16PUBLICATIONS23CITATIONS
SEEPROFILE
JanHettler
UniversityofLeuven
17PUBLICATIONS14CITATIONS
SEEPROFILE
StevenDelrue
UniversityofLeuven
35PUBLICATIONS78CITATIONS
SEEPROFILE
KoenVanDenAbeele
UniversityofLeuven
185PUBLICATIONS2,056CITATIONS
SEEPROFILE
AllcontentfollowingthispagewasuploadedbyMortezaTabatabaeipouron14April2016.
Theuserhasrequestedenhancementofthedownloadedfile.Allin-textreferencesunderlinedinblueareaddedtotheoriginaldocument
andarelinkedtopublicationsonResearchGate,lettingyouaccessandreadthemimmediately.

NDT&E International 80 (2016) 23–34
Contents lists available at ScienceDirect
NDT&E International
http://d0963-86
n CorrE-m
journal homepage: www.elsevier.com/locate/ndteint
Non-destructive ultrasonic examination of root defects in frictionstir welded butt-joints
M. Tabatabaeipour n, J. Hettler, S. Delrue, K. Van Den AbeeleWave propagation and Signal Processing, Department of Physics, KU Leuven Kulak, 8500 Kortrijk, Belgium
a r t i c l e i n f o
Article history:Received 11 November 2015Received in revised form19 January 2016Accepted 8 February 2016Available online 15 February 2016
Keywords:Friction stir weldingRoot-flawImmersion ultrasonicBackscatterC-scanOblique incidence
x.doi.org/10.1016/j.ndteint.2016.02.00795/& 2016 Elsevier Ltd. All rights reserved.
esponding author. Tel.: þ32 56 246 202.ail address: [email protected] (M. Taba
a b s t r a c t
As a solid-state welding process, Friction Stir Welding (FSW) offers a variety of advantages over tradi-tional welding processes. Problems that are typically occurring due to the cooling of the liquid phase,such as solidification cracking and formation of porosity, generally do not occur in FSW. Nevertheless, asa result of suboptimal settings of the welding process parameters and certain uncontrollable conditions,FSWs are still associated with a number of specific flaws, e.g. root flaws and wormholes.
Ultrasonic non-destructive testing and evaluation techniques (NDT&E) can be used for qualityassessment of friction stir welded joints. In this paper, a novel approach for the detection of root flaws isproposed using an immersion ultrasonic testing method in oblique incidence and backscatter mode. Thebackscattered energy C-scan images obtained after an empirical positioning and proper time gating canbe straightforwardly interpreted by direct comparison with typical ‘flaw’ patterns, allowing for identi-fication and localization of the root flaws in the weld. The method is illustrated for FSW butt joints of theAlZnMgCu (7XXX series) alloy.
& 2016 Elsevier Ltd. All rights reserved.
1. Introduction
After the major advances in arc welding technology during the1930s, it took another 60 years to establish a new joining techni-que, called Friction Stir Welding (FSW). FSW is a solid-state joiningprocess invented by W. M. Thomas at The Welding Institute (TWI-UK) [1,2]. The FSW process is based on heat generated by a non-consumable rotating tool that is plunged into the faying surface oftwo samples until the shoulder touches the surface of the samples,and then traverses along the joint line of the work-pieces (seeFig. 1) [3]. Primary sources of the heat generated during the pro-cess are friction between the work-piece and the rotating toolshoulder, and adiabatic heat transfer within the material [4,5]. Thelocal increase in temperature softens the material and inducesplastic deformation in the solid-phase. There is no weld pool in thefriction stir welding anymore. Till now, numerical and empiricalinvestigations to thoroughly understand the heat transfer andmaterial flow phenomena in the FSW process are still ongoing[6,7].
FSW was initially used for aerospace aluminum alloys, becauseof their low arc weldability, e.g. on AlCu type (2XXX series) and
tabaeipour).
AlZnMgCu (7XXX series) alloys [4,8,9]. The mechanical propertiesof the arc welded joint in these alloys can be seriously compro-mised by a dendritic structure formed in the fusion zone [9,10]. Inrecent years, attempts have been made to join other dissimilarmetals like Al–Ti [11,12], Al–Cu [13,14], Al–Steel [15] and Al MatrixComposites (AMCs) [16] using FSW. Currently, the method is beingused in a broad range of industrial applications including aero-space, automotive, pressure vessel construction, shipbuilding andoffshore construction.
While the parent material of Al-alloys generally containspancake-shaped grains with nonequiaxed subgrains inside [17],the FSW process creates three distinctive regions in the weld zone.These are known as the Heat-Affected Zone (HAZ), the Thermo-Mechanically Affected Zone (TMAZ) and the dynamically recrys-tallized zone (DXZ) around the weld center [10]. The DXZ, which isoften also referred to as the nugget zone [18], is characterized by afine grain equiaxed structure. However, variations in the grain sizemay occur going from the bottom to the top of the weld zone dueto the temperature profile and the heat dissipation in the nuggetzone [4]. Mishra et al. also proclaimed that the grain size may beinfluenced by other welding parameters, by the parent materialcomposition, the geometry of the tool and others [4,19]. Accordingto Cabibbo et al., the average grain size of the nugget zone is finerthan the parental material in 6XXX aluminum alloys by a factor ofapproximately 40 [20]. Unlike the nugget zone, the HAZ has not

Fig. 1. Schematic drawing of the friction stir welding procedure.
M. Tabatabaeipour et al. / NDT&E International 80 (2016) 23–3424
been mechanically disturbed by FSW, but only thermally. There-fore, this zone retains an approximately similar grain morphologyas the base metal [20]. Finally, the TMAZ is the transition zonebetween the base metal and the nugget zone. It can be dis-tinguished by a highly deformed structure with elongated grains[18,21]. As a result, an upward flowing pattern of elongated grains(relative to the parent plate) can be observed around the nuggetzone in the TMAZ [4,17,22]. Di Paola et al. have shown that there isa significant difference in dislocation density between the TMAZand the nugget zone, the concentration being low in the crystal-lized zone compared to the non-recrystallized region [22]. Inaddition, Cabibbo et al. extensively reported that the pattern of thegrain flow on the retreating side is much larger and broader thanthat on the advancing side [20]. Furthermore, Kadlec et al. recentlyshowed that the interface boundary between the TMAZ and thenugget zone on the advancing side is more distinct than on theretreating side since the tool displacement and the torsion speedsare enforcing each other on the advancing side [23]. Note that “theadvancing side” is the side of the tool where the local direction ofthe tool surface due to the tool rotation and the welding directionare in the same direction, whereas they are in the oppositedirection along the retreating side (see Fig. 1).
In contrast to traditional welding procedures, FSW can suc-cessfully avoid solidification flaws such as porosity and hotcracking in the weld region due to the solid-phase characteristicsof the joining procedure [8,24]. However, other flaws, such as lackof penetration (LOP), wormholes (tunnel defects), kissing bondsand lazy S features (also called zigzag line defect, Joint LineRemnant (JLR) or entrapped oxide defect) are common in FSWs[3,25]. The latter mostly occurs due to the presence of a con-tinuous oxide film in the weld zone coming from an initial oxidelayer on the butt surfaces [26–29]. When the entrapped oxide filmis connected to the root of the friction stir welded joints, the lazy Sfeatures are called kissing bonds, weak bonds or root-flaws[8,25,27,30,31]. Material properties, tool design [32,33] and cri-tical operation parameters (including rotation and translationspeed [34], tool plunge depth, spindle tilt angle, forge force andfixture clamping condition) play an important role in the forma-tion of flaws and in the quality of the [8,25,27,35–38]. Weldingconditions such as insufficient tool plunge depth, low tilt angleand insufficient heat-input may result in the formation of kissingbond flaws at the weld root [8,25, 27,30]. LOP defects, on the otherhand, occur when both sides of the root region are not properlyforged. In this case, the original parent metals of the faying sur-faces of the butt-joint root region are still undisturbed and thedefect is parallel to the faying surface [39]. Additionally, kissingbond defects might originate from the tip of LOP defects. In moregeneral terms, Arbegast has identified defects in FSWs as eitherflow-related (e.g. wormholes and surface galling) or geometry-related (e.g. LOP and lack of fusion (LOF) defects) [35].
Defects in FSWs, particularly root flaws exceeding a certainsize, may have an adverse effect on the mechanical properties andfatigue resistance of the friction stir welded joint components.Bending loading may cause a LOP defect containing welded joint
to break in a brittle manner, whereas the joint more likely willdevelop surface cracks in the presence of a kissing bond defect atthe root [27,40]. Furthermore, kissing bond flaws are preferredsites for macrocrack initiation [23,30,41–46], thereby reducing thestrength properties of the material. In view of achieving defect-free welded joints, further optimization of the FSW control vari-ables is important [47–53]. On the other hand, high level qualityassurance techniques need to be developed and implemented toassess potential defects in the welds due to uncontrollable vari-ables, e.g. slight thickness variation or material heterogeneity and/or the uncertainty in other welding parameters [54]. Commonnon-destructive techniques include fluorescent penetrating fluidinspection [55], ultrasonic testing, acoustic emission [56], X-ray[57], eddy current, magnetic methods [58], and ultrasound-excitedinfrared thermography [59]. Many of these conventional non-destructive testing (NDT) methods can be easily used for thedetection of volumetric faults (tunnel defects and voids). However,in many cases, they are insensitive and sometimes impractical forthe more challenging root flaws [8,55]. For instance, in order toobtain satisfactory results, the fluorescent penetrating fluidinspection method requires access to the back side of the butt-joint structure [55]. Digital X-ray radiography and lock-in infraredthermography have been exploited to examine sub-surface tunneldefects in FSW joints [60,61]. LOP defects can only be detectedusing radiographic inspection, if their size is greater than or equalto 30% of the material thickness [62]. In recent years, eddy currentNDT of FSW root flaws has been reported [63–65]. Santos et al.have stated that eddy currents could detect superficial defects atabout 60 mm deep from the far side, i.e. the side that contains theroot flaw [66]. The use of conventional ultrasonic techniques hasshown that it is not straightforward to detect small defects at thebottom of the weld or tiny root flaws in friction stir welded joints[67]. To transcend this, several studies have invested in advancingand optimizing these ultrasonic techniques. Hedin et al. havereported the detection of voids with an average size of 200 mm infriction stir welded T-joints using laser ultrasonics [68]. Otherstudies demonstrated the use of laser ultrasonics with frequenciesup to 220 MHz to detect LOP defects, hooking and void flaws in lapand butt-welded joints [69,70]. Detection of weak bonds usingleaky surface acoustic waves at frequencies in the range of 0.4–2 GHz has also been reported [71]. Using acoustic lenses, C-scanimages have been obtained with high resolution in the order of1.5–3 mm. Martin et al. successfully examined welded joints (dif-fusion welding, electron-beam welding and TIG welding) usingnormal and angle-beam immersion ultrasound in a pulse-echomode with a central frequency of 15 and 25 MHz for the detectionof inclusions (tungsten wire) and artificial longitudinal and crossholes [72]. Multiple-incident angle ultrasonic methods wereevaluated by Liu et al. using an immersion system. They concludedthat the effect of the incident angle on the reflection coefficient ofsmall void defects at the bottom of the weld is very small [73].Kinchen et al. validated the detection of LOP defects at 25–30% ofthe thickness using a modified RD/Teck Phased Array UT system[62]. In the framework of the “Qualistir” project [74], Bird et al.have focused on the detection of entrapped oxide flaws using a10–15 MHz phased array system. In their early experiments, usingfocused 10–30 MHz immersion probes in backscattering mode, thesignal-to-noise ratio was very low for reliable detection of kissingbond defects from back-reflected signals. As an alternative, theyproposed a noise distribution analysis, i.e. investigating the ratio ofthe parent metal noise to the weld root noise [29,75,76]. Iwakiet al. proposed an electronic scanning in pulse-echo mode using a10 MHz phased array to detect near surface imperfections and rootflaws, and they investigated the effect of different incident angleson the resulting defect maps along the welding direction [77,78].Lastly, Tabatabaeipour et al. have proposed a contact nonlinear

M. Tabatabaeipour et al. / NDT&E International 80 (2016) 23–34 25
pulse-inversion ultrasonic technique in a pitch-catch mode fromthe tool side for kissing bond detection [79,80]. In this novelmethod, two out of phase chirp signals (2–5 MHz) were emittedby a 3.5 MHz transducer at each position along the weld center-line. Each position, the corresponding back-wall reflected signalswere captured by a 7 MHz Fermat transducer and added togetherto investigate the second harmonic bandwidth (4–10 MHz) energywhich is indicative of a lack of inversion symmetry (nonlinearity).As a result, the presence of kissing bond defects can be interpretedby a 2D heat map image representing the nonlinearity as functionof the frequency and the position along the weld centerline.
Several researchers proposed a fusion of multiple NDE techni-ques for the detection of a wide spectrum of defects in FSWs. Thetriple NDE approach of Lamarre et al. (consisting of a 10 MHzpulse-echo ultrasonic analysis using a phased array, attenuationmeasurements and eddy current arrays) confirmed that themodified phased array method offers superior flexibility over theequivalent mechanical scanning technique [67]. Alternatively,Santos et al. proposed an integrated NDT system for the detectionof imperfections in FSWs, incorporating a 4 MHz creeping ultra-sonic probe, a 15 MHz Time of Flight Diffraction (ToFD), and twoeddy current probes (20 kHz and 2 MHz) [81,82]. Mandache et al.evaluated root discontinuities in FSWs using five NDE methodsconsisting of a 10 MHz phased array, a laser generated ultrasonicwave analysis employing the synthetic aperture focusing techni-que (SAFT), a conventional eddy current inspection, a pulsed eddycurrent approach and liquid penetrant testing. They concludedthat SAFT, carried out from the tool side of the welded joints withfrequencies up to 220 MHz, was the only suitable technique forkissing bond defect detection. Other inspection methods couldonly be used to identify LOP flaws, depending on the accessibleside [40].
Despite the fact that plenty of studies have already dealt withroot flaw examination using various advanced and optimizedtechniques, this paper attempts to put a new perspective on angle-beam immersion ultrasonic testing of FSW butt-joints. Backscatteranalysis of an oblique incident ultrasonic C-scan is the basis of themethod, and as such not new in NDT&E. The novelty of the presentresearch is the integration of the technique with empirical posi-tioning and time gating to increase the probability of detection
Table 1Operational welding parameters used for the five exemplary samples for which theresults are discussed in Section 4.
Sample Spindle rotation (rpm) Feed rate (mm/min)
1 500 5002 500 4003 500 5004 300 1505 600 600
Fig. 2. Schematics of the experimental setup, a) pitch-catch mode for transduce
and identification of root flaws. Proper positioning and gatingprior to the scanning is essential to obtain the ultrasonic finger-print of a friction stir welded butt-joint which is characteristic forthe various types of root surface defects.
Section 2 describes the ultrasonic measurement system used inthis research. The methodology, employing a specific empiricalpositioning and gating procedure, is explained in Section 3. Resultsare presented and discussed in Section 4, and conclusions andfurther perspectives are given in Section 5.
2. Ultrasonic measurement system and materials
2.1. Experimental setup
The proposed FSW inspection is based on an oblique incidenceultrasonic C-scan measurement in backscatter mode (pitch catch).Flat transducers were selected for this experiment rather than off-the-shelf focused ones. In fact, as the oblique incidence induces anangle dependent refraction, the energy of a focused transducer,just like that of a flat transducer, will not be focused anymoreinside the plate. Really, to properly focus the energy of an angle-beam probe after refraction on a flat surface, the working surfaceof transducer should have a Fermat shape [83]. As such transdu-cers should be custom made and are therefore quite expensive, weopted to test the proposed method first for the most basic type oftransducer, i.e. a flat Panametrics V382.
The experimental setup for the angle-beam FSW inspe-ction was designed to perform a two-step procedure including 1) apre-scan adjustment measurement of the transducer positioningand a determination of the proper time gating in a pitch-catchmode, and 2) the actual 2D scanning of the welded sample inpulse-echo mode. The ultrasonic measurements are carried out inimmersion conditions using a water bath.
1. Pitch-catch mode for pre-scan positioning and gating calcula-tion.In pitch-catch mode, two identical Panametrics V382 flat trans-ducers (3.5 MHz central frequency and 13 mm nominal elementsize) are positioned in a plane perpendicular to the welding line,each on a rotation stage with opposite angles (θi and �θi), atequal vertical distance from the top side of the sample. Thehorizontal separation distance between the two transducers wasset to two times the skip distance, s¼ 4T tanθr where T and θr
are the sample thickness and refraction angle respectively. Theentire system holding the two rotation stages can be adjusted inheight by a linear motion stage in vertical direction (which is partof the mechanical 3D scanner that is also being used for theactual C-scan measurements). The emitting transducer is excitedby a Panametrics 5058PR Pulser/Receiver at 400 Vpk amplitude.Reflected signals arriving at the second transducer are received
r positioning and time gating, b) pulse-echo mode for slanted C-scanning.

M. Tabatabaeipour et al. / NDT&E International 80 (2016) 23–3426
by the same Pulser/Receiver and digitized using a DAQ NI PXI-5122 acquisition card. The 100 MHz sampling frequency dataacquisition system and the (vertical) motion stage are bothcontrolled by LabVIEW. The experimental setup is shown sche-matically in Fig. 1a. The methodology to determine the propervertical offset for the transducers and the time gating window isexplained in Section 3.
2. Pulse-echo mode and scanning.The actual scanning of the FSW joints is carried out using asingle Panametrics V382 flat transducer (3.5 MHz) in pulse-echo(or backscatter) mode, with the vertical standoff position of thetransducer fixed to the value determined in the first step of theprocedure, and rotated at the preset inclination angle θi. In fact,the setup resulting from step 1 is used in which the secondtransducer becomes obsolete. The same Panametrics 5058PRPulser/Receiver as mentioned above is used to excite thetransducer at 400 Vpk amplitude. Backscattered signals receivedat the R-channel of this Pulser/Receiver are then digitized by theDAQ NI PXI�5122 acquisition card. Scanning is now performedin a horizontal plane parallel to the sample surface. Again, thedata acquisition system and the in-plane motion are controlledby LabVIEW. The experimental setup is shown schematically inFig. 1b.
2.2. Materials
In this report, we only consider FSW joints of flat aluminum7XXX samples (AA7475-T7351) with 6.35 mm thickness. The cri-tical angles for longitudinal and shear waves in the FSW aluminumsamples were calculated to be θL ¼ 13:21 and θS ¼ 27:41 respec-tively, based on elasticity data obtained from the manufacturer(TWI, UK [84]). To perform the ultrasonic inspection and simplifythe spectrum of reflected waves coming from various mode con-versions inside the welded plate, we opted to fix the incident angle
0
1
2
Local maximum due to the direct back-wall reflection
Fig. 3. Vertical scanning measurement above the FS welded butt-joint to deter-mine the appropriate vertical offset of the transmitter. Labels 0, 1 and 2 refer to theschematics illustrated in Fig. 3.
Sample
waterwater
12
ba
TT R
Fig. 4. Schematic explanation for the local maxima obtained in the vertical scanning mreflection, c) direct top-surface reflection. The horizontal distance between the transmi
at a value between θL and θS such that only shear waves could beexcited inside the plate. For a fixed incident angle of θi ¼ 251, therefraction angle of the shear waves in the samples is θr ¼ 651.
Thirteen FSW samples have been investigated. All sampleswere tested in slanted C-scan backscatter mode from the tool-sideof the FSW butt-joints. The results for five exemplary samplesillustrating the typical ‘flaw’ patterns that can be expected will bediscussed in detail in Section 4. The welding parameters of thesesamples are given in Table 1. The tool plunge depth varies between5.6 and 6.1 mmwith a nominal spindle title angle of 0° to producedifferent defect sizes. All welding parameters were set based onthe previous welding experience with similar alloys. All othersamples, not listed in Table 1 but examined under the same cir-cumstances, showed patterns that belonged to one of the ‘flawpattern” classes represented by the five exemplary samples.
3. Experimental focusing and gating procedure
As described above, the angle-beam immersion measurementsystem is suitable for pitch-catch as well as for pulse-echomeasurements.
3.1. Pre-scan positioning and gating
In the first stage of the measurements, the pitch-catch mode isused to determine the appropriate vertical offset of the transmitterin a plane perpendicular to the welding line. This is done byadjusting the stand-off distance between the transmitter–receiverplane (T–R plane) and the tool-side surface of the sample (Fig. 2a).The separation distance between transmitter and receiver (bothinclined at an incidence angle of 25°) is kept fixed at two times theskip distance (2s¼54.5 mm), while the position of the T–R plane ismoved vertically, i.e. perpendicular to the tool-side surface of thesample. During this vertical scanning, signals are recorded by thereceiver in pitch catch mode, and the signal amplitude maximumis recorded as function of the offset (see Fig. 3). The three observedlocal maxima can be attributed to the second skip back-wallreflection (label 2), the direct back-wall reflection (label 1) andthe direct top-surface reflection (label 0) respectively as illustratedin the schematics in Fig. 4. Based on the measured data, the heightof the T–R plane above the sample surface is then set to theposition at which the direct back-wall local maximum wasobserved.
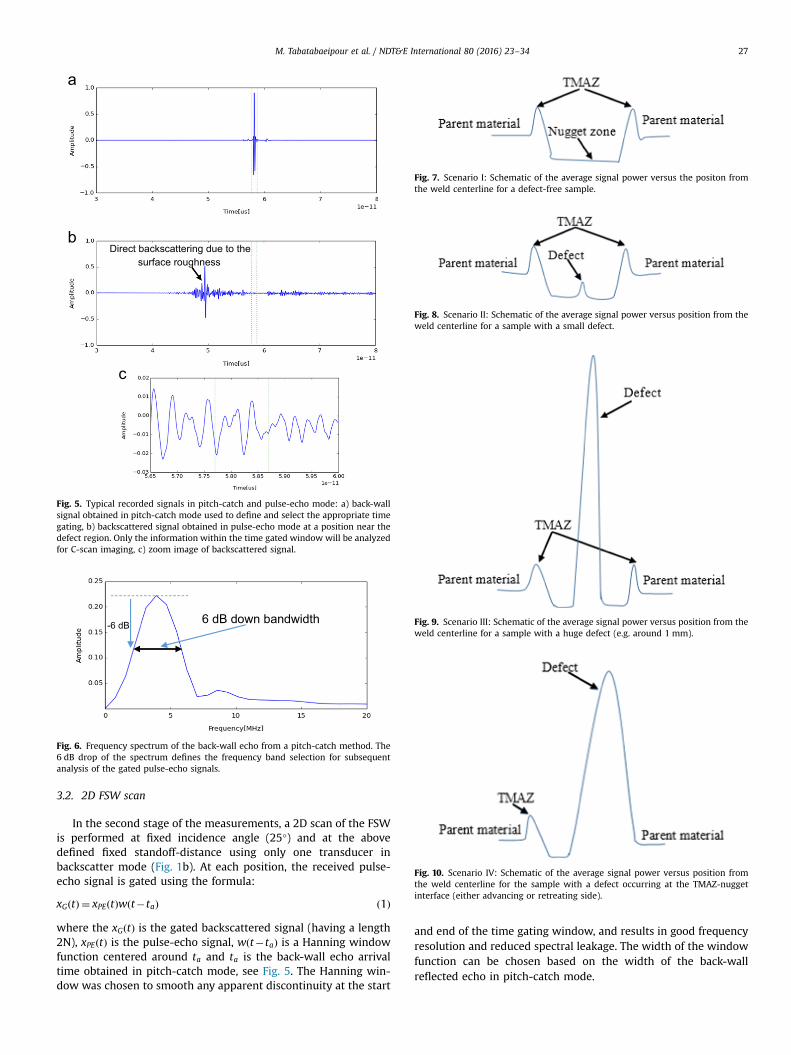
Having adjusted and fixed the stand-off distance, a time gatingwindow is calculated and selected based on the arrival window ofthe back-wall reflection echo received in pitch-catch mode (seeFig. 5a). Since the distance and time for the full path in the pitch-catch measurement is the same as for the backscatter measure-ment, the same time gating window can be used as an automatedtime gate for the subsequent pulse echo C-scanning in the secondstage of the measurement procedure (see Fig. 5b).
Sample Sample
water
0
c
R
T R
easurement (Fig. 2), a) second skip distance local maximum, b) direct back-walltter and receiver is fixed to twice the skip distance.
Direct backscattering due to the surface roughness
Fig. 5. Typical recorded signals in pitch-catch and pulse-echo mode: a) back-wallsignal obtained in pitch-catch mode used to define and select the appropriate timegating, b) backscattered signal obtained in pulse-echo mode at a position near thedefect region. Only the information within the time gated window will be analyzedfor C-scan imaging, c) zoom image of backscattered signal.
-6 dB 6 dB down bandwidth
Fig. 6. Frequency spectrum of the back-wall echo from a pitch-catch method. The6 dB drop of the spectrum defines the frequency band selection for subsequentanalysis of the gated pulse-echo signals.
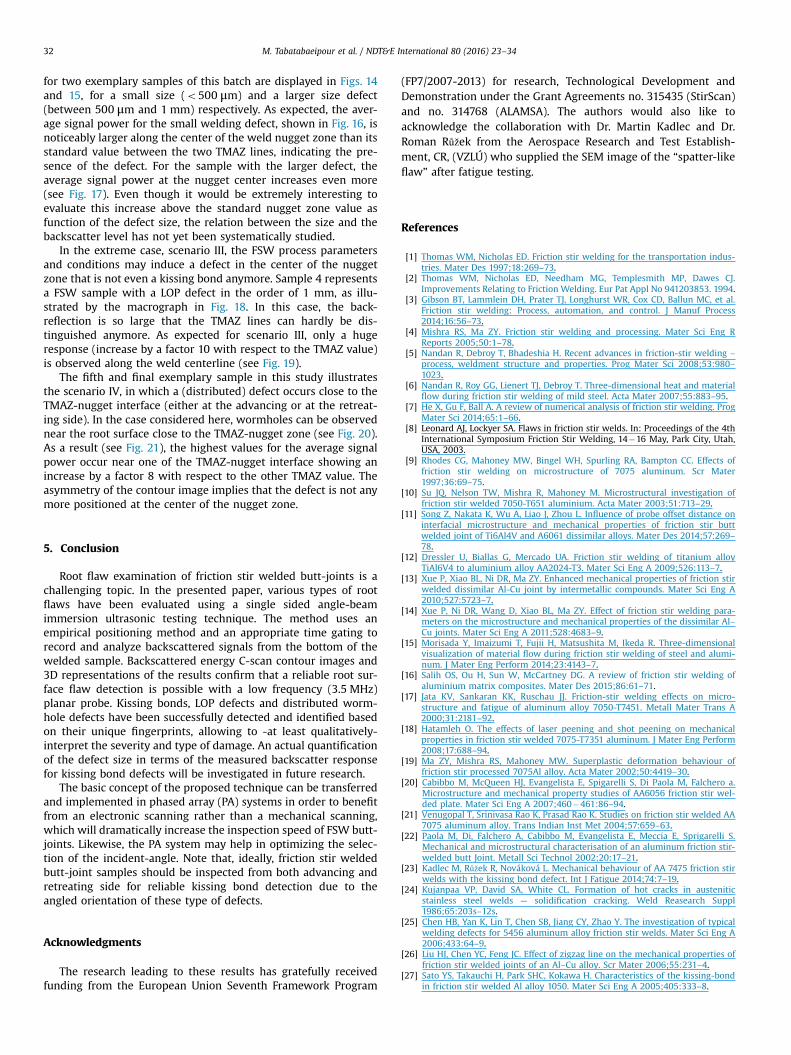
Fig. 7. Scenario I: Schematic of the average signal power versus the positon fromthe weld centerline for a defect-free sample.
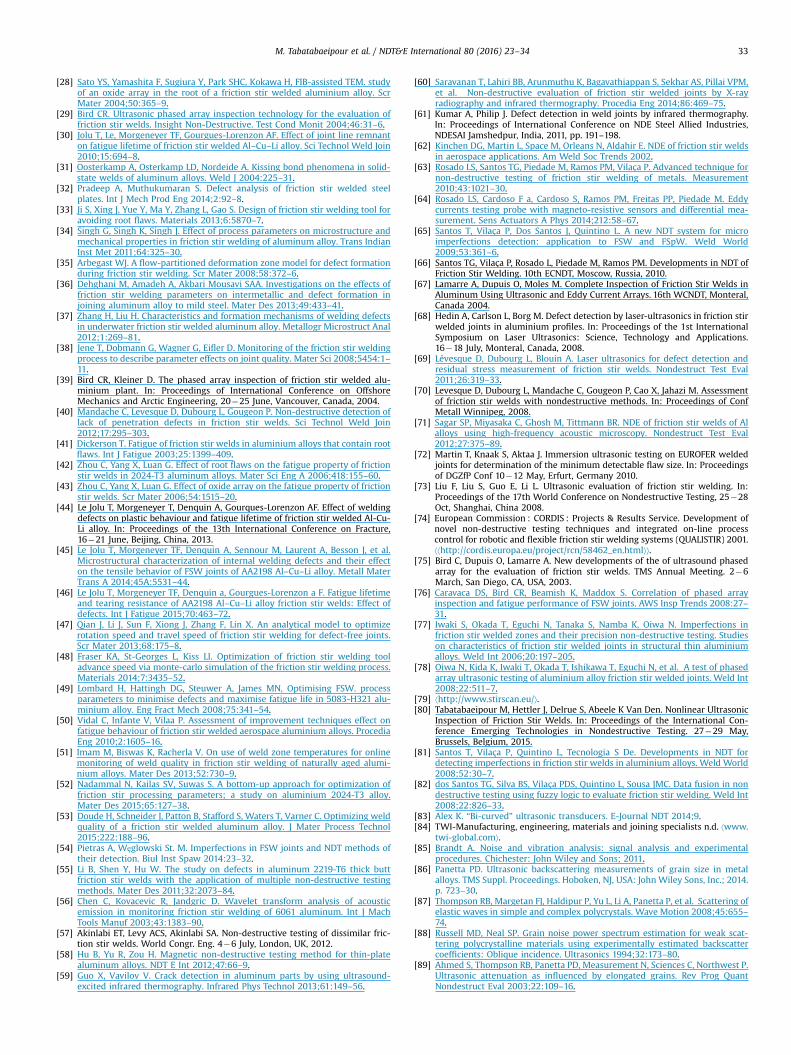
Fig. 8. Scenario II: Schematic of the average signal power versus position from theweld centerline for a sample with a small defect.
Fig. 9. Scenario III: Schematic of the average signal power versus position from theweld centerline for a sample with a huge defect (e.g. around 1 mm).
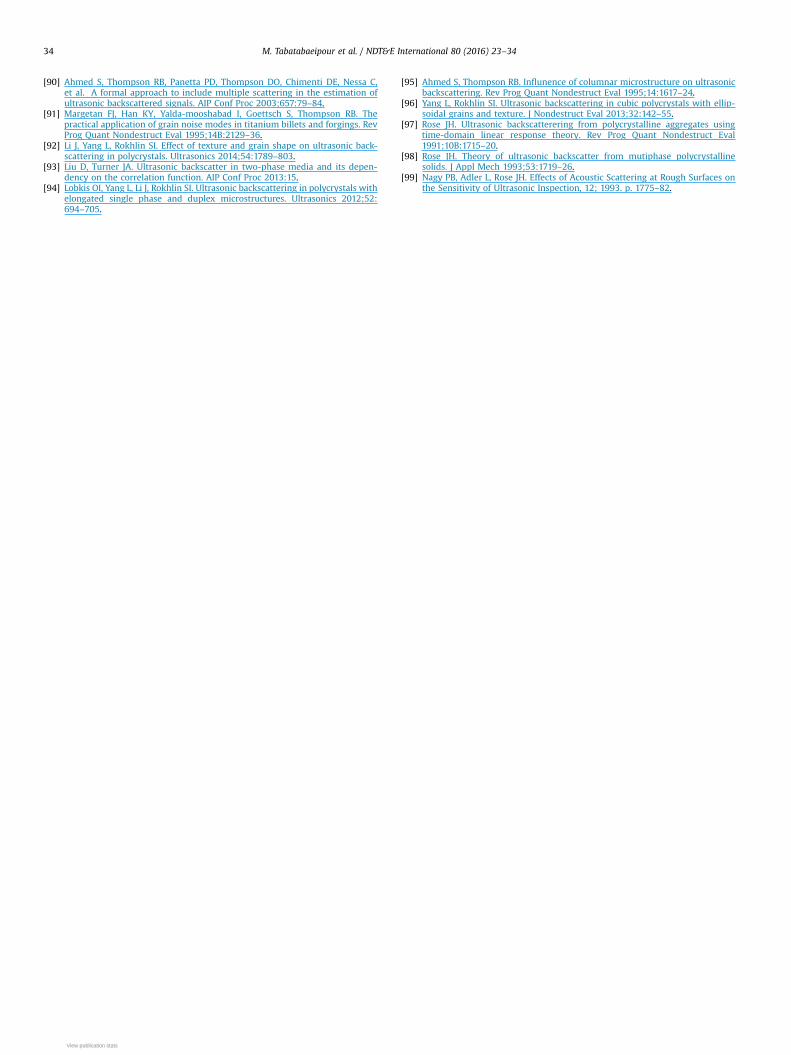
Fig. 10. Scenario IV: Schematic of the average signal power versus position fromthe weld centerline for the sample with a defect occurring at the TMAZ-nuggetinterface (either advancing or retreating side).
M. Tabatabaeipour et al. / NDT&E International 80 (2016) 23–34 27
3.2. 2D FSW scan
In the second stage of the measurements, a 2D scan of the FSWis performed at fixed incidence angle (25°) and at the abovedefined fixed standoff-distance using only one transducer inbackscatter mode (Fig. 1b). At each position, the received pulse-echo signal is gated using the formula:
xG tð Þ ¼ xPEðtÞwðt�taÞ ð1Þ
where the xG tð Þ is the gated backscattered signal (having a length2N), xPEðtÞ is the pulse-echo signal, wðt�taÞ is a Hanning windowfunction centered around ta and ta is the back-wall echo arrivaltime obtained in pitch-catch mode, see Fig. 5. The Hanning win-dow was chosen to smooth any apparent discontinuity at the start
and end of the time gating window, and results in good frequencyresolution and reduced spectral leakage. The width of the windowfunction can be chosen based on the width of the back-wallreflected echo in pitch-catch mode.

M. Tabatabaeipour et al. / NDT&E International 80 (2016) 23–3428
Subsequently, the power spectral density of the gated back-scattered signal is calculated over a fixed frequency band. Thefrequency band is selected using the back-wall echo obtained inthe pitch-catch method. The 6 dB drop method applied to thefrequency spectrum of this echo defines a suitable frequency bandfor analyzing the pulse-echo signals (Fig. 6). Here, the frequencyband 2–6 MHz is used. The power spectral density (PSD) is thencalculated as follows:
PSD fð Þ ¼ Power spectrum in V2rms
Δf � NENBW ð2Þ
Here, Δf is the frequency resolution, and NENBW stands for theNormalized Equivalent Noise Bandwidth of the window which isequal to 1.5 bins for a Hanning window. Since the application of awindow increases the effective bandwidth of an FFT bin by itsequivalent noise bandwidth, it is required to subsequently divideagain by this amount to correct this phenomena for the spectraldensity evaluation [85]. The power spectrum is defined as:
Power spectrum¼ FFT xG tð Þð Þ � FFT� xG tð Þð ÞN2 ð3Þ
where FFT� xG tð Þð Þ denotes the complex conjugate of FFT xG tð Þð Þ,which is the fast fourier transform of the gated backscatteredsignal of length 2N.
Next, the average signal power value Pðx; yÞ is calculated foreach measurement position along and from the weld centerline,using the formula:
P x; yð Þ ¼ Average signal power¼ 1N
X6MHz
f ¼ 2MHzPSD fð Þ ð4Þ
Finally, the average signal power as a function of the positionalong and from the weld centerline can be visualized as a 3D figureand/or as a C-scan (contour) image. In all scans, the signals weremeasured over a distance of 20 mm in the direction across theweld, (10 mm from the weld centerline each side) using a step sizeof 0.5 mm. In the direction along the weld, the step size was set to1 mm.
Fig. 11. Root side of a defect free FSW butt-joint (scenario I), except for two isolateddefect locations (“spatter-like flaws”) close the TMAZ-nugget interface.
Fig. 12. Macrograph of a FSW butt-joint transverse cross-section (left¼ full view and rigclose to the TMAZ-nugget zone. Evidence for this small defect (with a length of the ord
4. Results and discussion
4.1. Expected scenarios
Ultrasound that propagates through a polycrystalline materialcan be scattered at grain boundaries due to the grain anisotropyand grain-to-beam angle. Commonly, two phenomena may hap-pen as a result of this interaction. Firstly, the propagating wavewill be partially attenuated as a result of the conversion of thesound energy to other forms of energy. Secondly, a portion of thescattered waveform will be reflected back to the transmitter. Thisdetectable energy is known as the grain noise or backscatterednoise, and carries important information about the microstructureof the medium as it can be attributed to its physical propertiessuch as grain size, texture, shape and orientation. Several effortshave been reported to better understand and model back-scattering signals in polycrystalline materials [86–99]. In the fra-mework of the present study, it is important to realize that thenatural backscattering in polycrystalline materials, such as Alalloys, may hamper or at least complicate the detectability of smalland subtle defects, such as kissing bond root flaws.
Careful evaluation of the experimentally obtained 3D back-scatter plots (Eq. (4): z¼ Pðx; yÞ) and C-scan contour images of thethirteen FSW samples shows that only four different and illus-trative scenarios may occur. The scenarios are schematically illu-strated in Figs 7–10, representing the results of a line-scan per-pendicular to the weld centerline (also called D-scan, i.e. a one-dimensional C-scan across the weld center).
I. In the ideal case of a defect-free welded butt-joint, one candistinguish three characteristic regions, consisting of theparent material, the TMAZ and the nugget, as shown inFig. 7. The coarse and elongated grain morphology of theTMAZ zones results in a relatively high average backscatteredpower, meaning that the structural noise level in theseregions is increased with respect to the level of the naturalbackscattering in the parent material. In contrast, the finegrain equiaxed structure in the nugget zone results in lowaverage signal power.
II. In case of a very small root-flaw (kissing bond) in the nuggetzone, the average signal power at the center part of the
100 µm 2 mm
ht¼zoom) taken at one of the “spatter-like flaw” locations, showing small defectser of 100 mm) can be found in the average signal power scan, shown in Fig. 14.
Spatter location
Root side of the sample
Fatigue crack initiation siteKissing bond
Fig. 13. SEM Image, representing the fracture surface of the sample at the spatterlocation.

Fig. 14. C-scan contour image and 3D representation of the average signal power data obtained for a FSW butt-joint illustrating (for the major part) scenario I (defect freesample), except for two isolated defect locations close the TMAZ-nugget interface.
500µm
Nugget zone
Fig. 15. Macrograph of a FSW butt-joint transverse cross-section showing a kissing bond defect at the root of the nugget zone, illustrating scenario II.
Fig. 16. C-scan contour image and 3D representation of the average signal power data obtained for a FSW butt-joint illustrating scenario II (very tiny defect, smaller than500 μm), all along the welding line.
M. Tabatabaeipour et al. / NDT&E International 80 (2016) 23–34 29

Fig. 17. C-scan contour image and 3D representation of the average signal power data obtained for a FSW butt-joint illustrating scenario II (larger size defect, between500 μm and 1 mm), all along the welding line.
1mm
Fig. 18. Macrograph of a FSW butt-joint transverse cross-section (left¼full view and right¼zoom) showing a LOP defect at the root of the nugget zone, illustrating scenarioIII. The huge defect can be easily observed by the proposed method, as shown in Fig. 19.
TMAZ
line
Fig. 19. C-scan contour image and 3D representation of the average signal power data obtained for a FSW butt-joint illustrating scenario III (large defect, e.g. LOP).
M. Tabatabaeipour et al. / NDT&E International 80 (2016) 23–3430

M. Tabatabaeipour et al. / NDT&E International 80 (2016) 23–34 31
nugget increases due to the presence of the defect, as shownin Fig. 8. It should be mentioned that this tiny indication mayalso be shifted towards one of the TMAZ-nugget interfaces(advancing/retreating side) depending on the location of thedefect (as will be illustrated later in one of the examples).
III. As the defect becomes larger and potentially contains zonesthat may be completely open (i.e. non-touching surfaces dueto LOP), the average backscattered signal power at the centerpart of the nugget further increases, as schematically shownin Fig. 9.
IV. The fourth scenario occurs when the defect is located close toor at one of the TMAZ-nugget interfaces (advancing/retreat-ing side). In that case, the power spectral density of theaforesaid TMAZ zone significantly increases and an asym-metric pattern is observed in the D-scan, as shown in Fig. 10.
4.2. Observations and validation
We now illustrate the above discussed scenarios for five dif-ferent samples. The results for the other studied samples can beclassified in one of the above mentioned scenarios. In all cases, a C-scan contour image and a 3D representation of the average signalpower data is shown, along with cross-section macrographs whenappropriate. To guide the eye, the TMAZ lines have been indicatedin the figures, and the region of interest for the identification ofroot weld defects is thus the area between the TMAZ lines (areabetween �5 and 5 mm from the weldline center). As can beobserved in most figures, the coarser nonequiaxed grains of theparent material systematically result in a merely chaotic
2 mm
Fig. 20. Macrograph of a FSW butt-joint transverse cross-section showing a dis-tribution of wormholes at the advancing side, illustrating scenario IV. This type ofdefect can also be easily observed by the proposed method, as shown in Fig. 21.
Fig. 21. C-scan contour image and 3D representation of the average signal power dataillustrating scenario IV.
distribution of backscatter noise outside of the region of interest(�10odo�5 mm, and 5odo10 mm). Important to note is thatthe 3D images clearly show that the average backscatter levelabove the parent material is significantly higher than the back-scatter level originating from the recrystallized and finer equiaxedgrains of nugget zone. Typical average values, relative with respectto the TMAZ backscatter level, are 45–65% for the parent materialand 10–20% for the nugget zone.
The first sample under consideration was designed to bedefect-free, and therefore, the results for a D-scan should corre-spond to scenario I. For a large fraction of the scanned area, theultrasonic backscatter response confirms the intact nature of thenugget zone. However, visual inspection from the back side (rootsurface) shows the presence of two “spatters” close to the TMAZ-nugget interface, as indicated on Fig. 11. To avoid ambiguity, it isimportant to note that these features are not spatters as knownfrom a fusion welding process. The term “spatters” in the pre-sented study was merely adopted because of the shape similarityand the origin for the “spatter-like” features is not clear. A mac-rograph of the FSW butt-joint cross-section taken at one of the“spatter-like flaw” locations shows the presence of small flawsclose to the TMAZ-nugget zone (see Fig. 12). Further investigationafter destructive fatigue testing shows that these flaws are defi-nitely important fatigue crack initiation sites. The SEM Image inFig. 13 represents the fracture surface of the sample at the spatterlocation. Kissing bonds originating from these sites can beobserved as well. In terms of flaw detection, these sites thus havesimilar characteristic defect features with symptoms such asmicrocracks and kissing bond defects. The C-scan contour imageand 3D representation of the average signal power data, shown inFig. 14, confirm that there are indeed minor elevations of thebackscatter level with respect to the nugget zone around the two‘spatter-like’ locations. Despite these features, the rest of thewelded metal zone appears to be defect-free, as supposed. There isno evidence of other peaks in the average signal power along thenugget centerline.
A second batch of test samples was designed to have a smallroot-flaw (i.e. scenario II), consistently along the whole weld line.The cross-section macrograph in Fig. 15 illustrates the presence ofa kissing bond. The results of the angle-beam ultrasonic scanning
obtained for a FSW butt-joint with distributed defects at the TMAZ-nugget line,
M. Tabatabaeipour et al. / NDT&E International 80 (2016) 23–3432
for two exemplary samples of this batch are displayed in Figs. 14and 15, for a small size (o500 μm) and a larger size defect(between 500 μm and 1 mm) respectively. As expected, the aver-age signal power for the small welding defect, shown in Fig. 16, isnoticeably larger along the center of the weld nugget zone than itsstandard value between the two TMAZ lines, indicating the pre-sence of the defect. For the sample with the larger defect, theaverage signal power at the nugget center increases even more(see Fig. 17). Even though it would be extremely interesting toevaluate this increase above the standard nugget zone value asfunction of the defect size, the relation between the size and thebackscatter level has not yet been systematically studied.
In the extreme case, scenario III, the FSW process parametersand conditions may induce a defect in the center of the nuggetzone that is not even a kissing bond anymore. Sample 4 representsa FSW sample with a LOP defect in the order of 1 mm, as illu-strated by the macrograph in Fig. 18. In this case, the back-reflection is so large that the TMAZ lines can hardly be dis-tinguished anymore. As expected for scenario III, only a hugeresponse (increase by a factor 10 with respect to the TMAZ value)is observed along the weld centerline (see Fig. 19).
The fifth and final exemplary sample in this study illustratesthe scenario IV, in which a (distributed) defect occurs close to theTMAZ-nugget interface (either at the advancing or at the retreat-ing side). In the case considered here, wormholes can be observednear the root surface close to the TMAZ-nugget zone (see Fig. 20).As a result (see Fig. 21), the highest values for the average signalpower occur near one of the TMAZ-nugget interface showing anincrease by a factor 8 with respect to the other TMAZ value. Theasymmetry of the contour image implies that the defect is not anymore positioned at the center of the nugget zone.
5. Conclusion
Root flaw examination of friction stir welded butt-joints is achallenging topic. In the presented paper, various types of rootflaws have been evaluated using a single sided angle-beamimmersion ultrasonic testing technique. The method uses anempirical positioning method and an appropriate time gating torecord and analyze backscattered signals from the bottom of thewelded sample. Backscattered energy C-scan contour images and3D representations of the results confirm that a reliable root sur-face flaw detection is possible with a low frequency (3.5 MHz)planar probe. Kissing bonds, LOP defects and distributed worm-hole defects have been successfully detected and identified basedon their unique fingerprints, allowing to -at least qualitatively-interpret the severity and type of damage. An actual quantificationof the defect size in terms of the measured backscatter responsefor kissing bond defects will be investigated in future research.
The basic concept of the proposed technique can be transferredand implemented in phased array (PA) systems in order to benefitfrom an electronic scanning rather than a mechanical scanning,which will dramatically increase the inspection speed of FSW butt-joints. Likewise, the PA system may help in optimizing the selec-tion of the incident-angle. Note that, ideally, friction stir weldedbutt-joint samples should be inspected from both advancing andretreating side for reliable kissing bond detection due to theangled orientation of these type of defects.
Acknowledgments
The research leading to these results has gratefully receivedfunding from the European Union Seventh Framework Program
(FP7/2007-2013) for research, Technological Development andDemonstration under the Grant Agreements no. 315435 (StirScan)and no. 314768 (ALAMSA). The authors would also like toacknowledge the collaboration with Dr. Martin Kadlec and Dr.Roman Růžek from the Aerospace Research and Test Establish-ment, CR, (VZLÚ) who supplied the SEM image of the “spatter-likeflaw” after fatigue testing.
References
[1] Thomas WM, Nicholas ED. Friction stir welding for the transportation indus-tries. Mater Des 1997;18:269–73.
[2] Thomas WM, Nicholas ED, Needham MG, Templesmith MP, Dawes CJ.Improvements Relating to Friction Welding. Eur Pat Appl No 941203853. 1994.
[3] Gibson BT, Lammlein DH, Prater TJ, Longhurst WR, Cox CD, Ballun MC, et al.Friction stir welding: Process, automation, and control. J Manuf Process2014;16:56–73.
[4] Mishra RS, Ma ZY. Friction stir welding and processing. Mater Sci Eng RReports 2005;50:1–78.
[5] Nandan R, Debroy T, Bhadeshia H. Recent advances in friction-stir welding –
process, weldment structure and properties. Prog Mater Sci 2008;53:980–1023.
[6] Nandan R, Roy GG, Lienert TJ, Debroy T. Three-dimensional heat and materialflow during friction stir welding of mild steel. Acta Mater 2007;55:883–95.
[7] He X, Gu F, Ball A. A review of numerical analysis of friction stir welding. ProgMater Sci 2014;65:1–66.
[8] Leonard AJ, Lockyer SA. Flaws in friction stir welds. In: Proceedings of the 4thInternational Symposium Friction Stir Welding, 14�16 May, Park City, Utah,USA, 2003.
[9] Rhodes CG, Mahoney MW, Bingel WH, Spurling RA, Bampton CC. Effects offriction stir welding on microstructure of 7075 aluminum. Scr Mater1997;36:69–75.
[10] Su JQ, Nelson TW, Mishra R, Mahoney M. Microstructural investigation offriction stir welded 7050-T651 aluminium. Acta Mater 2003;51:713–29.
[11] Song Z, Nakata K, Wu A, Liao J, Zhou L. Influence of probe offset distance oninterfacial microstructure and mechanical properties of friction stir buttwelded joint of Ti6Al4V and A6061 dissimilar alloys. Mater Des 2014;57:269–78.
[12] Dressler U, Biallas G, Mercado UA. Friction stir welding of titanium alloyTiAl6V4 to aluminium alloy AA2024-T3. Mater Sci Eng A 2009;526:113–7.
[13] Xue P, Xiao BL, Ni DR, Ma ZY. Enhanced mechanical properties of friction stirwelded dissimilar Al-Cu joint by intermetallic compounds. Mater Sci Eng A2010;527:5723–7.
[14] Xue P, Ni DR, Wang D, Xiao BL, Ma ZY. Effect of friction stir welding para-meters on the microstructure and mechanical properties of the dissimilar Al–Cu joints. Mater Sci Eng A 2011;528:4683–9.
[15] Morisada Y, Imaizumi T, Fujii H, Matsushita M, Ikeda R. Three-dimensionalvisualization of material flow during friction stir welding of steel and alumi-num. J Mater Eng Perform 2014;23:4143–7.
[16] Salih OS, Ou H, Sun W, McCartney DG. A review of friction stir welding ofaluminium matrix composites. Mater Des 2015;86:61–71.
[17] Jata KV, Sankaran KK, Ruschau JJ. Friction-stir welding effects on micro-structure and fatigue of aluminum alloy 7050-T7451. Metall Mater Trans A2000;31:2181–92.
[18] Hatamleh O. The effects of laser peening and shot peening on mechanicalproperties in friction stir welded 7075-T7351 aluminum. J Mater Eng Perform2008;17:688–94.
[19] Ma ZY, Mishra RS, Mahoney MW. Superplastic deformation behaviour offriction stir processed 7075Al alloy. Acta Mater 2002;50:4419–30.
[20] Cabibbo M, McQueen HJ, Evangelista E, Spigarelli S, Di Paola M, Falchero a.Microstructure and mechanical property studies of AA6056 friction stir wel-ded plate. Mater Sci Eng A 2007;460�461:86–94.
[21] Venugopal T, Srinivasa Rao K, Prasad Rao K. Studies on friction stir welded AA7075 aluminum alloy. Trans Indian Inst Met 2004;57:659–63.
[22] Paola M, Di, Falchero A, Cabibbo M, Evangelista E, Meccia E, Sprigarelli S.Mechanical and microstructural characterisation of an aluminum friction stir-welded butt Joint. Metall Sci Technol 2002;20:17–21.
[23] Kadlec M, Růžek R, Nováková L. Mechanical behaviour of AA 7475 friction stirwelds with the kissing bond defect. Int J Fatigue 2014;74:7–19.
[24] Kujanpaa VP, David SA, White CL. Formation of hot cracks in austeniticstainless steel welds — solidification cracking. Weld Reasearch Suppl1986;65:203s–12s.
[25] Chen HB, Yan K, Lin T, Chen SB, Jiang CY, Zhao Y. The investigation of typicalwelding defects for 5456 aluminum alloy friction stir welds. Mater Sci Eng A2006;433:64–9.
[26] Liu HJ, Chen YC, Feng JC. Effect of zigzag line on the mechanical properties offriction stir welded joints of an Al–Cu alloy. Scr Mater 2006;55:231–4.
[27] Sato YS, Takauchi H, Park SHC, Kokawa H. Characteristics of the kissing-bondin friction stir welded Al alloy 1050. Mater Sci Eng A 2005;405:333–8.
M. Tabatabaeipour et al. / NDT&E International 80 (2016) 23–34 33
[28] Sato YS, Yamashita F, Sugiura Y, Park SHC, Kokawa H, FIB-assisted TEM. studyof an oxide array in the root of a friction stir welded aluminium alloy. ScrMater 2004;50:365–9.
[29] Bird CR. Ultrasonic phased array inspection technology for the evaluation offriction stir welds. Insight Non-Destructive. Test Cond Monit 2004;46:31–6.
[30] Jolu T, Le, Morgeneyer TF, Gourgues-Lorenzon AF. Effect of joint line remnanton fatigue lifetime of friction stir welded Al–Cu–Li alloy. Sci Technol Weld Join2010;15:694–8.
[31] Oosterkamp A, Osterkamp LD, Nordeide A. Kissing bond phenomena in solid-state welds of aluminum alloys. Weld J 2004:225–31.
[32] Pradeep A, Muthukumaran S. Defect analysis of friction stir welded steelplates. Int J Mech Prod Eng 2014;2:92–8.
[33] Ji S, Xing J, Yue Y, Ma Y, Zhang L, Gao S. Design of friction stir welding tool foravoiding root flaws. Materials 2013;6:5870–7.
[34] Singh G, Singh K, Singh J. Effect of process parameters on microstructure andmechanical properties in friction stir welding of aluminum alloy. Trans IndianInst Met 2011;64:325–30.
[35] Arbegast WJ. A flow-partitioned deformation zone model for defect formationduring friction stir welding. Scr Mater 2008;58:372–6.
[36] Dehghani M, Amadeh A, Akbari Mousavi SAA. Investigations on the effects offriction stir welding parameters on intermetallic and defect formation injoining aluminum alloy to mild steel. Mater Des 2013;49:433–41.
[37] Zhang H, Liu H. Characteristics and formation mechanisms of welding defectsin underwater friction stir welded aluminum alloy. Metallogr Microstruct Anal2012;1:269–81.
[38] Jene T, Dobmann G, Wagner G, Eifler D. Monitoring of the friction stir weldingprocess to describe parameter effects on joint quality. Mater Sci 2008;5454:1–11.
[39] Bird CR, Kleiner D. The phased array inspection of friction stir welded alu-minium plant. In: Proceedings of International Conference on OffshoreMechanics and Arctic Engineering, 20�25 June, Vancouver, Canada, 2004.
[40] Mandache C, Levesque D, Dubourg L, Gougeon P. Non-destructive detection oflack of penetration defects in friction stir welds. Sci Technol Weld Join2012;17:295–303.
[41] Dickerson T. Fatigue of friction stir welds in aluminium alloys that contain rootflaws. Int J Fatigue 2003;25:1399–409.
[42] Zhou C, Yang X, Luan G. Effect of root flaws on the fatigue property of frictionstir welds in 2024-T3 aluminum alloys. Mater Sci Eng A 2006;418:155–60.
[43] Zhou C, Yang X, Luan G. Effect of oxide array on the fatigue property of frictionstir welds. Scr Mater 2006;54:1515–20.
[44] Le Jolu T, Morgeneyer T, Denquin A, Gourques-Lorenzon AF. Effect of weldingdefects on plastic behaviour and fatigue lifetime of friction stir welded Al-Cu-Li alloy. In: Proceedings of the 13th International Conference on Fracture,16�21 June, Beijing, China, 2013.
[45] Le Jolu T, Morgeneyer TF, Denquin A, Sennour M, Laurent A, Besson J, et al.Microstructural characterization of internal welding defects and their effecton the tensile behavior of FSW joints of AA2198 Al–Cu–Li alloy. Metall MaterTrans A 2014;45A:5531–44.
[46] Le Jolu T, Morgeneyer TF, Denquin a, Gourgues-Lorenzon a F. Fatigue lifetimeand tearing resistance of AA2198 Al–Cu–Li alloy friction stir welds: Effect ofdefects. Int J Fatigue 2015;70:463–72.
[47] Qian J, Li J, Sun F, Xiong J, Zhang F, Lin X. An analytical model to optimizerotation speed and travel speed of friction stir welding for defect-free joints.Scr Mater 2013;68:175–8.
[48] Fraser KA, St-Georges L, Kiss LI. Optimization of friction stir welding tooladvance speed via monte-carlo simulation of the friction stir welding process.Materials 2014;7:3435–52.
[49] Lombard H, Hattingh DG, Steuwer A, James MN, Optimising FSW. processparameters to minimise defects and maximise fatigue life in 5083-H321 alu-minium alloy. Eng Fract Mech 2008;75:341–54.
[50] Vidal C, Infante V, Vilaa P. Assessment of improvement techniques effect onfatigue behaviour of friction stir welded aerospace aluminium alloys. ProcediaEng 2010;2:1605–16.
[51] Imam M, Biswas K, Racherla V. On use of weld zone temperatures for onlinemonitoring of weld quality in friction stir welding of naturally aged alumi-nium alloys. Mater Des 2013;52:730–9.
[52] Nadammal N, Kailas SV, Suwas S. A bottom-up approach for optimization offriction stir processing parameters; a study on aluminium 2024-T3 alloy.Mater Des 2015;65:127–38.
[53] Doude H, Schneider J, Patton B, Stafford S, Waters T, Varner C. Optimizing weldquality of a friction stir welded aluminum alloy. J Mater Process Technol2015;222:188–96.
[54] Pietras A, Węglowski St. M. Imperfections in FSW joints and NDT methods oftheir detection. Biul Inst Spaw 2014:23–32.
[55] Li B, Shen Y, Hu W. The study on defects in aluminum 2219-T6 thick buttfriction stir welds with the application of multiple non-destructive testingmethods. Mater Des 2011;32:2073–84.
[56] Chen C, Kovacevic R, Jandgric D. Wavelet transform analysis of acousticemission in monitoring friction stir welding of 6061 aluminum. Int J MachTools Manuf 2003;43:1383–90.
[57] Akinlabi ET, Levy ACS, Akinlabi SA. Non-destructive testing of dissimilar fric-tion stir welds. World Congr. Eng. 4�6 July, London, UK, 2012.
[58] Hu B, Yu R, Zou H. Magnetic non-destructive testing method for thin-platealuminum alloys. NDT E Int 2012;47:66–9.
[59] Guo X, Vavilov V. Crack detection in aluminum parts by using ultrasound-excited infrared thermography. Infrared Phys Technol 2013;61:149–56.
[60] Saravanan T, Lahiri BB, Arunmuthu K, Bagavathiappan S, Sekhar AS, Pillai VPM,et al. Non-destructive evaluation of friction stir welded joints by X-rayradiography and infrared thermography. Procedia Eng 2014;86:469–75.
[61] Kumar A, Philip J. Defect detection in weld joints by infrared thermography.In: Proceedings of International Conference on NDE Steel Allied Industries,NDESAI Jamshedpur, India, 2011, pp. 191–198.
[62] Kinchen DG, Martin L, Space M, Orleans N, Aldahir E. NDE of friction stir weldsin aerospace applications. Am Weld Soc Trends 2002.
[63] Rosado LS, Santos TG, Piedade M, Ramos PM, Vilaça P. Advanced technique fornon-destructive testing of friction stir welding of metals. Measurement2010;43:1021–30.
[64] Rosado LS, Cardoso F a, Cardoso S, Ramos PM, Freitas PP, Piedade M. Eddycurrents testing probe with magneto-resistive sensors and differential mea-surement. Sens Actuators A Phys 2014;212:58–67.
[65] Santos T, Vilaça P, Dos Santos J, Quintino L. A new NDT system for microimperfections detection: application to FSW and FSpW. Weld World2009;53:361–6.
[66] Santos TG, Vilaça P, Rosado L, Piedade M, Ramos PM. Developments in NDT ofFriction Stir Welding. 10th ECNDT, Moscow, Russia, 2010.
[67] Lamarre A, Dupuis O, Moles M. Complete Inspection of Friction Stir Welds inAluminum Using Ultrasonic and Eddy Current Arrays. 16th WCNDT, Monteral,Canada 2004.
[68] Hedin A, Carlson L, Borg M. Defect detection by laser-ultrasonics in friction stirwelded joints in aluminium profiles. In: Proceedings of the 1st InternationalSymposium on Laser Ultrasonics: Science, Technology and Applications.16�18 July, Monteral, Canada, 2008.
[69] Lévesque D, Dubourg L, Blouin A. Laser ultrasonics for defect detection andresidual stress measurement of friction stir welds. Nondestruct Test Eval2011;26:319–33.
[70] Levesque D, Dubourg L, Mandache C, Gougeon P, Cao X, Jahazi M. Assessmentof friction stir welds with nondestructive methods. In: Proceedings of ConfMetall Winnipeg, 2008.
[71] Sagar SP, Miyasaka C, Ghosh M, Tittmann BR. NDE of friction stir welds of Alalloys using high-frequency acoustic microscopy. Nondestruct Test Eval2012;27:375–89.
[72] Martin T, Knaak S, Aktaa J. Immersion ultrasonic testing on EUROFER weldedjoints for determination of the minimum detectable flaw size. In: Proceedingsof DGZfP Conf 10�12 May, Erfurt, Germany 2010.
[73] Liu F, Liu S, Guo E, Li L. Ultrasonic evaluation of friction stir welding. In:Proceedings of the 17th World Conference on Nondestructive Testing, 25�28Oct, Shanghai, China 2008.
[74] European Commission : CORDIS : Projects & Results Service. Development ofnovel non-destructive testing techniques and integrated on-line processcontrol for robotic and flexible friction stir welding systems (QUALISTIR) 2001.⟨⟨http://cordis.europa.eu/project/rcn/58462_en.html⟩⟩.
[75] Bird C, Dupuis O, Lamarre A. New developments of the of ultrasound phasedarray for the evaluation of friction stir welds. TMS Annual Meeting. 2�6March, San Diego, CA, USA, 2003.
[76] Caravaca DS, Bird CR, Beamish K, Maddox S. Correlation of phased arrayinspection and fatigue performance of FSW joints. AWS Insp Trends 2008:27–31.
[77] Iwaki S, Okada T, Eguchi N, Tanaka S, Namba K, Oiwa N. Imperfections infriction stir welded zones and their precision non-destructive testing. Studieson characteristics of friction stir welded joints in structural thin aluminiumalloys. Weld Int 2006;20:197–205.
[78] Oiwa N, Kida K, Iwaki T, Okada T, Ishikawa T, Eguchi N, et al. A test of phasedarray ultrasonic testing of aluminium alloy friction stir welded joints. Weld Int2008;22:511–7.
[79] ⟨http://www.stirscan.eu/⟩.[80] Tabatabaeipour M, Hettler J, Delrue S, Abeele K Van Den. Nonlinear Ultrasonic
Inspection of Friction Stir Welds. In: Proceedings of the International Con-ference Emerging Technologies in Nondestructive Testing. 27�29 May,Brussels, Belgium, 2015.
[81] Santos T, Vilaça P, Quintino L, Tecnologia S De. Developments in NDT fordetecting imperfections in friction stir welds in aluminium alloys. Weld World2008;52:30–7.
[82] dos Santos TG, Silva BS, Vilaça PDS, Quintino L, Sousa JMC. Data fusion in nondestructive testing using fuzzy logic to evaluate friction stir welding. Weld Int2008;22:826–33.
[83] Alex K. “Bi-curved” ultrasonic transducers. E-Journal NDT 2014;9.[84] TWI-Manufacturing, engineering, materials and joining specialists n.d. ⟨www.
twi-global.com⟩.[85] Brandt A. Noise and vibration analysis: signal analysis and experimental
procedures. Chichester: John Wiley and Sons; 2011.[86] Panetta PD. Ultrasonic backscattering measurements of grain size in metal
alloys. TMS Suppl. Proceedings. Hoboken, NJ, USA: John Wiley Sons, Inc.; 2014.p. 723–30.
[87] Thompson RB, Margetan FJ, Haldipur P, Yu L, Li A, Panetta P, et al. Scattering ofelastic waves in simple and complex polycrystals. Wave Motion 2008;45:655–74.
[88] Russell MD, Neal SP. Grain noise power spectrum estimation for weak scat-tering polycrystalline materials using experimentally estimated backscattercoefficients: Oblique incidence. Ultrasonics 1994;32:173–80.
[89] Ahmed S, Thompson RB, Panetta PD, Measurement N, Sciences C, Northwest P.Ultrasonic attenuation as influenced by elongated grains. Rev Prog QuantNondestruct Eval 2003;22:109–16.
M. Tabatabaeipour et al. / NDT&E International 80 (2016) 23–3434
[90] Ahmed S, Thompson RB, Panetta PD, Thompson DO, Chimenti DE, Nessa C,et al. A formal approach to include multiple scattering in the estimation ofultrasonic backscattered signals. AIP Conf Proc 2003;657:79–84.
[91] Margetan FJ, Han KY, Yalda-mooshabad I, Goettsch S, Thompson RB. Thepractical application of grain noise modes in titanium billets and forgings. RevProg Quant Nondestruct Eval 1995;14B:2129–36.
[92] Li J, Yang L, Rokhlin SI. Effect of texture and grain shape on ultrasonic back-scattering in polycrystals. Ultrasonics 2014;54:1789–803.
[93] Liu D, Turner JA. Ultrasonic backscatter in two-phase media and its depen-dency on the correlation function. AIP Conf Proc 2013:15.
[94] Lobkis OI, Yang L, Li J, Rokhlin SI. Ultrasonic backscattering in polycrystals withelongated single phase and duplex microstructures. Ultrasonics 2012;52:694–705.
View publication statsView publication stats
[95] Ahmed S, Thompson RB. Influnence of columnar microstructure on ultrasonicbackscattering. Rev Prog Quant Nondestruct Eval 1995;14:1617–24.
[96] Yang L, Rokhlin SI. Ultrasonic backscattering in cubic polycrystals with ellip-soidal grains and texture. J Nondestruct Eval 2013;32:142–55.
[97] Rose JH. Ultrasonic backscatterering from polycrystalline aggregates usingtime-domain linear response theory. Rev Prog Quant Nondestruct Eval1991;10B:1715–20.
[98] Rose JH. Theory of ultrasonic backscatter from mutiphase polycrystallinesolids. J Appl Mech 1993;53:1719–26.
[99] Nagy PB, Adler L, Rose JH. Effects of Acoustic Scattering at Rough Surfaces onthe Sensitivity of Ultrasonic Inspection, 12; 1993. p. 1775–82.