Embed Size (px)
Citation preview
Table of Contents
As filed with the Securities and Exchange Commission on March 4, 2021
UNITED STATESSECURITIES AND EXCHANGE COMMISSION
Washington, D.C. 20549
FORM 20-FANNUAL REPORT PURSUANT TO SECTION 13 OR 15(d) OF THE
SECURITIES EXCHANGE ACT OF 1934For the fiscal year ended December 31, 2020
Commission file number 1-13202
Nokia Corporation(Exact name of Registrant as specified in its charter)
Republic of Finland(Jurisdiction of incorporation)
Karakaari 7 FI-02610 Espoo, Finland(Address of principal executive offices)
Esa Niinimäki, Deputy Chief Legal Officer, Corporate, Telephone: +358 (0) 10 44 88 000, Facsimile: +358 (0) 10 44 81 002,Karakaari 7, FI-02610 Espoo, Finland
(Name, Telephone, E-mail and/or Facsimile number and Address of Company Contact Person)
Securities registered pursuant to Section 12(b) of the Securities Exchange Act of 1934 (the “Exchange Act”):
Title of each class Trading Symbol(s) Name of each exchange on which registeredAmerican Depositary Shares NOK New York Stock ExchangeShares New York Stock Exchange(1)
(1) Not for trading, but only in connection with the registration of American Depositary Shares representing these shares, pursuant to the requirements of the Securities and Exchange Commission.
Securities registered pursuant to Section 12(g) of the Exchange Act: None
Securities for which there is a reporting obligation pursuant to Section 15(d) of the Exchange Act: None
Indicate the number of outstanding shares of each of the registrant’s classes of capital or common stock as of the close of the period covered by theannual report. Shares: 5 653 886 159.
Indicate by check mark if the registrant is a well-known seasoned issuer, as defined in Rule 405 of the Securities Act. Yes ☐ No ⌧
If this report is an annual or transition report, indicate by check mark if the registrant is not required to file reports pursuant to Section13 or 15(d) of the Exchange Act. Yes ☐ No ⌧
Indicate by check mark whether the registrant: (1) has filed all reports required to be filed by Section 13 or 15(d) of the Exchange Actduring the preceding 12 months (or for such shorter period that the registrant was required to file such reports), and (2) has beensubject to such filing requirements for the past 90 days. Yes ⌧ No ☐
Indicate by check mark whether the registrant has submitted electronically every Interactive Data File required to be submittedpursuant to Rule 405 of Regulation S-T (§232.405 of this chapter) during the preceding 12 months (or for such shorter period thatthe registrant was required to submit such files). Yes ⌧ No ☐
Indicate by check mark whether the registrant is a large accelerated filer, an accelerated filer, a non-accelerated filer, a smaller reporting company, or anemerging growth company. See the definitions of “large accelerated filer,” “accelerated filer”, “smaller reporting company” or “emerging growth company” in Rule 12b-2 of the Exchange Act. (Check one):
Large accelerated filer ⌧ Accelerated filer ☐Non-accelerated filer ☐ Smaller reporting company ☐Emerging growth company ☐
Indicate by check mark whether the registrant has filed a report on and attestation to its management’s assessment of theeffectiveness of its internal control over financial reporting under Section 404(b) of the Sarbanes Oxley Act (15 U.S.C. 7262(b)) bythe registered public accounting firm that prepared or issued its audit report. ⌧
Indicate by check mark which basis of accounting the registrant has used to prepare the financial statements included in this filing:
U.S. GAAP ☐International Financial Reporting Standards as issued by the International Accounting Standards Board ⌧
Other ☐
If “Other” has been checked in response to the previous question, indicate by check mark which financial statement itemthe registrant has elected to follow. Item 17 ☐ Item 18 ☐
If this is an annual report, indicate by check mark whether the registrant is a shell company (as defined in Rule 12b-2 of the Exchange Act). Yes ☐ No ⌧
Table of Contents
2
Cross-reference table to Form 20-FForm 20-F Item Number Form 20-F Heading Section in Document
ITEM 1 IDENTITY OF DIRECTORS, SENIORMANAGEMENT AND ADVISERS
N/A
ITEM 2 OFFER STATISTICS AND EXPECTEDTIMETABLE
N/A
ITEM 3 KEY INFORMATION3A Selected Financial Data Operating and financial review and prospects—Selected financial data3B Capitalization and Indebtedness N/A3C Reasons for the Offer and Use
of ProceedsN/A
3D Risk Factors Operating and financial review and prospects—Risk factorsITEM 4 INFORMATION ON THE COMPANY
4A History and Development of the Company Cover page, Overview, Introduction and use of certain terms; Businessoverview—Our history; Operating and financial review and prospects—Liquidity and capital resources; Operating and financial review andprospects—Significant subsequent events; Financial statements—Notes to consolidated financial statements—Note 5, Segment information;Other information—Investor information; Other information—ContactInformation
4B Business Overview Business overview; Operating and financial review and prospects—Principal industry trends; Operating and financial review and prospects—Liquidity and capital resources; Financial statements—Notes toconsolidated financial statements—Note 5, Segment information; Generalfacts on Nokia—Government regulation
4C Organizational Structure Business overview—Key highlights in 2020; Financial statements—Notes to consolidated financial statements—Note 5, Segment information;Financial statements—Notes to consolidated financial statements—Note 32, Principal Group companies; Financial statements—Notes toconsolidated financial statements—Note 1, Corporate information
4D Property, Plants and Equipment Business overview; Financial statements—Notes to consolidated financialstatements—Note 2, Significant accounting policies; Financial statements—Notes to consolidated financial statements—Note 6, Discontinuedoperations; Financial statements—Notes to consolidated financialstatements—Note 15, Property, plant and equipment; General facts onNokia—Supply chain and manufacturing
4A UNRESOLVED STAFF COMMENTS NoneITEM 5 OPERATING AND FINANCIAL REVIEW
AND PROSPECTS5A Operating Results Operating and financial review and prospects—Principal industry trends;
General facts on Nokia—Government regulation; Financial statements—Notes to consolidated financial statements—Note 2, Significantaccounting policies; Financial statements—Notes to consolidated financialstatements—Note 36, Financial risk management
5B Liquidity and Capital Resources Operating and financial review and prospects—Liquidity and capitalresources; Financial statements—Notes to consolidated financialstatements—Note 24, Fair value of financial instruments; Financialstatements—Notes to consolidated financial statements—Note 25,Derivative financial instruments; Financial statements—Notes toconsolidated financial statements—Note 30, Commitments, contingenciesand legal proceedings; Financial statements—Notes to consolidatedfinancial statements—Note 36, Financial risk management
5C Research and Development, Patentsand Licenses
Business overview—Innovation; Business overview—Nokia Technologies—Research and development; Business overview—Nokia Technologies—Patents and licenses; Operating and financial review and prospects—Results of operations; Operating and financial review and prospects—Results of segments
5D Trends Information Business overview; Operating and financial review and prospects—Principal industry trends
5E Off-Balance Sheet Arrangements Operating and financial review and prospects—Liquidity and capitalresources—Off-Balance Sheet Arrangements; Financial statements—Notes to consolidated financial statements—Note 36, Financial riskmanagement; Financial statements—Notes to consolidated financialstatements—Note 30, Commitments, contingencies and legal proceedings
5F Tabular Disclosure of ContractualObligations
Financial statements—Notes to consolidated financial statements—Note 30, Commitments, contingencies and legal proceedings; Financialstatements—Notes to consolidated financial statements—Note 36,Financial risk management
5G Safe Harbor Forward-looking statements

Table of Contents
3
Form 20-F Item Number Form 20-F Heading Section in Document
ITEM 6 DIRECTORS, SENIOR MANAGEMENTAND EMPLOYEES
6A Directors and Senior Management Corporate governance—Corporate governance statement6B Compensation Corporate governance—Compensation; Financial statements—Notes to
consolidated financial statements—Note 35, Related party transactions6C Board Practices Corporate governance—Corporate governance statement; Corporate
governance—Compensation—Remuneration Governance; Financialstatements—Notes to consolidated financial statements—Note 35,Related party transactions
6D Employees Operating and financial review and prospects—Sustainability andcorporate responsibility
6E Share Ownership Corporate governance—Compensation—Remuneration Report;Corporate governance—Corporate governance statement—Shareownership of the Board of Directors and the Nokia Group LeadershipTeam; Financial statements—Notes to consolidated financial statements—Note 26, Share-based payments
ITEM 7 MAJOR SHAREHOLDERS ANDRELATED PARTY TRANSACTIONS
7A Major Shareholders Operating and financial review and prospects—Shares and shareholders7B Related Party Transactions Financial statements—Notes to consolidated financial statements—
Note 35, Related party transactions7C Interests of Experts and Counsel N/A
ITEM 8 FINANCIAL INFORMATION8A Consolidated Statements and Other
Financial InformationFinancial statements; Reports of independent registered public accountingfirms; Operating and financial review and prospects—Dividend; Financialstatements—Notes to consolidated financial statements—Note 30,Commitments, contingencies and legal matters
8B Significant Changes Operating and financial review and prospects—Significant subsequentevents; Financial statements—Notes to consolidated financial statements—Notes 37, Subsequent events
ITEM 9 THE OFFER AND LISTING9A Offer and Listing Details Operating and financial review and prospects—Shares and shareholders,
Other information—Investor information—Stock exchanges9B Plan of Distribution N/A9C Markets Operating and financial review and prospects—Shares and shareholders;
Financial statements—Notes to consolidated financial statements—Note1, Corporate information; Investor information; Other information—Investor information—Stock exchanges
9D Selling Shareholders N/A9E Dilution N/A9F Expenses of the Issue N/A
ITEM 10 ADDITIONAL INFORMATION10A Share capital N/A10B Memorandum and Articles of Association Operating and financial review and prospects—Articles of Association;
Other information—Exhibits10C Material Contracts Business overview—Our history; Other information—Exhibits10D Exchange Controls General facts on Nokia—Controls and procedures—Exchange controls10E Taxation General facts on Nokia—Taxation10F Dividends and Paying Agents N/A10G Statement by Experts N/A10H Documents on Display Other information—Investor information—Documents on display10I Subsidiary Information N/A
ITEM 11 QUANTITATIVE AND QUALITATIVEDISCLOSURES ABOUT MARKET RISK
Operating and financial review and prospects—Principal industry trends;Financial statements—Notes to consolidated financial statements—Note 36, Financial risk management, —Note 22, Other comprehensiveincome
ITEM 12 DESCRIPTION OF SECURITIES OTHERTHAN EQUITY SECURITIES
12A Debt Securities N/A12B Warrants and Rights N/A12C Other Securities N/A12D American Depositary Shares General facts on Nokia—American Depositary Shares; Introduction and
use of certain termsITEM 13 DEFAULTS, DIVIDEND ARREARAGES
AND DELINQUENCIESNone
ITEM 14 MATERIAL MODIFICATIONS TO THERIGHTS OF SECURITY HOLDERSAND USE OF PROCEEDS
None
ITEM 15 CONTROLS AND PROCEDURES Corporate governance—Regulatory framework—Risk management,internal control and internal audit functions at Nokia; General facts onNokia—Controls and procedures

Table of Contents
4
Form 20-F Item Number Form 20-F Heading Section in Document
ITEM 16A AUDIT COMMITTEE FINANCIALEXPERT
Corporate governance—Corporate governance statement—Members ofthe Board of Directors—Committees of the Board of Directors
16B CODE OF ETHICS Corporate governance—Corporate governance statement—Members ofthe Board of Directors—Further information; Operating and financialreview and prospects—Sustainability and corporate responsibility; Otherinformation—Exhibits
16C PRINCIPAL ACCOUNTANT FEES ANDSERVICES
Corporate governance—Corporate governance statement—Auditor feesand services, Corporate governance—Corporate governance statement—Audit Committee pre-approval policies and procedures
16D EXEMPTIONS FROM THE LISTINGSTANDARDS FOR AUDITCOMMITTEES
None
16E PURCHASES OF EQUITY SECURITIESBY THE ISSUER AND AFFILIATEDPURCHASERS
Corporate Governance—Compensation
16F CHANGE IN REGISTRANT’SCERTIFYING ACCOUNTANT
Corporate governance—Regulatory framework—Auditor rotation
16G CORPORATE GOVERNANCE Corporate governance—Corporate governance statement—Regulatoryframework
16H MINE SAFETY DISCLOSURE NoneITEM 17 FINANCIAL STATEMENTS N/AITEM 18 FINANCIAL STATEMENTS Financial statementsITEM 19 EXHIBITS Other information—Exhibits

Table of Contents
5
Forward-looking statementsCertain statements contained in this Annual Report constitute "forward-looking statements". Forward-looking statements provide Nokia's currentexpectations of future events based on certain assumptions and include any statement that does not directly relate to any current or historical fact. Thewords “believe”, “expect”, “expectations”, “anticipate”, “foresee”, “see”, “target”, “estimate”, “designed”, “aim”, “plan”, “intend”, “influence”, “assumption”,“focus”, “continue”, “project”, “should", "is to", "will”, "strive", "may" or similar expressions as they relate to us or our management are intended to identifythese forward-looking statements, as well as statements regarding:
A) business strategies, market expansion, growth management, and future industry trends and megatrends and our plans to address them;
B) future performance of our businesses and any future distributions and dividends;
C) expectations and targets regarding financial performance, results, operating expenses, cash flows, taxes, currency exchange rates, hedging, costsavings and competitiveness, as well as results of operations including targeted synergies and those related to market share, prices, net sales, incomeand margins;
D) expectations, plans, timelines or benefits related to changes in our organizational and operational structure;
E) market developments in our current and future markets and their seasonality and cyclicality, including the communication service provider market, aswell as general economic conditions, future regulatory developments and the expected impact, timing and duration of the COVID-19 pandemic on ourbusinesses, our supply chain, our customers’ businesses and the general market and economic conditions;
F) our position in the market, including product portfolio and geographical reach, and our ability to use the same to develop the relevant business ormarket and maintain our order pipeline over time;
G) any future collaboration or business collaboration agreements or patent license agreements or arbitration awards, including income from anycollaboration or partnership, agreement or award;
H) timing of the development and delivery of our products and services, including our short term and longer term expectations around the deployment of5G and our ability to capitalize on such deployment as well as use our global installed base as the platform for success in 5G, and the overall readinessof the 5G ecosystem;
I) the outcome of pending and threatened litigation, arbitration, disputes, regulatory proceedings or investigations by authorities;
J) restructurings, investments, capital structure optimization efforts, divestments and our ability to achieve the financial and operational targets set inconnection with any such restructurings, investments, and capital structure optimization efforts including our 2019-2020 cost savings program;
K) future capital expenditures, temporary incremental expenditures or other R&D expenditures to develop or rollout new products, including 5G; and
L) the sustainability and corporate responsibility contained in the sustainability and corporate responsibility section of this Annual Report on Form 20-F.
These statements are based on management’s best assumptions and beliefs in light of the information currently available to it and are subject to a numberof risks and uncertainties, many of which are beyond our control, which could cause actual results to differ materially from such statements. Thesestatements are only predictions based upon our current expectations and views of future events and developments and are subject to risks anduncertainties that are difficult to predict because they relate to events and depend on circumstances that will occur in the future. Risks and uncertaintiesthat could affect these statements include but are not limited to the risk factors specified under “Operating and financial review and prospects-Risk factors”of this Annual Report on Form 20-F and in our other filings or documents furnished with the U.S. Securities and Exchange Commission. Other unknown orunpredictable factors or underlying assumptions subsequently proven to be incorrect could cause actual results to differ materially from those in theforward-looking statements. We do not undertake any obligation to publicly update or revise forward-looking statements, whether as a result of newinformation, future events or otherwise, except to the extent legally required.

Table of Contents
6
Introduction and use of certain termsNokia Corporation is a public limited liability company incorporated under the laws of the Republic of Finland. In this Annual Report on Form 20-F, anyreference to “we”, “us”, “the Group”, “the company” or “Nokia” means Nokia Corporation and its consolidated subsidiaries and generally Nokia’s continuingoperations, except where we separately specify that the term means Nokia Corporation or a particular subsidiary or business segment only or ourdiscontinued operations. References to “our shares” matters relating to our shares or matters of corporate governance refer to the shares and corporategovernance of Nokia Corporation.
Nokia Corporation has published its consolidated financial statements in euro for periods beginning on or after January 1, 1999. In this Annual Report onForm 20-F, references to “EUR”, “euro” or “€” are to the common currency of the European Economic and Monetary Union, references to “dollars”, “USdollars”, “USD” or “$” are to the currency of the United States, and references to “Chinese yuan” or “Chinese yuan renminbi” or “CNY” are to the officialcurrency of the People’s Republic of China. Solely for the convenience of the reader, this Annual Report on Form 20-F contains conversions of selectedeuro amounts into US dollars at specified rates or, if not so specified, at the year-end rate of 1.2271 US dollars per euro, and conversions of selected euroamounts into Chinese yuan renminbi at specified rates or, if not specified, at the year-end rate 8.0225 Chinese yuan renminbi per euro. The referred year-end rates were the European Central Bank reference rates on December 31, 2020. No representation is made that the amounts have been, could havebeen or could be converted into US dollars or Chinese yuan at the rates indicated or at any other rates.
Additional terms are defined in the "Glossary".
The information contained in, or accessible through, the websites linked throughout this annual report on Form 20-F is not incorporated by reference intothis document and should not be considered a part of this document.
Nokia Corporation furnishes Citibank, N.A., as Depositary, with its consolidated financial statements and a related audit opinion of our independentauditors annually. These financial statements are prepared on the basis of International Financial Reporting Standards (IFRS) as issued by theInternational Accounting Standards Board and in conformity with IFRS as adopted by the European Union. In accordance with the rules and regulations ofthe SEC, we do not provide a reconciliation of net income and shareholders’ equity in our consolidated financial statements to the generally acceptedaccounting principles in the United States, or US GAAP. We also furnish the Depositary with quarterly reports containing unaudited financial informationprepared on the basis of IFRS, as well as all notices of shareholders’ meetings and other reports and communications that are made available generally toour shareholders. The Depositary makes these notices, reports and communications available for inspection by record holders of American DepositaryReceipts (ADRs), evidencing American Depositary Shares (ADSs), and distributes to all record holders of ADRs notices of shareholders’ meetingsreceived by the Depositary.
In addition to the materials delivered to holders of ADRs by the Depositary, holders can access our consolidated financial statements, and otherinformation included in our annual reports and proxy materials, at nokia.com/financials. This annual report on Form 20-F is also available atnokia.com/financials as well as on Citibank’s website at https://app.irdirect.net/company/49733/hotline/(1). Holders may also request a hard copy of thisannual report by calling the toll-free number 1-877-NOKIA-ADR (1-877-665-4223), or by directing a written request to Citibank, N.A., ShareholderServices, PO Box 43077, Providence, RI 02940-3081, United States. With each annual distribution of our proxy materials, we offer our record holders ofADRs the option of receiving all of these documents electronically in the future.
(1) None of the information contained on the https://app.irdirect.net/company/49733/hotline/ website constitutes a part of this filing and such information is not incorporated by reference herein.
Table of Contents
7
ContentsBusiness overview 8Key highlights 8Letter from our President and CEO 10Our strategy 12Our history 18Innovation 19Nokia Bell Labs 19Sales and Marketing 21Business groups 22Mobile Networks 22Global Services 24Fixed Networks 25IP/Optical Networks 26Nokia Software 27Nokia Enterprise 29Nokia Technologies 32Principal industry trends 34Corporate governance 36Corporate governance statement 37Compensation 52Operating and financial review and prospects 65Selected financial data 66Operating and financial review 67Our response to COVID-19 79Sustainability and corporate responsibility 80Shares and shareholders 85Articles of Association 89Risk factors 91Significant subsequent events 108General facts on Nokia 109American Depositary Shares 110Supply chain and manufacturing 110Controls and procedures 111Government regulation 111Sales in United States-sanctioned countries 112Taxation 112Key ratios 115Alternative performance measures 115Financial statements 116Consolidated statements 117Notes to consolidated financial statements 122Reports of independent registered public accounting firms 176Other information 180Exhibits 181Glossary 182Investor information 186Contact information 187Signatures 188
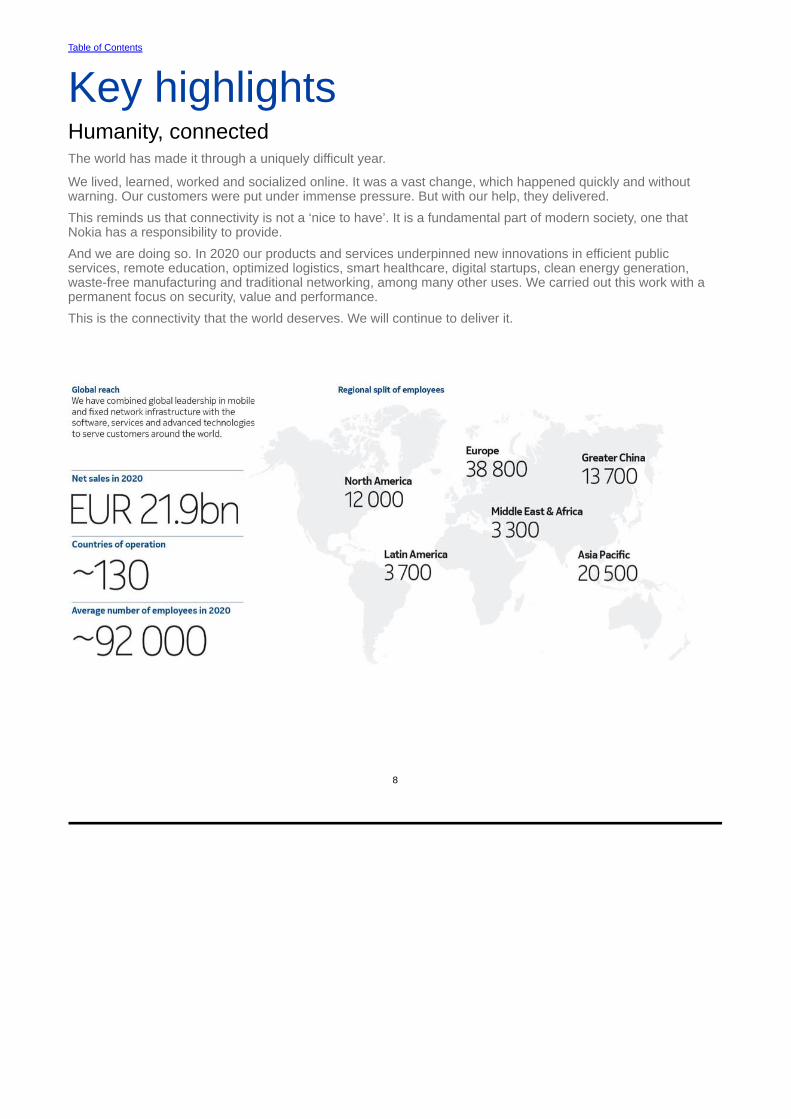
Table of Contents
8
Key highlightsHumanity, connectedThe world has made it through a uniquely difficult year.
We lived, learned, worked and socialized online. It was a vast change, which happened quickly and without warning. Our customers were put under immense pressure. But with our help, they delivered.
This reminds us that connectivity is not a ‘nice to have’. It is a fundamental part of modern society, one thatNokia has a responsibility to provide.
And we are doing so. In 2020 our products and services underpinned new innovations in efficient public services, remote education, optimized logistics, smart healthcare, digital startups, clean energy generation, waste-free manufacturing and traditional networking, among many other uses. We carried out this work with a permanent focus on security, value and performance.
This is the connectivity that the world deserves. We will continue to deliver it.

Table of Contents
9
Financial highlights Business groups
Mobile NetworksHigher quality and more reliable mobilebroadband experiences
Global ServicesHelping customers navigate complexityto transform and digitalize their business
Fixed NetworksUsing intelligent access to createnetworks that are faster, better, smarter
IP/Optical NetworksMassively scalable networks thatunderpin the digital world’s dynamicinterconnectivity
Nokia SoftwareIntelligent software platforms optimizingand automating network performance
Nokia EnterpriseDigitalizing asset-intensive industrieswith mission and business-critical needs
Nokia TechnologiesTechnology designed to bring thehuman family closer together
Reportable segmentsIn 2020, Nokia had three reportablesegments. Nokia also disclosessegment-level data for Group Commonand Other. For more details, refer toNote 5, Segment information, in theconsolidated financial statements.
NetworksNokia provides net sales disclosure forthe following businesses within theNetworks reportable segment: (i) MobileAccess (comprises Mobile Networksand Global Services operatingsegments), (ii) Fixed Access (comprises Fixed Networksoperating segment), (iii) IP Routing(comprises part of IP/Optical Networksoperating segment) and (iv) Optical Networks (comprisespart of IP/Optical Networks operatingsegment).
Nokia Software
Nokia Technologies
This Annual Report on Form 20-F describes theoperations and performance of Nokia in 2020. Duringthat time, Nokia had seven business groups andthree reportable segments listed above. As of 2021,Nokia has a new operating model comprising fourbusiness groups that are also our reportablesegments: (i) Mobile Networks, (ii) NetworkInfrastructure, (iii) Cloud and Network Services, and(iv) Nokia Technologies.
For the year ended December 31, Continuing operations
2020EURm
2019EURm
2018EURm
Net sales 21 852 23 315 22 563
Gross profit 8 193 8 264 8 312
Gross margin 37.5% 35.4% 36.8%
Operating profit/(loss) 885 485 (59)
Operating margin 4.0% 2.1% (0.3)%
(Loss)/profit for the year (2 513) 18 (549)
EUR EUR EUR
Earnings per share, diluted (0.45) 0.00 (0.10)
Dividend per share(1) 0.00 0.00 0.10
As of December 312020EURm
2019EURm
2018EURm
Net cash and current financial investments 2 485 1 730 3 053
(1) No dividend is proposed by the Board of Directors related to the financial year 2020.
Table of Contents
10
Letter from our President and CEO
This was a challenging year for everyone. Our networks were put to the testby a global crisis and they not only survived but thrived, showing that a newway of doing business is possible. 2020 showed the true value of technologyand increased the need to find smart solutions to global problems, fromclimate change to stalling productivity.
Change and continuityThis was a year of unprecedented change, but also one in which we saw the importance of our technology. Fixed and mobile networks kept the globaleconomy and critical infrastructure running even as the COVID-19 pandemic led to nationwide shutdowns across the world.
I was proud of the role we played in enabling emergency services, food suppliers, and public health agencies to stay connected throughout a global crisis.Kitchens became classrooms and boardrooms operated from bedrooms as millions of people turned to bandwidth-intensive video conferencing andstreaming applications. This contributed to a year’s worth of traffic growth in a matter of days, but we were able to support our CSP customers in handlingthe huge upsurge even as global supply chains were disrupted and lockdowns made accessing sites difficult.
The ability of our employees to adapt at speed and come up with creative solutions was our greatest asset this year and proved the resilience andreliability that Nokia is renowned for.
2020 was the year businesses realized that the old adage of “things must change to remain the same” has never been more true. Companies that haddone the most to modernize their operations were those best equipped to deal with the disruption. The pandemic accelerated the need for widespreaddigitalization and automation, leading to the increasing importance of critical networks – networks that combine flexibility with carrier-grade performance.
We launched a strategic analysis into these industry trends, which found that value would increasingly move away from monolithic systems towardssoftware, silicon and services with the importance of virtualization, cloud-native architecture, and open interfaces becoming ever greater. It was clear to usthat to support our customers through these changes and to better position Nokia for new opportunities we would also need to change.
Development in an extraordinary yearOverall in 2020, we saw improvement both in our gross margin and operating margin performance up by 2.1 percentage points and 1.9 percentage pointsyear-on-year respectively. This development was supported by a regional mix shift towards the higher-margin North America region, our ongoing R&Defforts to enhance product quality and cost competitiveness, and improvements in our Networks business.
Nokia delivered a strong cash performance for the year and we ended 2020 with net cash and current financial investments at approximately EUR 2.5billion, up approximately EUR 0.8 billion from 2019. Net sales decreased by 6% year-on-year primarily due to network deployment and planning serviceswithin Mobile Access. In Nokia Enterprise, we continued to make great progress in 2020 and delivered double digit year-on-year growth in net sales.
Overall, we took important steps in improving on execution. I was particularly pleased to see the clear financial improvement in Mobile Access, reflectingour ongoing efforts to strengthen the competitiveness and cost position of our mobile radio products. In 2020, we saw growth in radio access products andthe 5G gross margin increase due to product cost reduction, partly helped by higher ReefShark shipment volumes. Our aim was to be above 35% for ourKPI on shipments of our 5G Powered by ReefShark product portfolio; we ended the year at 43% and we remain on track to realize 70% by the end of2021. Our progress was validated by our customers. We ended the year with 188 commercial 5G agreements and 44 live 5G networks.
We strengthened our technology leadership in many key areas of our business: together with Elisa and Qualcomm, we achieved the worldwide 5G speedrecord. We brought AI to the network edge allowing CSPs to deliver improved customer experience, fix customer issues instantly and increase upload anddownload speeds.
We also launched the world’s first automated 4G/5G network slicing technology for mobile core and transport networks and a service to bring downnetwork energy usage. We continued to lead the passive optical network evolution and launched the world’s first 25G PON broadband solution to enhanceCSPs’ fiber network usage.
We continued to lead in private wireless networks ending 2020 with 260 customers. For the second year in a row Analysys Mason ranked Nokia as the #1telecoms software provider by market share for telecoms software and services combined. And we filed more than 1 500 new inventions with more than 3500 patent families now declared as essential for 5G.
This was a year that gave added impetus to addressing the digital divide. We continued to work with our customers to connect the unconnected, with 6.6billion subscriptions on our customer’s radio networks worldwide by the end of 2020. For instance, Nokia’s community investment programs helped bringfixed wireless access to more than 1 000 children in Kenya this year. We also remained on track to achieve our long-term science-based target of reducingemissions from our products. In 2020, the customer base station sites we modernized used 54% less energy on average. And we made progress instrengthening human rights protections by increasing training for our suppliers on preventing modern slavery and respecting minority rights. We alsomaintained our focus on ethical business training, which 96% of our employees completed. In addition, 85% of our leaders completed training onnavigating bias and building a more inclusive workplace.
Table of Contents
11
New operating modelAt the end of October we announced that we would move to a new operating model from the beginning of 2021. As I told our employees, this was notchange for change’s sake, with an incoming CEO looking to make his mark on an organization. But rather to improve the way we work so we can betteralign with how customers want to buy and achieve our aim of technology leadership in the areas where we choose to compete. The new structure willsimplify and streamline the way we work enabling us to improve cost efficiency and become faster, more agile, more accountable, and more transparent asan organization.
Our four new business groups each have a clear mission and have been empowered with the resources and accountability to achieve their goals. In brief,they are as follows:
◾Mobile Networks will focus on regaining leadership in 5G, as well as achieving leadership in O-RAN and vRAN, while maintaining scale with CSPcustomers and growing its private wireless business with enterprise customers.
◾Network Infrastructure will focus on the building blocks and essential solutions of critical networks, using its technology leadership in IP Networks,Optical Networks, Fixed Networks, and Alcatel Submarine Networks to drive digitalization across all industries.
◾Cloud and Network Services will focus on creating value for both service providers and enterprise customers as demand for critical networksaccelerates, leading the transition to cloud-native software and as-a-service delivery models.
◾Nokia Technologies will continue to monetize and grow the value of Nokia’s intellectual property and licensing revenue by investing in innovation and itsworld-leading patent portfolio as well as pursuing other licensing opportunities.
Looking aheadThis was a challenging year for everyone. Our networks were put to the test by a global crisis and they not only survived but thrived, showing that a newway of doing business is possible. 2020 showed the true value of technology and increased the need to find smart solutions to global problems, fromclimate change to stalling productivity.
Nokia will help enable those solutions by building the critical networks that the world will come to rely on, positioning ourselves for technology leadershipand a path to sustainable financial performance.
We know we have our work cut out for us. We expect 2021 to be challenging with meaningful headwinds primarily due to market share loss and price erosion in North America. It will be a time of transition as we adapt to a new structure and finalize our strategy, but by doing so our employees will be empowered to act faster enabling us to accelerate our immediate and long-term plans. We will stay focused on securing technology leadership in the segments where we compete, especially in 5G; continue to strengthen existing customer relationships; and make sure we seize new opportunities in areas where we see a path to value creation.
I would like to thank our employees for their tremendous efforts and commitment this year as well as the warm welcome they have given me.
I would also like to pay tribute to my predecessor, Rajeev Suri, who led Nokia over the past six years and through the first half of 2020. My return to Nokiaas President and CEO is both an incredible personal honor and also the next stage of continual evolution for this great company.
Pekka LundmarkPresident and CEO

Table of Contents
12
Our strategy
Our “Rebalancing for growth” strategy was launched at the end of2016 and updated in 2019. It was based on 5 pillars: Lead, Grow,Strengthen, Diversify, and Operational Excellence.With our “Rebalancing for Growth” strategy, we addressed both our primary CSP market and new growth opportunities. The strategy built on our corestrength of delivering large high-performance networks by expanding our business into targeted, higher-growth and higher-margin vertical markets.
On October 29, 2020, Nokia announced the start of a strategic review, to culminate in a renewed strategy to be announced at Capital Markets Day onMarch 18, 2021.
1.LeadLead in high-performance, end-to-end networks with communication service providers.In the first pillar of our strategy – leading in high-performance, end-to-end networks with communication service providers – we continued to progress in5G despite challenges in Mobile Access. By the end of 2020, we reached 139 commercial 5G deals and launched 44 live networks with our customers andwe achieved our 2020 target for 4G plus 5G market share, excluding China, to end 2020 at approximately 28%.
Focus areas and progress◾We continued to make good progress in the transition to 5G shipments that are “5G Powered by ReefShark” (5G PBR). We exceeded our end of 2020
target of reaching more than 35% of 5G PBR shipments.
◾Regarding our conversion rate from 4G to 5G based on actual radio business volume, we ended 2020 in the 90% range, excluding China. The declinefrom 2019 was primarily driven by some market share loss in North America, partially offset by footprint gains with customers that have increased theirfocus on security.
◾We invested in digital service architecture, advanced analytics, machine learning, automation and serviceability for fast and flawless delivery of ournetwork infrastructure services.
◾We provided industry-leading cognitive network services to improve network performance, operational efficiency and subscriber experience, anddevelop service business models to open new revenue streams for CSPs.
◾We are the #2 vendor in Service Provider Routing worldwide (excluding China) having shipped well over 1 million routers to date(1). Our in-housedesigned FP4 high-performance routing silicon demonstrates our continuing commitment to technology innovation and leadership, driving continuedsales momentum with >300 projects won, two thirds of which were new footprint and/or competitor displacements.
◾We are the #2 vendor worldwide in optical networking (excluding China), bringing together technology leadership in silicon and systems with ourfoundational WaveLogic Elements technology including the PSE-V coherent Digital Signal Processor (DSP) and Elenion silicon photonics, as well assoftware automation and applications optimized for driving efficiency in optical networks through our WaveSuite portfolio and WaveHub ecosystem(1).
◾We maintained our leading market share globally with #2 position in fiber and a #1 position in 5G fixed wireless access.
◾We are leading the industry transition to next generation fiber technologies, with our 25 Gigabit Symmetrical Passive Optical Network (25G PON)solution that expands Fixed Networks market into business and 5G mobile backhaul market segments.
◾We are also running the world’s largest Fixed Wireless Access deployments that complements our fiber business, for example, with Vodafone and Zain.
(1) Source: Dell’Oro. Q4 2020.

Table of Contents
13
2.GrowGrow our position in the enterprise market and enable Industry 4.0 acceleration through the digitalization of asset-intensive industries,governments and cities, and webscale businesses, with mission-critical networks and digital automation solutions.Our second pillar was about growing our enterprise business, focusing on two main market needs: the need for high-performance connectivity for hybridhyper-scale clouds, and the need for mission-critical networks in asset-intensive industries and governments, resulting in Industry 4.0 acceleration drivenby private networks and industrial automation. In 2020, we delivered on our ambition: (1) we expanded network sales into select vertical markets, with afocus on asset-heavy industries, including Transportation, Energy, Manufacturing and Logistics, as well as governments and webscale businesses, (2) wehave become the leaders in the private wireless market, (3) we are well positioned in the industrial automation market, which we expect will be critical inthe Fourth Industrial Revolution, and (4) we achieved double digit growth fueling Nokia's future growth.
Focus areas and progress◾In Nokia Enterprise, we continued to make great progress in 2020 and delivered double digit year-on-year growth in net sales. The strong growth in net
sales to enterprise customers was primarily driven by increased demand for mission-critical networking solutions in industries including utilities and thepublic sector, with continued momentum in private wireless solutions.
◾We scaled up our existing business in transportation, energy, government and cities segments by augmenting our IP/Multiprotocol Label Switching(MPLS), Optics, GSM-R and other existing portfolios with private networks, providing customers with the performance and security they require as theydigitalize and transform their communications infrastructure and applications.
◾We also continued to drive the adoption of multi-cloud, Internet of Things (IoT) and automation with strategic investments in emerging technologies suchas Software Defined Networks (SDN), Software Defined Wide-Area network (SD-WAN) applications, and data centers.
◾We continued to grow our market share in the webscale segment with IP and Optical portfolios, building large high-performance networks that drivehyperscale cloud connectivity.
◾We saw a private wireless inflection point in the market driven by the need for high-performance private wireless networks. Driven by the convergenceof operational technology (OT), information technology (IT) and networks, customers in these domains need a higher level of network performance inorder to automate and digitalize their operations. We have accelerated our private wireless networks (4G/LTE) business growth and serve 260customers across the globe and cross-industries.
◾We continued to implement a strategy to grow in the manufacturing and logistics segments where the opportunity for high-performance private wirelessnetworks is significant. Our strategy has been to address these customers with our Nokia Digital Automation Cloud platform and our modular privatewireless solution.
◾In 2020, we continued to build strong market momentum in our target vertical markets with 245 new customers. At the close of 2020, we have 1 545enterprise customers deploying our networks globally.
◾We expanded our market opportunity in high-performance cloud connectivity portfolio with our data center switching launch. We also enhanced ourprivate wireless portfolio, with the launch of our 5G standalone capabilities and Modular Private Wireless solutions.
◾We continued to expand our ecosystem of technology and go-to-market partners to increase our scale and coverage especially towards the newmanufacturing and logistics segments.
◾We continued to implement a new simplified and efficient delivery model for our enterprise projects to improve the enterprise customer experience andfurther support the growth in our revenues.
◾Nokia is well positioned to win the market given our deep experience in delivering carrier-grade network performance and extensive work with webscalecompanies and enterprises.
Table of Contents
14
3. StrengthenStrengthen the software business with one Common Software Foundation.The third pillar was about strengthening our software business with one Common Software Foundation. Nokia was once again, for the second consecutiveyear, rated as the world’s leading telco software business for both telecom software and services. Nokia Software’s performance was marked by a seriesof important product launches and by many key deal-wins, including one of the telco software industry’s largest ever deals with a key North Americancustomer, and breakthrough wins with new innovative customers, like DISH, on the basis of our strong technology.
Focus areas and progress◾We continued to accelerate our research and development (R&D) by focusing investment on key growth themes of 5G applications, automation,
software suites, and digital innovation platforms; building foundational innovation and leveraging it to lead with a cloud-native portfolio; and streamliningtowards more efficient and simple processes.
◾We focused our go-to-market capabilities to deliver success for our customers with a consultative selling approach, in order to drive new business andrecurring revenue.
◾We optimized our services and delivery with investments in people and digital and cloud skills by driving automation capabilities and evolving theservices we offer to meet new market needs.
◾We continued to reinforce a strong partner ecosystem of system integrators, independent software vendors (ISV), and technology players; andconsistent commercial and operational discipline.
◾We strengthened the comprehensiveness of our portfolio with several new product launches. These included Network Operations Masters, whichprovides vendor-agnostic network management functionalities for managing 5G networks, and Digital Operations Center, which provides a secure andfully-automated process to design, deploy and operate network slices at scale across multi-vendor, multi-domain and multi-technology environments.
◾Our orders remained strong, reflecting our product and service resonance with customers, and included the win of DISH, which chose Nokia’s cloud-native, standalone Core software products to help it build the most advanced, disruptive, fully-automated, 5G network in the US.
◾Nokia Software offers the industry’s leading cloud-native, multi-vendor and multi-network solutions combined with a robust partner ecosystem.
◾As such, Analysys Mason, a leading telco software consultancy firm, again ranked Nokia as the global leader in telecoms software and services byrevenue for the second year in a row.

Table of Contents
15
4. DiversifyDiversify the licensing business with new opportunities in automotive, consumer electronics, IoT and brand.We made good progress against our fourth pillar, diversifying our licensing business beyond mobile devices and into new licensing domains such asautomotive, consumer electronics, the Internet of Things (IoT) and brand licensing. Nokia Technologies has done a great job in building on the strength ofits mobile device patent licensing and creating new licensing opportunities in the consumer ecosystem, and we see meaningful growth opportunities inexpanding our scope.
Focus areas and progress◾We continued to invest in and renew the portfolio through innovation in multiple areas, especially cellular standard essential patents, in part as a result
of the extensive research activities of Nokia Bell Labs.
◾Our focus is on renewing existing patent licenses on favorable terms and reaching agreements with the remaining uncontracted mobile device players.
◾We continue to expand patent licensing into new segments, such as automotive, consumer electronics, and IoT.
◾We license our unique cutting-edge audio/visual technologies to consumer device manufacturers.
◾We are expanding our brand partnerships business beyond mobile phones.
◾We have declared more than 3 500 patent families to the European Telecommunications Standards Institute (ETSI) as essential for the 5G standard,reflecting our continuing leadership and strong momentum in cellular technology R&D and standardization.
◾An independent study by PA Consulting concluded we are #1 for ownership of granted patents that researchers found essential to the 5G standard.
◾We signed and continued to benefit from patent license agreements for mobile devices, consumer electronic devices, and IoT connected devices.
◾In September we successfully renewed one of our major patent license agreements. This new agreement demonstrates the strength of our portfolio,particularly now that we have 5G patents to offer.
◾We continue to make good progress with our automotive licensing program. Many automotive brands, including AUDI, Bentley, BMW, Mini, Porsche,Rolls Royce, Seat, Skoda, Volkswagen and Volvo have licenses to use our patented inventions for their connected vehicles.
◾Over the course of the year our customers ASUS, Axon, HMD Global, OPPO, OnePlus, and Panasonic launched a number of new smartphones andcameras using our industry leading OZO Audio technology.
◾HMD Global launched their first 5G smartphone, the Nokia 8.3 5G and we signed a number of new brand licensing agreements, bringing new Nokia-branded experiences to a range of product categories. Nokia-branded Smart TVs and media streaming devices were launched in India, Austria,Germany and Switzerland, and Nokia-branded earphones and headphones were launched in China.

Table of Contents
16
5.Operational ExcellenceOperational excellence for new levels of efficiency, productivity and industry cost leadership.Operational excellence was the foundation for our strategic priorities. In addition to focused actions to improve our cash position, commercial disciplineand operational improvements, we implemented various actions across Nokia to contribute to our commitment to successfully reduce costs in 2020.
Focus areas and progress◾We made significant progress with improving our cost position, and as of the end of 2020, we achieved our EUR 500 million recurring cost savings
target.
◾Furthermore, we benefited from additional temporary cost savings of approximately EUR 350 million, of which approximately EUR 250 million related toCOVID-19, due to lower travel and personnel expenses, and approximately EUR 100 million related to lower annual variable compensation, givenNokia’s business performance in 2020.
◾We have implemented structural changes to strengthen cash generation across Nokia, and we saw solid cash performance in 2020 with anapproximately EUR 0.8 billion improvement in our net cash position, allowing us to end the year with a net cash balance of approximately EUR 2.5billion.
◾We strengthened commercial management process to drive better performance in current contracts and improve outcomes in new ones. Deal decisionsnow include a sharp focus on cash and return-on-capital-employed metrics, and improved contractual terms.
◾We continued to modernize IT and simplify and digitalize our key processes to modernize our ways of working and increase productivity.
◾Our Global Services business completed significant operational improvements for instance by digitalizing 100% of its 5G network deployments aroundthe world, bringing high-quality, agility and transparency to customers globally.
◾With digital project orchestration and data inventories, Nokia is enabling network rollouts to be carried out swiftly and cost-effectively, matching theagility demands from customers and helping them to bring new services to market faster.
◾We continued efforts to improve collaboration and efficiency of R&D and made progress with our workforce strategy to ensure we have a future-fit set ofcapacity and capabilities. We focused on embedding productivity and effectiveness culture at the heart of our company for the long term.
◾We continued our site optimization strategy, reducing real estate spend while creating modern workplaces for our employees.
“Rebalancing for growth” will bereplaced with a refreshedcorporate strategyThis will be announced at Capital Markets Day on March 18, 2021.On October 29, 2020, Nokia announced it was embarking on a strategic review, aimed at renewing our strategy, to be announced at CapitalMarkets Day on March 18, 2021.
On December 16, 2020, we shared further information about Nokia’s strategic priorities and the market trends at the heart of our strategicbeliefs going forward.
Phase 1 of strategy review: high-level strategic principles and new operating modelOn October 29, 2020, Nokia announced the first phase of its new strategy, outlining high-level strategic observations alongside a new operating modeldesigned to better position the company for changing markets and align with customer needs effective from January 1, 2021.
Our industry is undergoing profound changes. Industrial automation and digitalization are increasing customer demand for critical networks, with a trendtowards open interfaces, virtualization, and cloud native software. This will revolutionize how we design, deploy, manage and sell our products andsolutions. Our strategy renewal will ensure we are well positioned to leverage these trends, improve our performance and position the company for long-term value creation.
We announced that our strategy review had yielded four observations to further build on:
◾first, that technology leadership will be the top priority;
◾second, that the company’s current customer base, consisting of telco operators and enterprises (including webscale companies), provides a solidplatform for value creation;
◾third, that there is a longer-term opportunity to move into higher-value “network-as-a-service” business models; and

Table of Contents
17
◾fourth, that end-to-end as a core strategic idea will be replaced with a more focused approach, with each of the company’s new business groups havinga distinct role in the overall strategy.
We also announced that from January 1, 2021 Nokia will have four business groups structured around unique customer offerings, with ownership forbecoming one of the technology and market leaders in their respective sector. They will also need to demonstrate a clear route for delivering shareholdervalue with return on capital employed as a key metric.
Our goal is to better align with the needs of our customers, and through that increase accountability, reduce complexity and improve cost-efficiency. Goingforward, we will have a more rigorous approach to capital allocation and will invest to win in those segments where we choose to compete.
The new business groups are:
◾Mobile Networks, which will include radio access network and microwave radio link products, related network management, network planning andoptimization, deployment and technical support services. This business group will offer the full portfolio for customers wanting to buy mobile accessnetworks. It will target leadership in key technologies such as 5G, O-RAN and vRAN. Tommi Uitto was appointed as President of this business group.
◾Network Infrastructure, which will include IP Routing, Optical Networks and Fixed Networks, as well as Alcatel Submarine Networks business,currently reported under Group Common and Other. This business group will respond to the ever-increasing demand for higher capacity, greaterreliability, faster speeds and lower costs. Federico Guillén was appointed as President of this business group.
◾Cloud and Network Services, which will include the existing Nokia Software business (excluding Mobile Networks network management), Nokia’senterprise solutions, core network solutions including both voice and packet core, and managed and advanced services from its current Global Servicesunit. This unit will also act as a Go-to-Market and delivery channel for products from other business groups to enterprise customers. Cloud and NetworkServices will target growth by leveraging the industry transition to cloud-based delivery, network-as-a-service business models, and software- andservices-led value creation. Raghav Sahgal was appointed as President of this business group.
◾Nokia Technologies, which will remain largely unchanged. Jenni Lukander continues as President of this business group.
Phase 2: mid-point update on strategy and operating modelOn December 16, 2020, Nokia provided a mid-point update on its strategy and operating model. We announced that Nokia was aligning itself to delivercritical networks to Communication Service Providers (CSPs), enterprises and webscales.
We synthesized our strategy analysis into six strategic beliefs:1. Networks are playing an increasingly important role in society. This is allowing us to extend our focus to serving critical networks beyond CSPs.
2. Critical networks are built based on a best-of-breed approach with network elements selected on a best performance per Total Cost of Ownership(TCO) basis.
3. Technology leadership underpins momentum and financial returns in critical networks.
4. Establishing technology leadership in some segments requires us to anticipate, shape and invest in the next technology window – where there is nopath, we will reassess segment participation.
5. Gradually, value in critical networks is migrating away from monolithic systems towards silicon, software and service, and will be captured throughdifferent business models.
6. Sustained investment in long-term innovation provides us with a platform to take the long view.
We are positioning Nokia to lead in a world facing big challenges: environmental issues, resource scarcity, inequality and stalling productivity. Technologywill be an essential part of the solution, with an increase in critical networks, which will extend to all corners of society.
Critical networks are advanced networks that run mission-critical services for companies and societies. They are becoming increasingly important andextending to all corners of society. This means that Nokia’s addressable market for critical networks with CSPs, webscales and enterprises is alsoextending. To position ourselves for long-term success, we have defined three focus areas:
Secure technology leadershipCustomers will take a best-of-breed approach selecting network elements from multiple individual vendors who are able to offer the best performance pertotal cost of ownership. Nokia is aiming to be the technology leader in the areas it chooses to play in. We have a strong position in technologies that areimportant for critical networks, such as open and virtualized radio access networks and we are on course for a 100% cloud-native software portfolio.
Build cloud software and network services futureWe see value in critical networks gradually shifting from monolithic systems to silicon, software and services. This will increase the importance of cloud-native and open solutions and lead to more revenue being captured through different business models. We are well-positioned to be a trusted partner inthe industry transition to software-led solutions and as-a-service delivery models, as demand for critical networks accelerates. Based on our leadingCommon Software Foundation, Nokia is a leader in cloud-native software including 5G Core, Digital Operations, Monetization, Security, and Analytics/AI.We are the first to deploy a software portfolio this broad on any cloud, leveraging our modular technology framework. We are experienced in creating bothcarrier-grade performance networks and working with the world’s most demanding webscales. We will continue building our capabilities in this area toensure technology and market leadership.
Strengthen our long-term research and patent portfolioContinuing to strengthen Nokia’s long-term research and global patent portfolio is a key element in securing technology leadership. We are aiming forleadership in all domains: innovation, product, patents, and standardization. Committing to long-term investment in research and innovation will allow us toanticipate and capitalize on industry changes and position us at the front of the pack when new technology windows open.
With these as focus areas we will invest in a best-of-breed portfolio.
Our renewed operating model is designed to enable the delivery of our strategic ambitions, with a lean corporate center enabling fully accountablebusiness groups.
The third phase of the strategy update, with detailed business group strategies, will take place on Capital Markets Day on March 18, 2021.

Table of Contents
18
Our historyFew companies have Nokia’s storied capacity for transformation, for the development of new technologies and for the ability to adapt to shifts in marketconditions.
From its beginning in 1865 as a single paper mill operation, Nokia has found and nurtured success in several sectors over the years, including cables,paper products, rubber boots and tires, mobile devices and telecommunications infrastructure equipment.
Nokia’s sector-by-sector success over the years has mirrored its geographical rise: from a Finnish-focused company until the 1980s with a growing Nordicand European presence; to a genuine European company in the early 1990s; and with our acquisitions of Alcatel-Lucent, Gainspeed, Deepfield andComptel in the 2010s, to a truly global company.
Nokia has been producing telecommunications equipment since the 1880s – almost since telephony began.
A storied pastWhen Finnish engineer Fredrik Idestam set up his initial wood pulp mill in Southern Finland in 1865, he took the first step in laying the foundations forNokia’s capacity to innovate and seize opportunities. Sensing a growing demand for wood pulp products, Idestam opened a second mill shortly after on theNokianvirta River, inspiring him to name his company Nokia AB.
Idestam’s sense of endeavor would continue to prevail throughout Nokia’s various phases.
In the 1960s, Nokia became a conglomerate comprising rubber, cable, forestry, electronics and power-generation businesses, resulting from the mergerbetween Idestam’s Nokia AB and a phone and power cable producer called Finnish Cable Works Ltd. founded in 1912, as well as other businesses.
Transforming anewIt was not long before transformation would occur again.
Deregulation of the European telecommunications industry in the 1980s triggered new thinking and fresh business models.
In 1982, Nokia introduced both the first fully digital local telephone exchange in Europe and the world’s first car phone for the Nordic Mobile Telephoneanalog standard. The breakthrough of GSM (Global System for Mobile Communications) in the 1980s introduced more efficient use of radio frequenciesand higher-quality sound. The first GSM call was made with a Nokia phone over the Nokia-built network of a Finnish operator called Radiolinja in 1991.
It was around this time that Nokia made the strategic decision to make telecommunications and mobile phones our core business. Our other businesses,including aluminum, cables, chemicals, paper, rubber, power generation and television, were subsequently divested.
By 1998, Nokia was the world leader in mobile phones, a position it enjoyed for more than a decade.
And still the business and technology worlds would continue to evolve, as would Nokia.
A shifting industryIn 2007, Nokia combined its telecoms infrastructure operations with those of Siemens to create the NSN joint venture. We later bought Siemens’ stake inNSN in 2013 as the business was emerging from a successful strategy shift and the reality of the Fourth Industrial Revolution of connected devices,sensors and people was starting to take shape.
In 2011, we joined with Microsoft to strengthen our position in the highly competitive smartphone market, which in 2014 resulted in the sale of our Devices& Services business. Nokia emerged from the transaction with a firm financial footing and three strong businesses – Nokia Networks, HERE and NokiaTechnologies – focused on connecting things and people.
But Nokia’s transformation was not complete. Our former HERE digital mapping and location services business, an arena we entered in 2006, had been akey pillar of Nokia’s operational performance. However, following a strategic review of the business by the Board in light of plans to acquire Alcatel-Lucent,Nokia decided to sell the HERE business in 2015.
Acquisition of Alcatel-Lucent and beyondThe acquisition of Alcatel-Lucent, completed in 2016, positions Nokia as an innovation leader in next-generation technology and services.
Our reputation as an innovation powerhouse has been bolstered by the addition of Bell Labs, now known as Nokia Bell Labs. It joined a future-focusedbusiness backed by tens of thousands of engineers and thousands of patent families, a reflection of Nokia’s innovation pedigree, which has produced anextensive array of benefits for consumers, businesses and society as a whole.
This acquisition helped us shape the connectivity and digitalization revolution before us – the Fourth Industrial Revolution – in which billions of people,devices and sensors are connected in a way that opens up a world of possibilities. These can make our planet safer, cleaner, healthier, more sustainable,more efficient and more productive.
This Fourth Industrial Revolution will require high-performance networks powered by 5G that will provide connectivity throughout the landscape. 5G willenable a wireless Internet of Things (IoT), helping to automate any physical business processes in verticals such as manufacturing, transport, logistics,smart cities, utilities, tele-medicine and environmental management.
Nokia today is at the forefront of the 5G evolution through our technology innovations, including 3 500 5G patent families, and we continue to drive openinterfaces, virtualization and cloud-native software. We partner with communication service providers (CSPs), enterprise customers and webscales.
Nokia’s long history is marked by change and reinvention. We have always been excited by where technology will lead us as we seek to enable the humanpossibilities of a connected world. We will continue to innovate, reimagining how technology works for us discreetly while blending into, and enriching, ourdaily lives.

Table of Contents
19
InnovationBy driving tomorrow’s innovation while delivering today’s technology, we help make businesses more productive, environments cleaner, workplaces safer,economies stronger and enrich people's lives. Our long-standing commitment to innovation enables our customers to deliver extraordinary, transformativeexperiences. Working alongside communication service providers (CSPs) and enterprise customers across industries and around the world, we arebuilding the future technologies that will make Industry 4.0 a reality and enhance virtually every aspect of life.
Research and developmentOur research and development (R&D) efforts are led by our business groups and by Nokia Bell Labs, the world-renowned industrial research arm of Nokia.As one of the industry’s leading investors in communication technology R&D, we drive innovation across a comprehensive portfolio of network equipment,software, services and licensing opportunities across the globe. Our continuous product development in 5G, private wireless, intelligent analytics andautomation, IoT, and next-generation software-defined networks enables our customers to address the needs of a digitally connected world.
We have a global network of R&D centers, each with individual technology and competence specialties. The main R&D centers are located in Belgium,Canada, China, Finland, France, Germany, Greece, Hungary, India, Italy, Japan, Poland, Portugal, Romania, Slovakia, the UK and the US. Theecosystems around each R&D center helps us to connect with experts on a global scale, and our R&D network is further complemented by cooperationwith universities and other research facilities. In Belgium, China, Finland, France, Germany and the US, we have significant Nokia Bell Labs researchactivities where we are conducting disruptive research for the next phase of human existence.
Nokia Bell LabsThe world-renowned industrial research and innovation arm of NokiaNokia Bell Labs has invented many foundational technologies that underpin information and communications networks and all digital devices and systems.The Nokia Bell Labs innovation engine accelerates technology development for Nokia’s core communication service provider and enterprise businesseswhile also researching the fundamental technologies that will shape future society. Over its more than 90-year history, Nokia Bell Labs researchbreakthroughs have produced nine Nobel Prizes, four Turing Awards and numerous other international awards.
With Nokia Bell Labs, we search for the fundamental limits of what is possible, rather than being constrained by the current state of the art.
We look to the future to understand essential human needs and the potential barriers to enabling this new human existence. We then use our uniquediversity of research intellects, disciplines and perspectives to solve key problems through disruptive innovations with the power to enable new economiccapabilities, societal behaviors, business models and types of services - in other words, we drive human and technological revolutions.
Nokia Bell Labs focuses on three core areas of innovation:
◾Patents & standards leadership: Nokia Bell Labs funnels a continuous stream of innovation into Nokia’s intellectual property portfolio. In addition tousing these innovations to create building blocks for Nokia products, they are also a significant source of patent licensing revenue. Equally significant isNokia Bell Labs’ active leadership in establishing communication technology standards through global standards-setting bodies. Our work in this areaaccelerates innovation and drives interoperability, expanding the possibilities for communication service providers, industrials and consumers in the 5Gera.
◾Disruptive research leadership: Fundamental research underpins Nokia Bell Labs’ mission to innovate the technologies and make the discoveries thatimprove human existence. Our research has laid the foundations for the digital world we live in through the software that powers it and thecommunications networks that connect it. Today, Nokia Bell Labs research follows many diverse trajectories but with a common goal: devise thetechnologies that will have the most sustained impact on the service providers, enterprises and the industries Nokia serves.
◾Technology architecture leadership: Nokia Bell Labs is creating the next technological architecture for the industry. This includes building anddemonstrating the power of seamless network and service orchestration across Nokia’s comprehensive product portfolio, which will be critical for themassively scalable networks of the future. Bell Labs Consulting leads customer engagement around future technology architecture, providingindependent advice to service providers, enterprises and industries, while our Future X Labs showcase the possibilities of the evolving architectures.

Table of Contents
20
2020 highlights■ Nokia declared more than 3 500 patent families as essential for the 5G standard, reflecting its continuing leadership and strong momentum in cellular
technology R&D and standardization, driven largely by foundational 5G commercial technologies invented by Nokia Bell Labs.
■ To provide faster realization of 5G strategies and services, Nokia Bell Labs launched a certification program to help industry professionals realize thefull business potential of end-to-end 5G networks. The Nokia Bell Labs End-to-End 5G Certification Program is a first-of-its-kind program that offersprofessionals in communication service providers and enterprises two levels of certification – Associate and Professional – that deliver essentialknowledge covering everything from the basics of 5G networks to professional level planning and design.
■ To support the higher capacity needs of 5G networks with fiber optics, Nokia Bell Labs announced that its researchers set the world record for thehighest single carrier bit rate at 1.52 Terabits per second (Tbit/s) over 80 km of standard single mode fiber – four times the market’s current state-of-the-art of approximately 400 Gigabits per second.
■ NASA selected Nokia and Nokia Bell Labs’ pioneering innovations to build and deploy the first ultra-compact, low-power, space-hardened, end-to-endLTE solution on the lunar surface in late 2022. The network aims to provide critical communication capabilities for many different data transmissionapplications vital to long-term human presence on the lunar surface.
■ Nokia Bell Labs has worked with Alex Thomson Racing to adapt existing and develop new connectivity and sensory technologies to optimize andimprove the performance of Alex Thomson and his racing yacht for the Vendée Globe – a 24 000-mile, solo, non-stop, unassisted race around theworld. The partnership optimizes the human performance of Alex Thomson while discovering and creating technologies for the 5G era that canenhance industrial IoT and mission-critical networks so that they can operate in harsh physical environments.
■ Nokia Bell Labs began 6G research and published the first white paper on the communication and technologies needed in the 6G era, presenting it atmultiple industry symposiums and forums.
■ Bell Labs consulting published the ‘New Collar’ white paper, a study that analyzed different US industry sectors and job classes to determine thatdigital transformation and industrial automation results in a new type of worker. The study also found that the COVID-19 crisis triggered anacceleration of digital transformation across nearly all industries in the world and highlighted the impact on future labor markets.
■ Bell Labs consulting released findings as part of the 5G Business Readiness Report, a landmark report from Nokia, that found that 5G-enabledindustries have the potential to add $8 trillion to the global GDP by 2030(1).
■ Nokia Bell Labs received the 2020 Technology & Engineering Emmy® Award for pioneering work on the charge-coupled device (CCD), the digitalimage sensors embedded in nearly every smartphone and digital camera in the world. The CCD was crucial in the development of television,allowing images to be captured digitally for recording transmission.
■ Nokia Bell Labs’ “Experiments in Arts and Technology” lab collaborated with the Finnish National Opera and Ballet on ‘Opera Beyond’, a project thatexplores the opportunities for emerging technologies to help evolve the performing arts in Finland.
■ Nokia won the SCTE·ISBE Chairmen’s Advanced Technology Award for contributions to the Cable 10G initiative based on Nokia Bell Labs’pioneering innovations in 10G cable systems, including novel scheduling methods and the move towards full duplex 10G systems with extendedspectrum in DOCSIS® 4.0.
■ Nokia Bell Labs contributed its technical expertise in robot orchestration, robot network controller and human-robot interaction to aid research andpromote socially relevant use cases as part of the Nokia Centre of Excellence for Networked Robotics collaboration with the Indian Institute ofScience.
(1) Source: Nokia. 5G Business Readiness Report. October 2020.

Table of Contents
21
Sales and MarketingDuring 2020, customers of Networks fell mainly into two broad categories. The primary customer group consisted of communication service providers(CSPs), while enterprise customers represented another, relatively fast-growing, area.
Our Customer Operations (CO) organization was, throughout 2020, the primary interface to our CSP customers, with CO Americas focusing on our NorthAmerica and Latin America markets, while CO EMEA & APAC held responsibility for our Asia Pacific, Europe, Greater China and Middle East & Africamarkets. Active in around 120 countries, CO ensured, throughout 2020, that our customers were able to benefit from dedicated management attention andour teams’ deep understanding of local markets. Our strong customer relationships were supported by a regional and country-based approach and bycustomer teams, which have for a long time been – and continue today to be – the face of Nokia to our CSP customers.
In addition to sales, CO was – throughout 2020 – responsible for much of our project delivery, ensuring strong alignment between our customer-facingsales and delivery teams in each account. Our “One CDM” (customer delivery manager) model provided a strong counterpart to our sales-focusedcustomer team setup, ensuring that customers have a seamless experience when working with Nokia.
Enterprise customers were in focus for Nokia and continue to grow in importance. Throughout 2020, enterprise customers were served by a dedicatedsales force with a global presence, selling to enterprise customer groups – including transportation, energy, manufacturing and logistics, governments andwebscale businesses – both directly and through channel partners (including system integrators, consulting companies, distributors and value-addedresellers).
The CO organization also worked very closely throughout the year with Nokia Software to ensure the right level of customer focus and expertise in thiscrucial area, and with Nokia Enterprise to make sure we could efficiently serve both our CSP and enterprise customers. Nokia’s innovative “ServiceProvider as a Partner” sales approach – in which we work in partnership with operators to address customers in the enterprise space, continues to be asuccessful route to market for CSPs as well as for Nokia.
Table of Contents
22
Business groups
Mobile NetworksMarket overviewThe primary market for our Mobile Networks business group includes technologies for Radio Access Networks (RAN) i.e. mobile access as well asMicrowave Radio Links (MWR) for transport networks. Mobile access encompasses RAN technologies ranging from 2G/GSM to 5G/NR in licensed andunlicensed spectrum for both macro and small cell deployments. On October 29, 2020, as part of our new operating model, we announced that as ofJanuary 1, 2021 it was planned for Mobile Networks to have a wider remit, including RAN and MWR products, associated network management solutions,as well as network planning and optimization, network deployment and technical support services.
Business overview and organizationIn Mobile Networks our goal is to be a technology leader in 5G/NR, Single RAN (2G/3G/4G/5G) and MWR and provide the best value to our customers asthey evolve their networks. We continue to develop our 5G/NR portfolio according to the latest 3GPP specifications, we have declared more than 3 500patent families as essential for 5G, and are proud of the number of industry firsts that we have achieved. In January 2020, an independent analytics firm,IPlytics GmbH, ranked Nokia #2 for ownership of granted 5G patents declared in at least one office, and an independent study by the consultancycompany PA Consulting concluded that Nokia was #1 for ownership of granted patents that the researchers found essential to the 5G standard. We see astrong appetite for 5G across mobile markets, and we are the only mobile network vendor working with all the major operators in the world’s mostadvanced markets in the US, South Korea and Japan. We are also providing 5G technology in China.
We have a large global installed base in 2G/3G/4G that is providing us with the platform for success in 5G. We have more than 360 customers in 4G/LTEand a robust AirScale platform for Single RAN, which can be upgraded from 4G/LTE to 5G/NR. We built our AirScale portfolio and small cells, softwareand microwave transport solutions to work across all generations of technology and all relevant spectrum bands for efficient, simplified and optimized sitesfor our customers. In June 2020, we announced 5G AirScale Cloud RAN in vRAN 2.0 configuration, with full baseband in cloud including VirtualizedCentralized Unit (vCU) and Virtualized Distributed Unit (vDU). In July 2020, we announced the addition of new open interfaces that would be built on top ofour AirScale portfolio with a suite of O-RAN-defined interfaces expected in 2021.
This broad technology portfolio allows us to help our customers evolve to and launch 5G/NR networks. Nokia was involved in more than 188 5G/NRcommercial engagements in 2020, with the total number of 5G commercial deals at 139 at the end of 2020. A total of 44 of those 5G networks were live in2020 in Asia Pacific, China, the US, Europe, Middle East and Africa. At the end of 2020, we also include within our 139 5G commercial deals 19 public 5Gdeals with enterprise customers beyond Communication Service Providers (CSP), including the world's first 5G-based network for automated rail operationwith Deutsche Bahn in Germany. We have delivered five million 5G/NR software upgradable radios, and we have delivered 5G/NR commercial networks in600MHz, 700MHz, 800MHz, 850MHz, 2.5GHz (TDD), 3.5GHz, 26 GHz, 28GHz and 39GHz. We have launched commercially 5G/NR vRAN 1.0 whichinvolves Cloud RAN for 5G/NR with a virtualized Centralized Unit (vCU). We have activated 4G/5G DSS (Dynamic Spectrum Sharing) and 5G Stand-Alone(SA) in commercial networks, including in T-Mobile US – the world’s first nationwide 5G SA network.
CompetitionThe RAN market is a highly consolidated market, and our main competitors are Huawei, Ericsson and Samsung. Smaller competitors include ZTE, Fujitsu,NEC, Altiostar, Mavenir, Parallel Wireless, JMA Wireless, KMW, Commscope, MTI, and Airspan, for example. The Microwave Radio Links market is morefragmented. There, besides Huawei and Ericsson, our key competitors include, for example, Ceragon, NEC and Aviat.

Table of Contents
23
2020 highlights■ At the end of 2020, we had 139 commercial 5G deals, and we had launched 44 5G networks.
■ We delivered 5G/NR commercial networks in 600MHz, 700MHz, 800MHz, 850MHz, 2.5GHz (TDD), 3.5GHz, 26GHz, 28GHz and 39GHz.
■ Our combined 4G/LTE and 5G/NR market share excluding China was approximately 27% to 28%.
■ We expanded our AirScale portfolio with a Dynamic Spectrum Sharing (DSS) software upgrade for existing Nokia AirScale base stations.
■ We had 260 private wireless customers and 19 publicly announced private 5G wireless customers.
■ Nokia launched the world’s first automated 4G/5G network slicing within RAN, transport and core domains.
■ We announced the next-generation 5G AirScale Cloud RAN solution based on vRAN 2.0, with general availability expected in 2021.
■ We announced the world’s first 5G liquid cooling deployment with Elisa. Our liquid-cooled 5G AirScale Base Station allows operators to cut their BTSsite energy expenses by 30% and CO2 emissions by 80%.
■ We announced an initial set of O-RAN functionalities with a full suite of O-RAN-defined interfaces expected in 2021.
■ Nokia, Elisa and Qualcomm achieved the world’s fastest 5G speeds on a commercial 26 GHz network in Finland by delivering 8 Gbps for the firsttime serving two 5G mmWave devices connected simultaneously.
■ Dell’Oro Group, an industry analyst company, outlined in their Q3/2020 Microwave Transmission report that Nokia was one of only three vendors(with Aviat and Huawei) who outperformed the market and increased their market share. Nokia’s share of the new E-Band market (5G wirelessbackhaul) sharply increased by eight percentage points.

Table of Contents
24
Global ServicesMarket overviewNokia deploys, supports and operates communication service providers’ (CSP) and enterprise networks. This includes network infrastructure services andprofessional services for mobile networks and managed operations for fixed, mobile, IP and optical domains. In addition, new growth areas are networkcognitive services and analytics, deploying and operating networks in public sector, energy and transport markets and introducing new business modelsfor CSPs, such as our Worldwide IoT Network Grid (WING).
Business overview and organizationNokia’s services, solutions and multi-vendor capabilities guide CSPs in their digital transformation journey and help navigate through the evolvingtechnology landscape, network complexity and data growth. We work with CSPs to improve end-user experience while providing support in day-to-daynetwork planning, implementation, operations and maintenance.
The offering, which was part of the Global Services business group in 2020, allows Nokia to differentiate in the 5G market while helping CSPs prioritize their 5G investments and bring 5G-based services to the market faster. Nokia 5G digital services portfolio helps CSPs assess the technical choices and design and deploy end-to-end 5G networks that meet the needs of diverse 5G use cases such as cloud gaming, connected cars and autonomous factory robots.
A key focus area in Global Services is empowering CSPs to transform to digital service providers, supported by a digital architecture for the full lifecycle ofnetwork design, deployment, operations and technical support – for both legacy and cloud-based networks. The Nokia AVA cognitive use cases provideadvanced AI and analytics as well as a common data lake to help boost network performance, operational efficiency and customer experience. We alsohelp digital service providers to seize the possibilities of Internet of Things (IoT) and enter new markets using Nokia Worldwide IoT Network Grid (WING),which provides seamless connectivity across geographical borders and technologies. We enable our customers to enter new markets rapidly and with lowrisk through pay-as-you-grow or revenue share models.
Enterprise is a strategic growth area for Nokia. In 2020, Global Services was focused on enabling the digitalization of asset-intensive industries withconnectivity-driven services and digital automation solutions. Our new digital service framework shortens sales cycles and drives rapid, repeatable servicedelivery helping our enterprise customers to minimize complexity. We deploy private broadband networks to accelerate the digitalization of industries,enabling higher productivity, operational efficiency and increased worker and asset safety. Our global expertise in managed services enables ourenterprise customers to reap the benefits of operational transformation, managed security and network operations support for their new IP/MPLS andmission-critical private LTE networks.
CompetitionIn a market segment that combines products and services as well as managed services, Nokia competes against traditional network equipment providerssuch as Ericsson and Huawei, while for the service-led businesses such as cognitive, IoT and enterprise services, we see other competitors such asCisco, HPE, and IBM emerging.
2020 highlights■ Nokia digitalized 100% of global 5G network deployments, enabling customers to benefit from a faster, more sustainable and higher-quality network
deployment process.
■ Global Services launched the Nokia AVA Quality of Experience (QoE) at the Edge service which enables artificial intelligence to be deployed at theedge, allowing real-time automated actions to improve customer experience, and Nokia AVA 5G Cognitive Operations which uses AI to informnetwork slice creation and help CSPs comply with committed service level agreements (SLAs) for massively scaled 5G networks and enterpriseservices.
■ Nokia WING, a managed service for global IoT deployments that provides seamless connectivity across geographical borders and technologies, sawcontinued momentum with US Cellular, Smart Philippines, China Mobile IoT, Vodafone India and Telecom Argentina, and continued partnership withAT&T. Nokia also upgraded the WING service with 5G and Edge capability to enable operators to offer 5G IoT services faster and cost-effectively.
■ GlobalData, an industry analyst company, rated Nokia as ‘Leader’ in managed services for the second consecutive year, a testimony to our advancedoperations capabilities. In managed services, Nokia announced agreements with Rakuten Mobile to implement a ‘zero touch’ operationalenvironment for 4G and 5G services and with A1 Austria on all existing and new private LTE and 5G enterprise campus network deployments. Wealso introduced cognitive operations to enable CSPs to transform their network and services operations though extreme automation enabled by AI.
■ In Enterprise Services, Nokia introduced four private wireless connectivity segment solutions for connected mining, private wireless for ports andairports, and train to ground. Nokia also announced agreements with Grand Paris Express France , Area X.O. Canada, Vale Brazil, Norcat Canada,BV Singapore, Ameren USA, PGE Systemy Poland, among others.
Table of Contents
25
Fixed NetworksMarket overviewThe primary market of Fixed Networks (FN) is the communication service providers (CSP). FN has been diversifying outside the CSP market into newsegments such as new infrastructure wholesalers and enterprises. FN’s mission is to provide affordable ultrabroadband solutions to connect more people,sooner. FN builds solutions that deliver hundreds of megabits or even gigabit broadband to homes, small businesses and cell sites, and sustain thatgigabit experience into every corner of the home using mesh Wi-Fi solutions. Fiber-to-the-home (FTTH) is now established as the main solution but otherfiber-rich access technologies, such as fixed wireless access (FWA) and xDSL upgrades, continue to be an attractive complement. The key to making theuniversal “gigabit to the home” business case work – connect more people, sooner – is to select the right tool from a broad toolkit. In the 5G era, FN’sFWA and the reuse of FTTH for connecting denser 5G cells site grid are seeing significant traction.
Business overview and organizationThe Fixed Networks focus is based on three pillars: fiber-based access infrastructure to bring a gigabit to every home, business and 5G cell site; Wi-Fisolutions to bring a gigabit into the home; and cloud/virtualization solutions to automate and simplify the network. Innovation and thought leadership are acornerstone of all three areas.
The first pillar of the strategy is about offering the right technology mix to deliver gigabit access to more people, everywhere. It includes fiber, fixed wirelessaccess, and xDSL upgrades, and we have a top three position in every market we serve. Nokia is a leader in fiber access with more than 270 customers.In 2020, FN introduced the industry’s first 25G PON technology. FN remain a market leader in copper technologies, such as VDSL and G.fast and havetaken a leading position in the burgeoning fixed wireless access market, including 4G and 5G outdoor receivers and 5G indoor gateways, with more than85 customers and trials. Our in-house developed Quillion chipset ensures we have best-in-class performance across our portfolio and can innovate atpace.
The second pillar is about ensuring perfect gigabit connectivity throughout the home. Our Nokia WiFi portfolio includes mesh Wi-Fi solutions to provide Wi-Fi coverage in every corner of the building and advanced cloud-based controllers that not only manage and optimize Wi-Fi performance in a single homebut also between buildings and across a network. In 2020, we were first to market with a self-optimizing mesh Wi-Fi 6 solution, providing a superiorexperience for consumers. We have 45+ CSP references for our Nokia WiFi solution.
As CSPs continue to combine different technologies and deployment models, their networks become more complex. The third pillar of the Fixed Networksstrategy looks at simplifying and automating operations, with the cloud and virtualization playing a key role. FN’s Software-Defined Access Network(SDAN) solution takes an open and pragmatic approach, with concrete use cases such as access network slicing, and a smooth evolution path for theinstalled base. Advances in FN’s SDAN controller cloud platform, Altiplano, take CSPs a step closer to the autonomous network. There are now more than250 SDAN-ready deployments.
Underpinning these three pillars is FN’s market-leading services that provide CSPs with smart and efficient ways to transform their networks, adopt newtechnologies and operate their networks. FN has more than 75 network transformation projects to its name and 30+ multi-vendor maintenance contracts.
CompetitionThe competitive landscape in fixed access for CSPs has two major key players, Nokia and Huawei. ZTE follows in third position. Despite the dominantposition in China held by these two Chinese players, Nokia holds a #2 position worldwide, particularly strong in optical line termination (OLT), with 37%market share in the 12 months rolling period ending in June 2020. Smaller players, such as Calix and Adtran, are relevant in North America andFiberhome in China but have limited footprint worldwide, with an estimated market share below 10% and no comparable breadth of portfolio. Nokia is theonly major vendor with a trustworthy market-leading position in every territory.
2020 highlights■ Nokia continues to be a market leader in fiber and fiber extensions (DSL upgrades such as VDSL, G.fast) and has become a leader in the new 5G
fixed wireless access segment. We are the only vendor with a leading market share in all regions worldwide, and the only Western supplier in China.
■ 2020 saw Fixed Networks launch two industry-first solutions: 25G PON enables CSPs to converge home broadband, business services, and 5Gmobile transport on a single PON; self-optimizing Wi-Fi 6 brings high-performance gigabit Wi-Fi to every corner of the home.
■ Our three-pillar strategy is paying off and 2020 saw growth in core solutions as well as new technologies such as whole-home Wi-Fi, fixed wirelessaccess and virtualization. Notable project announcements in 2020 include: Vodacom South Africa (FWA); Openreach and Vivacom Bulgaria (XGS-PON); NetCologne; and Converge ICT (SDAN).
■ Nokia, along with AOI, Chorus, Chunghwa Telecom, Ciena, MACOM, MaxLinear, NBN Co., Sumitomo Electric Industries, Ltd., and TibitCommunications, has established a multi-source agreement (MSA) to promote and accelerate the development of 25G PON, an important next-generation technology that supports emerging 5G and industrial demands.

Table of Contents
26
IP/Optical NetworksMarket overviewCSP networks are under tremendous pressure from cloud-based applications, ultra-broadband evolution and emerging Industry 4.0 applications andservices. Our IP and optical networking solutions reduce time to market and risk as CSPs launch new consumer, mobile and enterprise services, rapidlyscale them to meet surging demands, and continually add new features and functions. Our insight-driven network automation solutions help to furtherensure that network services are delivered with consistent quality, reliability and security and that restorative actions are automatically initiated when anyparameter varies beyond set limits. Overall, our comprehensive portfolio enables CSPs to build and operate automated, secure, and high-performancenetworks at massive scale.
These carrier-grade, mission-critical attributes also address the needs of – and are valued by – other customer segments including webscale companiesand enterprises. In the enterprise segment, we address verticals including transport, energy and the public sector as well as healthcare, finance and retailenterprises leveraging similar solution sets augmented with purpose-built capabilities.
Business overview and organizationOur IP/Optical Networks business group provides the high-performance and massively scalable networks that underpin the digital world’s dynamicinterconnectivity. Our portfolio of robust and innovative systems, software and services play across multiple domains including IP routing and switching,optical networking and network automation.
The IP/Optical Networks product portfolio includes:
◾IP routing solutions for aggregation, edge, core, data center and internet peering applications;
◾IP service gateways for residential, business, mobile and Industrial IoT services and unique hybrid solutions enabling converged service delivery;
◾IP network intelligence, analytics and distributed denial of service (DDoS) security solutions;
◾optical networking solutions including coherent optical transponders, OTN (Optical Transport Network) switching and transport, WDM (Wavelength-Division Multiplexing), ROADMs (Reconfigurable Optical Add-Drop Multiplexer), and optical line systems for metro access and aggregation, data centerinterconnection, longhaul and subsea applications;
◾network automation platforms that analyze, control and manage multi-vendor IP and optical networks;
◾data center automation and software-defined WAN solutions that configure network connectivity among clouds and to any enterprise branch office withthe ease and efficiency of cloud compute; and
◾an extensive portfolio of professional services to accelerate the benefits of integrating new technologies to transform networks and leverage the latestinnovations in SDN, virtualization and programmable IP and optical networks.
CompetitionOur competitive landscape in this space includes Cisco, Juniper Networks, Huawei, and Ciena.
2020 highlights■ Nokia redefined data center fabrics with the launch of a new and modern Network Operating System (NOS) and a declarative, intent-based
automation and operations toolkit, allowing cloud and data center builders to scale and adapt operations brought on from technology shifts such as5G and Industry 4.0. Apple is an early adopter of the innovative technology, deploying the solution within its cloud operations in its data centers.
■ Nokia launched its WaveFabric Elements portfolio of photonic chips, devices and subsystems, including its fifth generation coherent digital signalprocessor family, the Photonic Service Engine V (PSE-V).
■ Nokia introduced new capabilities to automate 4G/5G network slicing across the RAN, transport and core domains, including new functionalities to itsNetwork Services Platform (NSP) to enable it to play a key role in transport and core slicing.
■ Rakuten Mobile selected the Nokia 1830 Photonic Service Switch to power its reconfigurable photonic mesh mobile backhaul network. Nokia’scutting-edge coherent and optical component technologies will enable Rakuten Mobile to flexibly grow its network bandwidth for the rapid rollout of4G and 5G services.
■ Equinix deployed a new Nokia IP/MPLS network infrastructure to support its global interconnection services. This enables Equinix to consolidate intoone, efficient webscale infrastructure to provide FP4-powered connectivity to all data centers – laying the groundwork for customers to deploy 5Gnetworks and services.
■ DISH Network selected Nokia’s cloud-native, standalone core software products to help it build the most advanced, disruptive, fully-automated, cloud-native 5G network in the US. The agreement includes subscriber data management, device management, packet core, voice and data core, as wellas integration services.

Table of Contents
27
Nokia SoftwareMarket overviewNokia Software holds the #1 position in the telecoms software market(1).
Its market is driven by large-scale service and network operations automation; digital business transformation; and the shift to 5G and the cloud. Thebusiness also saw an increase in operator demand to optimize and secure their networks to cope with the communications shifts of COVID-19.
Business overview and organizationBuilt on Nokia’s cloud-native Common Software Foundation (CSF), Nokia’s multi-vendor and multi-network software solutions enrich and secure userexperiences; automate operations and infrastructure; and drive new revenue streams and cost-efficiencies. Nokia’s CSF ensures our software solutionsare easy to deploy, integrate, use, scale and service. Nokia was the first to build a cloud-native software platform at scale in the telecoms software market.
Nokia Software’s business has two parts, Applications and Core. Nokia Software applications improve customer experiences with better intelligence,security, operations and services. Nokia’s core network solutions span 5G, mobile broadband, and IoT; and simplify operations and enable new servicesand revenue streams.
Nokia Software’s strategy is to focus investments in the strategic areas of 5G, automation, portfolio integration, and digital innovation platforms. Investmentin a cloud-native CSF and our multi-vendor, multi-network agnostic approach sets us apart from most large competitors. Against smaller players, Nokiahas the advantage of global delivery capabilities and a large installed base, backed by a broad portfolio.
Competition and ecosystemNokia’s software competitors fall into two main categories: independent software vendors (ISVs) and network equipment providers (NEPs). The main ISVcompetitors are Amdocs, Netcracker and Oracle. The main NEP competitors are Huawei and Ericsson, which sell software as part of large infrastructuredeals. In addition, we see increasing competition from niche, boutique software players.
In the past year, “webscale” players such as Amazon Web Services, Google Cloud Platform, and Microsoft Azure have taken actions to increase theirservice offering to CSPs. These developments will accelerate the move to cloud-native telecoms software, on which Nokia Software has geared itsstrategy, and will open new possibilities for partnering with these webscale players.
While also this market segment faces some pricing pressure, telecom software provides significant long-term opportunity for vendors that can drivetechnology and operational leadership and set the pace of transformation in the industry.
Nokia’s software business is #1 in applications and applications services by revenue, according to Analysys Mason, and has 20–25% market share in corenetworks, according to Nokia data.
(1) Source: Analysys Mason. September 2020.
Table of Contents
28
2020 highlights■ We launched several cloud-native software applications:
– Nokia Network Operations Master to provide vendor-agnostic network management functionalities for managing 5G networks;
– Nokia Assurance Center software to automate network and service operations by using machine learning to help CSPs deliver service levelagreements required for new network functions;
– Nokia Experience Center software to enable automated action prioritization based on what is experienced by customers;
– Digital Operations Center software to give CSPs new revenue-enhancing opportunities with an automated platform that manages 5G slice-basedservices securely; and
– Upgraded cognitive Self-Organizing Networks software to provide CSPs with zero-touch operations for 5G and enabling real-time solutiondeployments.
■ Core saw continued commercial momentum and innovation. Industry research group Global Data ranked Nokia’s Telecom Applications Server as"Leader" again and Nokia’s Session Border Controller as “Very Strong” in all categories.
■ Secured the #1 market share for Self-Organizing Networks, according to LightCounting.
■ Nokia Software’s technology leadership furthered both our Core and Apps deal-win rate and increased their footprint in dozens of new and/or existingcustomers, including:
– Rakuten selected Nokia’s Core services, Monetization and Digital Experience solutions;
– DISH chose Nokia’s cloud-native 5G standalone Core software to build the operator’s US 5G network with scale, performance, and efficiency;
– China Unicom awarded Nokia approximately 10% share of the operator’s 5G core network;
– Singtel selected Nokia to collaborate on developing and trialling 5G network slicing capabilities, based on a Network as a Service (NaaS)approach that provides customers with highly customizable services;
– Optus selected Nokia to help it provide IoT software solutions to Australian mining, utilities and transportation industries;
– Airtel deployed India's largest open cloud-based VoLTE network with Nokia’s CloudBand Infrastructure software;
– Ooredoo Qatar rolled out Nokia’s cloud-native 5G Core network software for commercial 5G services; and
– Sunrise deployed Nokia’s Converged Charging software to drive 5G monetization.
■ There was significant growth in our enterprise business (outside of CSP customers) driven, for example, by deals with Highways England andEltaLab, a Private 5G Core/Apps win in Austria with Citycom; and the first commercial win for the Nokia Enterprise Voice Core solution.
Table of Contents
29
Nokia EnterpriseMarket overviewIn 2020, Nokia continued to grow its business with enterprise customers focusing on two main market needs – the need for high-performance connectivityfor hybrid hyperscale clouds and the need for mission-critical networks in asset-intensive industries. Driven by the continued growth in cloud adoption, ourwebscale customers continue to require high-performance cloud connectivity. In 2020, we expanded our market opportunity in high-performance cloudconnectivity portfolio with our data center switching launch. We also enhanced our private wireless portfolio, with the launch of our 5G standalonecapabilities and Modular Private Wireless solutions.
Our enterprise customers were highly impacted by COVID-19. However, in aggregate, our customers proved to be resilient as they adapted to socialdistancing and local health requirements, which redefined the global workplace with remote and autonomous workplaces. In addition, global businessvalue shifted towards resilient global supply chains as well as the prioritization of business continuity plans, increasing the demand for mission-criticalnetworking. We continue to monitor the overall market impact of the pandemic across the enterprise segments we serve.
Nokia continues to address the enterprise market through a combination of direct sales and service provider, system integrators, industrial, direct andindirect reseller, and distribution partners.
We bring our customers a lauded ethics track record, and corporate values that instill integrity and security, coupled with market expertise tailored to theirindividual needs. Our comprehensive services portfolio wraps our technology offers with deployment assurance, ensuring our customers get performance,innovation and results from the solutions they’ve trusted us to mobilize in their networks.
Business overview and organizationNokia has been serving enterprise clients for decades. In that time, we have developed a deep knowledge of the business requirements of the segmentswe serve. We leverage this long-developed expertise, to architect, build, and deliver solutions to our customers and our partners’ end-customers. Thosesolutions include innovative, high-performance, carrier-grade wireless networks, fixed networks, IP routing, optical networks, and communication andsecurity software. In addition, we leverage our ecosystem of partners to round out our solutions in areas where we do not participate broadly such asdevices, autonomous guided vehicles, and spectrum. We pre-integrate many of our solutions and customize these towards segment-specific requirementsand a suite of lifecycle services.
Our innovation roadmap is the Nokia Bell Labs Future X for industries network architecture. It provides a blueprint for industrial networks, intelligentlycombining high-performance, ubiquitous access with intelligent IP/optical networks, and agile multi-cloud-enabled solutions for industrial automation.Analytics-driven digital value platforms and business applications are tailored to the unique needs of each industry – with security embedded at all levels ofthe architecture.
Our approach has been validated in the market with 1 545 mission-critical customers and our private wireless solutions are used by 260 customersglobally.
Our Energy, Transportation, Government and Cities, and Manufacturing and Logistics segment customers continued to deploy mission-critical connectivityand applications powered by Industry 4.0 acceleration and the need to connect, automate, manage, and control critical industrial assets.
TransportationNokia continues to expand our market penetration into railways, aviation, and maritime segments. We deliver solutions that improve workplace safety andefficiency, enable autonomous operations, and help build better customer experiences. Our solutions support railway signaling, air traffic control criticalcommunications, airport communications, and connectivity as well as effectively automating passenger screening for health and safety. Nokia is wellpositioned in the railway market as it transitions to the 5G-enabled Future Railway Mobile Communications System (FRMCS), a new standard for railwaycommunications.
EnergyNokia provides energy companies, including power utilities, mining, and oil and gas companies, with private wireless networks that offer an affordable,agile, and secure way to deliver improved automation to a range of mission-critical operations in remote and harsh environments, from wind farms tooffshore oil rigs, protecting lives, ensuring business continuity, and increasing productivity. Our solutions have proved essential during COVID-19 as wehelped our power utility customers adapt to major changes in grid usage – powering up field hospitals, and balancing power distribution needs as usageshifted from commercial to residential.
Government and citiesThe Public Safety, Smart City, and National Government segments were influenced in 2020 by the response to COVID-19 and the need for broadband tosupport citizens with education and work in a remote and virtual environment. Globally, we anticipate an acceleration of Government Driven BroadbandInitiatives (GDBI) and digital government projects stemming from gaps in broadband availability, which have become essential today. Our communitybroadband solutions help governments, state, provincial, local agencies, and municipal power utilities to address inner-city connectivity coverage gaps andaddress rural broadband needs.
Nokia’s public safety solutions provide first responders with real-time, broadband mission-critical communications that help save lives and manage crisissituations.
We also help design future-proof cities powered by the required connectivity infrastructure and applications to deliver a safer and more inclusiveenvironment for all citizens. In the realm of Smart Cities, Nokia offers the 'city as a platform' solution, a unique platform-based approach to provideconnectivity, data sharing and usage control capabilities for municipal services such as smart parking, lighting, traffic management. The outcome formunicipalities is an improved quality of life of all citizens.
Table of Contents
30
Manufacturing and logisticsNokia enables Industry 4.0 acceleration in the Manufacturing, Supply Chain, and Logistics segments. Our private wireless networking solutions and IoTplatforms help to automate operations, increase productivity, and reduce costs. Through the digitalization and automation of operational systems,manufacturers and logistics companies can build resiliency and ensure business continuity during impact events.
Nokia has built a foundational customer base providing easy to implement private wireless solutions to enable greater degrees of factory and warehouseautomation. In 2020, we gained traction with deployments with A1 and Magna International in Austria, and Toyota Production Engineering in Japan, andBosch in Germany.
Webscale companiesWebscale companies handle billions of transactions per day in their networks. These customers demand hyper-efficiency in content delivery and supportexceptional online experiences. We help connect webscale infrastructure with high-performance IP routing, open optical systems, and alternative accessand subsea networking solutions. Nokia co-develops advanced open network components with our webscale customers to enhance the performance ofpublic and hybrid cloud platforms, driving market leadership and enabling timely product availability. In 2020, we announced our new data center switchingportfolio with initial customer support from Apple, BT, LINX, Equinix, Turkcell, and others.
CompetitionWe operate in a complex ecosystem where some companies are our customer, our partner, and our competitor. In that ecosystem, our competitors rangefrom broad networking companies with which we have competed for some time, and specialized competitors focusing on a single customer segment, to alarge set of new, smaller competitors who are typically attracted to the transformational value and opportunity of 5G.
Networking competitors include Cisco, Juniper, Ciena, Ericsson, and Huawei (in select geographies). In addition to our primary competitors, we also facemore segment specific competitors such as Motorola, Calix, and Adtran in the public sector, Kontron in the transportation segment, Arista in the webscalesegment, and in the private wireless domain companies such as Athonet and Celona.
Nokia maintains a key advantage for our customers as we offer solutions and expertise spanning broadband wireless, LTE and 5G and we have provenleadership in the market with successful private wireless deployments. Our unique Digital Automation and Modular Private Wireless are leading solutionsin the market(1).
Nokia has a proven co-development track record of working with our customers on high-performance product development that results in marketbreakthroughs. Our high-performance FP4 and PSE-V digital signal processors (DSP) optimize power, performance, and cost across multiple form-factorswith our DSPs supporting applications from metro to subsea deployments. Our focus on open systems offers customers flexibility, business agility andreduces the risks associated with vendor lock-in.
(1) Source: GlobalData. September 20, 2020.

Table of Contents
31
2020 Highlights■ We increased our private wireless networks (4.9G/LTE) business with 260 customers across the globe and cross-industries, marking our leadership
position in the market. We also launched the world's first commercially available 5G standalone (SA) private wireless solutions for the industrialworld, a ‘direct to 5G’ entry point for high-spec industrial use case validation, pushing the 5G ecosystem and leapfrog enterprises into the future withindustrial applications such as robotics, mixed reality platforms, digital automation of operations, and 4K video.
■ We expanded our global collaboration with service providers as partners (e.g. Verizon, AT&T, A1, NTT Docomo) to serve enterprises leveragingspectrum sharing capabilities, and leading to Industry 4.0 acceleration driven by private wireless. This resulted in business growth across marketsand segments.
■ We have moved up the value chain of industrial automation services adding horizontal and vertical capabilities that are critical to client use-cases,including positioning, video analytics, industrial protocol support, security, and management of end devices. These capabilities allow us to deliversegment-specific outcomes as-a-service, expand our automation and integration capabilities and provide our customers with the ability to digitalizeindustry-specific applications and facilitate the convergence of operational technologies (OT) and information technologies (IT).
■ We solidified our leadership position in the private wireless market with the mining industry, helping our customers with open-pit and undergroundmines move past the limitations of Wi-Fi and gain the performance needed for their industrial automation and workplace safety programs. Weachieved key wins in Chile, Australia and Canada, where our Nokia Private wireless solutions are helping to make mines safer, more productive andsustainable.
■ We were honored to be selected by NASA as a key partner for its next mission to the moon. Our innovations, deployed in the most extremeenvironments, are driven by Nokia Bell Labs for NASA and will provide the first-ever cellular network on the moon as it is established as a base ofoperations for forthcoming missions. Connectivity and performance will be critical to providing NASA with timely communications and control forautomated operations. In the same timeframe, Nokia was selected by the U.S. Department of Defense to develop effective methodologies to allowthe sharing or coexistence between airborne radar systems and 5G cellular telephony systems in the 3.1–3.45 GHz band. We were also selected byEE (part of the British Telecom Group) to build the world’s first 4G LTE air-to-ground network for emergency services in the UK.
■ New York Power Authority (NYPA), the US’ largest state public power organization, selected our private wireless solutions to help them become thefirst end-to-end digital utility in the US. Following the successful trial, our solutions will help NYPA modernize its network, conduct and monitoroperations and manage data from the deployment of intelligent sensor-based technologies. With power utility AMEREN, our private wirelesssolutions were selected for field trials to prove the implementation of secure, robust wireless coverage over the utility’s entire 64 000 square mile(103 000 sq. km.) service territory. We received an award and recognition for this effort.
■ Toyota Production Engineering Company will deploy a private LTE/4.9G network at TPEC’s site supporting a range of IoT-based devices that enableequipment digitization and visualization. Over time, the network will be upgraded to 5G, featuring ultra-low latency to support even faster throughput.5G networking will help the manufacturing process to evolve into a more automated operating environment.
■ Continuing our success in the Maritime segment, in 2020, Nokia helped maritime terminal operators automate operations for efficiency, continuity and improved safety.
■ In railways, Nokia helped Japanese rail operator Odakyu Electric Railway leverage machine-learning and video analytics to enhance the safety of railcrossings.
■ In aviation, our 5G solutions are helping Lufthansa Technik to adapt to social distancing safety guidelines by providing high-definition video table inspections of aircraft maintenance and repairs with remote inspection teams – keeping operations flowing efficiently and safely.
■ We have continued to accelerate our penetration of the webscale segment with innovative data center interconnect (DCI) network solutions. Withsignificant contract wins with China-based webscale giants Tencent and Baidu, we continue to strengthen our already strong presence in thesoftware-defined DCI infrastructure market.

Table of Contents
32
Nokia TechnologiesMarket overviewNokia Technologies is responsible for managing and monetizing Nokia’s intellectual property, including patents, technologies, and the Nokia brand,building on Nokia’s continued innovation and decades of research and development (R&D) leadership. We have three focus areas: Patent Licensing whichmonetizes our patent portfolio; Technology Licensing which helps device manufacturers integrate Nokia’s technologies into their products; and BrandPartnerships, which licenses the Nokia brand.
Business overview and organizationNokia Technologies is focused on licensing.
◾We manage the Nokia patent portfolio, working with all other Nokia businesses, and continue to grow our patent licensing and monetization activities,which drive most of Nokia Technologies’ net sales. This includes our successful mobile devices licensing program, where we currently have licensingagreements with most of the major smartphone vendors.
◾Nokia owns one of the broadest and strongest patent portfolios in the mobile communications sector. At the end of 2020, Nokia’s patent portfolioincluded around 20 000 patent families (each family being composed of several individual patents), of which the vast majority will still be in forcethrough 2030.
◾We also have patent licensing programs for other markets which use our standardized technologies, including consumer electronics, connected cars,smart meters, payment terminals, asset tracking and other IoT devices and related industries.
◾Nokia Technologies enables the commercialization of selected fundamental innovations from Nokia Bell Labs and other Nokia business groups in newareas via close collaboration with other companies.
◾We continue to license our innovative multimedia technologies, such as OZO spatial audio and video technologies, to smartphone and cameramanufacturers through our Technology Licensing business, and drive advanced audio and video research and standardization through our MediaTechnologies Research unit.
◾Nokia is a global brand that is recognized by almost anyone. We continue to work with HMD global Oy (HMD Global) – our exclusive licensee for Nokia-branded phones and tablets – along with new brand partners in other product categories, to increase the reach and strength of the Nokia brand.
Research and developmentThe Media Technologies Research unit in Nokia Technologies continues to invent and develop relevant and valuable solutions in emerging consumerexperiences, with the target also to further promote the standardization of important audio and video technologies.
Patents and licensesFor more than 30 years, we have defined many of the fundamental technologies used in virtually all mobile devices and taken a leadership role instandards setting. As a result, we have been ranked #1 in several independent third-party studies for our 2G, 3G, 4G and 5G patents that have beendeclared essential for cellular standards. We continue to generate new intellectual property at a robust rate and expect to remain in the top tier in 5Gstandard essential patents.
As part of our active portfolio management approach, we are continuously evaluating our collective assets and taking actions to optimize the size of ouroverall portfolio while preserving the high quality of our patents. At the end of 2020, our portfolio stood at around 20 000 patent families (each family beingcomposed of several individual patents), built on combined R&D investments of more than EUR 129 billion over the last two decades. This comprisesmore than 3 800 patent families declared as essential to one or more cellular standard, including more than 3 500 patent families declared as essential tothe 5G standard, which enable all 5G networks, connected 5G devices and ‘things’.
We continue to refresh our portfolio from R&D activities across all Nokia businesses, filing patent applications on more than 1 500 new inventions in 2020.
2020 highlights■ In 2020, Nokia across different units invested around EUR 4.1 billion in R&D. This investment yielded altogether more than 1 500 new patent filings,
continuing to renew our industry-leading portfolio.
■ During the year, we signed and continued to benefit from patent license agreements for mobile devices, consumer electronic devices, and IoTconnected devices. In September, we successfully renewed one of our major patent license agreements. This new agreement demonstrates thestrength of our portfolio, particularly now that we have 5G patents to offer.
■ By December 2020, we had declared more than 3 500 patent families (each family being composed of several individual patents) to the EuropeanTelecommunications Standards Institute (ETSI) as essential for the 5G standard, reflecting Nokia’s continuing leadership in cellular technology R&Dand standardization.
■ An independent study conducted by PA Consulting concluded that Nokia is #1 for ownership of granted patents that the researchers found essentialto the 5G Standard.
■ Over the course of the year, our customers ASUS, Axon, HMD Global, OPPO, OnePlus, and Panasonic launched a number of new smartphones andcameras using our industry-leading OZO Audio technology.
■ During 2020, we signed a number of new brand licensing agreements, bringing new Nokia-branded experiences to a range of product categoriesincluding Smart TVs, media streaming boxes and audio accessories, and HMD Global launched its first 5G smartphone, the Nokia 8.3 5G.
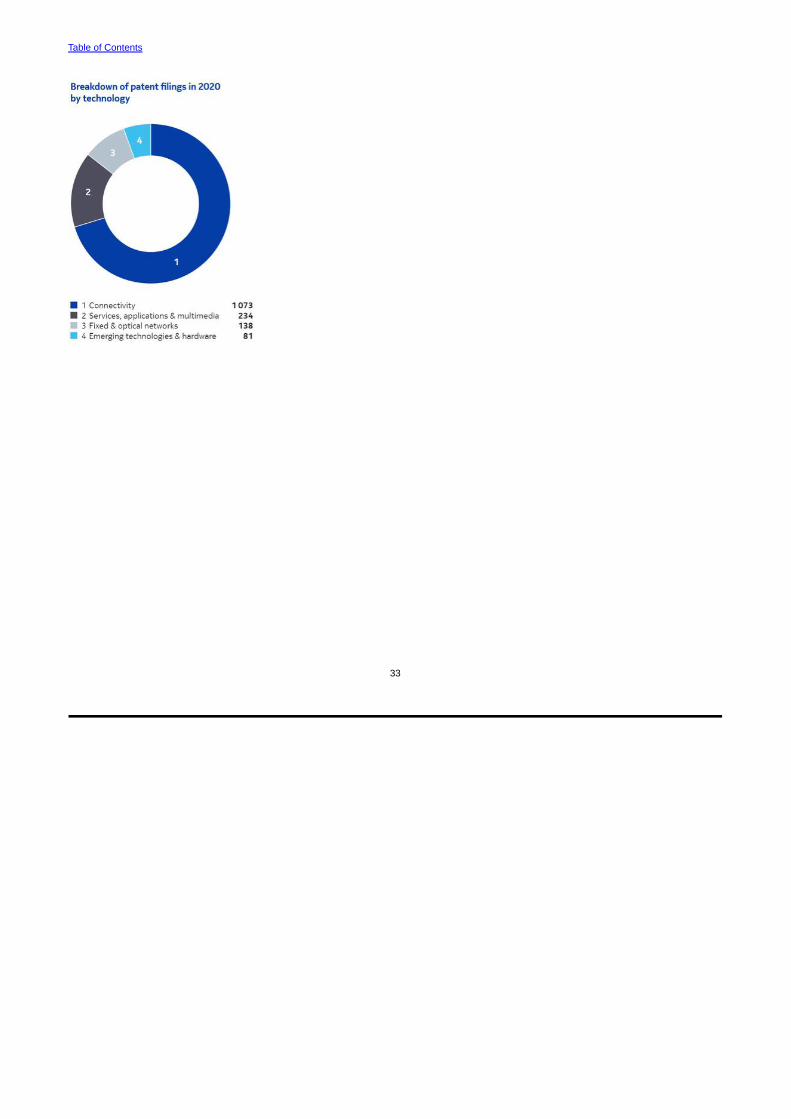
Table of Contents
33

Table of Contents
34
Principal industry trendsNetworks and Nokia SoftwareWe are a leading vendor in the network and IP infrastructure, software, and the related services market. We provide a broad range of products, from thehardware components of networks used by communication service providers and increasingly by customers in other select verticals, to software solutions,as well as services to plan, optimize, implement, run and upgrade networks. In 2020, our Networks reportable segment was comprised of the followingbusinesses: Mobile Access, Fixed Access, IP Routing and Optical Networks. We aim to be innovation leaders, drawing on our frontline R&D capabilities todeliver leading products and services for our customers, and ultimately ensure our long-term value creation.
Industry trendsThe network and IP infrastructure, software and related services industry has witnessed three main trends in recent years, which have also affected ourNetworks and Nokia Software segments. First, the increase in the use of data services and the resulting exponential growth in data traffic has led to anincreased need for high-performance, high-quality and highly reliable networks. The rise in data traffic has, however, not been directly reflected in growthof communication service providers’ revenue. Consequently, there is an imperative to be efficient and cost-competitive for both communication serviceproviders and network infrastructure and services vendors.
Second, we are witnessing continued consolidation among communication service providers, driven by their desire to provide a wider scope of services,especially through the convergence of disparate network technologies across mobile, fixed, and IP and optical networks. In order to improve networks interms of coverage, capacity and quality, communication service providers are continuing their transition to all-IP architectures, with an emphasis on fastaccess to their networks through fiber, LTE and 5G access and new digital services delivery. We are also seeing similar trends with cable operators, whoare investing in the deployment of high-speed networks.
Third, we see a stronger demand for large high-performance networks in some key areas outside the traditional communication service provider space.Webscale companies and extra-large enterprises - such as Apple, Facebook, Google, Alibaba and Amazon - are investing in cloud technology andnetwork infrastructure to build these high-performing, secure networks. In addition, other target vertical markets such as energy, transportation and thepublic sector are investing to build carrier-grade, mission-critical networks.
The first three pillars of our strategy in 2020 were aligned with these industry trends for our Networks and Nokia Software segments. We continued toexecute well on our strategy, with a particular focus on high-performance, end-to-end networks, expansion into new select verticals and building a strongsoftware business at scale. More information about our strategy in 2020 can be found in “Business Overview – Our Strategy”.
Additionally in 2020, we continued to witness some customers reassessing their vendor selection strategies, in light of ongoing security concerns. We areseeing some gains with operators who are reconsidering their vendors as a result of geopolitical issues. We estimate that we have won about half of thevalue of such deals available to date.
Pricing and price erosionWhile we experience varying levels of price erosion across our businesses, it is particularly evident in our Mobile Access business group, given the highlystandardized nature of the business. In 2020, we witnessed increased competitive intensity in some accounts, particularly in North America, as certaincompetitors sought to take share in 5G.
Product mixOur Networks and Nokia Software segments offer a combination of hardware, software and services. The profitability of our Networks and Nokia Softwaresegments is affected by our product mix, including the share of software in the sales mix. For example, this is particularly evident during large technologycycles, as initial deployments consist of a larger portion of hardware and services and less software. As the initial phases of deployments tend to be lowermargin, this is offset by the ongoing deployment of previous generation technologies, which tend to be higher margin. This ratio shifts more towardshigher-margin software further into the cycle, as additional capacity and features are deployed. In 2020, we experienced a decrease in networkdeployment services, following elevated levels in 2019.
Products and services also have varying profitability profiles. Hardware and software products generally have higher gross margins than services, but theyrequire significant R&D investment. Services are typically labor-intensive, while carrying low R&D investment, and have relatively low gross margins.
Seasonality and cyclical nature of projectsNet sales in our Networks and Nokia Software segments are affected by seasonality in the spending cycles of communication service providers, withgenerally higher sales in the fourth quarter, followed by generally lower sales in the first quarter. Also, we have recently witnessed that Networks and NokiaSoftware segments generate the majority of their respective operating profit and free cash flow in the fourth quarter. In addition to normal industryseasonality, there are normal peaks and troughs in the deployment of large infrastructure projects. As an example, the 5G technology cycle accelerated in2020 and is expected to continue over the coming years. The timing of these projects depends on a number of factors, including new radio spectrumallocation, network upgrade cycles and the availability of new consumer devices and services, which in turn could affect the net sales of our businesses.
Continued operational efficiency improvementsIn 2018, following the completion of the Alcatel-Lucent integration and the related cost savings program, we announced a new cost reduction programwhere we intend to target substantial savings while continuing to make further investments to drive future growth and higher returns. The savings wereexpected to come from a wide range of areas, including investments in digitalization to drive more automation and productivity, further process and toolsimplification, significant reductions in central support functions to reach best-in-class cost levels, prioritization of R&D programs to best create long-termvalue, a sharp reduction of R&D in legacy products, driving efficiency from further application of our Common Software Foundation and innovative softwaredevelopment techniques, the consolidation of selected cross-company activities and further reductions in real estate and other overhead costs.
In 2020, we completed our cost savings program, generating the expected savings through the actions listed above. The cost savings program resulted inEUR 500 million of net benefits in full year 2020, compared to full year 2018.

Table of Contents
35
Cost of components and raw materialsThere are several important factors driving the profitability and competitiveness of our Networks and Nokia Software segments: scale, operationalefficiency, pricing, and cost discipline. The costs of our Networks products are comprised of, among others, components, manufacturing, labor andoverheads, royalties and licensing fees, depreciation of product machinery, logistics and warranty and other quality costs. In 2020, margins in ourNetworks segment were positively impacted by progress in Mobile Access, where we continued to focus on driving improvements in our portfolio bystrengthening our roadmaps, reducing product costs and improving our product performance.
Profitability can be affected by changes in the sales volume, as well as the requirement to source large volumes of components on short notice, which canimpact the cost of sales or, in cases where component shortages emerge, the net sales.
Product design and serviceabilityFactors such as product design and serviceability also have an impact on our cost structure with Networks. For example, product design decisions, suchas the use of system-on-chip, or “SoCs” in our Mobile Access products, allow us to improve our product costs as the proportion of SoCs increases withinour products. Additionally, costs can be reduced through improved product serviceability. In 2020, these factors contributed to the improving 5G productcost position.
Nokia TechnologiesNokia Technologies is focused on pursuing new licensing opportunities for our valuable intellectual property, including patents, innovative technologies andknow-how, and the Nokia brand.
General trends in IPR licensingIn general, there has been increased focus on IPR protection and licensing in the market, and this trend is expected to continue. As such, new agreementsare generally a product of lengthy negotiations and occasionally through arbitration or litigation, and therefore the timing and outcome may be difficult toforecast. Due to the structure of patent license agreements, the payments may be infrequent, at times may be partly retrospective, and the lengths oflicense agreements can vary.
Additionally, there are clear regional differences in the ease of protecting and licensing patented innovations. We have seen some licensees activelyavoiding making license payments, and some licensors using aggressive methods to collect them; both behaviors have attracted regulatory attention. Weexpect discussion of the regulation of licensing to continue at both global and regional level. Some of those regulatory developments may be adverse tothe interests of technology developers and patent owners, including us.
Table of Contents
36
Corporate governanceContentsCorporate governance statement 37Introduction 37Regulatory framework 38Main corporate governance bodies of Nokia 39Risk management, internal control and internal audit functions at Nokia 49Main procedures relating to insider administration 50Share ownership of the Board of Directors and the Nokia Group Leadership Team 50Auditor fees and services 51Auditor rotation 51Compensation 52Highlights 52Word from the Chair of the Personnel Committee of the Board 52Remuneration Policy 2020 54Remuneration summary for the Board of Directors 56Remuneration Report 2020 57Introduction 57The President and CEO 58Board of Directors 59Remuneration governance 61Nokia Group Leadership Team remuneration 62Review of our incentive plans 63
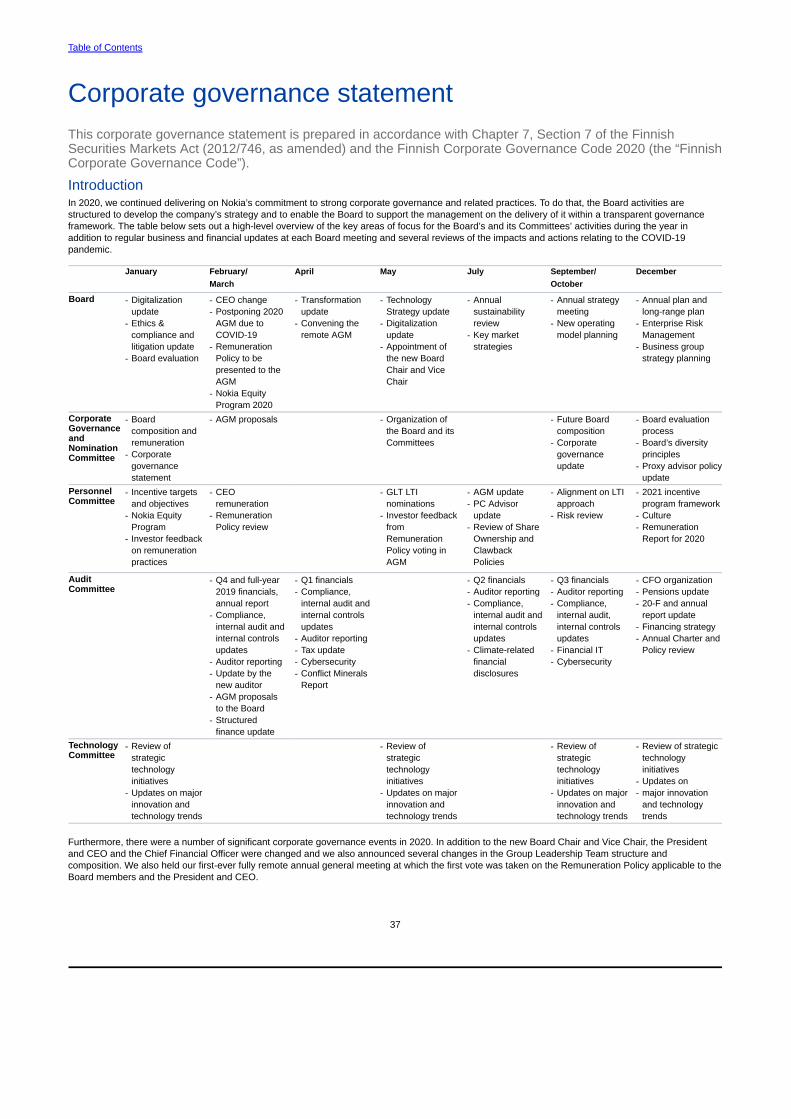
Table of Contents
37
Corporate governance statementThis corporate governance statement is prepared in accordance with Chapter 7, Section 7 of the FinnishSecurities Markets Act (2012/746, as amended) and the Finnish Corporate Governance Code 2020 (the “FinnishCorporate Governance Code”).
IntroductionIn 2020, we continued delivering on Nokia’s commitment to strong corporate governance and related practices. To do that, the Board activities arestructured to develop the company’s strategy and to enable the Board to support the management on the delivery of it within a transparent governanceframework. The table below sets out a high-level overview of the key areas of focus for the Board’s and its Committees’ activities during the year inaddition to regular business and financial updates at each Board meeting and several reviews of the impacts and actions relating to the COVID-19pandemic.
January February/March
April May July September/October
December
Board - Digitalizationupdate
- Ethics &compliance andlitigation update
- Board evaluation
- CEO change- Postponing 2020
AGM due toCOVID-19
- RemunerationPolicy to bepresented to theAGM
- Nokia EquityProgram 2020
- Transformationupdate
- Convening theremote AGM
- TechnologyStrategy update
- Digitalizationupdate
- Appointment ofthe new BoardChair and ViceChair
- Annualsustainabilityreview
- Key marketstrategies
- Annual strategymeeting
- New operatingmodel planning
- Annual plan andlong-range plan
- Enterprise Risk Management
- Business groupstrategy planning
CorporateGovernanceandNomination Committee
- Boardcomposition andremuneration
- Corporategovernancestatement
- AGM proposals - Organization ofthe Board and itsCommittees
- Future Boardcomposition
- Corporategovernanceupdate
- Board evaluationprocess
- Board’s diversityprinciples
- Proxy advisor policyupdate
Personnel Committee
- Incentive targetsand objectives
- Nokia EquityProgram
- Investor feedbackon remunerationpractices
- CEOremuneration
- RemunerationPolicy review
- GLT LTInominations
- Investor feedbackfromRemunerationPolicy voting inAGM
- AGM update- PC Advisor
update- Review of Share
Ownership andClawbackPolicies
- Alignment on LTIapproach
- Risk review
- 2021 incentive program framework
- Culture- Remuneration
Report for 2020
Audit Committee
- Q4 and full-year2019 financials,annual report
- Compliance,internal audit andinternal controlsupdates
- Auditor reporting- Update by the
new auditor- AGM proposals
to the Board- Structured
finance update
- Q1 financials- Compliance,
internal audit andinternal controlsupdates
- Auditor reporting- Tax update- Cybersecurity- Conflict Minerals
Report
- Q2 financials- Auditor reporting- Compliance,
internal audit andinternal controlsupdates
- Climate-relatedfinancialdisclosures
- Q3 financials- Auditor reporting- Compliance,
internal audit,internal controlsupdates
- Financial IT- Cybersecurity
- CFO organization- Pensions update- 20-F and annual
report update- Financing strategy- Annual Charter and
Policy review
Technology Committee
- Review ofstrategictechnologyinitiatives
- Updates on majorinnovation andtechnology trends
- Review ofstrategictechnologyinitiatives
- Updates on majorinnovation andtechnology trends
- Review ofstrategictechnologyinitiatives
- Updates on majorinnovation andtechnology trends
- Review of strategictechnologyinitiatives
- Updates on- major innovation
and technologytrends
Furthermore, there were a number of significant corporate governance events in 2020. In addition to the new Board Chair and Vice Chair, the Presidentand CEO and the Chief Financial Officer were changed and we also announced several changes in the Group Leadership Team structure andcomposition. We also held our first-ever fully remote annual general meeting at which the first vote was taken on the Remuneration Policy applicable to theBoard members and the President and CEO.

Table of Contents
38
Changes in the Board, management and auditor in 2020At the end of 2019 then Chair of the Board Risto Siilasmaa informed the Board’s Corporate Governance and Nomination Committee that he will no longerbe available to serve on the Nokia Board of Directors after the Annual General Meeting in 2020. Mr. Siilasmaa had been a Nokia Board member since2008 and served as Board Chair from 2012 onwards. He also served as interim CEO of Nokia from 2013 to 2014. Consequently, Vice Chair Sari Baldaufwas elected as the new Chair of the Board and Kari Stadigh as the new Vice Chair following their re-election to the Board by the Annual General Meetingin 2020.
On March 2, 2020, Nokia’s Board of Directors appointed Pekka Lundmark as the President and CEO of Nokia and he started in his new role on August 1,2020. The previous President and CEO Rajeev Suri stepped down from his position on July 31, 2020 while continuing to serve as an advisor to the NokiaBoard until January 1, 2021.
On June 11, 2020, Nokia announced the appointment of Marco Wirén as the new Chief Financial Officer of Nokia, effective September 1, 2020. Theprevious Chief Financial Officer Kristian Pullola stepped down from his position on August 31, 2020.
On October 29, 2020, Pekka Lundmark announced the composition of the new Group Leadership Team, effective January 1, 2021. Refer to the section on the Group Leadership Team and the President and CEO below for further information.
On January 1, 2020 Deloitte Oy started as the new auditor of the company as result of the auditor rotation resolved by the Annual General Meeting in2019.
Annual General Meeting 2020 and 2021On March 18, 2020, Nokia cancelled the Annual General Meeting originally convened to be held on April 8, 2020 due to the COVID-19 pandemic andrelated restrictions on public gatherings.
On April 27, 2020, the Board resolved on extraordinary measures pursuant to the temporary legislation approved by the Finnish Parliament on April 24,2020. In order to prevent the spread of the COVID-19 pandemic, the Annual General Meeting was convened to be held without shareholders and theirproxy representatives being present at the meeting venue. Participation in the Annual General Meeting and use of shareholder rights was possible only byvoting in advance, by submitting counterproposals and asking questions in advance.
The Annual General Meeting 2020 eventually took place at the Company’s headquarters in Espoo on May 27, 2020. Approximately 43 000 shareholdersrepresenting approximately 2 300 million shares and votes were represented at the Annual General Meeting through advance voting. The Annual GeneralMeeting supported all of the Board’s proposals by at least 86 percent of the votes cast.
As the COVID-19 situation remains serious, Nokia Corporation’s Annual General Meeting 2021 is planned to be held on April 8, 2021 under extraordinarymeasures pursuant to the temporary legislation, which entered into force on October 3, 2020 to prevent the spread of the COVID-19 pandemic.Participation and exercise of shareholder rights in the meeting will be possible only by voting in advance and by submitting counterproposals and askingquestions in advance. It is not possible for the shareholders or their proxy representatives to participate in the meeting at the meeting venue. Proposals ofthe Board of Directors to the Annual General Meeting 2021 were published on February 4, 2021.
Regulatory frameworkOur corporate governance practices comply with Finnish laws and regulations, our Articles of Association approved by the shareholders and corporategovernance guidelines (Corporate Governance Guidelines) adopted by the Board of Directors. Corporate Governance Guidelines reflect our commitmentto good corporate governance. They include the directors’ responsibilities, the composition and election of the members of the Board and its Committees,and certain other matters relating to corporate governance. We also comply with the Finnish Corporate Governance Code issued by the Securities MarketAssociation.
In addition, we comply with the rules and recommendations of Nasdaq Helsinki and Euronext Paris as applicable to us due to the listing of our shares onthe exchanges. Furthermore, as a result of the listing of our American Depositary Shares on the New York Stock Exchange (NYSE) and our registrationunder the US Securities Exchange Act of 1934, we follow the applicable U.S. federal securities laws and regulations, including the Sarbanes-Oxley Act of2002 as well as the rules of the NYSE, in particular the corporate governance standards under Section 303A of the NYSE Listed Company Manual. Wecomply with these standards to the extent such provisions are applicable to us as a foreign private issuer.
To the extent any non-domestic rules would require a violation of the laws of Finland, we are obliged to comply with Finnish law. There are no significantdifferences in the corporate governance practices applied by Nokia compared with those applied by the US companies under the NYSE corporategovernance standards with the exception that Nokia complies with Finnish law with respect to the approval of equity compensation plans. Under Finnishlaw, stock option plans require shareholder approval at the time of their launch. All other plans that include the delivery of company stock in the form ofnewly issued shares or treasury shares require shareholder approval at the time of the delivery of the shares unless a shareholder approval has beengranted through an authorization to the Board, a maximum of five years earlier. The NYSE corporate governance standards require that the equitycompensation plans are approved by the company’s shareholders. Nokia aims to minimize the necessity for, or consequences of, conflicts between thelaws of Finland and applicable non-domestic corporate governance standards.
In addition to the Corporate Governance Guidelines adopted by the Board, the Committees of the Board have adopted charters that define eachCommittee’s main duties and operating principles. The Board has also adopted the Code of Conduct that applies to directors, executives, and employeesof Nokia, as well as employees of Nokia’s wholly-owned affiliates and subsidiaries.The Code of Conduct also applies to directors, officers, and employeesof other business entities (such as joint ventures) in which Nokia owns a majority of the shares or exercises effective control. Furthermore, the Board hasadopted the Code of Ethics applicable to our key executives, including the President and CEO, CFO and Corporate Controller.

Table of Contents
39
Main corporate governance bodies of NokiaPursuant to the provisions of the Finnish Limited Liability Companies Act (2006/624, as amended) (the Finnish Companies Act) and Nokia’s Articles ofAssociation, the control and management of Nokia are divided among the shareholders at a general meeting, the Board, the President and CEO and theGroup Leadership Team, chaired by the President and CEO.
General Meeting of ShareholdersNokia shareholders play a key role in corporate governance, with our Annual General Meeting offering a regular opportunity to exercise their decision-making power in the company. In addition, at the meeting the shareholders may exercise their right to speak and ask questions, although in 2020 the useof shareholder rights happened by remote means only due to the COVID-19 pandemic and related precautions taken in order to ensure the health andsafety of our shareholders, employees and other stakeholders. Refer to section “Introduction–Annual General Meeting 2020 and 2021” above for furtherinformation.
Each Nokia share entitles a shareholder to one vote at general meetings of Nokia. The Annual General Meeting decides, among other things, on the election and remuneration of the Board, the adoption of the annual accounts, the distribution of profit shown on the balance sheet, and discharging the members of the Board and the President and CEO from liability, as well as on the election and fees of the external auditor. Starting from the 2020 Annual General Meeting, the Remuneration Policy shall be presented to the general meeting at least every four years and the Remuneration Report annually from 2021. Resolutions regarding the policy and report are advisory.
In addition to the Annual General Meeting, an Extraordinary General Meeting may be convened when the Board considers such a meeting to benecessary, or when the provisions of the Finnish Companies Act mandate that such a meeting must be held.
Board of DirectorsThe operations of Nokia are managed under the direction of the Board, within the framework set by the Finnish Companies Act and Nokia’s Articles ofAssociation as well as any complementary rules of procedure as defined by the Board, such as the Corporate Governance Guidelines and the charters ofthe Board’s Committees.
Election and composition of the Board of Directors, election of the Chair and Vice Chair of the Board and the Chairs and members of theBoard’s CommitteesPursuant to the Articles of Association of Nokia Corporation, we have a Board that is composed of a minimum of seven and a maximum of 12 members.The Board is elected at least annually at each Annual General Meeting with a simple majority of the shareholders’ votes cast at the meeting. The term of aBoard member begins at the close of the general meeting at which he or she was elected, or later as resolved by the general meeting, and expires at theclose of the following Annual General Meeting. The Annual General Meeting convenes by June 30 annually.
Our Board’s leadership structure consists of a Chair and Vice Chair elected annually by the Board, and confirmed by the independent directors of theBoard from among the Board members upon the recommendation of the Corporate Governance and Nomination Committee. The Chair of the Board hascertain specific duties as stipulated by Finnish law and our Corporate Governance Guidelines. The Vice Chair of the Board assumes the duties of the Chairof the Board in the event he or she is prevented from performing his or her duties.
The independent directors of the new Board also confirm the election of the members and chairs for the Board’s Committees from among the Board’sindependent directors upon the recommendation of the Corporate Governance and Nomination Committee and based on each Committee’s memberqualification standards. These elections take place at the Board’s assembly meeting following the general meeting.
Board diversityThe Board has adopted principles concerning Board diversity describing our commitment to promoting diverse Board composition and how diversity isembedded into our processes and practices when identifying and proposing new Board candidates as well as re-election of current Board members.
At Nokia, diversity is not a static concept but rather a relevant mix of required elements for the Board as a whole that evolves with time based on, amongother things, the relevant business objectives and future needs of Nokia. The Board diversity is treated as a means of improvement and developmentrather than an end in itself. Diversity of our Board is considered from a number of aspects including, but not limited to, skills and experience, age,nationality, ethnicity, cultural and educational backgrounds, gender identity, sexual orientation as well as other individual qualities. Both genders shall berepresented on the Board.
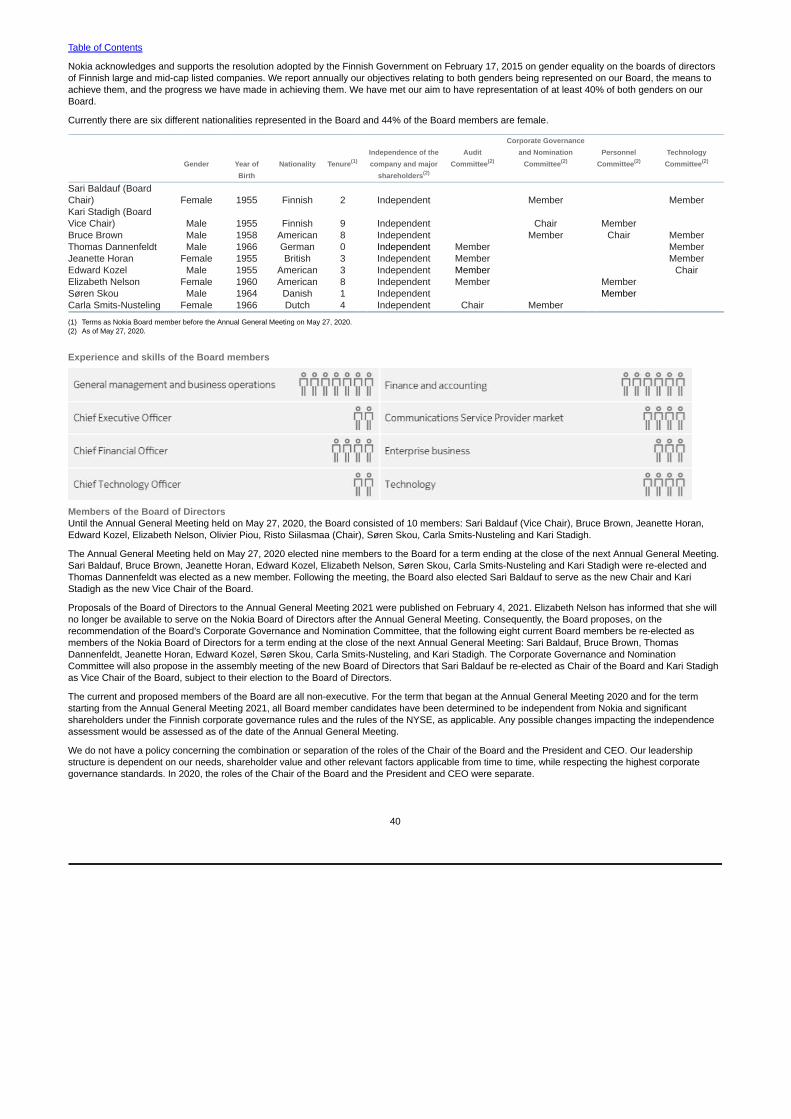
Table of Contents
40
Nokia acknowledges and supports the resolution adopted by the Finnish Government on February 17, 2015 on gender equality on the boards of directorsof Finnish large and mid-cap listed companies. We report annually our objectives relating to both genders being represented on our Board, the means toachieve them, and the progress we have made in achieving them. We have met our aim to have representation of at least 40% of both genders on ourBoard.
Currently there are six different nationalities represented in the Board and 44% of the Board members are female.
Corporate GovernanceIndependence of the Audit and Nomination Personnel Technology
Gender Year of Nationality Tenure(1) company and major Committee(2) Committee(2) Committee(2) Committee(2)
Birth shareholders(2)
Sari Baldauf (BoardChair) Female 1955 Finnish 2 Independent Member MemberKari Stadigh (BoardVice Chair) Male 1955 Finnish 9 Independent Chair MemberBruce Brown Male 1958 American 8 Independent Member Chair MemberThomas Dannenfeldt Male 1966 German 0 Independent Member MemberJeanette Horan Female 1955 British 3 Independent Member MemberEdward Kozel Male 1955 American 3 Independent Member ChairElizabeth Nelson Female 1960 American 8 Independent Member MemberSøren Skou Male 1964 Danish 1 Independent MemberCarla Smits-Nusteling Female 1966 Dutch 4 Independent Chair Member
(1) Terms as Nokia Board member before the Annual General Meeting on May 27, 2020.(2) As of May 27, 2020.
Experience and skills of the Board members
Members of the Board of DirectorsUntil the Annual General Meeting held on May 27, 2020, the Board consisted of 10 members: Sari Baldauf (Vice Chair), Bruce Brown, Jeanette Horan,Edward Kozel, Elizabeth Nelson, Olivier Piou, Risto Siilasmaa (Chair), Søren Skou, Carla Smits-Nusteling and Kari Stadigh.
The Annual General Meeting held on May 27, 2020 elected nine members to the Board for a term ending at the close of the next Annual General Meeting.Sari Baldauf, Bruce Brown, Jeanette Horan, Edward Kozel, Elizabeth Nelson, Søren Skou, Carla Smits-Nusteling and Kari Stadigh were re-elected andThomas Dannenfeldt was elected as a new member. Following the meeting, the Board also elected Sari Baldauf to serve as the new Chair and KariStadigh as the new Vice Chair of the Board.
Proposals of the Board of Directors to the Annual General Meeting 2021 were published on February 4, 2021. Elizabeth Nelson has informed that she willno longer be available to serve on the Nokia Board of Directors after the Annual General Meeting. Consequently, the Board proposes, on therecommendation of the Board’s Corporate Governance and Nomination Committee, that the following eight current Board members be re-elected asmembers of the Nokia Board of Directors for a term ending at the close of the next Annual General Meeting: Sari Baldauf, Bruce Brown, ThomasDannenfeldt, Jeanette Horan, Edward Kozel, Søren Skou, Carla Smits-Nusteling, and Kari Stadigh. The Corporate Governance and NominationCommittee will also propose in the assembly meeting of the new Board of Directors that Sari Baldauf be re-elected as Chair of the Board and Kari Stadighas Vice Chair of the Board, subject to their election to the Board of Directors.
The current and proposed members of the Board are all non-executive. For the term that began at the Annual General Meeting 2020 and for the termstarting from the Annual General Meeting 2021, all Board member candidates have been determined to be independent from Nokia and significantshareholders under the Finnish corporate governance rules and the rules of the NYSE, as applicable. Any possible changes impacting the independenceassessment would be assessed as of the date of the Annual General Meeting.
We do not have a policy concerning the combination or separation of the roles of the Chair of the Board and the President and CEO. Our leadership structure is dependent on our needs, shareholder value and other relevant factors applicable from time to time, while respecting the highest corporate governance standards. In 2020, the roles of the Chair of the Board and the President and CEO were separate.

Table of Contents
41
Biographical details of our current Board membersChair Sari Baldaufb. 1955Chair of the Nokia Board. Board member since 2018. Chair since 2020. Member of the Corporate Governance and Nomination Committee and theTechnology Committee.
Master of Business Administration, Helsinki School of Economics and Business Administration, Finland. Bachelor of Science, Helsinki School ofEconomics and Business Administration, Finland. Honorary doctorates in Technology (Helsinki University of Technology, Finland) and BusinessAdministration (Turku School of Economics and Business Administration and Aalto University School of Business, Finland).
Executive Vice President and General Manager, Networks Business Group, Nokia, 1998–2005. Various executive positions at Nokia in Finland and theUnited States 1983–1998.
Member of the Supervisory Board and Member of the Nomination Committee of Daimler AG. Member of Supervisory Board of Daimler Truck AG. Memberof the Board of Directors and Chair of the Audit Committee of Aalto University. Chair of the Board of Directors of Vexve Armatury Oy. Senior Advisor ofDevCo Partners Oy. Member of the Board of Directors of Demos Helsinki. Member of the Board of Directors and Member of the Executive Committee ofTechnology Industries of Finland.
Member of the Supervisory Board of Deutsche Telekom AG 2012–2018. Chair of the Board of Directors of Fortum Oyj 2011–2018. Member of the Board ofDirectors of Akzo Nobel 2012–2017.
Vice Chair Kari Stadighb. 1955
Vice Chair of the Nokia Board. Board member since 2011. Vice Chair since 2020. Chair of the Corporate Governance and Nomination Committee andmember of the Personnel Committee.
Master of Science (Eng.), Helsinki University of Technology, Finland. Bachelor of Business Administration, Hanken School of Economics, Helsinki, Finland.
Group CEO and President of Sampo plc 2009–2019. Deputy CEO of Sampo plc 2001–2009. President of Sampo Life Insurance Company Limited 1999–2000. President of Nova Life Insurance Company Ltd 1996–1998. President and COO of Jaakko Pöyry Group 1991–1996.
Member of the Board of Directors of Metso Outotec Corporation.
Chair of the Board of Directors of Mandatum Life Insurance Company Limited 2001–2019. Chair of the Board of Directors of If P&C Insurance Holding Ltd2002–2019. Member of the Board of Directors of Nordea Bank AB (publ) 2010–2018. Chair of the Board Risk Committee (BRIC) of Nordea Bank AB (publ)2011–2018.
Bruce Brownb. 1958Nokia Board member since 2012. Chair of the Personnel Committee. Member of the Corporate Governance and Nomination Committee and theTechnology Committee.
MBA Xavier University, the United States. BS (Chemical Engineering), Polytechnic Institute of New York University, the United States.
Chief Technology Officer of the Procter & Gamble Company 2008–2014. Various executive and managerial positions in Baby Care, Feminine Care, andBeauty Care units of the Procter & Gamble Company since 1980 in the United States, Germany and Japan.
Member of the Board of Directors, the Audit Committee and the Nominating and Corporate Governance Committee of P. H. Glatfelter Company.
Member of the Board of Directors, the Audit Committee and the Compensation Committee of Medpace Inc 2016–2019. Member of the Board of Directorsof Agency for Science, Technology & Research (A*STAR) in Singapore 2011–2018.
Thomas Dannenfeldtb. 1966Nokia Board member since 2020. Member of the Audit Committee and the Technology Committee.
Degree in Mathematics, University of Trier, Germany.
Chief Financial Officer of Deutsche Telekom AG 2014–2018. Chief Financial Officer of Deutsche Telekom’s German operations 2010–2014. Variousoperational positions (sales, marketing, customer care, finance and procurement in fixed and mobile business, national and international positions) inDeutsche Telekom 1992–2010.
Chair of the Supervisory Board of CECONOMY AG and member of the Board of Advisors at axxessio GmbH.
Member of the Board of Directors of T-Mobile US 2013–2018 and Buy-In 2013–2018. Chair of the Board of Directors of T-Systems International 2013–2018 and EE 2014–2016.

Table of Contents
42
Jeanette Horanb. 1955Nokia Board member since 2017. Member of the Audit Committee and the Technology Committee.
MBA, Business Administration and Management, Boston University, the United States. BSc, Mathematics, University of London, the United Kingdom.
Various executive and managerial positions in IBM 1998–2015. Vice President of Digital Equipment Corporation 1994–1998. Vice President, Developmentof Open Software Foundation 1989–1994.
Member of the Supervisory Board at Wolters Kluwer, and the Chair of the Remuneration Committee. Member of the Board of Advisors at Jane Doe NoMore, a non-profit organization. Member of the Board of Directors of the Ridgefield Symphony Orchestra, a non-profit organization.
Member of the Board of Advisors of Cybereason 2017–2018. Member of the Board of Directors of West Corporation 2016–2017 and Microvision 2006–2017.
Edward Kozelb. 1955Nokia Board member since 2017. Chair of the Technology Committee and member of the Audit Committee.
Degree in Electrical Engineering and Computer Science, University of California, the United States.
President and CEO of Range Networks 2013–2014. Owner of Open Range 2000–2013. Chief Technology and Innovation Officer and member of theBoard of Management of Deutsche Telekom 2010–2012. CEO of Skyrider 2006–2008. Managing Director of Integrated Finance 2005–2006. Senior VicePresident, Business development and Chief Technology Officer and Board Member of Cisco 1989–2001.
Member of the Advisory Board at Telia Ventures.
Various Board Memberships in 1999–2009.
Elizabeth Nelsonb. 1960Nokia Board member since 2012. Member of the Audit Committee and the Personnel Committee.
MBA (Finance), the Wharton School, University of Pennsylvania, the United States. BS (Foreign Service), Georgetown University, the United States.
Executive Vice President and Chief Financial Officer, Macromedia, Inc. 1997–2005. Vice President, Corporate Development, Macromedia, Inc. 1996–1997. Various roles in Corporate Development and International Finance, Hewlett-Packard Company 1988–1996.
Chair of the Board of Directors of DAI. Independent Member of the Board of Directors and Chair of the Audit Committee of Upwork Inc.
Independent Member of the Board of Directors and Chair of the Audit Committee of Berkeley Lights, Inc.
Independent Lead Director and Chair of the Audit Committee of Zendesk Inc 2013–2019. Member of the Board of Directors of Pandora Media 2013–2017.
Søren Skoub. 1964CEO of A.P. Møller Mærsk A/S. Nokia Board member since 2019. Member of the Personnel Committee.
MBA (honours), IMD, Switzerland. Business Administration, Copenhagen Business School, Denmark. Maersk International Shipping Education (M.I.S.E.).
Maersk Line Copenhagen CEO 2012–2016. Maersk Tankers Copenhagen CEO 2001–2011. Maersk Tankers Copenhagen Head of Crude and Product1999–2001. Maersk Line Copenhagen Head of Department 1997–1998. Maersk Line Beijing Operations Manager 1994–1996. Maersk Line Copenhagenand New Jersey, Charterer and other roles 1983–1994.
Member of International Council of Containership Operators (ICCO).
Carla Smits-Nustelingb. 1966Nokia Board member since 2016. Chair of the Audit Committee and member of the Corporate Governance and Nomination Committee.
Master’s Degree in Business Economics, Erasmus University Rotterdam, the Netherlands. Executive Master of Finance and Control, Vrije UniversityAmsterdam, the Netherlands.
Member of the Board of Directors and Chief Financial Officer of KPN 2009–2012. Various financial positions in KPN 2000–2009. Various financial andoperational positions in TNT/PTT Post 1990–2000.
Member of the Supervisory Board since 2013 and Chair of the Audit Committee of ASML. Chair of the Board of Directors of TELE2 AB. Member of theBoard of Directors, Chair of the Audit Committee and member of the Remuneration and Nomination Committee of Allegro.eu SA. Member of the Board ofDirectors of the Stichting Continuïteit Ahold Delhaize (SCAD) foundation. Lay Judge in the Enterprise Court of the Amsterdam Court of Appeal since 2015.
Member of the Management Board of the Unilever Trust Office 2015-2019.
Due to transitioning from one board to another, Carla Smits-Nusteling temporarily holds four audit committee positions in public companies, including Nokia. She recently joined the Board and Audit Committee of Allegro.eu SA while she will step down from the ASML Board and Audit Committee on April 29, 2021. As required under the NYSE corporate governance standards, the Board has determined that her ability to effectively serve on Nokia’s Audit Committee is not impaired due to this short period of serving on more than three audit committees of listed companies.

Table of Contents
43
Operations of the Board of DirectorsThe Board represents and is accountable to the shareholders of Nokia. While its ultimate statutory accountability is to the shareholders, the Board alsotakes into account the interests of the Company’s other stakeholders. The Board’s responsibilities are active, not passive, and include the responsibility toevaluate the strategic direction of Nokia, its management policies and the effectiveness of the implementation of such by the management on a regularbasis. It is the responsibility of the members of the Board to act in good faith and with due care, so as to exercise their business judgement on an informedbasis, in a manner that they reasonably and honestly believe to be in the best interests of Nokia and its shareholders. In discharging that obligation, themembers of the Board must inform themselves of all relevant information reasonably available to them. The Board and each Board Committee also havethe power to appoint independent legal, financial or other advisors as they deem necessary. The Company will provide sufficient funding to the Board andto each Committee to exercise their functions and provide compensation for the services of their advisors.
The Board is ultimately responsible for monitoring and reviewing Nokia’s financial reporting process, effectiveness of related control and audit functionsand the independence of Nokia’s external auditor, as well as for monitoring the statutory audit of the annual and consolidated financial statements. TheBoard’s responsibilities also include overseeing the structure and composition of our top management and monitoring legal compliance and themanagement of risks related to our operations. In doing so, the Board may set annual ranges and/or individual limits for capital expenditures, investmentsand divestitures and financial and non-financial commitments that may not be exceeded without a separate Board approval.
In risk management policies and processes, the Board’s role includes risk analysis and assessment in connection with financial, strategy and businessreviews, updates and decision-making proposals. Risk management policies and processes are integral parts of Board deliberations and risk-relatedupdates are provided to the Board on a recurring basis. For a more detailed description of our risk management policies and processes, refer to “—Riskmanagement, internal control and internal audit functions at Nokia—Main features of risk management systems” below.
Under our Corporate Governance Guidelines, the Board monitors the sustainability activities of the company, covering variety of environmental and socialmatters, and it periodically reviews the company’s related targets and performance. The Group Leadership Team decides on the environmental and socialapproach and key targets, and the key targets are incorporated into the ongoing performance management and related monthly business reviews of thebusiness groups by the Group Leadership Team. In addition, the Board Committees monitor environmental and social developments in their respectiveareas of responsibilities, which in 2020 included for the Audit Committee the implementation planning of climate related financial reporting and reviewingthe use of conflict minerals in the company’s products, Personnel Committee the incorporation of environmental and social targets in the incentivestructures, and Corporate Governance and Nomination Committee the assessment of the environmental, social and governance (ESG) relatedgovernance trends. The business groups and other units are responsible for the implementation of the ESG policies and instructions to their operations.
The Board has the responsibility for appointing and discharging the President, the Chief Executive Officer, Chief Financial Officer and Chief Legal Officer.Since August 2020, Pekka Lundmark has served as the President and CEO. His rights and responsibilities include those allotted to the President underFinnish law and he also chairs the Group Leadership Team.
The Board approves and the independent directors of the Board confirm the compensation and terms of employment of the President and CEO, subject tothe requirements of Finnish law, upon the recommendation of the Personnel Committee of the Board. The compensation and employment conditions ofthe other members of the Group Leadership Team are approved by the Personnel Committee upon the recommendation of the President and CEO.
Board evaluationIn line with our Corporate Governance Guidelines, the Board conducts an annual performance evaluation, which also includes evaluation of the BoardCommittees’ work, the Board and Committee Chairs and individual Board members. The Board evaluation is conducted as a self-evaluation while anexternal evaluator is periodically engaged. In 2020, the evaluation process included both numeric assessments and the possibility to provide more detailedwritten and verbal comments. Feedback is also requested from selected members of management as part of the Board evaluation process. Each year, theresults of the evaluation are discussed and analyzed by the entire Board and improvement actions are agreed based on such discussion.
Meetings of the Board of DirectorsThe Board held 20 meetings excluding Committee meetings during 2020, of which approximately 60% were meetings in person/by video. In 2020, thesemeetings were mainly conducted by access via video as a consequence of travel restrictions in place due to the COVID-19 pandemic. The other meetingswere held in writing.
Meetings in person/ Meetings Attendance inby video in writing all meetings %
Full Board 12 8 100Audit Committee 6 0 93Corporate Governance and Nomination Committee 3 1 100Personnel Committee 6 2 98Technology Committee 4 0 100

Table of Contents
44
Directors’ attendance at the Board and Committee meetings in 2020 is set forth in the table below:
Corporate Governance
Audit and Nomination Personnel TechnologyBoard Committee Committee Committee Committee
meetings meetings meetings meetings meetings% % % % %
Sari Baldauf (Board Chair) 100 100 100 100Kari Stadigh (Board Vice Chair) 100 100 100Bruce Brown 100 100 100 100Thomas Dannenfeldt (from May 27, 2020) 100 100 100Jeanette Horan 100 100 100Edward Kozel 100 83 100Elizabeth Nelson 100 100 88Olivier Piou (until May 27, 2020) 100 67 100Risto Siilasmaa (until May 27, 2020) 100 100 100Søren Skou 100 100Carla Smits-Nusteling 100 100 100
Additionally, many of the directors attended, as non-voting observers, meetings of a Committee of which they were not a member.
Directors meet without management in connection with each regularly scheduled meeting. According to Board practices, meetings without managementpresent would only be attended by non-executive directors and be chaired by the non-executive Chair of the Board. If the non-executive Chair of the Boardis unable to chair these meetings, the non-executive Vice Chair of the Board chairs the meeting. Additionally, the independent directors would meetseparately at least once annually. In 2020, all members of the Board were non-executive and determined to be independent from Nokia and significantshareholders under the Finnish corporate governance standards and the rules of the NYSE.
In order to prevent the spread of the COVID-19 pandemic, the Board of Directors resolved pursuant to the temporary legislation approved by the FinnishParliament on April 24, 2020 to hold the Annual General Meeting 2020 without the presence of shareholders, their proxy advisors, the Board and themanagement. Only the Chair of the Board Risto Siilasmaa was present in person to open the meeting.
Committees of the Board of DirectorsThe Board of Directors has four committees that assist the Board in its duties pursuant to their respective committee charters. The Board may alsoestablish ad hoc committees for detailed reviews or consideration of particular topics to be proposed for the approval of the Board. Any director who sowishes may attend, as a non-voting observer, meetings of committees of which they are not members.
Board of Directors
Audit CommitteeCorporate Governance andNomination Committee Personnel Committee Technology Committee
Oversees the accounting andfinancial reporting processes ofNokia and the audits of its financialstatements as well as the internalcontrols and compliance program.
Prepares the proposals for thegeneral meetings in respect of thecomposition of the Board and thedirector remuneration to beapproved by the shareholders, andmonitors issues and practicesrelated to corporate governance andproposes necessary actions inrespect thereof.
Oversees the personnel-relatedpolicies and practices at Nokia.Assists the Board in discharging itsresponsibilities in relation to allcompensation, including equitycompensation, of the company’sexecutives and their terms ofemployment.
Engages in a dialogue with andprovides opinions and advice tomanagement with respect tosignificant innovation and technologystrategies of the company which areformulated and executed by themanagement of the company.
The Audit CommitteeThe Committee consists of a minimum of three members of the Board who meet all applicable independence, financial literacy and other requirements asstipulated by Finnish law and the rules of Nasdaq Helsinki and the NYSE. From May 27, 2020, the Audit Committee has consisted of the following fivemembers of the Board: Carla Smits-Nusteling (Chair), Thomas Dannenfeldt, Jeanette Horan, Edward Kozel and Elizabeth Nelson.
The Committee is responsible for assisting the Board in the oversight of:
◾the quality and integrity of the company’s financial statements and related disclosures;
◾the statutory audit of the company’s financial statements;
◾the external auditor’s qualifications and independence;
◾the performance of the external auditor subject to the requirements of Finnish law;
◾the performance of the company’s internal controls and risk management and assurance function;
◾the performance of the internal audit function;
◾the Company’s compliance with legal and regulatory requirements, including the performance of its ethics and compliance program; and
◾the pension liabilities, taxation and cybersecurity of the company.
In discharging its oversight role, the Audit Committee has full access to all company books, records, facilities and personnel. The Audit Committee alsomaintains procedures for the receipt, retention and treatment of complaints received by the company regarding accounting, internal controls, or auditingmatters and for the confidential, anonymous submission by our employees of concerns relating to accounting or auditing matters. Nokia’s

Table of Contents
45
disclosure controls and procedures, which are reviewed by the Audit Committee and approved by the President and CEO and the Chief Financial Officer,as well as the internal controls over financial reporting, are designed to provide reasonable assurance regarding the quality and integrity of the company’sfinancial statements and related disclosures. For further information on internal control over financial reporting, refer to “Risk management, internal controland internal audit functions at Nokia–Description of internal control procedures in relation to the financial reporting process” below.
Under Finnish law, an external auditor is elected by a simple majority vote of the shareholders at the Annual General Meeting for one year at a time. TheAudit Committee prepares the proposal to the shareholders, upon its evaluation of the qualifications and independence of the external auditor, of thenominee for election or re-election. Under Finnish law, the fees of the external auditor are also approved by the shareholders by a simple majority vote atthe Annual General Meeting. The Committee prepares the proposal to the shareholders in respect of the fees of the external auditor, and approves theexternal auditor’s annual audit fees under the guidance given by the Annual General Meeting. For information about the fees paid to Nokia’s externalauditor, Deloitte Oy, during 2020, refer to “Auditor fees and services” below.
The Board has determined that all members of the Audit Committee, including its Chair, Carla Smits-Nusteling, are “audit committee financial experts” asdefined in the requirements of Item 16A of the Annual Report on Form 20-F filed with the U.S. Securities and Exchange Commission (SEC). Ms. Smits-Nusteling and each of the other members of the Audit Committee are “independent directors” as defined by Finnish law and Finnish CorporateGovernance Code and in Section 303A.02 of the NYSE Listed Company Manual.
The Audit Committee meets a minimum of four times a year based on a schedule established at the first meeting following the appointment of theCommittee. The Committee meets separately with the representatives of Nokia’s management, heads of the internal audit, and ethics and compliancefunctions, and the external auditor in connection with each regularly scheduled meeting. The head of the internal audit function has, at all times, directaccess to the Audit Committee, without the involvement of management.
Audit Committee pre-approval policies and proceduresThe Audit Committee of the Board is responsible, among other matters, for oversight of the external auditor’s independence, subject to the requirements ofapplicable legislation. The Audit Committee has adopted a policy regarding an approval procedure of audit services performed by the external auditors ofNokia Group and permissible non-audit services performed by the principal external auditor of the Nokia Group (the “Pre-approval Policy”).
Under the Pre-approval Policy, proposed services either: (i) may be pre-approved by the Audit Committee in accordance with certain service categoriesdescribed in the Pre-approval Policy (general pre-approval); or (ii) require the specific pre-approval of the Audit Committee (specific pre-approval). ThePre-approval Policy sets out the audit, audit-related, tax and other services that have received the general pre-approval of the Audit Committee. All otheraudit, audit-related (including services related to internal controls and significant mergers and acquisitions projects), tax and other services are subject tospecific pre-approval by the Audit Committee. All service requests concerning generally pre-approved services will be submitted to an appointed AuditCommittee delegate within management, who will determine whether the services are within the services generally pre-approved. The Pre-approval Policyis subject to annual review by the Audit Committee.
The Audit Committee establishes budgeted fee levels annually for each of the categories of audit and non-audit services that are pre-approved under thePre-approval Policy, namely, audit, audit-related, tax and other services. At each regular meeting of the Audit Committee, the auditor provides a report inorder for the Audit Committee to review the services that the auditor is providing, as well as the cost of those services.
The Corporate Governance and Nomination CommitteeThe Committee consists of three to five members of the Board who meet all applicable independence requirements as stipulated by Finnish law and therules of Nasdaq Helsinki and the NYSE. From May 27, 2020 the Corporate Governance and Nomination Committee has consisted of the following fourmembers of the Board: Kari Stadigh (Chair), Sari Baldauf, Bruce Brown and Carla Smits-Nusteling.
The Committee fulfills its responsibilities by:
◾actively identifying individuals qualified to be elected members of the Board as well as considering and evaluating the appropriate level and structure ofdirector remuneration;
◾preparing and evaluating the principles regarding Board diversity;
◾preparing proposals to the shareholders on the director nominees for election at the general meetings as well as director remuneration;
◾monitoring significant developments in the law and practice of corporate governance and of the duties and responsibilities of directors of publiccompanies;
◾assisting the Board and each Committee of the Board in its annual performance evaluations, including establishing criteria to be applied in connectionwith such evaluations;
◾developing and recommending to the Board and administering Nokia’s Corporate Governance Guidelines; and
◾reviewing Nokia’s disclosure in the corporate governance statement.
The Committee has the power and practice to appoint a recruitment firm to identify appropriate new director candidates.
The Personnel CommitteeThe Committee consists of a minimum of three members of the Board who meet all applicable independence requirements as stipulated by Finnish lawand the rules of Nasdaq Helsinki and the NYSE. From May 27, 2020 the Personnel Committee has consisted of the following four members of the Board:Bruce Brown (Chair), Elizabeth Nelson, Søren Skou and Kari Stadigh.
The Committee has overall responsibility for evaluating, resolving and making recommendations to the Board regarding:
◾compensation of the company’s top executives and their terms of employment;
◾all equity-based plans;
◾incentive compensation plans, policies and programs of the company affecting executives; and
◾other significant incentive plans.

Table of Contents
46
The Committee is responsible for overseeing compensation philosophy and principles and ensuring the Company’s compensation programs areperformance-based, and designed to contribute to long-term shareholder value creation and alignment to shareholders’ interests, properly motivatemanagement, and support overall corporate strategies.
The Technology CommitteeThe Committee consists of a minimum of three members of the Board who meet applicable independence requirements as stipulated by Finnish law andthe rules of Nasdaq Helsinki and the NYSE and have such skills in innovation, technology and science matters as the Board determines adequate fromtime to time. From May 27, 2020 the Technology Committee has consisted of the following five members of the Board: Edward Kozel (Chair), Sari Baldauf,Bruce Brown, Thomas Dannenfeldt and Jeanette Horan.
In its dialogue with and provision of opinions and advice to the management, the Committee will periodically review:
◾the company’s approach to major technological innovations;
◾key technology trends that may result in disruptive threats or opportunities;
◾high-level risks and opportunities associated with the company’s Research and Development Programs; and
◾the company’s technological competitiveness and new strategic technology initiatives.
Group Leadership Team and the President and CEOWe have a Group Leadership Team that is responsible for the operative management of Nokia. The Board appoints the Chair of the Group Leadershipteam. The Group Leadership Team is chaired by the President and CEO. The President and CEO’s rights and responsibilities include those allotted to thePresident under Finnish law.
On December 31, 2020, the Group Leadership Team consisted of 17 members representing nine different nationalities and 24% of the members werefemale. On October 29, 2020, we announced changes to our operating model and resulting appointments to the Group Leadership Team taking effect onJanuary 1, 2021. At present, our Group Leadership Team consists of 10 members, including the President and CEO, representing seven differentnationalities and 20% of the members are female.
Name Position Gender Year of birth NationalityOn GLT since
On GLT onJanuary 1, 2021
Pekka Lundmark President and CEO Male 1963 Finnish 2020 YesNassib Abou-Khalil Chief Legal Officer Male 1972 Dutch 2019 YesBasil Alwan Co-president of IP/Optical Networks Male 1962 American 2016 -Nishant Batra Chief Strategy and Technology Officer Male 1978 Indian 2021 -Ricky Corker President of Customer Operations, Americas(1) Male 1967 Australian 2019 YesBarry French Chief Marketing Officer Male 1963 American 2016 -Sanjay Goel President of Global Services Male 1967 Indian 2018 -Bhaskar Gorti President of Nokia Software Male 1966 American 2016 -Federico Guillén President of Customer Operations Officer, EMEA & APAC(2) Male 1963 Spanish 2016 YesJenni Lukander President of Nokia Technologies Female 1974 Finnish 2019 YesSandra Motley President of Fixed Networks Female 1959 American 2019 -Sri Reddy Co-president of IP/Optical Networks Male 1964 American 2018 -Raghav Sahgal President of Nokia Enterprise(3) Male 1962 American 2020 YesGabriela Styf Sjӧman Chief Strategy Officer Female 1969 Swedish 2019 -Tommi Uitto President of Mobile Networks Male 1969 Finnish 2019 YesMarcus Weldon Chief Technology Officer and President of Bell Labs Male 1968 British 2017 -Stephanie Werner-Dietz Chief Human Resources Officer Female 1972 German 2020 YesMarco Wirén Chief Financial Officer Male 1966 Finnish 2020 Yes
(1) As of January 1, 2021 Chief Customer Experience Officer.(2) As of January 1, 2021 President of Network Infrastructure.(3) As of January 1, 2021 President of Cloud and Networks Services.
Biographical details of the current members of the Nokia Group Leadership Team
Pekka Lundmarkb. 1963President and Chief Executive Officer of Nokia Corporation as of August 1, 2020.
Master of Science, Department of Technical Physics, Helsinki University of Technology, Finland.
President and CEO, Fortum Corporation 2015-2020. President and CEO, Konecranes Plc 2005–2015 and Group Executive Vice President 2004–2005.President and CEO, Hackman Oyj Abp 2002–2004. Managing Partner, Startupfactory 2000–2002. Various executive positions at Nokia 1990–2000.
Commissioner, Broadband Commission for Sustainable Development. Member of the Board, Climate Leadership Council. Member of the Board, Research Institute of the Finnish Economy (ETLA) and Finnish Business and Policy Forum (EVA). International Member of the Academy, Royal Swedish Academy of Engineering Sciences (IVA). Member of the Board, Finnish Athletics Federation.
Chairman of the Board, Confederation of Finnish Industries, 2019–2020. Member of the Board, East Office of Finnish Industries, 2009–2020. Chairman ofthe Board, Finnish Energy, 2016–2018.
Table of Contents
47
Nassib Abou-Khalilb. 1972Chief Legal Officer (CLO). Group Leadership Team member since 2019. Joined Nokia in 2014.
Bachelor of Arts (Political Sciences), Civil Law (LL.L.), Common Law (LL.B.) and Master of Law (LL.M), University of Ottawa, Canada.
Deputy Chief Legal Officer, Business, Nokia 2019. General Counsel, Customer Operations, Nokia 2016–2019. Head of Legal & compliance, MEA, Nokia 2014–2015. Head of Public Policy, Europe, Middle East & Africa, and General Counsel, Middle East & Africa, Yahoo!, 2010–2014. Regional Counsel, Middle East & Africa and India, GE Oil & Gas, 2007–2010. Regulatory Counsel, Etisalat, 2006–2007. Various legal counsel roles, TMF Netherlands 2002–2006. Legal articling, Fasken Martineau 1999–2001.
Nishant Batrab. 1978Chief Strategy and Technology Officer (CSTO). Group Leadership Team member since 2021. Joined Nokia in 2021.
MBA from INSEAD. Master’s degree in Telecommunications and a master’s degree in Computer Science, Southern Methodist University, Dallas, USBachelor’s degree in Computer Applications, Devi Ahilya University, India.
Previously Executive Vice President and Chief Technology Officer, Veoneer, Inc. 2018-2021. Prior to Veoneer Inc. held several senior positions at Ericssonfor 12 years in the US, Sweden and India.
Independent member of the Board of Directors, Sensys Gatso Group.
Ricky Corkerb. 1967Chief Customer Experience Officer (CCXO). Group Leadership Team member since 2019. Joined Nokia in 1993.
Bachelor in Communications and Electronic Engineering from the Royal Melbourne Institute of Technology, Australia.
President of Customer Operations, Americas, Nokia, 2019–2020. Executive Vice President and President of North America, Nokia, 2011–2018. Head ofAsia Pacific, Nokia Siemens Networks, 2009–2011. Head of Asia North Region, Nokia Siemens Networks, 2008–2009. Head of Hutchison GlobalCustomer Business Team, Nokia Siemens Networks, 2007–2008. Vice President Asia Pacific, Nokia Networks, 2005–2007. Lead Sales Director AsiaPacific, Nokia Networks, 2004–2005. Account Director Telstra, Nokia Networks, 2002–2003. Account Director Vodafone Australia and New Zealand, andSales Director Vodafone Asia Pacific Customer Business Team, Nokia Networks, 2001–2002. Commercial Director Global Accounts British Telecom,Nokia Networks, 2001. Senior sales and marketing positions at Nokia, 1993–2001.
Federico Guillénb. 1963President of Network Infrastructure. Group Leadership Team member since 2016. Joined Nokia in 2016.
Degree in Telecommunications Engineering, ETSIT at Universidad Politécnica de Madrid, Spain. Master’s degree in Switching & CommunicationArchitectures, ETSIT at Universidad Politécnica de Madrid, Spain. Master’s Degree in International Management, ESC Lyon and Alcatel, France.
President of Customer Operations, Europe, Middle East & Africa and Asia Pacific, Nokia, 2018–2020. President of Fixed Networks, Nokia, 2016–2018.President of Fixed Networks, Alcatel-Lucent, 2013–2016. President and Chief Senior Officer of Alcatel-Lucent Spain and Global Account ManagerTelefónica, Alcatel-Lucent, 2009–2013. Vice President Sales of Vertical Market Sales in Western Europe, Alcatel-Lucent, 2009. Head of Regional SupportCenter, Fixed Access Division for South Europe, Middle East & Africa, India and Caribbean & Latin America, Alcatel-Lucent, 2007–2009. President andChief Senior Officer, Alcatel Mexico and Global Account Manager, Telmex, 2003–2007. Various R&D, portfolio and sales management positions withTelettra in Spain, and then with Alcatel in Spain, Belgium and the United States 1989–2003.
Jenni Lukanderb. 1974President of Nokia Technologies. Group Leadership Team member since 2019. Joined Nokia in 2007.
Master of Laws, University of Helsinki, Finland.
Senior Vice President, Head of Patent Business, Nokia 2018–2019. Vice President, Head of Patent Licensing, Nokia 2018. Vice President, Head ofLitigation and Competition Law, Nokia 2016–2018. Director, Head of Regulatory and Competition Law, Nokia 2015–2016. Director, Head of CompetitionLaw, Nokia 2011–2015. Senior Legal Counsel, Nokia 2007–2011. Visiting lawyer, Nokia, 2001. Lawyer, Roschier Ltd. 1999–2007.
Raghav Sahgalb. 1962President of Cloud and Network Services. Group Leadership Team member since 2020. Joined Nokia in 2017.
Master of Science in Computer Systems Management, University of Maryland, United States. Bachelor of Science in Computer Engineering, TulaneUniversity, New Orleans, United States. Executive Business Certificate in General Management, Harvard University, United States.
President of Nokia Enterprise, 2020. Senior Vice President, Nokia Software, 2017–2020. President, NICE Ltd. Asia Pacific and the Middle East, 2010–2017. Advisory Board Member, Orga Systems, 2010–2014. Vice President, Communications Business Unit, Asia Pacific & Japan, Oracle, 2008–2010.Chief Business Officer, Comverse, 2005–2006. Executive Vice President, Asia Pacific, CSG, 2002–2005. Vice President, Software Products Group AsiaPacific, Lucent Technologies, 2000–2002.
Tommi Uittob. 1969President of Mobile Networks. Group Leadership Team member since 2019. Joined Nokia in 1996.
Master’s degree in industrial management, Helsinki University of Technology, Finland. Master’s degree in operations management, Michigan TechnologicalUniversity, the United States.
Senior Vice President, Global Product Sales, Mobile Networks, Nokia 2016–2018. Senior Vice President, Global Mobile Broadband Sales, CustomerOperations, Nokia Networks, 2015–2016. Senior Vice President, West Europe, Customer Operations, Nokia Networks, 2013–2015. Head of Radio Cluster(Senior Vice President), Mobile Broadband, Nokia Siemens Networks, 2012–2013. Head of Global LTE Radio Access Business Line (Vice President) andQuality, Mobile Broadband, Nokia Siemens Networks, 2011–2012. Head of Product Management, Network

Table of Contents
48
Systems, Nokia Siemens Networks, 2010. Head of Product Management, Radio Access, Nokia Siemens Networks, 2009. Head of WCDMA/HSPA andRadio Platforms Product Management, Nokia Siemens Networks, 2008. Head of WCDMA/HSPA Product Line Management, Nokia Siemens Networks,2007. General Manager, Radio Controller Product Management, Nokia Networks, 2005–2007. Director, Sales & Marketing (Lead Sales Director), FranceTelecom/Orange Nokia Networks, 2002–2005. Operations Director, Northeast Europe, Central & Eastern Europe and Middle East, Nokia Networks, 1999–2002.
Stephanie Werner-Dietzb. 1972Chief People Officer (CPO). Group Leadership Team member since 2020. Joined Nokia in 1998.
Diploma in Applied business languages (Chinese) and International business studies, University of Applied Sciences, Bremen, Germany.
Vice President, Global HR Center of Expertise, Nokia, 2018–2019. Vice President, Business HR Head for Nokia Corporate Functions, Nokia, 2016–2018.Head of Business HR for Chief Finance and Operations Officer/Organization, Nokia, 2012–2015. Head of Nokia Siemens Networks Business Talent,Leadership & Organization Development, Nokia Siemens Networks, 2011–2012. Head of Business HR, Nokia Radio Access, 2007–2011. Head of HREmerging Markets, Romania, Nokia, 2007. Senior HR Manager, Strategic Projects, US, Nokia, 2004–2006. HR Manager Global Platforms, Nokia, 2001–2004. HR Country Manager for the Philippines, Nokia, 1999–2001. HR Manager, Nokia Networks for Switzerland, Nokia, 1998–1999.
Marco Wirénb. 1966
Chief Financial Officer (CFO). Group Leadership Team member since 2020. Joined Nokia in 2020.
Master’s degree in Business Administration, University of Uppsala. Studies in management and strategic leadership, including at Duke Business School,IMD, and Stockholm School of Economics.
President, Wärtsilä Energy and Executive Vice President, Wärtsilä Group, 2018–2020. Executive Vice President and CFO, Wärtsilä Group, 2013–2018. Executive Vice President and CFO, SSAB Group, 2008–2013. Vice President, Business Control, SSAB Group, 2007–2008. CFO, Eltel Networks, 2006–2007. Vice President of Business development, Eltel Networks, 2004–2005. Head of Service Division, Eltel Networks, 2003–2004. Vice President, Corporate Development, Eltel Networks, 2002–2003. Vice President, Strategy & Business Development, NCC Group, 1999–2002. Head of Strategic Planning, NCC Group, 1998–1999. Group Controller, NCC Group, 1996–1998.
Vice Chair of the Board of Directors and Chair of the Audit Committee, Neste Corporation.
Summary of changes in the Group Leadership Team in 2020 and thereafterDuring 2020 and thereafter, the following new appointments were made to the Group Leadership Team:
◾Stephanie Werner-Dietz, Chief Human Resources Officer, as of January 1, 2020;
◾Raghav Sahgal, President of Nokia Enterprise, as of June 1, 2020;
◾Pekka Lundmark, President and CEO and Chair of the Group Leadership Team, as of August 1, 2020;
◾Marco Wirén, Chief Financial Officer, as of September 1, 2020;
◾Nishant Batra, Chief Strategy and Technology Officer, as of January 18, 2021.
During 2020, the following members of the Group Leadership Team stepped down from the Group Leadership Team:
◾Kathrin Buvac, President of Nokia Enterprise, as of May 31, 2020;
◾Rajeev Suri, President and CEO and the Chair of the Group Leadership Team, as of July 31, 2020;
◾Kristian Pullola, Chief Financial Officer, as of August 31, 2020;
◾Basil Alwan, Co-president of IP/Optical Networks, as of December 31, 2020;
◾Barry French, Chief Marketing Officer, as of December 31, 2020;
◾Sanjay Goel, President of Global Services, as of December 31, 2020;
◾Bhaskar Gorti, President of Nokia Software, as of December 31, 2020;
◾Sandra Motley, President of Fixed Networks, as of December 31, 2020;
◾Sri Reddy, Co-president of IP/Optical Networks, as of December 31, 2020;
◾Gabriela Styf Sjӧman, Chief Strategy Officer, as of December 31, 2020; and
◾Marcus Weldon, Chief Technology Officer and President of Bell Labs, as of December 31, 2020.
Furthermore, the following changes took place within the Group Leadership Team:
◾Ricky Corker, President of Customer Operations, Americas, was appointed Chief Customer Experience Officer as of January 1, 2021;
◾Federico Guillén, President of Customer Operations, EMEA & APAC, was appointed President of Network Infrastructure as of January 1, 2021; and
◾Raghav Sahgal, President of Nokia Enterprise, was appointed President of Cloud and Network Services as of January 1, 2021.
Table of Contents
49
Risk management, internal control and internal audit functions at NokiaMain features of risk management systemsWe have a systematic and structured approach to risk management. Key risks and opportunities are primarily identified against business targets either inbusiness operations or as an integral part of strategy and financial planning. Risk management covers strategic, operational, financial, compliance andhazard risks. Key risks and opportunities are analyzed, managed and monitored as part of business performance management with the support of riskmanagement personnel and the centralized Enterprise Risk Management function.
The principles documented in the Nokia Enterprise Risk Management Policy, which is approved by the Audit Committee of the Board, require riskmanagement and its elements to be integrated into key processes. One of the core principles is that the business or function head is also the risk owner,although all employees are responsible for identifying, analyzing and managing risks, as appropriate, given their roles and duties. Our overall riskmanagement concept is based on managing the key risks that would prevent us from meeting our objectives, rather than solely focusing on eliminatingrisks. In addition to the principles defined in the Nokia Enterprise Risk Management Policy, other key policies reflect implementation of specific aspects ofrisk management.
Key risks and opportunities are reviewed by the Group Leadership Team and the Board in order to create visibility on business risks as well as to enableprioritization of risk management activities. Overseeing risk is an integral part of the Board’s deliberations. The Board’s Audit Committee is responsible for,among other matters, risk management relating to the financial reporting process and assisting the Board’s oversight of the risk management function. TheBoard’s role in overseeing risk includes risk analysis and assessment in connection with financial, strategy and business reviews, updates and decision-making proposals.
Description of internal control procedures in relation to the financial reporting processThe management is responsible for establishing and maintaining adequate internal control over financial reporting for Nokia. Our internal control overfinancial reporting is designed to provide reasonable assurance to the management and the Board regarding the reliability of financial reporting and thepreparation and fair presentation of published financial statements.
The management conducts a yearly assessment of Nokia’s internal controls over financial reporting in accordance with the Committee of SponsoringOrganizations framework (the “COSO framework”, 2013) and the Control Objectives for Information and Related Technology (COBIT) framework ofinternal controls. The assessment is performed based on a top-down risk assessment of our financial statements covering significant accounts, processesand locations, corporate-level controls and information systems’ general controls.
As part of its assessment, the management has documented:
◾the corporate-level controls, which create the “tone from the top” containing the Nokia values and Code of Conduct and which provide discipline andstructure to decision-making processes and ways of working. Selected items from our operational mode and governance principles are separatelydocumented as corporate-level controls;
◾the significant processes: (i) give a complete end-to-end view of all financial processes; (ii) identify key control points; (iii) identify involvedorganizations; (iv) ensure coverage for important accounts and financial statement assertions; and (v) enable internal control management within Nokia;
◾the control activities, which consist of policies and procedures to ensure the management’s directives are carried out and the related documentation isstored according to our document retention practices and local statutory requirements; and
◾the information systems’ general controls to ensure that sufficient IT general controls, including change management, system development andcomputer operations, as well as access and authorizations, are in place.
Further, the management has also:
◾assessed the design of the controls in place aimed at mitigating the financial reporting risks;
◾tested operating effectiveness of all key controls; and
◾evaluated all noted deficiencies in internal controls over financial reporting in the interim and as of year-end.
In 2020, Nokia has followed the procedures as described above and has reported on the progress and assessments to the management and to the AuditCommittee of the Board on a quarterly basis.
Description of the organization of the internal audit functionWe also have an internal audit function that acts as an independent appraisal function by examining and evaluating the adequacy and effectiveness of oursystem of internal control. Internal audit reports to the Audit Committee of the Board. The head of the internal audit function has direct access to the AuditCommittee, without involvement of the management. The internal audit staffing levels and annual budget are approved by the Audit Committee. Allauthority of the internal audit function is derived from the Board. The internal audit aligns to the business regionally and by business and function.
Annually, an internal audit plan is developed with input from the management, including key business risks and external factors. This plan is approved bythe Audit Committee. Audits are completed across the business focused on site level, customer level, business project level, IT system implementation, ITsecurity, operations activities or at a Group function level. The results of each audit are reported to the management identifying issues, financial impact, ifany, and the correcting actions to be completed. Quarterly, the internal audit function communicates the progress of the internal audit plan completion,including the results of the closed audits, to the Audit Committee.
Internal audit also works closely with our Ethics and Compliance office to review any financial concerns brought to light from various channels and, whererelevant, works with Enterprise Risk Management to ensure priority risk areas are reviewed through audits.
In 2020, the internal audit plan was completed and all results of these reviews were reported to the management and to the Audit Committee.
Related party transactionsWe determine and monitor related parties in accordance with the International Accounting Standards (IAS 24) and other applicable regulations. We maintain information of our related parties as well as monitor and assess related party transactions. As a main principle, all transactions are conducted at arm’s-length and are considered to be part of the ordinary course of business. In an exceptional case where these principles would be deviated from, the company would set up a separate process to determine related parties and seek relevant approvals in accordance with internal guidelines and applicable regulations.

Table of Contents
50
Main procedures relating to insider administrationOur insider administration is organized according to the applicable European Union and Finnish laws and regulations. In addition, the Board of Directorshas approved the Nokia Insider Policy, which sets out Nokia-wide rules and practices to ensure full compliance with applicable rules and that insideinformation is recognized and treated in an appropriate manner and with the highest integrity. The Nokia Insider Policy is applicable to all directors,executives and employees of the company.
Persons discharging managerial responsibilitiesNokia has identified members of the Board of Directors and the Group Leadership Team as persons discharging managerial responsibilities who, alongwith persons closely associated with them, are required to notify Nokia and the Finnish Financial Supervisory Authority of their transactions with Nokia’sfinancial instruments. Nokia publishes the transaction notifications.
In addition, under the Nokia Insider Policy, persons discharging managerial responsibilities are obligated to clear with the Deputy Chief Legal Officer,Corporate, a planned transaction in Nokia’s financial instruments in advance. It is also recommended that trading and other transactions in Nokia’sfinancial instruments are carried out in times when the information available to the market is as complete as possible.
Closed windowPersons discharging managerial responsibilities are subject to a closed window period of 30 calendar days preceding the disclosure of Nokia’s quarterly orannual result announcements, as well as the day of the disclosure. During the closed window period, persons discharging managerial responsibilities areprohibited from dealing in Nokia’s financial instruments.
Nokia has imposed this closed window period also on separately designated financial reporting persons who are recurrently involved with the preparationof Nokia’s quarterly and annual results announcements. These persons are separately notified of their status as designated financial reporting persons.
Insider registersNokia does not maintain a permanent insider register. Insiders are identified on a case-by-case basis for specific projects and are notified of their insiderstatus. Persons included in a project-specific insider register are prohibited from dealing in Nokia’s financial instruments until the project ends or is madepublic.
SupervisionOur insider administration’s responsibilities include internal communications related to insider matters and trading restrictions, setting up and maintainingour insider registers, arranging related trainings as well as organizing and overseeing compliance with the insider rules.
Violations of the Nokia Insider Policy must be reported to the Deputy Chief Legal Officer, Corporate. Nokia employees may also use channels stated in theNokia Code of Conduct for reporting incidents involving alleged violations of the Nokia Insider Policy.
Share ownership of the Board of Directors and the Nokia Group Leadership TeamThe following table sets forth the number of shares and American Depositary Shares (ADS) held by the members of the Board at December 31, 2020 when they held a total of 1 033 100 shares and ADSs in Nokia, which represented approximately 0.02% of our total shares and voting rights excluding shares held by Nokia Group.
Name Shares(1) ADSs(1)
Sari Baldauf (Board Chair) 163 220Kari Stadigh (Board Vice Chair) 308 190Bruce Brown 165 788Thomas Dannenfeldt 30 299Jeanette Horan 60 630Edward Kozel 86 698Elizabeth Nelson 107 860Søren Skou 31 707Carla Smits-Nusteling 78 708
(1) The number of shares or ADSs includes shares and ADSs received as director compensation as well as shares and ADSs acquired through other means. Stock options or other equity awards that aredeemed as being beneficially owned under the applicable SEC rules are not included.

Table of Contents
51
The following table sets forth the number of shares and ADSs held by the President and CEO and the other members of the Group Leadership Team inoffice at December 31, 2020 when they held a total of 3 446 939 shares and ADSs in Nokia, which represented approximately 0.06% of our total sharesand voting rights excluding shares held by Nokia Group.
Name Position in 2020 Shares(1) ADSs(1)
Pekka Lundmark President and CEO 788 850 Nassib Abou-Khalil Chief Legal Officer 40 204 Basil Alwan Co-president of IP/Optical Networks 206 333 81 000Ricky Corker President of Customer Operations, Americas 193 021 Barry French Chief Marketing Officer 319 006Sanjay Goel President of Global Services 130 784 Bhaskar Gorti President of Nokia Software 472 273Federico Guillén President of Customer Operations Officer, EMEA & APAC 214 201Jenni Lukander President of Nokia Technologies 9 767Sandra Motley President of Fixed Networks 23 092 Sri Reddy Co-president of IP/Optical Networks 398 814 100 000Raghav Sahgal President of Nokia Enterprise 245 357 Gabriela Styf Sjӧman Chief Strategy Officer 4 000Tommi Uitto President of Mobile Networks 47 451 Marcus Weldon Chief Technology Officer and President of Bell Labs 77 482Stephanie Werner-Dietz Chief Human Resources Officer 17 304Marco Wirén Chief Financial Officer 78 000
(1) The number of shares or ADSs includes shares and ADSs received as compensation as well as shares and ADSs acquired through other means. Stock options or other equity awards that are deemedas being beneficially owned under the applicable SEC rules are not included.
Auditor fees and servicesDeloitte Oy served as our auditor for the period ending December 31, 2020 and PricewaterhouseCoopers Oy for the period from January 1 to December31, 2019. The auditor is elected annually by our shareholders at the Annual General Meeting for the financial year commencing next after the election. TheAudit Committee of the Board prepares the proposal to the shareholders in respect of the appointment of the auditor based upon its evaluation of thequalifications and independence of the auditor to be proposed for election or re-election on an annual basis.
The following table presents fees by type paid to Deloitte’s (2020) and PricewaterhouseCoopers’ (2019) network of firms for the years ended December31:
EURm 2020 2019
Audit fees(1) 22.3 22.7Audit-related fees(2) 0.4 1.2Tax fees(3) 0.6 1.9All other fees(4) 1.6 –Total 24.9 25.8
(1) Audit fees consist of fees incurred for the annual audit of the Group’s consolidated financial statements and the statutory financial statements of the Group’s subsidiaries.(2) Audit-related fees consist of fees billed for assurance and related services that are reasonably related to the performance of the audit or review of the Group’s financial statements or that are traditionally
performed by the independent auditor, and include consultations concerning financial accounting and reporting standards; advice and assistance in connection with local statutory accountingrequirements; due diligence related to mergers and acquisitions; and audit procedures in connection with investigations in the pre-litigation phase and compliance programs. They also include fees billedfor other audit services, which are those services that only the independent auditor can reasonably provide, and include the provision of comfort letters and consents in connection with statutory andregulatory filings and the review of documents filed with the SEC and other capital markets or local financial reporting regulatory bodies.
(3) Tax fees include fees billed for: (i) services related to tax compliance including preparation and/or review of tax returns, preparation, review and/or filing of various certificates and forms and consultationregarding tax returns and assistance with revenue authority queries; compliance reviews, advice and assistance on other indirect taxes; and transaction cost analysis; (ii) service related to tax audits; (iii)services related to individual compliance (preparation of individual tax returns and registrations for employees (non-executives), assistance with applying visa, residency, work permits and tax status forexpatriates); (iv) services related to technical guidance on tax matters; (v) services related to transfer pricing advice and assistance with tax clearances; and (vi) tax consultation and planning (advice onstock-based remuneration, local employer tax laws, social security laws, employment laws and compensation programs and tax implications on short-term international transfers).
(4) Other fees include fees billed for company establishments; liquidations; forensic accounting, data security, other consulting services and reference materials and services.
Auditor rotationThe Board of Directors is responsible for proposing the external auditor for election by the shareholders, upon recommendation from the Audit Committeeof the Board of Directors. Under applicable auditor rotation rules, Nokia needed to change auditors no later than during the financial year 2020.Accordingly, PricewaterhouseCoopers Oy declined to stand for re-election for the financial year 2020. Therefore in 2018, Nokia initiated a tenderingprocess, overseen by the Audit Committee, for appointment of Nokia Corporation’s auditor for the financial year 2020. To give the elected auditor time toprepare for the new audit engagement, the Board of Directors decided to propose the appointment of auditor for the financial year 2020 already at the2019 Annual General Meeting of shareholders. Based on the recommendation of the Audit Committee, the Board of Directors proposed to the AGM thatDeloitte Oy be elected as the company’s auditor for the financial year 2020. On May 21, 2019, the AGM resolved to appoint PwC as auditors of NokiaCorporation for the financial year 2019 and Deloitte Oy for the financial year 2020.
Table of Contents
52
CompensationThis section sets out our remuneration governance, policies and how they have been implemented within Nokiaand includes our Remuneration Report where we provide disclosure of the compensation of our Board membersand the President and CEO for 2020.
The content of the Remuneration Report, which will be presented to an advisory vote at the 2021 AnnualGeneral Meeting, is clearly indicated below and also exists as a standalone version published on a stockexchange release. Other compensation-related information provided before and after the Remuneration Reportfor 2020 is not subject to a vote at the 2021 Annual General Meeting, but provides further information on thecompensation policies applied within Nokia as well as on the compensation of the rest of the Group LeadershipTeam.
We report information applicable to executive compensation in accordance with Finnish regulatory requirementsand with requirements set forth by the U.S. Securities and Exchange Commission that are applicable to us.
Highlights◾2020 was a year of significant change with the Chair of the Board of Directors, President and CEO, and Chief Financial Officer all changing. This was
then followed by a restructure of the Group Leadership Team, effective January 1, 2021.
◾Mr. Lundmark joined Nokia as President and CEO on the same target compensation arrangement as his predecessor.
◾Mr. Lundmark purchased EUR 2.6 million of shares in the market prior to joining the company, of which the majority were eligible for the agreed co-invest based long-term incentive arrangement available to him on joining. Mr. Lundmark’s interests and the interests of Nokia’s shareholders areintended to be fully aligned through such ownership.
◾Business performance for 2020 was mixed, with free cash flow exceeding target, but profit and revenue falling short of the incentive targets. This wasreflected in Mr. Lundmark’s short-term incentive, which was at 84% of target, pro-rated for his time in role.
◾Our pay policies and practices continue to ensure that there is no gender pay gap in Nokia.
Word from the Chair of the Personnel Committee of the BoardDear Fellow Shareholder,
2020 has been a year of significant change and challenges. Shortly after the appointment of Mr. Pekka Lundmark as President and CEO, the world sawsignificant levels of disruption with the arrival of COVID-19. All Nokia employees are to be commended for the important role they played in keeping ouroperations going in a safe manner, and working with our customers to ensure critical performance of networks around the world to support the majorchanges in how people lived and worked. I also want to recognize and thank our former President and CEO, Rajeev Suri, for his continued commitmentthrough 2020 as he supported Pekka Lundmark in taking over the leadership of the company and engaging with our largest customers and stakeholdersduring this period of transition.
On the regulatory front, I am pleased to report that shareholders supported Nokia’s Remuneration Policy with 86% of the votes in favor of the proposedpolicy. The policy will remain in place for four years and we will report each year on the outcomes of the policy in our Remuneration Report, where ourshareholders will be asked to vote in support of the compensation paid. The Remuneration Report, and all elements of the compensation delivered in2020, are fully consistent with the approved policy.
Business contextWhile 2020 was a challenging year for Nokia with the significant leadership changes, and global disruption caused by the COVID-19 pandemic, Nokia’semployees delivered for our customers when it counted most, ensuring that they had the equipment and services to operate networks around the world.This was achieved despite disruption in supply chains and restrictions in movement in many of our markets. As a result, we saw our operating profit in linewith guidance, while below the incentive target, and free cash flow being positive at EUR 1 356 million. This is reflected in the outcome of our incentivearrangements.
Strategy and compensationAt the core of Nokia’s philosophy lie two principles:
◾pay for performance and aligning the interests of employees with shareholders; and
◾ensuring that compensation programs and policies support the delivery of the corporate strategy and create long-term sustainable shareholder value.
For 2021, which will be a year of transition with the announced organization and strategy changes, we have taken the decision to simplify our annual short-term incentive plan (STI plan) and to focus the annual incentive on operating profit (70%), a strategic objective (20%), along with an environment, socialand governance (ESG) related metric (10%). While we have always believed that ESG is core to how we run our business and our role in society, 2020has demonstrated clearly the importance of our role in society and the Personnel Committee decided that it would now be appropriate to formalize this aspart of our incentive structure.
Shareholder outreachHaving met with many of our shareholders throughout 2018 and 2019 to get their input on our compensation policies and programs, we had a more limitedoutreach in 2020. One comment we did hear in 2020 was to formally incent ESG as part of our incentive framework. In addition, we were pleased with thesupport our shareholders demonstrated with the support to our Remuneration Policy in the 2020 Annual General Meeting.
Table of Contents
53
New CEO compensationPekka Lundmark’s base salary and target incentives are at the same level as his predecessor.
◾Mr. Lundmark received his base compensation for the period from August 1, 2020 to the end of the financial year together with a pro rata bonus for thelast five months of 2020, based on the performance of the company. His bonus for 2020 totaled EUR 573 068.
In addition, Mr. Lundmark received an award of EUR 1.3 million of restricted shares on joining to buy out the awards he forfeited on leaving his previousemployer. Mr. Lundmark was invited to join the co-investment based long-term incentive arrangement (eLTI) targeted to engage senior leaders with thelong-term nature of our business and share price, and purchased EUR 2.6 million of Nokia shares against which he was given a matching award of EUR5.2 million of Nokia 2020 performance shares. This investment by Mr. Lundmark aligns him with shareholders from the start and is a sign of hiscommitment and engagement with the company. Delivery of actual Nokia shares would take place in 2023 subject to performance conditions.
Former CEO compensationMr. Suri continued to lead Nokia until July 31, 2020 and remained employed during 2020 to support the transition of leadership and relationships with ourkey customers and stakeholders, remaining active with our customers and helping us close contracts with them up to and after stepping down asPresident and CEO. His leadership was critical during the disruptions caused by COVID-19.
◾Mr. Suri received his base salary and incentives throughout 2020. The balance of his notice period was paid out in cash in accordance with his contractand his annual incentive and benefits were similarly handled in accordance with the rules of the incentive plan and his contract. Facing a period of up tosix months before Mr. Lundmark would be able to join, and an increasingly uncertain global economy due to COVID-19, retaining Mr. Suri’s ongoingcommitment was essential to ensure stability of the company until Mr. Lundmark was able to join.
Mr. Suri received a payment of EUR 2 028 666 on departure in accordance with amounts due under his contract.
2020 remuneration outcomesIn a year of challenge and change, our incentive plan payments reflect the performance of the company. The structure of the President and CEO’s compensation arrangements, with the emphasis on results based variable pay, and the 2020 above-target free cash flow achievement and the below-target revenue and profit achievement, have led to an overall payment of 84% of target short-term incentive for Mr. Lundmark as President and CEO.
2020 was also the year in which Mr. Suri’s 2018 long-term award vested. The outcome of this, at 56.82% of target vesting, is reflective of the performanceachievement during the period.
Share ownership requirementThe President and CEO is required to own three times his base salary in Nokia. Mr. Lundmark starts his tenure with Nokia with a significant purchase ofEUR 2.6 million of shares under the eLTI co-investment arrangement under which he was given a matching award of EUR 5.2 million of Nokia 2020performance shares. He also received an award of EUR 1.3 million of Nokia 2020 restricted shares to buy out awards forfeited on leaving his formeremployer.
Short and long-term incentives in 2021Our 2021 incentive plans follow this structure:
Delivering sustainable value – Long-term incentive
Absolute Total Shareholder Return 100%
Focus on increase in share price and restoration of the dividend
Delivering the next year’s step in the strategic plan – Short-term incentive
Operating profit 70% Strategic objective 20% Environmental, social and governance aspects (ESG)10%
Deliver operating profit Deliver meaningful strategic actions Deliver on our responsibilities to reduce carbonemissions and become a more diverse employer
The 2021 long-term incentive is based on performance over the life of the three-year plan from the date of the award. The metric is absolute totalshareholder return. By using this metric, we will incentivize executives to deliver the desired business results and support the restoration of the dividendand the transparency for participants to see how the plan is performing.
In summary, we believe that our compensation policies have facilitated an orderly transition in leadership in an exceptionally disrupted year and that thepolicy and plans set the company up well to support the strategy announced by Mr. Lundmark in October 2020.
In the Remuneration Report, we also show a comparison of the development of compensation for the Board members and the President and CEO, againstaverage employee remuneration and Nokia’s financial development over the last five years. The comparison shows a clear link between President andCEO pay and company performance, with President and CEO realized pay falling nearly 8% between 2019 and 2020 in line with company performance.We will continue to monitor this alignment.
Bruce Brown, Chair of the Personnel Committee
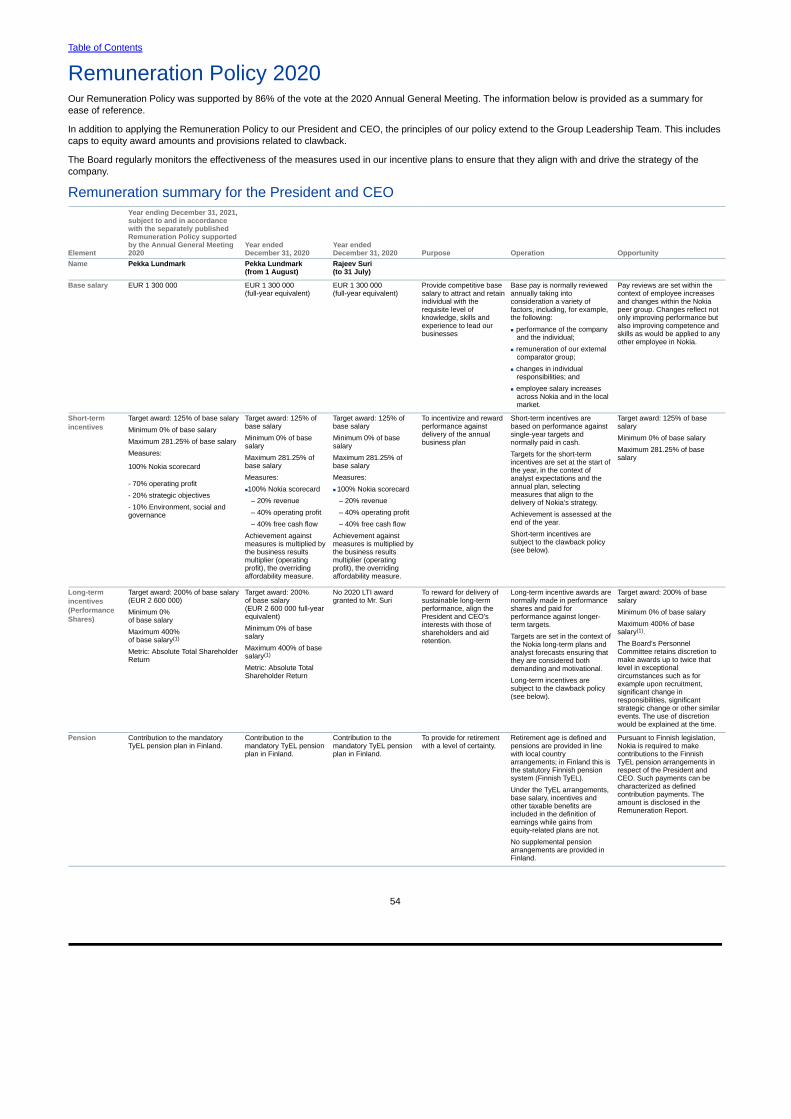
Table of Contents
54
Remuneration Policy 2020Our Remuneration Policy was supported by 86% of the vote at the 2020 Annual General Meeting. The information below is provided as a summary forease of reference.
In addition to applying the Remuneration Policy to our President and CEO, the principles of our policy extend to the Group Leadership Team. This includescaps to equity award amounts and provisions related to clawback.
The Board regularly monitors the effectiveness of the measures used in our incentive plans to ensure that they align with and drive the strategy of thecompany.
Remuneration summary for the President and CEO
Element
Year ending December 31, 2021,subject to and in accordancewith the separately publishedRemuneration Policy supportedby the Annual General Meeting2020
Year ended December 31, 2020
Year ended December 31, 2020 Purpose Operation Opportunity
Name Pekka Lundmark Pekka Lundmark (from 1 August)
Rajeev Suri (to 31 July)
Base salary EUR 1 300 000 EUR 1 300 000 (full-year equivalent)
EUR 1 300 000 (full-year equivalent)
Provide competitive basesalary to attract and retainindividual with therequisite level ofknowledge, skills andexperience to lead ourbusinesses
Base pay is normally reviewedannually taking intoconsideration a variety offactors, including, for example,the following:
■ performance of the companyand the individual;
■ remuneration of our externalcomparator group;
■ changes in individualresponsibilities; and
■ employee salary increasesacross Nokia and in the localmarket.
Pay reviews are set within thecontext of employee increasesand changes within the Nokiapeer group. Changes reflect notonly improving performance butalso improving competence andskills as would be applied to anyother employee in Nokia.
Short-termincentives
Target award: 125% of base salary
Minimum 0% of base salary
Maximum 281.25% of base salary
Measures:
100% Nokia scorecard
- 70% operating profit
- 20% strategic objectives
- 10% Environment, social andgovernance
Target award: 125% ofbase salary
Minimum 0% of basesalary
Maximum 281.25% ofbase salary
Measures:
■100% Nokia scorecard
– 20% revenue
– 40% operating profit
– 40% free cash flow
Achievement againstmeasures is multiplied bythe business resultsmultiplier (operatingprofit), the overridingaffordability measure.
Target award: 125% ofbase salary
Minimum 0% of basesalary
Maximum 281.25% ofbase salary
Measures:
■ 100% Nokia scorecard
– 20% revenue
– 40% operating profit
– 40% free cash flow
Achievement againstmeasures is multiplied bythe business resultsmultiplier (operatingprofit), the overridingaffordability measure.
To incentivize and rewardperformance againstdelivery of the annualbusiness plan
Short-term incentives arebased on performance againstsingle-year targets andnormally paid in cash.
Targets for the short-termincentives are set at the start ofthe year, in the context ofanalyst expectations and theannual plan, selectingmeasures that align to thedelivery of Nokia’s strategy.
Achievement is assessed at theend of the year.
Short-term incentives aresubject to the clawback policy(see below).
Target award: 125% of basesalary
Minimum 0% of base salary
Maximum 281.25% of basesalary
Long-termincentives(PerformanceShares)
Target award: 200% of base salary(EUR 2 600 000)
Minimum 0% of base salary
Maximum 400% of base salary(1)
Metric: Absolute Total ShareholderReturn
Target award: 200% of base salary (EUR 2 600 000 full-yearequivalent)
Minimum 0% of basesalary
Maximum 400% of basesalary(1)
Metric: Absolute TotalShareholder Return
No 2020 LTI awardgranted to Mr. Suri
To reward for delivery ofsustainable long-termperformance, align thePresident and CEO’sinterests with those ofshareholders and aidretention.
Long-term incentive awards arenormally made in performanceshares and paid forperformance against longer-term targets.
Targets are set in the context ofthe Nokia long-term plans andanalyst forecasts ensuring thatthey are considered bothdemanding and motivational.
Long-term incentives aresubject to the clawback policy(see below).
Target award: 200% of basesalary
Minimum 0% of base salary
Maximum 400% of basesalary(1).
The Board’s PersonnelCommittee retains discretion tomake awards up to twice thatlevel in exceptionalcircumstances such as forexample upon recruitment,significant change inresponsibilities, significantstrategic change or other similarevents. The use of discretionwould be explained at the time.
Pension Contribution to the mandatoryTyEL pension plan in Finland.
Contribution to themandatory TyEL pensionplan in Finland.
Contribution to themandatory TyEL pensionplan in Finland.
To provide for retirementwith a level of certainty.
Retirement age is defined andpensions are provided in linewith local countryarrangements; in Finland this isthe statutory Finnish pensionsystem (Finnish TyEL).
Under the TyEL arrangements,base salary, incentives andother taxable benefits areincluded in the definition ofearnings while gains fromequity-related plans are not.
No supplemental pensionarrangements are provided inFinland.
Pursuant to Finnish legislation,Nokia is required to makecontributions to the FinnishTyEL pension arrangements inrespect of the President andCEO. Such payments can becharacterized as definedcontribution payments. Theamount is disclosed in theRemuneration Report.
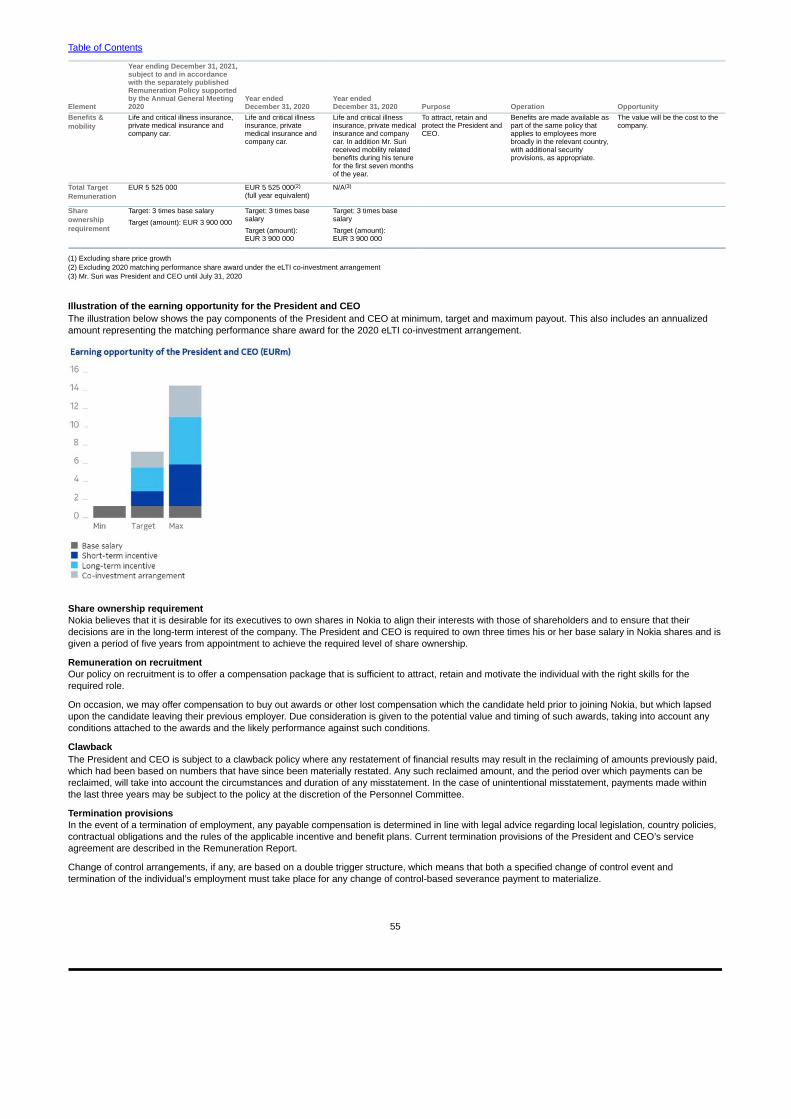
Table of Contents
55
Element
Year ending December 31, 2021,subject to and in accordancewith the separately publishedRemuneration Policy supportedby the Annual General Meeting2020
Year ended December 31, 2020
Year ended December 31, 2020 Purpose Operation Opportunity
Benefits &mobility
Life and critical illness insurance,private medical insurance andcompany car.
Life and critical illness insurance, private medical insurance and company car.
Life and critical illnessinsurance, private medicalinsurance and companycar. In addition Mr. Surireceived mobility relatedbenefits during his tenurefor the first seven monthsof the year.
To attract, retain andprotect the President andCEO.
Benefits are made available aspart of the same policy thatapplies to employees morebroadly in the relevant country,with additional securityprovisions, as appropriate.
The value will be the cost to thecompany.
Total TargetRemuneration
EUR 5 525 000 EUR 5 525 000(2)
(full year equivalent)N/A(3)
Shareownershiprequirement
Target: 3 times base salary
Target (amount): EUR 3 900 000
Target: 3 times basesalary
Target (amount): EUR 3 900 000
Target: 3 times basesalary
Target (amount): EUR 3 900 000
(1) Excluding share price growth(2) Excluding 2020 matching performance share award under the eLTI co-investment arrangement(3) Mr. Suri was President and CEO until July 31, 2020
Illustration of the earning opportunity for the President and CEOThe illustration below shows the pay components of the President and CEO at minimum, target and maximum payout. This also includes an annualizedamount representing the matching performance share award for the 2020 eLTI co-investment arrangement.
Share ownership requirementNokia believes that it is desirable for its executives to own shares in Nokia to align their interests with those of shareholders and to ensure that theirdecisions are in the long-term interest of the company. The President and CEO is required to own three times his or her base salary in Nokia shares and isgiven a period of five years from appointment to achieve the required level of share ownership.
Remuneration on recruitmentOur policy on recruitment is to offer a compensation package that is sufficient to attract, retain and motivate the individual with the right skills for therequired role.
On occasion, we may offer compensation to buy out awards or other lost compensation which the candidate held prior to joining Nokia, but which lapsedupon the candidate leaving their previous employer. Due consideration is given to the potential value and timing of such awards, taking into account anyconditions attached to the awards and the likely performance against such conditions.
ClawbackThe President and CEO is subject to a clawback policy where any restatement of financial results may result in the reclaiming of amounts previously paid,which had been based on numbers that have since been materially restated. Any such reclaimed amount, and the period over which payments can bereclaimed, will take into account the circumstances and duration of any misstatement. In the case of unintentional misstatement, payments made withinthe last three years may be subject to the policy at the discretion of the Personnel Committee.
Termination provisionsIn the event of a termination of employment, any payable compensation is determined in line with legal advice regarding local legislation, country policies,contractual obligations and the rules of the applicable incentive and benefit plans. Current termination provisions of the President and CEO’s serviceagreement are described in the Remuneration Report.
Change of control arrangements, if any, are based on a double trigger structure, which means that both a specified change of control event andtermination of the individual’s employment must take place for any change of control-based severance payment to materialize.

Table of Contents
56
Remuneration summary for the Board of DirectorsThe Board’s Corporate Governance and Nomination Committee periodically reviews the remuneration for the Chair and members of the Board againstcompanies of similar size and complexity to ensure Nokia is able to attract a suitably diverse and relevant mix of skills, experience and other personalqualities in order to maximize the value creation for shareholders.
The Annual General Meeting resolves annually on the remuneration to the Chair and members of the Board. The Chair of the Board’s remuneration waslast changed in 2008. The Board members’ annual fees were last changed in 2016 with the previous change in 2007. The structure of the Boardremuneration for the current term of the Board is set out in the table below.
Fees Fees consist of annual fees and meeting fees.Approximately 40% of the annual fee is paid in Nokia shares purchased from the market on behalf of the Board members oralternatively delivered as treasury shares held by the company. The balance is paid in cash, most of which is typically used tocover taxes arising from the paid remuneration.
Meeting fees are paid in cash.
Meeting fees are not paid to the Chair of the Board.
Incentives Non-executive directors are not eligible to participate in any Nokia incentive plans and do not receive performance shares,restricted shares or any other equity-based or other form of variable compensation for their duties as members of the Board.
Pensions Non-executive directors do not participate in any Nokia pension plans.
Share ownershiprequirement
Members of the Board shall normally retain until the end of their directorship such number of shares that corresponds to thenumber of shares they have received as Board remuneration during their first three years of service in the Board (the net amountreceived after deducting those shares needed to offset any costs relating to the acquisition of the shares, including taxes).
Other Directors are compensated for travel and accommodation expenses as well as other costs directly related to Board andCommittee work. The compensation is paid in cash.
Remuneration for the term that began at the Annual General Meeting held on May 27, 2020 and ends at the close of the Annual General Meeting in 2021consists of the following fees:
Annual fee EUR
Chair 440 000Vice Chair 185 000Member 160 000Chair of Audit Committee 30 000Member of Audit Committee 15 000Chair of Personnel Committee 30 000Chair of Technology Committee 20 000Meeting fee(1) EUR
Meeting requiring intercontinental travel 5 000Meeting requiring continental travel 2 000
(1) Paid for a maximum of seven meetings per term. Not paid to the Chair of the Board.
Proposals of the Board of Directors to the Annual General Meeting 2021 were published on February 4, 2021. The Board proposes on therecommendation of the Board’s Corporate Governance and Nomination Committee to introduce additional annual fees to be paid to the members of thePersonnel Committee and Technology Committee in addition to the Committee Chairs. Other remuneration payable to the Board members would remainunchanged and no additional annual fee is proposed to be paid to the members of the Corporate Governance and Nomination Committee or the Chair ofthe Board for her service in any of the Board Committees.
Consequently, on the recommendation of the Board’s Corporate Governance and Nomination Committee, in line with the company’s Remuneration Policypresented to and supported by the Annual General Meeting 2020, the Board of Directors proposes to the Annual General Meeting that the annual feepayable for a term ending at the close of the next Annual General Meeting be as follows: EUR 440 000 for the Chair of the Board, EUR 185 000 for theVice Chair of the Board, EUR 160 000 for each member of the Board, EUR 30 000 each for the Chairs of the Audit Committee and the PersonnelCommittee and EUR 20 000 for the Chair of the Technology Committee as an additional annual fee and EUR 15 000 for each member of the AuditCommittee and Personnel Committee and EUR 10 000 for each member of the Technology Committee as an additional annual fee. Meeting fees wouldremain at current level. Furthermore, the Board also proposes that members of the Board of Directors shall be compensated for travel and accommodationexpenses as well as other costs directly related to Board and Board Committee work.
It is proposed that approximately 40% of the annual fee be paid in Nokia shares purchased from the market, or alternatively by using treasury shares heldby the company. The meeting fee, travel expenses and other expenses would be paid in cash.
Please note that the Remuneration Report, applicable to the President and CEO and the Board, subject to anadvisory vote at the 2021 Annual General Meeting, starts below and is also published on a stock exchangerelease. Other compensation-related information provided before and after the Remuneration Report is notsubject to a vote at the 2021 Annual General Meeting, but provides further information on the compensationpolicies applied within Nokia and the compensation of the Group Leadership Team.

Table of Contents
57
Remuneration Report 2020IntroductionThis Remuneration Report of Nokia Corporation (the Report) has been approved by the company’s Board of Directors (the Board) to be presented to the2021 Annual General Meeting. The resolution of the Annual General Meeting on the Report is advisory. The Report presents the remuneration of thePresident and CEO and the members of the Board for the financial year 2020 in accordance with the Finnish Decree of the Ministry of Finance 608/2019,the Finnish Corporate Governance Code of 2020 as well as other applicable Finnish laws and regulations. The Annual General Meeting held on May 27,2020 resolved to support Nokia Corporation’s Remuneration Policy (the Policy) with 86.37% of the votes in favor of the Policy. Both persons who haveacted as the President and CEO as well as the members of the Board have been remunerated in accordance with this Policy during the financial year2020. No temporary or other deviations from the Policy have been made and no clawback provisions have been exercised during the financial year 2020.
In 2020 our remuneration structure promoted the company’s long-term financial success by setting the performance criteria for short- and long-termincentives to support the company’s short- and long-term goals, as well through shareholding requirements set for the President and CEO and the Boardmembers. Aligned with Nokia’s pay-for-performance remuneration principle, performance-based compensation was emphasized over fixed base salary.The setting and application of the performance criteria for incentive programs executed the philosophy of pay-for-performance and supported the deliveryof the corporate strategy as well as the creation of long-term sustainable shareholder value.
The table below compares the development of the remuneration of our Board of Directors, President and CEO, average employee pay and companyperformance.
YearAggregate remuneration of the
Board of Directors (EUR)(1)President and CEO actual
remuneration (EUR) Average Salaries and Wages (EUR)(2) Revenue (EURm)Total Shareholder Return
(Rebased to 100 at 31 Dec 2015)(3)
2016 2,050,902 9,508,156 61,108 23 614 73.292017 2,138,000 6,423,559 63,461 23 147 64.052018 2,203,000 4,651,009 63,220 22 563 85.922019 2,219,000 3,897,625 61,980 23 315 57.482020 2,016,000 3,587,781 65,787 21 852 54.95
(1) Aggregate total remuneration paid to the members of the Board during the financial year as annual fee and meeting fee, as applicable, and as approved by general meetings of shareholders. The valuedepends on the number of members elected to the Board for each term as well as on the composition of the Board committees and travel required. Meeting fees were introduced in 2016 and the Board’sTechnology Committee was established in 2018 after which the Board has had four Committees.
(2) Average salaries and wages are reported in the company’s financial statements based on average employee numbers and total salaries and wages.(3) Total shareholder return on last trading day of the previous year.
We also present this data graphically:
While the graph reflects the euro values paid during each financial year, in practice the Board members’ remuneration closely aligns with the performance of the company and the total shareholder return. Approximately 40% of the Board members’ annual fees were paid in Nokia shares purchased from the market on their behalf and the directors shall retain until the end of their directorship such number of shares that corresponds to the number of shares they have received as Board remuneration during their first three years of service in the Board. The rest of the annual fee was paid in cash, most of which is typically used to cover taxes arising from the remuneration. It is the company’s policy that the non-executive members of the Board do not participate in any of the company’s equity programs and do not receive performance shares, restricted shares, or any other equity-based or other variable compensation for their duties as Board members. All members of the Board were non-executive during the financial years 2016-2020.
The pay-for-performance remuneration principle applied to the President and CEO as well as the shareholding requirement of the President and CEO andthe Board members, as applicable, contribute to an alignment of interests with shareholders, while also promoting and incentivizing decisions that are inthe long-term interest of the company.
We look forward to our shareholders’ support and confirmation that the Report is aligned with the Remuneration Policy.
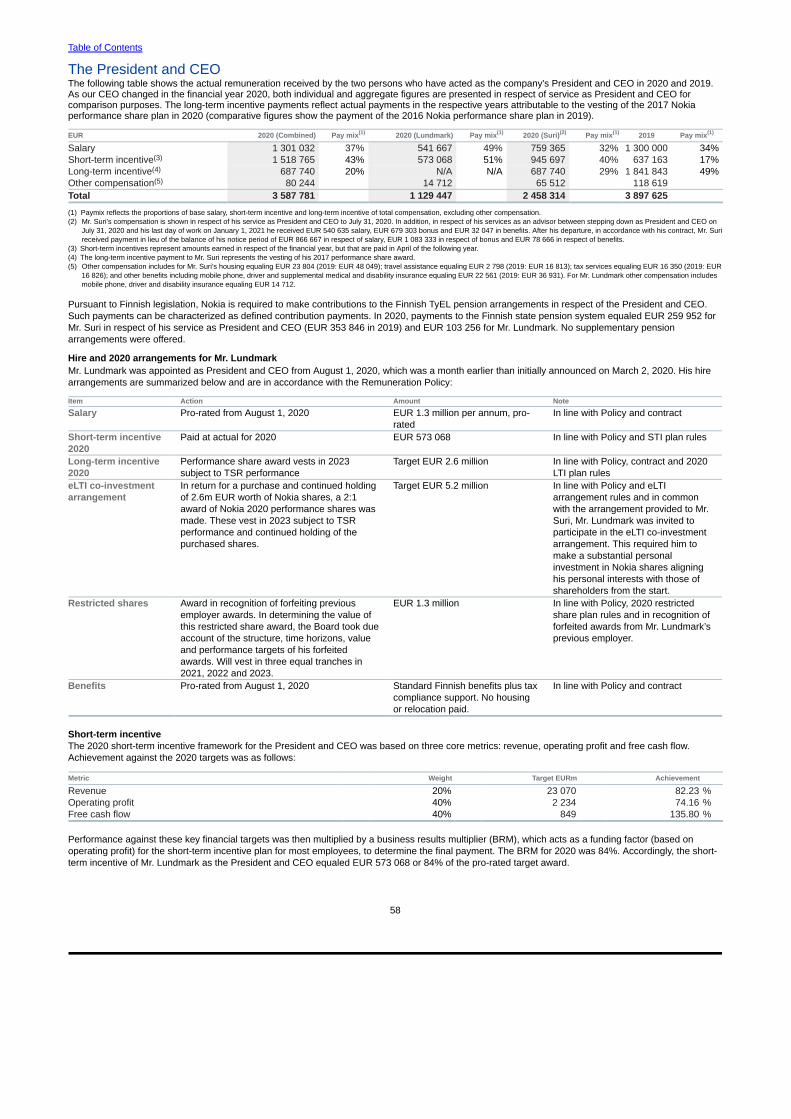
Table of Contents
58
The President and CEOThe following table shows the actual remuneration received by the two persons who have acted as the company's President and CEO in 2020 and 2019.As our CEO changed in the financial year 2020, both individual and aggregate figures are presented in respect of service as President and CEO forcomparison purposes. The long-term incentive payments reflect actual payments in the respective years attributable to the vesting of the 2017 Nokiaperformance share plan in 2020 (comparative figures show the payment of the 2016 Nokia performance share plan in 2019).
EUR 2020 (Combined) Pay mix(1) 2020 (Lundmark) Pay mix(1) 2020 (Suri)(2) Pay mix(1) 2019 Pay mix(1)
Salary 1 301 032 37% 541 667 49% 759 365 32% 1 300 000 34%Short-term incentive(3) 1 518 765 43% 573 068 51% 945 697 40% 637 163 17%Long-term incentive(4) 687 740 20% N/A N/A 687 740 29% 1 841 843 49%Other compensation(5) 80 244 14 712 65 512 118 619Total 3 587 781 1 129 447 2 458 314 3 897 625
(1) Paymix reflects the proportions of base salary, short-term incentive and long-term incentive of total compensation, excluding other compensation.(2) Mr. Suri’s compensation is shown in respect of his service as President and CEO to July 31, 2020. In addition, in respect of his services as an advisor between stepping down as President and CEO on
July 31, 2020 and his last day of work on January 1, 2021 he received EUR 540 635 salary, EUR 679 303 bonus and EUR 32 047 in benefits. After his departure, in accordance with his contract, Mr. Surireceived payment in lieu of the balance of his notice period of EUR 866 667 in respect of salary, EUR 1 083 333 in respect of bonus and EUR 78 666 in respect of benefits.
(3) Short-term incentives represent amounts earned in respect of the financial year, but that are paid in April of the following year.(4) The long-term incentive payment to Mr. Suri represents the vesting of his 2017 performance share award. (5) Other compensation includes for Mr. Suri’s housing equaling EUR 23 804 (2019: EUR 48 049); travel assistance equaling EUR 2 798 (2019: EUR 16 813); tax services equaling EUR 16 350 (2019: EUR
16 826); and other benefits including mobile phone, driver and supplemental medical and disability insurance equaling EUR 22 561 (2019: EUR 36 931). For Mr. Lundmark other compensation includesmobile phone, driver and disability insurance equaling EUR 14 712.
Pursuant to Finnish legislation, Nokia is required to make contributions to the Finnish TyEL pension arrangements in respect of the President and CEO.Such payments can be characterized as defined contribution payments. In 2020, payments to the Finnish state pension system equaled EUR 259 952 forMr. Suri in respect of his service as President and CEO (EUR 353 846 in 2019) and EUR 103 256 for Mr. Lundmark. No supplementary pensionarrangements were offered.
Hire and 2020 arrangements for Mr. LundmarkMr. Lundmark was appointed as President and CEO from August 1, 2020, which was a month earlier than initially announced on March 2, 2020. His hirearrangements are summarized below and are in accordance with the Remuneration Policy:
Item Action Amount Note
Salary Pro-rated from August 1, 2020 EUR 1.3 million per annum, pro-rated
In line with Policy and contract
Short-term incentive2020
Paid at actual for 2020 EUR 573 068 In line with Policy and STI plan rules
Long-term incentive2020
Performance share award vests in 2023subject to TSR performance
Target EUR 2.6 million In line with Policy, contract and 2020LTI plan rules
eLTI co-investmentarrangement
In return for a purchase and continued holdingof 2.6m EUR worth of Nokia shares, a 2:1award of Nokia 2020 performance shares wasmade. These vest in 2023 subject to TSRperformance and continued holding of thepurchased shares.
Target EUR 5.2 million In line with Policy and eLTIarrangement rules and in commonwith the arrangement provided to Mr.Suri, Mr. Lundmark was invited toparticipate in the eLTI co-investmentarrangement. This required him tomake a substantial personalinvestment in Nokia shares aligninghis personal interests with those ofshareholders from the start.
Restricted shares Award in recognition of forfeiting previousemployer awards. In determining the value ofthis restricted share award, the Board took dueaccount of the structure, time horizons, valueand performance targets of his forfeitedawards. Will vest in three equal tranches in2021, 2022 and 2023.
EUR 1.3 million In line with Policy, 2020 restrictedshare plan rules and in recognition offorfeited awards from Mr. Lundmark’sprevious employer.
Benefits Pro-rated from August 1, 2020 Standard Finnish benefits plus taxcompliance support. No housingor relocation paid.
In line with Policy and contract
Short-term incentiveThe 2020 short-term incentive framework for the President and CEO was based on three core metrics: revenue, operating profit and free cash flow.Achievement against the 2020 targets was as follows:
Metric Weight Target EURm Achievement
Revenue 20% 23 070 82.23 %Operating profit 40% 2 234 74.16 %Free cash flow 40% 849 135.80 %
Performance against these key financial targets was then multiplied by a business results multiplier (BRM), which acts as a funding factor (based onoperating profit) for the short-term incentive plan for most employees, to determine the final payment. The BRM for 2020 was 84%. Accordingly, the short-term incentive of Mr. Lundmark as the President and CEO equaled EUR 573 068 or 84% of the pro-rated target award.
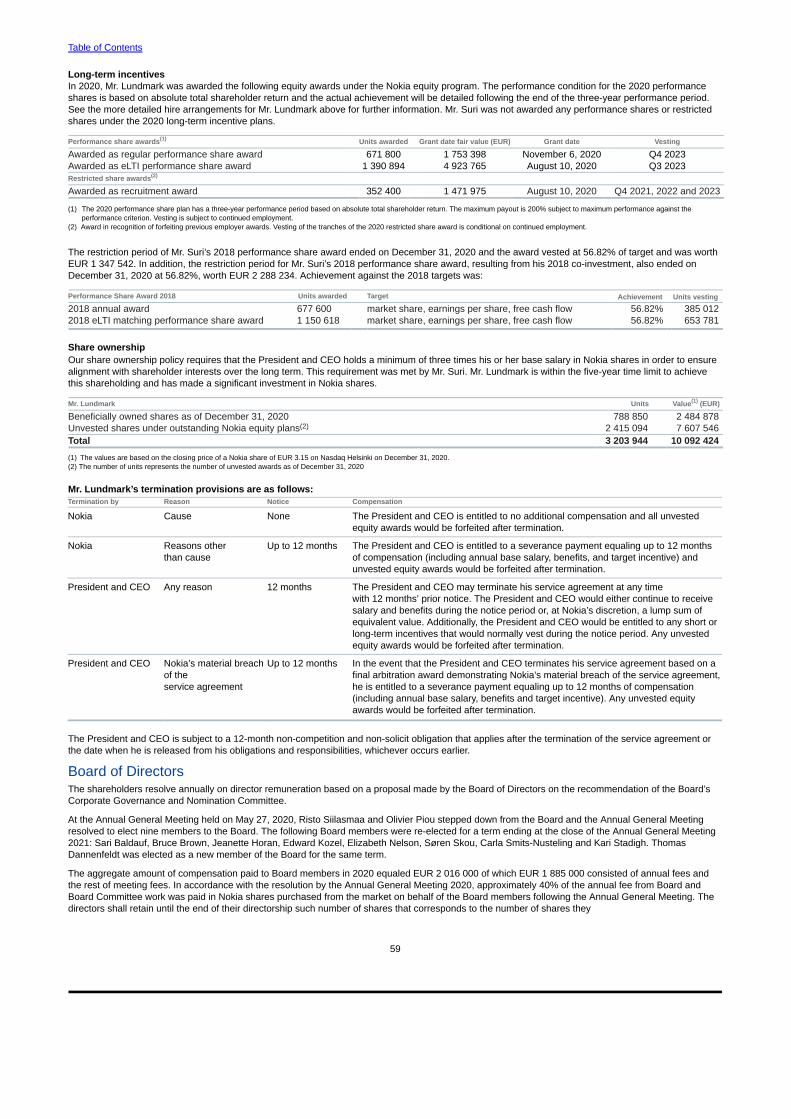
Table of Contents
59
Long-term incentivesIn 2020, Mr. Lundmark was awarded the following equity awards under the Nokia equity program. The performance condition for the 2020 performanceshares is based on absolute total shareholder return and the actual achievement will be detailed following the end of the three-year performance period.See the more detailed hire arrangements for Mr. Lundmark above for further information. Mr. Suri was not awarded any performance shares or restrictedshares under the 2020 long-term incentive plans.
Performance share awards(1) Units awarded Grant date fair value (EUR) Grant date Vesting
Awarded as regular performance share award 671 800 1 753 398 November 6, 2020 Q4 2023Awarded as eLTI performance share award 1 390 894 4 923 765 August 10, 2020 Q3 2023Restricted share awards(2)
Awarded as recruitment award 352 400 1 471 975 August 10, 2020 Q4 2021, 2022 and 2023
(1) The 2020 performance share plan has a three-year performance period based on absolute total shareholder return. The maximum payout is 200% subject to maximum performance against theperformance criterion. Vesting is subject to continued employment.
(2) Award in recognition of forfeiting previous employer awards. Vesting of the tranches of the 2020 restricted share award is conditional on continued employment.
The restriction period of Mr. Suri’s 2018 performance share award ended on December 31, 2020 and the award vested at 56.82% of target and was worthEUR 1 347 542. In addition, the restriction period for Mr. Suri’s 2018 performance share award, resulting from his 2018 co-investment, also ended onDecember 31, 2020 at 56.82%, worth EUR 2 288 234. Achievement against the 2018 targets was:
Performance Share Award 2018 Units awarded Target Achievement Units vesting
2018 annual award 677 600 market share, earnings per share, free cash flow 56.82% 385 0122018 eLTI matching performance share award 1 150 618 market share, earnings per share, free cash flow 56.82% 653 781
Share ownershipOur share ownership policy requires that the President and CEO holds a minimum of three times his or her base salary in Nokia shares in order to ensurealignment with shareholder interests over the long term. This requirement was met by Mr. Suri. Mr. Lundmark is within the five-year time limit to achievethis shareholding and has made a significant investment in Nokia shares.
Mr. Lundmark Units Value(1) (EUR)
Beneficially owned shares as of December 31, 2020 788 850 2 484 878Unvested shares under outstanding Nokia equity plans(2) 2 415 094 7 607 546Total 3 203 944 10 092 424
(1) The values are based on the closing price of a Nokia share of EUR 3.15 on Nasdaq Helsinki on December 31, 2020.(2) The number of units represents the number of unvested awards as of December 31, 2020
Mr. Lundmark’s termination provisions are as follows:Termination by Reason Notice Compensation
Nokia Cause None The President and CEO is entitled to no additional compensation and all unvestedequity awards would be forfeited after termination.
Nokia Reasons otherthan cause
Up to 12 months The President and CEO is entitled to a severance payment equaling up to 12 monthsof compensation (including annual base salary, benefits, and target incentive) andunvested equity awards would be forfeited after termination.
President and CEO Any reason 12 months The President and CEO may terminate his service agreement at any timewith 12 months’ prior notice. The President and CEO would either continue to receivesalary and benefits during the notice period or, at Nokia’s discretion, a lump sum ofequivalent value. Additionally, the President and CEO would be entitled to any short orlong-term incentives that would normally vest during the notice period. Any unvestedequity awards would be forfeited after termination.
President and CEO Nokia’s material breachof theservice agreement
Up to 12 months In the event that the President and CEO terminates his service agreement based on afinal arbitration award demonstrating Nokia’s material breach of the service agreement,he is entitled to a severance payment equaling up to 12 months of compensation(including annual base salary, benefits and target incentive). Any unvested equityawards would be forfeited after termination.
The President and CEO is subject to a 12-month non-competition and non-solicit obligation that applies after the termination of the service agreement orthe date when he is released from his obligations and responsibilities, whichever occurs earlier.
Board of DirectorsThe shareholders resolve annually on director remuneration based on a proposal made by the Board of Directors on the recommendation of the Board’sCorporate Governance and Nomination Committee.
At the Annual General Meeting held on May 27, 2020, Risto Siilasmaa and Olivier Piou stepped down from the Board and the Annual General Meetingresolved to elect nine members to the Board. The following Board members were re-elected for a term ending at the close of the Annual General Meeting2021: Sari Baldauf, Bruce Brown, Jeanette Horan, Edward Kozel, Elizabeth Nelson, Søren Skou, Carla Smits-Nusteling and Kari Stadigh. ThomasDannenfeldt was elected as a new member of the Board for the same term.
The aggregate amount of compensation paid to Board members in 2020 equaled EUR 2 016 000 of which EUR 1 885 000 consisted of annual fees andthe rest of meeting fees. In accordance with the resolution by the Annual General Meeting 2020, approximately 40% of the annual fee from Board andBoard Committee work was paid in Nokia shares purchased from the market on behalf of the Board members following the Annual General Meeting. Thedirectors shall retain until the end of their directorship such number of shares that corresponds to the number of shares they
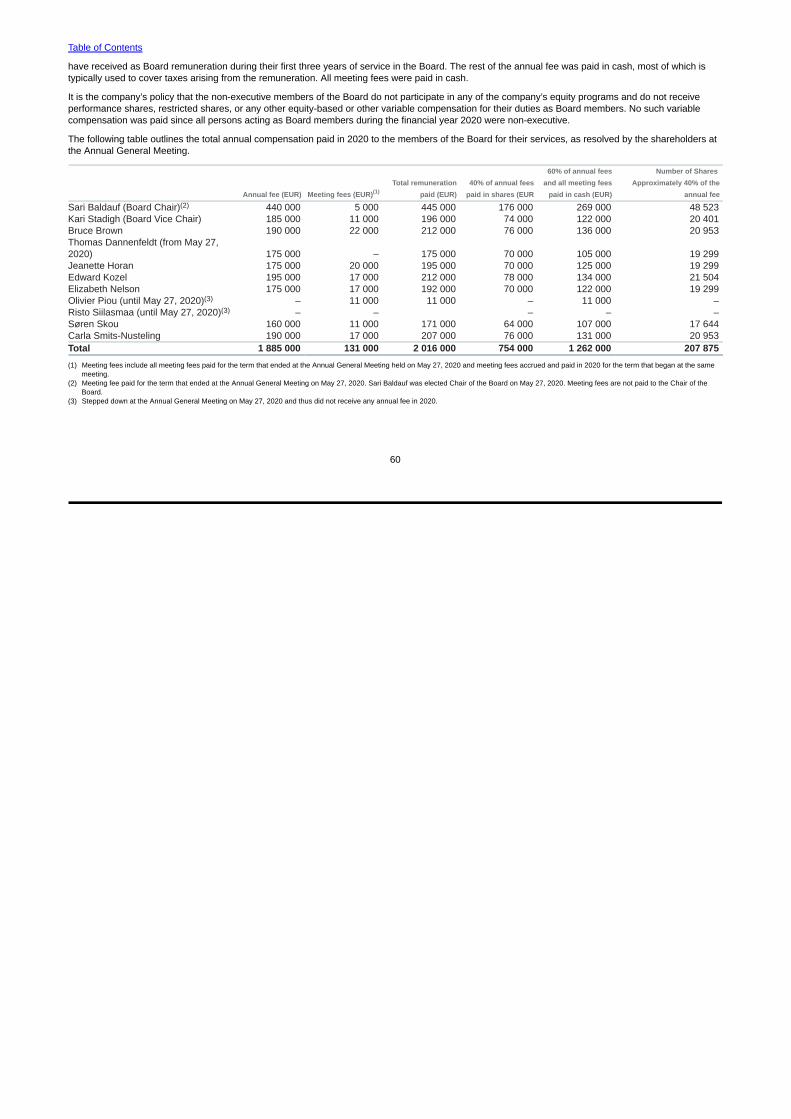
Table of Contents
60
have received as Board remuneration during their first three years of service in the Board. The rest of the annual fee was paid in cash, most of which istypically used to cover taxes arising from the remuneration. All meeting fees were paid in cash.
It is the company’s policy that the non-executive members of the Board do not participate in any of the company’s equity programs and do not receive performance shares, restricted shares, or any other equity-based or other variable compensation for their duties as Board members. No such variable compensation was paid since all persons acting as Board members during the financial year 2020 were non-executive.
The following table outlines the total annual compensation paid in 2020 to the members of the Board for their services, as resolved by the shareholders atthe Annual General Meeting.
Annual fee (EUR) Meeting fees (EUR)(1)Total remuneration
paid (EUR)40% of annual fees
paid in shares (EUR
60% of annual feesand all meeting fees
paid in cash (EUR)
Number of Shares Approximately 40% of the
annual fee
Sari Baldauf (Board Chair)(2) 440 000 5 000 445 000 176 000 269 000 48 523Kari Stadigh (Board Vice Chair) 185 000 11 000 196 000 74 000 122 000 20 401Bruce Brown 190 000 22 000 212 000 76 000 136 000 20 953Thomas Dannenfeldt (from May 27,2020) 175 000 – 175 000 70 000 105 000 19 299Jeanette Horan 175 000 20 000 195 000 70 000 125 000 19 299Edward Kozel 195 000 17 000 212 000 78 000 134 000 21 504Elizabeth Nelson 175 000 17 000 192 000 70 000 122 000 19 299Olivier Piou (until May 27, 2020)(3) – 11 000 11 000 – 11 000 –Risto Siilasmaa (until May 27, 2020)(3) – – – – –Søren Skou 160 000 11 000 171 000 64 000 107 000 17 644Carla Smits-Nusteling 190 000 17 000 207 000 76 000 131 000 20 953Total 1 885 000 131 000 2 016 000 754 000 1 262 000 207 875
(1) Meeting fees include all meeting fees paid for the term that ended at the Annual General Meeting held on May 27, 2020 and meeting fees accrued and paid in 2020 for the term that began at the samemeeting.
(2) Meeting fee paid for the term that ended at the Annual General Meeting on May 27, 2020. Sari Baldauf was elected Chair of the Board on May 27, 2020. Meeting fees are not paid to the Chair of theBoard.
(3) Stepped down at the Annual General Meeting on May 27, 2020 and thus did not receive any annual fee in 2020.

Table of Contents
61
Remuneration governanceWe manage our remuneration through clearly defined processes, with well-defined governance principles, ensuring that no individual is involved in thedecision-making related to their own remuneration and that there is appropriate oversight of any compensation decision. Remuneration of the Board isannually presented to shareholders for approval at the Annual General Meeting and the remuneration of the President and CEO is approved by the Board.
Remuneration of the Board is annually presented to shareholders for approval at the Annual General Meeting. The Board submits its proposal to theAnnual General Meeting on the recommendation of the Board's Corporate Governance and Nomination Committee, which actively considers andevaluates the appropriate level and structure of directors’ remuneration. Shareholders also authorize the Board to resolve to issue shares, for example tosettle the company’s equity-based incentive plans based on the proposal of the Board.
The Board of Directors approves, and the independent members of the Board confirm, the compensation of the President and CEO, uponrecommendation of the Personnel Committee. The Personnel Committee consults regularly with the President and CEO and the Chief People Officerthough they are not present when their own compensation is reviewed or discussed. This enables the Personnel Committee to be mindful of employee payand conditions across the broader employee population. The Committee has the power, in its sole discretion, to retain compensation consultants to assistthe Personnel Committee in evaluating director and executive compensation.
The Personnel Committee Chair regularly engages with shareholders on pay and broader matters to hear their views on our compensation policies,programs and associated disclosures and reflect on their feedback. For example, we had increased the performance period to three years in response toshareholders’ feedback.
Work of the Personnel CommitteeThe Personnel Committee convened six times during 2020 with a general theme for each meeting. All meetings were held in accordance with COVID-19restrictions.
January◾Incentive targets and objectives
◾Nokia Equity Program
◾Investor feedback on remuneration practices
March◾President and CEO remuneration
◾Remuneration policy review
May◾Long-term incentive nominations for the Group Leadership Team
◾Investor feedback from Remuneration Policy voting in the Annual GeneralMeeting
July◾Annual General Meeting update
◾Personnel Committee advisor update
◾Review of Share Ownership and Clawback Policies
October◾Alignment on long-term incentive approach
◾Risk review
December◾2021 incentive program framework
◾Culture
◾Remuneration Report for 2020
The President and CEOThe President and CEO has an active role in the compensation governance and performance management processes for the Group Leadership Team andthe wider employee population at Nokia.
The President and CEO is not a member of the Personnel Committee and does not vote at Personnel Committee meetings, nor does he participate in anyconversations regarding his own compensation.
◾ ◾

Table of Contents
62
AdvisorsThe Personnel Committee engaged Willis Towers Watson, an independent external consultant, to assist in the review and determination of executivecompensation and program design and provide insight into market trends and regulatory developments.
Nokia Group Leadership Team remunerationAt the end of 2020, the Group Leadership Team consisted of 17 persons split between Finland, other European countries and the United States. Forinformation regarding the current Group Leadership Team composition refer to the Corporate Governance Statement.
Name Position in 2020 Appointment date
Pekka Lundmark President and CEO (from Aug 1, 2020) August 1, 2020Rajeev Suri President and CEO (until July 31, 2020) May 1, 2014Nassib Abou-Khalil Chief Legal Officer August 1, 2019Basil Alwan Co-president of IP/Optical Networks January 8, 2016Ricky Corker President of Customer Operations, Americas January 1, 2019Barry French Chief Marketing Officer January 8, 2016Sanjay Goel President of Global Services April 1, 2018Bhaskar Gorti President of Nokia Software January 8, 2016Federico Guillén President of Customer Operations Officer, EMEA & APAC January 8, 2016Jenni Lukander President of Nokia Technologies August 1, 2019Sandra Motley President of Fixed Networks January 31, 2019Sri Reddy Co-president of IP/Optical Networks May 15, 2018Raghav Sahgal President of Nokia Enterprise (from Jun 1, 2020) June 1, 2020Kathrin Buvac President of Nokia Enterprise (until May 30, 2020) January 8, 2016Gabriela Styf Sjӧman Chief Strategy Officer December 1, 2019Tommi Uitto President of Mobile Networks January 31, 2019Marcus Weldon Chief Technology Officer and President of Bell Labs April 1, 2017Stephanie Werner-Dietz Chief Human Resources Officer January 1, 2020Marco Wirén Chief Financial Officer (from Sep 1, 2020) September 1, 2020Kristian Pullola Chief Financial Officer (until Aug 31, 2020) January 1, 2017
The remuneration of the members of the Group Leadership Team (excluding the President and CEO) consists of base salary, fringe benefits and short-and long-term incentives. Short-term incentive plans are based on rewarding the delivery of business performance utilizing certain, or all, of the followingmetrics as appropriate to the member’s role: revenue, operating profit, free cash flow and defined strategic objectives.
Executives on the Group Leadership Team are subject to the same remuneration policy framework as the President and CEO. This includes being subjectto clawback and shareholding requirements. The shareholding requirement for members of the Group Leadership Team is two times their base salary.
Remuneration of the Group Leadership Team in 2020Remuneration of the Group Leadership Team (excluding the President and CEO) in 2020 and 2019, in the aggregate, was as follows:
2020 2019EURm⁽¹⁾ EURm⁽¹⁾
Salary, short-term incentives and other compensation(2) 24.4 21.7Long-term incentives(3) 3.7 4.4Total 28.1 26.1
(1) The values represent each member’s time on the Group Leadership Team.(2) Short-term incentives represent amounts earned in respect of 2020 performance. Other compensation includes mobility related payments, local benefits and pension costs.(3) The amounts represent the value of equity awards that vested in 2020.
The members of the Group Leadership Team (excluding the President and CEO) were awarded the following equity awards under the Nokia equityprogram in 2020:
Award Units awarded(1) Grant date fair value (EUR) Grant date Vesting
Performance shares(2)1 575 900 4 132 482
November 6, 2020 and December 16,2020
Q4 2023
Restricted shares(3)1 902 100 4 931 049
March 18, 2020, May 7, 2020 andJuly 1, 2020
Q3, 2020; Q1, Q3 and Q4 in 2021,2022 and 2023
(1) Includes units awarded to persons who were Group Leadership Team members during 2020.(2) The 2020 performance share plan has a three-year performance period based on absolute total shareholder return. The maximum payout is 200% subject to maximum performance against the
performance criterion. Vesting is subject to continued employment.(3) Vesting of the tranches of the 2020 restricted share award is conditional to continued employment.

Table of Contents
63
Unvested equity awards held by the Nokia Group Leadership Team, including the President and CEOThe following table sets forth the potential aggregate ownership interest through the holding of equity-based incentives of the Group Leadership Team inoffice, including the President and CEO, as of December 31, 2020:
Shares receivable Shares receivable Shares receivable through performance through performance through restricted
shares at grant shares at maximum(4) shares
Number of equity awards held by the Group Leadership Team(1) 7 380 503 14 761 006 1 897 548% of the outstanding shares(2) 0.13 % 0.26 % 0.03 %% of the total outstanding equity incentives (per instrument)(3) 7.42 % 7.42 % 41.91 %
(1) Includes the 17 members of the Group Leadership Team in office as of December 31, 2020.(2) The percentages are calculated in relation to the outstanding number of shares and total voting rights of Nokia as of December 31, 2020, excluding shares held by Nokia Group. No member of the
Group Leadership Team owns more than 1% of the outstanding Nokia shares.(3) The percentages are calculated in relation to the total outstanding equity incentives per instrument.(4) At maximum performance, under the performance share plans outstanding as of December 31, 2020, the payout would be 200% and the table reflects this potential maximum payout. The restriction
period for the performance share plan 2018 ended on December 31, 2020 and Nokia’s performance against the performance criteria set out in the plan rules, was above the threshold performance. Thesettlement to the participants under the performance share 2018 plan took place in February 2021.
Review of our incentive plansEach year we monitor the performance of our incentive plans against the targets for the plan, total shareholder return and the impact that the plans haveon total compensation compared with market peers.
Target settingTargets for the short-term incentives are set annually at or before the start of the year, balancing the need to deliver value with the need to motivate anddrive performance of the Group Leadership Team. Targets are selected from a set of strategic metrics that align with driving sustainable value forshareholders and are set in the context of market expectations and analyst consensus forecasts. Targets for our long-term incentive plans are set in asimilar context. The long-term incentive targets are set at the start of the performance period and locked in for the life of the plan.
Short-term incentivesIn 2020 short-term incentive targets and achievements were based on a mix of revenue, operating profit and cash flow as well as personal targets. Targetswere measured either at a Nokia Group level or, alternatively, a mix of Nokia Group and business group level for business group presidents. For 2021 theincentive structure will be simplified to focus on four metrics:
◾Operating profit of Nokia
◾Operating profit for the relevant business group
◾Role related strategic objectives
◾ESG (carbon emissions and diversity)
Those Group Leadership Team members not leading a business group will have the equivalent proportion of their incentive based on Nokia’s operatingprofit.
Long-term incentivesWe annually review compensation against key metrics such as total shareholder return and share price to validate the effectiveness of our equity plans.
The 2017 performance share plan vested on January 1, 2020 with 28.9% of the target award vesting based on the achievement against the revenue andearnings per share targets during the performance period (financial years 2017 and 2018).
The 2018 performance share plan vested on January 1, 2021 with 56.82% of the target award vesting based on the achievement against the marketshare, earnings per share and free cash flow targets during the performance period (financial years 2018 and 2019).
The 2019 performance share plan was the first to be based on a three-year performance period and its performance will be assessed after the financialyear 2021 has ended.
The Personnel Committee of the Board determined that the metric for the 2020 performance share plan should be based on total shareholder return. Thisreflects our commitment to driving the best direct, long-term results and fully aligns plan participants with the interests of shareholders. The globalpandemic necessitated a delay to the award date for our main long-term incentive award from July to November. The performance period was adjustedaccordingly to ensure that a three-year performance period was maintained and the November 2020 awards will not vest until a corresponding date threeyears later in 2023. The performance conditions were not adjusted.
Nokia long-term incentive plan and employee share purchase plan 2021-2023The long-term incentive plan (LTI Plan) intends to effectively contribute to the long-term value creation and sustainability of the Company and align theinterests of the executives and employees with those of Nokia’s shareholders. Nokia’s long-term incentive plan for 2021-2023 is a key tool which supportsthese objectives. Under the LTI Plan the company may grant eligible executives and other employees awards in the form of both performance shares andrestricted shares.
Awards under the LTI Plan may be granted between the date the plan is approved and December 31, 2023 subject to applicable performance metrics aswell as performance and/or restriction periods of up to 36 months depending on the award. Consequently, the restriction periods for the last awardsgranted under the LTI Plan would end in 2026. Performance metrics as well as weightings and targets for the selected metrics for performance shares areset by the Board of Directors annually to ensure they continue to support Nokia’s long-term business strategy and financial success.
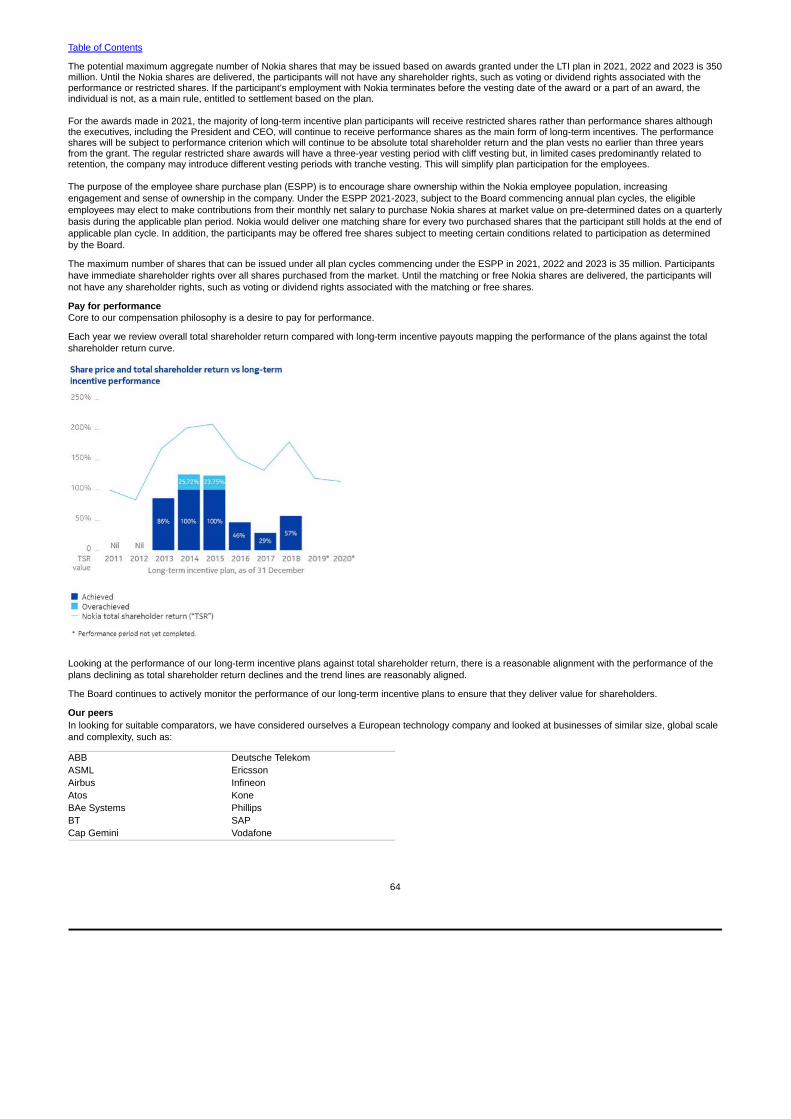
Table of Contents
64
The potential maximum aggregate number of Nokia shares that may be issued based on awards granted under the LTI plan in 2021, 2022 and 2023 is 350million. Until the Nokia shares are delivered, the participants will not have any shareholder rights, such as voting or dividend rights associated with theperformance or restricted shares. If the participant’s employment with Nokia terminates before the vesting date of the award or a part of an award, theindividual is not, as a main rule, entitled to settlement based on the plan.
For the awards made in 2021, the majority of long-term incentive plan participants will receive restricted shares rather than performance shares althoughthe executives, including the President and CEO, will continue to receive performance shares as the main form of long-term incentives. The performanceshares will be subject to performance criterion which will continue to be absolute total shareholder return and the plan vests no earlier than three yearsfrom the grant. The regular restricted share awards will have a three-year vesting period with cliff vesting but, in limited cases predominantly related toretention, the company may introduce different vesting periods with tranche vesting. This will simplify plan participation for the employees.
The purpose of the employee share purchase plan (ESPP) is to encourage share ownership within the Nokia employee population, increasingengagement and sense of ownership in the company. Under the ESPP 2021-2023, subject to the Board commencing annual plan cycles, the eligibleemployees may elect to make contributions from their monthly net salary to purchase Nokia shares at market value on pre-determined dates on a quarterlybasis during the applicable plan period. Nokia would deliver one matching share for every two purchased shares that the participant still holds at the end ofapplicable plan cycle. In addition, the participants may be offered free shares subject to meeting certain conditions related to participation as determinedby the Board.
The maximum number of shares that can be issued under all plan cycles commencing under the ESPP in 2021, 2022 and 2023 is 35 million. Participantshave immediate shareholder rights over all shares purchased from the market. Until the matching or free Nokia shares are delivered, the participants willnot have any shareholder rights, such as voting or dividend rights associated with the matching or free shares.
Pay for performanceCore to our compensation philosophy is a desire to pay for performance.
Each year we review overall total shareholder return compared with long-term incentive payouts mapping the performance of the plans against the totalshareholder return curve.
Looking at the performance of our long-term incentive plans against total shareholder return, there is a reasonable alignment with the performance of theplans declining as total shareholder return declines and the trend lines are reasonably aligned.
The Board continues to actively monitor the performance of our long-term incentive plans to ensure that they deliver value for shareholders.
Our peersIn looking for suitable comparators, we have considered ourselves a European technology company and looked at businesses of similar size, global scaleand complexity, such as:
ABB Deutsche TelekomASML EricssonAirbus InfineonAtos KoneBAe Systems PhillipsBT SAPCap Gemini Vodafone
Table of Contents
65
Operating and financial reviewand prospectsContentsSelected financial data 66Operating and financial review 67Results of operations 67Continuing operations 67Discontinued operations 71Results of segments 71Networks 71Nokia Software 73Nokia Technologies 74Group Common and Other 75Liquidity and capital resources 76Financial position 76Cash flow 76Financial assets and debt 77Venture fund investments and commitments 78Treasury policy 78Foreign exchange impact 78Our response to Covid-19 79The health of our employees and their families is our first priority 79As the pandemic spread, internet traffic surged 79We enabled networks to stay online 79Re-establishing the new normal 79Sustainability and corporate responsibility 80Sustainability governance 80Risk mangaement 80Strategy and targets 81Dealing with Covid-19 pandemic 81Improving lives with technology 82Combatting climate change 82Conducting our business with integrity 82Our culture – respecting people 84Shares and shareholders 85Share details 85Shareholders 87Articles of Association 89Risk factors 91Significant subsequent events 108

Table of Contents
66
Selected financial dataFive-year consolidated financial informationThe selected financial data set forth below as of and for each of the years in the five-year period ended December 31, 2020 has been derived from, andshould be read in conjunction with, our consolidated financial statements prepared in accordance with IFRS. The consolidated financial statements as ofDecember 31, 2020 and 2019 and for the years ended December 31, 2020, 2019 and 2018 are included in this Annual Report on Form 20-F.
In 2019, the Group applied IFRS 16, Leases, for the first time. In 2018, the Group applied IFRS 9, Financial Instruments, and IFRS 15, Revenue fromContracts with Customers, for the first time. As the new standards were not adopted retrospectively, the financial information for the comparative periodshas not been restated for the effects of the new standards.
2020 2020 2019 2018 2017 2016
For the year ended December 31 USDm(1) EURm
From the consolidated income statement Net sales 24 959 21 852 23 315 22 563 23 147 23 641Operating profit/(loss) 1 011 885 485 (59) 16 (1 100)Profit/(loss) before tax 849 743 156 (360) (510) (1 369)(Loss)/profit for the year from continuing operations (2 870) (2 513) 18 (549) (1 437) (912)(Loss)/profit for the year from discontinued operations (3) (3) (7) 214 (21) (15)(Loss)/profit for the year (2 874) (2 516) 11 (335) (1 458) (927)(Loss)/profit from continuing operations attributable to equity holders of the parent (2 878) (2 520) 14 (554) (1 473) (751)(Loss)/profit attributable to equity holders of the parent (2 882) (2 523) 7 (340) (1 494) (766)Earnings per share attributable to equity holders of the parent
Basic earnings per share, EUR Continuing operations (0.51) (0.45) 0.00 (0.10) (0.26) (0.13)(Loss)/profit for the year (0.51) (0.45) 0.00 (0.06) (0.26) (0.13)
Diluted earnings per share, EUR Continuing operations (0.51) (0.45) 0.00 (0.10) (0.26) (0.13)(Loss)/profit for the year (0.51) (0.45) 0.00 (0.06) (0.26) (0.13)
Cash dividends per share, EUR(2) 0.00 0.00 0.00 0.10 0.19 0.17Average number of shares (millions of shares)
Basic 5 612 5 612 5 600 5 588 5 652 5 732Diluted
Continuing operations 5 612 5 612 5 626 5 588 5 652 5 741(Loss)/profit for the year 5 612 5 612 5 626 5 588 5 652 5 741
(1) In 2020, average rate of USD per EUR 1.1422 has been used to translate the consolidated income statement items.(2) No dividend is proposed by the Board of Directors of the Parent Company related to the financial year 2020.
2020 2020 2019 2018 2017 2016
As of December 31 USDm(1) EURm
From the consolidated statement of financial position Non-current assets(2) 22 058 17 976 22 320 21 246 21 160 24 182Total cash and current financial investments(3)(4) 9 892 8 061 6 007 6 873 8 280 9 326Other current assets 12 460 10 154 10 801 11 393 11 561 11 349Assets held for sale – – – 5 23 44Total assets 44 410 36 191 39 128 39 517 41 024 44 901Capital and reserves attributable to equity holders of the parent 15 296 12 465 15 325 15 289 16 138 20 094Non-controlling interests 98 80 76 82 80 881Long-term interest-bearing liabilities(5) 6 154 5 015 3 985 2 826 3 454 3 647Other non-current liabilities(2)(5) 8 430 6 870 7 687 7 216 8 608 7 674Short-term interest-bearing liabilities 688 561 292 994 309 370Other current liabilities(2) 13 744 11 200 11 763 13 110 12 435 12 235Total shareholders’ equity and liabilities 44 410 36 191 39 128 39 517 41 024 44 901Net cash and current financial investments(4)(5)(6) 3 049 2 485 1 730 3 053 4 517 5 309Share capital 302 246 246 246 246 246
(1) In 2020, end of period rate of USD per EUR 1.2271 has been used to translate the consolidated statement of financial position items.(2) In 2020 and 2019, non-current assets, other non-current liabilities and other current liabilities reflect the impact of adoption of IFRS 16, Leases on January 1, 2019. (3) Total cash and current financial investments consist of the following line items from our consolidated statement of financial position: cash and cash equivalents and current financial investments. (4) Related to the adoption of IFRS 9, Financial Instruments on January 1, 2018, financial instruments previously presented within “Available for sale investments” are now presented within “Non-current
financial investments”, and financial instruments previously presented within “Available for sale investments, liquid assets” and “Investments at fair value though profit and loss, liquid assets” are nowpresented within “Current financial investments”. Despite the changes in the presentation of comparatives, IFRS 9 has not been adopted retrospectively.
(5) Lease liabilities recognized in accordance with IAS 17, Leases, for the years ended December 31, 2018, 2017 and 2016 have been reclassified from long-term interest-bearing liabilities to other non-current liabilities to ensure comparability with the presentation of interest-bearing liabilities and lease liabilities following the adoption of IFRS 16, Leases on January 1, 2019. Consequently, net cash andcurrent financial investments for the years ended December 31, 2018, 2017 and 2016 has been recast to exclude lease liabilities. Despite the changes in the presentation of comparatives, IFRS 16 hasnot been adopted retrospectively.
(6) Net cash and current financial investments equal total cash and current financial investments less long-term and short-term interest-bearing liabilities.

Table of Contents
67
Operating and financial reviewThe financial information included in this “Operating and financial review” section as of December 31, 2020 and 2019, and for the years ended December31, 2020, 2019 and 2018 has been derived from our audited consolidated financial statements included in this Annual Report on Form 20-F. The financialinformation should be read in conjunction with, and is qualified in its entirety by reference to, our audited consolidated financial statements.
Impact of COVID-19 on our operationsIn 2020, the global economy and financial markets have been severely affected by the COVID-19 pandemic. The impact of COVID-19 on our financialperformance and financial position during the year has been primarily related to temporary factory closures in the first half of the year. The factory closuresrelated primarily to Alcatel Submarine Networks in Group Common and Other and had a negative impact on net sales, with the majority of these net salesexpected to be shifted to future periods, rather than being lost. In addition, COVID-19 has affected our operational costs and cash flows, for example as aresult of temporarily lower travel, temporary delays in capital expenditure and lower cash outflows related to income taxes due to tax reliefs.
As of December 31, 2020, potential risks and uncertainties continue to exist related to the scope and duration of the COVID-19 impact and the pace andshape of the economic recovery following the pandemic and it is impossible to predict with accuracy the precise impact of such risks on us, our operationsand our business.
Results of operationsThis “Results of operations” section discusses the results of our continuing and discontinued operations.
In 2020, we reviewed the presentation of income and expenses related to our restructuring plans, pension plan curtailments and amendments as well ascertain asset impairments. As a result, we reclassified the restructuring and associated charges, pension curtailment and plan amendment income andexpenses as well as certain impairment charges that were previously presented in other operating income and expenses to the functional line items toenhance the relevance of information provided in our consolidated income statement. The comparative amounts for 2019 and 2018 have been reclassifiedaccordingly. For more information, refer to Note 2, Significant accounting policies, in the consolidated financial statements included in this Annual Reporton Form 20-F.
Continuing operationsFor the year ended December 31, 2020 compared to the year ended December 31, 2019The following table sets forth selective line items and the percentage of net sales for the years indicated.
2020 2019 Year-on-yearFor the year ended December 31 EURm % of net sales EURm % of net sales change %
Net sales 21 852 100.0 23 315 100.0 (6)Cost of sales(1) (13 659) (62.5) (15 051) (64.6) (9)Gross profit(1) 8 193 37.5 8 264 35.4 (1)Research and development expenses(1) (4 087) (18.7) (4 532) (19.4) (10)Selling, general and administrative expenses(1) (2 898) (13.3) (3 219) (13.8) (10)Other operating income and expenses(1) (323) (1.5) (28) (0.1) –Operating profit 885 4.0 485 2.1 82Share of results of associated companies and joint ventures 22 0.1 12 0.1 83Financial income and expenses (164) (0.8) (341) (1.5) (52)Profit before tax 743 3.4 156 0.7 –Income tax expense (3 256) (14.9) (138) (0.6) –(Loss)/profit for the year (2 513) (11.5) 18 0.1 –Attributable to:Equity holders of the parent (2 520) (11.5) 14 0.1 –Non-controlling interests 7 – 4 – 75
(1) In 2020, the Group reclassified certain items of income and expenses from other operating income and expenses to the functions. The comparative amounts for 2019 have been recast accordingly. Referto note 2, Significant accounting policies, in the consolidated financial statements included in this Annual Report on Form 20-F.
Net salesNet sales in 2020 were EUR 21 852 million, a decrease of EUR 1 463 million, or 6%, compared to EUR 23 315 million in 2019. The decrease in net saleswas primarily due to a decrease in Networks net sales, and, to a lesser extent, a decrease in Nokia Software and Nokia Technologies net sales. This waspartially offset by an increase in Group Common and Other.
The following tables set forth distribution of net sales by geographical area and net sales by customer type for the years indicated.
2020 2019 Year-on-yearFor the year ended December 31 EURm EURm change %
Asia Pacific 3 847 4 556 (16)Europe(1) 6 620 6 620 –Greater China 1 376 1 843 (25)Latin America 995 1 472 (32)Middle East & Africa 1 893 1 876 1North America 7 121 6 948 2Total 21 852 23 315 (6)(1) All Nokia Technologies IPR and licensing net sales are allocated to Finland.

Table of Contents
68
2020 2019 Year-on-yearFor the year ended December 31 EURm EURm change %
Communication service providers 17 954 19 558 (8)Enterprise 1 571 1 409 11Licensees 1 402 1 487 (6)Other(1) 925 861 7Total 21 852 23 315 (6)
(1) Includes net sales of Alcatel Submarine Networks and Radio Frequency Systems, both of which are being managed as separate entities, and certain other items, such as eliminations of inter-segmentrevenues and certain items related to purchase price allocation. Alcatel Submarine Networks and Radio Frequency Systems net sales include also revenue from communication service providers andenterprise customers.
Gross profitGross profit in 2020 was EUR 8 193 million, a decrease of EUR 71 million, or 1%, compared to EUR 8 264 million in 2019. The decrease in gross profitwas primarily due to higher restructuring and associated charges, a lower gain related to defined benefit plan amendments, and lower gross profit in NokiaSoftware, Nokia Technologies and Group Common and Other. These were partially offset by higher gross profit in Networks and the absence of productportfolio strategy costs. Gross margin in 2020 was 37.5%, compared to 35.4% in 2019. In 2020, gross profit did not include any product portfolio strategycosts, compared to EUR 123 million of such costs in 2019. In 2020, gross profit included restructuring and associated charges of EUR 393 million,compared to EUR 287 million in 2019. In 2020, gross profit included a gain related to defined benefit plan amendments of EUR 90 million, compared to again of EUR 168 million in 2019.
Operating expensesOur research and development expenses in 2020 were EUR 4 087 million, a decrease of EUR 445 million, or 10%, compared to EUR 4 532 million in2019. Research and development expenses represented 18.7% of our net sales in 2020 compared to 19.4% in 2019. The decrease in research anddevelopment expenses was primarily due to lower amortization of acquired intangible assets, a decrease in Networks research and developmentexpenses and the absence of product portfolio strategy costs. This was partially offset by higher restructuring and associated charges and an increase inNokia Technologies research and development expenses. In 2020, research and development expenses included EUR 57 million of amortization ofacquired intangible assets, compared to EUR 571 million in 2019. In 2020, research and development expenses did not include any product portfoliostrategy costs, compared to EUR 22 million in 2019. In 2020, research and development expenses included restructuring and associated charges of EUR190 million, compared to EUR 98 million in 2019.
Our selling, general and administrative expenses in 2020 were EUR 2 898 million, a decrease of EUR 321 million compared to EUR 3 219 million in 2019.Selling, general and administrative expenses represented 13.3% of our net sales in 2020 compared to 13.8% in 2019. The decrease in selling, generaland administrative expenses was primarily due to a decrease in Networks selling, general and administrative expenses, lower transaction and integration-related costs, lower restructuring and associated charges and, to a lesser extent, lower Nokia Technologies selling, general and administrative expenses.The decrease in Networks selling, general and administrative expenses, reflected continued progress related to Nokia’s cost savings program and lowertravel and personnel-related expenses due to COVID-19. In 2020, selling, general and administrative expenses included transaction and integration-related credits of EUR 11 million, compared to costs of EUR 50 million in 2019. In 2020, selling, general and administrative expenses includedrestructuring and associated charges of EUR 68 million, compared to EUR 117 million in 2019.
Other operating income and expenses in 2020 was a net expense of EUR 323 million, an increase of EUR 295 million, compared to a net expense of EUR28 million in 2019. The net negative fluctuation in our other operating income and expenses was primarily due to a non-cash impairment charge and a netnegative fluctuation in Networks other operating income and expenses. In 2020, we recorded a non-cash impairment loss on goodwill to other operatingincome and expenses of EUR 200 million, compared to no charge in 2019.
Operating profitOur operating profit in 2020 was EUR 885 million, an increase of EUR 400 million, compared to an operating profit of EUR 485 million in 2019. Theincrease in operating profit was primarily due to lower research and development expenses and lower selling, general and administrative expenses,partially offset by a net negative fluctuation in other operating income and expenses and lower gross profit. Our operating margin in 2020 was 4.0%,compared to 2.1% in 2019.
Financial income and expensesFinancial income and expenses were a net expense of EUR 164 million in 2020, a decrease of EUR 177 million, or 52%, compared to a net expense ofEUR 341 million in 2019. The net positive fluctuation in financial income and expenses was primarily due to a decrease in the costs related to the sale ofreceivables and a net benefit related to foreign exchange results arising from the impact of foreign exchange volatility. We sell trade receivables to variousfinancial institutions without recourse in the normal course of business, in order to manage our credit risk and working capital cycle.
Profit before taxOur profit before tax in 2020 was EUR 743 million, an increase of EUR 587 million compared to EUR 156 million in 2019.
Income taxIncome taxes were a net expense of EUR 3 256 million in 2020, an increase of EUR 3 118 million compared to a net expense of EUR 138 million in 2019.The increase in net income taxes was primarily attributable to a EUR 3.0 billion charge related to the derecognition of Finnish deferred tax assets and, to alesser extent, higher income taxes due to increased profitability in 2020 compared to 2019. The derecognition was required due to a regular assessment ofour ability to utilize the tax assets in Finland in the foreseeable future that is done primarily based on our historical performance. These tax assets are notlost, and the derecognition can be reversed. They can still be utilized in the taxation and the derecognition is not expected to affect the overall taxation ofthe Nokia Group or its cash taxes. For further details on the derecognition of Finnish deferred tax assets, please refer to Note 12, Income taxes, of ourconsolidated financial statements included in this Annual Report on Form 20-F.
Profit/loss attributable to equity holders of the parent and earnings per shareThe loss attributable to equity holders of the parent in 2020 was EUR 2 520 million, a decrease of EUR 2 534 million, compared to a profit of EUR 14million in 2019. The change in profit attributable to equity holders of the parent was primarily due to higher income tax expenses, partially offset by animprovement in operating profit, and net positive fluctuation in financial income and expenses.
Our EPS from continuing operations in 2020 was negative EUR 0.45 (basic) and negative EUR 0.45 (diluted) compared to EUR 0.00 (basic) and EUR 0.00(diluted) in 2019.
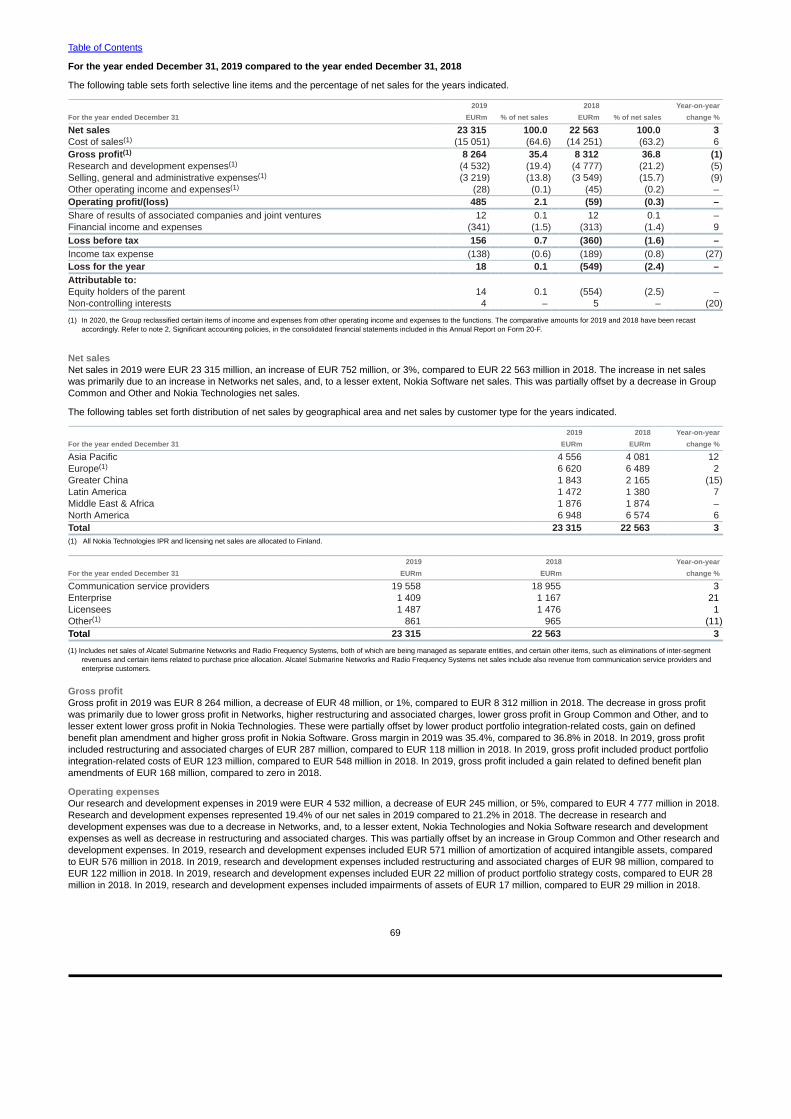
Table of Contents
69
For the year ended December 31, 2019 compared to the year ended December 31, 2018
The following table sets forth selective line items and the percentage of net sales for the years indicated.
2019 2018 Year-on-yearFor the year ended December 31 EURm % of net sales EURm % of net sales change %
Net sales 23 315 100.0 22 563 100.0 3Cost of sales(1) (15 051) (64.6) (14 251) (63.2) 6Gross profit(1) 8 264 35.4 8 312 36.8 (1)Research and development expenses(1) (4 532) (19.4) (4 777) (21.2) (5)Selling, general and administrative expenses(1) (3 219) (13.8) (3 549) (15.7) (9)Other operating income and expenses(1) (28) (0.1) (45) (0.2) –Operating profit/(loss) 485 2.1 (59) (0.3) –Share of results of associated companies and joint ventures 12 0.1 12 0.1 –Financial income and expenses (341) (1.5) (313) (1.4) 9Loss before tax 156 0.7 (360) (1.6) –Income tax expense (138) (0.6) (189) (0.8) (27)Loss for the year 18 0.1 (549) (2.4) –Attributable to:Equity holders of the parent 14 0.1 (554) (2.5) –Non-controlling interests 4 – 5 – (20)
(1) In 2020, the Group reclassified certain items of income and expenses from other operating income and expenses to the functions. The comparative amounts for 2019 and 2018 have been recastaccordingly. Refer to note 2, Significant accounting policies, in the consolidated financial statements included in this Annual Report on Form 20-F.
Net salesNet sales in 2019 were EUR 23 315 million, an increase of EUR 752 million, or 3%, compared to EUR 22 563 million in 2018. The increase in net saleswas primarily due to an increase in Networks net sales, and, to a lesser extent, Nokia Software net sales. This was partially offset by a decrease in GroupCommon and Other and Nokia Technologies net sales.
The following tables set forth distribution of net sales by geographical area and net sales by customer type for the years indicated.
2019 2018 Year-on-yearFor the year ended December 31 EURm EURm change %
Asia Pacific 4 556 4 081 12Europe(1) 6 620 6 489 2Greater China 1 843 2 165 (15)Latin America 1 472 1 380 7Middle East & Africa 1 876 1 874 –North America 6 948 6 574 6Total 23 315 22 563 3(1) All Nokia Technologies IPR and licensing net sales are allocated to Finland.
2019 2018 Year-on-yearFor the year ended December 31 EURm EURm change %
Communication service providers 19 558 18 955 3Enterprise 1 409 1 167 21Licensees 1 487 1 476 1Other(1) 861 965 (11)Total 23 315 22 563 3
(1) Includes net sales of Alcatel Submarine Networks and Radio Frequency Systems, both of which are being managed as separate entities, and certain other items, such as eliminations of inter-segmentrevenues and certain items related to purchase price allocation. Alcatel Submarine Networks and Radio Frequency Systems net sales include also revenue from communication service providers andenterprise customers.
Gross profitGross profit in 2019 was EUR 8 264 million, a decrease of EUR 48 million, or 1%, compared to EUR 8 312 million in 2018. The decrease in gross profitwas primarily due to lower gross profit in Networks, higher restructuring and associated charges, lower gross profit in Group Common and Other, and tolesser extent lower gross profit in Nokia Technologies. These were partially offset by lower product portfolio integration-related costs, gain on definedbenefit plan amendment and higher gross profit in Nokia Software. Gross margin in 2019 was 35.4%, compared to 36.8% in 2018. In 2019, gross profitincluded restructuring and associated charges of EUR 287 million, compared to EUR 118 million in 2018. In 2019, gross profit included product portfoliointegration-related costs of EUR 123 million, compared to EUR 548 million in 2018. In 2019, gross profit included a gain related to defined benefit planamendments of EUR 168 million, compared to zero in 2018.
Operating expensesOur research and development expenses in 2019 were EUR 4 532 million, a decrease of EUR 245 million, or 5%, compared to EUR 4 777 million in 2018.Research and development expenses represented 19.4% of our net sales in 2019 compared to 21.2% in 2018. The decrease in research anddevelopment expenses was due to a decrease in Networks, and, to a lesser extent, Nokia Technologies and Nokia Software research and developmentexpenses as well as decrease in restructuring and associated charges. This was partially offset by an increase in Group Common and Other research anddevelopment expenses. In 2019, research and development expenses included EUR 571 million of amortization of acquired intangible assets, comparedto EUR 576 million in 2018. In 2019, research and development expenses included restructuring and associated charges of EUR 98 million, compared toEUR 122 million in 2018. In 2019, research and development expenses included EUR 22 million of product portfolio strategy costs, compared to EUR 28million in 2018. In 2019, research and development expenses included impairments of assets of EUR 17 million, compared to EUR 29 million in 2018.

Table of Contents
70
Our selling, general and administrative expenses in 2019 were EUR 3 219 million, a decrease of EUR 330 million, or 9%, compared to EUR 3 549 millionin 2018. Selling, general and administrative expenses represented 13.8% of our net sales in 2019 compared to 15.7% in 2018. The decrease in selling,general and administrative expenses was primarily due to a decrease in Networks selling, general and administrative expenses, lower transaction andintegration-related costs and, to a lesser extent, lower Nokia Software and Nokia Technologies selling, general and administrative expenses. This waspartially offset by higher Group Common and Other selling, general and administrative expenses and higher restructuring and associated charges. In2019, selling, general and administrative expenses included EUR 352 million of amortization of acquired intangible assets, compared to EUR 358 million in2018. In 2019, selling, general and administrative expenses included restructuring and associated charges of EUR 117 million, compared to EUR 80million in 2018. In 2019, selling, general and administrative expenses included transaction and integration-related costs of EUR 50 million, compared toEUR 207 million in 2018.
Other operating income and expenses in 2019 was a net expense of EUR 28 million, a decrease of EUR 17 million, compared to a net expense of EUR 45million in 2018. The net positive fluctuation in our other operating income and expenses was primarily due to the absence of charges related to fair valuechanges of a legacy IPR fund and lower charges related to divestments of businesses. This was partially offset by a net negative fluctuation in GroupCommon and Other operating income and expenses.
Operating profit/lossOur operating profit in 2019 was EUR 485 million, a change of EUR 544 million, compared to an operating loss of EUR 59 million in 2018. The change inoperating result was primarily due to lower selling, general and administrative expenses, research and development expenses and a net positivefluctuation in other operating income and expenses, partially offset by lower gross profit. Our operating margin in 2019 was 2.1%, compared toapproximately breakeven in 2018.
Financial income and expensesFinancial income and expenses was a net expense of EUR 341 million in 2019, an increase of EUR 28 million, or 9%, compared to a net expense of EUR313 million in 2018. The net negative fluctuation in financial income and expenses was primarily due to an impairment charge related to loans extended toa certain emerging market customer, a recognition of interest expenses on lease liabilities within financial expenses, following the adoption of IFRS 16,Leases, in 2019, as well as an increase in the costs related to the sale of receivables in 2019 compared to 2018. We sell trade receivables to variousfinancial institutions without recourse in the normal course of business, in order to manage our credit risk and working capital cycle. The negativefluctuation was partially offset by income due to a change in the fair value of the financial liability related to Nokia Shanghai Bell, which positively impactedother financial income.
Profit/loss before taxOur profit before tax in 2019 was EUR 156 million, an increase of EUR 516 million compared to a loss of EUR 360 million in 2018.
Income taxIncome taxes was a net expense of EUR 138 million in 2019, a decrease of EUR 51 million compared to a net expense of EUR 189 million in 2018. Thechange in net income taxes was primarily attributable to the deferred tax expense recorded in 2018 resulting from the write-off of certain deferred taxassets, primarily related to foreign withholding tax credits in Finland. This was partially offset by higher income taxes due to increased profitability and ourregional profit mix in 2019 compared to 2018.
Profit/loss attributable to equity holders of the parent and earnings per shareThe profit attributable to equity holders of the parent in 2019 was EUR 14 million, an increase of EUR 568 million, compared to a loss of EUR 554 million in2018. The change in profit attributable to equity holders of the parent was primarily due to the improvement in operating profit, and, to a lesser extent,lower income tax expenses. This was partially offset by a net negative fluctuation in financial income and expenses.
Our EPS from continuing operations in 2019 was EUR 0.00 (basic) and EUR 0.00 (diluted) compared to negative EUR 0.10 (basic) and negative EUR 0.10(diluted) in 2018.

Table of Contents
71
Discontinued operationsDiscontinued operations include the continuing financial effects of the HERE business and the D&S business. The Group sold its HERE digital mappingand location services business to a German automotive industry consortium comprised of AUDI AG, BMW Group and Daimler AG in a transaction thatwas completed on December 4, 2015. The Group sold substantially all of its Devices & Services business to Microsoft in a transaction that was completedon April 25, 2014. The timing and amount of financial effects are largely dependent upon external factors such as final outcomes of uncertain tax positions.Refer to Note 6, Discontinued operations, of our consolidated financial statements included in this Annual Report on Form 20-F.
For the year ended December 31, 2020 compared to the year ended December 31, 2019Discontinued operations loss for the year was EUR 3 million in 2020 compared to a loss of EUR 7 million in 2019. In 2019, the loss for the year includedan addition of EUR 7 million to, and a deduction of EUR 1 million from, gain on the sale related to D&S business and HERE business, respectively, due totax indemnification.
For the year ended December 31, 2019 compared to the year ended December 31, 2018Discontinued operations loss for the year was EUR 7 million in 2019 compared to a profit of EUR 214 million in 2018. In 2019, the loss for the yearincluded an addition of EUR 7 million to and a deduction of EUR 1 million from gain on the sale related to D&S business and HERE business, respectively,due to tax indemnification. Profit for the year in 2018 mostly related to a resolution reached in the tax dispute concerning the applicability of withholding taxin respect of payments by Nokia India Private Limited to Nokia Corporation for the supply of operating software in D&S business as well as a release ofuncertain tax positions related to HERE business.
Results of segmentsIn 2020, we had three reportable segments for financial reporting purposes: (1) Networks, (2) Nokia Software and (3) Nokia Technologies. We also presentcertain segment-level information for Group Common and Other. The amounts presented in this “Results of segments” section for each reportablesegment and Group Common and Other represent the amounts reported to the management. Certain costs and revenue adjustments are not allocated tothe segments for the management reporting purposes. For more information on our operational and reporting structure as well as the reconciliation ofreportable segment measures to those of the Nokia Group, refer to Note 5, Segment information, in the consolidated financial statements included in thisAnnual Report on Form 20-F.
In 2020, we reviewed the presentation of income and expenses related to our restructuring plans, pension plan curtailments and amendments as well ascertain asset impairments. As a result, we reclassified the restructuring and associated charges, pension curtailment and plan amendment income andexpenses as well as certain impairment charges that were previously presented in other operating income and expenses to the functional line items toenhance the relevance of information provided in our consolidated income statement. The comparative amounts for 2019 and 2018 have been reclassifiedaccordingly, however, the change in presentation mostly related to items that are not allocated to segments, and therefore the results of segments werenot affected except for results of Networks for 2018 which have been recast below. For more information, refer to Note 2, Significant accounting policies, inthe consolidated financial statements included in this Annual Report on Form 20-F.
NetworksFor the year ended December 31, 2020 compared to the year ended December 31, 2019The following table sets forth selective line items and the percentage of net sales for the years indicated.
2020 2019 Year-on-yearFor the year ended December 31 EURm % of net sales EURm % of net sales change %
Net sales(1) 16 852 100.0 18 209 100.0 (7)Cost of sales (11 108) (65.9) (12 632) (69.4) (12)Gross profit 5 744 34.1 5 577 30.6 3Research and development expenses (2 908) (17.3) (2 943) (16.2) (1)Selling, general and administrative expenses (1 745) (10.4) (1 929) (10.6) (10)Other operating income and expenses (156) (0.9) (40) (0.2) –Operating profit 935 5.5 665 3.7 41
(1) In 2020, net sales include Mobile Access net sales of EUR 10 630 million, Fixed Access net sales of EUR 1 759 million, IP Routing net sales of EUR 2 768 million and Optical Networks net sales of EUR1 695 million. In 2019, net sales include Mobile Access net sales of EUR 11 655 million, Fixed Access net sales of EUR 1 881 million, IP Routing net sales of EUR 2 921 million and Optical Networks netsales of EUR 1 752 million.
Net salesNetworks net sales in 2020 were EUR 16 852 million, a decrease of EUR 1 357 million, or 7%, compared to EUR 18 209 million in 2019. The decrease inNetworks net sales was primarily due to Mobile Access and, to a lesser extent, IP Routing, Fixed Access and Optical Networks. Mobile Access net saleswere EUR 10 630 million in 2020, a decrease of EUR 1 025 million, or 9%, compared to EUR 11 655 million in 2019. IP Routing net sales were EUR 2 768million in 2020, a decrease of EUR 153 million, or 5%, compared to EUR 2 921 million in 2019. Fixed Access net sales were EUR 1 759 million in 2020, adecrease of EUR 122 million, or 6%, compared to EUR 1 881 million in 2019. Optical Networks net sales were EUR 1 695 million in 2020, a decrease ofEUR 57 million, or 3%, compared to EUR 1 752 million in 2019.
The decrease in Mobile Access net sales was primarily due to network deployment and planning services and legacy radio technologies, partially offset bystrong growth in 5G.
The decrease in IP Routing net sales was in comparison to a particularly strong 2019, which benefited from pent-up demand for some of its newlyintroduced FP4 products.
The decrease in Fixed Access net sales was primarily due to declines in copper access technologies, services and digital home, partially offset by growthin fiber access technologies.
The decrease in Optical Networks net sales was in comparison to a particularly strong 2019 and was also driven by temporary supply chain constraints asa result of COVID-19, which impacted the first half of 2020.

Table of Contents
72
Gross profitNetworks gross profit in 2020 was EUR 5 744 million, an increase of EUR 167 million, or 3%, compared to EUR 5 577 million in 2019. Networks grossmargin in 2020 was 34.1%, compared to 30.6% in 2019. The increase in Networks gross profit was primarily due to Mobile Access, partially offset by IPRouting and Fixed Access. The increase in Mobile Access gross profit was primarily due to higher gross margin, partially offset by lower net sales. Thehigher gross margin in Mobile Access was primarily due to improved 5G gross margin and, to a lesser extent, favorable mix, partially offset by project-related loss provisions. The favorable mix was primarily due to a lower proportion of network deployment net sales. The decrease in both IP Routing andFixed Access gross profit was primarily due to lower net sales. In 2020, annual variable compensation within Networks cost of sales was higher, comparedto 2019.
Operating expensesNetworks research and development expenses were EUR 2 908 million in 2020, a decrease of EUR 35 million, or 1%, compared to EUR 2 943 million in2019. The decrease in Networks research and development expenses was primarily due to Mobile Access, partially offset by Optical Networks. The lowerresearch and development expenses in Mobile Access was primarily due to progress related to Nokia’s cost savings program, partially offset by higherinvestments in 5G R&D to accelerate our product roadmaps and cost competitiveness. The higher research and development expenses in OpticalNetworks was primarily due to increased investments related to our Elenion acquisition. In 2020, annual variable compensation within Networks researchand development expenses was higher, compared to 2019.
Networks selling, general and administrative expenses were EUR 1 745 million in 2020, a decrease of EUR 184 million, or 10%, compared to EUR 1 929million in 2019. The decrease in Networks selling, general and administrative expenses was primarily due to Mobile Access, reflecting continued progressrelated to Nokia’s cost savings program and lower travel and personnel-related expenses due to COVID-19. In 2020, annual variable compensation withinNetworks selling, general and administrative expenses was higher, compared to 2019.
Networks other operating income and expenses was an expense of EUR 156 million in 2020, a change of EUR 116 million compared to an expense ofEUR 40 million in 2019. The change in other operating income and expenses was primarily due to the net effect of loss allowances on certain tradereceivables.
Operating profitNetworks operating profit was EUR 935 million in 2020, an increase of EUR 270 million, or 41%, compared to EUR 665 million in 2019. Networksoperating margin was 5.5% in 2020, compared to 3.7% in 2019. The increase in operating margin was primarily attributable to Mobile Access and, to alesser extent, Fixed Access, partially offset by IP Routing and Optical Networks.
For the year ended December 31, 2019 compared to the year ended December 31, 2018The following table sets forth selective line items and the percentage of net sales for the years indicated.
2019 2018 Year-on-yearFor the year ended December 31 EURm % of net sales EURm % of net sales change %
Net sales(1) 18 209 100.0 17 404 100.0 5Cost of sales(2) (12 632) (69.4) (11 372) (65.3) 11Gross profit(2) 5 577 30.6 6 032 34.7 (8)Research and development expenses(2) (2 943) (16.2) (3 097) (17.8) (5)Selling, general and administrative expenses(2) (1 929) (10.6) (2 142) (12.3) (10)Other operating income and expenses(2) (40) (0.2) (20) (0.1) –Operating profit 665 3.7 773 4.4 (14)
(1) In 2019, net sales include Mobile Access net sales of EUR 11 655 million, Fixed Access net sales of EUR 1 881 million, IP Routing net sales of EUR 2 921 million and Optical Networks net sales ofEUR 1 752 million. In 2018, net sales include Mobile Access net sales of EUR 11 273 million, Fixed Access net sales of EUR 1 980 million, IP Routing net sales of EUR 2 545 million and OpticalNetworks net sales of EUR 1 606 million.
(2) In 2020, the Group reclassified certain items of income and expenses from other operating income and expenses to the functions. The comparative amounts for 2018 have been recast accordingly.Refer to note 2, Significant accounting policies, in the consolidated financial statements included in this Annual Report on Form 20-F.
Net salesNetworks net sales in 2019 were EUR 18 209 million, an increase of EUR 805 million, or 5%, compared to EUR 17 404 million in 2018. The increase inNetworks net sales was primarily due to Mobile Access, IP Routing and, to a lesser extent, Optical Networks, partially offset by Fixed Access. MobileAccess net sales were EUR 11 655 million in 2019, an increase of EUR 382 million, or 3%, compared to EUR 11 273 million in 2018. IP Routing net saleswere EUR 2 921 million in 2019, an increase of EUR 376 million, or 15%, compared to EUR 2 545 million in 2018. Optical Networks net sales were EUR 1752 million in 2019, an increase of EUR 146 million, or 9%, compared to EUR 1 606 million in 2018. Fixed Access net sales were EUR 1 881 million in2019, a decrease of EUR 99 million, or 5%, compared to EUR 1 980 million in 2018.
The increase in Mobile Access net sales was primarily due to 5G radio technologies and network deployment services, partially offset by decreases inlegacy radio technologies.
The increase in IP Routing net sales was primarily driven by our market-leading portfolio, as well as improved supply chain execution.
The increase in Optical Networks net sales was primarily related to our market-leading portfolio.
The decrease in Fixed Access net sales was primarily due to broadband access, digital home and services.
Gross profitNetworks gross profit in 2019 was EUR 5 577 million, a decrease of EUR 455 million, or 8%, compared to EUR 6 032 million in 2018. Networks grossmargin in 2019 was 30.6%, compared to 34.7% in 2018. The decrease in Networks gross profit was primarily due to Mobile Access and, to a lesser extent,Fixed Access, partially offset by IP Routing and Optical Networks. The decrease in Mobile Access gross profit was primarily due to lower gross margin,partially offset by higher net sales. The lower gross margin in Mobile Access was primarily due to relatively high 5G product costs, as well as elevatedlevels of deployment services, consistent with being in the initial phase of 5G. The decrease in Fixed Access gross profit was primarily due to lower grossmargin and lower net sales. The increase in IP Routing gross profit was primarily due to higher net sales and higher gross margin. The increase in OpticalNetworks gross profit was primarily due to higher net sales and higher gross margin. In 2019, Networks gross profit also benefitted from lower incentiveaccruals, compared to 2018.
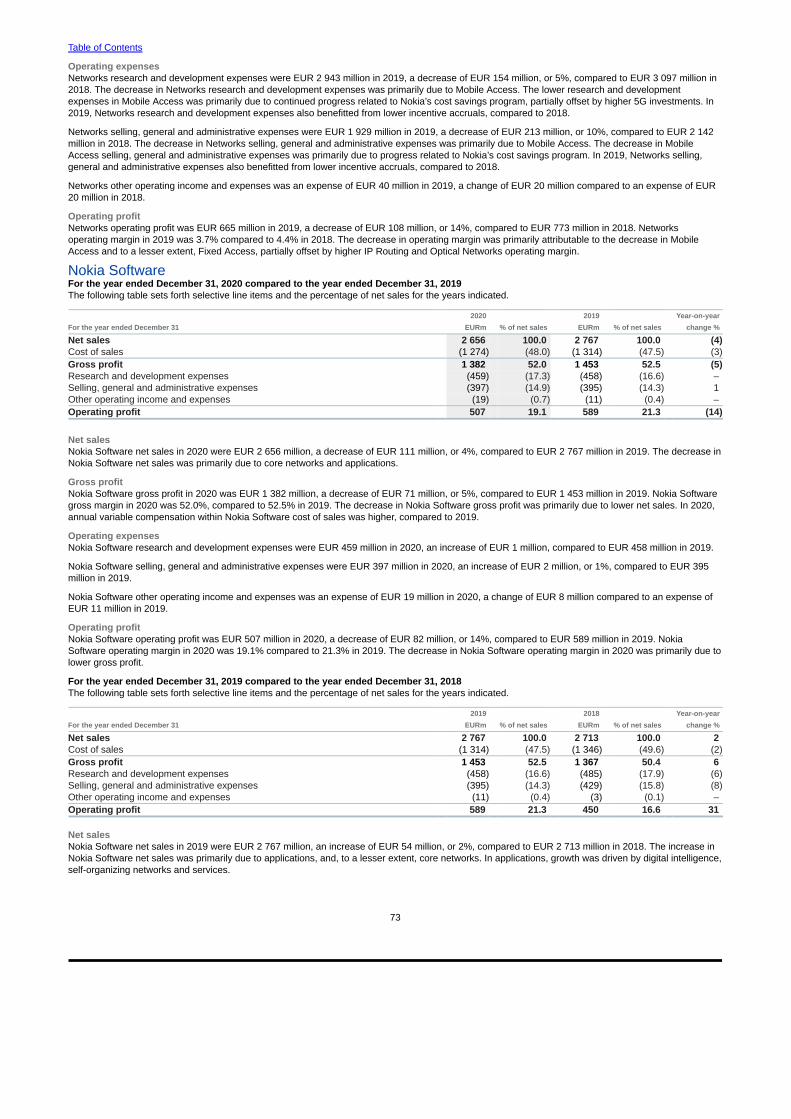
Table of Contents
73
Operating expensesNetworks research and development expenses were EUR 2 943 million in 2019, a decrease of EUR 154 million, or 5%, compared to EUR 3 097 million in2018. The decrease in Networks research and development expenses was primarily due to Mobile Access. The lower research and developmentexpenses in Mobile Access was primarily due to continued progress related to Nokia’s cost savings program, partially offset by higher 5G investments. In2019, Networks research and development expenses also benefitted from lower incentive accruals, compared to 2018.
Networks selling, general and administrative expenses were EUR 1 929 million in 2019, a decrease of EUR 213 million, or 10%, compared to EUR 2 142million in 2018. The decrease in Networks selling, general and administrative expenses was primarily due to Mobile Access. The decrease in MobileAccess selling, general and administrative expenses was primarily due to progress related to Nokia’s cost savings program. In 2019, Networks selling,general and administrative expenses also benefitted from lower incentive accruals, compared to 2018.
Networks other operating income and expenses was an expense of EUR 40 million in 2019, a change of EUR 20 million compared to an expense of EUR20 million in 2018.
Operating profitNetworks operating profit was EUR 665 million in 2019, a decrease of EUR 108 million, or 14%, compared to EUR 773 million in 2018. Networks operating margin in 2019 was 3.7% compared to 4.4% in 2018. The decrease in operating margin was primarily attributable to the decrease in Mobile Access and to a lesser extent, Fixed Access, partially offset by higher IP Routing and Optical Networks operating margin.
Nokia SoftwareFor the year ended December 31, 2020 compared to the year ended December 31, 2019The following table sets forth selective line items and the percentage of net sales for the years indicated.
2020 2019 Year-on-yearFor the year ended December 31 EURm % of net sales EURm % of net sales change %
Net sales 2 656 100.0 2 767 100.0 (4)Cost of sales (1 274) (48.0) (1 314) (47.5) (3)Gross profit 1 382 52.0 1 453 52.5 (5)Research and development expenses (459) (17.3) (458) (16.6) –Selling, general and administrative expenses (397) (14.9) (395) (14.3) 1Other operating income and expenses (19) (0.7) (11) (0.4) –Operating profit 507 19.1 589 21.3 (14)
Net salesNokia Software net sales in 2020 were EUR 2 656 million, a decrease of EUR 111 million, or 4%, compared to EUR 2 767 million in 2019. The decrease inNokia Software net sales was primarily due to core networks and applications.
Gross profitNokia Software gross profit in 2020 was EUR 1 382 million, a decrease of EUR 71 million, or 5%, compared to EUR 1 453 million in 2019. Nokia Softwaregross margin in 2020 was 52.0%, compared to 52.5% in 2019. The decrease in Nokia Software gross profit was primarily due to lower net sales. In 2020,annual variable compensation within Nokia Software cost of sales was higher, compared to 2019.
Operating expensesNokia Software research and development expenses were EUR 459 million in 2020, an increase of EUR 1 million, compared to EUR 458 million in 2019.
Nokia Software selling, general and administrative expenses were EUR 397 million in 2020, an increase of EUR 2 million, or 1%, compared to EUR 395million in 2019.
Nokia Software other operating income and expenses was an expense of EUR 19 million in 2020, a change of EUR 8 million compared to an expense ofEUR 11 million in 2019.
Operating profitNokia Software operating profit was EUR 507 million in 2020, a decrease of EUR 82 million, or 14%, compared to EUR 589 million in 2019. NokiaSoftware operating margin in 2020 was 19.1% compared to 21.3% in 2019. The decrease in Nokia Software operating margin in 2020 was primarily due tolower gross profit.
For the year ended December 31, 2019 compared to the year ended December 31, 2018The following table sets forth selective line items and the percentage of net sales for the years indicated.
2019 2018 Year-on-yearFor the year ended December 31 EURm % of net sales EURm % of net sales change %
Net sales 2 767 100.0 2 713 100.0 2Cost of sales (1 314) (47.5) (1 346) (49.6) (2)Gross profit 1 453 52.5 1 367 50.4 6Research and development expenses (458) (16.6) (485) (17.9) (6)Selling, general and administrative expenses (395) (14.3) (429) (15.8) (8)Other operating income and expenses (11) (0.4) (3) (0.1) –Operating profit 589 21.3 450 16.6 31
Net salesNokia Software net sales in 2019 were EUR 2 767 million, an increase of EUR 54 million, or 2%, compared to EUR 2 713 million in 2018. The increase inNokia Software net sales was primarily due to applications, and, to a lesser extent, core networks. In applications, growth was driven by digital intelligence,self-organizing networks and services.

Table of Contents
74
Gross profitNokia Software gross profit in 2019 was EUR 1 453 million, an increase of EUR 86 million, or 6%, compared to EUR 1 367 million in 2018. Nokia Softwaregross margin in 2019 was 52.5%, compared to 50.4% in 2018. The increase in Nokia Software gross profit was primarily due to higher net sales inapplications, higher gross margin and higher net sales in core networks, as well as lower incentive accruals in 2019, compared to 2018.
Operating expensesNokia Software research and development expenses were EUR 458 million in 2019, a decrease of EUR 27 million, or 6%, compared to EUR 485 million in2018. The decrease in Nokia Software research and development expenses was primarily due to an increase in R&D productivity achieved through ourinvestments in a Common Software Foundation and the further optimization of resources, as well as lower incentive accruals in 2019, compared to 2018.
Nokia Software selling, general and administrative expenses were EUR 395 million in 2019, a decrease of EUR 34 million, or 8%, compared to EUR 429million in 2018. The decrease in Nokia Software selling, general and administrative expenses was primarily due to the integration and streamlining of corenetworks into our existing specialized software salesforce, as well as lower incentive accruals in 2019, compared to 2018.
Nokia Software other operating income and expenses was an expense of EUR 11 million in 2019, a change of EUR 8 million compared to an expense ofEUR 3 million in 2018.
Operating profitNokia Software operating profit was EUR 589 million in 2019, an increase of EUR 139 million, or 31%, compared to EUR 450 million in 2018. NokiaSoftware operating margin in 2019 was 21.3% compared to 16.6% in 2018. The increase in Nokia Software operating margin in 2019 was primarily due tohigher gross profit, as well as lower research and development and selling, general and administrative expenses.
Nokia TechnologiesFor the year ended December 31, 2020 compared to the year ended December 31, 2019The following table sets forth selective line items and the percentage of net sales for the years indicated.
2020 2019 Year‑on‑yearFor the year ended December 31 EURm % of net sales EURm % of net sales change %
Net sales 1 402 100.0 1 487 100.0 (6)Cost of sales (9) (0.6) (28) (1.9) (68)Gross profit 1 393 99.4 1 459 98.1 (5)Research and development expenses (149) (10.6) (111) (7.5) 34Selling, general and administrative expenses (81) (5.8) (101) (6.8) (20)Other operating income and expenses 1 0.1 (8) (0.5) –Operating profit 1 164 83.0 1 239 83.3 (6)
Net salesNokia Technologies net sales in 2020 were EUR 1 402 million, a decrease of EUR 85 million, or 6%, compared to EUR 1 487 million in 2019. Thedecrease in Nokia Technologies net sales was primarily due to lower brand licensing net sales and lower catch-up net sales.
Gross profitNokia Technologies gross profit in 2020 was EUR 1 393 million, a decrease of EUR 66 million, or 5%, compared to EUR 1 459 million in 2019. The lowergross profit in Nokia Technologies was primarily due to lower net sales, partially offset by higher gross margin. The higher gross margin reflects costsassociated with a one-time sale of patent assets that negatively impacted 2019.
Operating expensesNokia Technologies research and development expenses in 2020 were EUR 149 million, an increase of EUR 38 million, or 34%, compared to EUR 111million in 2019. The increase in Nokia Technologies research and development expenses was primarily due to higher investments to drive creation ofintellectual property and higher costs to maintain our patent portfolio.
Nokia Technologies selling, general and administrative expenses in 2020 were EUR 81 million, a decrease of EUR 20 million, or 20%, compared to EUR101 million in 2019. The decrease in Nokia Technologies selling, general and administrative expenses was primarily due to lower licensing-related costs.
Nokia Technologies other operating income and expenses in 2020 was a net income of EUR 1 million, a change of EUR 9 million compared to a netexpense of EUR 8 million in 2019.
Operating profitNokia Technologies operating profit in 2020 was EUR 1 164 million, a decrease of EUR 75 million, or 6%, compared to an operating profit of EUR 1 239million in 2019. The decrease in Nokia Technologies operating profit was primarily due to lower gross profit and higher research and developmentexpenses, partially offset by lower selling, general and administrative expenses and a net positive fluctuation in other operating income and expenses.Nokia Technologies operating margin in 2020 was 83.0% compared to 83.3% in 2019.
For the year ended December 31, 2019 compared to the year ended December 31, 2018The following table sets forth selective line items and the percentage of net sales for the years indicated.
2019 2018 Year‑on‑yearFor the year ended December 31 EURm % of net sales EURm % of net sales change %
Net sales 1 487 100.0 1 501 100.0 (1)Cost of sales (28) (1.9) (22) (1.5) 27Gross profit 1 459 98.1 1 479 98.5 (1)Research and development expenses (111) (7.5) (145) (9.7) (23)Selling, general and administrative expenses (101) (6.8) (127) (8.5) (20)Other operating income and expenses (8) (0.5) (4) (0.3) –Operating profit 1 239 83.3 1 203 80.1 3

Table of Contents
75
Net salesNokia Technologies net sales in 2019 were EUR 1 487 million, a decrease of EUR 14 million, or 1%, compared to EUR 1 501 million in 2018. In 2019, theEUR 1 487 million of net sales related entirely to patent and brand licensing. In 2018, EUR 1 476 million of net sales related to patent and brand licensingand EUR 25 million of net sales related to digital health and digital media. The decrease in Nokia Technologies net sales was primarily due to the sale ofour digital health business in 2018, partially offset by higher one-time catch-up net sales related to a new license agreement and the sale of certainpatents.
Gross profitNokia Technologies gross profit in 2019 was EUR 1 459 million, a decrease of EUR 20 million, or 1%, compared to EUR 1 479 million in 2018. The lowergross profit in Nokia Technologies was primarily due to lower net sales and lower gross margin. The lower gross margin reflects costs associated with aone-time sale of patent assets, partially offset by the absence of costs related to digital health, following the sale of our digital health business in 2018.
Operating expensesNokia Technologies research and development expenses in 2019 were EUR 111 million, a decrease of EUR 34 million, or 23%, compared to EUR 145million in 2018. The decrease in Nokia Technologies research and development expenses was primarily due to the absence of costs related to digitalhealth, following the sale of our digital health business in 2018, as well as lower patent portfolio costs.
Nokia Technologies selling, general and administrative expenses in 2019 were EUR 101 million, a decrease of EUR 26 million, or 20%, compared to EUR127 million in 2018. The decrease in Nokia Technologies selling, general and administrative expenses was primarily due to the absence of costs related todigital health, following the sale of our digital health business in 2018, lower licensing-related litigation costs and lower business support costs.
Nokia Technologies other operating income and expenses in 2019 was a net expense of EUR 8 million, a change of EUR 4 million compared to a netexpense of EUR 4 million in 2018.
Operating profitNokia Technologies operating profit in 2019 was EUR 1 239 million, an increase of EUR 36 million, or 3%, compared to an operating profit of EUR 1 203million in 2018. The increase in Nokia Technologies operating profit was primarily due to lower research and development and selling, general andadministrative and expenses, partially offset by lower gross profit. Nokia Technologies operating margin in 2019 was 83.3% compared to 80.1% in 2018.
Group Common and OtherFor the year ended December 31, 2020 compared to the year ended December 31, 2019The following table sets forth selective line items and the percentage of net sales for the years indicated.
2020 2019 Year‑on‑yearFor the year ended December 31 EURm % of net sales EURm % of net sales change %
Net sales 982 100.0 952 100.0 3Cost of sales (992) (101.0) (918) (96.4) 8Gross profit (10) (1.0) 34 3.6 –Research and development expenses (301) (30.7) (312) (32.8) (4)Selling, general and administrative expenses (266) (27.1) (269) (28.3) (1)Other operating income and expenses 52 5.3 57 6.0 –Operating loss (525) (53.5) (490) (51.5) 7
Net salesGroup Common and Other net sales in 2020 were EUR 982 million, an increase of EUR 30 million, or 3%, compared to EUR 952 million in 2019. Theincrease in Group Common and Other net sales was primarily due to Alcatel Submarine Networks, partially offset by Radio Frequency Systems.
Gross profitGroup Common and Other gross profit in 2020 was negative EUR 10 million, a decrease of EUR 44 million, compared to positive EUR 34 million in 2019.The lower gross profit was primarily due to lower gross margin in Alcatel Submarine Networks. Group Common and Other gross margin in 2020 wasnegative 1.0% compared to positive 3.6% in 2019.
Operating expensesGroup Common and Other research and development expenses in 2020 were EUR 301 million, a decrease of EUR 11 million, or 4%, compared to EUR312 million in 2019.
Group Common and Other selling, general and administrative expenses in 2020 were EUR 266 million, a decrease of EUR 3 million, or 1%, compared toEUR 269 million in 2019.
Group Common and Other other operating income and expense in 2020 was a net income of EUR 52 million, a change of EUR 5 million compared to anet income of EUR 57 million in 2019.
Operating lossGroup Common and Other operating loss in 2020 was EUR 525 million, an increase of EUR 35 million, compared to an operating loss of EUR 490 million in 2019. The change in Group Common and Other operating loss was primarily attributable to lower gross profit, partially offset by lower research and development expenses.

Table of Contents
76
For the year ended December 31, 2019 compared to the year ended December 31, 2018The following table sets forth selective line items for the years indicated.
2019 2018 Year‑on‑yearFor the year ended December 31 EURm % of net sales EURm % of net sales change %
Net sales 952 100.0 1 025 100.0 (7)Cost of sales (918) (96.4) (871) (85.0) 5Gross profit 34 3.6 154 15.0 (78)Research and development expenses (312) (32.8) (293) (28.6) 6Selling, general and administrative expenses (269) (28.3) (200) (19.5) 35Other operating income and expenses 57 6.0 93 9.1 –Operating loss (490) (51.5) (246) (24.0) 99
Net salesGroup Common and Other net sales in 2019 were EUR 952 million, a decrease of EUR 73 million, or 7%, compared to EUR 1 025 million in 2018. Thedecrease in Group Common and Other net sales was primarily due to Radio Frequency Systems, partially offset by Alcatel Submarine Networks.
Gross profitGroup Common and Other gross profit in 2019 was EUR 34 million, a decrease of EUR 120 million, or 78%, compared to EUR 154 million in 2018. Thelower gross profit was primarily due to Radio Frequency Systems, Alcatel Submarine Networks, as well as investments to drive digitalization of internalprocesses. Group Common and Other gross margin in 2019 was 3.6% compared to 15.0% in 2018.
Operating expensesGroup Common and Other research and development expenses in 2019 were EUR 312 million, an increase of EUR 19 million, or 6%, compared to EUR293 million in 2018. The increase in Group Common and Other research and development expenses was primarily due to investments to drivedigitalization of internal processes, partially offset by lower incentive accruals in 2019, compared to 2018.
Group Common and Other selling, general and administrative expenses in 2019 were EUR 269 million, an increase of EUR 69 million, or 35%, comparedto EUR 200 million in 2018. The increase in Group Common and Other selling, general and administrative expenses was primarily due to investments todrive digitalization of internal processes, partially offset by lower incentive accruals in 2019, compared to 2018.
Group Common and Other other operating income and expense in 2019 was a net income of EUR 57 million, a change of EUR 36 million compared to anet income of EUR 93 million in 2018. The net negative fluctuation in other operating income and expenses was primarily due to lower gains in venturefund investments.
Operating lossGroup Common and Other operating loss in 2019 was EUR 490 million, an increase of EUR 244 million, compared to an operating loss of EUR 246 millionin 2018. The change in Group Common and Other operating loss was primarily attributable to lower gross profit, higher selling, general and administrativeexpenses, a negative fluctuation in other operating income and expense, and higher research and development expenses.
Liquidity and capital resourcesFinancial positionAs of December 31, 2020, our total cash and current financial investments (defined as cash and cash equivalents and current financial investments)equaled EUR 8 061 million, an increase of EUR 2 054 million, compared to EUR 6 007 million as of December 31, 2019. The increase was primarilyattributable to net cash inflow from operating activities of EUR 1 759 million and proceeds from long-term borrowings of EUR 1 595 million, partially offsetby capital expenditure of EUR 479 million, repayment of long-term borrowings of EUR 246 million, and payment of principal portion of lease liabilities ofEUR 234 million. As of December 31, 2018, our total cash and current financial investments equaled EUR 6 873 million.
As of December 31, 2020, our net cash and current financial investments (defined as total cash and current financial investments less long-term and short-term interest-bearing liabilities) equaled EUR 2 485 million, an increase of EUR 755 million, compared to EUR 1 730 million as of December 31, 2019. Theincrease was mainly attributable to net cash inflow from operating activities of EUR 1 759 million, partially offset by capital expenditure of EUR 479 million,and payment of the principal portion of the lease liabilities of EUR 234 million. As of December 31, 2018, our net cash and current financial investmentsequaled EUR 3 053 million.
As of December 31, 2020, our cash and cash equivalents equaled EUR 6 940 million, an increase of EUR 1 030 million compared to EUR 5 910 million asof December 31, 2019. As of December 31, 2018, our cash and cash equivalents equaled EUR 6 261 million.
Cash flow2020Our cash inflow from operating activities in 2020 was EUR 1 759 million, an increase of EUR 1 369 million compared to a cash inflow of EUR 390 million in2019. The increase was primarily attributable to a decrease in cash tied-up to net working capital of EUR 710 million in 2020 compared to EUR 1 788million cash tied-up in 2019, and net profit, adjusted for non-cash items, of EUR 2 751 million, an increase of EUR 113 million compared to EUR 2 638million in 2019. The primary driver for the decrease in net working capital tied-up was related to a decrease in liabilities of EUR 845 million compared to adecrease of EUR 2 232 million in 2019, and a decrease in inventories of EUR 553 million compared to a decrease of EUR 285 million in 2019. Thedecrease in liabilities was primarily attributable to a decrease in trade payables, driven by lower inventory levels, a decrease in deferred revenue andrestructuring and associated cash outflows, partially offset by an increase in provisions and an increase in liabilities related to employee benefits. Thedecrease in inventories was attributable to improved inventory management and temporary dynamics related to COVID-19. In 2020, the increase inreceivables was EUR 418 million compared to a decrease of EUR 159 million in 2019.
In 2020, cash inflow from operating activities included paid taxes of EUR 280 million, a decrease of EUR 236 million compared to EUR 516 million in 2019;interest received of EUR 33 million compared to EUR 57 million in 2019; and interest paid of EUR 35 million, compared to EUR 1 million in 2019.

Table of Contents
77
The cash outflow from investing activities equaled EUR 1 517 million in 2020, an increase of EUR 1 350 million compared to EUR 167 million cash outflowin 2019. Cash outflow from investing activities was primarily driven by cash outflow of EUR 1 154 million due to purchase of current financial investmentsin 2020, compared to EUR 473 million in 2019, and cash outflow due to the capital expenditure of EUR 479 millionin 2020 compared to EUR 690 million in2019.
Major items of capital expenditure in 2020 included investments in R&D equipment, test equipment, hardware for telecommunication and cloudenvironment, plants, buildings and construction for transformation projects, and repair or improvements of sites.
In 2020, our cash inflow from financing activities was EUR 883 million, compared to EUR 479 million cash used in 2019. The cash inflow was primarilydriven by cash inflow from long-term borrowings of EUR 1 349 million, partially offset by paid dividends of EUR 148 million, paid by subsidiaries of theGroup to non-controlling interest, compared to EUR 570 million in 2019, primarily relating to dividends to equity holders of the parent. The payments of theprincipal portion of lease liabilities were EUR 234 million in 2020 compared to EUR 221 million in 2019.
2019Our cash inflow from operating activities in 2019 was EUR 390 million, an increase of EUR 30 million compared to a cash inflow of EUR 360 million in2018. The increase was primarily attributable to net profit, adjusted for non-cash items, of EUR 2 638 million, an increase of EUR 880 million compared toEUR 1 758 million in 2018, partially offset by EUR 1 788 million cash tied-up to net working capital in 2019 compared to EUR 943 million cash tied-up in2018. The primary driver for the increase in net working capital tied-up was related to a decrease in liabilities of EUR 2 232 million compared to a decreaseof EUR 645 million in 2018, and a decrease in inventories of EUR 285 million compared to an increase of EUR 544 million in 2018. The decrease inliabilities was primarily attributable to a decrease in trade payables, restructuring and associated cash outflows, a decrease in liabilities related toemployee benefits and a decrease in deferred revenue. The decrease in inventories was attributable to improved inventory management. The decrease inreceivables was EUR 159 million compared to a decrease of EUR 246 million in 2018.
In 2019, cash flow from operating activities included paid taxes of EUR 516 million, an increase of EUR 152 million compared to EUR 364 million in 2018;interest received of EUR 57 million, a decrease of EUR 11 million compared to EUR 68 million in 2018; and interest paid of EUR 1 million, a decrease ofEUR 158 million compared to EUR 159 million in 2018.
The cash outflow from investing activities equaled EUR 167 million in 2019, a decrease of EUR 148 million compared to EUR 315 million cash outflow in2018. Cash outflow from investing activities was primarily driven by cash outflow due to the capital expenditure of EUR 690 million partially offset by netcash inflow of EUR 518 million resulting from proceeds from maturities and sale of current financial investments of EUR 991 million and purchase ofcurrent financial investments of EUR 473 million.
Major items of capital expenditure in 2019 included investments in R&D equipment, test equipment, hardware for telecommunication and cloudenvironment, plants, buildings and construction for transformation projects, and repair or improvements of sites.
In 2019, our cash outflow from financing activities was EUR 479 million a decrease of EUR 490 million in comparison to EUR 969 million cash outflow in2018. The decrease in cash outflow was primarily driven by paid dividends of EUR 570 million compared to EUR 1 081 million in 2018, partially offset bynet cash from long-term borrowings of 273 million and by payments of the principal portion of lease liabilities of EUR 221 million.
Financial assets and debtAs of December 31, 2020, our net cash and current financial investments equaled EUR 2 485 million consisting of EUR 8 061 million in total cash andcurrent financial investments, and EUR 5 576 million of long-term and short-term interest-bearing liabilities.
We hold our total cash and current financial investments predominantly in euro. Our current financial investments mainly include high-quality moneymarket and fixed income instruments with strict maturity limits. We also have a EUR 1 500 million revolving credit facility available for liquidity purposes.The facility has no financial covenants and remains undrawn.
As of December 31, 2020, our interest-bearing liabilities consisted of EUR 350 million notes due in 2021, USD 500 million notes due in 2022, EUR 750million notes due in 2024, EUR 500 million notes due in 2025, a EUR 500 million R&D loan from the European Investment Bank maturing in 2025, a EUR250 million R&D loan from the Nordic Investment Bank with final maturity in 2025, EUR 750 million notes due in 2026, USD 500 million notes due in 2027,EUR 500 million notes due in 2028, USD 74 million notes due in 2028, USD 206 million notes due in 2029, USD 500 million notes due in 2039, and EUR322 million of other liabilities. The EUR notes maturing in 2021, 2024, 2025, 2026, and 2028 as well as the USD notes maturing in 2022, 2027, and 2039are issued by Nokia Corporation, while the USD notes maturing in 2028 and 2029 are issued by Lucent Technologies Inc., a predecessor to Nokia ofAmerica Corporation (Nokia’s wholly-owned subsidiary, formerly known as Alcatel-Lucent USA Inc.). The loans from the Nordic Investment Bank and fromthe European Investment Bank are drawn by Nokia Corporation. Refer to Note 23, Interest-bearing liabilities, of our consolidated financial statementsincluded in this Annual Report on Form-20 for further information regarding our interest-bearing liabilities.
In February 2020, we drew a EUR 500 million R&D loan from the European Investment Bank. The loan facility agreement was signed in August 2018 andthe loan will mature in February 2025.
In May 2020, we executed capital markets transactions, including issuances of EUR 500 million notes due in 2025 and EUR 500 million notes due in 2028and, pursuant to a cash tender offer, a purchase of EUR 150 million of notes due in 2021. The notes were issued under our EUR 5 billion Euro Medium-Term Note Programme.
In June 2020, we exercised our option to extend the maturity date of the EUR 1 500 million revolving credit facility. Subsequent to the extension, EUR 1412 million of the facility has its maturity in June 2025 with a one-year extension option remaining, and EUR 88 million of the facility has its maturity inJune 2024.
We consider that with EUR 8 061 million of total cash and current financial investments, and with our undrawn revolving credit facility, we have sufficientfunds to satisfy our future working capital needs, capital expenditure, R&D investments, structured finance, venture fund commitments, acquisitions anddebt service requirements, at least through 2021. We further consider that with our current credit ratings of BB+ by Standard & Poor’s, Ba2 by Moody’s,and BBB- by Fitch, we have access to the capital markets should any funding needs arise in 2021.
We aim to re-establish investment grade credit ratings.

Table of Contents
78
Off-balance sheet arrangementsThere are no material off-balance sheet arrangements that have, or are reasonably likely to have, a current or future effect on our financial condition,revenues or expenses, results of operations, liquidity, capital expenditures or capital resources that are material to investors, except for the purchaseobligations and lease commitments, as well as guarantees and financing commitments disclosed in Note 30, Commitments, contingencies and legalproceedings, and in Note 36, Financial risk management, of our consolidated financial statements included in this Annual Report on Form 20-F.
Venture fund investments and commitmentsWe make financing commitments to a number of unlisted venture funds that make technology-related investments. The majority of the investments aremanaged by NGP Capital, a global venture capital firm backing companies that are creating the connected world through sensors, 5G mobile, hybrid cloudand intelligent technology.
As of December 31, 2020, our venture fund investments equaled EUR 745 million, compared to EUR 740 million as of December 31, 2019. Refer to Note24, Fair value of financial instruments, and Note 36, Financial risk management, of our consolidated financial statements included in this Annual Report onForm 20-F for further information regarding fair value of our venture fund investments.
As of December 31, 2020, our venture fund commitments equaled EUR 189 million, compared to EUR 244 million as of December 31, 2019. As a limitedpartner in venture funds, we are committed to capital contributions and entitled to cash distributions according to the respective partnership agreementsand underlying fund activities. Refer to Note 30, Commitments, contingencies and legal proceedings, of our consolidated financial statements included inthis Annual Report on Form 20-F for further information regarding commitments and contingencies.
Treasury policyTreasury activities are governed by the Nokia Treasury Policy approved by the President and CEO and supplemented by operating procedures approvedby the CFO, covering specific areas such as foreign exchange risk, interest rate risk, credit risk and liquidity risk. The objective of treasury’s liquidity andcapital structure management activities is to ensure that we have sufficient liquidity to go through unfavorable periods without being severely constrainedby the availability of funds to execute Nokia’s business plans and implement Nokia’s long-term business strategy. We are risk-averse in our treasuryactivities.
Foreign exchange impactWe are a company with global operations and net sales derived from various countries, invoiced in various currencies. Therefore, our business and resultsfrom operations are exposed to changes in exchange rates between the euro, our reporting currency, and other currencies, such as the US dollar and theChinese yuan. The magnitude of foreign exchange exposures changes over time as a function of our net sales and costs in different markets, as well asthe prevalent currencies used for transactions in those markets. Significant changes in exchange rates may also impact our competitive position andrelated price pressures through their impact on our competitors.
To mitigate the impact of changes in exchange rates on our results, we hedge material net foreign exchange exposures (net sales less costs in a currency)typically with a hedging horizon of approximately 12 months. For the majority of these hedges, hedge accounting is applied to reduce income statementvolatility.
In 2020, approximately 25% of Group net sales and total costs were denominated in euro, and approximately 50% of Group net sales and total costs weredenominated in US dollars. In 2020, approximately 5% of Group net sales and total costs were denominated in Chinese yuan.
The average currency mix for Group net sales and total costs:
2020 2019
Currency Net sales Total costs Net sales Total costs
EUR ~25 % ~25 % ~25 % ~25 %USD ~50 % ~50 % ~50 % ~45 %CNY ~5 % ~5 % ~5 % ~10 %Other ~20 % ~20 % ~20 % ~20 %Total ~100 % ~100 % ~100 % ~100 %
For the full year 2020 compared to the previous year, the US dollar was weaker against the euro. The weaker US dollar in 2020 on a year-on-year basishad a negative impact on our net sales reported in euros. However, the weaker US dollar also contributed to slightly lower costs of sales and operatingexpenses on a year-on-year basis. In total, before hedging, the weaker US dollar on a year-on-year basis had a slightly negative effect on our operatingprofit in 2020.
During 2020, the Chinese yuan depreciated against the euro on a year-on-year basis and this had a slightly negative impact on our net sales reported ineuros. However, the weaker Chinese yuan also contributed to slightly lower cost of sales and operating expenses on a year-on-year basis. In total, beforehedging, the slightly weaker Chinese yuan on a year-on-year basis had an approximately neutral impact on our operating profit in 2020.
For a discussion of the instruments used by us in connection with our hedging activities, refer to Note 36, Financial risk management, of our consolidatedfinancial statements included in this Annual Report on Form 20-F. Refer also to “Operating and financial review and prospects – Risk factors”.

Table of Contents
79
Our response to COVID-19The COVID-19 pandemic changed the world in ways we didn’t anticipate or expect. Together, we faced a once-in-a-generation struggle that called governments, regulators, businesses, NGOs, groups and individuals to doeverything they could to keep themselves and communities safe, and economies resilient and connected. In thissection we focus on the impact of COVID-19 on our employees, communities and the industry. For the impact ofCOVID-19 on our operations and financial performance, refer to “Operating and financial review” section.
The health of our employees and their families is our first priorityThe pandemic is of course first and foremost a health emergency. While Nokia was in a strong position to support the vital networks that enabled the worldto keep working, learning and communicating, protecting the health of our employees and their families was our highest priority.
We took, and continue to take, several measures to protect our employees, their families, and our customers while keeping our work and networks going.We provide more details about this in the “Sustainability and corporate responsibility” section.
As the pandemic spread, internet traffic surgedThe pandemic had a fundamental impact on network traffic volumes. As people started spending more time at home, working, watching TV, and gaming, itput an unexpected strain on networks around the world.
In 2020, global internet traffic and traffic in service provider networks experienced a year's worth of growth in just a few weeks. Statistics show:
◾30–50% increase in network traffic;
◾50–100% increase in video streaming traffic;
◾350% increase in videoconferencing traffic;
◾100–150% increase in gaming traffic; and
◾40–50% increase in Distributed Denial of Service (DDoS) traffic that renders websites or online services inoperable.
Over time, networks became more critical in all aspects of life. The virtually uninterrupted network performance during the pandemic’s early days was atestament to the performance and resilience of service provider networks around the world.
We enabled networks to stay onlineThe unwavering commitment of Nokia team members and the extraordinary efforts of all our customers – service providers, webscales and large digitalenterprises – were key for keeping networks running and people online.
Almost all business decisions in 2020 were affected by the pandemic to some degree, but some deployments were more directly COVID-19 influenced. Inthe earliest days of 2020, our team assisted in opening the first 5G base station at one of the key epidemic hospitals in Wuhan in just two days. In ruralCalifornia, we met a customer’s goal of providing a wireless solution that can deliver high-speed broadband to people who did not have access previouslyand address traffic needs driven by COVID-19. In Pennsylvania, we enabled a large medical center to connect ventilators and inpatient beds for real-timepatient monitoring. In India, we completed the world’s largest Dynamic Spectrum Refarming deployment to improve network coverage and enhanceconnectivity to meet growing data demand driven by COVID-19. In Algeria, we implemented ultra-high network capacity technology to meet growingmobile traffic demand. In Sri Lanka and the Philippines, we deployed next generation fiber networks to bring ultra-fast broadband access to homes duringthe unprecedented events of 2020. And in Chile, the pandemic has increased the value of our IMPACT Connected Device Platform, which enables remotemanagement of networks and IoT devices.
Beyond our existing portfolio, we applied our technical expertise to create new ways of connecting and working to ease the strain of the pandemic. Wecreated a camera that takes the temperature of 20 people every 30 milliseconds and incorporated it into a solution that allows real-time health monitoringand tracking, providing organizations with an automated, simple and scalable approach to identify COVID-19 symptoms and monitor mask compliance forfacilities with thousands of people.
We introduced artificial intelligence technology to optimize our supply chain. This enabled our customers to receive their orders in the shortest amount oftime and keep local households online and connected.
Re-establishing the new normalBy September, traffic levels settled down to 20–30% above the pre-pandemic level, albeit with expected seasonal growth. We believe that these elevatedtraffic levels could be the "new normal" for the near future. Many believe that the level of usage seen in 2020 was an acceleration of trends alreadyunderway before the pandemic.
Having experienced a once-in-a-lifetime pandemic, all operators are in a position to reconsider past assumptions and take a fresh look at their futureinvestment strategies. We have captured additional insight into the global 2020 network usage and how service providers can effectively prepare for thenew normal in the Nokia Deepfield Network Intelligence Report 2020.

Table of Contents
80
Working together to fight the pandemic around the world
Nokia team members came together in myriad ways to provide support to those directly affected by the pandemic:
One example was our US-based “Apart Together” campaign that sold t-shirts to raise funds.
In Finland, we participated in the “lunch for children” campaign and donated goods to local organizations to ensure quality food was available tounderprivileged families.
Across India, we worked to provide food to those most in need in local communities.
In Belgium and Greece, we 3-D printed special touch-free door handles for the office doors to help fight the virus’ spread.
In Hungary, we donated laptops to foundations and developed a help-desk to support local schools and remote education. We also organized trainingfor parents working from home with children.
In Ireland, we 3-D printed and donated mask strips.
In Romania, we 3-D printed and donated face shields.
In Singapore, we helped improve internet connectivity for dormitories and community care facilities to ensure that they stay connected with robust andstable internet access.
All Nokia colleagues were encouraged to vote for how the Nokia Coronavirus Global Donation Fund of USD 500 000 should be shared in theirrespective regions.
Sustainability and corporate responsibilityWe believe the positive impact of the technology we create and deliver far outweighs the potential negative impacts and provides our greatest positivecontribution to the United Nations Sustainable Development Goals (SDGs). Communications technologies provide access to better healthcare, educationand greater economic opportunity, enable more efficient industrial, agricultural and resource use, and contribute to a more equitable, secure society, and acleaner, safer planet.
Our products and solutions are designed to drive social, environmental, and economic progress. Furthermore, we continue to develop processes, policiesand programs that align with globally recognized ethical and responsible business practices and frameworks.
Sustainability governanceSustainability issues are reviewed by the Board of Directors as part of an annual sustainability review, which includes a review of the sustainabilitystrategy, key targets and actions, and performance. Nokia Group Leadership Team and its members are responsible for the management andimplementation of sustainability-related activities within their individual organizations when relevant to their responsibility area. In 2020, the ChiefMarketing Officer had overall responsibility for sustainability in the Group Leadership Team.
The alignment of sustainability strategy, priorities, and the implementation of sustainability activities across Nokia is steered by our Sustainability Council.The Council consists of senior leaders, including management representatives with climate-related responsibilities, from units such as productdevelopment, real estate, and procurement. Responsibilities of the Council include the assessment and monitoring of climate-related topics, review of themateriality, targets and overall performance of various sustainability-related matters and giving additional exposure to sustainability risks and opportunities.In 2020, the Council was managed by our Head of Sustainability who reported to the Chief Marketing Officer. The Council typically meets bi-annually, andmore frequently upon request. Day-to-day sustainability issues and activities are orchestrated by a dedicated corporate team and subject matter experts indifferent functions. Sustainability-related actions and programs all have their named responsible owners.
Risk managementSustainability risks are part of our Enterprise Risk Management framework with multi-disciplinary company-wide risk identification, assessment, andmanagement processes. We recognize and aim to mitigate the potential risks and negative impacts associated with our business whether related totechnology, supply chain, climate or people, while also driving the opportunities within and beyond our business in order to contribute to achieving theSDGs. Our Code of Conduct defines our way of working and we have clear policies and processes for each identified material sustainability risk.
The main features of our risk management systems are described as part of our Corporate governance statement (see Corporate Governance—Riskmanagement, internal control and internal audit functions at Nokia). In addition, the “Risk factors” section of this Annual Report on Form 20-F providesdiscussion on the most important risk factors affecting our operations. These risks include sustainability-related threats such as: risks related to productsafety, environmental accidents, health and privacy and security, including cybersecurity threats; risk of potential human rights abuse through misuse ofthe technology we provide; risk of potential lack of proper respect for human rights, fair labor conditions, the environment and communities in ouroperations and supply chains; risk of non-compliance with regulations or our supplier and customer requirements; violation of ethical standards, includingour Code of Conduct; labor unrest and strikes; inability to retain, motivate, develop and recruit appropriately skilled employees; purchasing boycotts andpublic harm to our brand; risks related to issues with tariffs and taxation, including tax disputes; and disruptions in our manufacturing, service creation,delivery, logistics or supply chain caused, for instance, by natural disasters, military actions, civil unrest, public health and safety threats (including diseaseoutbreaks), many of which may be fueled by the adverse effects resulting from climate change.

Table of Contents
81
Strategy and targetsAt the core of our sustainability approach is the belief that the purpose of technology is to improve people’s lives. During 2020, we launched our newsustainability strategic approach, which is focused on the areas we believe will have the greatest impact on sustainable development and our business.Although we need to be agile with our sustainability approach, we have identified three main cornerstones through which we can truly improve people’slives with technology and on which we need to focus to maintain our leading position in industry sustainability: climate, integrity and culture.
In terms of the fundamental necessities of responsible business, we also need to ensure we continuously develop our existing sustainability-relatedhousekeeping practices to create value and comply with stakeholder requests, legal requirements, customer expectations and increased demand forefficiency and transparency. The housekeeping practices provide a solid foundation to our sustainable development as a company, including areas suchas: operational environmental management and circularity; health and safety; labor practices in our own operations; responsible sourcing; and preventingthe misuse of technology.
In 2020, we had 20 short- and long-term sustainability targets. The key targets are listed in the table. Other targets are set for specific materialsustainability topics and can be found as part of our 2020 People & Planet report. We take a systematic approach to identifying sustainability risks andopportunities, and we aim to minimize the negative impact of our operations and to find new opportunities for revenue increase and cost savings.Sustainability with targets, activities and follow-up processes is included in various business activities and related strategies. Our business model isdescribed in the “Business overview” section of this Annual Report on Form 20-F.
Our key sustainability targets
Focus area Target Target status
Improving lives withtechnology
Helping our customers connect the next billion subscriptions between 2016 and 2022 Achieved
Climate Science Based Target (Scope 1 and 2):Reduce GHG emissions from our own operations by 41% between 2014 and 2030
On track
Science Based Target (Scope 3):Reduce GHG emissions from our products by 75% between 2014 and 2030
On track
Integrity Achieve 95% completion rate for Ethical Business Training in 2020 Achieved
Culture Increase the share of women in leadership by 25% between 2016 and 2020 Not achieved
Dealing with the COVID-19 pandemicAs a global business, many aspects of our operations have been impacted by the ongoing COVID-19 pandemic. Telecommunications is an essentialservice and one that became even more so as countries progressively locked down in 2020 to reduce the spread of the virus. We have had to adapt ourways of working to ensure that our people remain safe while our operations continue. This has been led centrally by a global crisis and continuitymanagement team with regional and country crisis management teams ensuring local implementation.
Our primary aim was to limit the likelihood of exposure for Nokia staff and those working for us. This means that in very early phases of the pandemic wetransferred all our employees to a temporary work from home policy regardless of whether they were able to conduct their work remotely or not. Otheractions included restricting travel, imposing self-quarantine requirements on return for employees who have been traveling, prohibiting visitors fromaccessing Nokia sites, eventually closing virtually all Nokia sites, and only allowing access to Nokia sites to a small number of people involved in criticalwork that could not be conducted offsite.
In order to facilitate operations where remote work is not possible, including field teams and factory operations, guidelines and mitigating controls wereimplemented. As countries have eased restrictions, we have made changes both to the physical working environments and our procedures for their use,ensuring that physical distancing is maintained and hygiene levels remain high, and that processes are in place for both infection management and contacttracing. We continually update our guidance as the situation develops.
We recognize that the pandemic impacts our employees’ work and personal lives in diverse ways. We offer flexible working hours so people can also fulfilltheir personal responsibilities during these challenging times. We conducted our 2020 annual salary review cycle and continued to pay incentives to ouremployees where applicable. We have continued to pay salary and benefits for employees who cannot work from home and whose work site is closed andensured additional paid leave and sick leave for employees who are in self-quarantine and cannot work remotely. We have also kept frequent contact withour colleagues who were on an international assignment and supported them with accommodation, medical coverage and registration to local embassies.
As most of our employees continue working remotely, we are providing guidance on how staff can maintain a healthy work-life balance and look after theirphysical and mental well-being. For example, our Personal Support Service provides our employees with the opportunity of attending virtual learningevents on a broad range of health and well-being related topics, as well as professional, confidential support. We introduced separate people managementguidelines during the crisis, and we ensure our employees, line managers and senior leaders are updated on the pandemic guidelines via multiplechannels: webcasts, newsletters, line manager and Human Resources calls, and a dedicated COVID-19 information hub. We also ran several employeesurveys to track how our employees were coping with the pandemic, share experiences and provide an additional channel for feedback and to requestguidance and support.
Amid the crisis, we also launched our COVID-19 donation fund in March 2020 and engaged with local organizations such as hospitals, community groupsand non-governmental organizations in 48 countries, helping them fight the pandemic and mitigate its impacts.
Table of Contents
82
Improving lives with technologyOur technology connects people to the services, places, opportunities and other people that matter to them. One of our key targets includes helping ourcustomers to connect the next billion subscribers by 2022, compared to approximately 5.5 billion at the end of 2016. The target is measured by number ofsubscriptions in Nokia radio customers’ networks. In 2020, the radio networks we supplied to our customers served around 6.6 billion subscriptionsworldwide, meaning we reached the target ahead of the targeted timeline. In addition, our approach has been validated in the market with 1 545 mission-critical customers and our private wireless solutions are used by 260 customers globally.
During 2020, we announced several new deals that will bring connectivity to the most rural and underserved areas, making sure small businesses, farmsand schools are connected. We also continued our shared value project with UNICEF in Kenya. The aim of the project is to bring together all relevantparties in collaboration to demonstrate the best solutions to connect the unconnected schools to digital learning in Kenya, and to enable accessible, qualityand inclusive education through digital connectivity particularly for girls and disabled children. The project started in 2018 and the first schools wereconnected in September using our Fixed Wireless Access solution.
Combating climate changeClimate change remains a significant risk to society. We recognize that we provide products and services globally that may affect the environment asmanufacturing, distributing, and operating these products require energy and other resources. The most material climate-related opportunities and risksare related to our ability to help other industries to reduce their emissions and the energy efficiency of our products. We believe that the opportunities ourtechnology provides to our customers, industry and society, and the measures we have taken in our operations can positively contribute to the fight againstclimate change. Our own operations are not very sensitive to the changes in energy pricing or natural catastrophes. However, climate change can impactour customers and supply chain, as well as the global economy, political and social stability.
We have utilized climate-related scenarios to support the review of our climate-related risks, opportunities, and related implications to our business. In ouranalysis, we applied global warming scenarios of 1.5ºC and 2.0ºC, based on 2DS scenario by the lnternational Energy Association’s and RCP2.6(Representative Concentration Pathway) scenario by the Intergovernmental Panel on Climate Change. The results of this analysis have providedinformation for our risks and opportunity analysis, stressed the need for greater and more urgent greenhouse gas (GHG) emission reduction activities andserved as a basis for our Science Based Target setting. We have also aligned our climate-related disclosures in our CDP report according to the guidanceof the Task Force on Climate-related Financial Disclosures. CDP is a global organization that runs a bespoke global disclosure system for investors,companies, cities, states, and regions to manage their environmental impacts. We publish our detailed GHG emissions also in our People & Planet report.
We constantly strive to drive down the energy required by our products in use in our customers’ communications networks, helping them to reduce theircarbon footprint as this is by far the greater part of our own carbon footprint. We have delivered zero emission products to over 150 customers around theworld. Modernization of legacy networks drives improved energy efficiency. The customer base station sites we modernized in 2020 used on average 54%less energy than those where our customers did not modernize. Not only does this reduce environmental impacts, it also provides an improved financialupside for our customers.
During 2020, we worked hard to recalibrate our existing long-term science-based targets in line with the goal to limit rises in global average temperaturesto 1.5°C. This is a commitment we made in 2019, and we expect to communicate our updated science-based targets in early 2021. The existing targetsseek to reduce emissions from sold products in use by 75% and operational emissions by 41% by 2030, as compared to the 2014 baseline. At the end of2020, we were on track to reach the targets by 2030. The progress of these targets is linked to the pricing mechanism of our Revolving Credit Facility loanannounced in 2019.
We have in place a robust environmental management system and environmental policy, supported by documented processes and procedures globally toensure implementation. The system helps us to monitor our progress and identify needed improvements. Our own operational footprint is certified underthe ISO 14001 environmental management system standard and in 2020 the coverage of employees within the scope of that certification was 90%.Circular economy and waste reduction are also key in our work and we offer refurbishment, reuse, and recycling of older equipment as an integralcomponent of the product lifecycle management. In 2020, we sent around 4 700 metric tons of old telecommunications equipment for materials recoveryand we refurbished or reused approximately 79 400 units with a combined total weight of 570 metric tons.
Conducting our business with integrityOur long-standing reputation for integrity is our most important asset. At Nokia, every employee is responsible and accountable for upholding our highethical values. Trust has never been more important, and we strive every day to earn and to keep the trust of our customers, governments, employees andother stakeholders with whom we interact. In these challenging times, our unwavering commitment to integrity remains steadfast.
Our Code of Conduct is the foundation upon which this commitment rests. Our Code sets out four straightforward defining principles: we follow the laws where we do business; we set an example for one another by being honest and fair; we promote a culture of integrity through mutual respect and trust; and we hold each other accountable to adhere to the Code and report potential violations.
These guiding principles are supplemented by 14 key business policy statements covering critical issues and risks we face: Improper Payments/Anti-Corruption, Conflicts of Interests, Fair Competition, Privacy, Dealing with Government Officials, Intellectual Property & Confidential Information, Workingwith Third Parties, Trade Compliance, Insider Trading, Health, Safety & Labor Conditions, Controllership, Fair Employment Practices, Human Rights, andEnvironment. An additional Code of Ethics sets out further expectations of our CEO and senior executive financial officers. Our Third-Party Code ofConduct applies to the various third parties with whom we work and clearly states our expectations of them on ethical conduct. Our codes are furthersupplemented by policies, procedures and guidance documents covering a range of topics such as third-party screening procedures, corporate hospitality,and more.
In 2020, we continued our longstanding practice of providing annual training to our employees on ethical business practices, as well as other importanttopics such as quality, health, safety, and well-being. Our Ethical Business Training was completed by 96.2% of our employees, surpassing the target of95%. In response to COVID-19, we redoubled our efforts to stay connected with employees worldwide, leveraged the use of internal social mediachannels, increased our communications on our global Ombuds program, and conducted various other virtual activities. Throughout 2020, we closelymonitored and responded to the impact of the pandemic on our compliance program, shifting our resources and priorities as circumstances dictated, andplanning for continued monitoring and action as required.

Table of Contents
83
Anti-corruption and briberyWe do not engage in, nor do we tolerate, corrupt behavior by our employees or suppliers. We employ a multi-faceted approach to prevent corruption. We have clear and unequivocal policies concerning improper payments, facilitation payments, gifts and hospitality, sponsorships and donations, and other areas of risk for public and private corruption.
We carry out training and regularly communicate to our employees regarding legal and compliance risks, and we review these risks and our mitigationmeasures with the company’s senior leadership and Audit Committee. We conduct periodic audits and risk assessments to ensure that we identify andrespond to corruption risks across our operations. Our Compliance Controls Framework (CCF) reviews are comprehensive, bottom-up assessments thatidentify gaps or shortcomings in our compliance program, and we develop and implement risk mitigation plans in response to each review. We also carryout risk-based due diligence and monitoring procedures for different categories of third parties (such as suppliers and business partners) to assess and tomanage potential risks related to engaging and working with them. In addition, we screen our end-customers to assess possible legal, compliance andreputational risks associated with them (including, but not limited to, sanctions and money laundering risks).
The Anti-Corruption Center of Excellence (CoE) is a dedicated group within our compliance team that assesses and monitors risks associated with commercial third parties and the provisioning of hospitality, sponsorships, and donations on behalf of Nokia. The activities of the CoE are digitalized and tool-based, including for example monitoring and online training. Third parties are not only expected to adhere to our Third-Party Code of Conduct; they are required annually to sign our anti-corruption certification.
We provide a range of trainings and resources that include comprehensive online courses, targeted micro-learnings, compliance job aids, and before the pandemic also face-to-face training. In 2020, anti-corruption training was delivered to business groups, regional groups, Nokia service companies, joint ventures and other stakeholders with over 3 000 individuals trained. We also celebrated Nokia Integrity Day in October with a variety of online activities, including two virtual global events hosted by our Chief Compliance Officer and a compliance panel. This gave employees around the world the opportunity to review real high-risk case scenarios and engage with the compliance team to ask questions and discuss compliance topics. Integrity Day celebrates Nokia’s commitment to integrity and seeks to draw all employees into a conversation about the importance of this core value.
Oversight and grievance mechanismsOur Board of Directors, Audit Committee, and executive leadership team all provide oversight of our ethics and compliance program. Our ChiefCompliance Officer provides periodic reports and updates concerning compliance programs, investigations, and evolving external enforcement and risktrends. Employees are expected and encouraged to report concerns about ethical misconduct or potential violations of law, our Code of Conduct or ourcompany policies. We provide numerous channels and mechanisms to facilitate such reporting and strive to ensure that employees feel comfortablereporting concerns, including means to report anonymously where permissible by local law. Nokia’s global Ombuds program helps drive our ‘speak up’culture and allays any concerns employees may feel about potential reprisal for having filed a report.
In 2020, we received 776 concerns, of which 329 were investigated by our Business Integrity Group as alleged violations of our Code of Conduct. 106 ofsuch integrity allegations were substantiated with cause found after investigations. Specifically, two concerns were received as alleged violations of ouranti-bribery policies, involving third parties. One of these concerns was not substantiated, and the other investigation was not concluded by the end of2020. We also implemented corrective actions including 16 dismissals and 20 written warnings following these and other investigations. Beyond individualdiscipline, these investigations resulted in detailed root cause analysis, and remedial measures and improvements were identified and monitored forimplementation, thereby ensuring constant improvement.
Data privacy and securityWe have established a comprehensive company-wide privacy program based on relevant laws, best practices, and standards. This program is supportedby, and aligned with, corporate, business-group, and central functions-level policies and processes. We aim to mitigate privacy risk in relation to the datawe collect, process, and store. We observe the concept of data minimization, meaning we endeavor only to collect personal data that is necessary for thepurposes for which they are collected and to retain such data for no longer than is necessary. We implement appropriate controls to ensure that onlypersons with a clear and justifiable need to know can access personal data. We have formal processes and procedures in place to manage and mitigateany related risk to data subjects in the event of a personal data breach. These processes also include mechanisms to communicate in a timely fashionwith supervisory authorities, should that be required. We measure and monitor privacy maturity and ambition by undertaking privacy maturity assessmentsacross the business. A program of privacy awareness and training ensures we continuously and effectively address areas of highest privacy impact.
Security is a key concern in 5G, IoT and other new technologies. We aim to develop products and services that meet or surpass the applicable securitystandards. Nevertheless, we and our products may be subject to cybersecurity breaches, including those resulting from hacking, viruses, malicioussoftware, unauthorized modifications, or other activities that may cause potential security risks and other harm to us, our customers or consumers, andother end-users of our products and services. We have developed and implemented processes and tools for use in product development, referred to asDesign for Security or DfSec, which underlies all product development. We maintain internal IT security and cybersecurity operations, including monitoringour internal network resources and we have ISO 27001 certifications for selected operations. We have also implemented policies, processes, and tools toenhance the security of our products and services, including managing the security risks in third parties.
Human rights – Freedom of expression and privacyWe are committed to the principles of the Universal Declaration of Human Rights, the United Nations Global Compact, and the Organisation for theEconomic Co-operation and Development (OECD) guidelines for Multinational Enterprises. We encourage our suppliers and business partners to sharethese values. We endorsed the United Nations Guiding Principles on Business and Human Rights in 2011. Our Code of Conduct together with our HumanRights Policy sets out our approach to human rights. Our human rights processes cover the whole value chain, from supplier management to product enduse and we have set clear targets for all areas separately.
Our Human Rights Due Diligence (HRDD) process, which is embedded in our global sales process, provides the mechanism and tools to effectively dealwith our most salient human rights risks arising from the potential misuse of the products and technology we provide. We aim to ensure the technology weprovide is not used to infringe on human rights, including the right to privacy, freedom of expression and assembly. Before any sale is made, the HRDDprocess is used to identify the potential risk level to human rights through potential misuse of our technology. Of the cases handled by HRDD in 2020, 70%were resolved as ‘Go’, 30% as ‘Go with conditions’, and 0% as ‘No go’. In addition to potential product misuse, human rights risks appear in our globalsupply chain. Our supply chain risks and activities are further discussed in the Responsible Sourcing section below and in a separate modern slaverystatement.
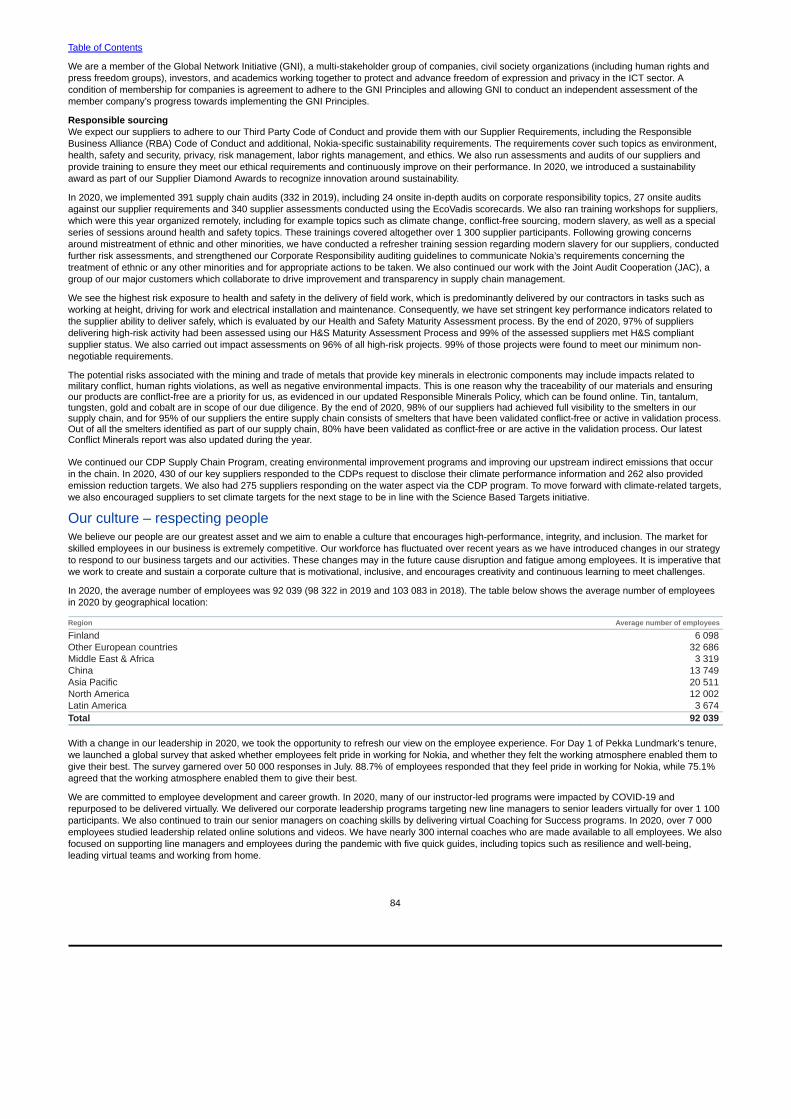
Table of Contents
84
We are a member of the Global Network Initiative (GNI), a multi-stakeholder group of companies, civil society organizations (including human rights andpress freedom groups), investors, and academics working together to protect and advance freedom of expression and privacy in the ICT sector. Acondition of membership for companies is agreement to adhere to the GNI Principles and allowing GNI to conduct an independent assessment of themember company’s progress towards implementing the GNI Principles.
Responsible sourcingWe expect our suppliers to adhere to our Third Party Code of Conduct and provide them with our Supplier Requirements, including the ResponsibleBusiness Alliance (RBA) Code of Conduct and additional, Nokia-specific sustainability requirements. The requirements cover such topics as environment,health, safety and security, privacy, risk management, labor rights management, and ethics. We also run assessments and audits of our suppliers andprovide training to ensure they meet our ethical requirements and continuously improve on their performance. In 2020, we introduced a sustainabilityaward as part of our Supplier Diamond Awards to recognize innovation around sustainability.
In 2020, we implemented 391 supply chain audits (332 in 2019), including 24 onsite in-depth audits on corporate responsibility topics, 27 onsite auditsagainst our supplier requirements and 340 supplier assessments conducted using the EcoVadis scorecards. We also ran training workshops for suppliers,which were this year organized remotely, including for example topics such as climate change, conflict-free sourcing, modern slavery, as well as a specialseries of sessions around health and safety topics. These trainings covered altogether over 1 300 supplier participants. Following growing concernsaround mistreatment of ethnic and other minorities, we have conducted a refresher training session regarding modern slavery for our suppliers, conductedfurther risk assessments, and strengthened our Corporate Responsibility auditing guidelines to communicate Nokia’s requirements concerning thetreatment of ethnic or any other minorities and for appropriate actions to be taken. We also continued our work with the Joint Audit Cooperation (JAC), agroup of our major customers which collaborate to drive improvement and transparency in supply chain management.
We see the highest risk exposure to health and safety in the delivery of field work, which is predominantly delivered by our contractors in tasks such asworking at height, driving for work and electrical installation and maintenance. Consequently, we have set stringent key performance indicators related tothe supplier ability to deliver safely, which is evaluated by our Health and Safety Maturity Assessment process. By the end of 2020, 97% of suppliersdelivering high-risk activity had been assessed using our H&S Maturity Assessment Process and 99% of the assessed suppliers met H&S compliantsupplier status. We also carried out impact assessments on 96% of all high-risk projects. 99% of those projects were found to meet our minimum non-negotiable requirements.
The potential risks associated with the mining and trade of metals that provide key minerals in electronic components may include impacts related tomilitary conflict, human rights violations, as well as negative environmental impacts. This is one reason why the traceability of our materials and ensuringour products are conflict-free are a priority for us, as evidenced in our updated Responsible Minerals Policy, which can be found online. Tin, tantalum,tungsten, gold and cobalt are in scope of our due diligence. By the end of 2020, 98% of our suppliers had achieved full visibility to the smelters in oursupply chain, and for 95% of our suppliers the entire supply chain consists of smelters that have been validated conflict-free or active in validation process.Out of all the smelters identified as part of our supply chain, 80% have been validated as conflict-free or are active in the validation process. Our latestConflict Minerals report was also updated during the year.
We continued our CDP Supply Chain Program, creating environmental improvement programs and improving our upstream indirect emissions that occurin the chain. In 2020, 430 of our key suppliers responded to the CDPs request to disclose their climate performance information and 262 also providedemission reduction targets. We also had 275 suppliers responding on the water aspect via the CDP program. To move forward with climate-related targets,we also encouraged suppliers to set climate targets for the next stage to be in line with the Science Based Targets initiative.
Our culture – respecting peopleWe believe our people are our greatest asset and we aim to enable a culture that encourages high-performance, integrity, and inclusion. The market forskilled employees in our business is extremely competitive. Our workforce has fluctuated over recent years as we have introduced changes in our strategyto respond to our business targets and our activities. These changes may in the future cause disruption and fatigue among employees. It is imperative thatwe work to create and sustain a corporate culture that is motivational, inclusive, and encourages creativity and continuous learning to meet challenges.
In 2020, the average number of employees was 92 039 (98 322 in 2019 and 103 083 in 2018). The table below shows the average number of employeesin 2020 by geographical location:
Region Average number of employees
Finland 6 098Other European countries 32 686Middle East & Africa 3 319China 13 749Asia Pacific 20 511North America 12 002Latin America 3 674Total 92 039
With a change in our leadership in 2020, we took the opportunity to refresh our view on the employee experience. For Day 1 of Pekka Lundmark’s tenure, we launched a global survey that asked whether employees felt pride in working for Nokia, and whether they felt the working atmosphere enabled them to give their best. The survey garnered over 50 000 responses in July. 88.7% of employees responded that they feel pride in working for Nokia, while 75.1% agreed that the working atmosphere enabled them to give their best.
We are committed to employee development and career growth. In 2020, many of our instructor-led programs were impacted by COVID-19 andrepurposed to be delivered virtually. We delivered our corporate leadership programs targeting new line managers to senior leaders virtually for over 1 100participants. We also continued to train our senior managers on coaching skills by delivering virtual Coaching for Success programs. In 2020, over 7 000employees studied leadership related online solutions and videos. We have nearly 300 internal coaches who are made available to all employees. We alsofocused on supporting line managers and employees during the pandemic with five quick guides, including topics such as resilience and well-being,leading virtual teams and working from home.
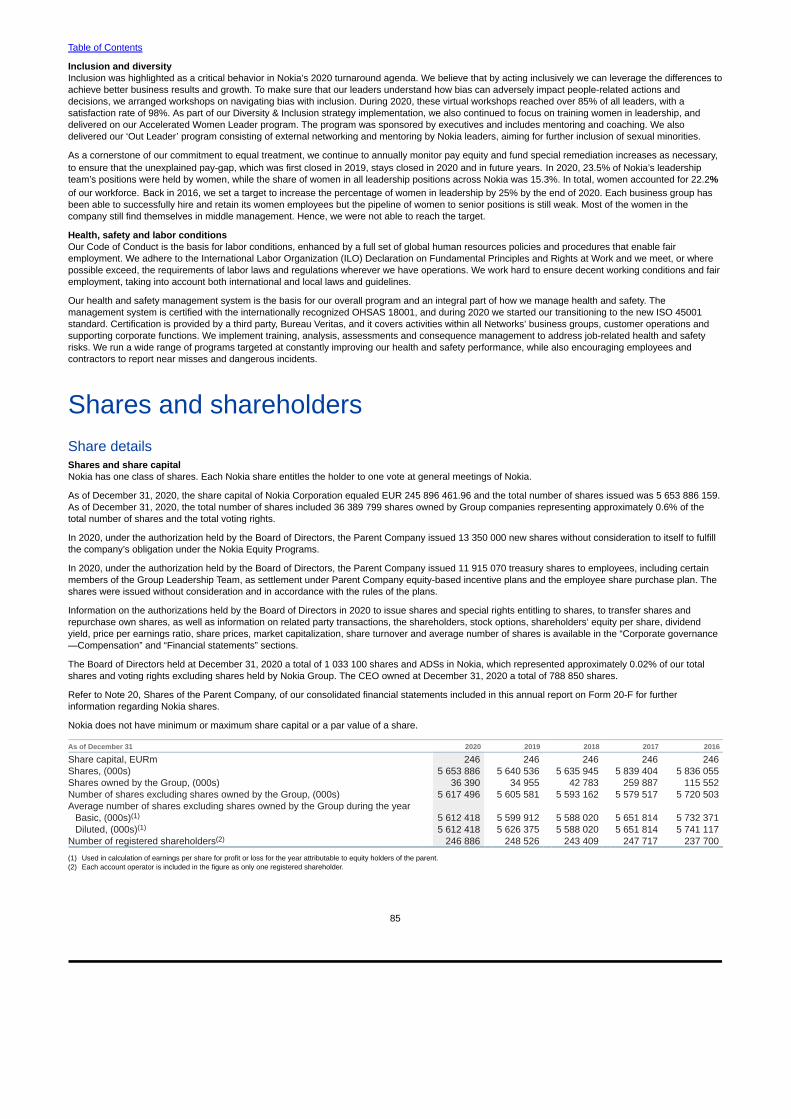
Table of Contents
85
Inclusion and diversityInclusion was highlighted as a critical behavior in Nokia’s 2020 turnaround agenda. We believe that by acting inclusively we can leverage the differences to achieve better business results and growth. To make sure that our leaders understand how bias can adversely impact people-related actions and decisions, we arranged workshops on navigating bias with inclusion. During 2020, these virtual workshops reached over 85% of all leaders, with a satisfaction rate of 98%. As part of our Diversity & Inclusion strategy implementation, we also continued to focus on training women in leadership, and delivered on our Accelerated Women Leader program. The program was sponsored by executives and includes mentoring and coaching. We also delivered our ‘Out Leader’ program consisting of external networking and mentoring by Nokia leaders, aiming for further inclusion of sexual minorities.
As a cornerstone of our commitment to equal treatment, we continue to annually monitor pay equity and fund special remediation increases as necessary,to ensure that the unexplained pay-gap, which was first closed in 2019, stays closed in 2020 and in future years. In 2020, 23.5% of Nokia’s leadershipteam’s positions were held by women, while the share of women in all leadership positions across Nokia was 15.3%. In total, women accounted for 22.2%of our workforce. Back in 2016, we set a target to increase the percentage of women in leadership by 25% by the end of 2020. Each business group hasbeen able to successfully hire and retain its women employees but the pipeline of women to senior positions is still weak. Most of the women in thecompany still find themselves in middle management. Hence, we were not able to reach the target.
Health, safety and labor conditionsOur Code of Conduct is the basis for labor conditions, enhanced by a full set of global human resources policies and procedures that enable fairemployment. We adhere to the International Labor Organization (ILO) Declaration on Fundamental Principles and Rights at Work and we meet, or wherepossible exceed, the requirements of labor laws and regulations wherever we have operations. We work hard to ensure decent working conditions and fairemployment, taking into account both international and local laws and guidelines.
Our health and safety management system is the basis for our overall program and an integral part of how we manage health and safety. Themanagement system is certified with the internationally recognized OHSAS 18001, and during 2020 we started our transitioning to the new ISO 45001standard. Certification is provided by a third party, Bureau Veritas, and it covers activities within all Networks’ business groups, customer operations andsupporting corporate functions. We implement training, analysis, assessments and consequence management to address job-related health and safetyrisks. We run a wide range of programs targeted at constantly improving our health and safety performance, while also encouraging employees andcontractors to report near misses and dangerous incidents.
Shares and shareholdersShare detailsShares and share capitalNokia has one class of shares. Each Nokia share entitles the holder to one vote at general meetings of Nokia.
As of December 31, 2020, the share capital of Nokia Corporation equaled EUR 245 896 461.96 and the total number of shares issued was 5 653 886 159.As of December 31, 2020, the total number of shares included 36 389 799 shares owned by Group companies representing approximately 0.6% of thetotal number of shares and the total voting rights.
In 2020, under the authorization held by the Board of Directors, the Parent Company issued 13 350 000 new shares without consideration to itself to fulfillthe company’s obligation under the Nokia Equity Programs.
In 2020, under the authorization held by the Board of Directors, the Parent Company issued 11 915 070 treasury shares to employees, including certainmembers of the Group Leadership Team, as settlement under Parent Company equity-based incentive plans and the employee share purchase plan. Theshares were issued without consideration and in accordance with the rules of the plans.
Information on the authorizations held by the Board of Directors in 2020 to issue shares and special rights entitling to shares, to transfer shares andrepurchase own shares, as well as information on related party transactions, the shareholders, stock options, shareholders’ equity per share, dividendyield, price per earnings ratio, share prices, market capitalization, share turnover and average number of shares is available in the “Corporate governance—Compensation” and “Financial statements” sections.
The Board of Directors held at December 31, 2020 a total of 1 033 100 shares and ADSs in Nokia, which represented approximately 0.02% of our totalshares and voting rights excluding shares held by Nokia Group. The CEO owned at December 31, 2020 a total of 788 850 shares.
Refer to Note 20, Shares of the Parent Company, of our consolidated financial statements included in this annual report on Form 20-F for furtherinformation regarding Nokia shares.
Nokia does not have minimum or maximum share capital or a par value of a share.
As of December 31 2020 2019 2018 2017 2016
Share capital, EURm 246 246 246 246 246Shares, (000s) 5 653 886 5 640 536 5 635 945 5 839 404 5 836 055Shares owned by the Group, (000s) 36 390 34 955 42 783 259 887 115 552Number of shares excluding shares owned by the Group, (000s) 5 617 496 5 605 581 5 593 162 5 579 517 5 720 503Average number of shares excluding shares owned by the Group during the year
Basic, (000s)(1) 5 612 418 5 599 912 5 588 020 5 651 814 5 732 371Diluted, (000s)(1) 5 612 418 5 626 375 5 588 020 5 651 814 5 741 117
Number of registered shareholders(2) 246 886 248 526 243 409 247 717 237 700
(1) Used in calculation of earnings per share for profit or loss for the year attributable to equity holders of the parent.(2) Each account operator is included in the figure as only one registered shareholder.
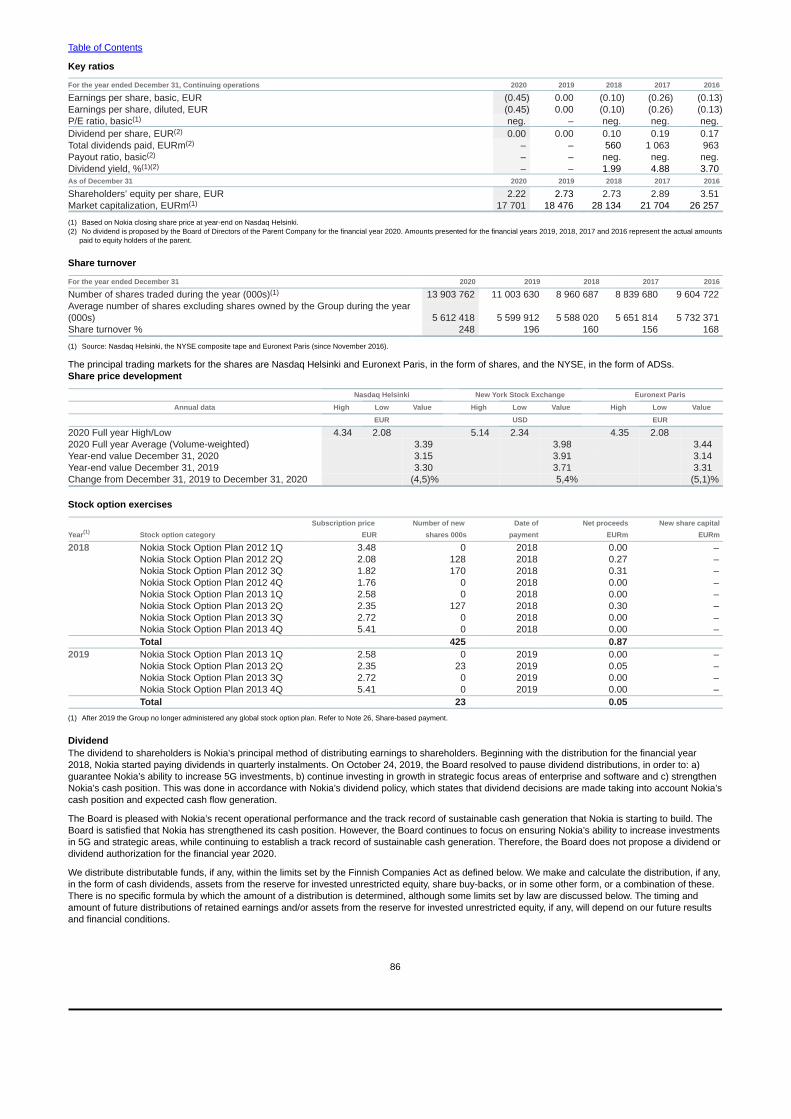
Table of Contents
86
Key ratios
For the year ended December 31, Continuing operations 2020 2019 2018 2017 2016
Earnings per share, basic, EUR (0.45) 0.00 (0.10) (0.26) (0.13)Earnings per share, diluted, EUR (0.45) 0.00 (0.10) (0.26) (0.13)P/E ratio, basic(1) neg. – neg. neg. neg.Dividend per share, EUR(2) 0.00 0.00 0.10 0.19 0.17Total dividends paid, EURm(2) – – 560 1 063 963Payout ratio, basic(2) – – neg. neg. neg.Dividend yield, %(1)(2) – – 1.99 4.88 3.70As of December 31 2020 2019 2018 2017 2016
Shareholders’ equity per share, EUR 2.22 2.73 2.73 2.89 3.51Market capitalization, EURm(1) 17 701 18 476 28 134 21 704 26 257
(1) Based on Nokia closing share price at year-end on Nasdaq Helsinki.(2) No dividend is proposed by the Board of Directors of the Parent Company for the financial year 2020. Amounts presented for the financial years 2019, 2018, 2017 and 2016 represent the actual amounts
paid to equity holders of the parent.
Share turnover
For the year ended December 31 2020 2019 2018 2017 2016
Number of shares traded during the year (000s)(1) 13 903 762 11 003 630 8 960 687 8 839 680 9 604 722Average number of shares excluding shares owned by the Group during the year(000s) 5 612 418 5 599 912 5 588 020 5 651 814 5 732 371Share turnover % 248 196 160 156 168
(1) Source: Nasdaq Helsinki, the NYSE composite tape and Euronext Paris (since November 2016).
The principal trading markets for the shares are Nasdaq Helsinki and Euronext Paris, in the form of shares, and the NYSE, in the form of ADSs.Share price development
Nasdaq Helsinki New York Stock Exchange Euronext Paris
Annual data High Low Value High Low Value High Low Value
EUR USD EUR
2020 Full year High/Low 4.34 2.08 5.14 2.34 4.35 2.082020 Full year Average (Volume-weighted) 3.39 3.98 3.44Year-end value December 31, 2020 3.15 3.91 3.14 Year-end value December 31, 2019 3.30 3.71 3.31 Change from December 31, 2019 to December 31, 2020 (4,5)% 5,4% (5,1)%
Stock option exercises
Subscription price Number of new Date of Net proceeds New share capitalYear(1) Stock option category EUR shares 000s payment EURm EURm
2018 Nokia Stock Option Plan 2012 1Q 3.48 0 2018 0.00 – Nokia Stock Option Plan 2012 2Q 2.08 128 2018 0.27 – Nokia Stock Option Plan 2012 3Q 1.82 170 2018 0.31 – Nokia Stock Option Plan 2012 4Q 1.76 0 2018 0.00 – Nokia Stock Option Plan 2013 1Q 2.58 0 2018 0.00 – Nokia Stock Option Plan 2013 2Q 2.35 127 2018 0.30 – Nokia Stock Option Plan 2013 3Q 2.72 0 2018 0.00 –
Nokia Stock Option Plan 2013 4Q 5.41 0 2018 0.00 – Total 425 0.87
2019 Nokia Stock Option Plan 2013 1Q 2.58 0 2019 0.00 –Nokia Stock Option Plan 2013 2Q 2.35 23 2019 0.05 –Nokia Stock Option Plan 2013 3Q 2.72 0 2019 0.00 –Nokia Stock Option Plan 2013 4Q 5.41 0 2019 0.00 – Total 23 0.05
(1) After 2019 the Group no longer administered any global stock option plan. Refer to Note 26, Share-based payment.
DividendThe dividend to shareholders is Nokia’s principal method of distributing earnings to shareholders. Beginning with the distribution for the financial year2018, Nokia started paying dividends in quarterly instalments. On October 24, 2019, the Board resolved to pause dividend distributions, in order to: a)guarantee Nokia’s ability to increase 5G investments, b) continue investing in growth in strategic focus areas of enterprise and software and c) strengthenNokia’s cash position. This was done in accordance with Nokia’s dividend policy, which states that dividend decisions are made taking into account Nokia’scash position and expected cash flow generation.
The Board is pleased with Nokia’s recent operational performance and the track record of sustainable cash generation that Nokia is starting to build. TheBoard is satisfied that Nokia has strengthened its cash position. However, the Board continues to focus on ensuring Nokia’s ability to increase investmentsin 5G and strategic areas, while continuing to establish a track record of sustainable cash generation. Therefore, the Board does not propose a dividend ordividend authorization for the financial year 2020.
We distribute distributable funds, if any, within the limits set by the Finnish Companies Act as defined below. We make and calculate the distribution, if any,in the form of cash dividends, assets from the reserve for invested unrestricted equity, share buy-backs, or in some other form, or a combination of these.There is no specific formula by which the amount of a distribution is determined, although some limits set by law are discussed below. The timing andamount of future distributions of retained earnings and/or assets from the reserve for invested unrestricted equity, if any, will depend on our future resultsand financial conditions.

Table of Contents
87
Under the Finnish Companies Act, we may distribute retained earnings and/or assets from the reserve for invested unrestricted equity on our shares onlyupon a shareholders’ resolution and subject to limited exceptions in the amount proposed by the Board. The amount of any distribution is limited to theamount of distributable earnings of the Parent Company pursuant to the last accounts approved by our shareholders, taking into account the materialchanges in the financial situation of the Parent Company after the end of the last financial period and a statutory requirement that the distribution ofearnings must not result in insolvency of the Parent Company. Subject to exceptions relating to the right of minority shareholders to request a certainminimum distribution, the distribution may not exceed the amount proposed by the Board of Directors.
ShareholdersAs of December 31, 2020, shareholders registered in Finland represented approximately 24% and shareholders registered in the name of a nomineerepresented approximately 76% of the total number of shares of Nokia Corporation. The number of directly registered shareholders was 246 886 as ofDecember 31, 2020. Each account operator (14) is included in this figure as only one registered shareholder.
Largest shareholders registered in Finland as of December 31, 2020(1)
Total number Shareholder of shares 000s % of all shares % of all voting rights
Solidium Oy 296 000 5.24 5.24Keskinäinen Eläkevakuutusyhtiö Ilmarinen 79 800 1.41 1.41Keskinäinen Työeläkevakuutusyhtiö Varma 78 952 1.40 1.40Keskinäinen Työeläkevakuutusyhtiö Elo 44 307 0.78 0.78Valtion Eläkerahasto 42 000 0.74 0.74Schweizerische Nationalbank 27 112 0.48 0.48Nordea Bank Abp 16 962 0.30 0.30Oy Lival Ab 16 700 0.30 0.30Svenska Litteratursällskapet i Finland r.f. 15 678 0.28 0.28Danske Invest Finnish Equity Fund 15 300 0.27 0.27
(1) Excluding nominee registered shares and shares owned by Nokia Corporation. Nokia Corporation owned 24 931 138 shares as of December 31, 2020.
Breakdown of share ownership as of December 31, 2020(1)
Number of % of Total number % ofBy number of shares owned shareholders shareholders of shares all shares
1–100 55 705 22.56 2 970 824 0.05101–1 000 116 103 47.03 52 207 178 0.921 001–10 000 66 069 26.76 206 558 643 3.6510 001–100 000 8 472 3.43 206 905 293 3.66100 001–500 000 424 0.17 83 320 702 1.47500 001–1 000 000 42 0.02 30 352 097 0.541 000 001–5 000 000 49 0.02 127 487 410 2.26Over 5 000 000 22 0.01 4 944 084 012 87.45Total 246 886 100.00 5 653 886 159 100.00
(1) The breakdown covers only shareholders registered in Finland, and each account operator (14) is included in the number of shareholders as only one registered shareholder. As a result, the breakdownis not illustrative of the entire shareholder base of Nokia.
By nationality % of shares
Non-Finnish shareholders 76.17Finnish shareholders 23.83Total 100.00
By shareholder category (Finnish shareholders) % of shares
Corporations 2.35Households 8.19Financial and insurance institutions 2.22Non-profit organizations 1.24Governmental bodies (incl. pension insurance companies) 9.83Total 23.83
As of December 31, 2020, a total of 770 246 104 ADSs (equivalent to the same number of shares or approximately 14% of the total shares) wereoutstanding and held of record by 114 939 registered holders in the United States. We are aware that many ADSs are held of record by brokers and othernominees, and accordingly the above number of holders is not necessarily representative of the actual number of persons who are beneficial holders ofADSs or the number of ADSs beneficially held by such persons. Based on information available from Broadridge Financial Solutions, Inc., the number ofbeneficial owners of ADSs as of December 31, 2020 was 522 361.
Based on information known to us as of January 29, 2021, as of December 31, 2020, Blackrock, Inc. beneficially owned 333 048 530 Nokia shares, whichat that time corresponded to approximately 5.9% of the total number of shares and voting rights of Nokia.
According to a notification received by Nokia on September 3, 2020, the holdings of Solidium Oy in Nokia amounted to a total of 283 000 000 shares,corresponding to approximately 5.01% of the total number of shares and voting rights of Nokia at that time.
To the best of our knowledge, Nokia is not directly or indirectly owned or controlled by any other corporation or any government, and there are noarrangements that may result in a change of control of Nokia.

Table of Contents
88
Shares and stock options owned by the members of the Board and the Nokia Group Leadership TeamAs of December 31, 2020, the members of our Board and the Group Leadership Team held a total of 4 480 039 shares and ADSs in Nokia, whichrepresented approximately 0.08% of our shares and total voting rights excluding shares held by the Nokia Group.
Offer and listing detailsOur capital consists of shares traded on Nasdaq Helsinki under the symbol “NOKIA” and Euronext Paris under the symbol “NOKIA”. Our ADSs, eachrepresenting one of our shares, are traded on the NYSE under the symbol “NOK”. The ADSs are evidenced by American Depositary Receipts (ADRs)issued by Citibank, N.A.

Table of Contents
89
Articles of AssociationArticles of AssociationAmendment of our Articles of Association requires a resolution of the general meeting of shareholders, supported by two-thirds of the votes cast and two-thirds of the shares represented at the meeting.
Our Articles of Association include provisions for obligations to redeem our shares. Amendment of the provisions of Article 13 of the Articles ofAssociation, “Obligation to purchase shares”, requires a resolution supported by three-quarters of the votes cast and three-quarters of the sharesrepresented at the meeting.
RegistrationNokia is organized under the laws of the Republic of Finland and registered under the business identity code 0112038-9. Under its current Articles ofAssociation, Nokia’s corporate purpose is to research, develop, manufacture, market, sell and deliver products, software and services in a wide range ofconsumer and business-to-business markets. These products, software and services relate to, among others, network infrastructure for telecommunicationoperators and other enterprises, the IoT, human health and well-being, multimedia, big data and analytics, mobile devices and consumer wearables andother electronics. The company may also create, acquire and license intellectual property and software as well as engage in other industrial andcommercial operations, including securities trading and other investment activities. The company may carry on its business operations directly, throughsubsidiary companies, affiliate companies and joint ventures.
Directors’ voting powersUnder Finnish law, resolutions of the Board shall be made by a majority vote. A director shall refrain from taking any part in the consideration of anagreement between the director and the company or third party, or any other issue that may provide any material benefit to him or her, which may becontradictory to the interests of the company. Under Finnish law, there is no age limit requirement for directors, and there are no requirements underFinnish law that a director must own a minimum number of shares in order to qualify to act as a director. However, in accordance with the current companypolicy, approximately 40% of the annual fee payable to the Board members is paid in Nokia shares purchased from the market or alternatively by usingtreasury shares held by Nokia, and the directors shall retain until the end of their directorship such number of shares that corresponds to the number ofshares they have received as Board remuneration during their first three years of service (the net amount received after deducting those shares used foroffsetting any costs relating to the acquisition of the shares, including taxes).
Share rights, preferences and restrictionsEach share confers the right to one vote at general meetings. According to Finnish law, a company generally must hold an Annual General Meeting calledby the Board within six months from the end of the financial year. Additionally, the Board is obliged to call an Extraordinary General Meeting, wheneversuch meeting is deemed necessary, or at the request of the auditor or shareholders representing a minimum of one-tenth of all outstanding shares.Under our Articles of Association, the Board is elected at least annually at the Annual General Meeting of the shareholders for a term ending at the end ofthe next Annual General Meeting.
Under Finnish law, shareholders may attend and vote at general meetings in person or by proxy. It is not customary in Finland for a company to issueforms of proxy to its shareholders. Accordingly, Nokia does not do so. However, registered holders and beneficial owners of ADSs are issued forms ofproxy by the Depositary.
To attend and vote at a general meeting, a shareholder must be registered in the register of shareholders in the Finnish book-entry system on or prior tothe record date set forth in the notice of the general meeting. A registered holder or a beneficial owner of the ADSs, like other beneficial owners whoseshares are registered in the company’s register of shareholders in the name of a nominee, may vote with their shares provided that they arrange to havetheir name entered in the temporary register of shareholders for the general meeting.
The record date is the eighth business day preceding the meeting. To be entered in the temporary register of shareholders for the general meeting, aholder of ADSs must provide the Depositary, or have his broker or other custodian provide the Depositary, on or before the voting deadline, as defined inthe proxy material issued by the Depositary, a proxy with the following information: the name, address, and social security number or anothercorresponding personal identification number of the holder of the ADSs, the number of shares to be voted by the holder of the ADSs and the votinginstructions. The register of shareholders as of the record date of each general meeting is public until the end of the respective meeting. Other nomineeregistered shareholders can attend and vote at the general meetings by instructing their broker or other custodian to register the shareholder in Nokia’stemporary register of shareholders and give the voting instructions in accordance with the broker’s or custodian’s instructions.
By completing and returning the form of proxy provided by the Depositary, a holder of ADSs also authorizes the Depositary to give notice to us, required byour Articles of Association, of the holder’s intention to attend the general meeting.
Each of our shares confers equal rights to share in the distribution of the company’s funds. Dividend entitlement lapses after three years if a dividendremains unclaimed for that period, in which case the unclaimed dividend will be retained by Nokia.
Under Finnish law, the rights of shareholders are related to the shares as set forth in law and our Articles of Association. Neither Finnish law nor ourArticles of Association sets limitations on the rights to own Nokia securities, including the rights of foreign shareholders to hold or exercise voting rights inthe said securities. Amendment of the Articles of Association requires a decision of the general meeting, supported by two-thirds of the votes cast and two-thirds of the shares represented at the meeting.
Table of Contents
90
Disclosure of shareholder ownership or voting powerAccording to the Finnish Securities Market Act, a shareholder shall disclose his or her ownership or voting power to the company and the Finnish FinancialSupervisory Authority when the ownership or voting power reaches, exceeds or falls below 5, 10, 15, 20, 25, 30, 50 or 90% of all the shares or the votingrights outstanding. The term “ownership” includes ownership by the shareholder, as well as selected related parties, and calculating the ownership orvoting power covers agreements or other arrangements, which when concluded would cause the proportion of voting rights or number of shares to reach,exceed or fall below the aforementioned limits. Upon receiving such notice, the company shall disclose it by a stock exchange release without unduedelay.
Purchase obligationOur Articles of Association require a shareholder that holds one-third or one-half of all of our shares to purchase the shares of all other shareholders thatso request. A shareholder who becomes subject to the purchase obligation is also obligated to purchase any subscription rights, stock options orconvertible bonds issued by the company if so requested by the holder. The purchase price of the shares under our Articles of Association is the higher of:(a) the weighted average trading price of the shares on Nasdaq Helsinki during the ten business days prior to the day on which we have been notified bythe purchaser that its holding has reached or exceeded the threshold referred to above or, in the absence of such notification or its failure to arrive withinthe specified period, the day on which our Board otherwise becomes aware of this; or (b) the average price, weighted by the number of shares, which thepurchaser has paid for the shares it has acquired during the last 12 months preceding the date referred to in (a).
Under the Finnish Securities Market Act, a shareholder whose voting power exceeds 30% or 50% of the total voting rights in a company shall, withinone month, offer to purchase the remaining shares of the company, as well as any other rights entitling to the shares issued by the company, such assubscription rights, convertible bonds or stock options issued by the company. The purchase price shall be the market price of the securities in question.Subject to certain exceptions, the market price is determined on the basis of the highest price paid for the security during the preceding six months by theshareholder or any party in close connection to the shareholder. Subject to certain exceptions, if the shareholder or any related party has not during thesix months preceding the offer acquired any securities that are the target for the offer, the market price is determined based on the average of the pricespaid for the security in public trading during the preceding three months weighted by the volume of trade.
Under the Finnish Companies Act, a shareholder whose holding exceeds nine-tenths of the total number of shares or voting rights in Nokia has both theright and, upon a request from the minority shareholders, the obligation to purchase all the shares of the minority shareholders for the then current marketprice. The market price is determined, among other things, on the basis of the recent market price of the shares. The purchase procedure under theFinnish Companies Act differs, and the purchase price may differ, from the purchase procedure and price under the Finnish Securities Market Act, asdiscussed above. However, if the threshold of nine-tenths has been exceeded through either a mandatory or a voluntary public offer pursuant to theFinnish Securities Market Act, the market price under the Finnish Companies Act is deemed to be the price offered in the public offer, unless there arespecific reasons to deviate from it.
Pre-emptive rightsIn connection with any offering of shares, the existing shareholders have a pre-emptive right to subscribe for shares offered in proportion to the amount ofshares in their possession. However, a general meeting of shareholders may vote, by a majority of two-thirds of the votes cast and two-thirds of the sharesrepresented at the meeting, to waive this pre-emptive right provided that, from the company’s perspective, weighty financial grounds exist.
Monitoring of Foreign Corporate AcquisitionsUnder the Finnish Act on the Monitoring of Foreign Corporate Acquisitions (2012/172 as amended), a notification to the Ministry of Economic Affairs andEmployment is required for a non-resident of Finland, directly or indirectly, when acquiring one-tenth or more of the voting power or corresponding factualinfluence in a company. The Ministry of Economic Affairs and Employment has to confirm the acquisition unless the acquisition would jeopardize importantnational interests, in which case the matter is referred to the Council of State. If the company in question is operating in the defense sector, an approval bythe Ministry of Economic Affairs and Employment is required before the acquisition is made. These requirements are not applicable if, for instance, thevoting power is acquired in a share issue that is proportional to the holder’s ownership of the shares. Moreover, the requirements do not apply to residentsof countries in the European Economic Area or EFTA countries, except where at least one tenth of shares or other controlling right in such resident areheld by a party not resident in the European Economic Area or EFTA.

Table of Contents
91
Risk factorsSet forth below is a description of risk factors that could affect our business. Shareholders and potentialinvestors should carefully review the following risk factors, in addition to other information contained in thisAnnual Report on Form 20-F. The risk factors described below should not be construed as exhaustive. Theremay be additional risks that are unknown to us and other risks currently believed to be immaterial that could turnout to be material.These risks, either individually or collectively, could adversely affect our business, sales, profitability, results of operations, financial condition,competitiveness, costs, expenses, liquidity, market share, brand, reputation and share price. Unless otherwise indicated or the context otherwise requires,references in these risk factors to “Nokia”, the “Nokia Group”, “Group”, “we”, “us” and “our” mean Nokia’s consolidated operating segments. Certain risks orevents may be more prevalent with respect to the Group or a certain business group, business or part of the Group.
In evaluating the risks, one should not rely exclusively on the bullets in the below summary but read the full risk factor discussion. This Annual Report onForm 20-F also contains forward-looking statements that involve risks and uncertainties presented in “Forward-looking statements” above.
Risk factors summaryOur capability to implement our strategic plans, improve competitiveness, sustain or improve the operational and financial performance of our businessgroups, identify or successfully pursue business opportunities or otherwise grow our business is dependent on multiple external and internal factors,partially outside our control, including such as:
Risks related to strategy and its execution◾Our ability to implement the new operating model;
◾Our ability to develop market recognition as a leading provider of technology, software and services in the information technology and communicationsand related services business in the industries and markets in which we operate;
◾Trends, such as cloudification, open RAN/openness, virtualization and disaggregation with potential impact on our portfolio of products and services, competitive landscape, business models and our margin profile;
◾The degree our investments result in technologies, products or services that achieve or retain broad or timely market acceptance, answer to theexpanding needs or preferences of our customers or consumers, or in break-through innovations that we could otherwise utilize for value creation; and
◾Our success in improving our operations and efficiencies through investing in R&D, entering into licensing arrangements, acquiring businesses andtechnologies, recruiting expert employees and partnering with third parties or forming joint ventures.
Surrounding economic, financial and competitive environment◾General economic and financial market conditions and other developments in the economies and industries where we, our customers and suppliers
operate;
◾Duration of the COVID-19 outbreak, disruptiveness of the related measures to contain the virus and other prolonged impacts of the pandemic;
◾The cyclical nature of the markets in which we operate, competitor behavior, customer consolidation, customer purchase and spending behavior,deployments and rollout timing;
◾Price erosion largely driven by competition challenging the connectivity business models of our customers;
◾Our dependency on a limited number of customers and large multi-year agreements/turnkey projects;
◾Competitiveness of or developments regarding pricing and agreement terms we offer, including developments with respect to customer financing orextended payment terms or credit lines that we provide our customers; and
◾Willingness of banks or other institutions to purchase our receivables.
Our competitiveness◾Our ability to adapt to changing business models, technological changes and to meet new competition;
◾Our ability to make and successfully integrate acquisitions and investments or complete divestitures, joint ventures or partnerships;
◾Investing in new competitive high-quality products, services, upgrades and technologies that achieve or retain a broad market acceptance or bring themto market in a timely manner;
◾Our success in the development of 5G technology and the rollout and commercialization of 5G services;
◾Our capabilities to manage end-to-end costs related to our portfolio of products and services; and
◾Identifying and implementing the appropriate measures to improve cost-efficiency or to maintain achieved efficiency levels.

Table of Contents
92
Intellectual property rights, technology and brand licensing◾Our ability to create new relevant technologies, products and services through our R&D, as well as our ability to protect our innovations and to maintain
the relative strength of our intellectual property portfolio;
◾Our ability to protect and monetize our intellectual property e.g. due to market, regulatory and other developments, or court rulings in intellectualproperty-related litigation and other disputes;
◾Uncertainty relating to the evolving global regulatory landscape relating to intellectual property;
◾Developments in the concentrated smartphone market, the source of a significant portion of our patent licensing income;
◾Success and profitability of technology licensing, brand licensing and other business ventures;
◾Claims that we have allegedly infringed third parties’ IPR; and
◾Our ability to renew or finalize licenses regarding technologies that are licensed to us on acceptable commercial terms.
Geopolitical and regulatory environment◾Direct and indirect regulation and political developments regulating trade, taxes, national security, competition law, export controls and sanctions, cyber
security, and anti-corruption;
◾Changes in regulations or in their application applicable to current or new technologies or products;
◾Emerging new regulation applicable to current or new technologies or products;
◾Our products and services meeting all relevant quality, health, safety or security standards and other recommendations and regulatory requirementsglobally;
◾Compliance with laws and regulations relating to privacy, data protection, and the protection or transfer of personal data; and
◾Our ability to maintain an effective system of governance and compliance processes, disclosure controls and internal control over financial reporting.
Business operations◾Our manufacturing, service creation, delivery, logistics or supply chain to operate without significant interruptions or shortages;
◾Performance capabilities of our partners and suppliers and their high standards to meet product quality, health, safety or security requirements orcomply with other regulations or local laws;
◾Inefficiencies, breaches, malfunctions or disruptions of our information technology systems and processes or disruptions of services relying on our orthird-party IT;
◾Actual or perceived security or privacy breaches, as well as defects, errors or vulnerabilities in our technology and that of third-party providers;
◾Damage caused to existing undersea infrastructure during installation or maintenance of undersea telecommunications cable networks;
◾Our ability to retain, develop and recruit appropriately skilled employees in the right locations and to maintain motivation and energy as our efforts toevolve our business and improve efficiency continue;
◾The degree of control and level of influence in the joint ventures where Nokia is the minority partner or where Nokia does not have direct managementcontrol; and
◾Natural or man-made disasters, military actions, labor unrest, civil unrest or health crises impacting our service delivery or production sites or theproduction sites of our suppliers, which are geographically concentrated.
Financial and taxes related uncertainties◾Complex tax laws and rules as well as diverse tax authority practices and interpretations;
◾Our ability to utilize our tax attributes and deferred tax assets;
◾Access to sources of funding on favorable terms (or at all);
◾Our ability to re-establish investment grade rating or maintain our credit ratings;
◾Exchange rate fluctuations impacting our net sales, costs and results of operations, as well as the US dollar value of our dividends and market price ofour ADSs;
◾Pension and post-employment cost-related risks and our ability to avoid or control costs resulting from a need for increased funding; and
◾Recoverablity of the carrying amount of our goodwill, which could result into significant impairment charges.
Matters regarding ownership of our shares◾The amount of dividend and/or repayment of capital distributed to shareholders for each financial period is uncertain;
◾Volatility of the trading price of our shares and ADSs, including as a result of factors outside our control; and
◾Shareholders may be required to provide detailed information to obtain advantageous withholding tax treatment for dividends.
Table of Contents
93
Full risk factor discussionRisks related to our strategy and its executionWe may be unable to successfully implement our strategic plans, the new operating model, sustain or improve the operational and financialperformance of our business groups, correctly identify or successfully pursue business opportunities or otherwise grow our business.We operate in rapidly changing and innovative industries and the opportunities we pursue require significant investments in innovation in order to generategrowth, profitability or other targeted benefits across our business. On October 29, 2020, we announced a new operating model that became effective onJanuary 1, 2021 and that we are renewing our strategy planned to be announced at Capital Markets Day on March 18, 2021. The aim of our new operatingmodel with four P&L responsible business groups is to better align with the needs of our customers, increase accountability, reduce complexity, improvecost-efficiency as well as to have a more rigorous approach to capital allocation and we will invest to win in those segments where we choose to compete.If we are unable to successfully implement the new operating model and achieve the goals set for it, this could have a material impact on our results ofoperations and financial condition.
Our strategic plans, which include targeted investments in our business and pursuing new business opportunities based on identified trends andopportunities, even if successful, may not yield a return on our investment as planned or at all. There can be no assurance that we will correctly identifytrends or opportunities to pursue or be able to achieve the goals or targets we have set. Furthermore, there can be no assurance that our investments willresult in technologies, products or services that achieve or retain broad or timely market acceptance, answer to the expanding needs or preferences of ourcustomers or consumers, or breakthrough innovations that we could otherwise utilize for value creation. As an example, while we believe that the progressof cloudification and open RAN/openness creates an opportunity for us to differentiate with our products and to serve our customers better, it may lead toentry of new competitors with different business models and, on the long-term horizon, could attempt to disaggregate the hardware from the software tobuild multi-vendor RAN networks. The virtualization of core and radio networks and the convergence of IT and telecommunications may lower barriers ofentry for IT and webscale companies in the traditional telecommunications industry or they may build up tight strategic partnerships with our traditionalcompetitors or our communication service provider customers. The enhanced competition might result in increased price competition and negatively affectour margins. Virtualization and disaggregation might also affect other parts of our portfolio and lead to changes in competitive landscape, business models,and margin profile. Our success is dependent on our ability to develop market recognition as a leading provider of technology, software and services in theinformation technology and communications and related services business in the industries and markets in which we operate.
We target on a continuous basis various improvements in our operations and efficiencies through investing in R&D, entering into licensing arrangements, acquiring businesses and technologies, recruiting expert employees and partnering with third parties or forming joint ventures. There can be no assurance that our efforts will generate the expected results or improvements in our operations or that we will achieve our intended targets or financial objectives related to such efforts. For instance, the underlying business case in terms of profits, revenue, strategic impact or otherwise justifying the creation or continuation of the arrangement may not be realized.
We may be unable to successfully implement planned transactions or transactions may result in liabilities.From time to time, as part of our strategy, we may consider and engage in possible transactions, such as acquisitions, divestments, mergers, joint venturesor minority investments that could complement our existing operations and enable us to grow our business or shift focus via divestitures of our existingbusinesses or operations. We may engage in further transactions, such as acquisitions, divestments, mergers, joint ventures or minority investments in thefuture. Additionally, we may make investments in certain investment funds, including NGP Capital, that invest in other companies.
The transactions that we initiate may not ultimately be completed on favorable terms or at all or provide the benefits or return on investment that we hadoriginally anticipated. After reaching an agreement for a transaction, we may need to satisfy pre-closing conditions on acceptable terms, which mayprevent us from completing the transaction or result in changes to the scope of the transaction. Furthermore, our initial assumptions may be incorrect inevaluating a transaction. Therefore, we may be exposed to unknown, larger or contingent liabilities of acquired businesses, such as those related tocontractual obligations, taxes, pensions, environmental liabilities, disputes and compliance matters. Transactions may result in claims between the parties(including, but not limited to, any indemnification or breach of contract claims), which can consume time and management attention, and the outcome ofany claims related to transactions may be difficult to predict. Additionally, there are multiple other events or conditions that can hamper or delay atransaction or impact our ability to realize value from the transaction, including:
◾Unanticipated delays or inability to proceed with transactions as planned, for instance, due to issues in obtaining regulatory or shareholder approvals,completing public offers or proposals, the imposition of conditions on the acquirer of a business to divest certain assets or impose other obligations dueto competition laws or other regulations;
◾Unanticipated costs or changes in scope, for instance due to issues with regulators or courts imposing terms on a transaction or obstacles that result inchanges required in the scope of the transaction;
◾The potential loss of key employees, customers and suppliers;
◾Unanticipated changes in business, industry or general economic conditions that affect the assumptions underlying the acquisition;
◾Impairments related to goodwill and other intangible assets, for instance due to business performance after an acquisition or differences in evaluatingthe goodwill with respect to the acquired businesses;
◾Unexpected costs associated with the integration or the separation of the business as applicable;
◾Additional payment obligations and higher costs resulting from non-performance by divested businesses;
◾Exposure to contingent liabilities in connection with any regulatory or compliance failures relating to divested products or any indemnity we provide tothe purchaser in connection with such divestment;
◾Our dependence on some of the divested businesses as our suppliers in the future; and
◾High transaction costs.

Table of Contents
94
We may be unable to realize the anticipated benefits, synergies, cost savings or efficiencies from acquisitions, and we may encounter issues orinefficiencies related to our organizational and operational structure, including being unable to successfully implement our business plans.The level of effort required for successful integration of acquired businesses or assets depends on the complexity of the acquired business or asset. Therecan be no assurance that we will be able to realize the intended organizational and operational benefits and potentially targeted cost savings related to ourbusiness plans in the manner or within the timeframe currently anticipated. The risks and uncertainties relating to the integration include, among others,the distraction of our management’s attention from our business resulting in performance shortfalls, the disruption of our ongoing business, interferencewith our ability to maintain our relationships with customers, vendors, regulators and employees and inconsistencies in our services, standards, quality,product road maps, controls, procedures and policies, any of which could have a material adverse effect on our business, financial condition and results ofoperations.
These failures could be triggered, among others, by the following factors impacting the integration process and operations:
◾adverse contractual issues with respect to various agreements with third parties, employment agreements, or pension and other post-employmentbenefits-related funding or liability issues;
◾our failure to identify issues and liabilities at the target business or assets during the due diligence and pre-acquisition process;
◾disruptions caused, for instance, by reorganizations, which may result in inefficiency within the new organization through loss of key employees ordelays in implementing our intended structural changes, among other issues;
◾inability to rationalize or streamline our organization or product lines/services or to retire legacy products and related services as a result of pre-existingcustomer commitments;
◾loss of, or lower volume of, business from key customers, or the inability to renew agreements with existing customers or establish new customerrelationships, including limitations linked to customer policies with respect to aggregate vendor share or supplier diversity policies or increased effortsfrom competitors aiming to capitalize on disruptions;
◾conditions and burdens imposed by laws, regulators or industry standards on our business or adverse regulatory or industry developments or litigationaffecting us;
◾issues relating to fraud, non-compliance with applicable laws and regulations, improper accounting policies, improper internal control or other improperactivities;
◾challenges relating to the consolidation or ongoing integration of corporate, financial data and reporting, control and administrative functions;
◾the coordination of R&D, marketing and other support functions of the combined business may fail or cause inefficiencies or other administrativeburdens; and
◾our inability to eliminate the complexity of our corporate structure following the acquisition.
Additionally, the anticipated cost reductions and other benefits expected to arise from the acquisitions and integration of businesses, as well as relatedcosts to implement such measures, are derived from our estimates, which are uncertain. The underlying assumptions are inherently uncertain and subjectto a variety of significant business, economic, and competitive factors, risks and uncertainties that could cause our actual results to differ materially fromthose contained in the expected synergy benefits and related cost estimates.
As previously disclosed, we were made aware of certain practices relating to compliance practices at the former Alcatel-Lucent business that have raisedconcerns. We voluntarily reported the matter to the relevant regulatory authorities and we continue to cooperate with them. We have seen no evidence thatwould suggest that criminal penalties would apply in this case, and we believe it is highly likely that any penalties that might apply would be limited andimmaterial.
Risks related to the general economic and financial market conditions and the industries and marketsin which we operateWe may be materially and adversely affected by general economic and financial market conditions and other developments in the economieswhere we operate.As we are a company with global operations and sales in many countries around the world, our sales and profitability are dependent on general economicand financial market conditions both globally and locally. We have manufacturing facilities and suppliers located in various countries around the world thatmay equally be impacted by these conditions. Adverse developments in, or the general weakness of, economic conditions, such as unemployment orconsumer spending, may have an adverse impact on the spending patterns of end-users. This, in turn, may affect demand for consumables, such asmobile devices, mobile subscriptions and related services, which would have an adverse effect on Nokia Technologies. In our Networks and NokiaSoftware segments, this may also affect both the services that end-users subscribe to and the usage levels of such services, which may lead serviceproviders to invest less in related infrastructure and services or to invest in low-margin products and services. Likewise, adverse developments ineconomic conditions may lead certain customer segments, such as webscale companies, TXLE, transportation, energy and public safety, to invest less ordelay spend in infrastructure and services to digitize their operations or to invest in low-margin products and services. Negative market developmentsaffecting our customers (including our licensees) and their end-users may also be caused by other adverse conditions such as natural or man-madedisasters, geopolitical disruptions, civil unrest or health crises.
General uncertainty and adverse developments in the financial markets and the general economy could have a material adverse effect on our or our partners’ or suppliers’ ability to obtain sufficient or affordable financing on satisfying terms, having in turn an adverse effect on our ability to deliver our products and services in time and with acceptable quality. Uncertain market conditions may increase the price of financing or decrease its availability. We or our suppliers could also encounter difficulties in raising funds or accessing liquidity necessary to maintain financial condition and results of operations.
Depending on the duration of the COVID-19 outbreak and disruptiveness of the related measures to contain the virus, the pandemic could havefurther adverse effect on the results of our operations and financial condition.The impact of COVID-19 on our operations in 2020 was primarily related to temporary factory closures in the first half of the year. Although we believe thatour industry is relatively resilient to the effects of COVID-19, customer demand and/or our capacity to meet customer demand could be further impacted inthe future. The measures taken by the governmental authorities have adversely affected and/or may further adversely affect our employees, supply chain,product development, service delivery and other operations. Any of such events could have a material adverse effect on

Table of Contents
95
our results of operations and financial condition. The impact of COVID-19 on the global economy and financial markets has also adversely affected and/ormay further adversely affect the value of our financial, tax, pension and other assets. In addition, the spread of COVID-19 has caused us to modify ourbusiness practices (including employee travel, employee work locations, and cancellation of physical participation in meetings, events and conferences),and we may take further actions as may be required by government authorities or determined by us to be necessary to protect our employees. Werecognize that this pandemic has significantly increased the number of employees and suppliers working from home or remotely, which inherently raisesthe vulnerability of IT security environment. As a result, we have adapted our IT security training, processes and tools accordingly. There is no certaintythat the measures we or the governments take will be sufficient to mitigate the risks posed by the virus. The continued spread of COVID-19 could causefurther disruption or delays in our operations and/or the operations of our suppliers, partners, customers and/or licensees. The degree to which COVID-19affects the Nokia's operations, results, assets and financial condition will depend on future developments, which are highly uncertain and cannot bepredicted, including, but not limited to, the duration and spread of the outbreak, its severity, locations impacted, the actions to contain the virus or treat itsimpact, and how quickly and to what extent normal economic and operating conditions can resume. For instance, despite the upcoming 5G cycle ofinvestments, the severity and length of the COVID-19 pandemic might result in a net decline of our key markets and cause delay of private wirelessinvestments from large enterprises.
We face intense competition and are dependent on development of the industries and markets in which we operate. The information technologyand communications industries and related services market are cyclical and are affected by many factors, including the general economicenvironment, technological changes, competitor behavior, customer consolidation, purchase and spending behavior of service providers andvertical customers, consumers and businesses, deployments and rollout timing. Our competition and new competition challenging theconnectivity business models of our customers are driving price erosion.The competitive environment in the markets where we operate, including the information technology and communications and related services market innumerous markets around the world, continues to be intense and is characterized by maturing industry technologies, 5G and related new technologies,equipment price erosion and aggressive price competition. For instance, we are particularly dependent on the investments made by service providers innetwork infrastructure and related services. The pace and size of such investments are in turn dependent on the ability of service providers to increasetheir subscriber numbers, reduce churn, maintain or increase their average revenue per user, and compete with business models eroding revenue fromtraditional voice, messaging and data transport services, as well as the financial condition of such service providers. Further, the purchasing power of ourcustomers, particularly in developing markets, depends to a greater extent on the price development of basic commodities and currency fluctuations,which may render our products or services unaffordable.
We continue to face intense competition, including from companies based in China, that endeavor to gain market share in selected regions where Nokiahas a large footprint. Despite exponential growth in mobile data traffic, most of our customer base has been facing persistent revenue erosion and isreverting to vendors to compensate for it. Competition for new customers, as well as for new infrastructure deployment, is particularly intense and focusedon the favorability of price and agreement terms. We compete with companies that have large overall scale, which affords such companies more flexibilitycompared with us. In addition, new competition may be entering the network infrastructure and related services business through new technologies (suchas virtualized RAN and O-RAN) or business models (such as products/services as-a-service models).
Service providers’ cost reductions and network sharing, and industry consolidation among operators have reduced the amount of available business,resulting in further competition and pressure on pricing and profitability. Consolidation of operators may result in vendors and service providersconcentrating their business in certain service providers and increasing the possibility that agreements with us are terminated or not renewed. Mergeractivity between our customers has in the past constricted, and may continue to do so, such customers’ capital expenditure. In addition, the investments ofthe service providers in the new spectrum assets may reduce their funds available for investing in the new network infrastructure and related services.Furthermore, the level of demand by service providers and other customers that purchase our products and services can change quickly and can varyover short periods of time. In addition, a portion of our revenues is driven by the timing of completion and customer acceptances, which particularly inrelation to 5G are further dependent on maturity of the whole 5G ecosystem. As a result of the uncertainty and variations in the telecommunications andvertical industries, accurately forecasting revenues, results and cash flow remains difficult. Significant reduction of business with us could result in the lossof benefits related to economies of scale.
We may be unable to respond successfully to technological changes in the markets in which we operate. Market developments favoring new technologicalsolutions, such as SDN, cloud and virtualization, may result in reduced spending for the benefit of our competitors who have, or may have, a strongerposition in such technologies. The technological viability of standardized, low-margin hardware products in combination with the virtualization of functionscan induce a change in purchase behavior, resulting in favoring other vendors or in higher bargaining power versus Nokia due to more alternative vendors.Our customers may prefer best-of-breed from multiple vendors or turn to alternative vendors to maintain end-to-end services. Additionally, new competitorsmay enter the industry as a result of acquisitions or shifts in technology. Furthermore, some companies, including webscale companies, may drive a fasterpace of innovation in telecommunication infrastructure through more collaborative approaches and open technologies across access, backhaul, core andmanagement.
We expect to generate a significant share of our growth from new customers, including webscale companies and vertical customers in energy, transport,public sector, manufacturing and TXLEs. Each of these sectors may face adverse industry developments, which may significantly impact the size ofinvestments addressable by us and our ability to address these investments, in terms of both having the right products available and being able to attainnew customers and having the right go-to-market capabilities and expertise to address the specific needs of these sectors. Furthermore, there are variousincumbent and new players competing with Nokia in these customer groups we strategically target. With these types of customers, the nature ofcompetition and the required capabilities can be significantly different from the communication service provider market, including competition based onaccess network, core network, cloud infrastructure, platforms, applications and devices, and related services.
We may be adversely affected by developments with respect to customer financing or extended payment terms that we provide to ourcustomers. Unwillingness of banks or other institutions to provide guarantees or financing to our customers or purchase our receivables couldimpair our capability to enter new customers or markets, mitigate payment risk and to manage our liquidity.Requests for customer financing and extended payment terms are typical for our industry and uncertainty in the financial markets, among other things,may result in increased customer financing requests.
As a strategic marketing requirement, we arrange and facilitate financing or provide extended payment terms to a number of our customers, typicallysupported by export credit agencies or through the sale of related deferred receivables. In certain cases, the amounts and duration of these financings andtrade credits, and the associated impact on our working capital, may be significant. Furthermore, reduced availability of export credits supporting our salescould affect our ability to attract customers and enter new markets thus facing the possibility of reduced sales.
In the event that export credit agencies face future constraints on their ability or willingness to provide guarantees or financing to our customers, or there isinsufficient demand from banks or other financial institutions to purchase receivables, such events could have a material adverse effect on our businessand financial condition. We have agreed to extended payment terms for a number of our customers and may continue to do so in the

Table of Contents
96
future. Extended payment terms may result in a material aggregate amount of trade credits. Even when the associated risk is mitigated by a diversifiedcustomer portfolio, defaults in the aggregate could have a material adverse effect on us.
Our ability to manage our total customer financing and trade credit exposure depends on a number of factors, including capital structure, market conditionsaffecting our customers, the levels and terms of credit available to us and our customers, the cooperation of export credit agencies and our ability tomitigate exposure on acceptable terms. We may be unsuccessful in managing the challenges associated with the customer financing and trade creditexposure that we may face from time to time, particularly in difficult financial conditions on the market. While defaults under financings, guarantees andtrade credits to our customers resulting in impairment charges and credit losses have not been significant for us in the past, these may increase in thefuture, in particular in markets such as India with increased risks potentially affecting our customers. Further, commercial banks may not continue to beable or willing to provide sufficient long-term financing, even if backed by export credit agency guarantees, due to their own constraints. Additionally,certain of our competitors may have greater access to arranging such financing, which could adversely affect our ability to compete in similar manner forbusiness opportunities in the markets in which we operate.
We have sold certain receivables to banks or other financial institutions to mitigate the payment risk and improve our liquidity, and any significant change inour ability to continue this practice could impair our capability to mitigate such payment risk and to manage our liquidity.
Nokia arranges bank guarantees and issues commercial guarantees in customers’ favor in relation to our business. We may not be able to collectoutstanding guarantees and bonds that could limit our possibilities to issue new guarantees and/or bonds, which are required in customer agreements orpractices. We also face risks that such commercial guarantees and bonds may be unfairly called.
We are dependent on a limited number of customers and large multi-year agreements. The loss of a single customer or contract, operatorconsolidation, unfavorable contract terms or other issues related to a single agreement may have a material adverse effect on our business andfinancial condition.A significant proportion of the net sales and profits that we generate have historically been derived from a limited number of customers. As consolidationamong existing customers continues, it is possible that an even greater portion of our net sales will be attributable to a smaller number of large serviceproviders operating in multiple markets. These developments are also likely to increase the impact on our net sales based on the outcome of certainindividual agreement tenders.
Service providers are increasingly entering into network sharing arrangements, as well as joint procurement agreements, which may reduce theirinvestments and the number of networks available for us to service. Furthermore, procurement organizations of certain large service providers sellconsulting services to enhance the negotiating position of small operators with their vendors. As a result of these trends and the intense competition in theindustry, we may be required to agree to increasingly less favorable terms in order to remain competitive. Any unfavorable developments in relation to, orany change in the agreement terms applicable to, a major customer may have a material adverse effect on our business, results of operations andfinancial condition. Also, due to the long-term nature of the agreements, it is possible that the contract terms of the agreement may prove less favorable tous than originally expected, for instance due to changes in costs and product portfolio decisions. Furthermore, in particular given the bargaining power ofour customers or limited legal ability to deviate from the standard governmental contract terms, we may be exposed to onereous terms and liabilities in ourcustomer contracts.
During 2020, we have lost share at one large North American customer. The loss of a single customer or contract, or other issues related to a singleagreement, may have a material adverse effect on our business and financial condition. Furthermore, any suspension, termination or non-performance byus under an agreement’s terms may have a material adverse effect on us, for example due to penalties for breaches, early termination or reduced ordersor customer footprint. In addition, we may lose existing agreements, or we may be unable to renew or gain new agreements, for instance due to customerdiversity policies that limit the ability of customers to have one network provider exceeding a certain threshold of business in a given market.
Agreements in the networks infrastructure business are typically complex and long-term in nature and over time the contracts may turn commercially lesssuccessful than anticipated. The timing of sales and results of operations associated with large multi-year agreements or turnkey projects may differ fromexpectations. For instance, recognition of sales and related costs in network implementation projects is often linked with achievement of customeracceptances, which may delay for reasons contributable or not contributable to us. Moreover, such agreements often require dedication of substantialamounts of working capital and other resources, which may adversely affect our cash flow, particularly in the early stages of an agreement’s term, or mayrequire us to continue to sell certain products and services, or to sell in certain markets that would otherwise be discontinued or exited, thereby divertingresources from developing more profitable or strategically important products and services, or focusing on more profitable or strategically importantmarkets. Furthermore, our customer agreements may involve complex transformation of the networks as the customers deploy new technologies and therelated costs and scope of required deliverables may differ from our expectations at the time we enter into such agreements.
Risks impacting our competitivenessWe may fail to effectively and profitably invest in new competitive high-quality products, services, upgrades and technologies or bring them tomarket in a timely manner. We also may fail to adapt to changing business models.Our business and the markets where we operate are characterized by rapidly evolving technologies, frequent new technological requirements, productfeature introductions and evolving industry standards. The participants in the information technology, communications and related services marketcompete on the basis of product offerings, technical capabilities and quality in addition to price and affordability through consumer financing arrangements.As a result, our business performance depends on the timely and successful introduction of new products, services and upgrades of current products tomeet the evolving requirements of customers, comply with emerging industry standards and address competing technological and product developmentscarried out by competitors while keeping prices and costs at competitive levels.
The R&D of new and innovative, technologically advanced products, as well as upgrades to current products and new generations of technologies, is acomplex and uncertain process requiring high levels of innovation and investment, in addition to accurate anticipation of technological, regulatory andmarket trends. We may focus our resources on products and technologies that do not become widely accepted or ultimately prove unviable. Additionally,many of our current and planned products are highly complex and may contain defects or errors that are, for instance, detected only after deployment intelecommunications networks. Our results of operations will depend to a significant extent on our ability to succeed in the following areas:
◾maintaining and developing a competitive product portfolio and service capability that are attractive to our customers, for instance by keeping pace withtechnological advances in our industry and pursuing the technologies that become commercially accepted and price competitive;
◾continuing to introduce new products and product upgrades successfully and on a cost-efficient and timely basis;
Table of Contents
97
◾developing new or enhancing existing tools for our service offerings;
◾optimizing the amount of customer or market-specific technology, product and feature variants in our product portfolio;
◾continuing to meet expectations and enhance the quality of our products and services as well as introducing products and services that have desiredfeatures and attributes, such as energy efficiency;
◾maintaining and building up strategic partnerships in our value creation chain (e.g. in product creation and project delivery); and
◾leveraging our technological strengths.
Certain of our competitors have significant resources to invest in market exploration and may seek new monetization models or drive industry developmentand capture value in areas where we may not currently be competitive or do not have similar resources available to us. These areas may includemonetization models linked to large amounts of consumer data, large connected communities, home or other entertainment services, alternative paymentmechanisms or marketing products. We also face competition from various companies that may be able to develop technologies or products that becomepreferred over those developed by us or result in adverse effects on us through, for instance, developing technological innovations that make ourinnovations less relevant. In addition, reduced government funding and support for our R&D activities could affect our ability to develop new technology orproducts.
We must invest effectively and profitably in new competitive products, services, upgrades or technologies (such as 5G, IoT, the cloud or software) andmanage proactively the costs related to our portfolio of products and services (including component sourcing, manufacturing, logistics and otheroperations). However, we may still fail to maintain or improve our market position, competitiveness or scale, or we may fail to leverage our scale to thefullest extent and keep prices and costs at competitive levels or provide high-quality products and services.
We may encounter difficulties and challenges in the development of 5G technology and the rollout and commercialization of 5G services.One of our primary operational objectives is the rollout of our 5G networks. Our 5G-related R&D efforts as well as product rollouts require us to devotefinancial and operational resources, and we expect to continue to make substantial investments in 5G and 5G-related technology. However, the 5G rolloutand commercialization has not and may not develop in the manner or in the time periods we anticipate. The acceleration of the 5G rollout andcommercialization requires us and our partners to accelerate the related R&D, manufacturing and supply chain efforts, which have and may risk ourreadiness to meet the timelines of our customers. Further, competitive intensity remains high in the market as competitors seek to take share in the earlystage of 5G, which is creating a risk of persistent high price erosion in the industry. If domestic and global economic conditions worsen, overall spendingon 5G infrastructure may be reduced or delayed, and spending in our other networks products and services might be even more rapidly reduced topreserve the customer investment in 5G, which would adversely impact demand for our products and services in these markets.
Even if the 5G infrastructure market develops in the manner or in the time periods we anticipate, if we do not have timely, competitively priced, market-accepted products available to meet our customers’ planned rollout of 5G networks or, if we have products below expected performance in the commercialnetworks, we may miss significant opportunities or, in the worst case, lose already awarded business. We have faced and may face challenges withrespect to the R&D roadmaps, SoC chipset development and cost competitiveness of our 5G products and our actions and investments to acceleratethose roadmaps and improve our cost competitiveness to address those challenges may prove to be insufficient. Further, any reduction in our marketshare in 5G compared with our installed base in 4G due to decisions to protect our profitability, inability to meet the customers’ requirements or otherreasons, may have a material negative effect on our scale and profitability.
Our efforts aimed at managing and improving our competitiveness, financial or operational performance may not lead to targeted results,benefits, cost savings or improvements.We are continuously targeting increased efficiency of our operations. For instance, we have recently completed our operating cost and productionoverheads savings program and have announced changes to our operating model (effective as of January 1, 2021) aiming at better accountability andtransparency, reduction of complexity and further improving cost-efficiency. Failure by us to determine the appropriate prioritization of operating expensesand other costs, to identify and implement the appropriate measures to improve cost-efficiency, increase simplicity or to adjust our operating expenses andother costs on timely basis, or to maintain achieved efficiency levels, could have a material adverse effect on our business, results of operations andfinancial condition. We may, in the ordinary course of business, institute new plans for restructuring measures or implement various programs aimed atimproving cost savings and financial performance. Such measures may be costly, potentially disruptive to operations, and may not lead to sustainableimprovements in our overall competitiveness and profitability and there can be no assurance that such measures will be met as planned in contemplatedtimeframes or at all. Our plans may be altered in the future, including adjusting any projected financial or other targets. The anticipated costs or the level ofdisruption expected from implementing such plans or restructurings may be higher than expected. Efforts to plan and implement cost-saving initiatives maydivert management attention from the rest of the business and adversely affect our business.
There are also several other factors that may prevent or delay a successful implementation of any cost-saving initiatives, including, among others, thefollowing:
◾need to make additional investments in other areas such as 5G and automation/digitalization of our operations;
◾changes in the general economic conditions, whether globally, nationally or in the markets in which we operate or inaccuracy in our expectations withrespect to market growth, customer demand and other trends;
◾legislative constraints or unfavorable changes in legislation in the markets in which we operate may influence timing, costs and expected savings ofcertain initiatives contemplated;
◾our ability to swap equipment of certain customers in line with our future product lines development and to secure continued business from suchcustomers;
◾our ability to align and adjust resources, systems and tools, including digitalization and automation, related to implementation of planned organizationalchanges;
◾our cost-saving initiatives, including R&D, may negatively affect our ability to develop new or improve existing products and compete effectively incertain markets, and there is no guarantee that we will continue to be able to successfully innovate or remain technologically competitive;
◾intended business plans may require us to inform or consult with employees and labor representatives, and such processes may influence the timing,costs and extent of expected savings and the feasibility of certain of the initiatives contemplated; and

Table of Contents
98
◾bargaining power of our suppliers may prevent us from achieving targeted procurement savings.
Risks associated with intellectual property rights, technology and brand licensingOur patent licensing income and other intellectual property-related revenues are subject to risks and uncertainties such as our ability tomaintain our existing sources of intellectual property-related revenue, establish new sources of revenue and protect our intellectual propertyfrom infringement. A proportionally significant share of the current patent licensing income is generated from the smartphone market, which israpidly changing and features a limited number of large vendors.We have a long history of continuously investing significantly in R&D to develop new relevant technologies, products and services for our business. As aresult, we have maintained a strong intellectual property portfolio, which our products and services and future cash generation and income depend on.Many of our products and services use or are protected by patents in our portfolio.
The continued strength of our intellectual property portfolios depends on our ability to create new relevant technologies, products and services through ourR&D activities and to protect our intellectual property rights (IPR). If those technologies, products and services do not become relevant, and thereforeattractive to licensees, the strength of our intellectual property portfolios could be reduced, which could adversely affect our ability to use our intellectualproperty portfolios for revenue generation. Despite the steps that we have taken to protect our technology investments with IPR, we cannot be certain thatany rights or pending applications will be granted or that the rights granted in connection with any future patents or other IPR will be sufficiently broad toprotect our innovations and maintain the relative strength of our portfolio. Third parties may infringe our intellectual property relating to our proprietarytechnologies or disregard their obligation to seek necessary licenses under our patents or seek to pay less than reasonable license fees. As a result, wemay be unable to continue to develop or protect our intellectual property-related revenue or establish new sources of revenue.
Nokia Technologies business group’s sales and profits are currently largely derived from patent licensing. Our ability to protect and monetize ourintellectual property may depend on regulatory and other developments in various jurisdictions with respect to protection awarded to technologyinnovations or compensation trends with respect to licensing and the actions or implementation of the regulations by administrative bodies. Any patents orother IPR may be challenged, invalidated or circumvented, and any right granted under our patents may not provide competitive advantages for us. Ourability to protect, license or divest our patented innovations may vary by region. In the technology sector generally, certain licensees are actively avoidinglicense payments, while some licensors are using aggressive methods to collect license payments, with both behaviors attracting regulatory attention.Authorities in various countries have increasingly monitored patent monetization and may aim to influence the terms on which patent licensingarrangements or patent divestments may be executed, which could compromise control over or protection of our technology and proprietary information.Such terms may be limited to a certain country or region; however, authorities could potentially seek to widen the scope and even impose global terms,potentially resulting in an adverse effect on us or limiting our ability to monetize our patent portfolios.
Patent licensing income may be adversely affected by general economic conditions or adverse market developments. Their impact is particularly relevantin the current climate, influenced heavily by COVID-19 and its effects on the world markets. For example, our patent licensing business may be adverselyaffected if a licensee’s ability to pay is reduced or it becomes insolvent or bankrupt. Additionally, poor performance of potential or current licensees maylimit a licensee’s motivation to seek new or renew existing licensing arrangements with us. In certain cases, patent licensing income is dependent on thesales of the licensee, where the reduced sales of the licensee have a direct effect on the patent licensing income received by the Nokia Technologiesbusiness group. Furthermore, patent license agreements can cover both licensees’ past and future sales, and the portion of the income that relates tolicensees’ past sales is not expected to have a recurring benefit and ongoing patent income from licensing is generally subject to various factors (forinstance, sales by the licensees) that we have little or no control over, and it can vary considerably from time to time based on factors such as the terms ofagreements we enter into with licensees, and there is no assurance that past levels are indicative of future levels of intellectual property-related revenue.
While we seek to renew existing license agreements and negotiate new license agreements in the industries where we have established licensingprograms, we also seek to expand the scope of our licensing activities to other industries, in particular those that implement mobile communicationtechnologies. The players in some of these industries may not have traditionally paid intellectual property-related royalties, which may hamper theexpansion of our licensing activities. Entering new segments may involve litigation, while entering highly fragmented markets or markets with high volumeof licensees may affect our effectiveness and/or profitability.
We retained our patent portfolio after the sale of Devices & Services business in 2014. Following the sale of Devices & Services business, NokiaTechnologies is no longer required to agree cross-licenses to cover its handset business, which has contributed to growing our licensing revenue. Whilethis has been our practice, there can be no guarantee that this can be continued in future. Also, in the past, parts of our intellectual property developmentwere driven by innovation from the Devices & Services Business. As we no longer own this business, our future intellectual property relating to the mobilephone sector may lessen and our ability to influence industry trends and technology selections may reduce.
We also enter into business agreements separately by our business groups, which may grant certain licenses to our patents. Some of these agreementsmay inadvertently grant licenses to our patents with a broader scope than intended, or they may otherwise make the enforcement of our patents moredifficult.
To enforce our intellectual property rights against unlawful infringement, we may engage in legal actions, the outcomes of which are uncertain.Intellectual property-related disputes are common in the technology industry. Litigation and arbitration are often used to enforce patents or other rights, or to set licensing fees. In certain cases, we have initiated litigation or arbitration proceedings to enforce our rights, for instance to enforce our patents or to establish the terms of a patent license between the parties. Due to the nature of any litigation or arbitration proceedings, there can be no assurances as to the final outcome or timing of any outcome of litigation, or arbitration.
In other cases, other companies have commenced and may continue to commence actions against us seeking to establish the invalidity of our intellectualproperty, including our patents or to contest our licensing practices. In the event that one or more of our patents is challenged, a court may invalidate thepatent or determine that the patent is not enforceable, which could have an impact on our competitive position. The outcome of court proceedings isdifficult to predict and, consequently, our ability to use intellectual property for revenue generation may from time to time depend on favorable court rulings.Additionally, if any of our patents is invalidated, or if the scope of the claims in any patents is limited by a court decision, we could be prevented from usingsuch patents as a basis for product differentiation or from licensing the invalidated or limited portion of our IPR. Even if such a patent challenge is notsuccessful, the related proceedings could be expensive and time-consuming, divert the attention of our management and technical experts from ourbusiness and have an adverse effect on our reputation. Any diminution in the protection of our IPR could cause us to lose certain benefits of our R&Dinvestments.

Table of Contents
99
While the primary source of Nokia Technologies business group net sales and profits is licensing of the Nokia patents, we are also engagedwith technologies and the Nokia brand licensing and other business ventures, including technology innovation and incubation. Expected netsales and profitability for these businesses may not materialize as planned or at all.Nokia Technologies has a strategic agreement covering branding rights and intellectual property licensing with HMD global. Under the agreement, Nokiareceives royalty payments from HMD global for sales of Nokia-branded mobile phones and tablets, covering both brand and patent licensing. Nokia alsohas a small number of territorially restricted brand licensing agreements beyond mobile devices and is exploring further opportunities to license the brandin new categories. However, there can be no assurance that we will successfully reach additional new brand licensing arrangements at all or on terms thatprove satisfactory to us. The agreement with HMD global limits Nokia’s possibilities to license the Nokia brand for certain types of devices over an agreedtime and as such limiting Nokia’s licensing possibilities with respect to such devices.
Additionally, licensing the Nokia brand to HMD global and other companies could – in cases where the licensee acts inconsistently with our ethical,compliance or quality standards – negatively affect our reputation and the value of our brand, thus diminishing the business potential with respect toutilizing our brand for licensing opportunities or otherwise having a negative effect on our business. Nokia has limitations in its ability to influence HMDglobal or other brand licensees in their business and other operations, exposing us to potential adverse effects from the use of the Nokia brand by HMDglobal or other brand licensees or other adverse developments encountered by brand licensees that become attributable to Nokia. Following a loanconversion, Nokia currently has a minority shareholding in HMD global.
There can be no assurances that our Nokia Technologies business group, or any other part of Nokia, will be successful in innovation and incubation or ingenerating net sales and profits through its business plans, for instance in patent, technology and brand licensing. The industries in which we operate, ormay operate in the future, are generally fast-paced, rapidly evolving and innovative. Such industries are at different levels of maturity, and there can be noassurances that any investment we make will yield an expected return or result in the intended benefits. Additionally, we are entering into new businessareas based on our technology assets and may explore new business ventures. Such business areas or plans may be adversely affected by adverseindustry and market developments in the numerous diverse markets in which we operate, as well as by general economic conditions globally andregionally. As such, the investments may not be profitable or achieve the targeted rates of return. Particularly the consumer business environment iscurrently unstable and unpredictable due to the COVID-19 situation and poor performance by any of Nokia’s patent, technology or brand licensees mayimpact Nokia financially.
Our products, services and business models depend on technologies that we have developed as well as technologies that are licensed to us bycertain third parties. As a result, evaluating the rights related to the technologies we use or intend to use is increasingly challenging, and weexpect to continue to face claims that we have allegedly infringed third parties’ IPR. The use of these technologies may also result in increasedlicensing costs for us, restrictions on our ability to use certain technologies in our products and/or costly and time-consuming litigation.Our products and services include increasingly complex technologies that we have developed or that have been licensed to us by certain third parties. Theamount of such proprietary technologies and the number of parties claiming to own relevant IPR continue to increase. The holders of patents and otherIPR potentially relevant to these complex technologies may be unknown to us, may have different business models, may refuse to grant licenses to theirproprietary rights or may otherwise make it difficult for us to acquire a license on commercially acceptable terms. If licensing agreements are not availableon commercially acceptable terms, we could be precluded from making and selling the affected products, or could face increased licensing costs. As newfeatures are added to our products, we may need to acquire further licenses, including from new and sometimes unidentified owners of intellectualproperty. The lack of availability of licenses for copyrighted content, delayed negotiations or restrictive IPR license terms may have a material adverseeffect on the cost or timing of content-related services and products offered by us, mobile network operators or third-party service providers. Thecumulative costs of obtaining any necessary licenses are difficult to predict and may be significant.
Additionally, although we endeavor to ensure that we and the companies collaborating with us possess appropriate IPR or licenses, we cannot fully avoidthe risks of IPR infringement by suppliers of components, processes and other various layers in our products, or by companies with which we collaborate.Similarly, we and our customers may face claims of infringement in connection with the use of our products. Any restrictions on our ability to sell ourproducts due to expected or alleged infringements of third-party IPR and any IPR claims, regardless of merit, could result in a material loss of profits,costly litigation, the obligation to pay damages and other compensation, the diversion of the attention of our key employees, product shipment delays orthe need for us to develop non-infringing technology or to enter into a licensing agreement on unfavorable commercial terms.
In line with standard practice in our industry, we generally indemnify our customers for certain intellectual property-related infringement claims initiated bythird parties relating to products or services purchased from us. These may include claims from non-practicing entities having no product or servicebusiness. If such claims are made directly against our customers, we may have limited opportunities to participate in the processes including innegotiations and in defenses, or to evaluate the outcomes and resolutions in advance. All IPR indemnifications can result in significant paymentobligations for us that are difficult to estimate in advance. Moreover, our indemnification responsibilities typically arise whether or not the IPR assertionsagainst our customers have merit.
Since all technology standards that we use and rely on, including mobile communication technologies such as UMTS, LTE and 5G, or fixed linecommunication technologies, include certain IPR, we cannot avoid risks of facing claims for infringement of such rights due to our reliance on suchstandards. We believe the number of third parties declaring their patents to be potentially relevant to these standards is increasing, which may increase thelikelihood that we will be subject to such claims in the future. As the number of market entrants and the complexity of technologies increase, it remainslikely that we will need to obtain licenses with respect to existing and new standards from other licensors. While we believe most of such IPR declared oractually found to be essential to a particular standard carries an obligation to be licensed on fair, reasonable and non-discriminatory terms, not allintellectual property owners agree to apply such terms, nor do all owners agree on what is fair, reasonable and non-discriminatory. As a result, we haveexperienced costly and time-consuming litigation proceedings against us and our customers or suppliers over such issues and we may continue toexperience such litigations in the future.
From time to time, certain existing patent licenses may expire or otherwise become subject to renegotiation. The inability to renew or finalize sucharrangements or renew licenses with acceptable commercial terms may result in costly and time-consuming litigation, and any adverse result in any suchlitigation may lead to restrictions on our ability to sell certain products and could result in payments that could be significant. These legal proceedings maycontinue to be expensive and time-consuming and divert the efforts of our management and technical experts from our business and, if decided againstus, could result in unfavorable judgements, restrictions on our ability to sell our products, require us to pay increased licensing fees, costly settlements,fines or other penalties and expenses.
Our patent license agreements may not cover all the future businesses that we may enter, our existing business may not necessarily be covered by ourpatent license agreements if there are changes in our corporate structure or our subsidiaries, or our newly-acquired businesses may already have patentlicense agreements with terms that differ from similar terms in our patent license agreements. This may result in increased costs,

Table of Contents
100
restrictions in the use of certain technologies or time-consuming and costly disputes whenever there are changes in our corporate structure or oursubsidiaries, or whenever we enter into new business areas or acquire new businesses.
We make accruals and provisions to cover our estimated total direct IPR costs for our products. The total direct IPR costs consist of actual payments tolicensors, accrued expenses under existing agreements and provisions for potential liabilities. We believe our accruals and provisions are appropriate forall technologies owned by third parties. The ultimate outcome, however, may differ from the provided level, which could have an adverse impact on us.
Risks stemming from geopolitical, legal, regulatory and compliance environmentWe conduct our business globally, being subject to direct and indirect regulation and exposed to geopolitical and regulatory risks, such asunfavorable or unpredictable treatment in relation to trade sanctions, tariffs, tax matters, export controls, exchange controls, and otherrestrictions. Our governance, internal controls and compliance processes could fail to detect errors or wrongdoings and to prevent regulatorypenalties at corporate level, in operating subsidiaries and joint ventures.Our business and activities cover multiple jurisdictions and are subject to complex regulatory frameworks, political, regulatory and economic developmentssuch as political turmoil, trade barriers, tariffs, military actions, labor unrest, civil unrest, and public health and safety threats, which could have a materialadverse effect on us, our supply chain, our ability to supply products and services, including network infrastructure equipment manufactured in suchcountries, and on our sales and results of operations. Furthermore, we have observed an increase in the adoption of surveillance, data localization,national sourcing and national hiring requirements regulations and policies. Current international trends show increased enforcement activity in areas suchas national security, competition law, export control and sanctions, privacy, cybersecurity and anti-corruption. Despite our Group-wide compliancemeasures, including annual ethical business training and other measures, we may not be able to prevent breaches of law or governance standards withinour business, subsidiaries or joint ventures. If we fail to or are unable to comply with applicable law and regulations, we could experience penalties andadverse rulings in enforcement and other proceedings.
The regulatory, trade controls and sanctions legal environment can be difficult to navigate for companies with global operations, impacting our ability togrow business in specific markets or enter new markets. Export controls, tariffs or other fees or levies imposed on our products and environmental, health,product safety and data protection, security, consumer protection, money laundering and other regulations that adversely affect the export, import,technical design, pricing or costs of our products could also adversely affect our sales and results of operations. Our business may be impacted by new,existing or tightened export control regulations, sanctions, embargoes or other forms of economic and trade restrictions imposed on certain countries andentities.
As a global operator, Nokia conducts business subject to export controls regulations and business in countries subject to various sanctions. Although westrive to conduct all operations of Nokia, and in particular any operations undertaken in countries targeted by sanctions, in accordance with ourcomprehensive and robust Internal Compliance Program to ensure that they are in full compliance with all applicable laws and regulations, we cannotensure that breaches will not occur. We continuously monitor international developments and assess the appropriateness of our presence and business invarious markets. As an example, the US’ unilateral withdrawal from the international agreement on Iran’s nuclear activities has led to the reimposition ofUS sanctions while the EU and other signatories remain fully committed to the international agreement relaxing the sanctions against Iran. The divergingEU and US regulatory frameworks governing business activities in Iran continue to be complex and as a European company, it will require reconciling theopposing foreign policy regimes of the US and the EU.
The UK departed from the EU on January 31, 2020 and the terms of its withdrawal and the nature of its future relationship with the EU were decided in theform of the Withdrawal Agreement (including the Northern Ireland Protocol) which came into force on that same date and the Trade and CooperationAgreement (TCA). The latter was agreed upon at the end of 2020 and is now in force following formal ratification by the UK, while the EU is applying it onlyprovisionally until the European Parliament formally approves it. This may not happen until April 2021. The true long-term effects of Brexit will notmaterialize at least until when the various transition periods agreed in the TCA expire and are replaced by the final provisions of the TCA and thelegislative and regulatory actions undertaken by the UK. The UK retained the freedom to diverge from EU regulation, so regulatory divergence will likelyoccur. Any of the potential or actual effects of Brexit (such as delays in supply chains, lack of access to skilled human resources, increased import-exportcontrols, added bureaucracy, additional certification rules, rules of origin requirements, inability to easily transfer data) could have a negative effect on ourbusiness, both in the UK and in the EU, as well as in other countries, depending on the terms of the agreements the UK concludes with other tradingpartners.
The US continues to maintain tariffs implemented during 2019. In response, certain foreign governments have implemented or are reportedly consideringimplementing additional tariffs on US goods. Implementation of or uncertainties with respect to any tariffs, trade agreements or further escalation of a tradewar could negatively impact the global economic markets and could affect our customers’ ability to invest in capital expenditures, which may in turn resultin reduced demand for our products and services. Changes in tariffs have resulted, and may continue to do so, in changes in supply and manufacturing.
We have a significant presence in emerging markets in which the political, economic, legal and regulatory systems are less predictable than in countrieswith more developed institutions. These markets represent a significant portion of our total sales, and a significant portion of expected future industrygrowth. Most of our suppliers are located in, and our products are manufactured and assembled in, emerging markets, particularly in Asia. Our businessand investments in emerging markets may also be subject to risks and uncertainties, including unfavorable or unpredictable treatment in relation to taxmatters, exchange controls, restrictions affecting our ability to make cross-border transfers of funds, regulatory proceedings, unsound or unethicalbusiness practices, challenges in protecting our IPR, nationalization, inflation, currency fluctuations or the absence of or unexpected changes in regulation,as well as other unforeseeable operational risks. The purchasing power of our customers in developing markets depends to a greater extent on the pricedevelopment of basic commodities and currency fluctuations, which may render our products or services unaffordable.
In recent years, we have witnessed political unrest in various markets in which we conduct business or in which we have operations, which in turn hasadversely affected our sales, profitability or operations in these markets, and also in certain cases affected us outside these countries or regions. Anyreoccurrence or escalation of such unrest could have a further material adverse effect on our sales or results of operations. Should we decide to exit orotherwise alter our presence in a particular market, this may have an adverse effect on us through, for example, triggering investigations, tax audits byauthorities, claims by contracting parties or reputational damage. The results and costs of investigations or claims against our international operations maybe difficult to predict and could lead to lengthy disputes, fines or fees, indemnities or costly settlements.
Nokia is a publicly listed company and, as such, subject to various securities and accounting rules and regulations. For instance, we must monitor andassess our internal control over financial reporting and its compliance with the applicable rules and regulations. Our corporate function’s, our operatingsubsidiaries’ or our joint ventures’ failure to maintain effective internal controls over financial reporting, or to comply with the applicable securities andaccounting rules and regulations, could adversely affect the accuracy and timeliness of our financial reporting, which could result, for
Table of Contents
101
instance, in loss of confidence in us or in the accuracy and completeness of our financial reports, or otherwise in the imposition of fines or other regulatorymeasures, which could have a material adverse effect on us.
Changes in various types of regulations or in their application, or emerging new regulation (in areas such as security/privacy, digital economyor sustainable finance), applicable to current or new technologies or products, may adversely affect us.We develop our products based on existing regulations and technical standards, our predictions for, and interpretation of, unfinished technical standardsand upcoming or draft regulations or, in certain cases, in the absence of applicable regulations and standards. The regulators’ lack of appropriateframeworks, legislative support and competencies necessary to address the rapid evolution of technology in our domain presents a particular challenge.On the other hand, changes in various existing regulations or in their application, applicable to current or new technologies, products or telecommunicationand technology sectors in general, may adversely affect our business and results of operations. For example, changes in regulation or standards affectingthe construction of base stations and other network infrastructure could adversely affect the timing and costs of new network constructions or theexpansion and commercial launch and ultimate commercial success of such networks.
The COVID-19 crisis exposed the limitations of the current mechanisms for delivering connectivity, such as market and community models. While newregulatory initiatives (including cross-jurisdictional partnerships, realistic spectrum pricing for 5G deployment and tax incentives to drive infrastructuredevelopment) are being launched, their immediate impact is difficult to predict. An increase in regulation of the digital economy and telecommunicationsfollowing the European Commission’s review of Europe’s 5G Action Plan and Radio Spectrum Policy Programme could fail to find the right balancebetween political ambitions and practical considerations, which might negatively affect the further uptake of 5G services, with an adverse effect on Nokia.From a spectrum policy perspective, unrealistic spectrum pricing for 5G development, failure to enable access to additional spectrum in various bandsand/or failure to achieve frequency band harmonization could also adversely impact Nokia’s customers and Nokia itself.
Changes in applicable privacy-related regulatory frameworks, such as EU General Data Protection Regulation, the upcoming EU eEvidence and e-PrivacyRegulations and similar regulations in other countries or their application may adversely affect our business, including possible changes that increasecosts, limit or restrict possibilities to offer products or services, or reduce or could be seen to reduce the privacy aspects of our offerings. Further, althoughwe monitor for such changes and implement updates to applicable policies and compliance measures, we cannot ensure that violations will not occur. Forinstance, countries could require governmental interception capabilities or issue regulations aimed at allowing direct governmental access to data for theproducts and services we offer. Such requirements or regulations could adversely affect us, if, among other things, we decide to reduce our sales to suchmarkets or if such requirements or regulations would be limiting our ability to use components, products or software that we have developed or sourcedfrom other companies. Our current business models and operations rely on certain centralized data processing solutions and cloud or remote delivery-based services for distribution of services and software or data storage, which have certain inherent risks, including those stemming from applicableregulatory regimes, including data protection or data localization, that may cause limitations in implementing such business models or conductingbusiness. An increase in the protectionist stances of governments around the world, which impact the free flow of data across borders, is already affectingour global service delivery model. Furthermore, we observe that enforcement actions and investigations by regulatory authorities related to data securityincidents and privacy violations continue to increase. Unauthorized disclosure, transfer or loss of sensitive or confidential data, whether through systemsfailure, employee negligence, fraud or misappropriation, by the company, our vendors or other parties with whom we do business (if they fail to meet thestandards we impose) could subject us to significant litigation, monetary damages, regulatory enforcement actions, fines and criminal prosecution in one ormore jurisdictions.
We are seeing an increase in climate-related regulations and customer requirements globally and, in the longer term, such regulations or requirementscould impact our energy, component and logistic costs or impact the competitiveness of our product offering. Emerging regulation coming from theEuropean Union related to Sustainable Finance could also affect how our products are perceived by the markets. For example, the EU Taxonomy initiativeaims to define rules of which economic activities are deemed to contribute to sustainability objectives. If our products did not belong to categories definedas sustainable according to the EU Taxonomy or comply with other set standards, we could potentially experience loss of sales, profit and brand value.
Our business and results of operations may be adversely affected by regulation favoring the local industry participants, as well as other measures withpotentially protectionist objectives or outcomes that host governments in various countries may take. Governments and regulators, particularly afterchanges in political regimes, may make legal and regulatory changes or interpret and apply existing laws in ways that make our products and services lessappealing to end-users or require us to incur substantial costs, change our business practices or prevent us from offering our products and services.Restrictive government policies or actions, such as limitations on visas or work permits for certain foreign workers, may make it difficult for us to move ouremployees into and out of these jurisdictions. Our operations and employee recruitment and retention depend on our ability to obtain the necessary visasand work permits for our employees to travel and work in the jurisdictions in which we operate. Our competitors have employed and will likely continue toemploy significant resources to shape the legal and regulatory regimes in countries where we have significant operations. Achieving the right balancebetween security imperatives, technological development needs and political ambition is essential. The impact of changes in or uncertainties related toregulation and trade policies could adversely affect our business and results of operations even in cases where the regulations do not directly apply to usor our products and services.
We operate in many jurisdictions around the world, and we are subject to various legal frameworks regulating corruption, fraud, competition,trade policies, and other risk areas. At any given time, we may be subject to inspections, investigations, claims, and government proceedings,and the extent and outcome of such proceedings may be difficult to estimate with any certainty. We may be subject to material fines, penaltiesand other sanctions as a result of such investigations.Bribery and anti-corruption laws in effect in many countries prohibit companies and their intermediaries from making improper payments to public officialsor private individuals for the purpose of obtaining new business, maintaining existing business relationships or gaining any material advantage. Certainanti-corruption laws such as the United States Foreign Corrupt Practices Act (FCPA) also require the maintenance of proper books and records, and theimplementation of controls and procedures in order to ensure that a company’s operations do not involve corrupt payments. Since we operate throughoutthe world and, given that some of our customers are government-owned entities and that our projects and agreements often require approvals from publicofficials, there is a risk that our employees, suppliers, consultants or commercial third-party representatives may take actions that are in violation of ourcompliance policies and of applicable anti-corruption laws.
In many parts of the world where we operate, local practices and customs may be inconsistent with our policies, including the Nokia Code of Conduct, andcould violate anti-corruption laws, including the FCPA and the UK Bribery Act 2010, and applicable European Union regulations, as well as applicableeconomic sanctions, embargoes and applicable competition laws. Our employees, or other parties acting on our behalf, could violate policies andprocedures intended to promote compliance with anti-corruption laws, economic sanctions or competition laws. Violations of these laws by our employeesor other parties acting on our behalf, regardless of whether we had participated in such acts or had knowledge of such acts, could result in us or ouremployees becoming subject to criminal or civil enforcement actions, including fines or penalties, disgorgement of profits and suspension ordisqualification of sales. Additionally, violations of law or allegations of violations may result in reputational harm and

Table of Contents
102
loss of business and adversely affect our brand and reputation. Detecting, investigating and resolving such situations may also result in significant costs,including the need to engage external advisors, and consume significant time, attention and resources from our management and other key employees.The results and costs of such investigations or claims may be difficult to predict and could lead to, for instance, lengthy disputes, fines, fees or indemnities,costly settlement or the deterioration of the Nokia brand. Furthermore, even without allegations of misconduct against us, our employees or other partiesacting on our behalf, we may face loss of business as a result of improper conduct or alleged improper conduct by our competitors.
We may be subject to claims, fines, investigations or assessments for conduct that we failed to or were unable to discover or identify in the course ofperforming our due diligence investigations of Alcatel-Lucent, including unknown or unasserted liabilities and issues relating to fraud, trade compliance,non-compliance with applicable laws and regulations, improper accounting policies or other improper activities. With the acquisition of Alcatel-Lucent, anyhistorical issues with Alcatel-Lucent’s operations may be attributed to or the responsibility of Nokia. In the past, Alcatel-Lucent has experienced both actualand alleged violations of anti-corruption laws. As a result of FCPA violations in the past, Alcatel-Lucent had to pay substantial amounts in fines, penaltiesand disgorgement of profits to government enforcement agencies in the United States and elsewhere.
We are subject to litigation proceedings, which may be disruptive and expensive. In addition, an unfavorable outcome of litigation, arbitrations,agreement-related disputes or product liability-related allegations against our business could have a material adverse effect on us.We are a party to lawsuits, arbitrations, agreement-related disputes and product liability-related allegations in the normal course of our business. Litigation,arbitration or agreement-related disputes can be expensive, lengthy and disruptive to normal business operations and divert the efforts of ourmanagement. Moreover, the outcomes of complex legal proceedings or agreement-related disputes are difficult to predict. An unfavorable resolution of aparticular lawsuit, arbitration or agreement-related dispute could have a material adverse effect on us. The investment or acquisition decisions we makemay subject us to litigation arising from minority shareholders’ actions and investor dissatisfaction with the activities of our business. Shareholder disputes,if resolved against us, could have a material adverse effect on us.
We record provisions for pending claims when we determine that an unfavorable outcome is likely and the loss can reasonably be estimated. Although webelieve our provisions for pending claims are appropriate, due to the inherent uncertain nature of legal proceedings, the ultimate outcome or actual cost ofsettlement may materially differ from estimates.
Although our products are designed to meet all relevant safety standards and other recommendations and regulatory requirements globally, we cannotguarantee we will not become subject to product liability claims or be held liable for such claims, which could have a material adverse effect on us. Wehave been involved in several lawsuits alleging adverse health effects associated with our products, including those caused by electromagnetic fields, andthe outcome of such procedures is difficult to predict, including potentially significant fines or settlements. Even a perceived risk of adverse health effects ofmobile devices or base stations could have a material adverse effect on us through a reduction in the demand for mobile devices, for instance through adecreased demand for mobile networks or increased difficulty in obtaining sites for base stations.
For a more detailed discussion of litigation to which we are a party, refer to Note 30, Commitments, contingencies and legal matters, of our consolidatedfinancial statements included in this Annual Report on Form 20-F.
Risks related to management and operationsWe may face problems or disruptions in our or our partners’ manufacturing, service creation, delivery, logistics or supply chain. Suchchallenges include securing adequate volumes to meet the demand, adapting supply, defects in products or related software or services andachieving required efficiencies and flexibility. Our supplier or suppliers/partners may fail to meet product quality, health, safety or securityrequirements or comply with other regulations or local laws, such as environmental or labor laws. Additionally, adverse events, such asgeopolitical disruptions, natural or man-made disasters, civil unrest or health crises, may have a profound impact on our service delivery orproduction sites or the production sites of our suppliers/partners, which are geographically concentrated.We, or third parties that we outsource manufacturing/services to, may experience difficulties in adapting supply to meet the changing demand for ourproducts and services, ramping up and down production, adjusting network implementation capabilities as needed on a timely basis, maintaining anoptimal inventory level, adopting new manufacturing processes, finding the most timely way to develop the best technical solutions for new products,managing the increasingly complex manufacturing process, service creation and delivery process or achieving required efficiencies and flexibility. Inaddition, these operations are exposed to various risks and potential liabilities, including those related to geopolitics, compliance with laws and regulations,exposure to environmental liabilities or other claims.
Our manufacturing operations depend on obtaining sufficient quantities of fully functional products, components, sub-assemblies, software and services ona timely basis. Our principal supply requirements for our products are for electronic components, mechanical components and software, which all have awide range of applications in our products. In certain cases, a particular component or service may be available only from a limited number of suppliers orfrom a single supplier in the supply chain. Suppliers may from time to time extend lead times, limit supplies, change their partner preferences, increaseprices, provide poor quality supplies or be unable to adapt to changes in demand due to capacity constraints or other factors, which could adversely affectour ability to deliver our products and services on a timely basis. If we fail to properly anticipate customer demand, an over-supply or under-supply ofcomponents and production or services delivery capacity could occur. In many cases, some of our competitors utilize the same contract manufacturers,component suppliers and service vendors. If they have purchased capacity or components ahead of us, or if there is significant consolidation in therelevant supplier base, this could prevent us from acquiring the required components or services, which could limit our ability to supply our customers orincrease our costs.
A large proportion of Nokia manufacturing and field installation activities are carried out by third-party suppliers. These vary in size and often engage anumber of tiers of suppliers, which limits Nokia’s direct control. Our suppliers or a supplier may fail to meet our supplier requirements, such as our and ourcustomers’ product quality, safety, security and other standards. Certain suppliers may not comply with local laws, including, among others, local labor law,health and safety or environmental requirements. Consequently, some of our products or the manner in which services are delivered may be unacceptableto us or to our customers. This can in turn lead to exposure in the form of litigation, product recalls or brand damage through association.
Our products are highly complex and defects in their design, manufacture and associated hardware, software and content have occurred in the past andmay continue to occur in the future. Defects and other quality issues may result from, among other things, failure in our own product manufacturing andservice creation and delivery, as well as failure of our suppliers/partners to comply with our requirements, or failures in products and services createdjointly with business partners or other third parties where the development and manufacturing process is not fully within our control. Quality issues maycause, for instance, delays in deliveries, loss of intellectual property, liabilities for network outages, court fees and fines due to breaches of significantlyincreasing regulatory privacy requirements and related negative publicity, and additional repair, product
Table of Contents
103
replacement or warranty costs to us, and harm our reputation and our ability to sustain or obtain business with our current and potential customers. Withrespect to our services, quality issues may relate to the challenges of having the services fully operational at the time they are made available to ourcustomers and maintaining them on an ongoing basis. We may also be subject to damages due to product liability claims arising from defective productsand components. We make provisions to cover our estimated warranty costs for our products and pending liability claims. We believe our provisions areappropriate, although the ultimate outcome may materially differ from the provisions that are provided for, which could have a material adverse effect onus.
We may be subjected to negative publicity with respect to the activities that we manage or that are managed by third parties for us. For instance, we mayexperience challenges caused by third parties, or other external difficulties in connection with our efforts to modify our operations to improve the efficiencyand flexibility of our manufacturing, service creation and delivery, as well as our logistics, including, but not limited to, strikes, purchasing boycotts, publicharm to our brand and claims for compensation resulting from our decisions on where to place and how to utilize our manufacturing facilities. Suchdifficulties may result from, among other things, delays in adjusting production at our facilities, delays in expanding production capacity, failures in ourmanufacturing, service creation and delivery, as well as logistics processes, failures in the activities we have outsourced, and interruptions in the datacommunication systems that run our operations. Any of these events could delay our successful and timely delivery of products that meet our and ourcustomers’ quality, safety, security and other requirements, cause delivery of insufficient or excess volumes compared with our own estimates or customerrequirements, or otherwise have a material adverse effect on our sales and results of operations or our reputation and brand value.
Many of our production sites or the production sites of our suppliers/partners are geographically concentrated, with a majority of our suppliers/partnersbased in Asia. We rely on efficient logistic chain elements, such as regional distribution hubs or transport chain elements (main ports, streets, andairways). In the event that any of these geographic areas are affected by any adverse conditions, such as severe impacts of climate change or otherenvironmental events, natural or man-made disasters, geopolitical disruptions, civil unrest or health crises (such as the COVID-19 pandemic) that disruptproduction or deliveries from our suppliers/partners, our ability to deliver our products on a timely basis could be adversely affected. In a similar manner,these adverse conditions may also cause disruption to our service creation and delivery, which, in either case, may lead to a material adverse effect on ourbusiness and results of operations.
Performance failures of our partners, as well as failures to agree to partnering arrangements with third parties could adversely affect us.If any of the companies we partner and collaborate with were to fail to perform as expected, or if we fail to achieve the collaboration or partneringarrangements needed to succeed, we may be unable to bring our products, services or technologies to market successfully or in a timely manner. We areincreasingly collaborating and partnering with third parties to develop technologies, products and services, as well as seeking new revenue streamsthrough partnering arrangements. We also depend on third-party partners in our efforts to monetize our brands, including the Nokia and Nokia Bell Labsbrands and technologies, and we have outsourced various functions to third parties and are relying on them to provide certain services to us. Thesearrangements involve the commitment of certain resources, including technology, R&D, services and employees. Although the objective of thecollaborative and partnering arrangements is a mutually beneficial outcome for each party, our ability to introduce and provide products and services thatare commercially viable and meet our, our customers’ and consumers’ quality, safety, security and other standards in a timely manner could be hamperedfrom performance or other failures. For instance, if a partner acts inconsistently with our ethical, sustainability, compliance, brand, or quality standards, thiscan negatively affect our reputation, the value of our brand, and the business outcome of our partnerships.
In many areas, including IT, finance and human resources-related arrangements, a failure to maintain an efficient relationship with the selected partnermay lead to ongoing operational problems or even to severe business disruptions, and the availability of the processes and services upon which we relymay be interrupted. Performance problems may result in missed reporting deadlines, internal controls challenges, financial losses, missed businessopportunities and reputational harm. In addition, as management’s focus shifts from a direct to an indirect operational control in these areas, there is a riskthat without active management and monitoring of the relationship, the services provided may be below appropriate quality standards. Partners may notmeet agreed service levels, in which case, depending on the impacted service, our contractual remedies may not fully cure all of the damages we maysuffer. This is particularly true for any deficiencies that would impact the reporting requirements applicable to us as a company listed on multiple stockexchanges.
In order to implement outsourcing arrangements, we may be required to implement changes in our business practices and processes, for instance tocapture economies of scale and operational efficiencies, and to reflect a different way of doing business. Consequently, business processes that werecustomized for individual business groups or for us generally may be converted to a more standardized format. During a transition to outsourcing, ouremployees may need to train the partner’s staff or be trained in the partner’s systems, potentially resulting in the distraction of our employees. Adjustmentsto staff size and transfer of employees to the partner’s companies could have an adverse effect on us, for instance through impacting the morale of ouremployees and raising complex labor law issues and resulting in the loss of key personnel. Additionally, partnering and outsourcing arrangements cancreate a dependency on the outsourcing company, causing issues in our ability to learn from day-to-day responsibilities, gain hands-on experience, adaptto changing business needs and properly transfer the specific know-how to the new outsourcing partners. Concerns could equally arise from giving thirdparties access to confidential data, strategic technology applications and books and records. There is also a risk that we may not be able to determinewhether controls have been effectively implemented, and whether the partner company’s performance-monitoring reports are accurate.
Inefficiencies, breaches, malfunctions or disruptions of information technology systems and processes could have a material adverse effect onour business and results of operations. As our business operations, including those we have outsourced, rely on complex IT systems,networks and related services, our reliance on the precautions taken by external companies to ensure the reliability of our and their IT systems,networks and related services is increasing. Consequently, certain disruptions in IT systems and networks affecting our external providerscould also have a material adverse effect on our business.Our operations rely on the efficient and uninterrupted operation of complex and centralized IT systems, networks and processes, which are integrated withthose of third parties. All IT systems, networks and processes are potentially vulnerable to damage, breaches, malfunction or interruption from a variety ofsources. We are, to a significant extent, relying on third parties for the provision of IT services. We may experience disruptions if our partners do notdeliver as expected or if we are unable to successfully manage systems and processes together with our business partners. The ongoing migration tocloud-based architectures and network function virtualization has introduced further complexity and associated risk.
We are constantly seeking to improve the quality and security of our IT systems. For instance, we have introduced new significant IT solutions in recentyears. While we have outsourced certain functions, we have also increased our dependence on the reliability of external providers as well as on thesecurity of communication with them. We will often need to use new service providers and may, due to technical developments or choices regardingtechnology, increase our reliance on certain new technologies, such as cloud or remote delivery on demand-based services and certain other services thatare used over the internet rather than using a traditional licensing model. Switching to new service providers and introducing

Table of Contents
104
new technologies is inherently risky and may expose us to an increased risk of disruptions in our operations, for instance due to network inefficiency, acybersecurity or a compliance breach, malfunctions, failure in disaster recovery/IT service continuity or other disruptions resulting from IT systems andprocesses.
We pursue various measures in order to manage our risks related to system and network malfunctions and disruptions, including the use of multiplesuppliers and their strong technical and contractual engagements in IT security. However, despite precautions taken by us, any malfunction or disruption ofour current or future systems or networks, such as an outage in a telecommunications network used by any of our IT systems, or a breach of ourcybersecurity, such as an attack, malware, ransomware or other event that leads to an unanticipated interruption or malfunction of our IT systems,processes, networks or data leakages, could have a material adverse effect on our business, results of operations and brand value. Additionally, we mayfail to successfully secure our IT. A disruption of services relying on our IT, for instance, could cause significant discontent among users resulting in claims,contractual penalties or deterioration of our brand value. Further, while we are increasing our investments in digitalizing our operations and transformingour IT, the legacy IT systems may be more vulnerable to malfunction, disruptions or security breaches than the new IT systems replacing them.
We are exposed to risks related to information security. Our business model relies on solutions for distribution of services and software or datastorage, which entail inherent risks relating not only to applicable regulatory regimes, but also to cybersecurity breaches and otherunauthorized access to network data or other potential security risks that may adversely affect our business and/or compromise personal data.Our business and operations rely on confidentiality of proprietary information as well as sensitive information, for instance related to our employees,consumers and our customers. Our business models rely on certain centralized data processing solutions and cloud or remote delivery-based services fordistribution of services and software or data storage, accessible by our partners or subcontractors according to the roles and responsibilities defined.
We or our products and online services, marketing and developer sites may be subject to cybersecurity breaches, including hacking, ransomware, viruses,worms and other malicious software, unauthorized modifications, or illegal activities that may cause potential security risks and other harm to us, ourcustomers or consumers and other end-users of our products and services. IT is rapidly evolving, the techniques used to obtain unauthorized access orsabotage systems change frequently and the parties behind cyber-attacks and other industrial espionage are believed to be sophisticated and haveextensive resources, and it is not commercially or technically feasible to mitigate all known vulnerabilities in a timely manner or to eliminate all risk ofcyber-attacks and data breaches. Further, while we are increasing our investments in digitalizing our operations and transforming our IT, the legacy ITsystems may be more vulnerable to malfunction, disruptions or security breaches than the new IT systems replacing them. Additionally, we contract withmultiple third parties in various jurisdictions who collect and use certain data on our behalf. Although we have processes in place designed to ensureappropriate collection, handling and use of such data, third parties may use the data inappropriately or breach laws and agreements in collecting, handlingor using or leaking such data. This could lead to lengthy legal proceedings or fines imposed on us, as well as adverse effects to our reputation and brandvalue. Additionally, cyber-attacks can be difficult to prevent, detect or contain. We cannot rule out the possibility that there may have been cyber-attacksthat have been successful and/or evaded our detection. We continue to invest in risk mitigating actions; however, there can be no assurance that suchinvestments and actions will prevent or detect future cyber-attacks.
In connection with providing products and services to our customers and consumers, certain personal and consumer data are collected, stored andprocessed through us, either by us or by our business partners or subcontractors in various jurisdictions. We have outsourced a significant portion of our IToperations, as well as the network and information systems that we sell to third parties or for whose security and reliability we may otherwise beaccountable. Loss, improper disclosure or processing or leakage of any personal or consumer data collected by us or which is available to our partners orsubcontractors, made available to us or stored in or through our products, could have a material adverse effect on us and harm our reputation and brand.Additionally, governmental authorities may use our networks products to access the personal data of individuals without our involvement; for example,through the so-called lawful intercept capabilities of network infrastructure, impairing our reputation.
Our business is also vulnerable to theft, fraud or other forms of deception, sabotage and intentional acts of vandalism by third parties and employees.Unauthorized access to or modification, misappropriation or loss of our intellectual property and confidential information, including personal data, couldresult in litigation and potential liability to customers, suppliers and other third parties, harm our competitive position, reduce the value of our investment inR&D and other strategic initiatives or damage our brand and reputation. Additionally, the cost and operational consequences of implementing furtherinformation system protection measures, especially if prescribed by national authorities, could be significant. We may not be successful in implementingsuch measures in due time, which could cause business disruptions and be more expensive, time-consuming and resource-intensive.
We engage in the installation and maintenance of undersea telecommunications cable networks. During this activity, we may cause damage toexisting undersea infrastructure, for which we may ultimately be held responsible.We supply, install and maintain submarine optical fiber cable networks linking mainland to islands, island to island or several points along a coast. Ouractivities also include the provision of optical fiber infrastructure to oil and gas platforms and other offshore installations. Expert personnel, specialistequipment and an independently certified management system are integral to our management of risk throughout the entire planning and executionphases of such activities. We perform surveys, follow rigorous permit processes and use third-party cartographic databases maintained by recognizedhydrographic institutes. However, there is a risk that previously-laid infrastructure, such as third-party fiber optic cables, electrical power lines orhydrocarbon pipelines, may go undetected despite such precautions, and be damaged during the process of laying or maintaining the telecommunicationscables. Such an event could potentially cause temporary business interruption to third parties operating in the same area, environmental incidents, safetyaccidents, unwanted media or regulatory attention, loss of reputation, litigation, repair costs or compensation payments for the affected parties. While wehave contractual limitations in place and maintain insurance coverage to limit our exposure, these protections may be insufficient to cover such exposureentirely.
We may be unable to retain, motivate, develop and recruit appropriately skilled employees or we may fail in workforce balancing. Employeesmay face change fatigue, reduction in motivation and energy as our efforts to evolve our business and improve efficiency continue. Increase inthe share of remote working was sharp and rapid due to COVID-19 pandemic, allowing little time to adapt the respective health and safetypractices, processes and policies.Our success is dependent in part on our ability to retain, motivate, develop and recruit appropriately skilled employees. The market for skilled employeesand leaders in our business is extremely competitive. We continuously work on developing a corporate culture that is motivational, based on equalopportunities and encourages creativity and continuous learning to meet the challenges.

Table of Contents
105
We have encountered, and may in the future encounter, shortages of appropriately skilled employees or lose key employees or senior management, whichmay hamper our ability to implement our strategies and may have a material adverse effect on us. Changes in our strategy in order to respond to ourbusiness targets and endeavors and related uncertainty have caused and may in the future cause disruption, dissatisfaction and fatigue amongemployees, as our efforts to evolve our business and maximize operational efficiency continue. As a result, employee motivation, energy, focus, moraleand productivity may be reduced, causing inefficiencies and other problems across the organization resulting in the loss of key employees, difficulties inrecruiting employees and increased costs in resolving and addressing such matters. The loss of key employees could result in resource gaps, some ofwhich may only be noticed after a certain period of time or which negatively impact our relationship with customers, vendors or other business partners.We have acquired, and may from time to time acquire, businesses or complete other transactions where retaining key employees may be crucial to obtainthe intended benefits of such transactions. There can be no assurances that we will be able to implement measures successfully to retain or hire therequired employees. We believe this will require significant time, attention and resources from our senior management and other key employees within ourorganization and may result in increased costs.
We may fail in our efforts to rebalance our workforce as planned, which may result in larger than expected costs, or we may not be able to complete suchefforts, for instance due to legal restrictions, resulting in a non-optimal workforce that could hinder our ability to reach targeted cost savings. Relationshipswith employee representatives are generally managed at the site level in accordance with country-specific legislation and most collective bargainingagreements have been in place for several years. Our inability to negotiate successfully with employee representatives or failures in our relationships withsuch representatives could result in strikes by the employees, increased operating costs as a result of higher wages or benefits paid to employees as theresult of such strike or other industrial action or inability to implement changes to our organization and operational structure in the planned timeframe orexpense level, or at all. If our employees were to engage in a strike or other work stoppage, we could experience a significant disruption in our day-to-dayoperations and higher ongoing labor costs.
We continue to have exposure to the health risks of COVID-19 pandemic and to the control and mitigation measures deployed by governments to reducethe spread of the virus. We were able to pivot to remote working very effectively in the early days of the pandemic; however, these changes were requiredin short timeframes that allowed little time to adapt. We believe that this pandemic will permanently increase share of remote working, and we may beexposed to a larger extent than before to impacts related to remote work and arranging the home office, such as decreased creativity or productivity ofemployees, supervising working hours, challenges in identifying, assessing and supporting employees in stress or poor mental health, inability to helpemployees to work safely in their home office environment (e.g. furnishing, equipment, lighting, ventilation) or developing and supervising the execution ofrelated internal policies leading to potential health issues and litigation.
We are involved in joint ventures and are exposed to risks inherent to companies under joint management.We have a number of joint ventures in various parts of the world, including those where Nokia is the minority partner or where Nokia does not have directmanagement control. The agreements related to our joint ventures may require unanimous consent or the affirmative vote of a qualified majority of theshareholders to take certain actions, thereby possibly slowing down the decision-making process or impairing our ability to implement our key policies andpractices, such as our compliance processes and culture in a comprehensive or timely manner. In addition, joint venture companies involve inherent riskssuch as those associated with a complex corporate governance structure, including lack of transparency and consequent risks of compliance breaches orother similar issues, or issues in dissolving such entities or divesting their shareholdings, assets and liabilities, and also may involve negative publicperceptions caused by the joint venture partner that are adverse to us.
Taxes-related uncertaintiesWe have operations in many countries with different tax laws and rules, which may result in complex tax issues and disputes.Taxation or other fees collected by governments or governmental agencies may result in unexpected payment obligations, and in response to prevailingdifficult economic conditions in the public sector, coupled with already enacted and proposed fundamental changes in international tax regulations, theremay be an increased aggressiveness in collecting such fees or taxes. We may be obliged to pay additional taxes for past periods as a result of changes inlaw, or changes of tax authority practice or interpretation (possibly with retroactive effect in certain cases), or inaccurate interpretations of tax laws by usresulting potentially in a material adverse effect on our cash flow and financial position. The taxes for which we make provisions, such as income taxes,indirect taxes and social taxes, could increase significantly in the future as a result of changes in applicable tax laws or global guidance in the area oftransfer pricing in the countries in which we operate. There may also be unforeseen tax expenses that turn out to have an unfavorable impact on us. As aresult, and given the inherently unpredictable nature of taxation, our tax rate may change from its current level and our cash flows regarding taxes may notbe stable.
Our business, investments and activities cover multiple jurisdictions and are subject to complex tax laws and rules as well as diverse tax authoritypractices and interpretations, including any changes (possibly unfavorable or unpredictable or with retroactive effect in certain cases) in the aforesaid.Despite our governance and compliance procedures, there might be unintended consequences from changes in interpretation of complex tax regulationsor retroactive implications in tax reforms to our business, subsidiaries and joint ventures. As a company with global operations, we are subject to taxinvestigations in various jurisdictions, and such proceedings can be lengthy, involve actions that can hinder local operations and affect unrelated parts ofour business, and the outcome of such proceedings is difficult to predict. While we have made provisions for certain tax issues, the provisions we havemade may not be adequate to cover such increases.
We may face adverse tax consequences due to our past acquisitions and divestments, including, but not limited to, stamp duties, land transfer taxes,franchise taxes and other levies and in connection with any indemnity for tax liabilities we have provided in connection with such divestments. Additionally,there may be other potential tax liabilities of which we are not currently aware but which may result in significant tax consequences now or in the future.
In the context of our sale of Devices & Services business to Microsoft, we are required to indemnify Microsoft for certain tax liabilities, including (i) taxliabilities of the Nokia entities acquired by Microsoft in connection with the closing of the sale of Devices & Services business, (ii) tax liabilities associatedwith the assets acquired by Microsoft and attributable to tax periods ending on or prior to the closing date of the sale of Devices & Services business, and(iii) tax liabilities relating to the pre-closing portion of any taxable period that includes the closing date of the sale of Devices & Services business.
Our actual or anticipated performance, among other factors, could reduce our ability to utilize our tax attributes and deferred tax assets.Deferred tax assets recognized on tax losses, unused tax credits and tax-deductible temporary differences are dependent on our ability to offset suchitems against future taxable income within the relevant tax jurisdiction. Such deferred tax assets are also based on our assumptions on future taxableearnings and these may not be realized as expected and could be adversely impacted by the COVID-19 crisis, which may cause the deferred tax assets tobe materially reduced. In the fourth quarter of 2020, Nokia derecognized EUR 2.9 billion deferred tax assets related to Finland. There can be noassurances that reductions in deferred tax assets will not occur in the future. Any such reduction could have a material adverse effect on us. Additionally,our earnings have been unfavorably affected in the past, and may continue to be in the future, in the event that no tax benefits are recognized for certaindeferred tax items.
Table of Contents
106
Potential changes in re-allocation of taxing rights and other fundamental international tax principles, in particular related to digital business operations,could adversely impact our business, operating results and overall tax burden. These changes could also lead to overlapping tax systems and re-evaluation of our global tax operating model, which could adversely impact our overall tax burden.
Financial risksWe may not have access to sources of funding on favorable terms, or at all.Our business requires a significant amount of cash and we continue to invest in our R&D capabilities, particularly in the 5G. We rely on multiple sources offunding for short-term and long-term capital and aim to minimize the liquidity risk by maintaining a sufficient cash position and having committed creditlines in place. However, there can be no assurances that we will be able to generate sufficient amounts of capital or to maintain an efficient capitalstructure from time to time.
We also may not be able to have access to additional sources of funds that we may need from time to time with reasonable terms, or at all. If we cannotaccess capital or sell receivables on a commercially viable basis, our business, financial condition and cash flow could materially suffer.
We may not be able to re-establish investment grade rating or maintain our credit ratings.Moody’s, Standard & Poor’s, Fitch and other credit rating agencies have assigned credit ratings to us and we have set a goal of re-establishing investmentgrade credit ratings. There can be no assurances that we will be able to achieve investment grade credit ratings.
In the event our credit rating is downgraded, it could have a material adverse effect, for instance on our cost of funds and related margins, our businessand results of operations, financial condition, liquidity, or access to capital markets.
Due to our global operations, our net sales, costs and results of operations, as well as the US dollar value of our dividends and market price ofour ADSs, are affected by exchange rate fluctuations.We operate globally and are therefore exposed to foreign exchange risks in the form of both transaction risks and translation risks. Our policy is to monitorand hedge exchange rate exposure, and we manage our operations to mitigate, but not to eliminate, the impacts of exchange rate fluctuations. Ourhedging activities may prove unsuccessful in mitigating the potentially negative impact of exchange rate fluctuations. Additionally, significant volatility in therelevant exchange rates and interest rates may increase our hedging costs, as well as limit our ability to hedge our exchange rate exposure. In particular,we may not adequately hedge against unfavorable exchange rate movements, including those of certain emerging market currencies. Furthermore,exchange rate fluctuations may have an adverse effect on our net sales, costs and results of operations, as well as our competitive position, through theirimpact on our customers, suppliers and competitors.
We also experience other financial market-related risks, including changes in interest rates and in prices of marketable securities that we own. We mayuse derivative financial instruments to reduce certain of these risks. If our strategies to reduce such risks are not successful, our financial condition andresults of operation may be harmed.
Additionally, exchange rate fluctuations may materially affect the US dollar value of any dividends or other distributions that are paid in euro, as well as themarket price of our ADSs.
We are exposed to pension and other post-employment cost-related risks and we may be unsuccessful in our ability to avoid or control costsresulting from a need for increased funding.We are exposed to various employee cost-related risks, including those related to pension and post-employment healthcare and life insurance cost-relatedrisks. In the US, we maintain significant employee pension benefit plans and a significant retiree welfare benefit plan (providing post-employmenthealthcare benefits and post-employment life insurance coverage). Outside the US, we contribute to pension schemes for large numbers of current andformer employees. The US and non-US plans and schemes have funding requirements that depend on, among other things, various legal requirements,how assets set aside to pay for those obligations are invested, the performance of financial markets, interest rates, assumptions regarding the lifeexpectancy of covered employees and retirees, and medical cost inflation and medical care utilization. To the extent that any of those variables change,the funding required for those plans/schemes may increase, and we may be unsuccessful in our ability to avoid or control costs resulting from suchincreased funding requirements.
With respect to our pension and post-employment obligations, we face the following risks, among others:
◾financial market performance and volatility in asset values and discount rates affect the funded status of our pension obligations and could increasefunding requirements, including legally required minimum contributions;
◾our pension plan participants and post-employment health plan participants may live longer than has been assumed, which would result in an increasein our benefit obligations. We cannot be certain that the longevity of the participants in our pension plans or retiree healthcare plan will not exceed thatindicated by the mortality tables we currently use or that future updates to those tables will not reflect materially longer life expectancies;
◾we currently fund, and expect to be able to continue to fund, our US post-employment healthcare and group life insurance costs for our formerlyrepresented retirees with excess pension assets in our (US) formerly represented pension plan, as permitted under Section 420 of the US InternalRevenue Code. A deterioration in the funded status of that pension plan could negatively affect our ability to continue making Section 420 transfers.Section 420 is currently set to expire in 2025; and
◾we currently provide post-employment group life insurance coverage for a closed group of former non-represented employees who meet stated age andservice criteria. This benefit obligation is largely insured through an experience-rated group life insurance policy issued by a reputable insurer, thepremiums for which are paid from a voluntary employees’ beneficiary association (veba) trust. Based on current actuarial and return-on-assetassumptions and the present level and structure of this group life insurance obligation, we believe that we can continue to fund the premiums for thispolicy from this trust for several more years. Once the trust’s assets are depleted, however, the company will bear the annual premium cost associatedwith this benefit. Although we expect to be able, in the future, to fund this cost from excess pension assets in our (US) non-represented pension plan,under Section 420 of the US Internal Revenue Code, the level of excess pension assets in that plan in any given year may be insufficient to cover theannual premium cost. As noted, Section 420 is currently set to expire in 2025.
The carrying amount of our goodwill may not be recoverable.We assess the carrying amount of goodwill annually, or more frequently if events or changes in circumstances indicate that such carrying amount may notbe recoverable. We assess the carrying amount of other identifiable assets if events or changes in circumstances indicate that their carrying amounts maynot be recoverable. If we do not generate revenues from our businesses as anticipated, our businesses may not generate sufficient positive operating cashflows. This, or other factors, may lead to a decrease in the value of our assets, including intangible assets and the goodwill attributed to our businesses,resulting in impairment charges that may adversely affect our net profit for the year. While we believe the
Table of Contents
107
estimated recoverable values are reasonable, actual performance in the short- and long-term and our assumptions on which we base our calculationscould materially differ from our forecasts, which could impact future estimates of our businesses’ recoverable values, and may result in impairmentcharges.
Risks associated with our sharesOur share and/or ADS price may be volatile and subject to fluctuations.Our share and/or ADS price may be volatile and could be subject to fluctuations in response to various factors, some of which are beyond our control. Inaddition to the factors described in this section, “Risk Factors”, other factors that could cause fluctuations in our share price include, among others, highvolatility in the securities markets generally and volatility in telecommunications and technology companies’ securities in particular, trading volumes,speculation in the media or retail or institutional investment communities regarding the company and our prospects, future developments in our industryand competitors, our financial results and the expectations of financial analysts, as well as the timing or content of any public communications, includingreports of operating results, by us or our competitors. Further, factors in the public trading market for our stock may produce price movements that may ormay not comport with macro, industry or company-specific fundamentals, including, without limitation, the sentiment of retail investors (including as may beexpressed on financial trading and other social media sites and online forums), the direct access by retail investors to broadly available trading platforms,the amount and status of short interest in our securities, access to margin debt, trading in options and other derivatives on our common stock and anyrelated hedging and other trading factors.
The market price of, and trading volume for, our shares and/or ADS may change for reasons not necessarily related to our actual operating performance.The capital markets have experienced extreme volatility that has often been unrelated to the operating performance of particular companies. In addition, inthe past, following periods of volatility in the market price of a company’s securities, stockholders often institute securities class action litigation against thatcompany. This type of litigation could result in substantial costs and divert our management’s attention and resources, which could have a materialadverse effect on our cash flows, our ability to execute our business strategy and our ability to make distributions to our stockholders.
The amount of dividend and/or repayment of capital distributed to shareholders for each financial period is uncertain.As announced on February 4, 2021, our Board proposed not to pay any dividend for the financial year 2020. We cannot assure that we will distributedividends and/or capital repayments on the shares issued by us, nor is there any assurance as to the amount of any dividend and/or repayment of capitalwe may pay, including but not limited to situations where we make commitments to increase our dividends. The payment and the amount of any dividendand/or repayment of capital is subject to the discretion of the general meeting of our shareholders and our Board, and will depend on available cashbalances, expected cash flow generation, anticipated cash needs, retained earnings, the results of our operations and our financial condition and terms ofoutstanding indebtedness, as well as other relevant factors such as restrictions, prohibitions or limitations imposed by applicable law. Further, even if anyconditions or factors covering the issuance or distribution of dividends are met, the Board or the shareholders have in the past and may going forwarddecide not to issue or distribute dividends.
Shareholders may be required to provide detailed information to obtain advantageous withholding tax treatment for dividends.As described in more detail under “General facts on Nokia – Taxation”, non-Finnish shareholders are required to provide certain information in order to benefit from the reduced dividend withholding tax rates set out in the applicable tax treaties. Furthermore, custodians are required to fulfill certain strict requirements and take over certain responsibilities and assume liability of incorrectly applied withholding tax, or a higher withholding tax rate will apply. Such requirements may impose an additional administrative burden on shareholders or result in the higher withholding rate becoming applicable for non-Finnish shareholders.

Table of Contents
108
Significant subsequent eventsChanges in organizational structureOn January 1, 2021, the Group adopted a new operating model designed to better position the company for changing markets and align with customerneeds. The new operating model includes four reportable segments aligned with customer buying behavior: (i) Mobile Networks, (ii) Network Infrastructure,(iii) Cloud and Network Services and (iv) Nokia Technologies. The new operating model is optimized for better accountability and transparency, increasedsimplicity and improved cost-efficiency.
Bond redemptionIn January 2021, Nokia exercised its issuer call option to redeem 1.00% Senior Notes due March 2021 for the full amount of EUR 350 million. Theredemption date for the notes was February 15, 2021.
Debt restructuring request of an emerging market customerIn February 2021, one of the Group’s emerging market customers commenced negotiations to renegotiate its debt with the aim of avoiding insolvency.Although this event occurred after the reporting period, it confirms that the customer was credit-impaired as of December 31, 2020. As a result, the Grouprecognized an increase in the allowance for expected credit loss for loans extended to the customer of EUR 58 million in financial expenses. The Groupalso concluded that the collectability of consideration due from the customer is no longer probable resulting in adjustments in net sales, cost of sales andother operating expenses totaling EUR 34 million.

Table of Contents
109
General facts on NokiaAmerican Depositary Shares 110Supply chain and manufacturing 110Controls and procedures 111Government regulation 111Sales in United States-sanctioned countries 112Taxation 112Key ratios 115Alternative performance measures 115
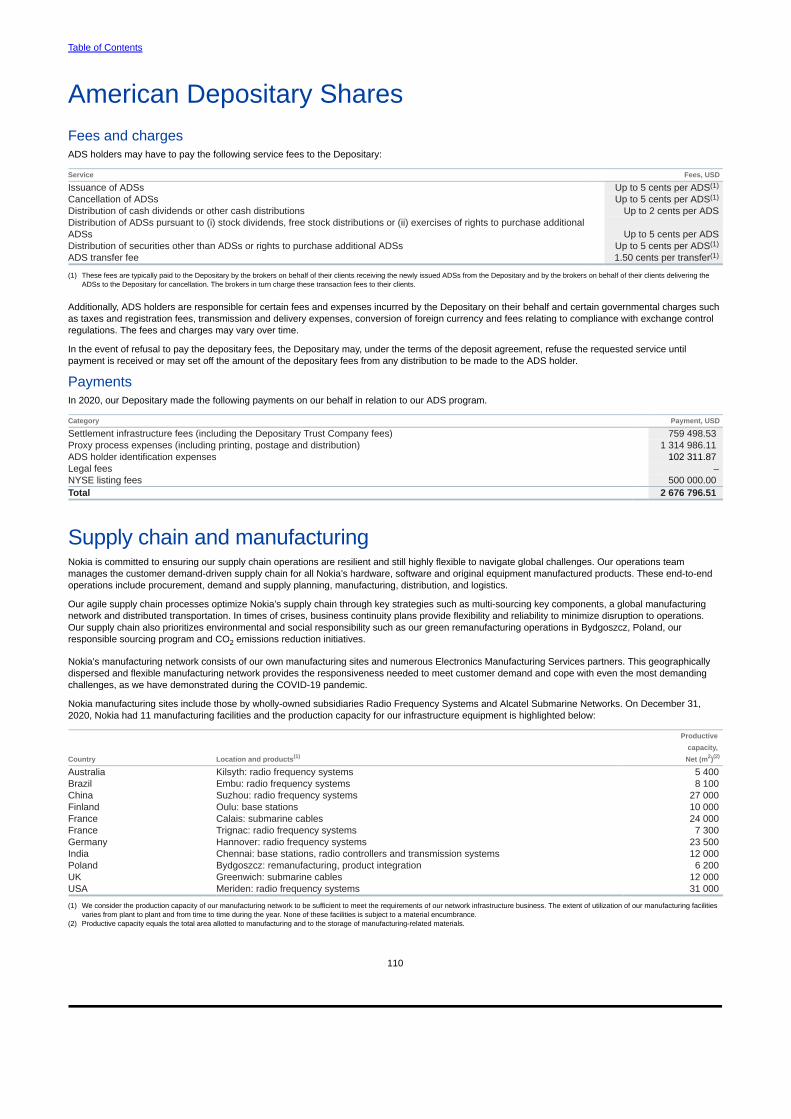
Table of Contents
110
American Depositary SharesFees and chargesADS holders may have to pay the following service fees to the Depositary:
Service Fees, USD
Issuance of ADSs Up to 5 cents per ADS(1)
Cancellation of ADSs Up to 5 cents per ADS(1)
Distribution of cash dividends or other cash distributions Up to 2 cents per ADSDistribution of ADSs pursuant to (i) stock dividends, free stock distributions or (ii) exercises of rights to purchase additionalADSs Up to 5 cents per ADSDistribution of securities other than ADSs or rights to purchase additional ADSs Up to 5 cents per ADS(1)
ADS transfer fee 1.50 cents per transfer(1)
(1) These fees are typically paid to the Depositary by the brokers on behalf of their clients receiving the newly issued ADSs from the Depositary and by the brokers on behalf of their clients delivering theADSs to the Depositary for cancellation. The brokers in turn charge these transaction fees to their clients.
Additionally, ADS holders are responsible for certain fees and expenses incurred by the Depositary on their behalf and certain governmental charges suchas taxes and registration fees, transmission and delivery expenses, conversion of foreign currency and fees relating to compliance with exchange controlregulations. The fees and charges may vary over time.
In the event of refusal to pay the depositary fees, the Depositary may, under the terms of the deposit agreement, refuse the requested service untilpayment is received or may set off the amount of the depositary fees from any distribution to be made to the ADS holder.
PaymentsIn 2020, our Depositary made the following payments on our behalf in relation to our ADS program.
Category Payment, USD
Settlement infrastructure fees (including the Depositary Trust Company fees) 759 498.53 Proxy process expenses (including printing, postage and distribution) 1 314 986.11 ADS holder identification expenses 102 311.87 Legal fees –NYSE listing fees 500 000.00 Total 2 676 796.51
Supply chain and manufacturingNokia is committed to ensuring our supply chain operations are resilient and still highly flexible to navigate global challenges. Our operations teammanages the customer demand-driven supply chain for all Nokia’s hardware, software and original equipment manufactured products. These end-to-endoperations include procurement, demand and supply planning, manufacturing, distribution, and logistics.
Our agile supply chain processes optimize Nokia’s supply chain through key strategies such as multi-sourcing key components, a global manufacturingnetwork and distributed transportation. In times of crises, business continuity plans provide flexibility and reliability to minimize disruption to operations.Our supply chain also prioritizes environmental and social responsibility such as our green remanufacturing operations in Bydgoszcz, Poland, ourresponsible sourcing program and CO2 emissions reduction initiatives.
Nokia’s manufacturing network consists of our own manufacturing sites and numerous Electronics Manufacturing Services partners. This geographically dispersed and flexible manufacturing network provides the responsiveness needed to meet customer demand and cope with even the most demanding challenges, as we have demonstrated during the COVID-19 pandemic.
Nokia manufacturing sites include those by wholly-owned subsidiaries Radio Frequency Systems and Alcatel Submarine Networks. On December 31,2020, Nokia had 11 manufacturing facilities and the production capacity for our infrastructure equipment is highlighted below:
Productive capacity,
Country Location and products(1) Net (m2)(2)
Australia Kilsyth: radio frequency systems 5 400Brazil Embu: radio frequency systems 8 100China Suzhou: radio frequency systems 27 000Finland Oulu: base stations 10 000France Calais: submarine cables 24 000France Trignac: radio frequency systems 7 300Germany Hannover: radio frequency systems 23 500India Chennai: base stations, radio controllers and transmission systems 12 000Poland Bydgoszcz: remanufacturing, product integration 6 200UK Greenwich: submarine cables 12 000USA Meriden: radio frequency systems 31 000
(1) We consider the production capacity of our manufacturing network to be sufficient to meet the requirements of our network infrastructure business. The extent of utilization of our manufacturing facilitiesvaries from plant to plant and from time to time during the year. None of these facilities is subject to a material encumbrance.
(2) Productive capacity equals the total area allotted to manufacturing and to the storage of manufacturing-related materials.

Table of Contents
111
Controls and proceduresOur management, with the participation of our President and CEO and our Chief Financial Officer, conducted an evaluation pursuant to Rules 13a-15(e)and 15d-15(e) under the Securities Exchange Act of 1934, as amended (the Exchange Act), of the effectiveness of our disclosure controls and proceduresas of December 31, 2020. Based on such evaluation, our President and CEO and our Chief Financial Officer have concluded that our disclosure controlsand procedures were effective.
Disclosure controls and procedures mean controls and other procedures that are designed to ensure that information required to be disclosed by us in thereports that we file or submit under the Exchange Act is recorded, processed, summarized and reported, within the time periods specified in theCommission’s rules and forms, and that such information required to be disclosed by us in the reports that we file or submit under the Exchange Act isaccumulated and communicated to our management, including our President and CEO and our Chief Financial Officer, or persons performing similarfunctions, as appropriate to allow timely decisions regarding required disclosures.
Management’s annual report on internal control over financial reportingOur management is responsible for establishing and maintaining adequate internal control over financial reporting for Nokia. Our internal control overfinancial reporting is designed to provide reasonable assurance regarding the reliability of financial reporting and the preparation and fair presentation ofpublished financial statements. Because of its inherent limitations, internal control over financial reporting may not prevent or detect misstatements. Also,projections of any evaluation of effectiveness to future periods are subject to the risk that controls may become inadequate because of changes inconditions, or that the degree of compliance with the policies or procedures may deteriorate.
Our management evaluated the effectiveness of our internal control over financial reporting using the criteria described in Internal Control – IntegratedFramework (2013) issued by the Committee of Sponsoring Organizations of the Treadway Commission (COSO). Based on this evaluation, ourmanagement has assessed the effectiveness of Nokia’s internal control over financial reporting at December 31, 2020 and concluded that such internalcontrol over financial reporting is effective.
The effectiveness of our internal control over financial reporting as of December 31, 2020 has been audited by Deloitte Oy, an independent registeredpublic accounting firm. Refer to “Reports of independent registered public accounting firms” of this Annual Report on Form 20-F.
Changes in internal control over financial reportingThere have been no changes in our internal control over financial reporting during 2020 that have materially affected, or are reasonably likely to materiallyaffect, our internal control over financial reporting.
Attestation report of the registered public accounting firmRefer to “Reports of independent registered public accounting firms” of this Annual Report on Form 20-F.
Exchange controlsThere are currently no Finnish laws that may affect the import or export of capital, or the remittance of dividends, interest or other payments.
Government regulationNokia and its businesses are subject to direct and indirect regulation in each of the countries in which we and our customers do business. As a result,changes in or uncertainties related to various types of regulations applicable to current or new technologies, intellectual property, products, services,company operations and business environment (e.g. labor laws, taxation) could affect our business adversely. Moreover, the implementation oftechnological or legal requirements could impact our products and services, technology and patent licensing activities, manufacturing and distributionprocesses, and could affect the timing of product and services introductions and the cost of our production, products and services, as well as theircommercial success. Also, our business is subject to the impacts of changes in economic and trade policies. Export control, tariffs or other fees or leviesimposed on our products and services, environmental, product safety and security and other regulations that adversely affect the export, import, pricing orcosts of our products and services as well as export prohibitions (sanctions) enacted by the EU, the United States or other countries or regions couldadversely affect our net sales and results of operations. Further, potential governmental intervention in supply chain (e.g. prohibiting imports from certaingeographies or imposing certain criteria on selection of suppliers) may impact Nokia’s operations.
For example, in the United States, our products and services are subject to a wide range of government regulations that might have a direct impact on ourbusiness, including, but not limited to, regulation related to product certification, standards, spectrum management, provision of telecommunicationsservices, privacy and data protection, competition and sustainability. The EU-level or local member state regulation has a direct impact on many areas ofour business, markets and customers within the EU. The European regulation influences, for example, conditions for innovation for telecommunicationsinfrastructure and internet and related services, as well as technology and patent licensing; investment in fixed and wireless broadband communicationinfrastructure and operation of global data flows. Additionally, with respect to certain developing market countries, the business environment we operate incan be affected by protectionist regulation.
We proactively exchange views and address the impact of any planned changes to the regulatory environment on our business activities with stateagencies, regulators and other decision-makers either through our government relations representatives in various geographies and through our experts,or indirectly through the membership in industry associations.

Table of Contents
112
Sales in United States-sanctioned countriesGeneralWe are a global company and have sales in most countries of the world. Nokia is committed to the highest standards of ethical conduct, and adheres to allapplicable national and international trade-related laws. As a leading international telecommunications company with global operations, Nokia has apresence also in countries subject to international sanctions. All operations of Nokia, and in particular any operations undertaken in countries targeted bysanctions, are conducted in accordance with our comprehensive and robust Internal Compliance Program to ensure that they are in full compliance with allapplicable laws and regulations. In addition, we continuously monitor international developments and assess the appropriateness of our presence andbusiness in these, and all, markets. Nevertheless, business in these markets is marked by complexity and uncertainty.
We cannot exclude the possibility that third parties may unlawfully divert our products to these countries from other countries in which we sell them, or that,for services distributed through the internet, third parties could have accessed them in markets or countries for which they are not intended bycircumventing the industry standard protective mechanisms, such as IP address blocks, despite our efforts in implementing measures to prevent suchactions.
Disclosure pursuant to Section 219 of the Iran Threat Reduction and Syria Human Rights Act of 2012We operate in Iran in compliance with applicable economic sanctions and other trade-related laws. We provide telecommunications equipment withancillary services to various network operator customers and internet service providers. We do not deliver equipment and services to Iran for militarypurposes, or for the purpose of limiting political discourse, blocking legitimate forms of free speech or conducting surveillance of individuals.
In connection with the business activities relating to Iran, we have two local offices in Iran that employed approximately 28 employees at the end of 2020through a branch of a Finnish subsidiary. Nokia is the controlling shareholder in Pishahang Communications Network Development Company (Pishahang).The other minority shareholder in Pishahang is Information Technology Application Development TACFAM Company (Tacfam).
We continue to maintain routine contacts with governmental agencies in Iran as required, for example, to maintain a legal presence and office facilities inIran, pay taxes and employ Iranian nationals.
To our knowledge, none of our sales in Iran in 2020 are required to be disclosed pursuant to ITRA Section 219, with the possible exception of thefollowing.
In 2020, we continued only with our existing contractual obligations in compliance with applicable economic sanctions and other trade-related lawsincluding limited local delivery of radio products and transmission licenses, including associated services, to MTN Irancell and some software and featuresto Mobile Communications Company of Iran (MCCI).
Although it is difficult to evaluate with any reasonable degree of certainty, we have concluded that we cannot exclude the possibility that MCCI, MTNIrancell or Tacfam is owned or controlled, directly or indirectly, by the government of Iran. None of these activities involve US affiliates of Nokia, or anypersons from the United States.
Nokia does not normally allocate net profit on a country-by-country or activity-by-activity basis, other than as set forth in Nokia's consolidated financialstatements prepared in accordance with IFRS. Therefore, for this exercise Nokia will reflect its sales margin in lieu of the net profit/loss. In 2020, werecognized net sales of EUR 1.1 million and a sales margin of EUR 1.1 million from business with MCCI, net sales of EUR 3.2 million and a sales marginof EUR 0.9 million from business with MTN Irancell.
Although we evaluate our business activities on an ongoing basis, we intend to continue not accepting any new business in Iran in 2021 and intend to onlycomplete existing contractual obligations in Iran in compliance with applicable economic sanctions and other trade-related laws.
TaxationGeneralThe statements of the United States and Finnish tax laws set out below are based on the laws in force as of the date of this Annual Report on Form 20-F and may be subject to any changes in US or Finnish law, and in any double taxation convention or treaty between the United States and Finland, occurring after that date, possibly with retroactive effect.
For purposes of this discussion, “US Holders” are beneficial owners of ADSs that: (i) hold the ADSs as capital assets; (ii) are citizens or residents of the United States, corporations created in or organized under US law, estates whose income is subject to US federal income tax, or trusts that elect to be treated as a US person or are both subject to the primary supervision of a US court and controlled by a US person; and (iii) in each case, are considered residents of the United States for purposes of the current income tax convention between the United States and Finland, referred to as the “Treaty”, and the limitation on benefits provisions therein. Special rules apply to US Holders that are also residents of Finland and to citizens or residents of the United States that do not maintain a substantial presence, permanent home or habitual abode in the United States. For purposes of this discussion, it is assumed that the Depositary and its custodian will perform all actions as required by the deposit agreement with the Depositary and other related agreements between the Depositary and Nokia.
If a partnership holds ADSs (including for this purpose any entity or arrangement treated as a partnership for US federal income tax purposes), the tax treatment of a partner will depend upon the status of the partner and activities of the partnership. If a US Holder is a partnership or a partner in a partnership that holds ADSs, the holder is urged to consult its own tax advisor regarding the specific tax consequences of owning and disposing of its ADSs.
Because this summary is not exhaustive of all possible tax considerations - such as situations involving financial institutions, banks, tax-exempt entities,pension funds, US expatriates, real estate investment trusts, persons that are dealers in securities, persons who own (directly, indirectly or

Table of Contents
113
by attribution) 10% or more of the share capital or voting stock of Nokia, persons who acquired their ADSs pursuant to the exercise of employee stockoptions or otherwise as compensation, or US Holders whose functional currency is not the US dollar, who may be subject to special rules that are notdiscussed herein - holders of shares or ADSs that are US Holders are advised to satisfy themselves as to the overall US federal, state and local taxconsequences, as well as to the overall Finnish and other applicable non-US tax consequences, of their ownership of ADSs and the underlying shares byconsulting their own tax advisors. This summary does not discuss the treatment of ADSs that are held in connection with a permanent establishment orfixed base in Finland, and it does not address the US Medicare tax on certain investment income.
For the purposes of both the Treaty and the US Internal Revenue Code of 1986, as amended, referred to as the “Code”, US Holders of ADSs will be treated as the owners of the underlying shares that are represented by those ADSs. Accordingly, the following discussion, except where otherwise expressly noted, applies equally to US Holders of ADSs, on the one hand, and of shares on the other.
The holders of ADSs will, for Finnish tax purposes, be treated as the owners of the shares that are represented by the ADSs. The Finnish taxconsequences to the holders of shares, as discussed below, also apply to the holders of ADSs.
US taxation of cash dividendsFor US federal income tax purposes, the gross amount of dividends paid to US Holders of shares or ADSs out of our current or accumulated earnings and profits, including any related Finnish withholding tax, generally will be included in gross income as foreign source dividend income. We do not expect to maintain calculations of our earnings and profits under US federal income tax principles; therefore, US Holders should expect that the entire amount of any distribution generally will be reported as dividend income. Dividends will not be eligible for the dividends received deduction allowed to corporations under the Code. The amount includible in income (including any Finnish withholding tax) will equal the US dollar value of the payment, determined at the time such payment is received by the Depositary (in the case of ADSs) or by the US Holder (in the case of shares), regardless of whether the payment is in fact converted into US dollars. Generally, any gain or loss resulting from currency exchange rate fluctuations during the period between the time such payment is received and the date the dividend payment is converted into US dollars will be treated as US source ordinary income or loss to a US Holder.
Special rules govern and specific elections are available to accrual method taxpayers to determine the US dollar amount includible in income in the case of a dividend paid (and taxes withheld) in foreign currency. Accrual basis taxpayers are urged to consult their own tax advisors regarding the requirements and elections applicable in this regard.
Dividends received generally will constitute foreign source “passive category income” for foreign tax credit purposes. Subject to certain limitations, Finnish taxes withheld may be eligible for credit (not in excess of the applicable Treaty rate) against a US Holder’s US federal income tax liability. Additionally, if Nokia makes a distribution from its SVOP-reserve (discussed below) when it does not have current or accumulated earnings and profits, a US Holder may not be able to claim such credit.
In lieu of a credit, a US Holder may elect to claim a deduction in respect of its Finnish income taxes provided the deduction is claimed for all of the foreign taxes paid by the US Holder in that particular taxable year. A deduction does not reduce US tax on a dollar-for-dollar basis like a tax credit. The deduction, however, is not subject to the limitations applicable to foreign tax credits.
Provided that certain holding period and other requirements are met, individuals and certain other non-corporate US Holders are eligible for reduced rates of US federal income tax at a maximum rate of 20% in respect of “qualified dividend income”. Dividends that Nokia pays with respect to its shares and ADSs generally will be qualified dividend income if certain holding periods are met and Nokia was neither a passive foreign investment company (PFIC) in the taxable year prior to the year in which the dividend was paid nor in the taxable year in which the dividend is paid. Nokia currently believes that dividends it pays with respect to its shares and ADSs will constitute qualified dividend income for US federal income tax purposes; however, this is a factual matter and is subject to change. Nokia anticipates that its dividends will be reported as qualified dividends on Forms 1099-DIV delivered to US Holders. US Holders of shares or ADSs are urged to consult their own tax advisors regarding the availability to them of the reduced dividend tax rate in light of their own particular situation and the computations of their foreign tax credit limitation with respect to any qualified dividends paid to them, as applicable.
We believe we should not be classified as a PFIC for US federal income tax purposes for the taxable year ended December 31, 2020 and we do notexpect to become a PFIC in the foreseeable future. US Holders are advised, however, that this conclusion is a factual determination that must be madeannually and thus may be subject to change. If we were to be classified as a PFIC, the tax on distributions on our shares or ADSs and on any gainsrealized upon the disposition of our shares or ADSs generally would be less favorable than as described herein. Dividends paid by a PFIC are not“qualified dividend income” and are not eligible for reduced rates of taxation. Additionally, US persons who are shareholders in a PFIC generally will berequired to file an annual report disclosing the ownership of such shares and certain other information. US Holders should consult their own tax advisorsregarding the application of the PFIC rules, including the related reporting requirements, to their ownership of our shares or ADSs.
Finnish withholding taxes on dividendsUnder the Finnish Income Tax Act and Act on Taxation of Non-residents’ Income, non-residents of Finland are generally subject to a withholding tax at arate of 30% on dividends paid by a Finnish resident company. Further, under the Finnish Prepayment Act, 50% preliminary tax must be withheld ondividends paid in certain situations. However, pursuant to the Treaty, dividends paid to US Holders are generally subject to Finnish withholding tax atreduced rates.
Under the Finnish Income Tax Act and tax court practice, the distribution of funds from reserves for invested unrestricted equity (an "SVOP-reserve") by alisted company such as Nokia is taxed as a distribution of a dividend.
As of January 1, 2021, nominee registered shares are generally subject to a withholding tax at a rate of 35% on dividends paid by Nokia. This newwithholding tax regime is based on OECD’s TRACE (Treaty Relief and Compliance Enhancement) model. Under the new rules, the 35% withholding taxwill generally be applied on dividend distributions on nominee registered shares by listed companies such as Nokia, unless custodians fulfill certain strictrequirements and are willing to take over certain responsibilities (e.g. registration with the Finnish Tax Administration (so-called authorized intermediary),identification of the beneficial owner of the dividend and collecting and submitting detailed recipient information to the Finnish Tax Administration usingspecific filing procedures). Furthermore, application of reduced withholding tax rates at source require that the custodian and dividend distributor are willingto assume liability of incorrectly applied withholding tax. If the custodian only registers with the Finnish Tax Administration and submits (or undertakes tosubmit) the detailed recipient details to the Finnish Tax Administration, 30% withholding tax rate can be applied, instead of 35%.

Table of Contents
114
Any tax withheld in excess can be reclaimed after the calendar year of the dividend payment by submitting a refund application to the Finnish TaxAdministration no later than by the end of the third calendar year following the dividend payment year. During the year of dividend payment, the refund canbe processed if custodians and dividend distributor fulfill the above-mentioned requirements laid down for actual dividend distribution.
It is exceptionally also possible that any tax not withheld at source is later assessed directly to the shareholder by the Finnish Tax Administration, in casethe failure to withhold tax at source is not due to negligence of the custodian or the dividend distributor.
Holders of shares or ADSs are urged to consult their own custodian regarding the availability of reduced withholding tax rates in light of their own particularsituation and approach their custodian in terms of their responsibilities, as well as consult their own tax advisors regarding the availability to them of the taxcredit from dividend withholding tax.
US and Finnish tax on sale or other dispositionA US Holder generally will recognize taxable capital gain or loss on the sale or other disposition of ADSs in an amount equal to the difference between the US dollar value of the amount realized and the adjusted tax basis (determined in US dollars) in the ADSs. If the ADSs are held as a capital asset, this gain or loss generally will be long-term capital gain or loss if, at the time of the sale, the ADSs have been held for more than one year. Any capital gain or loss, for foreign tax credit purposes, generally will constitute US source gain or loss. In the case of a US Holder that is an individual, long-term capital gain generally is subject to US federal income tax at preferential rates. The deductibility of capital losses is subject to significant limitations.
The deposit or withdrawal by a US Holder of shares in exchange for ADSs or of ADSs for shares under the deposit agreement generally will not be subject to US federal income tax or Finnish income tax.
The sale by a US Holder of the ADSs or the underlying shares, other than an individual who, by reason of his residence in Finland for a period exceedingsix months, is or becomes liable for Finnish income tax according to the relevant provisions of Finnish tax law, generally will not be subject to income tax inFinland, in accordance with Finnish tax law and the Treaty.
Finnish transfer taxThe transfer of our shares and ADSs for cash through a broker or other appropriate intermediary is generally not subject to Finnish transfer tax. Non-brokered transfers will generally be exempted from the transfer tax if the transferee has been approved as a trading party in the market where the transferis executed, or other conditions are met. Transfers of ADSs on the New York Stock Exchange are exempt. Where the transfer does not fulfill the aboverequirements, and either the buyer or the seller is a Finnish resident or a Finnish branch office of a specified foreign financial service provider, the buyer isliable to pay transfer tax of 1.6% of the transaction price where the resulting tax is at least EUR 10. Selling shareholders should consult their tax advisorsregarding the specific tax considerations of a sale of our shares or ADSs.
Finnish inheritance and gift taxesA transfer of an underlying share by gift or by reason of the death of a US Holder and the transfer of an ADS are not subject to Finnish gift or inheritancetax provided that none of the deceased person, the donor, the beneficiary of the deceased person or the recipient of the gift is resident in Finland.
Non-residents of the United StatesBeneficial owners of ADSs that are not US Holders will not be subject to US federal income tax on dividends received with respect to ADSs unless suchdividend income is effectively connected with the conduct of a trade or business within the United States. Similarly, non-US Holders generally will not besubject to US federal income tax on any gain realized on the sale or other disposition of ADSs, unless (a) the gain is effectively connected with the conductof a trade or business in the United States or (b) in the case of an individual, that individual is present in the United States for 183 days or more in thetaxable year of the disposition and other conditions are met.
The United States information reporting and backup withholdingDividend payments with respect to shares or ADSs and proceeds from the sale or other disposition of shares or ADSs may be subject to informationreporting to the Internal Revenue Service and possible US backup withholding. Backup withholding will not apply to a holder if the holder furnishes acorrect taxpayer identification number or certificate of foreign status and makes any other required certification in connection therewith, or if it is a recipientotherwise exempt from backup withholding (such as a corporation). Any US persons required to establish their exempt status generally must furnish a dulycompleted IRS Form W-9 (Request for Taxpayer Identification Number and Certification). Non-US holders generally are not subject to US informationreporting or backup withholding. However, such holders may be required to provide certification of non-US status (generally on IRS Form W-8BEN forindividuals and Form W-8BEN-E for corporations) in connection with payments received in the United States or through certain US-related financialintermediaries. Backup withholding is not an additional tax. Amounts withheld as backup withholding may be credited against a holder’s US federal incometax liability, and the holder may obtain a refund of any excess amounts withheld under the backup withholding rules by timely filing the appropriate claim forrefund with the Internal Revenue Service and furnishing the proper required information.
Table of Contents
115
Key ratiosEarnings per share (basic)
Profit/(loss) attributable to equity holders of the parentWeighted average number of shares outstanding
Earnings per share (diluted)Profit/(loss) attributable to equity holders of the parent adjusted for the effect of dilutionAdjusted weighted average number of shares
P/E ratioClosing share price as of December 31Earnings per share (basic) for continuing operations
Payout ratioDividend per shareEarnings per share (basic) for continuing operations
Dividend yield %Dividend per shareClosing share price as of December 31
Shareholders’ equity per shareCapital and reserves attributable to equity holders of the parentNumber of shares as of December 31 - number of treasury shares as of December 31
Market capitalization(Number of shares as of December 31 - number of treasury shares as of December 31) x closing share price as of December 31
Share turnover %Number of shares traded during the yearAverage number of shares during the year
Alternative performance measuresCertain financial measures presented in this Annual Report on Form 20-F are not measures of financial performance, financial position or cash flowsdefined in IFRS. As these measures are not defined in IFRS, they may not be directly comparable with financial measures used by other companies,including those in the same industry. The primary rationale for presenting these measures is that the management uses these measures in assessing thefinancial performance of the Group and believes that these measures provide meaningful supplemental information on the underlying businessperformance of the Group. These financial measures should not be considered in isolation from, or as a substitute for, financial information presented incompliance with IFRS.
Financial measure Definition Purpose
Total cash and current financialinvestments (total cash)
Total cash and current financial investments consist ofcash and cash equivalents and current financialinvestments.
Total cash and current financial investments is used toindicate funds available to the Group to run its currentand invest in future business activities as well asprovide return for security holders.
Net cash and current financialinvestments (net cash)
Net cash and current financial investments equalstotal cash and current financial investments less long-term and short-term interest-bearing liabilities.
Net cash and current financial investments is used toindicate the Group's liquidity position after cashrequired to settle the interest-bearing liabilities.
Free cash flow Net cash from/(used in) operating activities -purchases of property, plant and equipment andintangible assets (capital expenditures) + proceedsfrom sale of property, plant and equipment andintangible assets – purchase of non-current financialinvestments + proceeds from sale of non-currentfinancial investments.
Free cash flow is the cash that the Group generatesafter net investments to tangible, intangible and non-current financial investments and it represents thecash available for distribution among its securityholders. It is a measure of cash generation, workingcapital efficiency and capital discipline of the business.
Capital expenditure Purchases of property, plant and equipment andintangible assets (excluding assets acquired underbusiness combinations).
Capital expenditure is used to describe investments inprofit-generating activities in the future.

Table of Contents
116
Financial statementsConsolidated income statement 117Consolidated statement of comprehensive income 118Consolidated statement of financial position 119Consolidated statement of cash flows 120Consolidated statement of changes in shareholders’ equity 121Notes to consolidated financial statements 1221. Corporate information 1222. Significant accounting policies 1223. New and amended standards and interpretations 1334. Use of estimates and critical accounting judgments 1345. Segment information 1366. Discontinued operations 1387. Revenue recognition 1398. Expenses by nature 1409. Personnel expenses 14010. Other operating income and expenses 14011. Financial income and expenses 14112. Income taxes 14113. Earnings per share 14314. Intangible assets 14415. Property, plant and equipment 14516. Leases 14517. Impairment 14618. Inventories 14719. Prepaid expenses and accrued income 14720. Shares of the Parent Company 14721. Translation differences, fair value and other reserves 14822. Other comprehensive income 14923. Interest-bearing liabilities 15024. Fair value of financial instruments 15125. Derivative financial instruments 15326. Share-based payments 15427. Pensions and other post-employment benefits 15528. Accrued expenses, deferred revenue and other liabilities 16129. Provisions 16230. Commitments, contingencies and legal proceedings 16331. Notes to the consolidated statement of cash flows 16432. Principal Group companies 16533. Significant partly-owned subsidiaries 16534. Investments in associated companies and joint ventures 16635. Related party transactions 16636. Financial risk management 16837. Subsequent events 175Reports of independent registered public accounting firms 176

Table of Contents
Consolidated income statement
117
2020 2019 2018For the year ended December 31 Notes EURm EURm EURm
Net sales 5, 7 21 852 23 315 22 563Cost of sales(1) 8 (13 659) (15 051) (14 251)Gross profit(1) 8 193 8 264 8 312Research and development expenses(1) 8 (4 087) (4 532) (4 777)Selling, general and administrative expenses(1) 8 (2 898) (3 219) (3 549)Other operating income(1) 10 150 237 267Other operating expenses(1) 8, 10 (473) (265) (312)Operating profit/(loss) 885 485 (59)Share of results of associated companies and joint ventures 34 22 12 12Financial income 11 156 165 85Financial expenses 11 (320) (506) (398)Profit/(loss) before tax 743 156 (360)Income tax expense 12 (3 256) (138) (189)(Loss)/profit for the year from continuing operations (2 513) 18 (549)(Loss)/profit for the year from discontinued operations 6 (3) (7) 214(Loss)/profit for the year (2 516) 11 (335)Attributable to: Equity holders of the parent (2 523) 7 (340)Non-controlling interests 7 4 5
Earnings per share attributable to equity holders of the parent 13 EUR EUR EUR
Basic Continuing operations (0.45) 0.00 (0.10)(Loss)/profit for the year (0.45) 0.00 (0.06)Diluted Continuing operations (0.45) 0.00 (0.10)(Loss)/profit for the year (0.45) 0.00 (0.06)
(1) In 2020, the Group reclassified certain items of income and expenses from other operating income and expenses to the functions. The comparative amounts for 2019 and 2018 have been recastaccordingly. Refer to Note 2, Significant accounting policies.
The notes are an integral part of these consolidated financial statements.
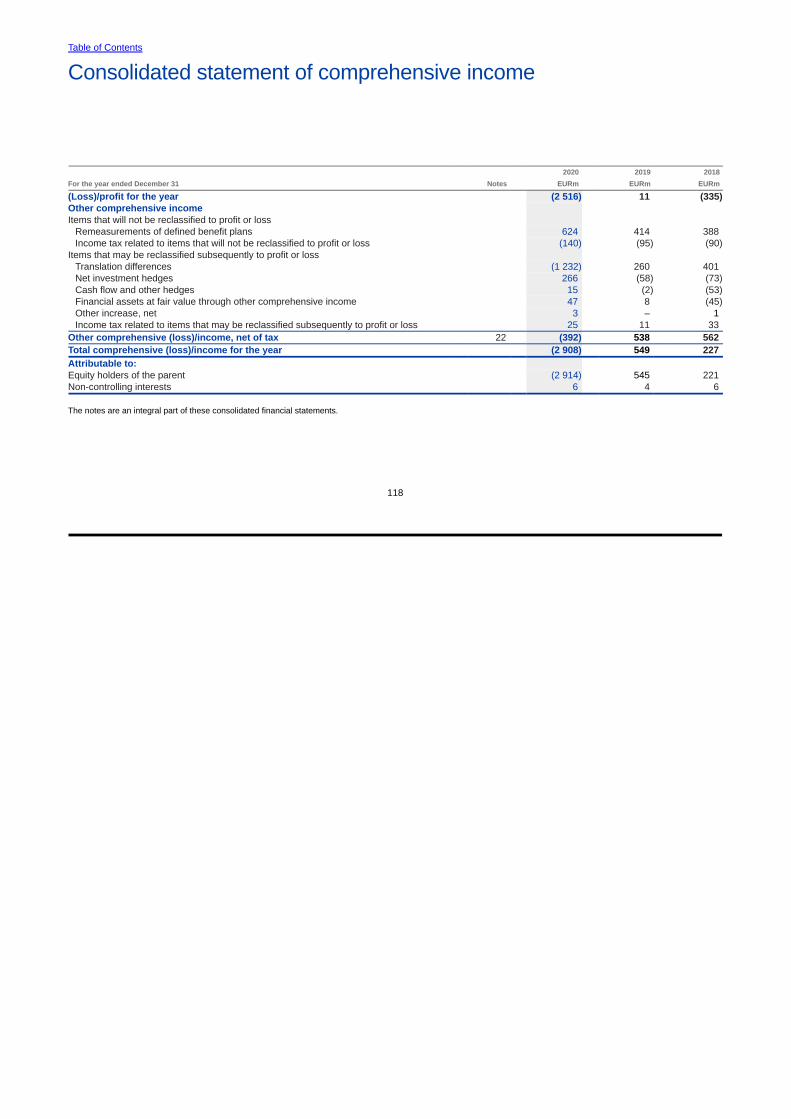
Table of Contents
Consolidated statement of comprehensive income
118
2020 2019 2018For the year ended December 31 Notes EURm EURm EURm
(Loss)/profit for the year (2 516) 11 (335)Other comprehensive income Items that will not be reclassified to profit or loss
Remeasurements of defined benefit plans 624 414 388Income tax related to items that will not be reclassified to profit or loss (140) (95) (90)
Items that may be reclassified subsequently to profit or loss Translation differences (1 232) 260 401Net investment hedges 266 (58) (73)Cash flow and other hedges 15 (2) (53)Financial assets at fair value through other comprehensive income 47 8 (45)Other increase, net 3 – 1Income tax related to items that may be reclassified subsequently to profit or loss 25 11 33
Other comprehensive (loss)/income, net of tax 22 (392) 538 562Total comprehensive (loss)/income for the year (2 908) 549 227Attributable to: Equity holders of the parent (2 914) 545 221Non-controlling interests 6 4 6
The notes are an integral part of these consolidated financial statements.

Table of Contents
Consolidated statement of financial position
119
2020 2019 As of December 31 Notes EURm EURm
ASSETS Non-current assets Intangible assets 14, 17 7 027 7 956Property, plant and equipment 15, 17 1 783 1 856Right-of-use assets 16, 17 805 912Investments in associated companies and joint ventures 17, 34 233 165Non-current financial investments 24 745 740Deferred tax assets 12 1 822 5 124Other non-current financial assets 17, 24, 36 306 445Defined benefit pension assets 27 5 038 4 830Other non-current assets 19 217 292Total non-current assets 17 976 22 320Current assets Inventories 18 2 242 2 936Trade receivables 24, 36 5 503 5 025Contract assets 7, 36 1 080 1 489Prepaid expenses and accrued income 19 850 908Current income tax assets 12 265 279Other current financial assets 24, 25, 36 214 164Current financial investments 24, 36 1 121 97Cash and cash equivalents 24, 36 6 940 5 910Total current assets 18 215 16 808Total assets 36 191 39 128SHAREHOLDERS' EQUITY AND LIABILITIES Capital and reserves attributable to equity holders of the parent Share capital 20 246 246Share issue premium 443 427Treasury shares (352) (352)Translation differences 21 (1 295) (372)Fair value and other reserves 21 1 910 1 382Reserve for invested unrestricted equity 15 656 15 607Accumulated deficit (4 143) (1 613)Total capital and reserves attributable to equity holders of the parent 12 465 15 325Non-controlling interests 80 76Total equity 12 545 15 401Non-current liabilities Long-term interest-bearing liabilities 23, 24, 36 5 015 3 985Long-term lease liabilities 23 721 771Deferred tax liabilities 12 260 390Defined benefit pension and post-employment liabilities 27 4 046 4 343Contract liabilities 7 566 915Deferred revenue and other long-term liabilities 24, 28 541 712Provisions 29 736 556Total non-current liabilities 11 885 11 672Current liabilities Short-term interest-bearing liabilities 23, 24, 36 561 292Short-term lease liabilities 23 189 259Other financial liabilities 24, 25, 36 738 803Current income tax liabilities 12 188 187Trade payables 24, 36 3 174 3 786Contract liabilities 7 2 394 2 752Accrued expenses, deferred revenue and other liabilities 28 3 721 3 323Provisions 29 796 653Total current liabilities 11 761 12 055Total liabilities 23 646 23 727Total shareholders' equity and liabilities 36 191 39 128
The notes are an integral part of these consolidated financial statements.

Table of Contents
Consolidated statement of cash flows
120
2020 2019 2018For the year ended December 31 Notes EURm EURm EURm
Cash flow from operating activities (Loss)/profit for the year (2 516) 11 (335)Adjustments, total 31 5 267 2 627 2 093Change in net working capital(1)
(Increase)/decrease in receivables (418) 159 246Decrease/(increase) in inventories 553 285 (544)Decrease in non-interest-bearing liabilities (845) (2 232) (645)
Cash from operations 2 041 850 815Interest received 33 57 68Interest paid 16, 23 (35) (1) (159)Income taxes paid, net (280) (516) (364)Net cash from operating activities 1 759 390 360Cash flow from investing activities Purchase of property, plant and equipment and intangible assets (479) (690) (672)Proceeds from sale of property, plant and equipment and intangible assets 13 39 88Acquisition of businesses, net of cash acquired (104) – (31)Proceeds from disposal of businesses, net of disposed cash 11 19 (18)Purchase of current financial investments (1 154) (473) (2 104)Proceeds from maturities and sale of current financial investments 123 991 2 397Purchase of non-current financial investments (59) (180) (145)Proceeds from sale of non-current financial investments 122 144 170Other 10 (17) –Net cash used in investing activities (1 517) (167) (315)Cash flow from financing activities Proceeds from stock option exercises – – 1(Purchase of)/proceeds from sale of equity instruments of subsidiaries (1) (1) 1Proceeds from long-term borrowings 23 1 595 1 039 139Repayment of long-term borrowings 23 (246) (766) (29)(Repayment of)/proceeds from short-term borrowings 23 (83) 40 2Payment of principal portion of lease liabilities 16, 23 (234) (221) (2)Dividends paid (148) (570) (1 081)Net cash from/(used in) financing activities 883 (479) (969)Translation differences (95) (95) (184)Net increase/(decrease) in cash and cash equivalents 1 030 (351) (1 108)Cash and cash equivalents as of January 1 5 910 6 261 7 369Cash and cash equivalents as of December 31 6 940 5 910 6 261
(1) Net working capital includes both short-term and long-term items.
The items in the consolidated statement of cash flows do not directly correspond to the changes in the respective items in the consolidated statement offinancial position due to several reasons, principally due to the effects of foreign exchange differences arising on consolidation and changes in theconsolidation scope. The consolidated statement of cash flows combines cash flows from both the continuing and the discontinued operations. For detailsof cash flows from discontinued operations, refer to Note 6, Discontinued operations.
The notes are an integral part of these consolidated financial statements.

Table of Contents
Consolidated statement of changes in shareholders’ equity
121
Reserve for Attributable
Share Fair value invested to equity Non-
Share issue Treasury Translation and other unrestricted Accumulated holders of controlling Total
EURm Notes capital premium shares differences reserves equity deficit the parent interests equity
As of January 1, 2018 246 447 (1 480) (932) 842 15 616 1 345 16 084 80 16 164
Loss for the year (340) (340) 5 (335)
Other comprehensive income 21, 22 341 221 (1) 561 1 562
Total comprehensive income for the year – – – 341 221 – (341) 221 6 227
Share-based payments 68 68 68
Excess tax benefit on share-based payments 6 6 6
Settlement of share-based payments (85) 72 (11) (24) (24)
Cancellation of treasury shares 1 000 (1 000) – –
Stock options exercised 1 1 1
Dividends(1) (1 063) (1 063) (5) (1 068)
Acquisition of non-controlling interests (1) (1) 1 –
Other movements (1) (2) (3) (3)
Total transactions with owners – (11) 1 072 (1) – (10) (2 066) (1 016) (4) (1 020)
As of December 31, 2018 246 436 (408) (592) 1 063 15 606 (1 062) 15 289 82 15 371
Adoption of IFRS 16 4 4 4
As of January 1, 2019 246 436 (408) (592) 1 063 15 606 (1 058) 15 293 82 15 375
Profit for the year 7 7 4 11
Other comprehensive income 21, 22 220 319 (1) 538 538
Total comprehensive income for the year – – – 220 319 – 6 545 4 549
Share-based payments 81 81 81
Excess tax benefit on share-based payments (7) (7) (7)
Settlement of share-based payments (83) 56 1 (26) (26)
Dividends(1) (560) (560) (10) (570)
Other movements (1) (1) (1)
Total transactions with owners – (9) 56 – – 1 (561) (513) (10) (523)
As of December 31, 2019 246 427 (352) (372) 1 382 15 607 (1 613) 15 325 76 15 401
Loss for the year (2 523) (2 523) 7 (2 516)
Other comprehensive loss 21, 22 (922) 528 3 (391) (1) (392)
Total comprehensive loss for the year – – – (922) 528 – (2 520) (2 914) 6 (2 908)
Share-based payments 76 76 76
Excess tax benefit on share-based payments 2 2 2
Settlement of share-based payments (62) 49 (13) (13)
Dividends(1) – (5) (5)
Acquisition of non-controlling interests (10) (10) (10)
Investment in subsidiary by non-controlling interest – 2 2
Other movements (1) (1) 1 –
Total transactions with owners – 16 – (1) – 49 (10) 54 (2) 52
As of December 31, 2020 246 443 (352) (1 295) 1 910 15 656 (4 143) 12 465 80 12 545
(1) The Group did not pay dividends to equity holders of the parent in 2020 (dividends settled per share EUR 0.10 in 2019 and EUR 0.19 in 2018). No dividend is proposed by the Board of Directors of theParent Company related to the financial year 2020.
The notes are an integral part of these consolidated financial statements.

Table of Contents
Notes to consolidated financial statements
122
1. Corporate informationNokia Corporation, a public limited liability company incorporated and domiciled in Helsinki, Finland, is the parent company (Parent Company or Parent)for all its subsidiaries (Nokia or the Group). The Group is a global provider of mobile and fixed network solutions combining hardware, software andservices, as well as licensing of intellectual property, including patents, technologies and the Nokia brand. The Group’s operational headquarters arelocated in Espoo, Finland. The shares of Nokia Corporation are listed on the Nasdaq Helsinki Stock Exchange, the New York Stock Exchange and theEuronext Paris Stock Exchange.
On March 4, 2021, the Board of Directors authorized the financial statements for the year ended December 31, 2020, for issuance and filing.
2. Significant accounting policiesBasis of presentation and statement of complianceThe consolidated financial statements are prepared in accordance with International Financial Reporting Standards (IFRS) as issued by the InternationalAccounting Standards Board (IASB) and as adopted by the European Union (EU). The consolidated financial statements are presented in millions of euros(EURm), except as otherwise noted, and are prepared under the historical cost convention, except as disclosed in the accounting policies below.The notes to the consolidated financial statements also conform to the Finnish accounting legislation.
In 2020, the Group reviewed the presentation of income and expenses related to its restructuring plans, pension plan curtailments and amendments aswell as certain asset impairments. As a result, the Group reclassified the restructuring and associated charges, pension curtailment and plan amendmentincome and expenses as well as certain impairment charges that were previously presented in other operating income and expenses to the functional lineitems to enhance the relevance of information provided in the Group’s consolidated income statement.
The comparative amounts for 2019 and 2018 have been reclassified accordingly. Related to 2019, as a result of reclassification, the Group’s cost of salesincreased by EUR 62 million, research and development expenses increased by EUR 121 million, selling, general and administrative expenses increasedby EUR 118 million, other operating income decreased by EUR 187 million and other operating expenses decreased by EUR 488 million compared to thepreviously reported amounts. Related to 2018, the Group’s cost of sales increased by EUR 134 million, research and development expenses increased byEUR 157 million, selling, general and administrative expenses increased by EUR 86 million, other operating income decreased by EUR 23 million andother operating expenses decreased by EUR 400 million compared to the previously reported amounts.
Other informationThis paragraph is included in connection with statutory reporting requirements in Germany. The fully consolidated German subsidiary, Nokia Solutions andNetworks GmbH & Co. KG, registered in the commercial register of Munich under HRA 88537, has made use of the exemption available under § 264b and§ 291 of the German Commercial Code (HGB).
Principles of consolidationThe consolidated financial statements comprise the financial statements of the Parent Company, and each of those companies over which it exercisescontrol. Control over an entity exists when the Group is exposed, or has rights, to variable returns from its involvement with the entity and has the ability toaffect those returns through its power over the entity. When the Group has less than a majority of voting or similar rights in an entity, the Group considersall relevant facts and circumstances in assessing whether it has power over an entity, including the contractual arrangements, and voting rights andpotential voting rights. The Group reassesses whether or not it controls an entity if facts and circumstances indicate that there are changes to the elementsof control.
Consolidation of a subsidiary begins when the Group obtains control over the subsidiary and ceases when the Group loses control over the subsidiary.Assets, liabilities, income and expenses of a subsidiary acquired or disposed of during the year are included in the consolidated financial statements fromthe date the Group gains control until the date the Group ceases to control the subsidiary. A change in the ownership interest of a subsidiary, without a lossof control, is accounted for as an equity transaction. If the Group loses control in a subsidiary, the related assets, liabilities, non-controlling interest andother components of equity are derecognized with any gain or loss recognized in the consolidated income statement. Any investment retained in theformer subsidiary is measured at fair value.
All intercompany transactions are eliminated as part of the consolidation process. Non-controlling interests are presented separately as a component ofnet profit or loss and are shown as a component of shareholders’ equity in the consolidated statement of financial position.
Business combinationsBusiness combinations are accounted for using the acquisition method. The consideration transferred in a business combination is measured as theaggregate of the fair values of the assets transferred, liabilities incurred towards the former owners of the acquired entity or business and equityinstruments issued. Acquisition-related costs are recognized as expenses in the consolidated income statement in the period in which the costs areincurred and the related services are received with the exception of costs directly attributable to the issuance of equity instruments that are accounted foras a deduction from equity.
Identifiable assets acquired and liabilities assumed are measured at the acquisition date fair values. The Group elects whether to measure the non-controlling interests in the acquiree at fair value or at the proportionate share of the acquiree’s identifiable net assets on a business combination bybusiness combination basis. The excess of the aggregate of the consideration transferred and the amount recognized for non-controlling interests over theacquisition date fair values of the identifiable net assets acquired is recorded as goodwill.
Investment in associates and joint venturesAn associate is an entity over which the Group exercises significant influence. Significant influence is the power to participate in the financial and operatingpolicy decisions of the entity, but is not control or joint control over those policies.
Table of Contents
123
A joint venture is a type of joint arrangement whereby the parties that have joint control of the arrangement have rights to the net assets of thearrangement. Joint control is the contractually agreed sharing of control of an arrangement, which exists only when decisions about relevant activitiesrequire the unanimous consent of the parties sharing control.
The Group’s investments in associates and joint ventures are accounted for using the equity method. Under the equity method, the investment in anassociate or joint venture is initially recognized at cost. The carrying amount of the investment is adjusted to recognize changes in the Group’s share of netassets of the associate or joint venture since the acquisition date. The Group’s share of profits and losses of associates and joint ventures is included inthe consolidated income statement outside operating profit or loss. Any change in other comprehensive income of associates and joint ventures ispresented as part of the Group’s other comprehensive income.
After application of the equity method, as of each reporting date, the Group determines whether there is objective evidence that the investment in anassociate or joint venture is impaired. If there is such evidence, the Group recognizes an impairment loss that is calculated as the difference between therecoverable amount of the associate or joint venture and its carrying value. The impairment loss is presented within ‘share of results of associatedcompanies and joint ventures’ in the consolidated income statement.
Non-current assets (or disposal groups) held for sale and discontinued operationsNon-current assets or disposal groups are classified as assets held for sale if their carrying amounts will be recovered principally through a saletransaction rather than through continuing use. For this to be the case, the asset, or the disposal group, must be available for immediate sale in its presentcondition subject only to terms that are usual and customary for sales of such assets or disposal groups, and the sale must be highly probable. Theseassets, or in the case of disposal groups, assets and liabilities, are presented separately in the consolidated statement of financial position and measuredat the lower of the carrying amount and fair value less costs to sell. Non-current assets classified as held for sale, or included in a disposal group classifiedas held for sale, are not depreciated or amortized.
Discontinued operations are reported when a component of the Group, comprising operations and cash flows that can be clearly distinguished bothoperationally and for financial reporting purposes from the rest of the Group, is classified as held for sale or has been disposed of, or the componentrepresents a major line of business or geographical area of operations, or is a part of a single coordinated plan to dispose of a separate major line ofbusiness or geographical area of operations. Profit or loss from discontinued operations is reported separately from income and expenses from continuingoperations in the consolidated income statement, with prior periods presented on a comparative basis. Cash flows for discontinued operations arepresented separately in the notes to the consolidated financial statements. Intra-group revenues and expenses between continuing and discontinuedoperations are eliminated.
Revenue recognitionThe Group accounts for a contract with a customer when the contract has been approved in writing, which is generally when both parties are committed toperform their respective obligations, the rights, including payment terms, regarding the goods and services to be transferred can be identified, the contracthas commercial substance, and collection of the consideration to which the Group expects to be entitled is probable. Management considers only legallyenforceable rights in evaluating the accounting for contracts with customers. As such, frame agreements that do not create legally enforceable rights andobligations are accounted for based on the issuance of subsequent legally binding purchase orders under the frame agreements.
A contract modification or a purchase order is accounted for as a separate contract if the scope of the contract increases by additional distinct goods orservices, and the price of the contract increases by an amount that reflects the standalone selling price of those additional goods or services. In case theadditional goods or services are distinct but not sold at a standalone selling price, the contract modification is accounted for prospectively. In cases wherethe additional goods or services are not distinct, the modification is accounted for through a cumulative catch-up adjustment.
The Group recognizes revenue from contracts with customers to reflect the transfer of promised goods and services to customers for amounts that reflectthe consideration to which the Group expects to be entitled in exchange for those goods and services. The consideration may include a variable amount,which the Group estimates based on the most likely amount. Items causing variability include volume discounts and sales-based or usage-based royalties.The Group includes variable consideration into the transaction price only to the extent that it is highly probable that a significant revenue reversal will notoccur. The transaction price also excludes amounts collected on behalf of third parties.
The Group’s payment terms are 100 days on average. Invoices are generally issued as control transfers and/or as services are rendered. When this is notthe case, the Group recognizes a contract asset or liability depending on the timing of payment versus transfer of control. In case the timing of paymentsprovides either the customer or the Group with a significant benefit of financing, the transaction price is adjusted for the effect of financing and the relatedinterest revenue or interest expense is presented separately from revenue. As a practical expedient, the Group does not account for financing componentsif, at contract inception, the consideration is expected to be received within one year before or after the goods or services have been transferred to thecustomer.
The Group enters into contracts with customers consisting of any combination of hardware, services and intellectual property. The associated revenuerecognized for such contracts depends on the nature of the underlying goods and services provided. The promised goods or services in the contract mightinclude sale of goods, license of intellectual property and grant of options to purchase additional goods or services that may provide the customer with amaterial right. The Group conducts an assessment at contract inception to determine which promised goods and services in a customer contract aredistinct and accordingly identified as performance obligations. The Group considers that goods and services are distinct if the customer can benefit fromthe good or service either on its own or together with other resources readily available, and if the Group’s promise to transfer the good or service isseparately identifiable from other promises in the contract.
The Group allocates the transaction price to each distinct performance obligation on the basis of their standalone selling prices, relative to the overalltransaction price. If a standalone selling price is not observable, it is estimated. The transaction price may include a discount or a variable amount ofconsideration that is generally allocated proportionately to all performance obligations in the contract unless the Group has observable evidence that theentire discount relates to only one or more, but not all, performance obligations in a contract.

Table of Contents
124
Revenue is recognized when, or as, the Group satisfies a performance obligation by transferring a promised good or service to a customer, which is whenthe customer obtains control of that good or service. The amount of revenue recognized is the amount allocated to the satisfied performance obligationbased on the relative standalone selling prices. A performance obligation may be satisfied at a point in time or over time.
Hardware and software sold by the Group includes warranty, which can either be assurance-type for repair of defects and recognized as a centralizedwarranty provision (refer to Note 29, Provisions), or service-type for scope beyond the repair of defects or for a time period beyond the standardassurance-type warranty period and considered a separate performance obligation within the context of the contract. Revenue is allocated to eachperformance obligation based on its standalone selling price in relation to the overall transaction price. The standalone selling price of each performanceobligation is determined by considering factors such as the price of the performance obligation if sold on a standalone basis and the expected cost of theperformance obligation plus a reasonable margin when price references are not available. The portion of the transaction price allocated to eachperformance obligation is then recognized when the revenue recognition criteria for that performance obligation have been met.
The Group presents its customer contracts in the consolidated statement of financial position as either a contract asset or a contract liability, depending onthe relationship between the Group’s performance and the customer’s payment for each individual contract. On a net basis, a contract asset positionrepresents where the Group has performed by transferring goods or services to a customer before the customer has provided the associatedconsideration or before payment is due. Conversely, a contract liability position represents where a customer has paid consideration or payment is due, butthe Group has not yet transferred goods or services to the customer. Contract assets presented in the consolidated statement of financial position arecurrent in nature while contract liabilities can be either current or non-current. Invoiced receivables represent unconditional rights to payment and arepresented separately as trade receivables in the consolidated statement of financial position.
Sale of productsThe Group manufactures and sells a range of networking equipment, covering the requirements of network operators. Revenue for these products isrecognized when control of the products has transferred, the determination of which may require judgment. Typically, for standard equipment sales, controltransfers upon delivery. For more complex solutions, control generally transfers upon acceptance.
In some arrangements, mainly within the submarine cable business, performance does not create an asset with an alternative use and the Grouprecognizes revenue over time using the output method, which faithfully depicts the manner in which the asset is transferred to the customer as well as theGroup's enforceable rights to payment for the work completed to date. The output measure selected by the Group may vary from each contract dependingon the nature of the contract.
Sale of servicesThe Group provides services related to the provision of networking equipment, ranging from managing a customer’s network and product maintenance services to network installation, integration and optimization. Revenue for each separate service performance obligation is recognized as or when the customer obtains the benefits of the Group’s performance. Service revenue is recognized over time for managed and maintenance services, as in these cases the Group performs throughout a fixed contract term and the customer simultaneously receives and consumes the benefits as the Group performs. In some cases, the Group performs services that are subject to customer acceptance where revenue is recognized when the customer acceptance is received.
Sale of intellectual property licensesThe Group provides its customers with licenses to intellectual property (IP) owned by the Group by granting software licenses and rights to benefit from theGroup’s IP in their products. When a software license is sold, revenue is recognized upon delivery or acceptance of the software, as the Group hasdetermined that each software release is distinct and the license is granted for software as it exists at the point of transfer of control to the customer.
When the Group grants customers a license to use IP owned by the Group, the associated license fee revenue is recognized in accordance with thesubstance of the relevant agreements. In the majority of cases, the Group retains obligations to continue to develop and make available to the customerthe latest IP in the licensed assets during the contract term, and therefore revenue is recognized pro rata over the period during which the Group isexpected to perform. Recognition of the revenue as pro rata over the term of the license is considered the most faithful depiction of the Group’s satisfactionof the performance obligation as the IP being licensed towards the customer includes new inventions patented by the Group that are highly interdependentand interrelated and created through the course of continuous research and development (R&D) efforts that are relatively stable throughout the year. Insome contracts, the Group has no remaining obligations to perform after granting a license to the initial IP, and licensing fees are non-refundable. In thesecases, revenue is recognized at the beginning of the license term.
Government grantsGovernment grants are recognized when there is reasonable assurance that the Group will comply with the conditions attached to them and the grants willbe received. Government grants received as compensation for expenses or losses incurred are recognized in the consolidated income statement as adeduction against the related expenses. Government grants related to assets are presented in the consolidated statement of financial position as deferredincome and recognized as income over the same period the asset is depreciated or amortized.
Government grants received in the form of R&D tax credits are recognized as a deduction against R&D expenses if the amount of the tax credit is linked tothe amount of R&D expenditures incurred by the Group and the tax credit is a fully collectible asset that will be paid in cash by the government in case theGroup is not able to offset it against its income tax payable. R&D tax credits that do not meet both conditions are recognized as income tax benefit.
Employee benefitsPensions and other post-employment benefitsThe Group companies have various post-employment plans in accordance with the local conditions and practices in the countries in which they operate.The plans are generally funded through payments to insurance companies or contributions to trustee-administered funds as determined by periodicactuarial calculations.

Table of Contents
125
In a defined contribution plan, the Group’s legal or constructive obligation is limited to the amount that it agrees to contribute to the fund. The Group’scontributions to defined contribution plans, multi-employer and insured plans are recognized in the consolidated income statement in the period to whichthe contributions relate. If a pension plan is funded through an insurance contract where the Group does not retain any legal or constructive obligations,the plan is treated as a defined contribution plan. All arrangements that do not fulfill these conditions are considered defined benefit plans.
For defined benefit plans, including pension and post-employment healthcare and life insurance, costs are assessed using the projected unit creditmethod: the cost is recognized in the consolidated income statement so as to spread the benefit over the service lives of employees. The defined benefitobligation is measured as the present value of the estimated future cash outflows using interest rates on high-quality corporate bonds or governmentbonds with maturities that most closely match expected payouts of benefits. The liability or asset recognized in the consolidated statement of financialposition is the present value of the defined benefit obligation as of the reporting date less the fair value of plan assets including effects of any asset ceiling.
Service cost related to employees’ service in the current period as well as past service cost resulting from plan amendments, curtailments, and gains andlosses on settlements are all presented within cost of sales, research and development expenses or selling, general and administrative expenses in theconsolidated income statement. Past service costs are recognized immediately in the consolidated income statement when the plan amendment,curtailment or settlement occurs. Net interest, consisting of interest calculated by applying a discount rate to the net defined benefit liability or asset andthe effect of asset ceiling, as well as pension plan administration costs not taken into account in determining the return on plan assets, are presentedwithin financial income and expenses in the consolidated income statement. Remeasurements, comprising actuarial gains and losses, the effect of theasset ceiling and the return on plan assets, excluding amounts recognized in net interest, are recognized immediately in the consolidated statement offinancial position with a corresponding debit or credit to pension remeasurements reserve within shareholders’ equity through other comprehensive incomein the period in which they occur. Remeasurements are not reclassified to profit or loss in subsequent periods.
Actuarial valuations for the Group’s defined benefit post-employment plans are performed annually or when a material plan amendment, curtailment orsettlement occurs.
Termination benefitsTermination benefits are payable when employment is terminated before the normal retirement date, or whenever an employee accepts voluntaryredundancy in exchange for these benefits. The Group recognizes termination benefits when it is demonstrably committed to either terminating theemployment of current employees according to a detailed formal plan without possibility of withdrawal, or providing termination benefits as a result of anoffer made to encourage voluntary redundancy. These benefits are recorded as termination benefits as a component of the restructuring provision. Locallaws may provide employees with the right to benefits from the employer upon termination whether the termination is voluntary or involuntary. For thesespecific benefits, the difference between the value of the higher benefit for involuntary termination and the lower benefit for voluntary termination is treatedas a termination benefit and the portion of the benefit that the Group would be required to pay to the employee in the case of voluntary terminationis treated as a contractual or legal obligation determined by local law and accounted for as a defined benefit arrangement as described in the pensionssection above.
Share-based paymentsThe Group offers three types of global equity-settled share-based compensation plans for employees: performance shares, restricted shares and theemployee share purchase plan.
Employee services received and the corresponding increase in equity are measured by reference to the fair value of the equity instruments as of the grantdate, excluding the impact of any non-market vesting conditions. Non-market vesting conditions attached to the performance shares are included inassumptions about the number of shares that the employee will ultimately receive. The Group reviews the assumptions made on a regular basis and,where necessary, revises its estimates of the number of performance shares that are expected to be settled. Plans that apply tranched vesting areaccounted for under the graded vesting model. Share-based compensation is recognized as an expense in the consolidated income statement over therelevant service periods.
Income taxesThe income tax expense comprises current tax and deferred tax. Tax is recognized in the consolidated income statement except to the extent that it relatesto items recognized in other comprehensive income, or directly in equity; then the related tax is recognized in other comprehensive income or equity,respectively.
Current taxes are based on the results of Group companies and are calculated using the local tax laws and tax rates that are enacted or substantivelyenacted as of each reporting date. Corporate taxes withheld at the source of the income on behalf of Group companies are accounted for in income taxeswhere determined to represent a tax on net income.
Deferred tax assets and liabilities are determined using the balance sheet liability method for all temporary differences arising between the tax basesof assets and liabilities and their carrying amounts in the consolidated financial statements. Deferred tax assets are recognized to the extent it is probablethat future taxable profit will be available against which the unused tax losses, unused tax credits and deductible temporary differences can be utilized inthe relevant jurisdictions. Deferred tax assets are assessed for realizability as of each reporting date. When circumstances indicate it is no longer probablethat deferred tax assets will be utilized, adjustments are made as necessary. Deferred tax liabilities are recognized for taxable temporary differences, andfor temporary differences that arise between the fair value and the tax base of identifiable net assets acquired in business combinations.
Deferred tax assets and deferred tax liabilities are offset for presentation purposes when there is a legally enforceable right to set off current tax assetsagainst current tax liabilities, and the deferred tax assets and deferred tax liabilities relate to income taxes levied by the same taxation authority on eitherthe same taxable entity or different taxable entities, which intend either to settle current tax liabilities and assets on a net basis, or to realize the assets andsettle the liabilities simultaneously in each future period in which significant amounts of deferred tax liabilities or deferred tax assets are expected to besettled or recovered.

Table of Contents
126
Deferred tax liabilities are not recognized if they arise from the initial recognition of goodwill. Deferred tax liabilities are provided on taxable temporarydifferences arising from investments in subsidiaries, associates and joint arrangements, except for deferred tax liability where the timing of the reversal ofthe temporary difference is controlled by the Group, and it is probable that the temporary difference will not reverse in the foreseeable future.
The enacted or substantively enacted tax rates as of each reporting date that are expected to apply in the period when the asset is realized or the liabilityis settled are used in the measurement of deferred tax assets and deferred tax liabilities. Deferred tax assets and liabilities are not discounted.
The Group periodically evaluates positions taken in tax returns with respect to situations in which applicable tax regulation is subject to interpretation. Itadjusts the amounts of current and deferred tax assets and liabilities recorded, where it is considered probable, i.e. more likely than not, that certain taxpositions may not be fully sustained upon review by tax authorities. The amounts recorded are based on the most likely amount or the expected value,depending on which method the Group expects to better predict the resolution of the uncertainty, as of each reporting date.
Foreign currency translationFunctional and presentation currencyThe financial statements of all Group companies are measured using functional currency, which is the currency of the primary economic environment inwhich the entity operates. The consolidated financial statements are presented in euro, the functional and presentation currency of the Parent Company.
Transactions in foreign currenciesTransactions in foreign currencies are recorded at exchange rates prevailing as of the dates of the individual transactions. For practical reasons, a rate thatapproximates the actual rate as of the date of the transaction is often used. Monetary assets and liabilities denominated in foreign currency are valued atthe exchange rates prevailing at the end of the reporting period. Foreign exchange gains and losses arising from monetary assets and liabilities as well asfair value changes of related hedging instruments are recognized in financial income and expenses in the consolidated income statement. Unrealizedforeign exchange gains and losses related to non-monetary non-current financial investments are included in the fair value measurement of theseinvestments and recognized in other operating income and expenses in the consolidated income statement.
Foreign Group companiesOn consolidation, the assets and liabilities of foreign operations whose functional currency is other than euro are translated into euro at the exchange ratesprevailing at the end of the reporting period. The income and expenses of these foreign operations are translated into euro at the average exchange ratesfor the reporting period. The exchange differences arising from translation for consolidation are recognized as translation differences in the consolidatedstatement of comprehensive income. On disposal of a foreign operation the cumulative amount of translation differences relating to that disposal isreclassified to profit or loss.
Intangible assetsIntangible assets acquired separately are measured on initial recognition at cost. The cost of intangible assets acquired in a business combination is theirfair value as of the date of acquisition. Internally generated intangibles, except for development costs that may be capitalized, are expensed as incurred.Development costs are capitalized only if the Group has the technical feasibility to complete the asset; has an ability and intention to use or sell the asset;can demonstrate that the asset will generate future economic benefits; has resources available to complete the asset; and has the ability to measurereliably the expenditure during development.
The useful life of the Group’s intangible assets, other than goodwill, is finite. Following initial recognition, finite intangible assets are carried at costless accumulated amortization and accumulated impairment losses. Intangible assets are amortized over their useful lives, generally three to ten years,using the straight-line method, which is considered to best reflect the pattern in which the asset’s future economic benefits are expected to be consumed.Depending on the nature of the intangible asset, the amortization charges are presented within cost of sales, research and development expenses orselling, general and administrative expenses in the consolidated income statement.
Property, plant and equipmentProperty, plant and equipment are stated at cost less accumulated depreciation and accumulated impairment losses. Depreciation is recorded on astraight-line basis over the expected useful lives of the assets as follows:
Buildings and constructions Buildings and constructions 20–33 yearsLight buildings and constructions 3–20 yearsMachinery and equipment Production machinery, measuring and test equipment 1–5 yearsOther machinery and equipment 3–10 years
Land and water areas are not depreciated.
Maintenance, repairs and renewals are generally expensed in the period in which they are incurred. However, major renovations are capitalized andincluded in the carrying amount of the asset when it is probable that future economic benefits in excess of the originally assessed standard of performanceof the existing asset will flow to the Group. Major renovations are depreciated over the remaining useful life of the related asset. Leasehold improvementsare depreciated over the shorter of the lease term and the useful life. Gains and losses on the disposal of property, plant and equipment are included inother operating income or expenses.
LeasesOn January 1, 2019, the Group adopted IFRS 16, Leases, which provides a single lessee accounting model, requiring lessees to recognize right-of-useassets and lease liabilities for all leases in the consolidated statement of financial position. The right-of-use asset represents the lessee’s right to use theunderlying leased asset while the lease liability represents the lessee’s obligation to make lease payments.

Table of Contents
127
The Group assesses at contract inception whether a contract is, or contains, a lease. That is, the Group assesses whether the contract conveys the rightto control the use of an identified asset for a period of time in exchange for consideration. At the commencement date of the lease, the Group recognizes aright-of-use asset and a lease liability for all leases with a lease term exceeding 12 months. The commencement date is the date when the lessor makesthe underlying leased asset available for use by the Group.
The Group applies a practical expedient whereby leases for which the lease term is 12 months or less at the lease commencement date (short-termleases) are not recognized in its consolidated statement of financial position. Instead, the Group recognizes the lease payments associated with short-termleases as an operating expense on a straight-line basis over the lease term. In addition, as a practical expedient, the Group does not separate certain non-lease components from lease components but instead accounts for each lease component and associated specified non-lease component as a singlelease component. Non-lease components such as payments for maintenance and services made in conjunction with the leased asset are included in thelease liability whenever these payments are fixed and defined in the lease contract. Other payments for non-lease components that are variable based onconsumption, as an example property taxes, insurance payments and variable property service costs, are recognized as an expense when incurred.
The majority of the Group’s leased assets relate to commercial and industrial properties such as R&D facilities, production facilities and office buildings.The Group also leases vehicles provided as employee benefits and service vehicles.
Right-of-use assets are measured at cost less accumulated depreciation and impairment losses, and adjusted for any remeasurements of the leaseliabilities. The cost of right-of-use assets includes the amount of lease liabilities recognized, initial direct costs incurred, and lease payments made at orbefore the commencement date less any lease incentives received. Right-of-use assets are depreciated on a straight-line basis over the lease term asfollows:
Buildings 3–10 yearsOther 3–5 years
Lease liabilities are measured at the present value of lease payments to be made over the lease term. The Group determines the lease term as the non-cancellable term of the lease, together with any periods covered by an option to extend the lease if it is reasonably certain to be exercised, as well as anyperiods covered by an option to terminate the lease if it is reasonably certain not to be exercised. The lease payments include fixed lease payments andcertain fixed non-lease components less any lease incentives receivable, variable lease payments that depend on an index or a rate, and appropriatetermination fees whenever the lease term has been determined based on the expectation that the Group will exercise its option to terminate. The Groupdoes not generally enter into lease contracts with variable lease payments linked to future performance or use of an underlying asset.
After the commencement date, the amount of lease liabilities is measured on an amortized cost basis using the effective interest method where the leaseliabilities increase related to the accretion of interest and decrease for lease payments made. In addition, the carrying amounts for the right-of-use assetand lease liability are remeasured if there is a modification, a change in the lease term or a change in the future lease payments resulting from a change inan index or rate used to determine such lease payments. The interest component of the lease payments is recognized as interest expense within financialincome and expenses.
The Group uses its incremental borrowing rate to calculate the present value of lease payments as the interest rate implicit in the lease is not readilydeterminable. The Group estimates its incremental borrowing rate quarterly based on the rate of interest that the Group would pay to borrow over thelease term with a similar security to obtain an asset of a similar value to the leased asset in a similar economic environment. The Group measures allleases at amortized cost based on the appropriate discount rate available in the quarter when lease commencement occurred. Where a lease contractmodification or reassessment of the lease liability resulting from a change in the lease term occurs, the Group remeasures the present value of the leaseliability based on the appropriate discount rate available in the quarter when the reassessment or modification occurs.
The Group acts primarily as a lessee in its leasing transactions. However, the Group will enter into contracts to sublease vacant leasehold or freeholdproperties for sublease terms up to 10 years to offset or mitigate the unavoidable costs associated with those properties. In these cases, the Groupclassifies each sublease as a finance lease whenever the sublease contract transfers substantially all the risks and rewards incidental to ownership to thesubtenant. All other subleases are classified as operating leases.
Included within other financial assets in its consolidated statement of financial position, the Group recognizes a net investment asset for all financesubleases based on the present value of future sublease payments at the sublease commencement date. After the commencement date, the netinvestment asset is measured on an amortized cost basis using the effective interest method where the net investment asset increases related to theaccretion of interest income and decreases for sublease payments received. Sublease payments received from operating subleases is recognized asother operating income on a straight-line basis over the lease term.
Impairment of goodwill, other intangible assets, property, plant and equipment and right-of-use assetsThe Group assesses the recoverability of the carrying value of goodwill, other intangible assets, property, plant and equipment and right-of-use assets ifevents or changes in circumstances indicate that the carrying value may be impaired. In addition, the Group tests the carrying value of goodwillfor impairment annually even if there is no indication of impairment.
Factors that the Group considers when it reviews indications of impairment include, but are not limited to, underperformance of the asset relative to itshistorical or projected future results, significant changes in the manner of using the asset or the strategy for the overall business, and significant negativeindustry or economic trends.
Goodwill is allocated to the cash-generating units or groups of cash-generating units that are expected to benefit from the synergies of the relatedbusiness combination and that reflect the lowest level at which goodwill is monitored for internal management purposes. A cash-generating unit, asdetermined for the purposes of the Group’s goodwill impairment testing, is the smallest group of assets generating cash inflows that are largelyindependent of the cash inflows from other assets or groups of assets. The carrying value of a cash-generating unit includes its share of relevant corporateassets allocated to it on a reasonable and consistent basis. When the composition of one or more groups of cash-generating units to

Table of Contents
128
which goodwill has been allocated is changed, the goodwill is reallocated based on the relative fair value of the affected groups of cash-generating units.
The Group conducts its impairment testing by determining the recoverable amount for an asset, a cash-generating unit or groups of cash-generating units.The recoverable amount of an asset, a cash-generating unit or groups of cash-generating units is the higher of its fair value less costs of disposal and itsvalue-in-use. The recoverable amount is compared to the asset’s, cash-generating unit’s or groups of cash-generating units’ carrying value. If therecoverable amount for the asset, cash-generating unit or groups of cash-generating units is less than its carrying value, the asset is considered impairedand is written down to its recoverable amount. Impairment losses are presented in cost of sales, research and development expenses or selling, generaland administrative expenses in the consolidated income statement, except for impairment losses on goodwill, which are presented in other operatingexpenses.
InventoriesInventories are stated at the lower of cost and net realizable value. Cost is determined using standard cost, which approximates actual cost on a first-infirst-out (FIFO) basis. Net realizable value is the amount that can be realized from the sale of the inventory in the normal course of business after allowingfor the costs of realization. In addition to the cost of materials and direct labor, an appropriate proportion of production overhead is included in the cost ofinventory. An allowance is recorded for excess inventory and obsolescence based on the lower of cost and net realizable value.
The Group classifies its inventories to raw materials and semi-finished goods, finished goods, and contract work in progress. Raw materials and semi-finished goods include purchased materials, components and supplies to be used in production. Finished goods include goods manufactured by the Groupor by subcontractors that are ready for sale and goods purchased for resale. Contract work in progress includes costs incurred to date for customercontracts where the contractual performance obligations are not yet satisfied. Contract work in progress will be recognized as cost of sales when control ofthe related performance obligation is transferred to the customer.
Fair value measurement of financial instrumentsA number of financial instruments are measured at fair value as of each reporting date after initial recognition. Fair value is the price that would bereceived to sell an asset or paid to transfer a liability in an orderly transaction between market participants at the measurement date. The fair value of anasset or a liability is measured using the assumptions that market participants would use when pricing the asset or liability, assuming that marketparticipants act in their economic best interest, by using quoted market rates, discounted cash flow analyses and other appropriate valuation models. TheGroup uses valuation techniques that are appropriate in the circumstances and for which sufficient data is available to measure fair value, maximizing theuse of relevant observable inputs and minimizing the use of unobservable inputs. All financial assets and liabilities for which fair values are beingmeasured or disclosed in the consolidated financial statements are categorized within the fair value hierarchy, described as follows, based on the lowestlevel input that is significant to the fair value measurement as a whole:
Level 1—Quoted (unadjusted) market prices for exchange-traded products in active markets for identical assets or liabilities;
Level 2—Valuation techniques for which significant inputs other than quoted prices are directly or indirectly observable; and
Level 3—Valuation techniques for which significant inputs are unobservable.
The Group categorizes assets and liabilities that are measured at fair value on a recurring basis into an appropriate level of the fair value hierarchy at theend of each reporting period.
Classification and measurement of financial assetsThe Group has classified its financial assets that are debt instruments in the following three categories: financial assets measured at amortized cost,financial assets measured at fair value through other comprehensive income, and financial assets measured at fair value through profit and loss. TheGroup has classified its financial assets that are equity instruments to financial assets measured at fair value through profit and loss. The selection of theappropriate category is made based on both the Group’s business model for managing the financial asset and on the contractual cash flow characteristicsof the asset.
The Group’s business model for managing financial assets is defined on a portfolio level. The business model must be observable on a practical level bythe way the business is managed. The cash flows of financial assets measured at amortized cost are solely payments of principal and interest. Theseassets are held within a business model that has an objective to hold assets to collect contractual cash flows. Financial assets measured at fair valuethrough other comprehensive income have cash flows that are solely payments of principal and interest and these assets are held within a business modelthat has an objective that is achieved both by holding financial assets to collect contractual cash flows and selling financial assets. Financial assetsmeasured at fair value through profit and loss are assets that do not fall in either of these two categories. In addition to the classification as describedabove, the accounting for financial assets is impacted if the financial asset is part of a hedging relationship (see below the section on Hedge accounting).
All purchases and sales of financial assets are recorded on the trade date, that is, when the Group commits to purchase or sell the asset. A financial assetis derecognized when substantially all the risks and rewards related to the financial asset have been transferred to a third party that assumes control of thefinancial asset.
Non-current financial investmentsNon-current financial investments include investments in unlisted private equity shares and unlisted venture funds. These equity and debt investments areclassified as fair value through profit and loss and are initially recognized and subsequently remeasured at fair value.
Fair value is estimated using a number of methods, including, but not limited to: quoted market rates; the current market value of similar instruments;prices established from a recent arm’s-length financing transaction of target companies; and analysis of market prospects and operating performance oftarget companies, taking into consideration public market comparable companies in similar industry sectors. The Group uses judgment in selecting theappropriate valuation methodology as well as underlying assumptions based on existing market practice and conditions.

Table of Contents
129
Fair value adjustments, foreign exchange gains and losses as well as realized gains and losses from the disposal of these investments are recognizedwithin other operating income and expenses in the consolidated income statement. Weighted average method is used to determine the cost basis of theinvestments disposed.
Other non-current financial assetsOther non-current financial assets include restricted assets and other receivables, customer and vendor financing related loan receivables and certainother investments of a long-term nature.
Restricted assets and other receivables include restricted bank deposits primarily related to employee benefits as well as other loan receivables. Theseassets are initially measured at fair value and in subsequent periods at amortized cost using the effective interest method. Interest calculated using theeffective interest method as well as foreign exchange gains and losses are recognized in financial income and expenses in the consolidated incomestatement. For these assets, a loss allowance is calculated on a quarterly basis based on a review of collectability and available collateral, recorded as anadjustment to the carrying amount of the investment and recognized in other financial expenses in the consolidated income statement.
Customer- and vendor-related loan receivables are managed in a portfolio with a business model of holding investments to collect principal and interest aswell as selling investments. They are initially recognized and subsequently remeasured at fair value determined using the discounted cash flow method.The changes in fair value are recognized in fair value reserve in other comprehensive income. Interest calculated using the effective interest method aswell as foreign exchange gains and losses are recognized in financial income and expenses in the consolidated income statement. Estimated credit loss istypically based on 12-month expected credit loss for existing loans and estimated additional draw-downs during that period; refer to Impairments sectionfor further detail. Loss allowance is calculated on a quarterly basis based on a review of collectability and available collateral, and recorded in otherfinancial expenses in the consolidated income statement reducing fair value loss recorded in other comprehensive income. In case a receivable is sold,the impact of expected credit loss is reversed, and the full gain or loss incurred for the sale is recorded in financial income and expenses in theconsolidated income statement.
The cash flows of other investments of a long-term nature do not fulfill the criteria of being solely payments of principal and interest. These investments areinitially recognized and subsequently remeasured at fair value using quoted market rates, discounted cash flow models or other appropriate valuationmethods as of the reporting date. Fair value adjustments, foreign exchange gains and losses as well as realized gains and losses from the disposal ofthese investments are mainly recognized within financial income and expenses in the consolidated income statement.
Other current financial assetsOther current financial assets include current part of other non-current financial assets and short-term loan receivables as well as derivative assets that arediscussed separately in the Derivative financial instruments section below.
Short-term loan receivables are initially measured at fair value and in subsequent periods measured at amortized cost using the effective interest method.Interest calculated using the effective interest method as well as foreign exchange gains and losses are recognized in financial income and expenses inthe consolidated income statement. For these loans, a loss allowance is calculated on a quarterly basis based on a review of collectability and availablecollateral, recorded as an adjustment to the carrying amount of the investment and recognized in other financial expenses in the consolidated incomestatement.
Trade receivablesTrade receivables arise from contracts with customers and represent an unconditional right to receive the consideration and only the passage of time isrequired before the consideration is received. The Group sells trade receivables to various financial institutions without recourse in the normal course ofbusiness, in order to manage credit risk and working capital cycle, and the business model for managing trade receivables is holding receivables to collectcontractual cash flows and selling receivables. Trade receivables are initially recognized and subsequently remeasured at fair value, determined using thediscounted cash flow method. The changes in fair value are recognized in fair value reserve in other comprehensive income. The Group applies asimplified approach to recognizing a loss allowance on trade receivables and contract assets based on measurement of lifetime expected credit lossesarising from trade receivables and contract assets without significant financing components. Refer to Note 4, Use of estimates and critical accountingjudgments, for disclosure of the use of estimates and critical accounting judgments necessary in the estimation of such loss allowances. Loss allowanceson trade receivables and contract assets are recognized in other operating expenses in the consolidated income statement. If trade receivables are sold,the difference between the carrying amount derecognized and the consideration received is recognized in financial expenses in the consolidated incomestatement.
Current financial investmentsThe Group invests a portion of the corporate cash needed to cover the projected cash outflows of its ongoing business operations in highly liquid, interest-bearing investments. Current financial investments may include investments measured at amortized cost, investments measured at fair value throughother comprehensive income and investments measured at fair value through profit and loss.
Corporate cash investments in bank deposits used as collaterals for derivative transactions are initially measured at fair value and in subsequent periodsmeasured at amortized cost using the effective interest method. Interest calculated using the effective interest method as well as foreign exchange gainsand losses are recognized in financial income and expenses in the consolidated income statement.
Corporate cash investments in bank deposits, as well as fixed income and money market securities with initial maturity or put feature longer than threemonths that have characteristics of solely payments of principal and interest and are not part of structured investments, are managed in a portfolio with abusiness model of holding investments to collect principal and interest as well as selling investments, and are classified as fair value through othercomprehensive income. In this portfolio, investments are executed with the main purpose of collecting contractual cash flows and principal repayments.However, investments are sold from time to time for liquidity management and market risk mitigation purposes.

Table of Contents
130
The fair value of these investments is determined using quoted market rates, discounted cash flow models or other appropriate valuation methods as ofthe reporting date. The changes in fair value are recognized in fair value reserve in other comprehensive income. Interest calculated using the effectiveinterest method, as well as foreign exchange gains and losses, are recognized in financial income and expenses in the consolidated income statement.When an investment is disposed of, the related accumulated fair value changes are derecognized from other comprehensive income and recognized infinancial income and expenses in the consolidated income statement. The FIFO method is used to determine the cost basis of fixed income securitiesbeing disposed of.
Due to the high credit quality of the Group’s investment portfolio, the estimated credit loss is normally based on 12-month expected credit loss. Lossallowance is calculated on a quarterly basis, recorded in other financial expenses in the consolidated income statement reducing fair value gains andlosses recorded in other comprehensive income.
Corporate cash investments may also include money market funds that do not qualify as cash equivalents, investments acquired for trading purposes,investment structures consisting of securities traded in combination with derivatives with complementing and typically offsetting risk factors and otherinvestments that have cash flows not being solely payments of principal and interest. In this portfolio, investments are executed with the purpose ofcollecting contractual cash flows and principal repayments as well as for capital appreciation and can be sold at any time.
These investments are initially recognized and subsequently remeasured at fair value determined using quoted market rates, discounted cash flow modelsor other appropriate valuation methods as of the reporting date. Fair value adjustments, foreign exchange gains and losses and realized gains and lossesare recognized in financial income and expenses in the consolidated income statement.
Cash and cash equivalentsCash and cash equivalents include cash at bank and in hand as well as highly liquid, fixed income and money market investments that are readilyconvertible to known amounts of cash with maturities at acquisition of three months or less, as well as bank deposits with maturities or contractual callperiods at acquisition of three months or less. Due to the high credit quality and short-term nature of these investments, there is an insignificant risk ofchange in value. Investments in money market funds that have a risk profile consistent with the aforementioned criteria are also classified as cashequivalents. Investments that have cash flows that are solely payments of principal and interest are measured at amortized cost. All other investments aremeasured at fair value through profit and loss.
Classification and measurement of financial liabilitiesThe Group has classified its financial liabilities in the following categories: financial liabilities measured at amortized cost and financial liabilities measuredat fair value through profit and loss. The Group classifies derivative liabilities as well as the conditional obligation related to Nokia Shanghai Bell at fairvalue through profit and loss and all other financial liabilities at amortized cost.
All financial liabilities are initially recognized at fair value and, in case of borrowings and payables, net of transaction costs. Financial liabilities arederecognized when the related obligation is discharged or cancelled or expired. Additionally, a substantial modification of the terms of an existing financialliability is accounted for as a derecognition of the original financial liability and the recognition of a new financial liability. On derecognition of a financialliability, the difference between the carrying amount extinguished and the consideration paid is recognized in interest expenses in the consolidated incomestatement.
Interest-bearing liabilitiesLong-term interest-bearing liabilities are measured at amortized cost using the effective interest method. Short-term interest-bearing liabilities, including thecurrent part of long-term interest-bearing liabilities and collaterals for derivative transactions, are measured at amortized cost using the effective interestmethod.
Transaction costs, interest calculated using the effective interest method as well as foreign exchange gains and losses are recognized in financial incomeand expenses in the consolidated income statement.
Other financial liabilitiesOther financial liabilities mainly include a conditional obligation to China Huaxin as part of the Nokia Shanghai Bell definitive agreements where ChinaHuaxin obtained the right to fully transfer its ownership interest in Nokia Shanghai Bell to the Group in exchange for a future cash settlement. The financialliability related to the conditional obligation is measured based on the expected future cash settlement with any changes recorded in financial income andexpenses in the consolidated income statement.
Other financial liabilities also include derivative liabilities that are discussed separately in the Derivative financial instruments section below.
Trade payablesTrade payables are carried at invoiced amount, which is considered to be equal to the fair value due to the short-term nature of the Group’s tradepayables.
Impairments of financial assets excluding trade receivables and contract assetsImpairment requirements apply to the recognition of a loss allowance for expected credit losses (ECL) on financial assets measured at amortized cost,financial assets measured at fair value through other comprehensive income, financial guarantee contracts and loan commitments. The Groupcontinuously assesses its financial instruments on a forward-looking basis and accounts for the changes in ECL on a quarterly basis using the followingmethod:
◾ECL = PD x LGD x EAD
◾Probability of Default (PD) is estimated separately for the centralized investment portfolio and non-centralized investments. The estimate is based onthe credit rating profile of these investments as well as specific local circumstances as applicable, unless there are specific events that would indicatethat the credit rating would not be an appropriate basis for estimating credit risk at the reporting date.

Table of Contents
131
◾For Loss Given Default (LGD), the recovery rate is also estimated separately for centralized investment portfolios and non-centralized investments andis based on the type of investment, specific local circumstances as applicable as well as related collateral arrangements, if any.
◾Exposure at Default (EAD) is normally the nominal value of the investment or financial guarantee. For loan commitments, EAD is based on estimateddraw-down amounts for the next 12 months.
All the Group’s current investments at amortized cost and fair value through other comprehensive income are considered to have low credit risk, and theloss allowance recognized during the period is therefore limited to 12 months’ expected losses. Financial instruments that are rated as investment gradeare considered to have low credit risk for the purposes of this assessment.
For other non-current financial assets, loans, loan commitments and financial guarantees extended to third parties, the ECL is calculated separately foreach significant counterparty using the method described above, including the impact of any collateral arrangements or other credit enhancements toLGD. The estimate is based on 12-month ECL unless there has been a significant increase in credit risk for the specific counterparty since the initialrecognition, in which case lifetime ECL is estimated. Breaches of contract, credit rating downgrades and other credit measures are typical indicators thatthe Group takes into consideration when assessing whether the credit risk on a financial instrument has increased significantly since initial recognition.
The change in the amount of loss allowance for ECL is recognized as an impairment gain or loss in financial income and expenses in the consolidatedincome statement. For assets carried at amortized cost, the loss allowance is recorded as an adjustment to the carrying amount. For assets carried at fairvalue through other comprehensive income, the loss allowance is recorded as an adjustment in other comprehensive income instead of adjusting thecarrying amount that has already been recorded at fair value. For financial guarantee contracts, the loss allowance is recognized as another liability in thestatement of financial position.
Derivative financial instrumentsAll derivatives are recognized initially at fair value on the date a derivative contract is entered into and subsequently remeasured at fair value. The methodof recognizing the resulting gain or loss varies according to whether the derivatives are designated and qualify under hedge accounting.
The cash flows of a hedge are classified as cash flows from operating activities in the consolidated statement of cash flows in case the underlying hedgeditems relate to the Group’s operating activities. When a derivative contract is accounted for as a hedge of an identifiable position relating to financing orinvesting activities, the cash flows of the contract are classified in the same way as the cash flows of the position being hedged. Certain derivatives arehedging the foreign exchange risk of the Group’s cash position and their cash flows are included in foreign exchange adjustment in the consolidatedstatement of cash flows.
Derivatives not designated in hedge accounting relationships carried at fair value through profit and lossForeign exchange forward contracts are valued at market-forward exchange rates. Changes in fair value are measured by comparing these rates with theoriginal contract-forward rate. Currency options are valued as of each reporting date by using the Garman & Kohlhagen option valuation model. Changesin fair value are recognized in the consolidated income statement.
Fair values of forward rate agreements, interest rate options, futures contracts and exchange-traded options are calculated based on quoted market ratesas of each reporting date. The discounted cash flow method is used to value interest rate and cross-currency swaps. Changes in fair value are recognizedin the consolidated income statement.
For derivatives not designated under hedge accounting but hedging identifiable forecast exposures such as anticipated foreign currency denominatedsales and purchases, the gains and losses are recognized in other operating income or expenses in the consolidated income statement. The gains andlosses on all other derivatives not designated under hedge accounting are recognized in financial income and expenses in the consolidated incomestatement.
Embedded derivatives included in contracts are identified and monitored by the Group. For host contracts that are not financial assets containingembedded derivatives that are not closely related, the embedded derivatives are separated and measured at fair value as of each reporting date withchanges in fair value recognized in financial income and expenses in the consolidated income statement. For host contracts that are financial assetscontaining embedded derivatives, the whole contract is measured at fair value as of each reporting date with changes in fair value recognized in financialincome and expenses in the consolidated income statement.
Hedge accountingThe Group applies hedge accounting on certain foreign exchange forward contracts, options or option strategies, and interest rate derivatives. Qualifyingoptions and option strategies have zero net premium, or a net premium paid. For option structures, the critical terms of the purchased and written optionsare the same and the notional amount of the written option component is not greater than that of the purchased option.
In the fair valuation of foreign exchange forward contracts, the Group separates the spot element and the forward element including the impact of foreigncurrency basis spread and forward points, which is considered as the cost of hedging for foreign exchange forward contracts. In the fair valuation offoreign exchange option contracts, the Group separates the intrinsic value and time value, which is considered as the cost of hedging for foreign exchangeoption contracts. In the fair valuation of cross-currency swaps, the Group separates the foreign currency basis spread that is considered as the cost ofhedging for cross-currency swaps.
Cash flow hedges: hedging of forecast foreign currency denominated sales and purchasesThe Group applies cash flow hedge accounting primarily to forecast business foreign exchange exposure that arises from highly probable forecastoperative business transactions. The risk management strategy is to hedge material net exposures (identified standard sales exposure minus identifiedstandard costs exposure) by using foreign exchange forwards and foreign exchange options in a layered hedging style that follows defined hedge ratioranges and hedge maturities in quarterly time buckets. The hedged item must be highly probable and present an exposure to variations in cash flows thatcould ultimately affect profit or loss.
Table of Contents
132
The Group only designates the spot element of the foreign exchange forward contract as the hedging instrument. Currency options, or option strategies,may also be used for cash flow hedging, in which case the intrinsic value of the option is designated as the hedging instrument. Hedge effectiveness isassessed at inception and quarterly during the hedge relationship to ensure that an economic relationship exists. As the Group only enters in hedgerelationships where the critical terms match, the assessment of effectiveness is done on a qualitative basis.
For qualifying foreign exchange forwards and foreign exchange options, the change in fair value that reflects the change in spot exchange rates on adiscounted basis is recognized in hedging reserve in other comprehensive income. The changes in the forward element of the foreign exchange forwardsand the time value of the options that relate to hedged items are deferred in the cost of hedging reserve in other comprehensive income and aresubsequently accounted for in the same way as the spot element or intrinsic value.
In each quarter, the Group evaluates whether the forecast sales and purchases are still expected to occur. If a portion of the hedged cash flow is no longerexpected to occur, all related deferred gains or losses are derecognized from other comprehensive income and recognized in other operating income andexpenses in the consolidated income statement as hedge accounting criteria is no longer met. If the hedged cash flow ceases to be highly probable, but isstill expected to occur, accumulated gains and losses remain in other comprehensive income until the hedged cash flow affects profit or loss.
The Group’s risk management objective is to hedge forecast cash flows until the related revenue has been recognized. Each hedge relationship is discontinued during the quarter when the hedge matures, which is also the quarter that it has been designated to hedge. At this point, the accumulated profit or loss of cash flow hedges is recycled to other operating income and expenses in the consolidated income statement. In case the forecast amount of revenue is not recognized during a quarter, the full accumulated profit or loss of cash flow hedges designated for said quarter is still recycled and the portion related to forecast revenue that was not recognized is disclosed as hedge ineffectiveness.
As cash flow hedges primarily mature in the same quarter as the hedged item, there is no significant ineffectiveness resulting from time value of money.The Group will validate the magnitude of the impact of discounting related to the amount of profit or loss recognized in other comprehensive income on aquarterly basis.
The Group has also entered into foreign exchange forwards in relation to forecast sales and purchases that do not qualify as highly probable forecasttransactions and hence do not satisfy the requirements for hedge accounting. For these foreign exchange forwards, the gains and losses are recognized inother operating income and expenses in the consolidated income statement.
Cash flow hedges: hedging of future interest cash flowsThe Group also applies cash flow hedging to future interest cash flows in foreign currency related to issued bonds. These future interest cash flows arehedged with cross-currency swaps that have been designated partly as fair value hedges and partly as cash flow hedges with the risk related to the risk-free portion of interest cash flows being hedged under fair value hedge accounting and the company-specific credit spread portion being hedged undercash flow hedge accounting. The accumulated profit or loss for the part of these cross-currency swaps designated as cash flow hedges is initially recordedin hedging reserve and recycled to profit or loss at the time when the related interest cash flows are settled. The Group separates the foreign currencybasis spread from cross-currency swaps and excludes it from the hedge relationship as cost of hedging that is initially recognized and subsequentlymeasured at fair value and recorded in cost of hedging reserve in other comprehensive income.
Fair value hedges: hedging of foreign exchange exposureIn certain cases, mainly related to long-term construction projects, the Group applies fair value hedge accounting for foreign exchange risk with theobjective to reduce the exposure to fluctuations in the fair value of firm commitments due to changes in foreign exchange rates. Changes in the fair valueof both spot and forward elements of the derivatives designated and qualifying as fair value hedges, together with any changes in the fair value of thehedged firm commitments attributable to the hedged risk, are recorded in financial income and expenses in the consolidated income statement.
Fair value hedges: hedging of interest rate exposureThe Group applies fair value hedge accounting to reduce exposure to fair value fluctuations of interest-bearing liabilities due to changes in interest ratesand foreign exchange rates. The Group uses interest rate swaps and cross-currency swaps aligned with the hedged items to hedge interest rate risk andassociated foreign exchange risk.
The Group has entered into long-term borrowings mainly at fixed rate and swapped a portion of them into floating rates in line with a defined target interestprofile. The Group aims to mitigate the adverse impacts from interest rate fluctuations by continuously managing net interest exposure resulting fromfinancial assets and liabilities by setting appropriate risk management benchmarks and risk limits. The hedged item is identified as a proportion of theoutstanding loans up to the notional amount of the swaps as appropriate to achieve the risk management objective. The Group enters into interest rateswaps that have similar critical terms as the hedged item, such as reference rate, reset dates, payment dates, maturities and notional amount and hencethe Group expects that there will be no significant ineffectiveness. The Group has not entered into interest rate swaps where it would be paying fixed rate.
The Group’s borrowings are carried at amortized cost. Changes in the fair value of derivatives designated and qualifying as fair value hedges, togetherwith any changes in the fair value of hedged liabilities attributable to the hedged risk, are recorded in financial income and expenses in the consolidatedincome statement. The Group separates the foreign currency basis spread from cross-currency swaps and excludes it from the hedged risk as cost ofhedging that is initially recognized and subsequently measured at fair value and recorded in cost of hedging reserve in other comprehensive income. If ahedge relationship no longer meets the criteria for hedge accounting, hedge accounting ceases, cost of hedging recorded in cost of hedging reserve isimmediately expensed and any fair value adjustments made to the carrying amount of the hedged item while the hedge was effective are recognized infinancial income and expenses in the consolidated income statement based on the effective interest method.

Table of Contents
133
Hedges of net investments in foreign operationsThe Group applies hedge accounting for its foreign currency hedging of selected net investments. Hedged item can be an amount of net assets equal to orless than the carrying amount of the net assets of the foreign operation in the Group consolidated financial statements. The risk management strategy is toprotect the euro counter value of the portion of this exposure expected to materialize as non-euro cash repatriation in the foreseeable future.
The Group only designates the spot element of the foreign exchange forward contract as the hedging instrument. Currency options, or option strategies,may also be used for net investment hedging, in which case the intrinsic value of the option is designated as the hedging instrument. Hedge effectivenessis assessed at inception and quarterly during the hedge relationship to ensure that an economic relationship exists. As the Group only enters in hedgerelationships where the critical terms match, the assessment of effectiveness is done on a qualitative basis with no significant ineffectiveness expected.
For qualifying foreign exchange forwards, foreign exchange options and option strategies, the change in fair value that reflects the change in spotexchange rates is recognized in translation differences within consolidated shareholders’ equity. The changes in the forward element of foreign exchangeforwards as well as the changes in the time value of options (collectively known as the “cost of hedging”) is recognized in cost of hedging reserve in othercomprehensive income. The cost of hedging at the date of designation of the foreign exchange forward or option contract as a hedging instrument isamortized to financial income and expenses in the consolidated income statement over the duration of the contract. Hence, in each reporting period, thechange in fair value of forward element of the foreign exchange forward contract or the time value of the option contract is recorded in cost of hedgingreserve, while the amortization amount is reclassified from cost of hedging reserve to profit or loss.
Accumulated changes in fair value from qualifying hedges are derecognized from translation differences within consolidated shareholders’ equity on thedisposal of all or part of a foreign subsidiary by sale, liquidation, repayment of share capital or abandonment. The cumulative amount or proportionateshare of changes in the fair value of qualifying hedges deferred in translation differences is recognized as income or expense on disposal.
ProvisionsProvisions are recognized when the Group has a present legal or constructive obligation as a result of past events, it is probable that an outflow ofresources will be required to settle the obligation and a reliable estimate of the amount can be made. When the Group expects a provision to bereimbursed, the reimbursement is recognized as an asset only when the reimbursement is virtually certain. The Group assesses the adequacy of itsexisting provisions and adjusts the amounts as necessary based on actual experience and changes in facts and circumstances as of each reporting date.For descriptions of different classes of provisions, refer to Note 29, Provisions.
Contingent liabilitiesThe Group discloses ongoing legal matters that relate to possible obligations whose existence will be confirmed by the occurrence or non-occurrence ofone or more uncertain future events not wholly within the control of the Group. These matters are assessed continually to determine whether an outflow ofresources embodying economic benefits has become probable so as to recognize a provision.
Treasury sharesThe Group recognizes its own equity instruments that are acquired (treasury shares) as a reduction of equity at cost of acquisition. When cancelled orreissued, the acquisition cost of treasury shares is recognized in retained earnings or other distributable reserves of the equity.
DividendsUntil 2018, dividends proposed by the Board of Directors were recognized in the consolidated financial statements when they were approved by theshareholders at the Annual General Meeting. From 2019 onwards, and applicable for the first time for distribution of funds for 2018, dividends and capitalrepayments are recognized in the consolidated financial statements when the Board of Directors has approved the quarterly payment in accordance withthe authorization granted by Annual General Meeting.
3. New and amended standards and interpretationsOn January 1, 2020, the Group adopted the following amendments to the accounting standards issued by the IASB and endorsed by the EU with nomaterial impact on the Group’s consolidated financial statements:
◾Amendments to IFRS 3, Definition of a Business;
◾Amendments to IFRS 7, IFRS 9 and IAS 39, Interest Rate Benchmark Reform;
◾Amendments to IAS 1 and IAS 8, Definition of Material; and
◾Amendments to References to the Conceptual Framework in IFRS Standards.
The Group has not early adopted any new and amended standards and interpretations that have been issued but are not yet effective. The new andamended standards and interpretations issued by the IASB that are effective in future periods are not expected to have a material impact on theconsolidated financial statements of the Group when adopted. The Group intends to adopt these new and amended standards and interpretations, ifapplicable, when they become effective and are endorsed by the EU.
Table of Contents
134
4. Use of estimates and critical accounting judgmentsThe preparation of financial statements requires use of management judgment in electing and applying accounting policies as well as making estimatesand assumptions about the future. These judgments, estimates and assumptions may have a significant effect on the amounts recognized in the financialstatements.
The estimates and assumptions used in determining the carrying amounts of assets and liabilities are based on historical experience, expected outcomesand various other factors that were available when these consolidated financial statements were prepared, and they are believed to be reasonable underthe circumstances. The estimates and assumptions are reviewed continually and revised if changes in circumstances occur, or as a result of newinformation or more experience. As estimates and assumptions inherently contain a varying degree of uncertainty, actual outcomes may differ resulting inadjustments to the carrying amounts of assets and liabilities in the subsequent periods.
The accounting matters presented in this note are determined to involve the most difficult, subjective or complex judgments, or are considered as keysources of estimation uncertainty.
COVID-19In 2020, the global economy and financial markets have been severely affected by the COVID-19 pandemic. While the direct impact of COVID-19 on theGroup’s financial performance and financial position has been primarily related to temporary factory closures in the first half of the year, the uncertaintyrelated to the duration of the pandemic and the pace and shape of the economic recovery that follows has made it even more challenging to makeestimates and assumptions about the future, increasing the risks that the actual results will differ significantly from those estimated. As always, theestimates and assumptions used in determining the carrying amounts of assets and liabilities as of the reporting date reflect the best and latest informationavailable at the time and are considered reasonable under the circumstances.
Due to the high market volatility experienced particularly in the first half of the year as a result of the impact of COVID-19, the Group has throughout theyear closely monitored the valuation of those assets where the measurement is to a large extent based on unobservable inputs, such as venture fundinvestments and certain pension assets, and has concluded the valuation of these assets as of December 31, 2020, is appropriate.
In addition, the Group considered the impact of COVID-19 in its annual goodwill impairment test and the assessment of recoverability of its deferred taxassets, and while it recorded an impairment loss on goodwill related to Fixed Networks operating segment and derecognized its deferred tax assetsrelated to Finland, the reasons for both of these events were considered unrelated to the current COVID-19 situation. For more information on deferred taxassets and goodwill impairment test, refer to Note 12, Income taxes, and Note 17, Impairment, respectively.
Revenue recognitionCritical accounting judgmentAccounting for contract modifications A significant part of the Group’s business is conducted under framework agreements with no fixed commitment on the overall project scope. Theaccounting treatment of subsequent purchase commitments received from the customer in the form of new purchase orders is a critical judgment.Subsequent purchase orders may be deemed either to represent separate contracts or to represent a modification of the existing contract, which requirescombination with the original contract for accounting purposes.
The decision whether to segregate or combine subsequent purchase orders can have a direct impact on the amount of revenue recognized in a givenperiod for arrangements with multiple performance obligations including material rights as the transaction price is allocated to the performance obligationsidentified within the contract.
Determining and allocating the transaction priceThe Group enters into complex customer arrangements, some of which are non-committed framework agreements that contain complex discountingstructures as well as customer pricing that varies depending on the different needs of each customer. The appropriate identification and allocation ofdiscounts and other forms of variable consideration as well as determination of the standalone selling price of each performance obligation are criticaljudgments that have a direct impact on the timing and amount of revenue recognized. The determination of standalone selling prices of existingperformance obligations and of unexercised customer options to purchase additional goods or services will also impact the Group’s determination whethera non-committed part of the contract contains material rights that must be accounted for within the context of the contract. Identified material rights areaccounted for as a performance obligation within the contract and the Group will allocate part of the transaction price to it with the relative standaloneselling price method.
Identifying distinct performance obligations and determining when the performance obligation is satisfiedThe Group regularly enters into agreements with customers comprising multiple performance obligations, which include a variety of products, services andsoftware that the Group offers. The identification of distinct performance obligations within these types of arrangements is considered a critical judgment asinappropriate identification of performance obligations could lead to the recognition of revenue in an incorrect period or for an inaccurate amount.
Pension and other post-employment benefit obligations and expensesKey source of estimation uncertaintyThe determination of pension and other post-employment benefit obligations and expenses for defined benefit plans is dependent on a number ofestimates and assumptions, including the discount rate, future mortality rate, annual rate of increase in future compensation levels, and healthcare coststrend rates and usage of services in the United States where the majority of our post-employment healthcare plans are maintained. Changes inassumptions and actuarial estimates may materially affect the benefit obligation, future expense and future cash flow. Based on these estimates andassumptions, as of December 31, 2020, defined benefit obligations amount to EUR 23 501 million (EUR 24 780 million in 2019) and the fair value of planassets amounts to EUR 25 688 million (EUR 26 297 million in 2019).
Table of Contents
135
Critical accounting judgmentWhere a surplus on a defined benefit scheme arises, the Group analyzes the recoverability of the surplus through either a refund or through reduction of future contributions in determining whether it is necessary to restrict the amount of the surplus that is recognized. The Group has two plans in the US, one plan in the UK and one in Belgium with material surplus positions with a combined surplus of EUR 6 147 million as of December 31, 2020 (EUR 5 794 million in 2019). The Group has made the judgment that limits to recoverability at the reporting date apply to one of the plans in the US and all other surpluses meet the requirements of recoverability. For the US plan where recoverability has been determined to be limited, the resulting asset ceiling limitation is recorded at EUR 1 125 million as of December 31, 2020 (EUR 975 million in 2019).
Refer to Note 27, Pensions and other post-employment benefits.
Income taxesCritical accounting judgmentThe Group uses judgment in determining the extent to which deferred tax assets can be recognized. The recognition of deferred tax assets is based on theassessment of whether it is probable that sufficient taxable profit will be available in the future to utilize the deductible temporary differences, unused taxlosses and unused tax credits before the unused tax losses and unused tax credits expire. This assessment requires estimates of the future financialperformance of a particular legal entity or a tax group that has recognized the deferred tax asset.
A significant portion of the Group's recognized deferred tax assets relate to unused tax losses, tax credits and deductible temporary differences in theUnited States which amounted of EUR 753 million as of December 31, 2020 (EUR 1 076 million in 2019). In addition, as of December 31, 2020, the Grouphas EUR 33 620 million (EUR 20 426 million in 2019) of temporary differences, tax losses carry forward and tax credits for which no deferred tax assetsare recognized due to uncertainty of utilization. The majority of these unrecognized deferred tax assets relate to France and Finland.
Refer to Note 12, Income taxes, for further details on income taxes.
LeasesCritical accounting judgmentThe Group uses judgment when it evaluates the lease term. Many of the Group’s more significant leasehold properties include options to extend the leaseterm or to terminate the lease prior to the expiration of the lease. These options provide the Group with the financial flexibility needed to align its globalportfolio of commercial and industrial real estate properties to meet the changing occupancy needs of its various businesses. This financial flexibility isreflected in the measurement of the right-of-use assets and lease liabilities that the Group records for its leasehold properties to the extent thatmanagement concludes that any lease extension options are not reasonably certain to be exercised.
In its assessment whether lease extension and termination options are reasonably certain to be exercised, management applies judgment, considering allrelevant factors that create an economic incentive for the Group to exercise either option. The Group determines that extension of the lease term beyondthe non-cancellable lease term is reasonably certain when the leased property is significantly customized or specialized for the Group’s specific use, theGroup has made significant leasehold improvements that it seeks to recover over the lease term, or lease payments in the optional renewal or breakperiod are significantly lower than the expected future market rent levels. After the commencement date of the lease, the Group reassesses the lease termonly if there is a significant event or change in circumstances that is within its control and affects its ability to exercise or not to exercise the option. As ofDecember 31, 2020, the Group has potential (undiscounted) future lease payments of EUR 468 million (EUR 560 million in 2019) relating to extensionoptions not expected to be exercised and EUR 51 million (EUR 79 million in 2019) relating to termination options expected to be exercised that are notincluded in the lease liability.
Refer to Note 16, Leases, for further details on leases.
Goodwill recoverabilityKey source of estimation uncertaintyThe recoverable amounts of the groups of CGUs are based on fair value less costs of disposal that is determined using a level 3 fair value measurementbased on a discounted cash flow calculation. The cash flow projections used in calculating the recoverable amounts are based on financial plans approvedby management covering an explicit forecast period of three years. Seven additional years of cash flow projections subsequent to the explicit forecastperiod reflect a gradual progression towards the steady state cash flow projections modeled in the terminal year. Estimation and judgment are required indetermining the components of the recoverable amount calculation, including among others the discount rates, the terminal growth rates and the operatingprofits in the terminal year. The discount rates reflect current assessments of the time value of money and relevant market risk premiums reflecting risksand uncertainties for which the future cash flow estimates have not been adjusted. The terminal growth rate assumptions reflect long-term average growthrates for the industry and economies in which the groups of CGUs operate.
In 2020, the Group has considered the effects of the ongoing COVID-19 pandemic when estimating future cash flows, revenue growth rates, grossmargins and operating margins and these considerations have been reflected in the goodwill impairment test performed. The Group conducted thegoodwill impairment test based on a long-range plan prepared in the fourth quarter of 2020 and concluded that the carrying amount exceeded therecoverable amount for its Fixed Networks group of CGUs. As a result, the Group recorded a non-cash impairment charge of EUR 200 million to reducethe goodwill within its Fixed Networks operating segment.
Taken in isolation, either of the following changes would cause a further material goodwill impairment in the Fixed Networks operating segment:
◾increase in discount rate from 7.4% to 8.4%◾reduction in the operating profit in the terminal year by EUR 25 million
A reasonably possible change in the key assumptions used in the valuation of all other groups of CGUs would not lead to an impairment.
Refer to Note 14, Intangible assets and Note 17, Impairment.

Table of Contents
136
Fair value of level 3 financial assetsKey source of estimation uncertaintyFair values for level 3 financial assets are determined with valuation techniques using material inputs that are not observable from transactions on activemarket requiring estimation and judgment both in selecting an appropriate valuation technique as well as in defining appropriate underlying assumptions.
For unlisted venture funds and unlisted shares, the fair value is based on a number of factors including, but not limited to, the current market value ofsimilar instruments; prices established from recent arm’s-length transactions; and/or analysis of market prospects and operating performance of targetcompanies with reference to public market comparable companies in similar industry sectors. Changes in these estimates could result in losses in futureperiods. Based on these estimates and assumptions, the fair value of level 3 financial assets is EUR 727 million (EUR 746 million in 2019), representing7% of total financial assets measured at fair value on a recurring basis (9% in 2019).
Refer to Note 24, Fair value of financial instruments.
Provisions and legal contingenciesKey source of estimation uncertaintyEstimation is required in determining the value of the obligation. The amount recognized as a provision is based on the best estimate of unavoidable costsrequired to settle the obligation at the end of the reporting period. When estimating the value, management may be required to consider a range ofpossible outcomes and their associated probabilities, risks and uncertainties surrounding the events and circumstances as well as making assumptions ofthe timing of payment. Changes in estimates of timing or amounts of costs required to settle the obligation may become necessary as time passes and/ormore accurate information becomes available. While the use of estimates and assumptions by management as a whole may lead to material adjustmentsto the aggregate balance of provisions, no individual provision estimate on its own is expected to require a material adjustment to the overall carryingamount. Based on these estimates and assumptions, provisions amount to EUR 1 532 million as of December 31, 2020 (EUR 1 209 million in 2019).
Critical accounting judgmentThe Group recognizes a provision when it has a present legal or constructive obligation as a result of a past event, it is probable that an outflow ofresources will be required to settle the obligation and a reliable estimate of the amount can be made. At times, management judgment is required indetermining whether it is probable that an outflow of economic benefits will be required to settle the obligation. The Group is regularly subject to variouslegal proceedings and investigations covering a wide range of matters. Management judgment is required in assessing the probability of differentoutcomes and a provision is recognized when an unfavorable outcome is deemed probable and the related obligation can be reasonably estimated.
Refer to Note 29, Provisions and Note 30, Commitments, contingencies and legal proceedings.
5. Segment informationThe Group has three reportable segments for financial reporting purposes: (1) Networks, (2) Nokia Software and (3) Nokia Technologies. Segment-levelinformation for Group Common and Other is also presented.
Networks reportable segment consists of four aggregated operating segments: (1) Mobile Networks, (2) Global Services, (3) Fixed Networks and (4)IP/Optical Networks. The aggregated operating segments have similar economic characteristics, such as long-term margins; have similar products,production processes, distribution methods and customers; and operate in a similar regulatory environment.
In addition, the Group provides net sales disclosure for the following businesses within the Networks reportable segment: (i) Mobile Access (comprisesMobile Networks and Global Services operating segments), (ii) Fixed Access (comprises Fixed Networks operating segment), (iii) IP Routing (comprisespart of IP/Optical Networks operating segment) and (iv) Optical Networks (comprises part of IP/Optical Networks operating segment).
The President and CEO is the chief operating decision-maker and monitors the operating results of operating and reportable segments for the purpose ofassessing performance and making decisions about resource allocation. Key financial performance measures of the segments include primarily net salesand segment operating profit. The evaluation of segment performance and allocation of resources is based on segment operating profit(1).
Accounting policies of the segments are the same as those described in Note 2, Significant accounting policies. Inter-segment revenues and transfers areaccounted for as if the revenues were to third parties, that is, at current market prices. Certain costs and revenue adjustments are not allocated to thesegments(1).
Segment descriptionsNetworksNetworks comprises Mobile Networks, Global Services, Fixed Networks and IP/Optical Networks operating segments.
The Mobile Networks operating segment focuses on mobile radio including macro radio, small cells and cloud-native radio solutions for communicationservice providers and enterprises.
The Global Services operating segment provides a wide range of professional services with multi-vendor capabilities, covering network planning andoptimization, network implementation, systems integration as well as company-wide managed services.
The Fixed Networks operating segment provides copper and fiber access products, solutions and services. The portfolio allows for a customizedcombination of technologies that brings fiber to the most economical point for the customer.
The IP/Optical Networks operating segment provides IP routing and optical transport systems, each with its own software and services to build high-capacity network infrastructure for the internet and global connectivity.

Table of Contents
137
Nokia SoftwareThe Nokia Software operating segment offers the cloud core software portfolio in addition to software applications spanning customer experiencemanagement, network operations and management, communications and collaboration, policy and charging, as well as cloud, IoT, security, and analyticsplatforms that enable digital services providers and enterprises to accelerate innovation, monetize services, and optimize their customer experience.
Nokia TechnologiesThe Nokia Technologies operating segment, building on decades of innovation and R&D leadership in technologies used in virtually all mobile devicesused today, is expanding Nokia patent licensing business, reintroducing the Nokia brand to smartphones through brand licensing, and establishing atechnology licensing business. The majority of net sales and related costs and expenses attributable to licensing and patenting the patent portfolio isrecorded in Nokia Technologies, while each reportable segment separately records its own research and development expenses.
Group Common and OtherGroup Common and Other includes Alcatel-Lucent Submarine Networks and Radio Frequency Systems, both of which are managed as separate entities.In addition, Group Common and Other includes Nokia Bell Labs’ operating expenses, as well as certain corporate-level and centrally managed operatingexpenses.
(1) Segment results exclude costs related to the acquisition of Alcatel-Lucent and related integration, goodwill impairment charges, intangible asset amortization and other purchase price fair value
adjustments, restructuring and associated charges and certain other items.
Segment information
Nokia Nokia Group Common Segment UnallocatedEURm Networks (1) Software Technologies and Other Eliminations total items (2) Total
Continuing operations2020Net sales to external customers 16 847 2 656 1 388 963 – 21 854 (2) 21 852Net sales to other segments 5 – 14 19 (38) – – –Depreciation and amortization (557) (81) (32) (55) – (725) (407) (1 132)Goodwill impairment – – – – – – (200) (200)Operating profit/(loss) 935 507 1 164 (525) – 2 081 (1 196) 885Share of results of associated companies and joint ventures 25 – 1 (4) – 22 – 222019 Net sales to external customers 18 207 2 767 1 473 897 – 23 344 (29) 23 315Net sales to other segments 2 – 14 55 (71) – – –Depreciation and amortization (566) (85) (31) (54) – (736) (924) (1 660)Operating profit/(loss) 665 589 1 239 (490) – 2 003 (1 518) 485Share of results of associated companies and joint ventures 12 – – – – 12 – 122018 Net sales to external customers 17 403 2 713 1 486 978 – 22 580 (17) 22 563Net sales to other segments 1 – 15 47 (63) – – –Depreciation and amortization (383) (65) (21) (46) – (515) (940) (1 455)Operating profit/(loss) 773 450 1 203 (246) – 2 180 (2 239) (59)Share of results of associated companies and joint ventures 12 – – – – 12 – 12
(1) Includes Mobile Access net sales of EUR 10 630 million (EUR 11 655 million in 2019 and EUR 11 273 million in 2018), Fixed Access net sales of EUR 1 759 million (EUR 1 881 million in 2019 and EUR1 980 million in 2018), IP Routing net sales of EUR 2 768 million (EUR 2 921 million in 2019 and EUR 2 545 million in 2018) and Optical Networks net sales of EUR 1 695 million (EUR 1 752 million in2019 and EUR 1 606 million in 2018).
(2) Comprises costs related to the acquisition of Alcatel-Lucent and related integration, goodwill impairment charges, intangible asset amortization and other purchase price fair value adjustments,restructuring and associated charges and certain other items.
Reconciliation of total segment operating profit to total operating profit/(loss)
EURm 2020 2019 2018
Total segment operating profit 2 081 2 003 2 180Restructuring and associated charges (651) (502) (321)Amortization and depreciation of acquired intangible assets and property, plant and equipment (407) (924) (940)Impairment of assets, net of impairment reversals (241) (29) (48)Gain on defined benefit plan amendment 90 168 –Transaction and related costs, including integration costs 11 (48) (220)Release of acquisition-related fair value adjustments to deferred revenue and inventory (2) (6) (16)Divestment of businesses (2) (2) (39)Product portfolio strategy costs – (163) (583)Operating model integration – (12) –Fair value changes of legacy IPR fund – – (57)Other 6 – (15)Total operating profit/(loss) 885 485 (59)

Table of Contents
138
Information by geographiesNet sales to external customers and non-current assets by country
Net sales(1) Non-current assets(2)
EURm 2020 2019 2018 2020 2019
Finland(3) 1 480 1 552 1 556 1 382 1 477United States 6 751 6 609 6 204 4 843 5 505France 1 444 1 229 1 179 1 857 1 997India 944 1 348 1 629 170 178China 906 1 506 1 754 346 400Other 10 327 11 071 10 241 1 017 1 167Total 21 852 23 315 22 563 9 615 10 724
(1) Net sales to external customers by country are based on the location of the customer.(2) Consists of goodwill and other intangible assets, property, plant and equipment and right-of-use assets.(3) All Nokia Technologies IPR and licensing net sales are allocated to Finland.
No single customer represents 10% or more of revenues.
6. Discontinued operationsDiscontinued operations include the continuing financial effects of the HERE business and the D&S business. The Group sold its HERE digital mappingand location services business to a German automotive industry consortium comprised of AUDI AG, BMW Group and Daimler AG in a transaction thatwas completed on December 4, 2015. The Group sold substantially all of its Devices & Services business to Microsoft in a transaction that was completedon April 25, 2014. The timing and amount of financial effects are largely dependent upon external factors such as final outcomes of uncertain tax positions.
Results of discontinued operations
EURm 2020 2019 2018
Net sales – – –Cost of sales – – –Gross profit – – –Research and development expenses – – –Selling, general and administrative expenses (2) (6) (9)Other operating income and expenses 2 (1) 17Operating profit/(loss) – (7) 8Financial income and expenses (4) (5) 81(Loss)/profit before tax (4) (12) 89Income tax benefit/(expense) 1 (1) 125(Loss)/profit for the year, ordinary activities(1) (3) (13) 214Gain on the sale, net of tax(2) – 6 –(Loss)/profit for the year (3) (7) 214
(1) In 2018, the results of discontinued operations mostly relate to a resolution reached in the tax dispute concerning the applicability of withholding tax in respect of payments by Nokia India Private Limitedto Nokia Corporation for the supply of operating software in D&S business as well as a release of uncertain tax positions related to HERE business.
(2) In 2019, an addition of EUR 7 million to and a deduction of EUR 1 million from gain on the sale were recognized related to D&S business and HERE business, respectively, due to tax indemnification.
Cash flows from discontinued operations
EURm 2020 2019 2018
Net cash from operating activities 6 (7) (33)Net cash from investing activities 7 9 10Net cash flow for the period 13 2 (23)
Table of Contents
139
7. Revenue recognitionManagement has determined that the Group’s geographic areas depict how the nature, amount, timing and uncertainty of revenue and cash flows areaffected by economic factors. The Group’s primary customer base consists of companies that operate on a country-specific or a regional basis. Althoughthe Group’s technology cycle is similar around the world, different countries and regions are inherently in a different stage of that cycle, often influenced bymacroeconomic conditions specific to those countries and regions.
Each reportable segment, as described in Note 5, Segment information, consists of customers that operate in all geographic areas. No reportable segmenthas a specific revenue concentration in any geographic area other than Nokia Technologies, which is included within Europe.
Net sales to external customers by region(1)
EURm 2020 2019 2018
Asia Pacific 3 847 4 556 4 081Europe 6 620 6 620 6 489Greater China 1 376 1 843 2 165Latin America 995 1 472 1 380Middle East & Africa 1 893 1 876 1 874North America 7 121 6 948 6 574Total 21 852 23 315 22 563
(1) Net sales to external customers by region are based on the location of the customer.
Contract assets and contract liabilitiesContract asset balances decrease upon reclassification to trade receivables when the Group’s right to payment becomes unconditional. Contract liabilitybalances decrease when the Group satisfies the related performance obligations and revenue is recognized. There were no material cumulativeadjustments to revenue recognized arising from changes in transaction prices, changes in measures of progress or changes in estimated variableconsideration.
During the year, the Group recognized EUR 2.1 billion (EUR 1.9 billion in 2019) of revenue that was included in the current contract liability balance at thebeginning of the period.
Order backlogAs of December 31, 2020, the aggregate amount of the transaction price allocated to partially or wholly unsatisfied performance obligations arising fromfixed contractual commitments amounted to EUR 16.6 billion (EUR 18.8 billion in 2019). Management has estimated that these unsatisfied performanceobligations will be recognized as revenue as follows:
2020 2019
Within 1 year 68% 69%2-3 years 31% 27%More than 3 years 1% 4%Total 100% 100%
The estimated timing of the satisfaction of these performance obligations is subject to change owing to factors beyond the Group’s control such ascustomer and network demand, market conditions and, in some cases, restrictions imposed by the weather or other factors impacting project logistics.Revenue recognized in the reporting period from performance obligations satisfied (or partially satisfied) in previous periods (for example, due to changesin transaction price) was not material.
Completed Contracts In April 2014, the Group entered into an agreement to license certain technology patents and patent applications owned by the Group on the effective dateof that agreement, on a non-exclusive basis, to a licensee, for a period of 10 years (the “License Agreement”). Contemporaneously and under the terms ofthe License Agreement, the Group issued to the licensee an option to extend the technology patent license for the remaining life of the licensed patents.The Group received all cash consideration due for the sale of the 10-year license and option upon closing of the License Agreement. Management hasdetermined that, upon transition to IFRS 15, Revenue from Contracts with Customers, the License Agreement is a completed contract. As such, inaccordance with the transition requirements of the standard, the Group continues to apply its prior revenue accounting policies, based on IAS 18,Revenue, and related interpretations, to the License Agreement. Under those policies, the Group is recognizing revenue over the term of the LicenseAgreement.
As of December 31, 2020, the balance of deferred revenue related to the License Agreement of EUR 515 million (EUR 670 million in 2019), recognized indeferred revenue in the consolidated statement of financial position, is expected to be recognized as revenue through 2024.
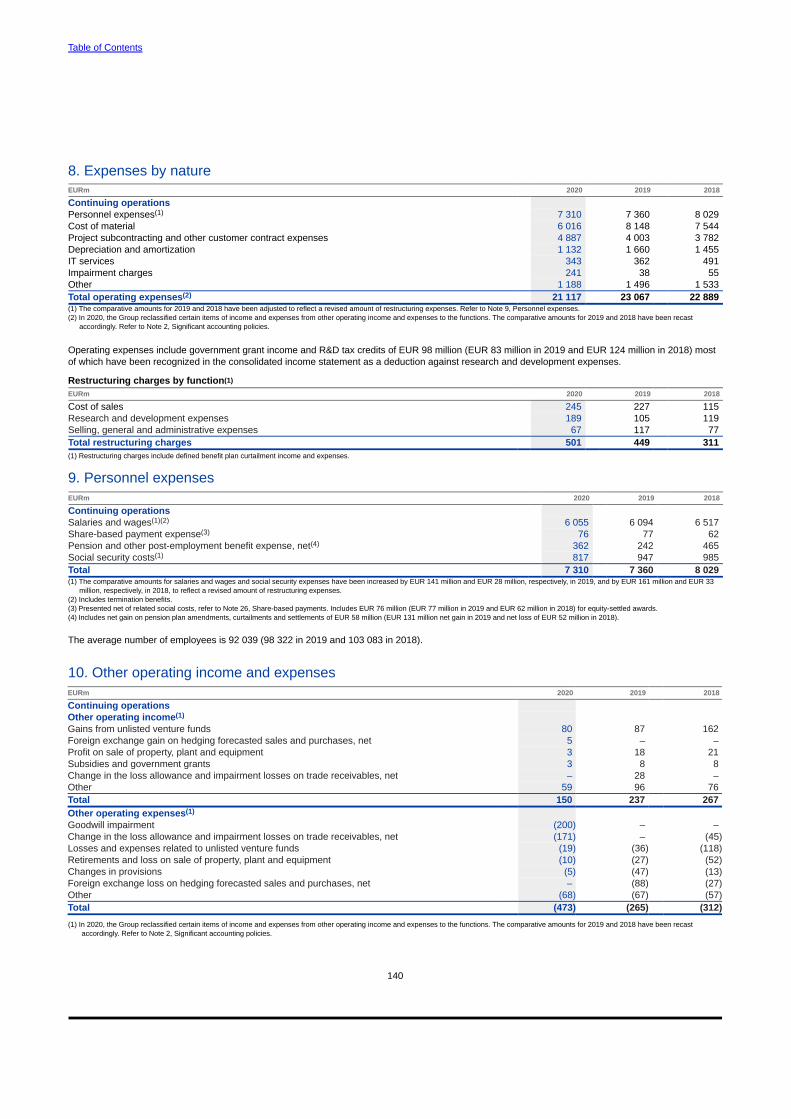
Table of Contents
140
8. Expenses by natureEURm 2020 2019 2018
Continuing operations Personnel expenses(1) 7 310 7 360 8 029Cost of material 6 016 8 148 7 544Project subcontracting and other customer contract expenses 4 887 4 003 3 782Depreciation and amortization 1 132 1 660 1 455IT services 343 362 491Impairment charges 241 38 55Other 1 188 1 496 1 533Total operating expenses(2) 21 117 23 067 22 889(1) The comparative amounts for 2019 and 2018 have been adjusted to reflect a revised amount of restructuring expenses. Refer to Note 9, Personnel expenses.(2) In 2020, the Group reclassified certain items of income and expenses from other operating income and expenses to the functions. The comparative amounts for 2019 and 2018 have been recast
accordingly. Refer to Note 2, Significant accounting policies.
Operating expenses include government grant income and R&D tax credits of EUR 98 million (EUR 83 million in 2019 and EUR 124 million in 2018) mostof which have been recognized in the consolidated income statement as a deduction against research and development expenses.
Restructuring charges by function(1)
EURm 2020 2019 2018
Cost of sales 245 227 115Research and development expenses 189 105 119Selling, general and administrative expenses 67 117 77Total restructuring charges 501 449 311(1) Restructuring charges include defined benefit plan curtailment income and expenses.
9. Personnel expensesEURm 2020 2019 2018
Continuing operationsSalaries and wages(1)(2) 6 055 6 094 6 517Share-based payment expense(3) 76 77 62Pension and other post-employment benefit expense, net(4) 362 242 465Social security costs(1) 817 947 985Total 7 310 7 360 8 029(1) The comparative amounts for salaries and wages and social security expenses have been increased by EUR 141 million and EUR 28 million, respectively, in 2019, and by EUR 161 million and EUR 33
million, respectively, in 2018, to reflect a revised amount of restructuring expenses.(2) Includes termination benefits.(3) Presented net of related social costs, refer to Note 26, Share-based payments. Includes EUR 76 million (EUR 77 million in 2019 and EUR 62 million in 2018) for equity-settled awards.(4) Includes net gain on pension plan amendments, curtailments and settlements of EUR 58 million (EUR 131 million net gain in 2019 and net loss of EUR 52 million in 2018).
The average number of employees is 92 039 (98 322 in 2019 and 103 083 in 2018).
10. Other operating income and expensesEURm 2020 2019 2018
Continuing operations Other operating income(1) Gains from unlisted venture funds 80 87 162Foreign exchange gain on hedging forecasted sales and purchases, net 5 – –Profit on sale of property, plant and equipment 3 18 21Subsidies and government grants 3 8 8Change in the loss allowance and impairment losses on trade receivables, net – 28 –Other 59 96 76Total 150 237 267Other operating expenses(1) Goodwill impairment (200) – –Change in the loss allowance and impairment losses on trade receivables, net (171) – (45)Losses and expenses related to unlisted venture funds (19) (36) (118)Retirements and loss on sale of property, plant and equipment (10) (27) (52)Changes in provisions (5) (47) (13)Foreign exchange loss on hedging forecasted sales and purchases, net – (88) (27)Other (68) (67) (57)Total (473) (265) (312)
(1) In 2020, the Group reclassified certain items of income and expenses from other operating income and expenses to the functions. The comparative amounts for 2019 and 2018 have been recastaccordingly. Refer to Note 2, Significant accounting policies.
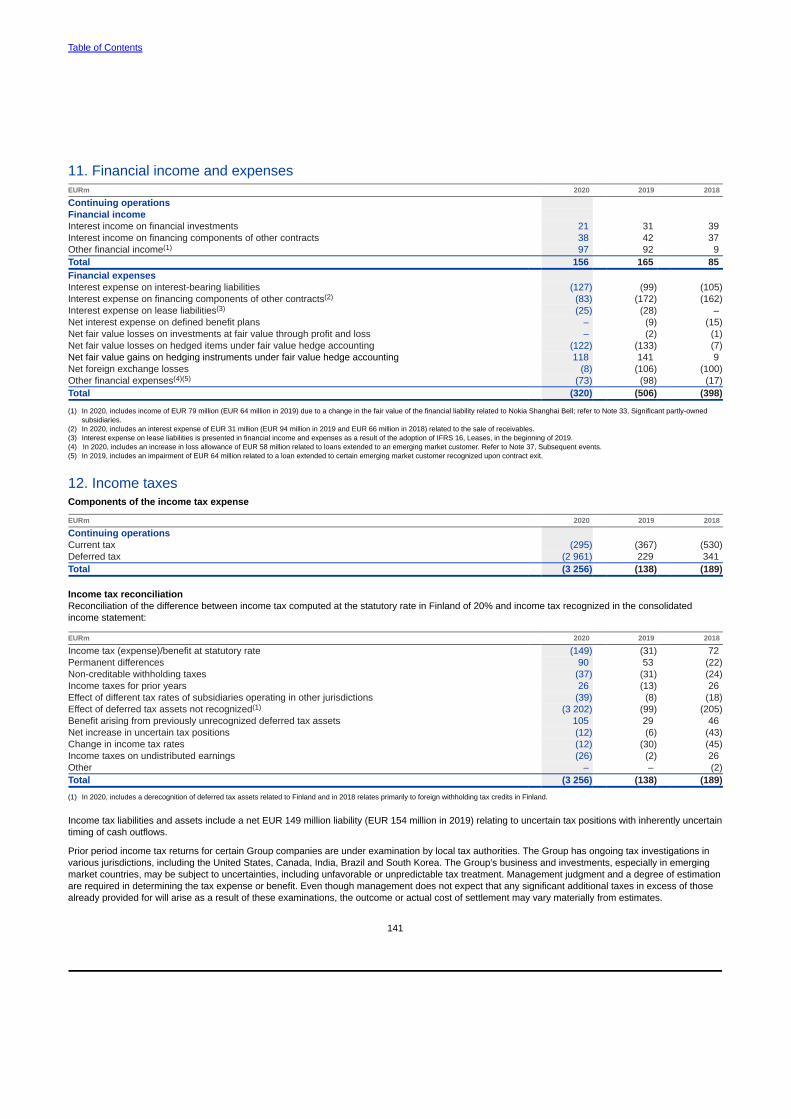
Table of Contents
141
11. Financial income and expensesEURm 2020 2019 2018
Continuing operations Financial incomeInterest income on financial investments 21 31 39Interest income on financing components of other contracts 38 42 37Other financial income(1) 97 92 9Total 156 165 85Financial expensesInterest expense on interest-bearing liabilities (127) (99) (105)Interest expense on financing components of other contracts(2) (83) (172) (162)Interest expense on lease liabilities(3) (25) (28) –Net interest expense on defined benefit plans – (9) (15)Net fair value losses on investments at fair value through profit and loss – (2) (1)Net fair value losses on hedged items under fair value hedge accounting (122) (133) (7)Net fair value gains on hedging instruments under fair value hedge accounting 118 141 9Net foreign exchange losses (8) (106) (100)Other financial expenses(4)(5) (73) (98) (17)Total (320) (506) (398)
(1) In 2020, includes income of EUR 79 million (EUR 64 million in 2019) due to a change in the fair value of the financial liability related to Nokia Shanghai Bell; refer to Note 33, Significant partly-ownedsubsidiaries.
(2) In 2020, includes an interest expense of EUR 31 million (EUR 94 million in 2019 and EUR 66 million in 2018) related to the sale of receivables. (3) Interest expense on lease liabilities is presented in financial income and expenses as a result of the adoption of IFRS 16, Leases, in the beginning of 2019.(4) In 2020, includes an increase in loss allowance of EUR 58 million related to loans extended to an emerging market customer. Refer to Note 37, Subsequent events.(5) In 2019, includes an impairment of EUR 64 million related to a loan extended to certain emerging market customer recognized upon contract exit.
12. Income taxesComponents of the income tax expense
EURm 2020 2019 2018
Continuing operations Current tax (295) (367) (530)Deferred tax (2 961) 229 341Total (3 256) (138) (189)
Income tax reconciliationReconciliation of the difference between income tax computed at the statutory rate in Finland of 20% and income tax recognized in the consolidatedincome statement:
EURm 2020 2019 2018
Income tax (expense)/benefit at statutory rate (149) (31) 72Permanent differences 90 53 (22)Non-creditable withholding taxes (37) (31) (24)Income taxes for prior years 26 (13) 26Effect of different tax rates of subsidiaries operating in other jurisdictions (39) (8) (18)Effect of deferred tax assets not recognized(1) (3 202) (99) (205)Benefit arising from previously unrecognized deferred tax assets 105 29 46Net increase in uncertain tax positions (12) (6) (43)Change in income tax rates (12) (30) (45)Income taxes on undistributed earnings (26) (2) 26Other – – (2)Total (3 256) (138) (189)
(1) In 2020, includes a derecognition of deferred tax assets related to Finland and in 2018 relates primarily to foreign withholding tax credits in Finland.
Income tax liabilities and assets include a net EUR 149 million liability (EUR 154 million in 2019) relating to uncertain tax positions with inherently uncertaintiming of cash outflows.
Prior period income tax returns for certain Group companies are under examination by local tax authorities. The Group has ongoing tax investigations invarious jurisdictions, including the United States, Canada, India, Brazil and South Korea. The Group’s business and investments, especially in emergingmarket countries, may be subject to uncertainties, including unfavorable or unpredictable tax treatment. Management judgment and a degree of estimationare required in determining the tax expense or benefit. Even though management does not expect that any significant additional taxes in excess of thosealready provided for will arise as a result of these examinations, the outcome or actual cost of settlement may vary materially from estimates.

Table of Contents
142
Deferred tax assets and liabilities
2020 2019
Deferred Deferred Deferred DeferredEURm tax assets tax liabilities Net balance tax assets tax liabilities Net balance
Tax losses carried forward and unused tax credits(1) 720 – 1 301 – Undistributed earnings – (104) – (83) Intangible assets and property, plant and equipment(1) 1 020 (291) 3 257 (279) Right-of-use assets – (197) 2 (221)Defined benefit pension assets 3 (1 233) 55 (1 150) Other non-current assets 27 (40) 62 (53) Inventories 120 (8) 216 (24) Other current assets 98 (46) 164 (32) Lease liabilities 164 (3) 220 –Defined benefit pension and other post-employment liabilities 1 045 (7) 1 006 (29) Other non-current liabilities – – 32 – Provisions 251 (86) 213 (51) Other current liabilities 200 (63) 182 (126) Other temporary differences 5 (13) 99 (27) Total before netting 3 653 (2 091) 1 562 6 809 (2 075) 4 734Netting of deferred tax assets and liabilities (1 831) 1 831 – (1 685) 1 685 –Total after netting 1 822 (260) 1 562 5 124 (390) 4 734
(1) The decrease in deferred tax assets in 2020 compared to 2019 is primarily related to derecognition of deferred tax assets in Finland.
Movements in the net deferred tax balance during the year:
EURm 2020 2019 2018
As of January 1 4 734 4 561 4 169Adoption of new IFRS standards(1) – (1) 19Recognized in income statement, continuing operations (2 961) 229 341Recognized in income statement, discontinued operations 1 – 29Recognized in other comprehensive income (115) (84) (57)Recognized in equity 2 (7) 6Acquisitions through business combinations and disposals 4 – –Translation differences (103) 36 54As of December 31 1 562 4 734 4 561
(1) In 2019, adoption of IFRS 16, Leases. In 2018, adoption of IFRS 9, Financial Instruments, and IFRS 15, Revenue from Contracts with Customers.
Amount of temporary differences, tax losses carried forward and tax credits for which no deferred tax asset was recognized due to uncertainty ofutilization:
EURm 2020 2019
Temporary differences 14 258 1 716Tax losses carried forward 19 021 18 609Tax credits 341 101Total 33 620 20 426
The Group continually evaluates the probability of utilizing its deferred tax assets and considers both favorable and unfavorable factors in its assessment.Deferred tax assets are recognized to the extent it is probable that future taxable profit will be available against which the unused tax losses, unused taxcredits and deductible temporary differences can be utilized in the relevant jurisdictions. A significant portion of the Group's recognized deferred tax assetsrelate to unused tax losses, tax credits and deductible temporary differences in the United States which amounted of EUR 753 million as of December 31,2020 (EUR 1 076 million in 2019). The Group has an established pattern of sufficient tax profitability to conclude that it is probable that the Group will beable to utilize the deferred tax assets in the United States.
At December 31, 2020, the Group has concluded based on its assessment that it is not probable that it will be able to utilize the unused tax losses, unusedtax credits and deductible temporary differences in Finland in the foreseeable future. This assessment was done primarily based on the historicalperformance. Consequently, the Group derecognized EUR 2 918 million deferred tax assets related to Finland. The recent years’ cumulative profitability inFinland, excluding certain integration costs related to the acquisition of Alcatel-Lucent, is changing from a cumulative profit position to a cumulative lossposition based on the assessment made at the end of 2020. When an entity has a history of recent losses in a certain jurisdiction, the entity recognizes adeferred tax asset arising from unused losses or tax credits only to the extent the entity has sufficient taxable temporary differences or there is convincingother evidence that sufficient tax profit will be available against which the unused tax losses or unused tax credits can be utilized in the future. Positiveevidence of future taxable profits may be assigned less weight in assessing the appropriateness of recording a deferred tax asset when there is otherunfavorable evidence such as cumulative losses, which are considered strong evidence that future taxable profits may not be available. The Groupcontinues to assess the realizability of deferred tax assets including in particular its actual profit record in upcoming periods and may re-recognize deferredtax assets related to Finland if pattern of tax profitability is re-established.
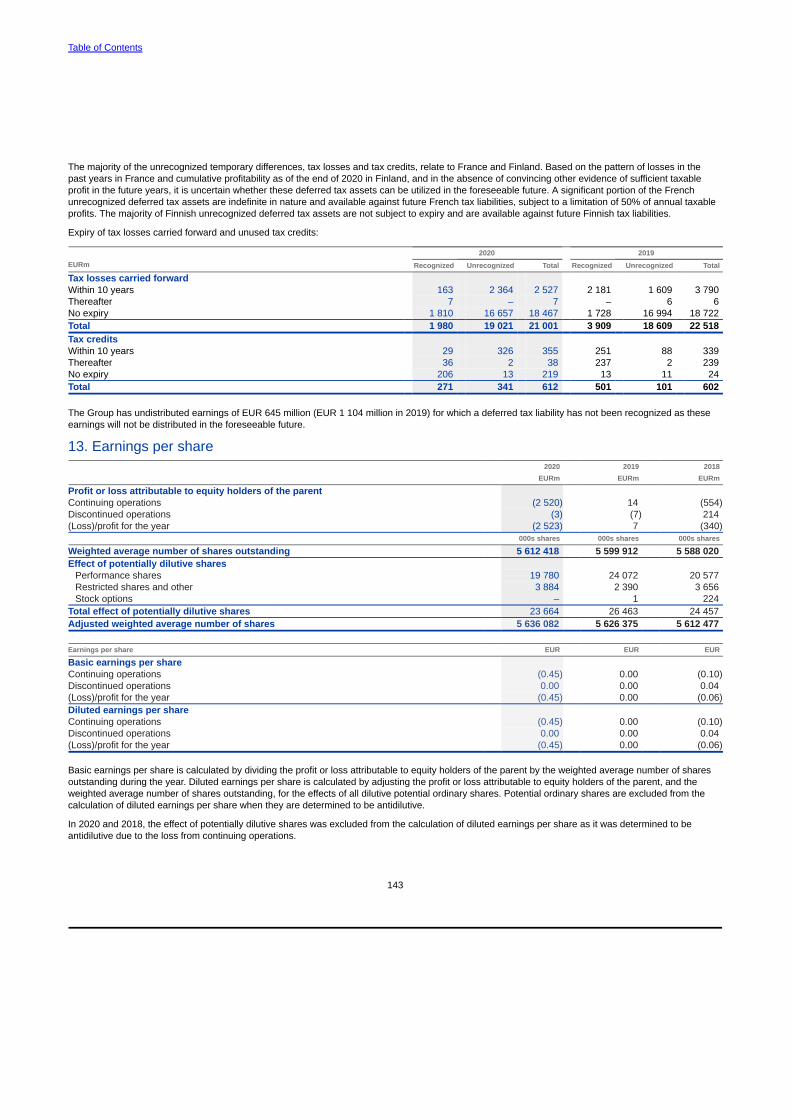
Table of Contents
143
The majority of the unrecognized temporary differences, tax losses and tax credits, relate to France and Finland. Based on the pattern of losses in thepast years in France and cumulative profitability as of the end of 2020 in Finland, and in the absence of convincing other evidence of sufficient taxableprofit in the future years, it is uncertain whether these deferred tax assets can be utilized in the foreseeable future. A significant portion of the Frenchunrecognized deferred tax assets are indefinite in nature and available against future French tax liabilities, subject to a limitation of 50% of annual taxableprofits. The majority of Finnish unrecognized deferred tax assets are not subject to expiry and are available against future Finnish tax liabilities.
Expiry of tax losses carried forward and unused tax credits:
2020 2019EURm Recognized Unrecognized Total Recognized Unrecognized Total
Tax losses carried forward Within 10 years 163 2 364 2 527 2 181 1 609 3 790Thereafter 7 – 7 – 6 6No expiry 1 810 16 657 18 467 1 728 16 994 18 722Total 1 980 19 021 21 001 3 909 18 609 22 518Tax credits Within 10 years 29 326 355 251 88 339Thereafter 36 2 38 237 2 239No expiry 206 13 219 13 11 24Total 271 341 612 501 101 602
The Group has undistributed earnings of EUR 645 million (EUR 1 104 million in 2019) for which a deferred tax liability has not been recognized as theseearnings will not be distributed in the foreseeable future.
13. Earnings per share 2020 2019 2018
EURm EURm EURm
Profit or loss attributable to equity holders of the parent Continuing operations (2 520) 14 (554)Discontinued operations (3) (7) 214(Loss)/profit for the year (2 523) 7 (340)
000s shares 000s shares 000s shares
Weighted average number of shares outstanding 5 612 418 5 599 912 5 588 020Effect of potentially dilutive shares
Performance shares 19 780 24 072 20 577Restricted shares and other 3 884 2 390 3 656Stock options – 1 224
Total effect of potentially dilutive shares 23 664 26 463 24 457Adjusted weighted average number of shares 5 636 082 5 626 375 5 612 477
Earnings per share EUR EUR EUR
Basic earnings per share Continuing operations (0.45) 0.00 (0.10)Discontinued operations 0.00 0.00 0.04(Loss)/profit for the year (0.45) 0.00 (0.06)Diluted earnings per share Continuing operations (0.45) 0.00 (0.10)Discontinued operations 0.00 0.00 0.04(Loss)/profit for the year (0.45) 0.00 (0.06)
Basic earnings per share is calculated by dividing the profit or loss attributable to equity holders of the parent by the weighted average number of sharesoutstanding during the year. Diluted earnings per share is calculated by adjusting the profit or loss attributable to equity holders of the parent, and theweighted average number of shares outstanding, for the effects of all dilutive potential ordinary shares. Potential ordinary shares are excluded from thecalculation of diluted earnings per share when they are determined to be antidilutive.
In 2020 and 2018, the effect of potentially dilutive shares was excluded from the calculation of diluted earnings per share as it was determined to beantidilutive due to the loss from continuing operations.

Table of Contents
144
14. Intangible assetsEURm Goodwill Other Total
Acquisition cost as of January 1, 2019 6 360 9 424 15 784Translation differences 75 82 157Additions – 52 52Disposals and retirements – (92) (92)Acquisition cost as of December 31, 2019 6 435 9 466 15 901Accumulated amortization and impairment charges as of January 1, 2019 (908) (6 071) (6 979)Translation differences – (41) (41)Impairment charges – (12) (12)Disposals and retirements – 71 71Amortization – (984) (984)Accumulated amortization and impairment charges as of December 31, 2019 (908) (7 037) (7 945)Net book value as of January 1, 2019 5 452 3 353 8 805Net book value as of December 31, 2019 5 527 2 429 7 956Acquisition cost as of January 1, 2020 6 435 9 466 15 901Translation differences (331) (359) (690)Additions – 39 39Acquisitions through business combinations(1) 78 72 150Disposals and retirements – (31) (31)Acquisition cost as of December 31, 2020 6 182 9 187 15 369Accumulated amortization and impairment charges as of January 1, 2020 (908) (7 037) (7 945)Translation differences – 256 256Impairment charges (200) (9) (209)Disposals and retirements – 28 28Amortization – (472) (472)Accumulated amortization and impairment charges as of December 31, 2020 (1 108) (7 234) (8 342)Net book value as of January 1, 2020 5 527 2 429 7 956Net book value as of December 31, 2020 5 074 1 953 7 027
(1) The Group acquired 100% ownership interest in Elenion Technologies. Goodwill was allocated to the IP/Optical Networks operating segment.
Net book value of other intangible assets by type of asset(1):
EURm 2020 2019
Customer relationships 1 401 1 788Patents and licenses 232 264Technologies and IPR&D 155 160Tradenames and trademarks 90 145Other 75 72Total 1 953 2 429
(1) The largest movements are due to amortization and translation differences, with the exception of Technologies and IPR&D, which increased due to acquired technology of EUR 72 million in 2020.
As of December 31, 2020, the weighted average for the remaining amortization periods is approximately five years for customer relationships, six years forpatents and licenses, three years for technologies and IPR&D, two years for tradenames and trademarks and one year for other.

Table of Contents
145
15. Property, plant and equipment Land, buildings and Machinery, equipment Assets under
EURm constructions and other construction Total
Acquisition cost as of January 1, 2019 1 219 2 863 91 4 173Translation differences 17 22 – 39Additions 63 339 143 545Reclassifications 28 62 (90) –Disposals and retirements (60) (268) (1) (329)Acquisition cost as of December 31, 2019 1 267 3 018 143 4 428Accumulated depreciation as of January 1, 2019 (386) (1 997) – (2 383)Translation differences (8) (16) – (24)Impairment charges – (4) – (4)Disposals and retirements 33 257 – 290Depreciation (90) (361) – (451)Accumulated depreciation as of December 31, 2019 (451) (2 121) – (2 572)Net book value as of January 1, 2019 833 866 91 1 790Net book value as of December 31, 2019 816 897 143 1 856Acquisition cost as of January 1, 2020 1 267 3 018 143 4 428Translation differences (63) (102) (4) (169)Additions 36 290 123 449Acquisitions through business combinations – 2 – 2Reclassifications 61 64 (125) –Disposals and retirements (36) (137) – (173)Acquisition cost as of December 31, 2020 1 265 3 135 137 4 537Accumulated depreciation as of January 1, 2020 (451) (2 121) – (2 572)Translation differences 33 72 – 105Disposals and retirements 22 128 – 150Depreciation (86) (351) – (437)Accumulated depreciation as of December 31, 2020 (482) (2 272) – (2 754)Net book value as of January 1, 2020 816 897 143 1 856Net book value as of December 31, 2020 783 863 137 1 783
16. LeasesRight-of-use assetsRight-of-use assets represent the Group’s right to use the underlying leased assets.
EURm Buildings Other Total
Acquisition cost as of January 1, 2019 898 77 975Net additions(1) 150 44 194Acquisition cost as of December 31, 2019 1 048 121 1 169Accumulated depreciation as of January 1, 2019 – – –Impairment charges (32) – (32)Depreciation (177) (48) (225)Accumulated depreciation as of December 31, 2019 (209) (48) (257)Net book value as of January 1, 2019 898 77 975Net book value as of December 31, 2019 839 73 912Acquisition cost as of January 1, 2020 1 048 121 1 169Net additions(1) 89 59 148Retirements (31) – (31)Acquisition cost as of December 31, 2020 1 106 180 1 286Accumulated depreciation as of January 1, 2020 (209) (48) (257)Impairment charges (32) – (32)Retirements 31 – 31Depreciation (176) (47) (223)Accumulated depreciation as of December 31, 2020 (386) (95) (481)Net book value as of January 1, 2020 839 73 912Net book value as of December 31, 2020 720 85 805(1) Net additions comprise new lease contracts as well as modifications and remeasurements of existing lease contracts.
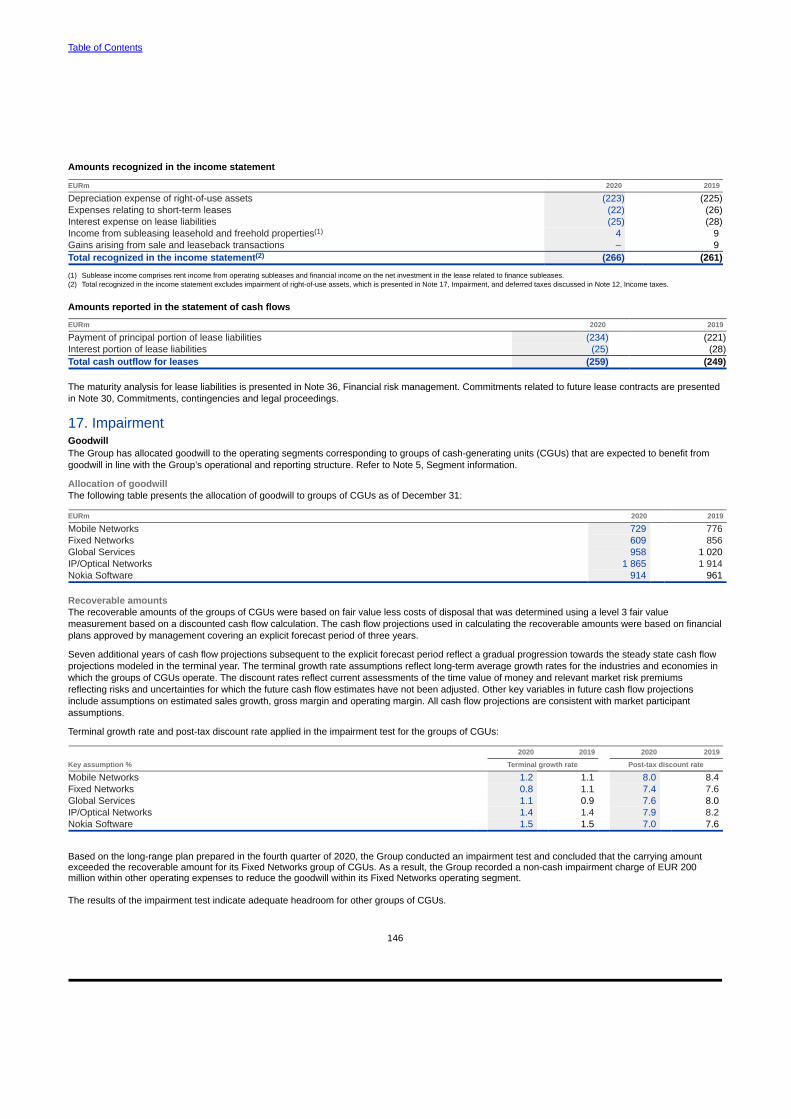
Table of Contents
146
Amounts recognized in the income statement
EURm 2020 2019
Depreciation expense of right-of-use assets (223) (225)Expenses relating to short-term leases (22) (26)Interest expense on lease liabilities (25) (28)Income from subleasing leasehold and freehold properties(1) 4 9Gains arising from sale and leaseback transactions – 9Total recognized in the income statement(2) (266) (261)
(1) Sublease income comprises rent income from operating subleases and financial income on the net investment in the lease related to finance subleases.(2) Total recognized in the income statement excludes impairment of right-of-use assets, which is presented in Note 17, Impairment, and deferred taxes discussed in Note 12, Income taxes.
Amounts reported in the statement of cash flows
EURm 2020 2019
Payment of principal portion of lease liabilities (234) (221)Interest portion of lease liabilities (25) (28)Total cash outflow for leases (259) (249)
The maturity analysis for lease liabilities is presented in Note 36, Financial risk management. Commitments related to future lease contracts are presentedin Note 30, Commitments, contingencies and legal proceedings.
17. ImpairmentGoodwillThe Group has allocated goodwill to the operating segments corresponding to groups of cash-generating units (CGUs) that are expected to benefit fromgoodwill in line with the Group’s operational and reporting structure. Refer to Note 5, Segment information.
Allocation of goodwillThe following table presents the allocation of goodwill to groups of CGUs as of December 31:
EURm 2020 2019
Mobile Networks 729 776Fixed Networks 609 856Global Services 958 1 020IP/Optical Networks 1 865 1 914Nokia Software 914 961
Recoverable amountsThe recoverable amounts of the groups of CGUs were based on fair value less costs of disposal that was determined using a level 3 fair valuemeasurement based on a discounted cash flow calculation. The cash flow projections used in calculating the recoverable amounts were based on financialplans approved by management covering an explicit forecast period of three years.
Seven additional years of cash flow projections subsequent to the explicit forecast period reflect a gradual progression towards the steady state cash flowprojections modeled in the terminal year. The terminal growth rate assumptions reflect long-term average growth rates for the industries and economies inwhich the groups of CGUs operate. The discount rates reflect current assessments of the time value of money and relevant market risk premiumsreflecting risks and uncertainties for which the future cash flow estimates have not been adjusted. Other key variables in future cash flow projectionsinclude assumptions on estimated sales growth, gross margin and operating margin. All cash flow projections are consistent with market participantassumptions.
Terminal growth rate and post-tax discount rate applied in the impairment test for the groups of CGUs:
2020 2019 2020 2019
Key assumption % Terminal growth rate Post-tax discount rate
Mobile Networks 1.2 1.1 8.0 8.4Fixed Networks 0.8 1.1 7.4 7.6Global Services 1.1 0.9 7.6 8.0IP/Optical Networks 1.4 1.4 7.9 8.2Nokia Software 1.5 1.5 7.0 7.6
Based on the long-range plan prepared in the fourth quarter of 2020, the Group conducted an impairment test and concluded that the carrying amountexceeded the recoverable amount for its Fixed Networks group of CGUs. As a result, the Group recorded a non-cash impairment charge of EUR 200million within other operating expenses to reduce the goodwill within its Fixed Networks operating segment.
The results of the impairment test indicate adequate headroom for other groups of CGUs.

Table of Contents
147
Impairment charges by asset category
EURm 2020 2019 2018
Goodwill 200 – –Other intangible assets 9 12 16Property, plant and equipment – 4 39Right-of-use assets(1) 32 20 –Investments in associated companies and joint ventures 4 2 –Financial assets 1 64 –Total 246 102 55
(1) The Group adopted IFRS 16, Leases, on January 1, 2019. In 2019, a EUR 20 million impairment charge is presented net of onerous lease contract provision releases.
In 2020, the Group recognized an impairment charge of EUR 200 million related to the goodwill held within the Fixed Networks operating segment.
In 2019, upon contract exit the Group recognized an impairment charge of EUR 64 million related to loans extended to a certain emerging marketcustomer. Other impairments recorded by the Group in 2020, 2019 and 2018 are immaterial.
18. InventoriesEURm 2020 2019(1)
Raw materials and semi-finished goods 552 636Finished goods 940 1 258Contract work in progress 750 1 042Total 2 242 2 936
(1) The Group has changed the classification of inventories from previous presentation to better reflect the nature of the inventories.
The cost of inventories recognized as an expense during the year and included in the cost of sales is EUR 6 115 million (EUR 8 181 million in 2019 andEUR 7 569 million in 2018).
Movements in allowances for excess and obsolete inventory for the years ended December 31:
EURm 2020 2019 2018
As of January 1 505 521 432Charged to income statement 71 83 153Deductions(1) (96) (99) (64)As of December 31 480 505 521
(1) Deductions include utilization and releases of allowances.
19. Prepaid expenses and accrued incomeNon-current
EURm 2020 2019
R&D tax credits and other indirect tax receivables 129 156Deposits 47 58Other 41 78Total 217 292
Current
EURm 2020 2019
R&D tax credits, VAT and other indirect tax receivables 483 543Divestment-related receivables 23 33Deposits 19 20Other 325 312Total 850 908
20. Shares of the Parent CompanyShares and share capitalParent Company has one class of shares. Each share entitles the holder to one vote at general meetings. The shares have no par value nor is there aminimum or maximum share capital or number of shares under the Articles of Association of Nokia Corporation. As of December 31, 2020, the sharecapital amounted to EUR 245 896 461.96 (EUR 245 896 461.96 in 2019) and consisted of 5 653 886 159 (5 640 536 159 in 2019) issued and fully paidshares.

Table of Contents
148
Treasury sharesAs of December 31, 2020, the number of Parent Company shares held by the Group companies was 36 389 799 (34 954 869 in 2019) representing 0.6%(0.6% in 2019) of the share capital and total voting rights.
In 2020, under the authorization held by the Board of Directors, the Parent Company issued 13 350 000 new shares without consideration to itself to fulfillthe company’s obligation under the Nokia Equity Programs.
In 2020, under the authorization held by the Board of Directors, the Parent Company issued 11 915 070 treasury shares to employees, including certainmembers of the Group Leadership Team, as settlement under Parent Company equity-based incentive plans and the employee share purchase plan. Theshares were issued without consideration and in accordance with the rules of the plans.
Reconciliation of the number of shares outstanding at the beginning and at the end of the period
Number of shares 000s 2020 2019 2018
As of January 1 5 605 581 5 593 162 5 579 517Settlement of share-based payments 11 915 12 396 13 221Stock options exercised – 23 424As of December 31 5 617 496 5 605 581 5 593 162
Authorizations given to the Board of DirectorsAuthorization to issue shares and special rights entitling to sharesAt the Annual General Meeting held on May 27, 2020, the shareholders authorized the Board of Directors to issue a maximum of 550 million sharesthrough one or more issues of shares or special rights entitling to shares. The Board of Directors is authorized to issue either new shares or shares held bythe Parent Company. The authorization included the right for the Board of Directors to resolve on all the terms and conditions of such share and specialrights issuances, including issuance in deviation from the shareholders’ pre-emptive rights. The authorization may be used to develop the ParentCompany’s capital structure, diversify the shareholder base, finance or carry out acquisitions or other arrangements, settle the Parent Company’s equity-based incentive plans, or for other purposes resolved by the Board of Directors. The authorization is effective until October 7, 2021 and terminated the previousauthorizations to issue shares and special rights entitling to shares.
Authorization to repurchase sharesAt the Annual General Meeting held on May 27, 2020, the shareholders authorized the Board of Directors to repurchase a maximum of 550 million shares.The amount corresponds to less than 10% of the total number of Parent Company’s shares. Shares may be repurchased to be cancelled, held to bereissued, transferred further or for other purposes resolved by the Board. The Board shall resolve on all other matters related to the repurchase of Nokiashares. The authorization is effective until October 7, 2021, and terminated the previous authorization to repurchase shares.
21. Translation differences, fair value and other reservesFair value and other reserves
Translation Pension Hedging Cost of hedging Fair valueEURm differences remeasurements reserve reserve reserve
As of January 1, 2018 (932) 838 37 (10) (23)Foreign exchange translation differences 444 – – – –Net investment hedging losses (66) – – 3 –Remeasurements of defined benefit plans – 293 – – –Net fair value losses – – (28) (8) (116)Transfer to income statement (37) – (30) 23 78Other (decrease)/increase (1) 6 – – –As of December 31, 2018 (592) 1 137 (21) 8 (61)Foreign exchange translation differences 259 – – – –Net investment hedging losses (40) – – (6) –Remeasurements of defined benefit plans – 319 – – –Net fair value losses – – (17) (34) (101)Transfer to income statement 1 – 32 18 107Other increase – 1 – – –As of December 31, 2019 (372) 1 457 (6) (14) (55)Foreign exchange translation differences (1 231) – – – –Net investment hedging gains 307 – – 1 –Remeasurements of defined benefit plans – 484 – – –Net fair value gains/(losses) – – 13 (13) (175)Transfer to income statement – – (5) 16 208Other decrease (1) – – – –Movement attributable to non-controlling interests 2 (1) – – –As of December 31, 2020 (1 295) 1 940 2 (10) (22)
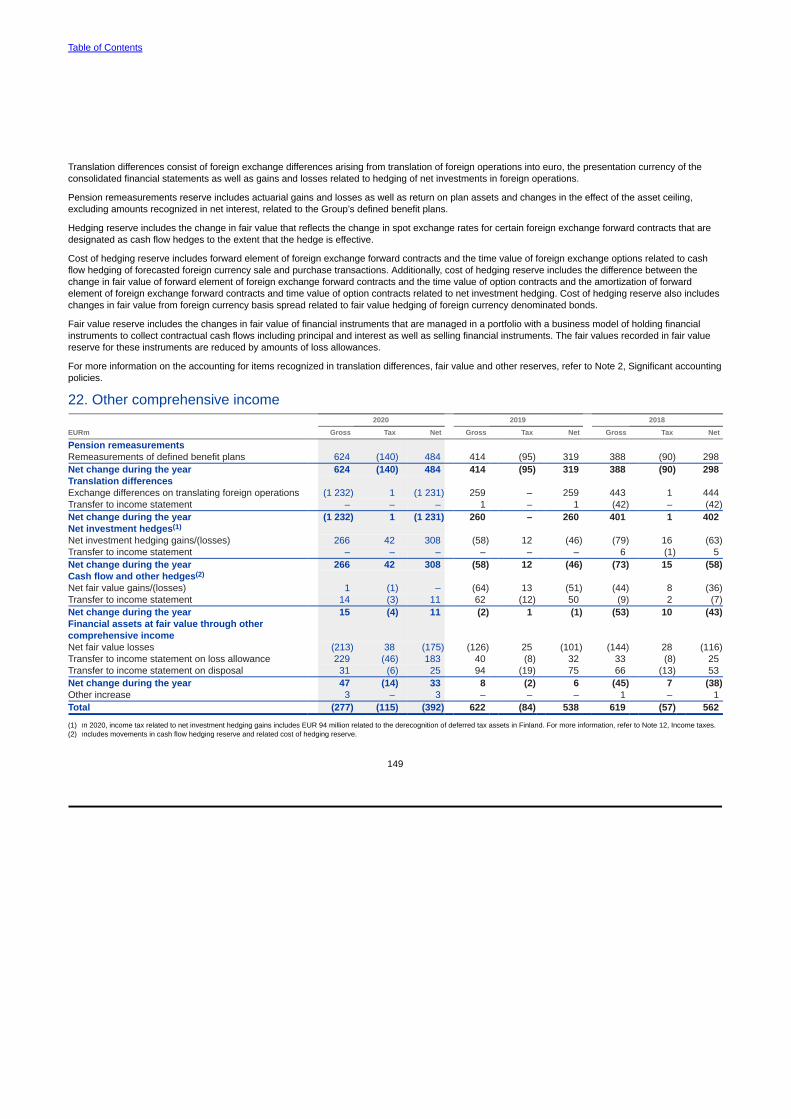
Table of Contents
149
Translation differences consist of foreign exchange differences arising from translation of foreign operations into euro, the presentation currency of theconsolidated financial statements as well as gains and losses related to hedging of net investments in foreign operations.
Pension remeasurements reserve includes actuarial gains and losses as well as return on plan assets and changes in the effect of the asset ceiling,excluding amounts recognized in net interest, related to the Group’s defined benefit plans.
Hedging reserve includes the change in fair value that reflects the change in spot exchange rates for certain foreign exchange forward contracts that aredesignated as cash flow hedges to the extent that the hedge is effective.
Cost of hedging reserve includes forward element of foreign exchange forward contracts and the time value of foreign exchange options related to cashflow hedging of forecasted foreign currency sale and purchase transactions. Additionally, cost of hedging reserve includes the difference between thechange in fair value of forward element of foreign exchange forward contracts and the time value of option contracts and the amortization of forwardelement of foreign exchange forward contracts and time value of option contracts related to net investment hedging. Cost of hedging reserve also includeschanges in fair value from foreign currency basis spread related to fair value hedging of foreign currency denominated bonds.
Fair value reserve includes the changes in fair value of financial instruments that are managed in a portfolio with a business model of holding financialinstruments to collect contractual cash flows including principal and interest as well as selling financial instruments. The fair values recorded in fair valuereserve for these instruments are reduced by amounts of loss allowances.
For more information on the accounting for items recognized in translation differences, fair value and other reserves, refer to Note 2, Significant accounting policies.
22. Other comprehensive income2020 2019 2018
EURm Gross Tax Net Gross Tax Net Gross Tax Net
Pension remeasurements Remeasurements of defined benefit plans 624 (140) 484 414 (95) 319 388 (90) 298Net change during the year 624 (140) 484 414 (95) 319 388 (90) 298Translation differences Exchange differences on translating foreign operations (1 232) 1 (1 231) 259 – 259 443 1 444Transfer to income statement – – – 1 – 1 (42) – (42)Net change during the year (1 232) 1 (1 231) 260 – 260 401 1 402Net investment hedges(1) Net investment hedging gains/(losses) 266 42 308 (58) 12 (46) (79) 16 (63)Transfer to income statement – – – – – – 6 (1) 5Net change during the year 266 42 308 (58) 12 (46) (73) 15 (58)Cash flow and other hedges(2) Net fair value gains/(losses) 1 (1) – (64) 13 (51) (44) 8 (36)Transfer to income statement 14 (3) 11 62 (12) 50 (9) 2 (7)Net change during the year 15 (4) 11 (2) 1 (1) (53) 10 (43)Financial assets at fair value through othercomprehensive income Net fair value losses (213) 38 (175) (126) 25 (101) (144) 28 (116)Transfer to income statement on loss allowance 229 (46) 183 40 (8) 32 33 (8) 25Transfer to income statement on disposal 31 (6) 25 94 (19) 75 66 (13) 53Net change during the year 47 (14) 33 8 (2) 6 (45) 7 (38)Other increase 3 – 3 – – – 1 – 1Total (277) (115) (392) 622 (84) 538 619 (57) 562
(1) In 2020, income tax related to net investment hedging gains includes EUR 94 million related to the derecognition of deferred tax assets in Finland. For more information, refer to Note 12, Income taxes.(2) Includes movements in cash flow hedging reserve and related cost of hedging reserve.
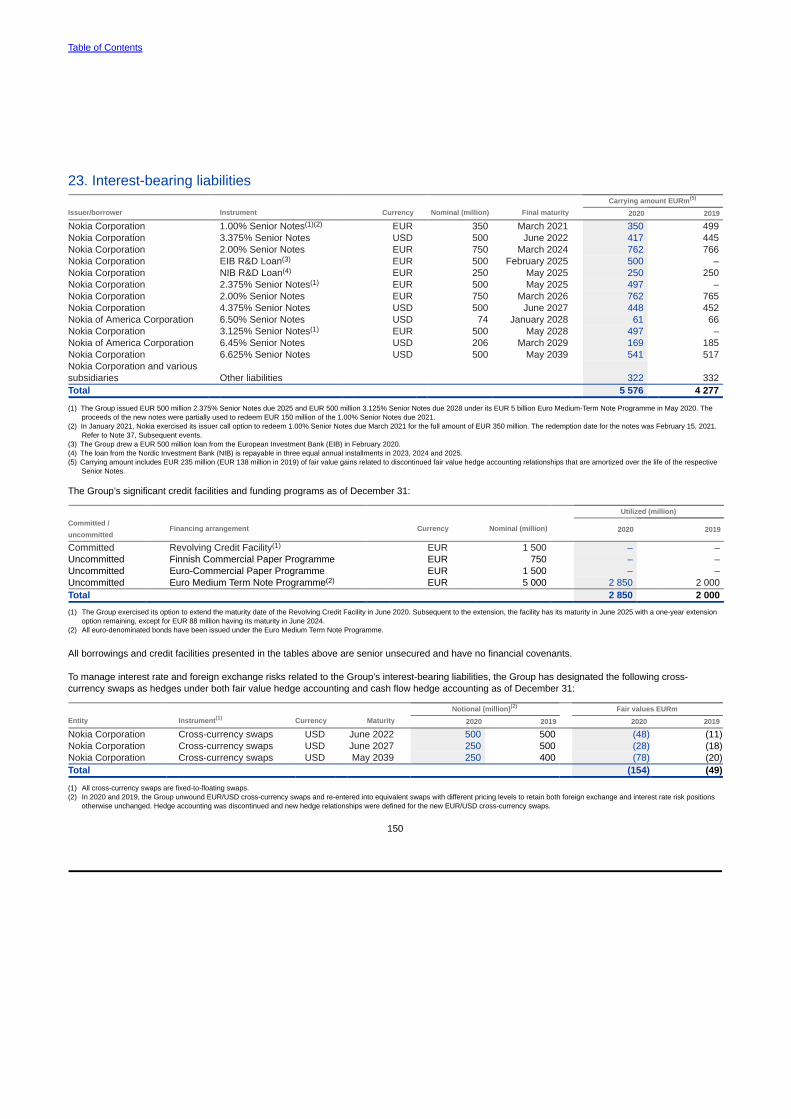
Table of Contents
150
23. Interest-bearing liabilitiesCarrying amount EURm(5)
Issuer/borrower Instrument Currency Nominal (million) Final maturity 2020 2019
Nokia Corporation 1.00% Senior Notes(1)(2) EUR 350 March 2021 350 499Nokia Corporation 3.375% Senior Notes USD 500 June 2022 417 445Nokia Corporation 2.00% Senior Notes EUR 750 March 2024 762 766Nokia Corporation EIB R&D Loan(3) EUR 500 February 2025 500 –Nokia Corporation NIB R&D Loan(4) EUR 250 May 2025 250 250Nokia Corporation 2.375% Senior Notes(1) EUR 500 May 2025 497 –Nokia Corporation 2.00% Senior Notes EUR 750 March 2026 762 765Nokia Corporation 4.375% Senior Notes USD 500 June 2027 448 452Nokia of America Corporation 6.50% Senior Notes USD 74 January 2028 61 66Nokia Corporation 3.125% Senior Notes(1) EUR 500 May 2028 497 –Nokia of America Corporation 6.45% Senior Notes USD 206 March 2029 169 185Nokia Corporation 6.625% Senior Notes USD 500 May 2039 541 517Nokia Corporation and varioussubsidiaries Other liabilities 322 332Total 5 576 4 277
(1) The Group issued EUR 500 million 2.375% Senior Notes due 2025 and EUR 500 million 3.125% Senior Notes due 2028 under its EUR 5 billion Euro Medium-Term Note Programme in May 2020. Theproceeds of the new notes were partially used to redeem EUR 150 million of the 1.00% Senior Notes due 2021.
(2) In January 2021, Nokia exercised its issuer call option to redeem 1.00% Senior Notes due March 2021 for the full amount of EUR 350 million. The redemption date for the notes was February 15, 2021. Refer to Note 37, Subsequent events.
(3) The Group drew a EUR 500 million loan from the European Investment Bank (EIB) in February 2020.(4) The loan from the Nordic Investment Bank (NIB) is repayable in three equal annual installments in 2023, 2024 and 2025.(5) Carrying amount includes EUR 235 million (EUR 138 million in 2019) of fair value gains related to discontinued fair value hedge accounting relationships that are amortized over the life of the respective
Senior Notes.
The Group’s significant credit facilities and funding programs as of December 31:
Utilized (million)Committed /uncommitted
Financing arrangement Currency Nominal (million) 2020 2019
Committed Revolving Credit Facility(1) EUR 1 500 – –Uncommitted Finnish Commercial Paper Programme EUR 750 – –Uncommitted Euro-Commercial Paper Programme EUR 1 500 – –Uncommitted Euro Medium Term Note Programme(2) EUR 5 000 2 850 2 000Total 2 850 2 000
(1) The Group exercised its option to extend the maturity date of the Revolving Credit Facility in June 2020. Subsequent to the extension, the facility has its maturity in June 2025 with a one-year extensionoption remaining, except for EUR 88 million having its maturity in June 2024.
(2) All euro-denominated bonds have been issued under the Euro Medium Term Note Programme.
All borrowings and credit facilities presented in the tables above are senior unsecured and have no financial covenants.
To manage interest rate and foreign exchange risks related to the Group’s interest-bearing liabilities, the Group has designated the following cross-currency swaps as hedges under both fair value hedge accounting and cash flow hedge accounting as of December 31:
Notional (million)(2) Fair values EURmEntity Instrument(1) Currency Maturity 2020 2019 2020 2019
Nokia Corporation Cross-currency swaps USD June 2022 500 500 (48) (11)Nokia Corporation Cross-currency swaps USD June 2027 250 500 (28) (18)Nokia Corporation Cross-currency swaps USD May 2039 250 400 (78) (20)Total (154) (49)
(1) All cross-currency swaps are fixed-to-floating swaps.(2) In 2020 and 2019, the Group unwound EUR/USD cross-currency swaps and re-entered into equivalent swaps with different pricing levels to retain both foreign exchange and interest rate risk positions
otherwise unchanged. Hedge accounting was discontinued and new hedge relationships were defined for the new EUR/USD cross-currency swaps.
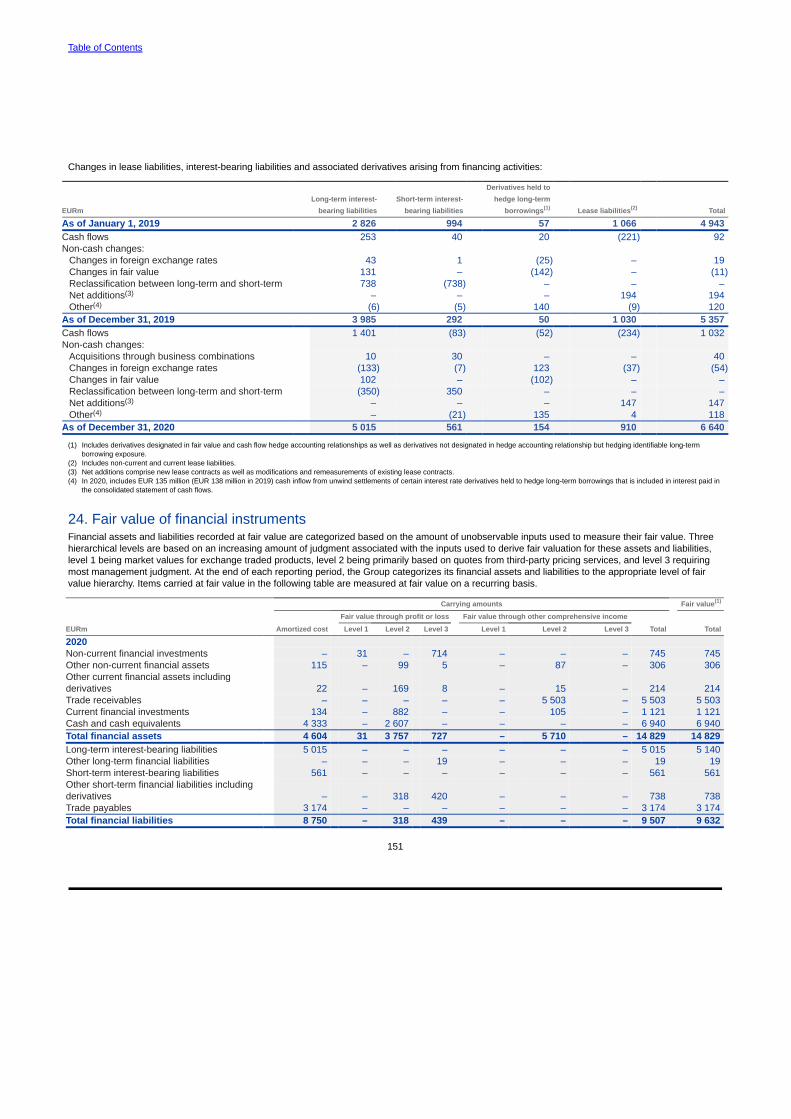
Table of Contents
151
Changes in lease liabilities, interest-bearing liabilities and associated derivatives arising from financing activities:
EURm Long-term interest-
bearing liabilities Short-term interest-
bearing liabilities
Derivatives held tohedge long-term
borrowings(1) Lease liabilities(2) Total
As of January 1, 2019 2 826 994 57 1 066 4 943Cash flows 253 40 20 (221) 92Non-cash changes:
Changes in foreign exchange rates 43 1 (25) – 19Changes in fair value 131 – (142) – (11)Reclassification between long-term and short-term 738 (738) – – –Net additions(3) – – – 194 194Other(4) (6) (5) 140 (9) 120
As of December 31, 2019 3 985 292 50 1 030 5 357Cash flows 1 401 (83) (52) (234) 1 032Non-cash changes:
Acquisitions through business combinations 10 30 – – 40Changes in foreign exchange rates (133) (7) 123 (37) (54)Changes in fair value 102 – (102) – –Reclassification between long-term and short-term (350) 350 – – –Net additions(3) – – – 147 147Other(4) – (21) 135 4 118
As of December 31, 2020 5 015 561 154 910 6 640
(1) Includes derivatives designated in fair value and cash flow hedge accounting relationships as well as derivatives not designated in hedge accounting relationship but hedging identifiable long-termborrowing exposure.
(2) Includes non-current and current lease liabilities.(3) Net additions comprise new lease contracts as well as modifications and remeasurements of existing lease contracts.(4) In 2020, includes EUR 135 million (EUR 138 million in 2019) cash inflow from unwind settlements of certain interest rate derivatives held to hedge long-term borrowings that is included in interest paid in
the consolidated statement of cash flows.
24. Fair value of financial instrumentsFinancial assets and liabilities recorded at fair value are categorized based on the amount of unobservable inputs used to measure their fair value. Threehierarchical levels are based on an increasing amount of judgment associated with the inputs used to derive fair valuation for these assets and liabilities,level 1 being market values for exchange traded products, level 2 being primarily based on quotes from third-party pricing services, and level 3 requiringmost management judgment. At the end of each reporting period, the Group categorizes its financial assets and liabilities to the appropriate level of fairvalue hierarchy. Items carried at fair value in the following table are measured at fair value on a recurring basis.
Carrying amounts Fair value(1)
Fair value through profit or loss Fair value through other comprehensive income
EURm Amortized cost Level 1 Level 2 Level 3 Level 1 Level 2 Level 3 Total Total
2020Non-current financial investments – 31 – 714 – – – 745 745Other non-current financial assets 115 – 99 5 – 87 – 306 306Other current financial assets includingderivatives 22 – 169 8 – 15 – 214 214Trade receivables – – – – – 5 503 – 5 503 5 503Current financial investments 134 – 882 – – 105 – 1 121 1 121Cash and cash equivalents 4 333 – 2 607 – – – – 6 940 6 940Total financial assets 4 604 31 3 757 727 – 5 710 – 14 829 14 829Long-term interest-bearing liabilities 5 015 – – – – – – 5 015 5 140Other long-term financial liabilities – – – 19 – – – 19 19Short-term interest-bearing liabilities 561 – – – – – – 561 561Other short-term financial liabilities includingderivatives – – 318 420 – – – 738 738Trade payables 3 174 – – – – – – 3 174 3 174Total financial liabilities 8 750 – 318 439 – – – 9 507 9 632

Table of Contents
152
Carrying amounts Fair value(1)
Fair value through profit or loss Fair value through other comprehensive income
EURm Amortized cost Level 1 Level 2 Level 3 Level 1 Level 2 Level 3 Total Total
2019Non-current financial investments – – – 740 – – – 740 740Other non-current financial assets 165 – 171 6 – 103 – 445 430Other current financial assets includingderivatives 46 – 81 – – 37 – 164 164Trade receivables – – – – – 5 025 – 5 025 5 025Current financial investments 42 – 51 – – 4 – 97 97Cash and cash equivalents 4 090 – 1 820 – – – – 5 910 5 910Total financial assets 4 343 – 2 123 746 – 5 169 – 12 381 12 366Long-term interest-bearing liabilities 3 985 – – – – – – 3 985 4 056Other long-term financial liabilities – – 10 20 – – – 30 30Short-term interest-bearing liabilities 292 – – – – – – 292 292Other short-term financial liabilities includingderivatives – – 164 639 – – – 803 803Trade payables 3 786 – – – – – – 3 786 3 786Total financial liabilities 8 063 – 174 659 – – – 8 896 8 967
(1) The following fair value measurement methods are used for items not carried at fair value: The fair values of long-term interest-bearing liabilities, including current part, are primarily based on quotesfrom third-party pricing services (level 2). The fair values of other assets and liabilities, including loan receivables and loans payable, are primarily based on discounted cash flow analysis (level 2). Thefair value is estimated to equal the carrying amount for short-term financial assets and financial liabilities due to limited credit risk and short time to maturity. Refer to Note 2, Significant accountingpolicies.
Lease liabilities are not included in the fair value of financial instruments.
The level 1 category includes financial assets and liabilities that are measured in whole by reference to published quotes in an active market. A financialinstrument is regarded as quoted in an active market if quoted prices are readily and regularly available from an exchange, and those prices representactual and regularly occurring market transactions on an arm’s-length basis. This category includes only exchange traded products.
The level 2 category includes financial assets and liabilities measured using a valuation technique based on assumptions that are supported by pricesfrom observable current market transactions. These include assets and liabilities with fair values based on quotes from third-party pricing services,financial assets with fair values based on broker quotes and assets that are valued using the Group’s own valuation models whereby the materialassumptions are market observable. The majority of the Group’s listed bonds and other securities, over-the-counter derivatives, trade receivables andcertain other products are included within this category.
The level 3 financial assets category includes a large number of investments in unlisted equities and unlisted venture funds, including investmentsmanaged by NGP Capital specializing in growth-stage investing. The fair value of level 3 investments is determined using one or more valuationtechniques where the use of the market approach generally consists of using comparable market transactions, while the use of the income approachgenerally consists of calculating the net present value of expected future cash flows. For unlisted funds, the selection of appropriate valuation techniquesby the fund managing partner may be affected by the availability and reliability of relevant inputs. In some cases, one valuation technique may provide thebest indication of fair value while in other circumstances multiple valuation techniques may be appropriate.
The inputs generally considered in determining the fair value of level 3 investments include the original transaction price, recent transactions in the sameor similar instruments, completed or pending third-party transactions in the underlying investment or comparable issuers, subsequent rounds of financing,recapitalizations or other transactions undertaken by the issuer, offerings in the equity or debt capital markets, and changes in financial ratios or cashflows, adjusted as appropriate for liquidity, credit, market and/or other risk factors. The fair value may be adjusted to reflect illiquidity and/or non-transferability, with the amount of such discount estimated by the managing partner in the absence of market information.
The level 3 investments are remeasured for each reporting date taking into consideration any changes in estimates, projections and assumptions, as wellas any changes in economic and other relevant conditions. The majority of the venture funds invest in digital health, software and enterprise sectors and,even though as of December 31, 2020 an elevated degree of uncertainty related to unobservable inputs prevails in the current market conditions causedby COVID-19 outbreak, the quantitative impact on the fair values of venture fund investments is considered limited. Level 3 investments includeapproximately 40 separate venture funds investing in hundreds of individual companies in various sectors and geographies. Hence, specific estimates andassumptions used by managing partners due to the lack of observable inputs do impact the fair value of individual investments, but no individual input hasa significant impact on the aggregated fair value of level 3 investments.
Level 3 financial liabilities include a conditional obligation to China Huaxin as part of the Nokia Shanghai Bell definitive agreements where China Huaxinobtained the right to fully transfer its ownership interest in Nokia Shanghai Bell to the Group in exchange for a future cash settlement. The fair value of theliability is measured based on the expected future cash settlement. The measurement of the financial liability involves estimation of the option exerciseprice and the distribution of excess cash balances upon exercise. Unobservable valuation inputs include certain financial performance metrics of NokiaShanghai Bell. No individual input has a significant impact on the total fair value of the level 3 financial liability. Refer to Note 33, Significant partly-ownedsubsidiaries.

Table of Contents
153
Reconciliation of the opening and closing balances of level 3 financial assets and liabilities:
Level 3 financial Level 3 financialEURm assets liabilities
As of January 1, 2019 688 (707)Net gains in income statement 49 35Additions 90 –Deductions (79) 1Other movements (2) 12As of December 31, 2019 746 (659)Net gains in income statement 19 94Additions 49 –Deductions (85) 2Transfers out of level 3 (5) 126Other movements 3 (2)As of December 31, 2020 727 (439)
The gains and losses from venture fund and similar investments categorized in level 3 are included in other operating income and expenses. The gainsand losses from other level 3 financial assets and liabilities are recorded in financial income and expenses. A net gain of EUR 102 million (net gain of EUR73 million in 2019) related to level 3 financial instruments held at December 31, 2020 was included in the profit and loss during 2020.
25. Derivative financial instrumentsAssets Liabilities
EURm Fair value(1) Notional(2) Fair value(1) Notional(2)
2020 Hedges on net investment in foreign subsidiaries Foreign exchange forward contracts 1 1 423 (3) 559Cash flow hedges Foreign exchange forward contracts 34 933 (16) 736Currency options bought 1 108 – –Currency options sold – – – 6Fair value hedges Foreign exchange forward contracts 83 1 340 (14) 588Firm commitments 19 468 (101) 1 105Cash flow and fair value hedges(3) Cross-currency swaps – – (154) 815Derivatives not designated in hedge accounting relationships carried at fair valuethrough profit and loss Foreign exchange forward contracts 29 3 716 (16) 3 917Currency options bought 2 171 – –Other derivatives – – – 9Total 169 8 159 (304) 7 7352019 Hedges on net investment in foreign subsidiaries Foreign exchange forward contracts 36 3 807 (2) 517Cash flow hedges Foreign exchange forward contracts 7 660 (18) 749Currency options bought 1 343 – –Fair value hedges Foreign exchange forward contracts 7 697 (7) 549Firm commitments 6 606 (2) 255Cash flow and fair value hedges(3) Cross-currency swaps – – (49) 1 246Derivatives not designated in hedge accounting relationships carried at fair valuethrough profit and loss Foreign exchange forward contracts 17 3 491 (72) 8 070Currency options bought 7 654 – –Other derivatives – – (7) 84Total 81 10 258 (157) 11 470
(1) Included in other current financial assets and other financial liabilities in the consolidated statement of financial position.(2) Includes the gross amount of all notional values for contracts that have not yet been settled or cancelled. The amount of notional value outstanding is not necessarily a measure or indication of market
risk as the exposure of certain contracts may be offset by that of other contracts.(3) Cross-currency swaps have been designated partly as fair value hedges and partly as cash flow hedges.
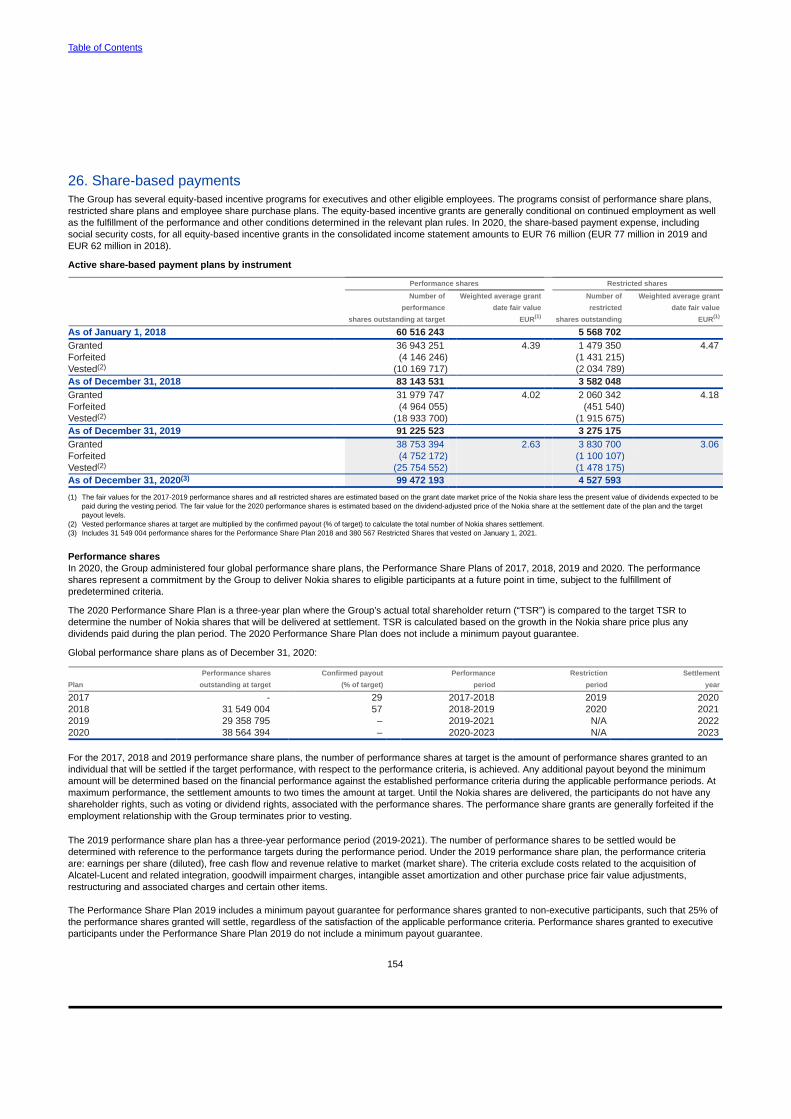
Table of Contents
154
26. Share-based paymentsThe Group has several equity-based incentive programs for executives and other eligible employees. The programs consist of performance share plans,restricted share plans and employee share purchase plans. The equity-based incentive grants are generally conditional on continued employment as wellas the fulfillment of the performance and other conditions determined in the relevant plan rules. In 2020, the share-based payment expense, includingsocial security costs, for all equity-based incentive grants in the consolidated income statement amounts to EUR 76 million (EUR 77 million in 2019 andEUR 62 million in 2018).
Active share-based payment plans by instrument
Performance shares Restricted shares
Number of Weighted average grant Number of Weighted average grantperformance date fair value restricted date fair value
shares outstanding at target EUR(1) shares outstanding EUR(1)
As of January 1, 2018 60 516 243 5 568 702 Granted 36 943 251 4.39 1 479 350 4.47Forfeited (4 146 246) (1 431 215)Vested(2) (10 169 717) (2 034 789)As of December 31, 2018 83 143 531 3 582 048 Granted 31 979 747 4.02 2 060 342 4.18Forfeited (4 964 055) (451 540)Vested(2) (18 933 700) (1 915 675)As of December 31, 2019 91 225 523 3 275 175 Granted 38 753 394 2.63 3 830 700 3.06Forfeited (4 752 172) (1 100 107)Vested(2) (25 754 552) (1 478 175)As of December 31, 2020(3) 99 472 193 4 527 593
(1) The fair values for the 2017-2019 performance shares and all restricted shares are estimated based on the grant date market price of the Nokia share less the present value of dividends expected to bepaid during the vesting period. The fair value for the 2020 performance shares is estimated based on the dividend-adjusted price of the Nokia share at the settlement date of the plan and the targetpayout levels.
(2) Vested performance shares at target are multiplied by the confirmed payout (% of target) to calculate the total number of Nokia shares settlement.(3) Includes 31 549 004 performance shares for the Performance Share Plan 2018 and 380 567 Restricted Shares that vested on January 1, 2021.
Performance sharesIn 2020, the Group administered four global performance share plans, the Performance Share Plans of 2017, 2018, 2019 and 2020. The performanceshares represent a commitment by the Group to deliver Nokia shares to eligible participants at a future point in time, subject to the fulfillment ofpredetermined criteria.
The 2020 Performance Share Plan is a three-year plan where the Group’s actual total shareholder return (“TSR”) is compared to the target TSR todetermine the number of Nokia shares that will be delivered at settlement. TSR is calculated based on the growth in the Nokia share price plus anydividends paid during the plan period. The 2020 Performance Share Plan does not include a minimum payout guarantee.
Global performance share plans as of December 31, 2020:
Performance shares Confirmed payout Performance Restriction SettlementPlan outstanding at target (% of target) period period year
2017 - 29 2017-2018 2019 20202018 31 549 004 57 2018-2019 2020 20212019 29 358 795 – 2019-2021 N/A 20222020 38 564 394 – 2020-2023 N/A 2023
For the 2017, 2018 and 2019 performance share plans, the number of performance shares at target is the amount of performance shares granted to anindividual that will be settled if the target performance, with respect to the performance criteria, is achieved. Any additional payout beyond the minimumamount will be determined based on the financial performance against the established performance criteria during the applicable performance periods. Atmaximum performance, the settlement amounts to two times the amount at target. Until the Nokia shares are delivered, the participants do not have anyshareholder rights, such as voting or dividend rights, associated with the performance shares. The performance share grants are generally forfeited if theemployment relationship with the Group terminates prior to vesting.
The 2019 performance share plan has a three-year performance period (2019-2021). The number of performance shares to be settled would bedetermined with reference to the performance targets during the performance period. Under the 2019 performance share plan, the performance criteriaare: earnings per share (diluted), free cash flow and revenue relative to market (market share). The criteria exclude costs related to the acquisition ofAlcatel-Lucent and related integration, goodwill impairment charges, intangible asset amortization and other purchase price fair value adjustments,restructuring and associated charges and certain other items.
The Performance Share Plan 2019 includes a minimum payout guarantee for performance shares granted to non-executive participants, such that 25% ofthe performance shares granted will settle, regardless of the satisfaction of the applicable performance criteria. Performance shares granted to executiveparticipants under the Performance Share Plan 2019 do not include a minimum payout guarantee.
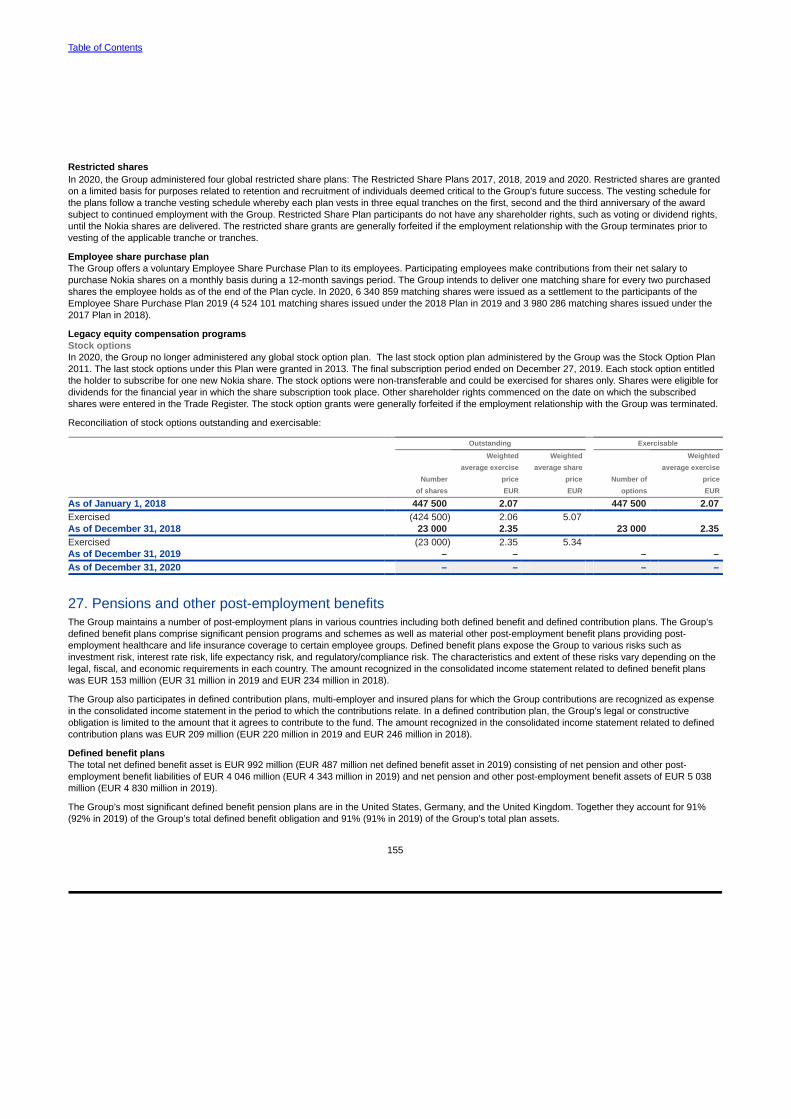
Table of Contents
155
Restricted sharesIn 2020, the Group administered four global restricted share plans: The Restricted Share Plans 2017, 2018, 2019 and 2020. Restricted shares are grantedon a limited basis for purposes related to retention and recruitment of individuals deemed critical to the Group's future success. The vesting schedule forthe plans follow a tranche vesting schedule whereby each plan vests in three equal tranches on the first, second and the third anniversary of the awardsubject to continued employment with the Group. Restricted Share Plan participants do not have any shareholder rights, such as voting or dividend rights,until the Nokia shares are delivered. The restricted share grants are generally forfeited if the employment relationship with the Group terminates prior tovesting of the applicable tranche or tranches.
Employee share purchase planThe Group offers a voluntary Employee Share Purchase Plan to its employees. Participating employees make contributions from their net salary topurchase Nokia shares on a monthly basis during a 12-month savings period. The Group intends to deliver one matching share for every two purchasedshares the employee holds as of the end of the Plan cycle. In 2020, 6 340 859 matching shares were issued as a settlement to the participants of theEmployee Share Purchase Plan 2019 (4 524 101 matching shares issued under the 2018 Plan in 2019 and 3 980 286 matching shares issued under the2017 Plan in 2018).
Legacy equity compensation programsStock optionsIn 2020, the Group no longer administered any global stock option plan. The last stock option plan administered by the Group was the Stock Option Plan 2011. The last stock options under this Plan were granted in 2013. The final subscription period ended on December 27, 2019. Each stock option entitled the holder to subscribe for one new Nokia share. The stock options were non-transferable and could be exercised for shares only. Shares were eligible for dividends for the financial year in which the share subscription took place. Other shareholder rights commenced on the date on which the subscribed shares were entered in the Trade Register. The stock option grants were generally forfeited if the employment relationship with the Group was terminated.
Reconciliation of stock options outstanding and exercisable:
Outstanding Exercisable
Weighted Weighted Weightedaverage exercise average share average exercise
Number price price Number of price
of shares EUR EUR options EUR
As of January 1, 2018 447 500 2.07 447 500 2.07Exercised (424 500) 2.06 5.07 As of December 31, 2018 23 000 2.35 23 000 2.35Exercised (23 000) 2.35 5.34 As of December 31, 2019 – – – –As of December 31, 2020 – – – –
27. Pensions and other post-employment benefitsThe Group maintains a number of post-employment plans in various countries including both defined benefit and defined contribution plans. The Group’sdefined benefit plans comprise significant pension programs and schemes as well as material other post-employment benefit plans providing post-employment healthcare and life insurance coverage to certain employee groups. Defined benefit plans expose the Group to various risks such asinvestment risk, interest rate risk, life expectancy risk, and regulatory/compliance risk. The characteristics and extent of these risks vary depending on thelegal, fiscal, and economic requirements in each country. The amount recognized in the consolidated income statement related to defined benefit planswas EUR 153 million (EUR 31 million in 2019 and EUR 234 million in 2018).
The Group also participates in defined contribution plans, multi-employer and insured plans for which the Group contributions are recognized as expensein the consolidated income statement in the period to which the contributions relate. In a defined contribution plan, the Group’s legal or constructiveobligation is limited to the amount that it agrees to contribute to the fund. The amount recognized in the consolidated income statement related to definedcontribution plans was EUR 209 million (EUR 220 million in 2019 and EUR 246 million in 2018).
Defined benefit plansThe total net defined benefit asset is EUR 992 million (EUR 487 million net defined benefit asset in 2019) consisting of net pension and other post-employment benefit liabilities of EUR 4 046 million (EUR 4 343 million in 2019) and net pension and other post-employment benefit assets of EUR 5 038million (EUR 4 830 million in 2019).
The Group’s most significant defined benefit pension plans are in the United States, Germany, and the United Kingdom. Together they account for 91%(92% in 2019) of the Group’s total defined benefit obligation and 91% (91% in 2019) of the Group’s total plan assets.
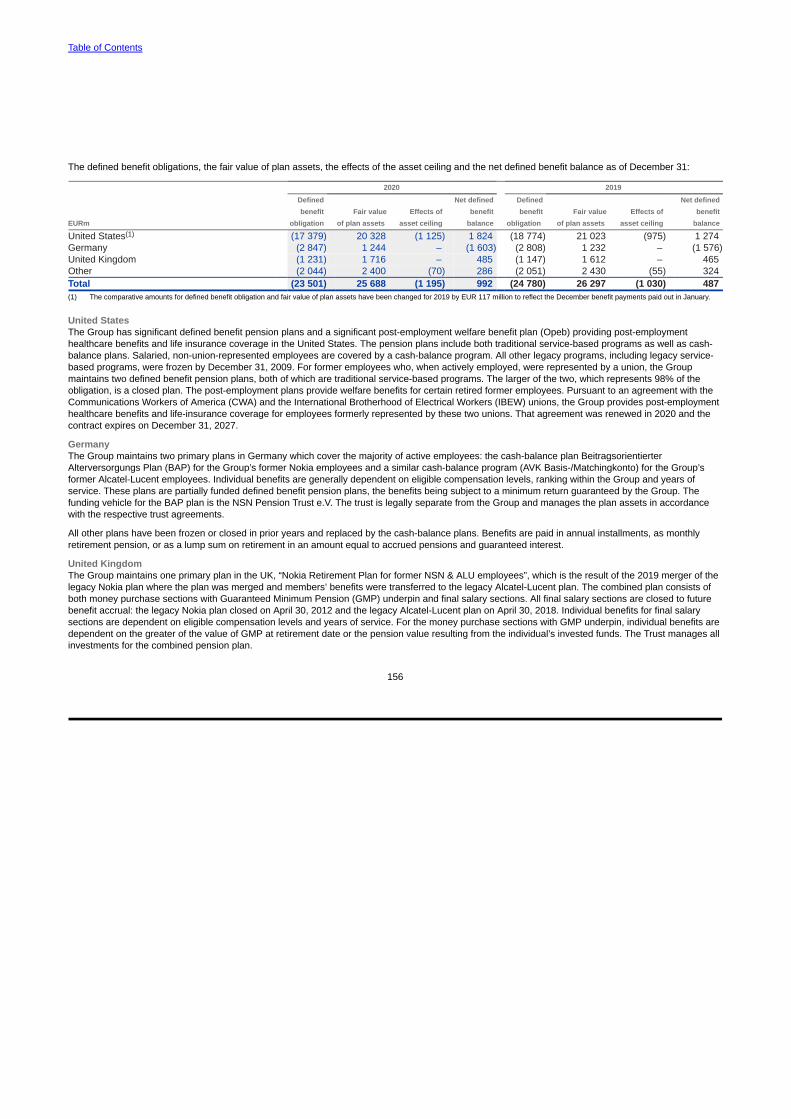
Table of Contents
156
The defined benefit obligations, the fair value of plan assets, the effects of the asset ceiling and the net defined benefit balance as of December 31:
2020 2019
Defined Net defined Defined Net definedbenefit Fair value Effects of benefit benefit Fair value Effects of benefit
EURm obligation of plan assets asset ceiling balance obligation of plan assets asset ceiling balance
United States(1) (17 379) 20 328 (1 125) 1 824 (18 774) 21 023 (975) 1 274Germany (2 847) 1 244 – (1 603) (2 808) 1 232 – (1 576)United Kingdom (1 231) 1 716 – 485 (1 147) 1 612 – 465Other (2 044) 2 400 (70) 286 (2 051) 2 430 (55) 324Total (23 501) 25 688 (1 195) 992 (24 780) 26 297 (1 030) 487(1) The comparative amounts for defined benefit obligation and fair value of plan assets have been changed for 2019 by EUR 117 million to reflect the December benefit payments paid out in January.
United StatesThe Group has significant defined benefit pension plans and a significant post-employment welfare benefit plan (Opeb) providing post-employmenthealthcare benefits and life insurance coverage in the United States. The pension plans include both traditional service-based programs as well as cash-balance plans. Salaried, non-union-represented employees are covered by a cash-balance program. All other legacy programs, including legacy service-based programs, were frozen by December 31, 2009. For former employees who, when actively employed, were represented by a union, the Groupmaintains two defined benefit pension plans, both of which are traditional service-based programs. The larger of the two, which represents 98% of theobligation, is a closed plan. The post-employment plans provide welfare benefits for certain retired former employees. Pursuant to an agreement with theCommunications Workers of America (CWA) and the International Brotherhood of Electrical Workers (IBEW) unions, the Group provides post-employmenthealthcare benefits and life-insurance coverage for employees formerly represented by these two unions. That agreement was renewed in 2020 and thecontract expires on December 31, 2027.
GermanyThe Group maintains two primary plans in Germany which cover the majority of active employees: the cash-balance plan BeitragsorientierterAlterversorgungs Plan (BAP) for the Group’s former Nokia employees and a similar cash-balance program (AVK Basis-/Matchingkonto) for the Group’sformer Alcatel-Lucent employees. Individual benefits are generally dependent on eligible compensation levels, ranking within the Group and years ofservice. These plans are partially funded defined benefit pension plans, the benefits being subject to a minimum return guaranteed by the Group. Thefunding vehicle for the BAP plan is the NSN Pension Trust e.V. The trust is legally separate from the Group and manages the plan assets in accordancewith the respective trust agreements.
All other plans have been frozen or closed in prior years and replaced by the cash-balance plans. Benefits are paid in annual installments, as monthlyretirement pension, or as a lump sum on retirement in an amount equal to accrued pensions and guaranteed interest.
United KingdomThe Group maintains one primary plan in the UK, “Nokia Retirement Plan for former NSN & ALU employees”, which is the result of the 2019 merger of thelegacy Nokia plan where the plan was merged and members’ benefits were transferred to the legacy Alcatel-Lucent plan. The combined plan consists ofboth money purchase sections with Guaranteed Minimum Pension (GMP) underpin and final salary sections. All final salary sections are closed to futurebenefit accrual: the legacy Nokia plan closed on April 30, 2012 and the legacy Alcatel-Lucent plan on April 30, 2018. Individual benefits for final salarysections are dependent on eligible compensation levels and years of service. For the money purchase sections with GMP underpin, individual benefits aredependent on the greater of the value of GMP at retirement date or the pension value resulting from the individual’s invested funds. The Trust manages allinvestments for the combined pension plan.

Table of Contents
157
Impact on the consolidated financial statementsMovements in the defined benefit obligation, fair value of plan assets and the impact of the asset ceilingThe movements in the present value of the defined benefit obligation for the years ended December 31:
2020 2019
United States United States Other United States United States OtherEURm pension Opeb pension Total pension(1) Opeb pension Total
As of January 1 (16 449) (2 325) (6 006) (24 780) (16 086) (2 384) (5 609) (24 079)Current service cost (118) – (93) (211) (66) – (87) (153)Interest expense (375) (54) (83) (512) (553) (79) (121) (753)Past service cost(2) (55) 89 29 63 (46) 167 19 140Settlements – – 10 10 – – 149 149Total (548) 35 (137) (650) (665) 88 (40) (617)Remeasurements:
Gain/(loss) from change in demographicassumptions 202 20 66 288 759 49 5 813(Loss)/gain from change in financial assumptions (1 427) (203) (377) (2 007) (1 677) (231) (483) (2 391)Experience gain/(loss) 30 85 (15) 100 37 39 (5) 71
Total (1 195) (98) (326) (1 619) (881) (143) (483) (1 507)Translation differences 1 451 196 125 1 772 (335) (53) (92) (480)Contributions from plan participants – (92) (29) (121) – (105) (25) (130)Benefits paid 1 401 260 245 1 906 1 518 284 242 2 044Other – (15) 6 (9) – (12) 1 (11)Total 2 852 349 347 3 548 1 183 114 126 1 423As of December 31 (15 340) (2 039) (6 122) (23 501) (16 449) (2 325) (6 006) (24 780)
(1) The comparative amounts for defined benefit obligation and fair value of plan assets have been changed for opening balance of 2019 by EUR 124 million and for ending balance of 2019 by EUR 117million to reflect the December benefit payments paid out in January.
(2) Consists of curtailment due to global restructuring, special termination benefits for certain US employees and extension of US retiree healthcare benefits related to US union negotiations for formerlyrepresented employees.
Present value of obligations includes EUR 16 959 million (EUR 17 899 million in 2019) of wholly funded obligations, EUR 5 412 million (EUR 5 660 millionin 2019) of partly funded obligations and EUR 1 130 million (EUR 1 221 million in 2019) of unfunded obligations.
The movements in the fair value of plan assets for the years ended December 31:
2020 2019
United States United States Other United States United States OtherEURm pension Opeb pension Total pension (1) Opeb pension Total
As of January 1 20 560 464 5 273 26 297 19 343 397 4 863 24 603Interest income 480 8 77 565 674 11 108 793Administrative expenses and interest on assetceiling (19) – (7) (26) (18) – (7) (25)Settlements – – (15) (15) – – (158) (158)Total 461 8 55 524 656 11 (57) 610Remeasurements:
Return on plan assets, excluding amounts includedin interest income 2 227 16 233 2 476 1 834 43 414 2 291
Total 2 227 16 233 2 476 1 834 43 414 2 291Translation differences (1 832) (41) (139) (2 012) 386 9 111 506Contributions:
Employers 26 6 67 99 27 14 57 98Plan participants – 92 29 121 – 105 25 130
Benefits paid (1 401) (260) (152) (1 813) (1 518) (284) (139) (1 941)Section 420 Transfer(2) (160) 160 – – (169) 169 – –Other (12) 14 (6) (4) 1 – (1) –Total (3 379) (29) (201) (3 609) (1 273) 13 53 (1 207)As of December 31 19 869 459 5 360 25 688 20 560 464 5 273 26 297
(1) The comparative amounts for defined benefit obligation and fair value of plan assets have been changed for opening balance of 2019 by EUR 124 million and for ending balance of 2019 by EUR 117million to reflect the December benefit payments paid out in January.
(2) Section 420 Transfer. Refer to ‘Future cash flows’ section below.

Table of Contents
158
The movements in the impact of the asset ceiling limitation for the years ended December 31:
2020 2019
United States United States Other United States United States OtherEURm pension Opeb pension Total pension Opeb pension Total
As of January 1 (975) – (55) (1 030) (573) – (54) (627)Interest expense (27) – – (27) (24) – – (24)Remeasurements:
Change in asset ceiling, excluding amounts included ininterest expense (216) – (17) (233) (370) – – (370)
Translation differences 93 – 2 95 (8) – (1) (9)As of December 31 (1 125) – (70) (1 195) (975) – (55) (1 030)
Net balances as of December 31:
2020 2019
United States United States Other United States United States OtherEURm pension Opeb pension Total pension Opeb pension Total
As of December 31 3 404 (1 580) (832) 992 3 136 (1 861) (788) 487
Asset ceiling limitationThe Group may recognize the surplus of a pension plan to the amount of economic benefit that the entity can realize, either through a refund or as areduction in future contributions. The most significant limitation of asset recognition for the Group is from the overfunded US formerly union representedpension plan. All other countries where asset ceiling limits apply are not considered material. Movements in asset ceiling limitation are recognized directlyin the consolidated statement of comprehensive income, excluding amounts included in interest expense. The Group recognized an asset ceiling limitationin the amount of EUR 1 195 million (EUR 1 030 million in 2019).
Recognized in the income statementRecognized in the consolidated income statement for the years ended December 31:
EURm 2020 2019 2018
Current service cost(1) 211 153 163Past service cost(1) (63) (140) 52Net Interest(2) – 9 15Settlements(1) 5 9 –Other – – 4Total 153 31 234
(1) Included in operating expenses within the consolidated income statement.(2) Included in financial expenses within the consolidated income statement.
Recognized in other comprehensive incomeRecognized in other comprehensive income for the years ended December 31:
EURm 2020 2019 2018
Return on plan assets, excluding amounts included in interest income 2 476 2 291 (987)Gain from change in demographic assumptions 288 813 80(Loss)/gain from change in financial assumptions (2 007) (2 391) 1 298Experience gain 100 71 79Change in asset ceiling, excluding amounts included in interest expense (233) (370) (82)Total 624 414 388
Actuarial assumptions and sensitivity analysisActuarial assumptionsAssumptions regarding future mortality are set based on actuarial advice in accordance with published statistics and experience in each country.
The discount rates and mortality tables used for the significant plans:
2020 2019 2020
Discount rate % Mortality table
United States 1.9 2.8 Pri–2012 w/MP–2020
mortality projection scaleGermany 0.4 0.8 Heubeck 2018GUnited Kingdom(1) 1.3 1.9 CMI 2019Total weighted average for all countries 1.7 2.5
(1) Tables are adjusted with 1.5% long-term rate of improvement.
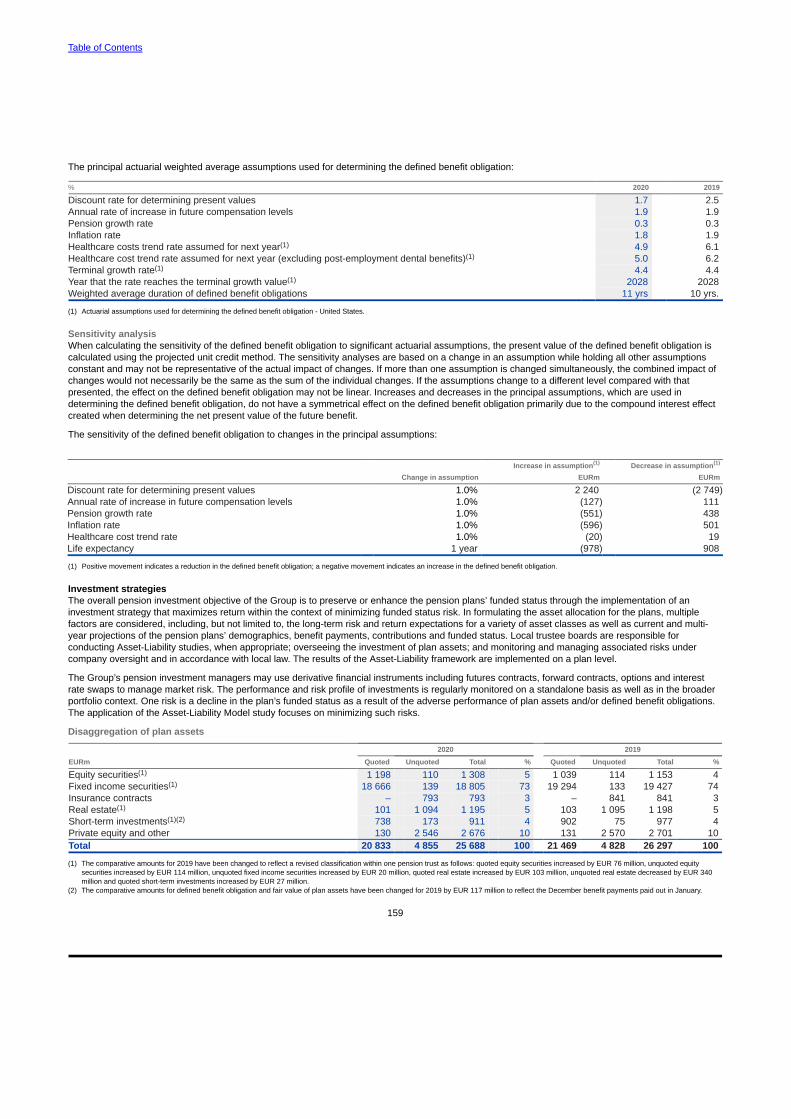
Table of Contents
159
The principal actuarial weighted average assumptions used for determining the defined benefit obligation:
% 2020 2019
Discount rate for determining present values 1.7 2.5Annual rate of increase in future compensation levels 1.9 1.9Pension growth rate 0.3 0.3Inflation rate 1.8 1.9Healthcare costs trend rate assumed for next year(1) 4.9 6.1Healthcare cost trend rate assumed for next year (excluding post-employment dental benefits)(1) 5.0 6.2Terminal growth rate(1) 4.4 4.4Year that the rate reaches the terminal growth value(1) 2028 2028Weighted average duration of defined benefit obligations 11 yrs 10 yrs.
(1) Actuarial assumptions used for determining the defined benefit obligation - United States.
Sensitivity analysisWhen calculating the sensitivity of the defined benefit obligation to significant actuarial assumptions, the present value of the defined benefit obligation iscalculated using the projected unit credit method. The sensitivity analyses are based on a change in an assumption while holding all other assumptionsconstant and may not be representative of the actual impact of changes. If more than one assumption is changed simultaneously, the combined impact ofchanges would not necessarily be the same as the sum of the individual changes. If the assumptions change to a different level compared with thatpresented, the effect on the defined benefit obligation may not be linear. Increases and decreases in the principal assumptions, which are used indetermining the defined benefit obligation, do not have a symmetrical effect on the defined benefit obligation primarily due to the compound interest effectcreated when determining the net present value of the future benefit.
The sensitivity of the defined benefit obligation to changes in the principal assumptions:
Increase in assumption(1) Decrease in assumption(1)
Change in assumption EURm EURm
Discount rate for determining present values 1.0% 2 240 (2 749)Annual rate of increase in future compensation levels 1.0% (127) 111Pension growth rate 1.0% (551) 438Inflation rate 1.0% (596) 501Healthcare cost trend rate 1.0% (20) 19Life expectancy 1 year (978) 908
(1) Positive movement indicates a reduction in the defined benefit obligation; a negative movement indicates an increase in the defined benefit obligation.
Investment strategiesThe overall pension investment objective of the Group is to preserve or enhance the pension plans’ funded status through the implementation of aninvestment strategy that maximizes return within the context of minimizing funded status risk. In formulating the asset allocation for the plans, multiplefactors are considered, including, but not limited to, the long-term risk and return expectations for a variety of asset classes as well as current and multi-year projections of the pension plans’ demographics, benefit payments, contributions and funded status. Local trustee boards are responsible forconducting Asset-Liability studies, when appropriate; overseeing the investment of plan assets; and monitoring and managing associated risks undercompany oversight and in accordance with local law. The results of the Asset-Liability framework are implemented on a plan level.
The Group’s pension investment managers may use derivative financial instruments including futures contracts, forward contracts, options and interestrate swaps to manage market risk. The performance and risk profile of investments is regularly monitored on a standalone basis as well as in the broaderportfolio context. One risk is a decline in the plan’s funded status as a result of the adverse performance of plan assets and/or defined benefit obligations.The application of the Asset-Liability Model study focuses on minimizing such risks.
Disaggregation of plan assets
2020 2019
EURm Quoted Unquoted Total % Quoted Unquoted Total %
Equity securities(1) 1 198 110 1 308 5 1 039 114 1 153 4Fixed income securities(1) 18 666 139 18 805 73 19 294 133 19 427 74Insurance contracts – 793 793 3 – 841 841 3Real estate(1) 101 1 094 1 195 5 103 1 095 1 198 5Short-term investments(1)(2) 738 173 911 4 902 75 977 4Private equity and other 130 2 546 2 676 10 131 2 570 2 701 10Total 20 833 4 855 25 688 100 21 469 4 828 26 297 100
(1) The comparative amounts for 2019 have been changed to reflect a revised classification within one pension trust as follows: quoted equity securities increased by EUR 76 million, unquoted equitysecurities increased by EUR 114 million, unquoted fixed income securities increased by EUR 20 million, quoted real estate increased by EUR 103 million, unquoted real estate decreased by EUR 340million and quoted short-term investments increased by EUR 27 million.
(2) The comparative amounts for defined benefit obligation and fair value of plan assets have been changed for 2019 by EUR 117 million to reflect the December benefit payments paid out in January.
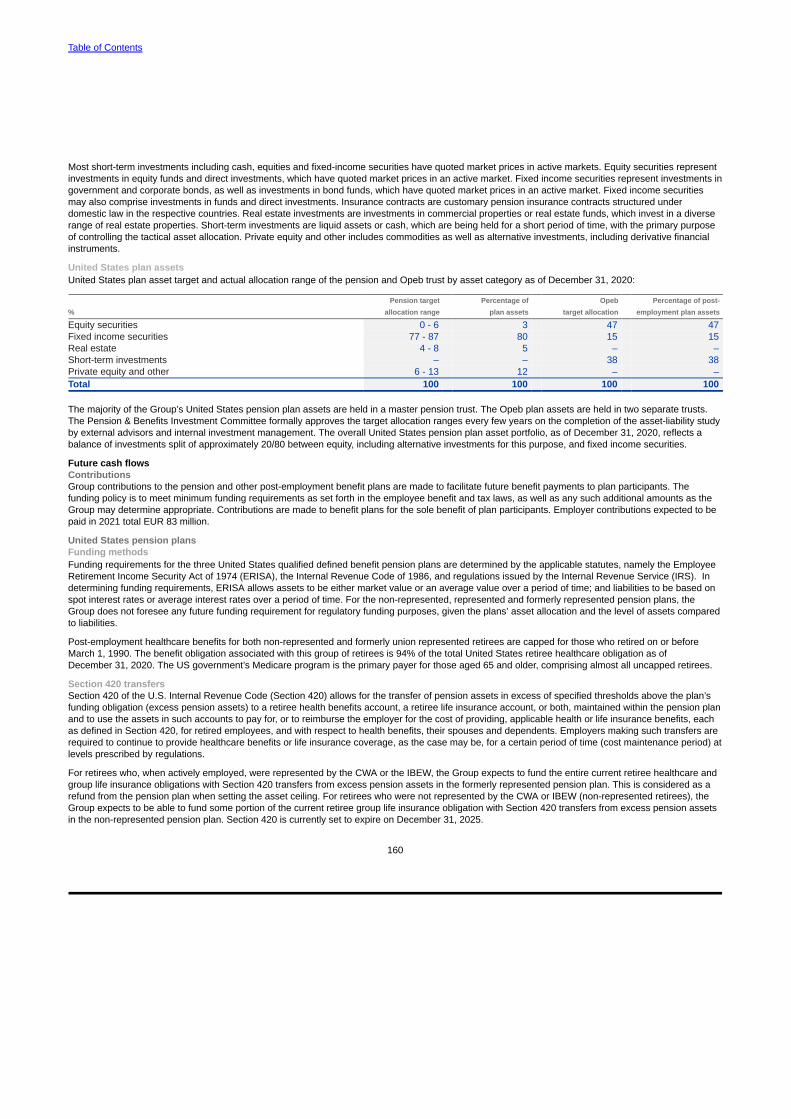
Table of Contents
160
Most short-term investments including cash, equities and fixed-income securities have quoted market prices in active markets. Equity securities representinvestments in equity funds and direct investments, which have quoted market prices in an active market. Fixed income securities represent investments ingovernment and corporate bonds, as well as investments in bond funds, which have quoted market prices in an active market. Fixed income securitiesmay also comprise investments in funds and direct investments. Insurance contracts are customary pension insurance contracts structured underdomestic law in the respective countries. Real estate investments are investments in commercial properties or real estate funds, which invest in a diverserange of real estate properties. Short-term investments are liquid assets or cash, which are being held for a short period of time, with the primary purposeof controlling the tactical asset allocation. Private equity and other includes commodities as well as alternative investments, including derivative financialinstruments.
United States plan assetsUnited States plan asset target and actual allocation range of the pension and Opeb trust by asset category as of December 31, 2020:
Pension target Percentage of Opeb Percentage of post-% allocation range plan assets target allocation employment plan assets
Equity securities 0 - 6 3 47 47Fixed income securities 77 - 87 80 15 15Real estate 4 - 8 5 – –Short-term investments – – 38 38Private equity and other 6 - 13 12 – –Total 100 100 100 100
The majority of the Group’s United States pension plan assets are held in a master pension trust. The Opeb plan assets are held in two separate trusts.The Pension & Benefits Investment Committee formally approves the target allocation ranges every few years on the completion of the asset-liability studyby external advisors and internal investment management. The overall United States pension plan asset portfolio, as of December 31, 2020, reflects abalance of investments split of approximately 20/80 between equity, including alternative investments for this purpose, and fixed income securities.
Future cash flowsContributionsGroup contributions to the pension and other post-employment benefit plans are made to facilitate future benefit payments to plan participants. Thefunding policy is to meet minimum funding requirements as set forth in the employee benefit and tax laws, as well as any such additional amounts as theGroup may determine appropriate. Contributions are made to benefit plans for the sole benefit of plan participants. Employer contributions expected to bepaid in 2021 total EUR 83 million.
United States pension plansFunding methodsFunding requirements for the three United States qualified defined benefit pension plans are determined by the applicable statutes, namely the Employee Retirement Income Security Act of 1974 (ERISA), the Internal Revenue Code of 1986, and regulations issued by the Internal Revenue Service (IRS). In determining funding requirements, ERISA allows assets to be either market value or an average value over a period of time; and liabilities to be based on spot interest rates or average interest rates over a period of time. For the non-represented, represented and formerly represented pension plans, the Group does not foresee any future funding requirement for regulatory funding purposes, given the plans’ asset allocation and the level of assets compared to liabilities.
Post-employment healthcare benefits for both non-represented and formerly union represented retirees are capped for those who retired on or beforeMarch 1, 1990. The benefit obligation associated with this group of retirees is 94% of the total United States retiree healthcare obligation as ofDecember 31, 2020. The US government’s Medicare program is the primary payer for those aged 65 and older, comprising almost all uncapped retirees.
Section 420 transfersSection 420 of the U.S. Internal Revenue Code (Section 420) allows for the transfer of pension assets in excess of specified thresholds above the plan’sfunding obligation (excess pension assets) to a retiree health benefits account, a retiree life insurance account, or both, maintained within the pension planand to use the assets in such accounts to pay for, or to reimburse the employer for the cost of providing, applicable health or life insurance benefits, eachas defined in Section 420, for retired employees, and with respect to health benefits, their spouses and dependents. Employers making such transfers arerequired to continue to provide healthcare benefits or life insurance coverage, as the case may be, for a certain period of time (cost maintenance period) atlevels prescribed by regulations.
For retirees who, when actively employed, were represented by the CWA or the IBEW, the Group expects to fund the entire current retiree healthcare and group life insurance obligations with Section 420 transfers from excess pension assets in the formerly represented pension plan. This is considered as a refund from the pension plan when setting the asset ceiling. For retirees who were not represented by the CWA or IBEW (non-represented retirees), the Group expects to be able to fund some portion of the current retiree group life insurance obligation with Section 420 transfers from excess pension assets in the non-represented pension plan. Section 420 is currently set to expire on December 31, 2025.

Table of Contents
161
Benefit paymentsThe following table summarizes expected benefit payments from the pension plans and other post-employment benefit plans until 2030. Actual benefitpayments may differ from expected benefit payments.
Direct benefit payments
US Pension US Opeb Other countries Total
Formerly union Non-union
EURm Management Occupational Supplemental plans represented represented
2021 1 061 264 23 111 50 288 1 7972022 941 224 23 101 51 272 1 6122023 900 212 22 87 52 329 1 6022024 860 199 22 73 52 283 1 4892025 819 187 21 63 53 290 1 4332026-2030 3 526 761 97 298 269 1 489 6 440
Benefits are paid from plan assets where there is sufficient funding available to the plan to cover the benefit obligation. Any payments in excess of the planassets are paid directly by the Group. Direct benefit payments expected to be paid in 2021 total EUR 97 million.
28. Accrued expenses, deferred revenue and other liabilitiesNon-current
EURm 2020 2019
Deferred revenue(1) 460 615Salaries, wages and social charges 45 45Other 36 52Total 541 712
Current
EURm 2020 2019
Deferred revenue(1) 155 155Salaries, wages and social charges 1 362 1 236VAT and other indirect taxes 337 359Discount accruals(2) 747 385Accrued expenses related to customer projects 475 496Other 645 692Total 3 721 3 323
(1) Non-current deferred revenue of EUR 460 million (EUR 615 million in 2019) and current deferred revenue of EUR 155 million (EUR 155 million in 2019) relates to an IP licensing contract which wasdetermined to be a completed contract as defined in the transition guidance of IFRS 15, Revenue from Contracts with Customers.
(2) Discount accruals represent customer credits without any outstanding future performance obligations.
Other accruals include accrued logistics, research and development, IT, interest and royalty expenses, as well as various amounts that are individuallyinsignificant.
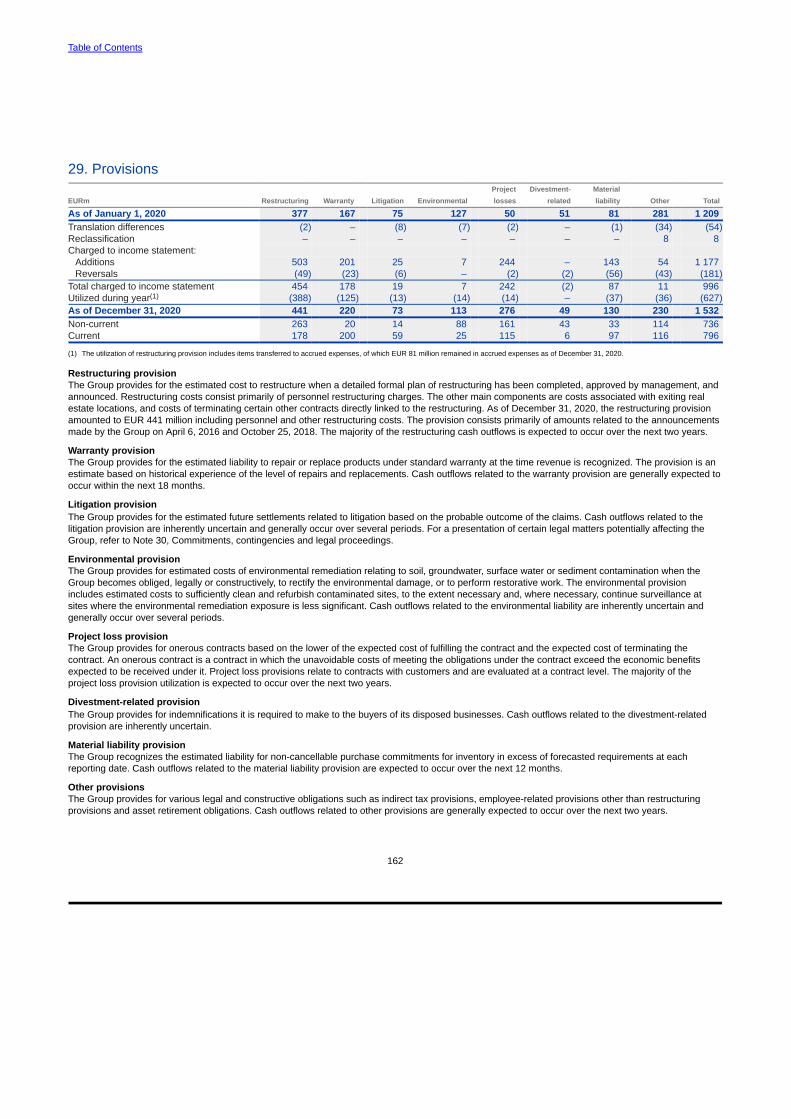
Table of Contents
162
29. Provisions Project Divestment- Material
EURm Restructuring Warranty Litigation Environmental losses related liability Other Total
As of January 1, 2020 377 167 75 127 50 51 81 281 1 209Translation differences (2) – (8) (7) (2) – (1) (34) (54)Reclassification – – – – – – – 8 8Charged to income statement:
Additions 503 201 25 7 244 – 143 54 1 177Reversals (49) (23) (6) – (2) (2) (56) (43) (181)
Total charged to income statement 454 178 19 7 242 (2) 87 11 996Utilized during year(1) (388) (125) (13) (14) (14) – (37) (36) (627)As of December 31, 2020 441 220 73 113 276 49 130 230 1 532Non-current 263 20 14 88 161 43 33 114 736Current 178 200 59 25 115 6 97 116 796
(1) The utilization of restructuring provision includes items transferred to accrued expenses, of which EUR 81 million remained in accrued expenses as of December 31, 2020.
Restructuring provisionThe Group provides for the estimated cost to restructure when a detailed formal plan of restructuring has been completed, approved by management, andannounced. Restructuring costs consist primarily of personnel restructuring charges. The other main components are costs associated with exiting realestate locations, and costs of terminating certain other contracts directly linked to the restructuring. As of December 31, 2020, the restructuring provisionamounted to EUR 441 million including personnel and other restructuring costs. The provision consists primarily of amounts related to the announcementsmade by the Group on April 6, 2016 and October 25, 2018. The majority of the restructuring cash outflows is expected to occur over the next two years.
Warranty provisionThe Group provides for the estimated liability to repair or replace products under standard warranty at the time revenue is recognized. The provision is anestimate based on historical experience of the level of repairs and replacements. Cash outflows related to the warranty provision are generally expected tooccur within the next 18 months.
Litigation provisionThe Group provides for the estimated future settlements related to litigation based on the probable outcome of the claims. Cash outflows related to thelitigation provision are inherently uncertain and generally occur over several periods. For a presentation of certain legal matters potentially affecting theGroup, refer to Note 30, Commitments, contingencies and legal proceedings.
Environmental provisionThe Group provides for estimated costs of environmental remediation relating to soil, groundwater, surface water or sediment contamination when theGroup becomes obliged, legally or constructively, to rectify the environmental damage, or to perform restorative work. The environmental provisionincludes estimated costs to sufficiently clean and refurbish contaminated sites, to the extent necessary and, where necessary, continue surveillance atsites where the environmental remediation exposure is less significant. Cash outflows related to the environmental liability are inherently uncertain andgenerally occur over several periods.
Project loss provisionThe Group provides for onerous contracts based on the lower of the expected cost of fulfilling the contract and the expected cost of terminating thecontract. An onerous contract is a contract in which the unavoidable costs of meeting the obligations under the contract exceed the economic benefitsexpected to be received under it. Project loss provisions relate to contracts with customers and are evaluated at a contract level. The majority of theproject loss provision utilization is expected to occur over the next two years.
Divestment-related provisionThe Group provides for indemnifications it is required to make to the buyers of its disposed businesses. Cash outflows related to the divestment-relatedprovision are inherently uncertain.
Material liability provisionThe Group recognizes the estimated liability for non-cancellable purchase commitments for inventory in excess of forecasted requirements at eachreporting date. Cash outflows related to the material liability provision are expected to occur over the next 12 months.
Other provisionsThe Group provides for various legal and constructive obligations such as indirect tax provisions, employee-related provisions other than restructuringprovisions and asset retirement obligations. Cash outflows related to other provisions are generally expected to occur over the next two years.

Table of Contents
163
30. Commitments, contingencies and legal proceedingsContractual obligationsPayments due for contractual obligations as of December 31, 2020, by due date:
EURm Within 1 year Between 1 and 3 years Between 3 and 5 years More than 5 years Total
Purchase obligations(1) 2 780 159 109 4 3 052
(1) Includes inventory purchase obligations, service agreements and outsourcing arrangements.
Additionally, the Group has committed lease contracts that have not yet commenced as of December 31, 2020. The future lease payments for these non-cancellable lease contracts are EUR 4 million within one year, EUR 71 million within two to five years and EUR 106 million thereafter
Guarantees and other contingent commitments
EURm 2020 2019
Contingent liabilities on behalf of Group companies Guarantees issued by financial institutions
Commercial guarantees(1) 1 107 1 190Non-commercial guarantees 450 531
Corporate guarantees(2) Commercial guarantees(1) 453 969Non-commercial guarantees 53 54
Financing commitments Customer finance commitments(3) 180 303Venture fund commitments(4) 189 244Other contingent liabilities and financing commitments(5)
Other guarantees and financing commitments 11 15
(1) In commercial guarantees, the Group reports guarantees that are issued in the normal course of business to the Group’s customers for the performance of the Group’s obligations under supplyagreements, including tender bonds, performance bonds and warranty bonds.
(2) In corporate guarantees, the Group reports guarantees with primary obligation that have been issued to the Group’s customers and other third parties.(3) Customer finance commitments are available under loan facilities negotiated with customers. Availability of the facility is dependent upon the borrower’s continuing compliance with the agreed financial
and operational covenants, and compliance with other administrative terms of the facility. The loan facilities are primarily available to fund capital expenditure relating to purchases of networkinfrastructure equipment and services. Refer to Note 36, Financial risk management.
(4) As a limited partner in NGP Capital and certain other funds making technology-related investments, the Group is committed to capital contributions and entitled to cash distributions according to therespective partnership agreements and underlying fund activities.
(5) Other contingent liabilities and financing commitments exclude committed lease contracts that have not yet commenced and purchase obligations.
The amounts in the table above represent the maximum principal amount of commitments and contingencies, and these amounts do not reflectmanagement’s expected outcomes.
Legal mattersA number of Group companies are and will likely continue to be subject to various legal proceedings and investigations that arise from time to time,including proceedings regarding intellectual property, product liability, sales and marketing practices, commercial disputes, employment and wrongfuldischarge, antitrust, securities, health and safety, environmental, tax, international trade, privacy matters and compliance. As a result, the Group may incursubstantial costs that may not be covered by insurance and could affect business and reputation. While management does not expect any of the legalproceedings it is currently aware of to have a material adverse effect on the Group’s financial position, litigation is inherently unpredictable and the Groupmay in the future incur judgments or enter into settlements that could have a material adverse effect on its profitability and cash flows.
Litigation and proceedingsMass labor litigation in BrazilThe Group is defending against a number of labor claims in various Brazilian labor courts. Plaintiffs are former employees whose contracts wereterminated after the Group exited from certain managed services contracts. The claims mainly relate to payments made under, or in connection with, theterminated labor contracts. The Group has closed the majority of the court cases through settlement or judgment.
Asbestos litigation in the United StatesThe Group is defending approximately 300 asbestos-related matters, at various stages of litigation. The claims are based on premises liability, products liability, and contractor liability. The claims also involve plaintiffs allegedly diagnosed with various diseases, including but not limited to asbestosis, lung cancer, and mesothelioma.
Securities Class ActionA litigation was filed on April 19, 2019, against the Group and certain executives in the United States relating to allegations of the Group making false andmisleading statements and omissions concerning its progress of integration of Alcatel-Lucent, including compliance practices identified during theintegration process and disclosed in the Group’s Annual Report on Form 20-F filed on March 21, 2019. The complaint was subsequently amended toinclude allegations of the Group making false and misleading statements and omissions concerning the Group’s readiness for the transition to fifthgeneration wireless technology.

Table of Contents
164
Intellectual property rights litigationDaimler litigationsIn March 2019, the Group commenced patent infringement proceedings against Daimler in Germany. The Group has asserted ten Nokia patents relevantto the 3G and 4G cellular standards in three German regional courts against Daimler’s connected cars. Two Nokia patents have been held to be infringedby Daimler and injunctions granted. The Group has not sought to enforce either of these injunctions and the litigations, including appeals, remain ongoing.In November 2020, one of the cases was stayed pending a referral to the Court of Justice of the European Union on questions relating to standardessential patent litigation.
Continental US litigationIn May 2019, Continental Automotive Systems filed a lawsuit in the United States against the Group and three other defendants relating to an allegedbreach of FRAND obligations and a refusal to license component suppliers. In September 2020, all antitrust and state law claims were dismissed in adistrict court in favour of the Group and other defendants. Continental has filed a notice of appeal.
LenovoIn September and October 2019, the Group commenced patent infringement proceedings against Lenovo in Germany, India and the United States, withadditional proceedings filed in the US International Trade Commission (USITC) and Brazil in July 2020. Across these actions, there are 19 Nokia patents insuit, covering video coding technologies used in Lenovo’s laptop, PC and tablet products. In September 2020, a district court in the United States issuedan order staying all deadlines until the determination of the USITC investigation becomes final. In September 2020, a regional court in Germany ruled thatLenovo was infringing one of Nokia’s standard essential patents and issued an injunction. In October 2020, Nokia enforced the injunction against Lenovo.A higher regional court in Germany stayed that enforcement pending the outcome of the appeal. In December 2020, Lenovo filed an action in the UnitedStates against the Group asserting various claims alleging breach of RAND obligations and seeking that these patents be declared unenforceable.
31. Notes to the consolidated statement of cash flowsEURm 2020 2019 2018
Adjustments for(1)
Depreciation and amortization 1 132 1 660 1 455Share-based payments 76 81 68Impairment charges 246 102 55Restructuring charges(2) 454 397 238Profit from non-current investments (61) (50) (44)Profit on sale of property, plant and equipment, net (3) (15) (16)Share of results of associated companies and joint ventures (26) (12) (12)Financial income and expenses 167 283 232Income tax expense 3 254 140 64(Gain)/loss on the sale of businesses – (4) 24Other operating income and expenses 28 45 29Total 5 267 2 627 2 093
(1) Includes continuing and discontinued operations.(2) Adjustments represent the non-cash portion of the restructuring charges recognized in the consolidated income statement.
The Group had no material non-cash investing or financing transactions in any of the years presented.

Table of Contents
165
32. Principal Group companiesThe Group’s significant subsidiaries as of December 31, 2020:
Parent Group ownershipholding interest
Company name Country of incorporation % %
Nokia Solutions and Networks Oy Finland 100.0 100.0Nokia of America Corporation United States – 100.0Nokia Shanghai Bell Co., Ltd.(1) China – 50.0Nokia Technologies Oy Finland 100.0 100.0Nokia Solutions and Networks India Private Limited India – 100.0Nokia Solutions and Networks B.V. Netherlands – 100.0Nokia Solutions and Networks Japan G.K. Japan – 100.0Alcatel-Lucent International S.A. France – 100.0Nokia Solutions and Networks Branch Operations Oy Finland – 100.0Alcatel Submarine Networks S.A.S. France – 100.0Nokia Solutions and Networks do Brasil Telecomunicações Ltda. Brazil – 100.0Alcatel-Lucent Participations S.A. France – 100.0Nokia Solutions and Networks Korea Ltd. South Korea – 100.0Nokia Spain, S.A. Spain – 100.0Nokia UK Limited United Kingdom – 100.0Nokia Canada Inc. Canada – 100.0Nokia Solutions and Networks Italia S.p.A. Italy – 100.0Nokia Solutions and Networks GmbH & Co. KG Germany – 100.0Nokia Solutions and Networks Australia Pty Ltd Australia – 100.0Alcatel-Lucent S.A.S. France – 100.0Nokia Solutions and Networks Limited Liability Company Russian Federation – 100.0
(1) Nokia Shanghai Bell Co., Ltd. is the parent company of the Nokia Shanghai Bell Group of which the Nokia Group owns 50% plus one share with China Huaxin, an entity controlled by the Chinesegovernment, holding the remaining ownership interests. Refer to Note 33, Significant partly-owned subsidiaries.
33. Significant partly-owned subsidiariesThe Group holds an ownership interest of 50% plus one share in Nokia Shanghai Bell’s parent company, Nokia Shanghai Bell Co., Ltd. (NSB), with ChinaHuaxin Post & Telecommunication Economy Development Center (China Huaxin) holding the remaining ownership interests. The Group applied judgmentto conclude that it is able to control NSB based on an assessment of various factors including the ability to nominate key management personnel,decision-making related to the management of NSB operations and the Group’s exposure to variable returns from NSB.
In 2017, the Group entered into a contractual arrangement providing China Huaxin with the right to fully transfer its ownership interest in NSB to the Groupand the Group with the right to purchase China Huaxin’s ownership interest in NSB in exchange for a future cash settlement. To reflect this, the Groupderecognized the non-controlling interest balance related to NSB and recognized a financial liability based on the estimated future cash settlement.
The financial liability is measured based on the expected future cash settlement to acquire the non-controlling interest in NSB. The measurement of thefinancial liability is complex as it involves estimation of the option exercise price and the distribution of excess cash balances upon exercise. The Groupdecreased the value of the financial liability to reflect a change in estimate of the future cash settlement resulting in the recognition of a EUR 79 milliongain (EUR 64 million in 2019) in financial income and expenses. As of December 31, 2020, the expected future cash settlement amounted to EUR 420million (EUR 639 million in 2019).

Table of Contents
166
Financial information for the Nokia Shanghai Bell Group(1):
EURm 2020 2019
Summarized income statement Net sales(2) 1 376 2 013Operating loss (3) (26)Loss for the year (14) (47)Loss for the year attributable to:
Equity holders of the parent (14) (47)Non-controlling interests(3) – –
Summarized statement of financial position Non-current assets 577 651Non-current liabilities (150) (192)Non-current net assets 427 459Current assets(4) 1 984 2 669Current liabilities (1 228) (1 637)Current net assets 756 1 032Net assets(5) 1 183 1 491Non-controlling interests(3) – –Summarized statement of cash flows Net cash from operating activities 189 125Net cash used in investing activities (26) (87)Net cash (used in)/from financing activities(6) (376) 38Net (decrease)/increase in cash and cash equivalents (213) 76
(1) Financial information for the Nokia Shanghai Bell Group is presented before eliminations of intercompany transactions with the rest of the Group but after eliminations of intercompany transactionsbetween entities within the Nokia Shanghai Bell Group.
(2) Includes EUR 104 million (EUR 100 million in 2019) net sales to other Group entities.(3) Based on the contractual arrangement with China Huaxin, the Group does not recognize any non-controlling interest in NSB.(4) Includes a total of EUR 604 million (EUR 819 million in 2019) of cash and cash equivalents and current financial investments.(5) The distribution of the profits of NSB requires the passing of a special resolution by more than two-thirds of its shareholders, subject to a requirement that at least 50% of the after-tax distributable profits
are distributed as dividends each year.(6) Includes EUR 144 million dividend paid to China Huaxin in 2020.
34. Investments in associated companies and joint venturesEURm 2020 2019
Net carrying amount as of January 1 165 145Translation differences (10) 3Acquisitions and additions(1) 68 13Disposals and deductions (7) –Impairments(2) (4) (2)Share of results(2) 26 12Dividends (5) (6)Net carrying amount as of December 31 233 165
(1) In 2020, the Group acquired an ownership interest in HMD global Oy as a result of the equity conversion of the convertible loan. For more information, refer to Note 35, Related party transactions.(2) In 2020, impairments and share of results are presented in the share of results of associated companies and joint ventures line in the consolidated income statement.
Shareholdings in associated companies and joint ventures comprise investments in unlisted companies.
35. Related party transactionsThe Group has related party transactions with pension funds, associated companies and joint ventures, and the management and the Board of Directors.Transactions and balances with companies over which the Group exercises control are eliminated on consolidation. Refer to Note 2, Significant accountingpolicies, and Note 32, Principal Group companies.
Transactions with pension fundsThe Group has borrowings of EUR 43 million (EUR 69 million in 2019) from Nokia Unterstützungsgesellschaft mbH, the Group’s German pension fund, aseparate legal entity. The loan bears interest at the rate of 6% per annum and its duration is pending until further notice by the loan counterparties eventhough they have the right to terminate the loan with a 90-day notice. In 2020, an amendment in the loan agreement was reached allowing an off-set to theloan balance of contributions, interest and benefit payments paid. The loan is included in short-term interest-bearing liabilities in the consolidatedstatement of financial position. For more information on the Group’s pension plans, refer to Note 27, Pensions and other post-employment benefits.
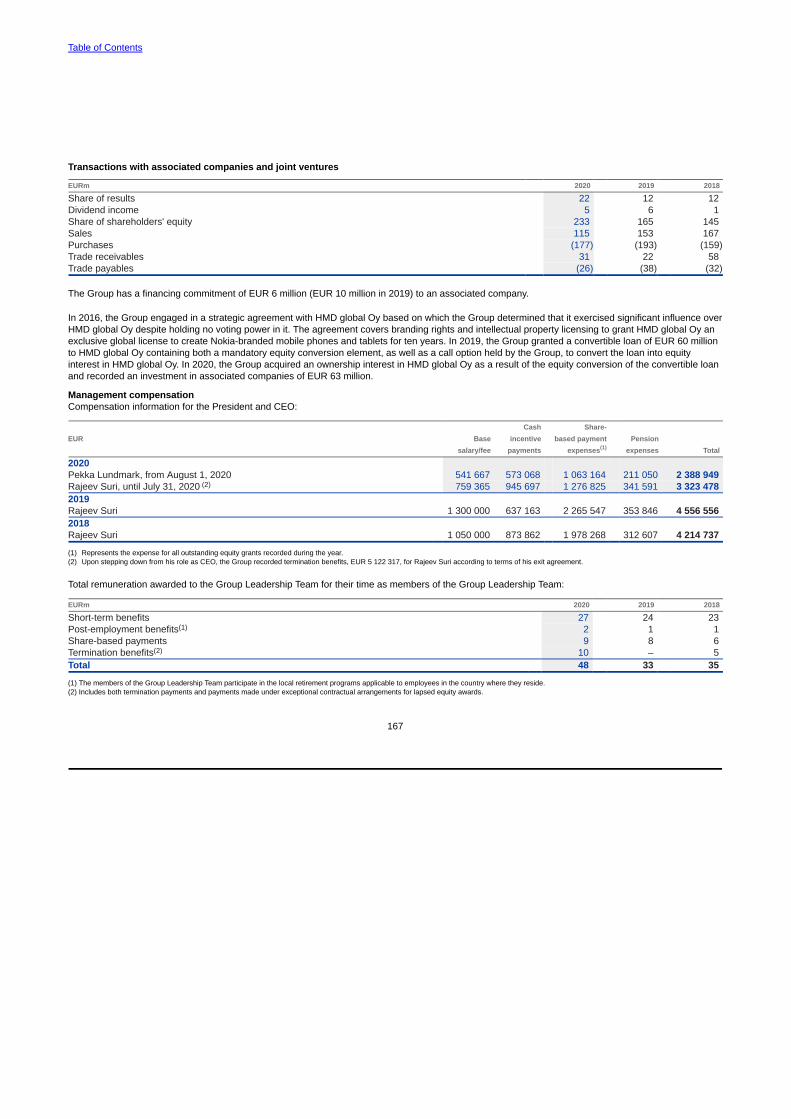
Table of Contents
167
Transactions with associated companies and joint ventures
EURm 2020 2019 2018
Share of results 22 12 12Dividend income 5 6 1Share of shareholders' equity 233 165 145Sales 115 153 167Purchases (177) (193) (159)Trade receivables 31 22 58Trade payables (26) (38) (32)
The Group has a financing commitment of EUR 6 million (EUR 10 million in 2019) to an associated company.
In 2016, the Group engaged in a strategic agreement with HMD global Oy based on which the Group determined that it exercised significant influence overHMD global Oy despite holding no voting power in it. The agreement covers branding rights and intellectual property licensing to grant HMD global Oy anexclusive global license to create Nokia-branded mobile phones and tablets for ten years. In 2019, the Group granted a convertible loan of EUR 60 millionto HMD global Oy containing both a mandatory equity conversion element, as well as a call option held by the Group, to convert the loan into equityinterest in HMD global Oy. In 2020, the Group acquired an ownership interest in HMD global Oy as a result of the equity conversion of the convertible loanand recorded an investment in associated companies of EUR 63 million.
Management compensationCompensation information for the President and CEO:
EUR Basesalary/fee
Cashincentive
payments
Share-based payment
expenses(1)Pension
expenses Total
2020Pekka Lundmark, from August 1, 2020 541 667 573 068 1 063 164 211 050 2 388 949Rajeev Suri, until July 31, 2020 (2) 759 365 945 697 1 276 825 341 591 3 323 4782019Rajeev Suri 1 300 000 637 163 2 265 547 353 846 4 556 5562018Rajeev Suri 1 050 000 873 862 1 978 268 312 607 4 214 737
(1) Represents the expense for all outstanding equity grants recorded during the year.(2) Upon stepping down from his role as CEO, the Group recorded termination benefits, EUR 5 122 317, for Rajeev Suri according to terms of his exit agreement.
Total remuneration awarded to the Group Leadership Team for their time as members of the Group Leadership Team:
EURm 2020 2019 2018
Short-term benefits 27 24 23Post-employment benefits(1) 2 1 1Share-based payments 9 8 6Termination benefits(2) 10 – 5Total 48 33 35
(1) The members of the Group Leadership Team participate in the local retirement programs applicable to employees in the country where they reside.(2) Includes both termination payments and payments made under exceptional contractual arrangements for lapsed equity awards.

Table of Contents
168
Board of Directors’ compensationThe annual remuneration paid to the members of the Board of Directors, as decided by the Annual General Meetings in the respective years:
2020 2019 2018
Annual Meeting Shares Annual Meeting Shares Annual Meeting Sharesfee(1) fees (2) received(3) fee(1) fees received(3) fee(1) fees received(3)
EUR EUR number EUR EUR number EUR EUR number
Sari Baldauf, Chair 440 000 5 000 48 523 185 000 12 000 16 261 160 000 – 12 636Kari Stadigh, Vice Chair 185 000 11 000 20 401 160 000 12 000 14 063 160 000 10 000 12 636Bruce Brown(4) 190 000 22 000 20 953 190 000 27 000 16 700 190 000 24 000 15 005Thomas Dannenfeldt(5) 175 000 – 19 299 – – – – – –Jeanette Horan(5) 175 000 20 000 19 299 175 000 22 000 15 382 175 000 20 000 13 820Louis R. Hughes – – – – 22 000 – 175 000 24 000 13 820Edward Kozel(5)(6) 195 000 17 000 21 504 195 000 20 000 17 140 195 000 22 000 15 400Jean C. Monty – – – – – – – 14 000 –Elizabeth Nelson(5) 175 000 17 000 19 299 175 000 25 000 15 382 175 000 17 000 13 820Olivier Piou – 11 000 – 175 000 14 000 15 382 185 000 11 000 14 610Risto Siilasmaa – – – 440 000 – 38 675 440 000 – 34 749Søren Skou 160 000 11 000 17 644 160 000 – 14 063 – – –Carla Smits-Nusteling(5) 190 000 17 000 20 953 190 000 20 000 16 700 190 000 16 000 15 005Total 1 885 000 131 000 2 045 000 174 000 2 045 000 158 000
(1) Annual fees consist of Board member fees and Committee chair and member fees.(2) Meeting fees include all meeting fees paid for the term that ended at the Annual General Meeting held on May 27, 2020, and meeting fees accrued and paid in 2020 for the term that began at the same meeting.(3) Approximately 40% of each Board member’s annual compensation is paid in Nokia shares purchased from the market, and the remaining approximately 60% is paid in cash.(4) Annual fees include EUR 30 000 for Bruce Brown as Chair of the Personnel Committee.(5) Annual fees include EUR 30 000 for Carla Smits-Nusteling as Chair and EUR 15 000 for Thomas Dannenfeldt, Jeanette Horan, Edward Kozel and Elizabeth Nelson as members of the Audit Committee.(6) Annual fees include EUR 20 000 for Edward Kozel as Chair of the Technology Committee.
Transactions with the Group Leadership Team and the Board of DirectorsNo loans were granted to the members of the Group Leadership Team and the Board of Directors in 2020, 2019 or 2018.
Terms of termination of employment of the President and CEORajeev Suri stepped down from his position as President and CEO on July 31, 2020. Nokia’s Board of Directors appointed Pekka Lundmark as Presidentand CEO of Nokia and he started in his new role on August 1, 2020.
The President and CEO, Pekka Lundmark, may terminate his service agreement at any time with 12 months’ prior notice. The President and CEO wouldeither continue to receive salary and benefits during the notice period or, at Nokia’s discretion, a lump sum of equivalent value. Additionally, the Presidentand CEO would be entitled to any short- or long-term incentives that would normally vest during the notice period. Any unvested equity awards would beforfeited after termination.
In the event that the President and CEO terminates his service agreement based on a final arbitration award demonstrating Nokia’s material breach of theservice agreement, he is entitled to a severance payment equaling up to 12 months of compensation (including annual base salary, benefits and targetincentive). Any unvested equity awards would be forfeited after termination.
36. Financial risk managementGeneral risk management principlesWe have a systematic and structured approach to risk management. Key risks and opportunities are primarily identified against business targets either inbusiness operations or as an integral part of strategy and financial planning. Risk management covers strategic, operational, financial and hazard risks.Key risks and opportunities are analyzed, managed and monitored as part of business performance management with the support of risk managementpersonnel and the centralized Enterprise Risk Management function. The principles documented in the Nokia Enterprise Risk Management Policy, which isapproved by the Audit Committee of the Board, require risk management and its elements to be integrated into key processes. One of the core principlesis that the business or function head is also the risk owner, although all employees are responsible for identifying, analyzing and managing risks, asappropriate, given their roles and duties. Our overall risk management concept is based on managing the key risks that would prevent us from meeting ourobjectives, rather than solely focusing on eliminating risks. In addition to the principles defined in the Nokia Enterprise Risk Management Policy, specificrisk management implementation, including financial risk management, is reflected in other key policies and operating procedures.
Financial risksThe objective for treasury activities is to guarantee sufficient funding at all times and to identify, evaluate and manage financial risks. Treasury activitiessupport this aim by mitigating the adverse effects on the profitability of the underlying business caused by fluctuations in the financial markets, and bymanaging the capital structure by balancing the levels of liquid assets and financial borrowings. Treasury activities are governed by the Nokia TreasuryPolicy approved by the Group President and CEO, which provides principles for overall financial risk management and determines the allocation ofresponsibilities for financial risk management activities. Operating procedures approved by the Group CFO cover specific areas such as foreign exchangerisk, interest rate risk, credit risk and liquidity risk as well as the use of derivative financial instruments in managing these risks. The Group is risk averse inits treasury activities.
Financial risks are divided into market risk covering foreign exchange risk and interest rate risk; credit risk covering business-related credit risk andfinancial credit risk; and liquidity risk.

Table of Contents
169
Market riskForeign exchange riskThe Group operates globally and is exposed to transaction and translation foreign exchange risks. The objective of foreign exchange risk management isto mitigate adverse impacts from foreign exchange fluctuations on the Group profitability and cash flows. Treasury applies a global portfolio approach tomanage foreign exchange risks within approved guidelines and limits.
Transaction risk arises from foreign currency denominated assets and liabilities together with foreign currency denominated future cash flows. Transactionexposures are managed in the context of various functional currencies of Group companies. Material transactional foreign exchange exposures arehedged, unless hedging would be uneconomical due to market liquidity and/or hedging cost. Exposures are defined using transaction nominal values.Exposures are mainly hedged with derivative financial instruments, such as foreign exchange forward contracts and foreign exchange options with most ofthe hedging instruments having a duration of less than a year.
Layered hedging approach is typically used for hedging of highly probable forecast foreign currency denominated cash flows with quarterly hedged itemsdefined based on set hedge ratio ranges for each successive quarter. Hedged items defined for successive quarters are hedged with foreign exchangeforward contracts and foreign exchange options with a hedge ratio of 1:1. Hedging levels are adjusted on a monthly basis including hedging instrumentdesignation and documentation as appropriate. In case hedges exceed the hedge ratio range for any specific quarter, the hedge portfolio for that specificquarter is adjusted accordingly.
In certain cases, mainly related to long-term construction projects, the Group applies fair value hedge accounting for foreign exchange risk with theobjective to reduce the exposure to fluctuations in the fair value of the related firm commitments due to changes in foreign exchange rates. Exposures aremainly hedged with foreign exchange forward contracts with most of the hedging instruments having a duration of less than a year. The Groupcontinuously manages the portfolio of hedging instruments to ensure appropriate alignment with the portfolio of hedged items at a hedging ratio of 1:1.
As the Group has entities where the functional currency is other than the euro, the shareholders’ equity is exposed to fluctuations in foreign exchangerates. Changes in shareholders’ equity caused by movements in foreign exchange rates are shown as currency translation differences in the consolidatedfinancial statements. The risk management strategy is to protect the euro counter value of the portion of this exposure expected to materialize as foreigncurrency repatriation cash flows in the foreseeable future. Exposures are mainly hedged with derivative financial instruments, such as foreign exchangeforward contracts and foreign exchange options with most of the hedging instruments having a duration of less than a year.
Hedged items are defined based on conservative expectations of repatriation cash flows based on a range of considerations. Net investment exposuresare reviewed, hedged items designated, and hedging levels adjusted at minimum on a quarterly basis with a hedge ratio of 1:1. Additionally, hedging levelsare adjusted whenever there are significant events impacting expected repatriation cash flows.
The foreign exchange risk arising from foreign currency denominated interest-bearing liabilities is primarily hedged using cross-currency swaps that arealso used to manage the Group’s interest rate profile (refer to the interest rate risk section below).
Notional amounts in currencies that represent a significant portion of the currency mix in outstanding financial instruments and other hedged items as ofDecember 31:
EURm USD GBP CNY JPY
2020 Foreign exchange exposure designated as hedged item for cash flow hedging, net(1) 313 238 – 369Foreign exchange exposure designated as hedged item for fair value hedging for FX risk, net(2) 705 (52) – –Foreign exchange exposure designated as hedged item for net investment hedging(3) 392 136 746 –Foreign exchange exposure from interest-bearing liabilities(4) (1 207) – – –Foreign exchange exposure from items on the statement of financial position, excluding interest-bearingliabilities, net 88 (148) (894) 130Other foreign exchange derivatives, carried at fair value through profit and loss, net(5) (324) 120 714 (95)EURm USD GBP CNY INR
2019 Foreign exchange exposure designated as hedged item for cash flow hedging, net(1) 628 379 – –Foreign exchange exposure designated as hedged item for fair value hedging for FX risk, net(2) 423 (70) – –Foreign exchange exposure designated as hedged item for net investment hedging(3) 2 547 93 981 346Foreign exchange exposure from interest-bearing liabilities(4) (1 314) – – –Foreign exchange exposure from items on the statement of financial position, excluding interest-bearingliabilities, net (2 855) (81) (868) (294)Other foreign exchange derivatives, carried at fair value through profit and loss, net(5) 2 607 86 711 346
(1) Includes foreign exchange exposure from forecasted cash flows related to sales and purchases. In some currencies, especially the US dollar, the Group has substantial foreign exchange exposures inboth estimated cash inflows and outflows. These underlying exposures have been hedged.
(2) Includes foreign exchange exposure from contractual firm commitments. These underlying exposures have been substantially hedged.(3) Includes net investment exposures in foreign operations. These underlying exposures have been hedged.(4) Includes interest-bearing liabilities that have been hedged with cross-currency swaps and foreign exchange forwards. Refer to Note 23, Interest-bearing liabilities.(5) Items on the statement of financial position are hedged by a portion of foreign exchange derivatives not designated in a hedge relationship and carried at fair value through profit and loss.
The methodology for assessing foreign exchange risk exposures: Value-at-RiskThe Group uses the Value-at-Risk (VaR) methodology to assess exposures to foreign exchange risks. The VaR-based methodology provides estimates ofpotential fair value losses in market risk-sensitive instruments as a result of adverse changes in specified market factors, at a specified confidence levelover a defined holding period. The Group calculates the foreign exchange VaR using the Monte Carlo method, which simulates random values forexchange rates in which the Group has exposures and takes the non-linear price function of certain derivative instruments into

Table of Contents
170
account. The VaR is determined using volatilities and correlations of rates and prices estimated from a sample of historical market data, at a 95%confidence level, using a one-month holding period. To put more weight on recent market conditions, an exponentially weighted moving average isperformed on the data with an appropriate decay factor. This model implies that, within a one-month period, the potential loss will not exceed the VaRestimate in 95% of possible outcomes. In the remaining 5% of possible outcomes, the potential loss will be at minimum equal to the VaR figure and, onaverage, substantially higher. The VaR methodology relies on a number of assumptions, which include the following: risks are measured under averagemarket conditions, changes in market risk factors follow normal distributions, future movements in market risk factors are in line with estimated parametersand the assessed exposures do not change during the holding period. Thus, it is possible that, for any given month, the potential losses at a 95%confidence level are different and could be substantially higher than the estimated VaR.
The VaR calculation includes foreign currency denominated monetary financial instruments, such as current financial investments, loans and tradereceivables, cash, loans and trade payables; foreign exchange derivatives carried at fair value through profit and loss that are not in a hedge relationshipand are mostly used to hedge the statement of financial position foreign exchange exposure; and foreign exchange derivatives designated as forecastedcash flow hedges, fair value hedges and net investment hedges as well as the exposures designated as hedged items for these hedge relationships.
The VaR figures for the Group’s financial instruments, which are sensitive to foreign exchange risks, are presented in the Total VaR column and thesimulated impact to financial statements presented in profit, other comprehensive income (OCI) and cumulative translation adjustment (CTA) columns inthe table below.
2020 2019
Simulated impact on financial statements Simulated impact on financial statements
EURm Total VaR Profit OCI CTA Total VaR Profit OCI CTA
As of December 31 9 15 21 – 8 10 18 –Average for the year 9 18 30 – 11 10 22 1Range for the year 6-18 8-32 15-41 0-0 7-25 4-17 13-31 0-4
Interest rate riskThe Group is exposed to interest rate risk either through market value fluctuations of items on the consolidated statement of financial position (price risk)or through changes in interest income or expenses (refinancing or reinvestment risk). Interest rate risk mainly arises through interest-bearing liabilities andassets. Estimated future changes in cash flows and the structure of the consolidated statement of financial position also expose the Group to interest raterisk.
The objective of interest rate risk management is to mitigate adverse impacts arising from interest rate fluctuations on the consolidated income statement,cash flow, and financial assets and liabilities while taking into consideration the Group’s target capital structure and the resulting net interest rate exposure.The Group has entered into long-term borrowings mainly at fixed rates and swapped a portion of them into floating rates, in line with a defined targetinterest profile. The Group has not entered into interest rate swaps where it would be paying fixed rates. The Group aims to mitigate the adverse impactsfrom interest rate fluctuations by continuously managing net interest rate exposure arising from financial assets and liabilities, by setting appropriate riskmanagement benchmarks and risk limits.
Interest rate profile of items under interest rate risk management including the Group’s net cash and current financial investments as well as relatedderivatives as of December 31:
2020 2019
EURm Fixed rate Floating rate(1) Fixed rate Floating rate(1)
Current financial investments 104 1 017 4 93Cash and cash equivalents 324 6 616 80 5 830Interest-bearing liabilities (4 687) (889) (3 872) (405)Financial assets and liabilities before derivatives (4 259) 6 744 (3 788) 5 518Interest rate derivatives 661 (661) 1 197 (1 197)Financial assets and liabilities after derivatives (3 598) 6 083 (2 591) 4 321
(1) All cash equivalents and derivative transaction-related collaterals with initial maturity of three months or less are considered floating rate for the purposes of interest rate risk management.
Treasury monitors and manages interest rate exposure centrally. The Group uses selective sensitivity analyses to assess and measure interest rateexposure arising from interest-bearing assets, interest-bearing liabilities and related derivatives. Sensitivity analysis determines an estimate of potential fairvalue changes in market risk-sensitive instruments by varying interest rates in currencies in which the Group has material amounts of financial assets andliabilities while keeping all other variables constant. Sensitivities to credit spreads are not reflected in the numbers.
The Group’s sensitivity to interest rate exposure in the investment and debt portfolios is presented in the fair value column in the table below withsimulated impact to financial statements presented in profit and OCI columns.
2020 2019
Impact on Impact Impact Impact on Impact ImpactEURm fair value on profit on OCI fair value on profit on OCI
Interest rates – increase by 100 basis points 190 1 4 112 1 2Interest rates – decrease by 50 basis points (100) (1) (2) (58) (1) (1)

Table of Contents
171
Effects of hedge accounting on the financial position and performanceThe Group is using several types of hedge accounting programs to manage its foreign exchange and interest rate risk exposures; refer to Note 2,Significant accounting policies. The effect of these programs on the Group’s financial position and performance as of December 31:
EURm
Cash flowhedges (FX
forwards andoptions)(1)
Net investmenthedges (FX
forwards andoptions)(1)
Fair valuehedges (FXforwards)(1)
Fair value andcash flow
hedges (IRswaps and
cross-currencyswaps)(1)
2020Carrying amount of hedging instruments 19 (2) 69 (154)Notional amount of hedging instruments (787) (1 620) (636) 815Notional amount of hedged items 787 1 620 635 (815)Change in intrinsic value of hedging instruments since January 1 33 265 79 118Change in value of hedged items used to determine hedge effectiveness (35) (265) (87) (116)2019Carrying amount of hedging instruments (10) 34 1 (51)Notional amount of hedging instruments (1 029) (4 106) (348) 1 246Notional amount of hedged items 1 043 4 106 351 (1 246)Change in intrinsic value of hedging instruments since January 1 (31) (51) (4) 132Change in value of hedged items used to determine hedge effectiveness 32 51 3 (133)
(1) No significant ineffectiveness has been recorded during the periods presented and economic relationships have been fully effective.
The most significant foreign exchange hedging instruments under cash flow, net investment and fair value hedge accounting as of December 31:
Maturity breakdown of net notional amounts (EURm)(1)
Currency InstrumentFair value
(EURm)
Weightedaverage hedged
rate Total Within 3 months
Between 3and 12
months
Between 1and 3years
Beyond 3years
2020Cash flow hedge accounting
GBP FX Forwards (0) 0.8951 (163) (42) (97) (24) –GBP FX Options 1 0.9262 (75) (24) (47) (4) –JPY FX Forwards 7 122.0685 (185) (47) (138) – –JPY FX Options 0 128.3026 (19) – (19) – –KRW FX Forwards (2) 1 347.3221 (132) (29) (103) – –KRW FX Options 0 1 412.5000 (7) (7) – – –PLN FX Forwards (2) 4.4876 153 46 107 – –USD FX Forwards 17 1.1809 (268) (64) (204) – –
Net investment hedge accountingCNY FX Forwards 4 7.9625 (746) (746) – – –GBP FX Forwards (1) 0.9061 (136) (136) – – –INR FX Forwards (1) 89.8000 (182) (182) – – –USD FX Forwards (6) 1.2158 (392) (392) – – –
Fair value hedge accounting for FXrisk
USD FX Forwards 70 1.1490 (705) (114) (66) (487) (38)2019Cash flow hedge accounting
GBP FX Forwards (8) 0.8780 (207) (53) (126) (28) –GBP FX Options 1 0.9058 (172) (40) (99) (33) –JPY FX Forwards (2) 122.1697 (167) (44) (123) – –KRW FX Forwards (1) 1 310.0412 (129) (15) (114) – –KRW FX Options 0 1 336.2500 (46) (31) (15) – –PLN FX Forwards 2 4.2926 139 45 94 – –USD FX Forwards 0 1.1171 (280) 0 (280) – –USD FX Options 0 1.1489 (125) (67) (58) – –
Net investment hedge accountingCNY FX Forwards 0 7.8003 (981) (981) – – –INR FX Forwards 6 78.4807 (346) (346) – – –USD FX Forwards 28 1.1076 (2 547) (2 547) – – –
Fair value hedge accounting for FXrisk
USD FX Forwards 0 1.1082 (423) (171) (270) 18 –
(1) Negative notional amounts indicate that hedges sell currency and positive notional amounts indicate that hedges buy currency.

Table of Contents
172
For information on the impact of hedge accounting on equity, refer to Note 21, Fair value and other reserves. For information on hedging instruments usedfor fair value and cash flow hedge accounting related to the Group’s interest-bearing liabilities, refer to Note 23, Interest-bearing liabilities. For informationon derivative instruments, refer to Note 25, Derivative financial instruments.
Other market riskIn certain emerging market countries, there are local exchange control regulations that provide for restrictions on making cross-border transfers of funds aswell as other regulations that impact the Group’s ability to control its net assets in those countries.
Credit riskCredit risk refers to the risk that a counterparty will default on its contractual obligations resulting in financial loss to the Group. Credit risk arises from creditexposures to customers, including outstanding receivables, financial guarantees and committed transactions, as well as financial institutions, includingbank and cash, fixed income and money market investments, and derivative financial instruments. Credit risk is managed separately for business-relatedand financial credit exposures.
Business-related credit riskThe Group aims to ensure the highest possible quality in trade receivables and contract assets as well as customer or third-party loan receivables. TheCredit Risk Management Standard Operating Procedure, approved by the Group CFO, lays out the framework for the management of the business-relatedcredit risks. The Credit Risk Management Standard Operating Procedure sets out that credit decisions are based on credit evaluation in each business,including credit rating and limits for larger exposures, according to defined principles. Group level limit approvals are required for material credit exposures.Credit risks are monitored in each business and, where appropriate, mitigated on case by case basis with the use of letters of credit, collaterals, sponsorguarantees, credit insurance, and sale of selected receivables.
The Group applies a simplified approach to recognizing a loss allowance on trade receivables and contract assets based on measurement of lifetimeexpected credit losses arising from trade receivables without significant financing components. Based on quantitative and qualitative analysis, the Grouphas determined that the credit risk exposure arising from its trade receivables is low risk. Quantitative analysis focuses on historical loss rates, historic andprojected sales and the corresponding trade receivables, and overdue trade receivables including indicators of any deterioration in the recoveryexpectation. Qualitative analysis focuses on all relevant conditions, including customer credit rating, country credit rating and political situation, to improvethe accuracy of estimating lifetime expected credit losses. In 2020, the Group recognized impairment losses of 1.1% of net sales (0.6% in 2019).
Credit exposure is measured as the total of trade receivables, contract assets and loans outstanding from customers and committed credits. Tradereceivables do not include any major concentrations of credit risk by customer. The top three customers account for 10.5%, 5.1% and 4.6% (4.6%, 4.3%and 3.8% in 2019) of trade receivables, contract assets and loans due from customers and other third parties as of December 31, 2020. The top threecredit exposures by country account for 24.0%, 9.6% and 8.6% (12.4%, 11.4% and 9.7% in 2019) of the Group’s trade receivables, contract assets andloans due from customers and other third parties as of December 31, 2020. The 24.0% credit exposure relates to trade receivables in the United States(12.4% in 2019 from China).
The Group has provided loss allowances on trade receivables, contract assets and loans due from customers and other third parties not past due basedon an analysis of debtors’ credit ratings and credit histories. The Group establishes loss allowances that represent an estimate of expected losses at theend of the reporting period. All trade receivables, contract assets and loans due from customers are considered on an individual basis to determine theloss allowances. The total of trade receivables, contract assets and loans due from customers is EUR 7 124 million (EUR 6 936 million in 2019) as ofDecember 31, 2020.
The aging of trade receivables, contract assets and customer finance loans is as of December 31:
Past due Past due Past dueEURm Current 1-30 days 31-180 days More than 180 days Total
As of December 31, 2020 Trade receivables 5 190 93 199 320 5 802Contract assets 1 080 – – – 1 080Customer financing related loan receivables 178 – – 64 242Total 6 448 93 199 384 7 124As of December 31, 2019 Trade receivables 4 364 156 306 345 5 171Contract assets 1 489 – – – 1 489Customer financing related loan receivables 224 – 17 35 276Total 6 077 156 323 380 6 936
Movements in loss allowances, all of which relate to trade receivables, for the years ended December 31:
EURm 2020 2019 2018
As of January 1 147 195 192Charged to income statement 183 41 86Deductions(1) (30) (89) (83)As of December 31 300 147 195
(1) Deductions include utilization and releases of allowances.

Table of Contents
173
The Group's exposure to credit risk related to customer financing as of December 31:
EURm 2020 2019
Loan commitments given undrawn 180 303Outstanding customer financing related loan receivables 242 276Total 422 579
For customer financing related loan receivables, the credit loss estimate is typically based on a 12-month expected credit loss for outstanding loans andestimated additional draw-downs during this period. The loss allowance is calculated on a quarterly basis based on a review of collectability and availablecollateral, derecognized from other comprehensive income and recognized in other financial expenses in the consolidated income statement. Lossallowance for customer financing-related loan receivables was EUR 134 million (EUR 76 million in 2019). The increase in loss allowance balance is EUR58 million (EUR 69 million in 2019) mainly due to a significant decrease in the credit quality of an emerging market customer. In 2019 the movement in lossallowance balance is mainly due to an impairment related to a certain emerging market customer, refer to Note 17, Impairment.
Financial credit riskFinancial instruments contain an element of risk resulting from changes in the market price due to counterparties becoming less creditworthy or risk of lossdue to counterparties being unable to meet their obligations. Financial credit risk is measured and monitored centrally by Treasury. Financial credit risk ismanaged actively by limiting counterparties to a sufficient number of major banks and financial institutions, and by monitoring the creditworthiness and thesize of exposures continuously. Additionally, the Group enters into netting arrangements with all major counterparties, which give the right to offset in theevent that the counterparty would not be able to fulfill its obligations. The Group enters into collateral agreements with certain counterparties, which requirecounterparties to post collateral against derivative receivables.
Investment decisions are based on strict creditworthiness and maturity criteria as defined in the Treasury-related policies and procedures. As a result ofthis investment policy approach and active management of outstanding investment exposures, the Group has not been subject to any material creditlosses in its financial investments in the years presented. The Group did not have any financial investments that were past due but not impaired atDecember 31. Due to the high credit quality of the Group’s financial investments, the expected credit loss for these investments is deemed insignificant.
Outstanding current financial investments, cash equivalents and cash classified by credit rating grades ranked in line with Standard & Poor’s ratingcategories as of December 31:
EURm Rating(1) CashDue within
3 monthsDue between 3and 12 months
Due between1 and 3 years
Due between3 and 5 years
Due beyond5 years Total(2)(3)
2020 AAA – 1 411 – – – – 1 411AA+ - AA- 895 352 – – – – 1 247A+ - A- 1 685 2 593 50 70 155 50 4 603BBB+ - BBB- 106 490 100 – – – 696BB+ - BB- 36 – 1 – – – 37B+ - B- 26 – – – – – 26CCC+ - CCC- 3 – – – – – 3Non-rated 30 8 – – – – 38
Total 2 781 4 854 151 70 155 50 8 0612019
AAA – 800 – – – – 800AA+ - AA- 663 143 – – – – 806A+ - A- 2 007 1 377 20 20 25 – 3 449BBB+ - BBB- 445 360 13 – – – 818BB+ - BB- 8 – – – – – 8B+ - B- 22 – – – – – 22Non-rated 100 3 1 – – – 104
Total 3 245 2 683 34 20 25 – 6 007
(1) Bank Parent Company ratings are used here for bank groups. Actual bank subsidiary ratings may differ from the Bank Parent Company rating.(2) Current financial investments and cash equivalents include bank deposits, structured deposits, investments in money market funds and investments in fixed income instruments.(3) Instruments that include a call feature have been presented at their final maturities. Instruments that are contractually due beyond three months include EUR 325 million (EUR 77 million in 2019) of
instruments that have a call period of less than three months.
The Group has restricted bank deposits primarily related to employee benefits of EUR 107 million (EUR 126 million in 2019) that are presented in othernon-current financial assets. The Group has assessed the counterparty credit risk for these financial assets and concluded that expected credit losses arenot significant.

Table of Contents
174
Financial assets and liabilities subject to offsetting under enforceable master netting agreements and similar arrangements as of December 31:
Related amounts not set off in the statement of financial position
EURm
Gross amounts offinancial assets/
(liabilities)
Gross amounts offinancial liabilities/
(assets) set off in thestatement of financial
position
Net amounts of financialassets/ (liabilities)
presented in the statement of financial
position
Financialinstruments
assets/(liabilities)Cash collateral
received/(pledged) Net amount
2020 Derivative assets 169 – 169 73 89 7Derivative liabilities (304) – (304) (153) (134) (17)Total (135) – (135) (80) (45) (10)2019Derivative assets 81 – 81 76 – 5Derivative liabilities (157) – (157) (83) (37) (37)Total (76) – (76) (7) (37) (32)
The financial instruments subject to enforceable master netting agreements and similar arrangements are not offset in the consolidated statement offinancial position where there is no intention to settle net or realize the asset and settle the liability simultaneously.
Liquidity riskLiquidity risk is defined as financial distress or extraordinarily high financing costs arising from a shortage of liquid funds in a situation where outstandingdebt needs to be refinanced or where business conditions unexpectedly deteriorate and require financing. Transactional liquidity risk is defined as the riskof executing a financial transaction below fair market value or not being able to execute the transaction at all within a specific period of time. The objectiveof liquidity risk management is to maintain sufficient liquidity, and to ensure that it is readily available without endangering its value in order to avoiduncertainty related to financial distress at all times.
The Group aims to secure sufficient liquidity at all times through efficient cash management and by investing primarily in highly liquid money marketinvestments. Depending on its overall liquidity position, the Group may pre-finance or refinance upcoming debt maturities before contractual maturity dates.The transactional liquidity risk is minimized by entering into transactions where proper two-way quotes can be obtained from the market. The Group aimsto ensure flexibility in funding by maintaining committed and uncommitted credit lines. Refer to Note 23, Interest-bearing liabilities.
The following table presents an undiscounted, contractual cash flow analysis for lease liabilities, financial liabilities and financial assets that are presentedon the consolidated statement of financial position as well as commitments given and obtained, such as loan commitments and leases committed but notyet commenced. The line-by-line analysis does not directly reconcile with the consolidated statement of financial position.
EURm TotalDue within
3 monthsDue between
3 and 12 monthsDue between1 and 3 years
Due between3 and 5 years
Due beyond5 years
2020 Non-current financial assetsOther non-current financial assets(1) 188 – – 66 79 43Current financial assetsOther current financial assets excluding derivatives(1) 39 2 37 – – –Current financial investments 1 121 1 020 101 – – –Cash and cash equivalents(2) 6 944 6 618 50 70 156 50Cash flows related to derivative financial assets gross settled:
Derivative contracts – receipts 7 810 5 873 1 299 599 39 –Derivative contracts – payments (7 682) (5 813) (1 258) (573) (38) –
Trade receivables 5 802 4 674 974 154 – –Non-current financial and lease liabilitiesLong-term interest-bearing liabilities (5 920) (39) (97) (794) (2 194) (2 796)Long-term lease liabilities (750) – – (338) (220) (192)Current financial and lease liabilitiesShort-term interest-bearing liabilities (564) (552) (12) – – –Short-term lease liabilities (232) (65) (167) – – –Other financial liabilities excluding derivatives(3) (434) (420) (14) – – –Cash flows related to derivative financial liabilities gross settled:
Derivative contracts – receipts 6 926 4 870 883 525 45 603Derivative contracts – payments (6 999) (4 906) (882) (563) (35) (613)
Trade payables (3 174) (3 049) (122) (2) – (1)Commitments given and obtainedLoan commitments given undrawn(4) (180) (26) (26) (128) – –Loan commitments obtained undrawn(5) 1 482 (1) (3) (8) 1 494 –Leases committed but not yet commenced (182) (1) (3) (43) (29) (106)
(1) Other non-current financial assets and other current financial assets excluding derivatives include mainly customer financing-related loan receivables.(2) Instruments that include a call feature have been presented at their final maturities. Instruments that are contractually due beyond three months include EUR 325 million of instruments that have a call
period of less than three months.(3) Other financial liabilities include a conditional obligation to China Huaxin presented in the earliest period as the exercise period is open.(4) Loan commitments given undrawn have been included in the earliest period in which they could be drawn or called.(5) Loan commitments obtained undrawn have been included based on the period in which they expire. These amounts include related commitment fees.

Table of Contents
175
EURm Total Due within 3 months
Due between 3 and 12 months
Due between 1 and 3 years
Due between 3 and 5 years
Due beyond 5 years
2019 Non-current financial assets Other non-current financial assets(1) 252 – 3 115 54 80Current financial assetsOther current financial assets excluding derivatives(2) 53 21 32 – – –Current financial investments 97 95 2 – – –Cash and cash equivalents(3) 5 913 5 835 33 20 25 –Cash flows related to derivative financial assets gross settled:
Derivative contracts – receipts 9 660 7 582 1 993 85 – –Derivative contracts – payments (9 639) (7 548) (2 005) (86) – –
Trade receivables 5 019 3 873 1 088 58 – –Non-current financial and lease liabilitiesLong-term interest-bearing liabilities (4 990) (43) (75) (1 209) (1 113) (2 550)Long-term lease liabilities (841) – – (375) (251) (215)Current financial and lease liabilitiesShort-term interest-bearing liabilities (294) (212) (82) – – –Short-term lease liabilities (276) (81) (195) – – –Other financial liabilities excluding derivatives(4) (646) (638) (8) – – –Cash flows related to derivative financial liabilities gross settled:
Derivative contracts – receipts 11 725 9 003 828 616 86 1 192Derivative contracts – payments (11 517) (9 078) (808) (569) (43) (1 019)
Trade payables (3 786) (3 653) (111) (21) (1) –Commitments given and obtainedLoan commitments given undrawn(5) (303) (32) (77) (194) – –Loan commitments obtained undrawn(6) 1 971 499 (4) (11) (11) 1 498Leases committed but not yet commenced (160) – – (11) (23) (126)
(1) Other non-current financial assets include long-term customer and vendor financing related loan receivables as well as certain other long-term loan receivables that have been presented in other non-current financial assets in the consolidated statement of financial position. Convertible instruments are presented at their final contractual maturities.
(2) Other current financial assets excluding derivatives include short-term customer and vendor financing-related loan receivables that have been presented in other financial assets in the consolidatedstatement of financial position.
(3) Instruments that include a call feature have been presented at their final maturities. Instruments that are contractually due beyond three months include EUR 77 million of instruments that have a callperiod of less than three months.
(4) Other financial liabilities include a conditional obligation to China Huaxin presented in the earliest period as the exercise period is open.(5) Loan commitments given undrawn have been included in the earliest period in which they could be drawn or called.(6) Loan commitments obtained undrawn have been included based on the period in which they expire. These amounts include related commitment fees.
37. Subsequent eventsAdjusting events after the reporting period
Debt restructuring request of an emerging market customerIn February 2021, one of the Group’s emerging market customers commenced negotiations to renegotiate its debt with the aim of avoiding insolvency.Although this event occurred after the reporting period, it confirms that the customer was credit-impaired as of December 31, 2020. As a result, the Grouprecognized an increase in the allowance for expected credit loss for loans extended to the customer of EUR 58 million in financial expenses. The Groupalso concluded that the collectability of consideration due from the customer is no longer probable resulting in adjustments in net sales, cost of sales andother operating expenses totaling EUR 34 million.
Non-adjusting events after the reporting period
Changes in organizational structureIn relation to its strategy review, Nokia adopted on January 1, 2021, a new operating model designed to better position the company for changing marketsand align with customer needs. The new operating model includes four reportable segments aligned with customer buying behavior: (i) Mobile Networks,(ii) Network Infrastructure, (iii) Cloud and Network Services and (iv) Nokia Technologies. In addition, segment-level information for Group Common andOther is presented. The new operating model is optimized for better accountability and transparency, increased simplicity and improved cost-efficiency.
Bond redemptionIn January 2021, Nokia exercised its issuer call option to redeem 1.00% Senior Notes due March 2021 for the full amount of EUR 350 million. Theredemption date for the notes was February 15, 2021.

Table of Contents
176
Reports of independent registered public accountingfirmsReport of independent registered public accounting firmTo the shareholders and the Board of Directors of Nokia Corporation.
Opinion on the Financial StatementsWe have audited the accompanying consolidated statement of financial position of Nokia Corporation and subsidiaries (the "Company") as of 31December 2020 and the related consolidated income statement, consolidated statement of comprehensive income, consolidated statement of changes inshareholders’ equity and consolidated statement of cash flows for the year ended 31 December 2020 and the related notes (collectively referred to as the"financial statements"). In our opinion, the financial statements present fairly, in all material respects, the financial position of the Company as of 31December 2020, and the results of its operations and its cash flows for the year ended 31 December 2020, in conformity with International FinancialReporting Standards as issued by the International Accounting Standards Board and International Financial Reporting Standards as adopted by theEuropean Union.
We have also audited, in accordance with the standards of the Public Company Accounting Oversight Board (United States) (PCAOB), the Company'sinternal control over financial reporting as of 31 December 2020 based on criteria established in Internal Control — Integrated Framework (2013) issued bythe Committee of Sponsoring Organizations of the Treadway Commission and our report dated 4 March 2021 expressed an unqualified opinion on theCompany's internal control over financial reporting.
Basis for OpinionThese financial statements are the responsibility of the Company's management. Our responsibility is to express an opinion on the Company's financialstatements based on our audit. We are a public accounting firm registered with the PCAOB and are required to be independent with respect to theCompany in accordance with the U.S. federal securities laws and the applicable rules and regulations of the Securities and Exchange Commission and thePCAOB.
We conducted our audit in accordance with the standards of the PCAOB. Those standards require that we plan and perform the audit to obtain reasonableassurance about whether the financial statements are free of material misstatement, whether due to error or fraud. Our audit included performingprocedures to assess the risks of material misstatement of the financial statements, whether due to error or fraud, and performing procedures that respondto those risks. Such procedures included examining, on a test basis, evidence regarding the amounts and disclosures in the financial statements. Ouraudit also included evaluating the accounting principles used and significant estimates made by management, as well as evaluating the overallpresentation of the financial statements. We believe that our audit provides a reasonable basis for our opinion.
Critical Audit MattersThe critical audit matters communicated below are matters arising from the current-period audit of the financial statements that were communicated orrequired to be communicated to the audit committee and that (1) relate to accounts or disclosures that are material to the financial statements and (2)involved our especially challenging, subjective, or complex judgments. The communication of critical audit matters does not alter in any way our opinion onthe financial statements, taken as a whole, and we are not, by communicating the critical audit matters below, providing separate opinions on the criticalaudit matters or on the accounts or disclosures to which they relate.
Fixed Networks goodwill - Long-Range Plan and terminal year operating profit within the goodwill valuation model— Refer to Notes 2, 4, 14 and17 to the financial statementsCritical Audit Matter DescriptionThe Company’s Goodwill arises mainly from the acquisition of Alcatel Lucent (“ALU”) and also includes amounts related to various other acquisitions. Thegoodwill balance in the Fixed Networks business group is €609 million as of 31 December 2020 and is included in the total goodwill balance of €5,074million. The Company’s evaluation of goodwill for impairment involves the comparison of the recoverable amount of each cash-generating unit (“CGU”,which generally align to the business groups) to its carrying value on at least an annual basis, in line with International Accounting Standard (“IAS”) 36Impairment of Assets.
Management’s discounted future cash flow model consists of an explicit three-year long-range plan and seven additional years of cash flow projectionsreflecting a gradual progression towards the steady state cashflow projections modeled in the terminal year. The Company’s model contains variousassumptions, including discount rates and growth rates, and is particularly sensitive to changes in operating profit, a management estimate requiringsignificant judgment. This sensitivity is especially pronounced in Fixed Networks, and the difference between the carrying amount and the fair value lesscost to sell thereof has remained low throughout 2020. Therefore, there is a risk that management’s goodwill impairment analysis utilises inappropriateoperating profit, specifically in the long-range plan years and the terminal year, for Fixed Networks, resulting in an incorrect impairment conclusion or therecognition of an impairment charge that is too low.
The evaluation of whether the operating profit, both in the long-range plan and terminal year, used by the Company to evaluate goodwill for impairmentrequired a high degree of auditor judgement and increased audit effort, including the need to involve our fair value specialists and an internal industryexpert.
How the Critical Audit Matter Was Addressed in the AuditOur audit procedures related to management’s estimate of operating profit within the long-range plan and terminal year for Fixed Networks included thefollowing, among others:

Table of Contents
177
● We tested the operating effectiveness of controls over goodwill, specifically focusing on controls related to the determination of the carrying valueand fair value as well as controls over forecasting.
● We held discussions with key members of management to understand how the forecast, including key assumptions around operating profit, wasderived.
● We utilised our fair value specialists to test the mathematical accuracy of the impairment model, review valuation assumptions, and challengecertain estimates and judgments used in valuing Fixed Networks (including discount rate, terminal growth rates, peer company selection, amongothers).
● We challenged forecasted operating profit within the terminal year used in estimating the fair value by comparing to (1) historical and forecastedpeer company data, (2) historical actual results, and (3) prior period internal forecasts. As operating profit within the long-range plan years is a keyinput into the determination of operating profit within the terminal year, we also performed these procedures on operating profit within the long-range plan years.
● We read analyst reports to identify supporting or contradictory information in relation to management’s operating profit assumptions. Allcontradictory information was evaluated and incremental inquiries were performed.
● We challenged certain of management’s forecasting assumptions based on information provided by an internal industry expert about the outlookfor the industry in which Fixed Networks operates.
● We performed a year-over-year trend analysis of forecasted operating profit at the business unit level for Fixed Networks, which is one level belowthe business group, investigating changes that were potentially inconsistent with our understanding of the business.
Revenue recognition - Determination of standalone selling prices in Nokia Networks and Nokia Software — Refer to Notes 2, 4, and 7 to thefinancial statementsCritical Audit Matter DescriptionThe Company recognises revenue in accordance with International Financial Reporting Standard 15 Revenue from Contracts with Customers fromcomplex contracts that often contain multiple performance obligations, including hardware, software, and services.
The transaction price in the contract is allocated across these performance obligations based on the standalone selling prices identified by management.This identification of standalone selling prices involves significant judgement, involves multiple inputs and calculations and has a direct impact on thetiming and amount of revenue recognised. Where there is limited history or experience of selling similar goods or services, such as with 5G equipment insome markets, there is necessarily an increased level of judgement required in making the determination.
Given the level of management judgement involved, performing audit procedures to evaluate the reasonableness of these judgements required a highdegree of auditor judgement, and given the differing inputs and calculations across contracts, there was a significant audit effort in obtaining sufficient auditevidence.
How the Critical Audit Matter Was Addressed in the AuditOur audit procedures related to the determination of standalone selling prices and the allocation of transaction price included the following, among others:
● We assessed management’s accounting policy in relation to allocation of transaction price to determine compliance with IFRS 15 Revenue fromContracts with Customers;
● We tested the operating effectiveness of controls over revenue recognition, specifically focusing on controls related to the determination ofstandalone selling prices in the largest and most complex contracts;
● We utilised data analytics to identify those contracts with higher levels of risk based on size, complexity and inclusion of new products such as 5G,where there is less objective evidence of standalone selling price. For these contracts we reviewed their terms and obtained management’saccounting conclusions to consider whether these were in line with IFRS 15;
● We evaluated the appropriateness of the estimation methods and related inputs used by management for standalone selling prices in thecontracts selected by assessing compliance with IFRS 15 and considering the nature of the performance obligations;
● We benchmarked contracts against those with similar customers or for similar transactions to challenge whether the determination of standaloneselling price was consistent across the Company;
● We tested the related inputs used by management in their standalone selling price determinations in the contracts selected by assessing evidencerelated to judgements and calculations and agreeing to supporting audit evidence; and
● We tested the arithmetic accuracy of the allocation of transaction price based on the determination of standalone selling price.
/s/ Deloitte Oy
Helsinki, Finland
March 4, 2021
We have served as the Company’s auditor since 2020.

Table of Contents
178
Report of independent registered public accounting firmTo the shareholders and the Board of Directors of Nokia Corporation.
Opinion on Internal Control over Financial ReportingWe have audited the internal control over financial reporting of Nokia Corporation and subsidiaries (the “Company”) as of 31 December 2020, based oncriteria established in Internal Control — Integrated Framework (2013) issued by the Committee of Sponsoring Organizations of the Treadway Commission(COSO). In our opinion, the Company maintained, in all material respects, effective internal control over financial reporting as of 31 December 2020, basedon criteria established in Internal Control — Integrated Framework (2013) issued by COSO.
We have also audited, in accordance with the standards of the Public Company Accounting Oversight Board (United States) (PCAOB), the consolidatedfinancial statements as of and for the year ended 31 December 2020, of the Company and our report dated 4 March 2021, expressed an unqualifiedopinion on those financial statements.
Basis for OpinionThe Company’s management is responsible for maintaining effective internal control over financial reporting and for its assessment of the effectiveness ofinternal control over financial reporting, included in the accompanying Management’s annual report on internal control over financial reporting. Ourresponsibility is to express an opinion on the Company’s internal control over financial reporting based on our audit. We are a public accounting firmregistered with the PCAOB and are required to be independent with respect to the Company in accordance with the U.S. federal securities laws and theapplicable rules and regulations of the Securities and Exchange Commission and the PCAOB.
We conducted our audit in accordance with the standards of the PCAOB. Those standards require that we plan and perform the audit to obtain reasonableassurance about whether effective internal control over financial reporting was maintained in all material respects. Our audit included obtaining anunderstanding of internal control over financial reporting, assessing the risk that a material weakness exists, testing and evaluating the design andoperating effectiveness of internal control based on the assessed risk, and performing such other procedures as we considered necessary in thecircumstances. We believe that our audit provides a reasonable basis for our opinion.
Definition and Limitations of Internal Control over Financial ReportingA company’s internal control over financial reporting is a process designed to provide reasonable assurance regarding the reliability of financial reportingand the preparation of financial statements for external purposes in accordance with generally accepted accounting principles. A company’s internalcontrol over financial reporting includes those policies and procedures that (1) pertain to the maintenance of records that, in reasonable detail, accuratelyand fairly reflect the transactions and dispositions of the assets of the company; (2) provide reasonable assurance that transactions are recorded asnecessary to permit preparation of financial statements in accordance with generally accepted accounting principles, and that receipts and expenditures ofthe company are being made only in accordance with authorizations of management and directors of the company; and (3) provide reasonable assuranceregarding prevention or timely detection of unauthorized acquisition, use, or disposition of the company’s assets that could have a material effect on thefinancial statements.
Because of its inherent limitations, internal control over financial reporting may not prevent or detect misstatements. Also, projections of any evaluation ofeffectiveness to future periods are subject to the risk that controls may become inadequate because of changes in conditions, or that the degree ofcompliance with the policies or procedures may deteriorate.
/s/ Deloitte Oy
Helsinki, Finland
March 4, 2021
Table of Contents
179
Report of independent registered public accounting firmTo the Board of Directors and shareholders of Nokia Corporation
Opinion on the Financial StatementsWe have audited the consolidated statement of financial position of Nokia Corporation and its subsidiaries (the “Company”) as of December 31, 2019, andthe related consolidated income statement, consolidated statement of comprehensive income, consolidated statement of changes in shareholders’ equityand consolidated statement of cash flows for each of the two years in the period ended December 31, 2019, including the related notes (collectivelyreferred to as the “consolidated financial statements”).
In our opinion, the consolidated financial statements present fairly, in all material respects, the financial position of the Company as of December 31, 2019,and the results of its operations and its cash flows for each of the two years in the period ended December 31, 2019 in conformity with InternationalFinancial Reporting Standards as issued by the International Accounting Standards Board and International Financial Reporting Standards as adopted bythe European Union.
Change in Accounting PrincipleAs discussed in Note 2 to the consolidated financial statements, the Company changed the manner in which it accounts for leases in 2019.
Basis for OpinionThese consolidated financial statements are the responsibility of the Company's management. Our responsibility is to express an opinion on the Company’s consolidated financial statements based on our audits. We are a public accounting firm registered with the Public Company Accounting Oversight Board (United States) (PCAOB) and are required to be independent with respect to the Company in accordance with the U.S. federal securities laws and the applicable rules and regulations of the Securities and Exchange Commission and the PCAOB.
We conducted our audits of these consolidated financial statements in accordance with the standards of the PCAOB. Those standards require that we planand perform the audit to obtain reasonable assurance about whether the consolidated financial statements are free of material misstatement, whether dueto error or fraud.
Our audits included performing procedures to assess the risks of material misstatement of the consolidated financial statements, whether due to error orfraud, and performing procedures that respond to those risks. Such procedures included examining, on a test basis, evidence regarding the amounts anddisclosures in the consolidated financial statements. Our audits also included evaluating the accounting principles used and significant estimates made bymanagement, as well as evaluating the overall presentation of the consolidated financial statements. We believe that our audits provide a reasonable basisfor our opinion.
/s/ PricewaterhouseCoopers Oy
Helsinki, Finland
March 5, 2020, except for the change in the manner in which the Company accounts for other operating income and expenses discussed in Note 2 to theconsolidated financial statements, as to which the date is March 4, 2021
We served as the Company's auditor from 1987 to 2020.

Table of Contents
180
Other informationContentsExhibits 181Glossary 182Investor information 186Contact information 187Signatures 188

Table of Contents
Exhibits
181
1 Articles of Association of Nokia Corporation (incorporated by reference to Exhibit 1 of our annual report on Form 20-F filed with theSecurities and Exchange Commission on March 23, 2017 (File No. 1-13202)).
6 Refer to Note 13, Earnings per share, of our consolidated financial statements included in this annual report on Form 20-F, for information on how earnings per share information was calculated.
8 Refer to Note 32, Principal Group companies, of our consolidated financial statements included in this annual report on Form 20-F, formore information on our significant subsidiaries.
11 Code of Ethics.
12.1 Certification of Pekka Lundmark, President and Chief Executive Officer of Nokia Corporation, pursuant to Section 302 of the Sarbanes-Oxley Act of 2002.
12.2 Certification of Marco Wiren, Group Chief Financial Officer of Nokia Corporation, pursuant to Section 302 of the Sarbanes-Oxley Act of 2002.
13 Certification, pursuant to 18 U.S.C. Section 1350, as adopted pursuant to Section 906 of the Sarbanes-Oxley Act of 2002.
15.1 Consent of Deloitte Oy.
15.2 Consent of PricewaterhouseCoopers Oy.
101 Interactive Data Files (XBRL – Related Documents).

Table of Contents
Glossary
182
2G (Second Generation Mobile Communications): Also known as GSM (Global System for Mobile Communications): A digital system for mobilecommunications that is based on a widely-accepted standard and typically operates in the 900 MHz, 1800 MHz and 1900 MHz frequency bands.
3G (Third Generation Mobile Communications): The third generation of mobile communications standards designed for carrying both voice and datagenerally using WCDMA or close variants. See also WCDMA.
3GPP (The Third Generation Partnership Project): A consortium comprising several standards organizations which develop protocols for mobiletelecommunications. The initial goal was to develop a global technical specification for a 3G mobile phone system. Since then, the operations have beenextended and today the main focus is on 5G networks.
4G (Fourth Generation Mobile Communications): The fourth generation of mobile communications standards based on LTE, offering IP dataconnections only and providing true broadband internet access for mobile devices. See also LTE.
5G (Fifth Generation Mobile Communications): The next major phase of mobile telecommunications standards. 5G is a complete redesign of networkarchitecture with the flexibility and agility to support upcoming service opportunities. It delivers higher speeds, higher capacity, extremely low latency andgreater reliability.
Access network: A telecommunications network between a local exchange and the subscriber station.
Airframe: Our 5G-ready, end-to-end data center solution that combines the benefits of cloud computing technologies with the requirements of the coreand radio telecommunications world. It is available in Rackmount and Open Compute Project (OCP) form factors. This enables the solution to be veryscalable: from small distributed latency-optimized data centers to massive centralized hyperscale data center deployment.
AirScale Radio Access: A 5G-ready complete radio access generation that helps operators address the increasing demands of today and tomorrow. Thesolution comprises: Nokia AirScale Base Station with multiband radio frequency elements and system modules; Nokia AirScale Active Antennas; CloudRAN with Nokia AirScale Cloud Base Station Server and the cloud-based AirScale RNC (Radio Network Controller) for 3G; Nokia AirScale Wi-Fi; commonsoftware; and services which use intelligent analytics and extreme automation to maximize the performance of hybrid networks.
Alcatel-Lucent: Alcatel-Lucent Group, that has been part of the Nokia Group since 2016.
Anyhaul: Mobile transport solution for 5G networks covering microwave, IP, optical and broadband.
Artificial Intelligence (AI): Autonomous and adaptive intelligence of machines, where machines have the ability to perform tasks in complexenvironments without constant guidance by a user and have the ability to improve performance by learning from experience.
Bandwidth: The width of a communication channel, which affects transmission speeds over that channel.
Base station: A network element in a mobile network responsible for radio transmission and reception to or from the mobile station.
Broadband: The delivery of higher bandwidth by using transmission channels capable of supporting data rates greater than the primary rate of 9.6 Kbps.
Churn: A measure of the number of customers or subscribers who leave their service provider, e.g. a mobile operator, during a given time period.
Cloud: Cloud computing is a model for enabling ubiquitous, convenient, on-demand network access to a shared pool of configurable computing resources(e.g., networks, servers, storage, applications and services) that can be rapidly provisioned and released with minimal management effort.
CloudBand: Our loud management and orchestration solutions enabling a unified cloud engine and platform for Network Functions Virtualization (NFV).See also NFV.
Common Software Foundation (CSF): As a coherent software suite, Nokia’s cloud-native Common Software Foundation is designed to deliverapplications that are hardware- and vendor-agnostic, and easy to deploy, integrate, use and upgrade.
Converged core: Wireless and fixed access convergence within the core. As we move towards a 5G standalone core, service providers will be able touse a common set of control plane functions within the core to manage both wireless and fixed user plane functions. The ability of a unified control planewill simplify operations and provide independent location, scaling and lifecycle management capabilities.
Convergence: The coming together of two or more disparate disciplines or technologies. Convergence types are e.g. IP convergence, fixed-mobileconvergence and device convergence.
Core network: A combination of exchanges and the basic transmission equipment that together form the basis for network services.
CSP: Communication service providers.
Customer Experience Management: Software suite used to manage and improve the customer experience, based on customer, device and networkinsights.
Devices & Services: Our former mobile device business, substantially all of which was sold to Microsoft.
Digital: A signaling technique in which a signal is encoded into digits for transmission.
Discontinued operations: The continuing financial effects of the HERE business and the Devices & Services business. HERE was divested to anautomotive consortium and substantially all of the Devices & Services business was sold to Microsoft.

Table of Contents
183
Ecosystem: An industry term to describe the increasingly large communities of mutually beneficial partnerships that participants such as hardwaremanufacturers, software providers, developers, publishers, entertainment providers, advertisers and ecommerce specialists form in order to bring theirofferings to market. At the heart of the major ecosystems in the mobile devices and related services industry is the operating system and the developmentplatform upon which services are built.
ETSI (European Telecommunications Standards Institute): Standards produced by the ETSI contain technical specifications laying down thecharacteristics required for a telecommunications product.
Fixed Networks: Our Fixed Networks business group provides copper and fiber access products, solutions, and services.
Fixed Wireless Access (FWA): Uses wireless networks to connect fixed locations such as homes and businesses with broadband services.
Future X: A network architecture - a massively distributed, cognitive, continuously adaptive, learning and optimizing network connecting humans, senses,things, systems, infrastructure, processes.
G.fast: A fixed broadband technology able to deliver up to 1Gbps over very short distances (for example, for in-building use, also called “Fiber-to-the-Building”). Launched in 2014, G.fast uses more frequencies and G.fast Vectoring techniques to achieve higher speeds.
Global Services: Our Global Services business group provides a broad variety of services to communication service providers and enterprises rangingfrom network infrastructure services, professional services and managed operations to network cognitive services and analytics.
GPON (Gigabit Passive Optical Network): A fiber access technology that delivers 2.5Gbps over a single optical fiber to multiple end points includingresidential and enterprise sites.
GSM (Global System for Mobile Communications): A digital system for mobile communications that is based on a widely accepted standard andtypically operates in the 900 MHz, 1800 MHz and 1900 MHz frequency bands. See also 2G.
GSM-R (GSM-Railway): An international wireless communications standard for railway communication and applications. A sub-system of European RailTraffic Management System (ERTMS), it is used for communication between train and railway regulation control centers.
HERE: A former Nokia company focused on mapping and location intelligence services, which was divested to an automotive consortium in 2015.
Internet of Things (IoT): All things such as cars, the clothes we wear, household appliances and machines in factories connected to the internet and ableto automatically learn and organize themselves.
IP (Internet Protocol): A network layer protocol that offers a connectionless internet work service and forms part of the (Transmission Control Protocol)TCP/IP protocol.
IP (Intellectual Property): Intellectual property results from original creative thought, covering items such as patents, copyright material and trademarks,as well as business models and plans.
IPR (Intellectual Property Rights): Legal rights protecting the economic exploitation of intellectual property, a generic term used to describe products ofhuman intellect, for example patents, that have an economic value.
IP/MPLS (IP Multiprotocol Label Switching): IP/MPLS is a routing technique in telecommunications networks that directs data from one node to the nextbased on short path labels rather than long network addresses, thus avoiding complex lookups in a routing table and speeding traffic flows.
IPR licensing: Generally an agreement or an arrangement where a company allows another company to use its intellectual property (such as patents,trademarks or copyrights) under certain terms.
IP/Optical Networks: Our IP/Optical Networks business group provides the key IP routing and optical transport systems, software and services to buildhigh capacity network infrastructure for the internet and global connectivity.
LTE (Long-Term Evolution): 3GPP radio technology evolution architecture and a standard for wireless communication of high-speed data. Also referredto as 4G.
Mission-critical networks/communications: One of the key elements of 5G. Mission-critical communications meets the needs of emergency responderssuch as emergency operations centers, fire departments, emergency vehicles, police, and search and rescue services, replacing traditional radio with newcommunications capabilities available to smartphone users.
Mobile broadband: Refers to high-speed wireless internet connections and services designed to be used from multiple locations.
Mobile Networks: Our Mobile Networks business group offers an industry-leading portfolio of radio access networks solutions, including 2G, 3G, 4G, 5Gand Single-RAN, microwave radio links and cloud computing hardware platforms.
MPLS: Multiprotocol Label Switching, a routing technique for networks.
MSO: Multiple System Operators (MSO) are operators of multiple cable television systems. The majority of system operators run cable systems in morethan one community and hence most of them are multiple system operators.
Networks segment: One of our three reportable segments until the end of 2020. As Nokia’s new operating model became effective on January 1, 2021,the reportable segments changed accordingly.
NFV (Network Functions Virtualization): Principle of separating network functions from the hardware they run on by using virtual hardware abstraction.
Nokia Bell Labs: Our research arm engaged in discovering and developing the technological shifts needed for the next phase of human existence as wellas exploring and solving complex problems to radically redefine networks.

Table of Contents
184
Nokia Enterprise: Recognizing the growth potential of our business within the enterprise customer segment, we created Nokia Enterprise business group,effective 1 January, 2019. It addresses the mission- and business-critical networking requirements of asset-intensive industries such as transportation,energy, manufacturing and logistics – as well as governments and cities.
Nokia Networks: Our former business focused on mobile network infrastructure software, hardware and services.
Nokia Software: Our business group and a reportable segment offering carrier-grade software applications and platforms to provide operations andbusiness support systems, build, deliver, and optimize services, enable their monetization, and to improve customer experience.
Nokia Technologies: Our business group and a reportable segment focused on advanced technology development and licensing.
Non-Standalone (NSA): Network architecture that is built over an existing 4G network.
Nuage Networks: A Nokia brand, focused on creating Software Defined Networking (SDN) solutions that simplify and automate communication serviceproviders’ cloud networks and enterprise Wide Area Networks (SD-WAN).
Operating System (OS): Software that controls the basic operation of a computer or a mobile device, such as managing the processor and memory. Theterm is also often used to refer more generally to the software within a device e.g. the user interface.
Packet: Part of a message transmitted over a packet-switched network.
Platform: Software platform is a term used to refer to an operating system or programming environment, or a combination of the two.
PON (Passive Optical Network): A fiber access architecture in which unpowered fiber optic splitters are used to enable a single optical fiber to servemultiple end-points without having to provide individual fibers between the hub and customer.
Programmable world: A world where connectivity will expand massively, linking people as well as billions of physical objects - from cars, homeappliances and smartphones, to wearables, industrial equipment and health monitors. What distinguishes the Programmable World from the Internet ofThings (IoT) is the intelligence that is added to data to allow people to interpret and use it, rather than just capture it.
PSE-3: The PSE-3 chipset is the first coherent digital signal processor to implement Probabilistic Constellation Shaping (PCS), a modulation techniquepioneered by Nokia Bell Labs.
RAN (Radio Access Network): A mobile telecommunications system consisting of radio base stations and transmission equipment.
SDAN: Software Defined Access Network.
SDN (Software-Defined Network): Decoupling of network control and data forwarding to simplify and automate connections in data centers, clouds andacross the wide area.
SD-WAN: Software-Defined Networking in a Wide Area Network (WAN) that simplifies and automates enterprise networks, seamlessly connecting usersand applications, from branch office to cloud.
SEP (Standard-Essential Patent): Generally, patents needed to produce products which work on a standard, which companies declare as essential andagree to license on Fair, Reasonable and Non-Discriminatory (FRAND) terms. Can be referred to as essential patent also.
Single RAN: Single RAN (S-RAN) allows different radio technologies to be provided at the same time from a single base station, using a multi-purposeplatform.
Small cells: Low-powered radio access nodes (micro cells or picocells) that are a vital element in handling very dense data traffic demands. 3G and LTEsmall cells use spectrum licensed by the operator; Wi-Fi uses unlicensed spectrum which is therefore not under the operator’s exclusive control.
Standalone (SA): Network architecture that allows independent operation of a 5G service without interaction with an existing 4G core and 4G radionetwork.
Technology licensing: Generally refers an agreement or arrangement where under certain terms a company provides another company with itstechnology and possibly know-how, whether protected by intellectual property or not, for use in products or services offered by the other company.
Telco cloud: Applying cloud computing, SDN and NFV principles in telecommunications environment, e.g. separating application software from underlyinghardware with automated, programmable interfaces while still retaining telecommunications requirements such as high availability and low latency.
Transmission: The action of conveying signals from one point to one or more other points.
TXLE (Technical Extra-Large Enterprise): Technically sophisticated companies, such as banks, that invest heavily in their own network infrastructures togain a key competitive advantage.
VDSL2 (Very High Bit Rate Digital Subscriber Line 2): A fixed broadband technology, the successor of ADSL. Launched in 2007, it typically delivers a30Mbps broadband service from a street cabinet (also called a “Fiber-to-the-Node” deployment) over existing telephone lines.
VDSL2 vectoring: A fixed broadband technology launched in 2011, able to deliver up to 100Mbps over a VDSL2 line by applying noise cancellationtechniques to remove cross-talk between neighboring VDSL2 lines.
Virtual Reality (VR): The simulation of a three-dimensional image or environment that can be interacted with in a seemingly real or physical way by aperson using special electronic equipment, such as a helmet with a screen inside or gloves fitted with sensors.
VoLTE (Voice over LTE): Required to offer voice services on an all-IP LTE network and generally provided using IP Multimedia Subsystem, which is anarchitectural framework designed to deliver IP-based multimedia services on telecommunications networks; standardized by 3GPP.

Table of Contents
185
WAN (Wide Area Network): A geographically distributed private telecommunications network that interconnects multiple local area networks.
WCDMA (Wideband Code Division Multiple Access): A third-generation mobile wireless technology that offers high data speeds to mobile and portablewireless devices. Also referred to as 3G.
Webscale companies: Companies - such as Google, Microsoft, and Alibaba - which are investing in cloud technology and network infrastructure on anincreasing scale to fulfill their needs for massive, mission-critical networks.
WING: Worldwide IoT Network Grid is a managed service that offers CSPs the ability to support their enterprise customers with global IoT connectivityacross borders and technologies.
WLAN (Wireless Local Area Network): A local area network using wireless connections, such as radio, microwave or infrared links, in place of physicalcables.

Table of Contents
Investor information
186
Information on the internetwww.nokia.com
Available on the internet: financial reports, members of the Group Leadership Team, other investor-related materials and events, and press releases aswell as environmental and social information, including our Sustainability Report, Code of Conduct, Corporate Governance Statement and RemunerationStatement.
SEC maintains an internet site that contains reports, proxy and information statements, and other information regarding issuers that file electronically withthe SEC (http://www.sec.gov).
Investor Relations [email protected]
Annual General MeetingDate: April 8, 2021
Place: Espoo, Finland
DividendThe Board proposes to the Annual General Meeting that no dividend be paid for the financial year 2020.
Financial reportingOur interim reports in 2021 are planned to be published on April 29, 2021, July 29, 2021 and October 28, 2021. The full-year 2021 results are plannedto be published in February 2022.
Information published in 2020All our global press releases and statements published in 2020 are available on the internet at www.nokia.com/en_int/news/releases.
Stock exchangesThe Nokia Corporation share is quoted on the following stock exchanges:
SymbolTrading
currency
Nasdaq Helsinki (since 1915) NOKIA EURNew York Stock Exchange (since 1994) NOK USDEuronext Paris (since 2015) NOKIA EUR
Documents on displayThe documents referred to in this annual report on Form 20-F can be read at the Securities and Exchange Commission’s internet site athttp://www.sec.gov.

Table of Contents
Contact information
187
Nokia Head OfficeKarakaari 7
FI-02610 Espoo, FinlandFINLAND
Tel. +358 (0) 10 44 88 000Fax +358 (0) 10 44 81 002
Table of Contents
Signatures
188
The registrant hereby certifies that it meets all of the requirements for filing on Form 20-F and that it has duly caused and authorized the undersigned tosign this annual report on Form 20-F on its behalf.
Nokia Corporation
By: /S/ STEPHAN PROSIName: Stephan ProsiTitle: Vice President, Corporate Controlling and Accounting
By: /S/ ESA NIINIMÄKIName: Esa NiinimäkiTitle: Deputy Chief Legal Officer, Corporate
March 4, 2021
1 / 3 © Nokia 2018
Exhibit 11
CODE OF ETHICS
FOR THE PRINCIPAL EXECUTIVE OFFICERS AND THE SENIOR FINANCIAL OFFICERS
1 Purpose
The purpose of this Code of Ethics (the “Code”) is to reinforce ethical behavior and promote high standards of corporate governance.This Code complements Nokia’s Code of Conduct, Nokia Insider Policy and other guidelines and policies applicable at Nokia.
2 Applicability
The Code applies to Nokia’s President and Chief Executive Officer, Chief Financial Officer, Deputy Chief Financial Officer andCorporate Controller (the “Officers”).
3 Good corporate practices
3.1 Honest and ethical conduct
The Officers shall act honestly and ethically in all their business activities in their respective roles. They shall comply with andpromote compliance with the highest standards of ethical conduct, including the principles set out in Nokia’s Code of Conduct, inall their business activities at Nokia.
3.2 Conflicts of interest
Situations involving an actual or apparent conflict of interest between personal and professional relationships of the Officers withNokia, or any doubt thereof, shall be handled in an ethical way. An Officer shall not participate in consideration of a matter inwhich he/she has a conflict of interest or even a perceived conflict of interest between his/her personal and professionalrelationships with respect to Nokia.
For the avoidance of doubt, the Officers shall comply with the provisions on conflicts of interest included in various Nokiaguidelines and policies (e.g., Nokia Insider Policy, Conflict of Interest Policy and external board membership related standardoperating procedures).
2 / 3 © Nokia 2018
3.3 Fair and timely disclosure
The Officers shall take all measures generally required from a prudent principal executive officer or senior financial officer,including measures in accordance with Nokia’s disclosure controls and procedures, to promote full, fair, accurate, timely andunderstandable disclosure in reports and documents filed with or submitted to financial and regulatory authorities or stockexchanges by Nokia.
3.4 Compliance with laws and regulations
The Officers shall comply in all their business activities in their respective roles with all applicable governmental laws, rules andregulations of Finland and other applicable jurisdictions, as well as the rules of stock exchanges on which Nokia shares are listed,including the New York Stock Exchange. These obligations include cooperating, appropriately, with governmental investigationsof Nokia’s business and operations.
4 Accountability
4.1 Clearances
Nokia regards adherence to this Code as well as accountability for such adherence as important.
The Chief Compliance Officer may, upon request, advise the Officers whether a particular situation or behavior is in compliancewith this Code or not, and give a clearance for a situation or behavior that is obviously and evidently compliant. Thedetermination whether a conflict of interest exists or not, shall be made by the Chief Compliance Officer or, upon the request ofthe Officer or the Chief Compliance Officer, by the Chair of the Audit Committee.
4.2 Reporting of illegal or unethical behavior
Any suspected failures to adhere to, and suspected violations of this Code by any of the Officers, shall be reported to the ChiefCompliance Officer or to the Chair of the Audit Committee. Except for such matters that are beyond question frivolous, each suchmatter shall be reviewed and considered by the Audit Committee. The matter shall be prepared for such consideration by theChief Compliance Officer or another officer as instructed by the Audit Committee.
4.3 Violations
The Audit Committee shall consider and determine if a violation of this Code has occurred, and possible consequences, if any, forsuch violation. The consequences may vary from a

3 / 3 © Nokia 2018
written reprimand to a recommendation to the corporate body entitled to discharge the Officer in question to discharge him/herfrom his/her duties, and may include other measures that the Audit Committee deems appropriate, depending on thecircumstances of the case.
4.4 Recording
The Chief Compliance Officer shall keep records of all clearances given by him/her or the Vice Chair of the Board, as well as ofall reports made under this Code on suspected failures by the Officers to adhere to the Code or suspected violations thereof. Inaddition, records shall be kept on all decisions taken by the Audit Committee in respect of matters considered under this Code.
5 Assignments
The Audit Committee may authorize its Chair to resolve a specific matter, or a specific category of matters, under this Code.
Any reference to the Chief Compliance Officer in this Code is equally applicable to his/her deputy.
6 Waivers
Any waiver of this Code may be made only by the Audit Committee and must be disclosed as set forth below.
7 Disclosure
This Code will be published on the Nokia’s website. Amendments to, and waivers of, this Code will be disclosed in a similar way.
8 Approval and amendments
This Code is approved, and may be amended, by the Board of Directors of Nokia.

Exhibit 12.1
CERTIFICATION
I, PEKKA LUNDMARK, certify that:
1. I have reviewed this annual report on Form 20-F of Nokia Corporation;
2. Based on my knowledge, this report does not contain any untrue statement of a material fact or omit to state a material fact necessaryto make the statements made, in light of the circumstances under which such statements were made, not misleading with respect tothe period covered by this report;
3. Based on my knowledge, the financial statements, and other financial information included in this report, fairly present in allmaterial respects the financial condition, results of operations and cash flows of the company as of, and for, the periods presented inthis report;
4. The company’s other certifying officer and I are responsible for establishing and maintaining disclosure controls and procedures (asdefined in Exchange Act Rules 13a-15(e) and 15d-15(e)) and internal control over financial reporting (as defined in Exchange ActRules 13a-15(f) and 15d-15(f)) for the company and have:
a. Designed such disclosure controls and procedures, or caused such disclosure controls and procedures to be designed under oursupervision, to ensure that material information relating to the company, including its consolidated subsidiaries, is made knownto us by others within those entities, particularly during the period in which this report is being prepared;
b. Designed such internal control over financial reporting, or caused such internal control over financial reporting to be designedunder our supervision, to provide reasonable assurance regarding the reliability of financial reporting and the preparation offinancial statements for external purposes in accordance with generally accepted accounting principles;
c. Evaluated the effectiveness of the company’s disclosure controls and procedures and presented in this report our conclusionsabout the effectiveness of the disclosure controls and procedures, as of the end of the period covered by this report based onsuch evaluation; and
d. Disclosed in this report any change in the company’s internal control over financial reporting that occurred during the periodcovered by the annual report that has materially affected, or is reasonably likely to materially affect, the company’s internalcontrol over financial reporting; and
5. The company’s other certifying officer and I have disclosed, based on our most recent evaluation of internal control over financialreporting, to the company’s auditors and the audit committee of the company’s board of directors (or persons performing theequivalent functions):
a. All significant deficiencies and material weaknesses in the design or operation of internal control over financial reporting whichare reasonably likely to adversely affect the company’s ability to record, process, summarize and report financial information;and
b. Any fraud, whether or not material, that involves management or other employees who have a significant role in the company’sinternal control over financial reporting.
Date: March 4, 2021
/s/ PEKKA LUNDMARKPEKKA LUNDMARKPresident and Chief Executive Officer
Exhibit 12.2
CERTIFICATION
I, MARCO WIRÉN, certify that:
1. I have reviewed this annual report on Form 20-F of Nokia Corporation;
2. Based on my knowledge, this report does not contain any untrue statement of a material fact or omit to state a material fact necessaryto make the statements made, in light of the circumstances under which such statements were made, not misleading with respect tothe period covered by this report;
3. Based on my knowledge, the financial statements, and other financial information included in this report, fairly present in allmaterial respects the financial condition, results of operations and cash flows of the company as of, and for, the periods presented inthis report;
4. The company’s other certifying officer and I are responsible for establishing and maintaining disclosure controls and procedures (asdefined in Exchange Act Rules 13a-15(e) and 15d-15(e)) and internal control over financial reporting (as defined in Exchange ActRules 13a-15(f) and 15d-15(f)) for the company and have:
a. Designed such disclosure controls and procedures, or caused such disclosure controls and procedures to be designed under oursupervision, to ensure that material information relating to the company, including its consolidated subsidiaries, is made knownto us by others within those entities, particularly during the period in which this report is being prepared;
b. Designed such internal control over financial reporting, or caused such internal control over financial reporting to be designedunder our supervision, to provide reasonable assurance regarding the reliability of financial reporting and the preparation offinancial statements for external purposes in accordance with generally accepted accounting principles;
c. Evaluated the effectiveness of the company’s disclosure controls and procedures and presented in this report our conclusionsabout the effectiveness of the disclosure controls and procedures, as of the end of the period covered by this report based onsuch evaluation; and
d. Disclosed in this report any change in the company’s internal control over financial reporting that occurred during the periodcovered by the annual report that has materially affected, or is reasonably likely to materially affect, the company’s internalcontrol over financial reporting; and
5. The company’s other certifying officer and I have disclosed, based on our most recent evaluation of internal control over financialreporting, to the company’s auditors and the audit committee of the company’s board of directors (or persons performing theequivalent functions):
a. All significant deficiencies and material weaknesses in the design or operation of internal control over financial reporting whichare reasonably likely to adversely affect the company’s ability to record, process, summarize and report financial information;and
b. Any fraud, whether or not material, that involves management or other employees who have a significant role in the company’sinternal control over financial reporting.
Date: March 4, 2021
/s/ MARCO WIRÉNMARCO WIRÉNChief Financial Officer
Exhibit 13
CERTIFICATION PURSUANT TO18 U.S.C. SECTION 1350,
AS ADOPTED PURSUANT TOSECTION 906 OF THE SARBANES-OXLEY ACT OF 2002
In connection with the annual report on Form 20-F of Nokia Corporation (the “Company”) for the period endingDecember 31, 2020, as filed with the Securities and Exchange Commission on the date hereof (the “Report”), theundersigned hereby certify that to the best of our knowledge:
1. The Report fully complies with the requirements of Section 13(a) or 15(d) of the Securities Exchange Act of 1934; and
2. The information contained in the Report fairly presents, in all material respects, the financial condition and results ofoperations of the Company.
/s/ PEKKA LUNDMARKName: PEKKA LUNDMARKTitle: President and Chief Executive Officer
Date: March 4, 2021 /s/ MARCO WIRÉNName: MARCO WIRÉNTitle: Chief Financial Officer

Exhibit 15.1
CONSENT OF DELOITTE OY
We consent to the incorporation by reference in Registration Statement Nos. 333-253253, 333-236903, 333-230467, 333-223848 and 333-187096 on Form S-8 of our reports dated 4 March 2021, relating to the financial statements of NokiaCorporation and the effectiveness of Nokia Corporation’s internal control over financial reporting appearing in this AnnualReport on Form 20-F for the year ended 31 December 2020.
/s/ Deloitte Oy
Deloitte OyHelsinki, FinlandMarch 4, 2021

Exhibit 15.2
CONSENT OF PRICEWATERHOUSECOOPERS OY
We hereby consent to the incorporation by reference in the Registration Statements on Form S-8 (Nos. 333-253253, 333-236903, 333-230467, 333-223848, and 333-187096) of Nokia Corporation of our report dated March 5, 2020, except forthe change in the manner in which the Company accounts for other operating income and expenses discussed in Note 2 tothe consolidated financial statements, as to which the date is March 4, 2021, relating to the consolidated financialstatements, which appears in this Form 20-F.
/s/ PricewaterhouseCoopers Oy
PricewaterhouseCoopers OyHelsinki, FinlandMarch 4, 2021