Embed Size (px)
Citation preview

Nokia Mobile Phones
is Europe’s largest and the
world’s second-largest manu-
facturer of mobile phones with
products for all the major dig-
ital and analog systems.
Nokia’s phones are sold in ap-
proximately 100 countries.
Nokia Consumer and
Industrial Electronics’
product range comprises
home entertainment prod-
ucts, including televisions,
VCRs, cable and satellite re-
ceivers and systems, PC
monitors for demanding
professional users, audio
systems and other electron-
ics for the automotive in-
dustry, as well as mobile
phone chargers.
Nokia Cables and Machinery
manufactures optical and copper cables for
telecommunications, power, rubber and in-
stallation cables, optical ground wires, radio
frequency and automation cables, and cable
machinery.
Contents
2 Highlights
3 Nokia 1994
4 Review by the President and CEO
6 Nokia Telecommunications
10 Nokia Mobile Phones
14 Nokia Consumer and Industrial Electronics
16 Cables and Machinery
18 Other Operations
19 Nokia Research Center
Financial Statements
20 Review by the Board of Directors
25 Consolidated Profit and
Loss Account, IAS
26 Consolidated Balance Sheet, IAS
27 Consolidated Cash Flow Statement, IAS
28 Reconciliation between Financial
Statements under FAS and IAS
29 Consolidated Profit and
Loss Account, FAS
30 Consolidated Balance Sheet, FAS
32 Consolidated Cash Flow Statement, FAS
33 Notes to the Financial Statements
50 Profit and Loss Account,
Parent Company, FAS
51 Cash Flow Statement,
Parent Company, FAS
52 Consolidated Balance Sheet,
Parent Company, FAS
54 Proposal of the Board to
the Annual General Meeting
55 Auditor’s Report
56 U.S. GAAP
58 Nokia 1990–1994, IAS
60 Nokia 1990–1994, FAS
61 Calculation of Key Ratios
62 Board of Directors,
Group Executive Board and Auditors
64 Organization
66 Data on Nokia Shares
71 Addresses
1

Highlights
In July Nokia became the first Finnish company to be listed on the New York StockExchange, and at the same time launched a FIM 2.5 billion international share issue.
Nokia signed a broad cooperation agreement with NYNEX CableComms England.Over the next six years, it will supply NYNEX with telecom network systems valued atabout FIM 900 million.
GSM expanded to the Asia-Pacific region: Nokia supplied a GSM network to Beijingand the Philippines. In Europe, Nokia received an important GSM order from OmnitelPronto in Italy.
Nokia introduced digital cellular phones for all the digital standards used in the worldand substantially increased its production.
Nokia started selling its digital cellular phones in Japan.
Nokia introduced a new data card for use in digital wireless communications.
Nokia was the first manufacturer to launch PALplus wide-screen TVs on themarket.
The Nokia Multigraph 447X monitor was awarded “Monitor of the Year” by the Ameri-can “PC Magazine”.
Nokia wins the contract to install high-voltage power cables beneath the Suez Canal.
Nokia-Maillefer will have its largest-ever power cable factory delivery to China.
▲▲
▲▲
▲▲
▲▲
▲▲
2
Net Sales
by Business Group
22% Nokia Telecommunications
35% Nokia Mobile Phones
22% Nokia Consumer and
Industrial Electronics
16% Cables and Machinery
5% Other Operations
Personnel
by Business Group 31 Dec.
28% Nokia Telecommunications
27% Nokia Mobile Phones
23% Nokia Consumer and
Industrial Electronics
16% Cables and Machinery
6% Other Operations
1
23
4
5
6
Net Sales
by Market Area
1. 11% Finland
2. 50% Other European Union countries
3. 9% Other European countries
4. 12% North America and Mexico
5. 13% Asia/Pacific
6. 5% Other countries
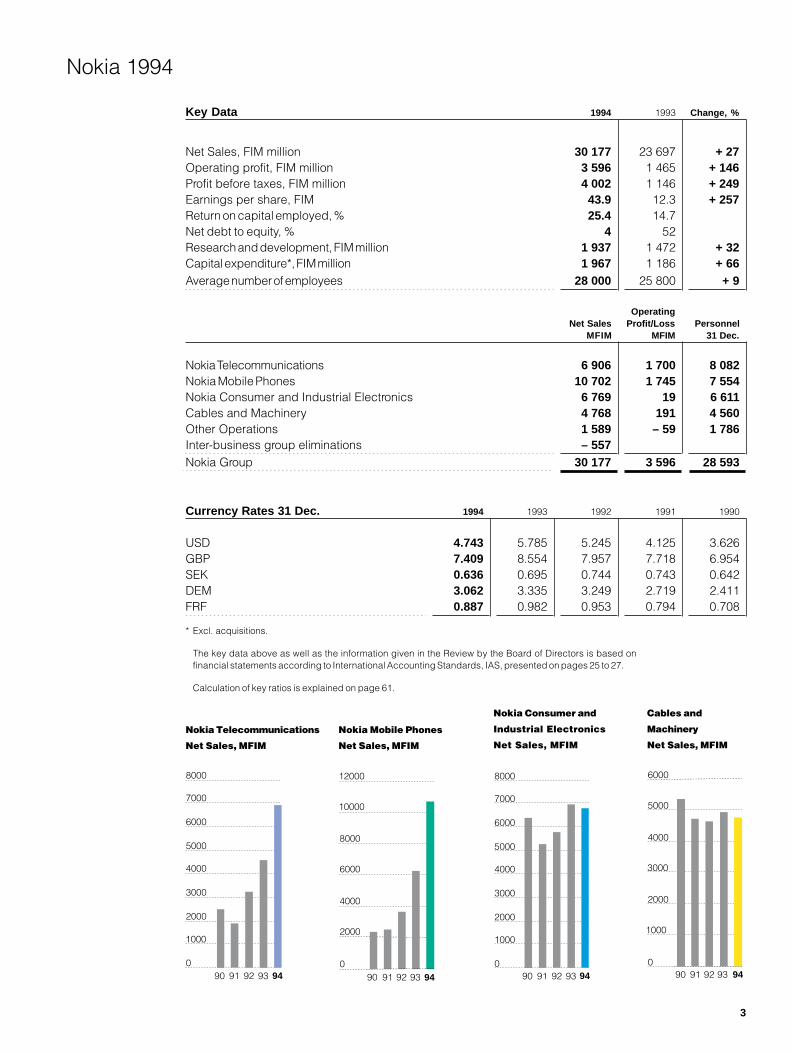
Nokia 1994
Key Data 1994 1993 Change, %
Net Sales, FIM million 30 177 23 697 + 27Operating profit, FIM million 3 596 1 465 + 146Profit before taxes, FIM million 4 002 1 146 + 249Earnings per share, FIM 43.9 12.3 + 257Return on capital employed, % 25.4 14.7Net debt to equity, % 4 52Research and development, FIM million 1 937 1 472 + 32Capital expenditure*, FIM million 1 967 1 186 + 66Average number of employees 28 000 25 800 + 9
OperatingNet Sales Profit/Loss Personnel
MFIM MFIM 31 Dec.
Nokia Telecommunications 6 906 1 700 8 082Nokia Mobile Phones 10 702 1 745 7 554Nokia Consumer and Industrial Electronics 6 769 19 6 611Cables and Machinery 4 768 191 4 560Other Operations 1 589 – 59 1 786Inter-business group eliminations – 557Nokia Group 30 177 3 596 28 593
Currency Rates 31 Dec. 1994 1993 1992 1991 1990
USD 4.743 5.785 5.245 4.125 3.626GBP 7.409 8.554 7.957 7.718 6.954SEK 0.636 0.695 0.744 0.743 0.642DEM 3.062 3.335 3.249 2.719 2.411FRF 0.887 0.982 0.953 0.794 0.708
* Excl. acquisitions.
The key data above as well as the information given in the Review by the Board of Directors is based onfinancial statements according to International Accounting Standards, IAS, presented on pages 25 to 27.
Calculation of key ratios is explained on page 61.
Nokia Telecommunications
Net Sales, MFIM
Nokia Mobile Phones
Net Sales, MFIM
90 91 92 93 940
2000
4000
6000
8000
10000
12000
90 91 92 93 940
1000
2000
3000
4000
5000
6000
7000
8000
Nokia Consumer and
Industrial Electronics
Net Sales, MFIM
Cables and
Machinery
Net Sales, MFIM
90 91 92 93 940
1000
2000
3000
4000
5000
6000
90 91 92 93 940
1000
2000
3000
4000
5000
6000
7000
8000
3
With the third year ofNokia’s turnaround nowbehind us, we can lookon 1994’s results withpride. Our efforts to fur-ther develop our telecom-munications sector, re-focus our energies on ourcore competencies andstrengthen the Group’sshared values are nowbearing fruit.
REVIEW BY THE PRESIDENT AND CEO
Accepting the Challenge of Growth
The increasing popularity of mobile
communications together with the on-
going liberalisation of telecommunica-
tions markets continued to offer oppor-
tunities for Nokia. Our Mobile Phones
and Telecommunications business
groups reported growth rates of over
50%, leading to a rise in the company’s
total share of net sales attributable to
telecommunications to 64%.
In Nokia’s other industries, efforts
continued to improve efficiency and
competitiveness. Nokia Consumer and
Industrial Electronics, following decisive
restructuring moves, reported positive
results for 1994 in sharp contrast to a
loss of over FIM 700 million a year ear-
lier. This impressive achievement by the
business group and its personnel dem-
onstrates how renewed commitment
and adopting new ways of operating
can lead to a marked turnaround.
Our Cables and Machinery busi-
ness group also made important
progress in preparation for intensifying
competition faci
has trimmed ope
area of activity w
principal busine
Globalisation co
Nokia became a
company in 199
the New York St
significant step
nancing strateg
expanding geog
operations. Last
4
ng it. In recent years, it
rations outside its core
hile strengthening its
ss units.
ntinues
more globally-oriented
4. The July listing on
ock Exchange was a
for the company’s fi-
y and a reflection of the
raphical scope of our
year, our domestic
market accounted for only eleven per-
cent of net sales. Though Europe con-
tinues to be our major market, our fast-
est growth took place in North America
and the Asia-Pacific region. Due to our
expanded global presence, we are no
longer dependent on the development
of any single market.
As liberalisation in telecommunica-
tions continues, competition is tighten-
ing among network operators as well
as equipment manufacturers and im-
pacting on the roles of both. Our opera-
tor customers are increasingly focusing
on creating new services to satisfy the
growing requirements of their own cus-
tomers while transferring some of their
traditional functions to the care of oth-
ers. This is placing additional chal-
lenges on equipment manufacturers like
Nokia. In addition to offering new tech-
nologies, it is necessary for us to render
rapid and continuous support through-
out all phases of network building and
development. In the long-term, it is
therefore paramount that we maintain
our competitiveness both in technology
as well as know-how in network serv-
ices.
Common values are the foundation
of operation
Growth in Nokia’s telecommunications
activities has averaged 50% annually
for the past few years and remains
strong. Our expanding operations com-
bined with our commercial successes
have established us as one of the
world’s leading companies in this field.
Along with this growth has also been a
parallel escalation in the number of our
personnel. In 1994, Nokia hired ap-
proximately 6000 new employees, lift-
ing our total to 28,600. We expect this
to continue in 1995. Indeed, managing
the growth of our company is emerging
as one of the most important chal-
lenges we face in the years ahead. Our
success in this endeavour is largely de-
pendent upon how well our new em-
ployees internalise our company’s val-
ues: Customer Satisfaction, Respect
for the Individual, Achievement and
Continuous Learning.
It is essential that we have a solid,
common foundation for our operations.
Nokia’s orientation will continue to be-
come more global. As this process
moves forward, the importance of com-
municating our values to our personnel
increases. True globalisation requires
that we all think in new ways, which in
turn, necessitates that we broaden our
own intellect. The Nokia Way, which
has drawn much from the Finnish cul-
ture, will have new resonance in the fu-
ture. Our values will endure with their
content enriched.
Despite our growth, we must pre-
serve our challenger spirit and maintain
our humility. Rapid decision making,
flexibility and innovativeness – tradition-
ally strong features of Nokia – must not
be buried in bureaucracy and its fix-
tures which inhibit creativity.
We should recognize, however,
that our growth will change our opera-
tions. Maintaining decentralised deci-
sion-making, further developing our
business processes and remaining
aware of our objectives will ensure that
we continue to rapidly respond to our
customers’ needs.
Increased investment in our people
In order to cope with increasing com-
petition in the future, we will continue
to invest in our people. As a Group, we
must examine how we can better ex-
ploit our core competencies; as indi-
viduals, we must consider ways to im-
prove our own expertise. Last year we
introduced the theme “Excellence in
Performance”. Recognising that
strengthening our corporate culture and
developing our way of operating is a
continuous process, we will carry on
with this theme in 1995.
In 1994, Nokia conducted a global
employee survey which, among other
things, examined our ability to impart
our company’s values. The results were
encouraging when compared to our in-
dustry peers, though shortcomings
were also identified. We still have room
for improvement when it comes to our
communication skills. I consider it,
therefore, a challenge for all of us – my-
self included – that in 1995 we shall re-
solve to improve in this area.
The rapid changes we are witness-
ing today call for a new style of leader-
ship. This year, we shall invest more
than ever in our management. A leader
must assume the role of a coach, with
the responsibility to encourage each
player to develop to the best of his or
her abilities while building a team that
aspires to excellence.
Achieving success in a knowledge-
intensive business requires the courage
and ability to perceive changes and
make sound decisions. We are masters
of our own destiny.
Jorma Ollila
5
Nokia Telecommunications is a global leader in tele-communications technology. Its focus is on the devel-opment and production of systems used in mobile andfixed networks.
Liberalisation Spreads in TelecommunicationsNOKIA TELECOMMUNICATIONS
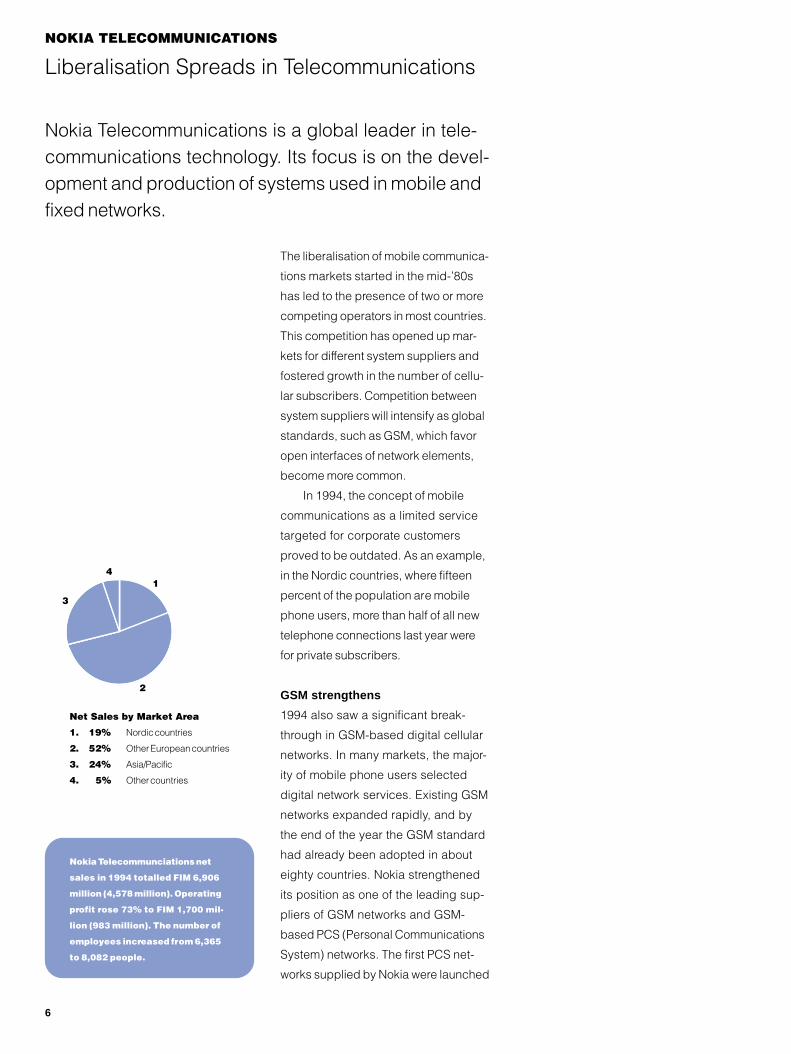
Net Sales by Market Area
1. 19% Nordic countries
2. 52% Other European countries
3. 24% Asia/Pacific
4. 5% Other countries
1
2
3
4
Nokia Telecommunciations net
sales in 1994 totalled FIM 6,906
million (4,578 million). Operating
profit rose 73% to FIM 1,700 mil-
lion (983 million). The number of
employees increased from 6,365
to 8,082 people.
6
The liberalisation of mobile communica-
tions markets started in the mid-’80s
has led to the presence of two or more
competing operators in most countries.
This competition has opened up mar-
kets for different system suppliers and
fostered growth in the number of cellu-
lar subscribers. Competition between
system suppliers will intensify as global
standards, such as GSM, which favor
open interfaces of network elements,
become more common.
In 1994, the concept of mobile
communications as a limited service
targeted for corporate customers
proved to be outdated. As an example,
in the Nordic countries, where fifteen
percent of the population are mobile
phone users, more than half of all new
telephone connections last year were
for private subscribers.
GSM strengthens
1994 also saw a significant break-
through in GSM-based digital cellular
networks. In many markets, the major-
ity of mobile phone users selected
digital network services. Existing GSM
networks expanded rapidly, and by
the end of the year the GSM standard
had already been adopted in about
eighty countries. Nokia strengthened
its position as one of the leading sup-
pliers of GSM networks and GSM-
based PCS (Personal Communications
System) networks. The first PCS net-
works supplied by Nokia were launched

E-PLUS launched their network
in Berlin and several other Ger-
man cities in 1994.
NYNEX and Nokia signed a long-
term agreement enabling NYNEX
the possibility of offering its
cable TV customers advanced
telecommunications services.
Globe Telecom’s GSM network
opened in autumn 1994 in the
Philippines. The network was
built quickly following the sign-
ing of the agreement at the end
of 1993.
7

8
NOKIA TELECOMMUNICATIONS
Nokia’s DX 200 switching
system is the platform
for both fixed and mobile
network solutions which
bring added value to op-
erators competing in the
growing market for tele-
communications serv-
ices.
Antenna works form a
visible part of base
station installation in
Nokia’s total system
deliveries.
in 1994. The GSM-based DCS 1800
standard solidified its position, as it was
adopted also in Asia for PCS.
Liberalisation of fixed networks
In many countries the liberalisation of
markets is expanding to include all sec-
tors of telecommunications. In the U.K.,
companies offering local cable TV and
telephony services grew. Nokia
strengthened its position as one of the
leading suppliers of switching and
transmission systems in this rapidly de-
veloping market by signing a long-term
agreement with NYNEX CableComms
in June of 1994. Nokia also signed a
delivery agreement for digital ex-
changes and Intelligent Network sys-
tems with Sweden’s TELE2. Nokia be-
lieves that fixed telecommunications
network services will also be open to
competition in most countries by the
end of the decade. The impending lib-
eralisation of fixed networks will offer
new growth opportunities for system
suppliers like Nokia.
Other significant agreements
In January 1994, Nokia and Hewlett-
Packard announced a strategic part-
nership agreement on the develop-
ment of Intelligent Networks. The net-
work development work will take ad-
vantage of Nokia’s expertise in tele-
communication networks and Hewlett-
Packard’s know-how in Unix-based
data-processing and communications.
Intelligent Networks enable operators to
offer their customers inexpensive, ad-
vanced telecommunications services.
With GSM-based systems becom-
ing more popular and spreading be-
yond Europe, Nokia received orders for
networks from the People’s Republic of
China, the Philippines and Malaysia. At
the end of the year, Nokia also signed
an agreement with the Italian company
Omnitel Pronto on the delivery of the
first phase of a GSM network.
Application of Synchronous Digital
Hierarchy (SDH) technology became
more widespread, and Nokia received
new orders from Europe and Asia. At
the end of the year, Nokia concluded
an OEM (Original Equipment Manufac-
turer) agreement with Sweden’s
Ericsson. Under the agreement,
Ericsson can use Nokia’s SDH products
as a part of its system deliveries.
Emphasis on complete system
know-how
The growth of GSM markets remains
strong; the number of networks is ris-
ing along with new licensees and net-
works already established are being
expanded as the number of subscrib-
ers climbs. At the same time, compe-
tition among system suppliers is esca-
lating. In response to the new needs of
customers and to the new challenges
posed by competition, Nokia is invest-
ing in R&D and in customer service.
The future deregulation of fixed
networks places even greater de-
mands on the capability of equipment
suppliers to deliver complete sys-
tems. In order to meet these demands,
at the turn of the year Nokia Telecom-
munications revised the organisation of
its fixed networks business. The forma-
tion of the new Network and Access
Systems division is similar to the forma-
tion of the Cellular Systems division in
1988. Both Network and Access Sys-
tems and Cellular Systems use Nokia’s
expertise in switching systems, Intelli-
gent Networks and Network Manage-
ment, and in services provided by the
global Customer Service organisation.
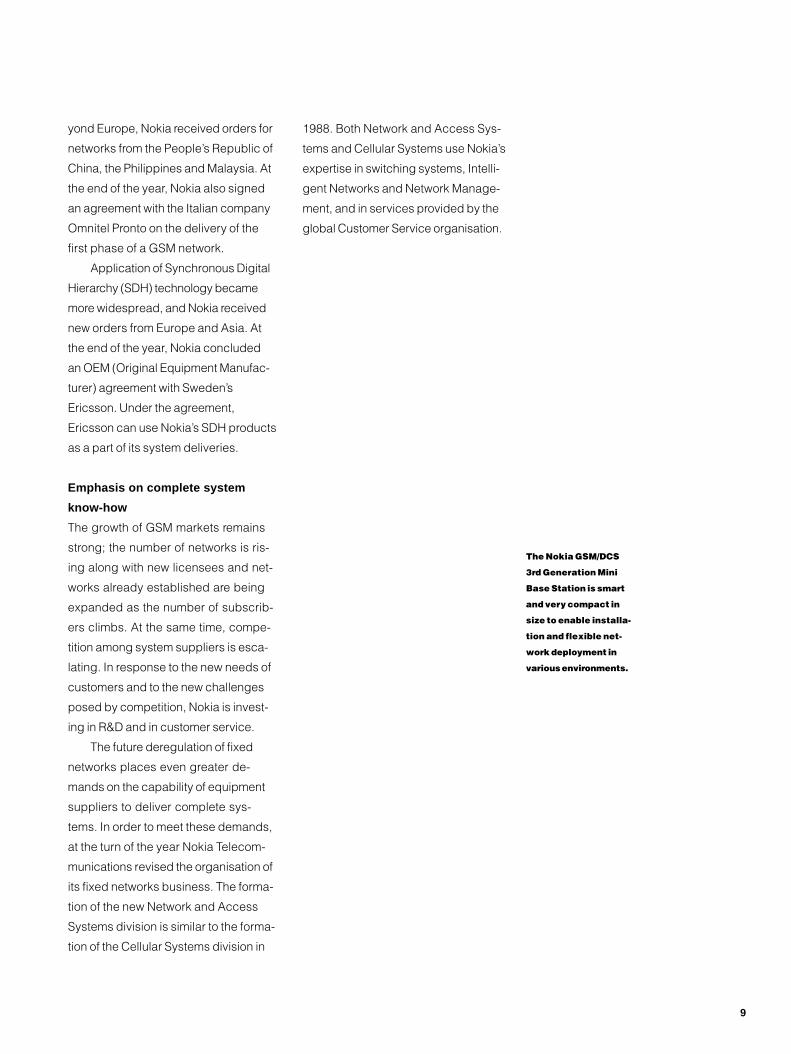
The Nokia GSM/DCS
3rd Generation Mini
Base Station is smart
and very compact in
size to enable installa-
tion and flexible net-
work deployment in
various environments.
9
NOKIA MOBILE PHONES
Growth in consumer markets
Nokia Mobile Phones is Europe’s largest and theworld’s second-largest manufacturer of mobilephones with products for all the major digital andanalog systems. Nokia’s phones are sold in approxi-mately 100 countries.
10
The number of digital
mobile phones is grow-
ing rapidly, but the
majority of the world’s
mobile phones are still
analog. Early in the year,
Nokia Mobile Phones in-
troduced the Nokia 232
handportable for the
analog AMPS and TACS
networks. It is Nokia’s
smallest and lightest
phone, weighing 185
grams when equipped
with the lightest battery.
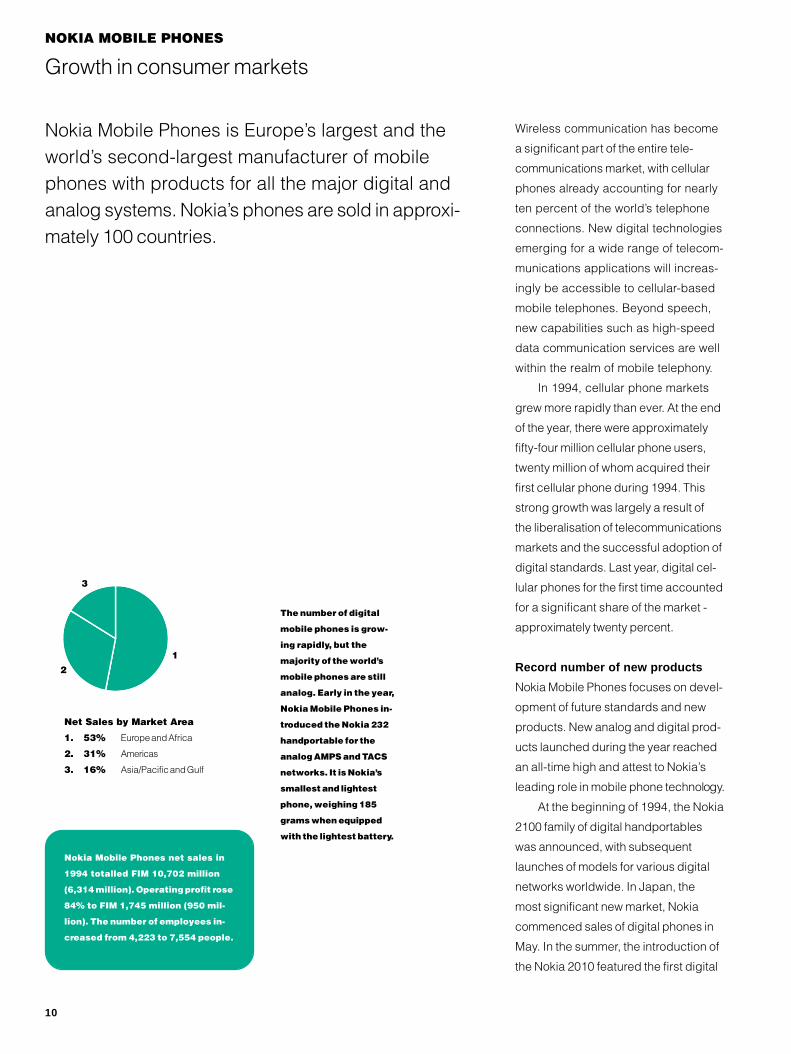
Net Sales by Market Area
1. 53% Europe and Africa
2. 31% Americas
3. 16% Asia/Pacific and Gulf
1
2
3
Nokia Mobile Phones net sales in
1994 totalled FIM 10,702 million
(6,314 million). Operating profit rose
84% to FIM 1,745 million (950 mil-
lion). The number of employees in-
creased from 4,223 to 7,554 people.
Wireless communication has become
a significant part of the entire tele-
communications market, with cellular
phones already accounting for nearly
ten percent of the world’s telephone
connections. New digital technologies
emerging for a wide range of telecom-
munications applications will increas-
ingly be accessible to cellular-based
mobile telephones. Beyond speech,
new capabilities such as high-speed
data communication services are well
within the realm of mobile telephony.
In 1994, cellular phone markets
grew more rapidly than ever. At the end
of the year, there were approximately
fifty-four million cellular phone users,
twenty million of whom acquired their
first cellular phone during 1994. This
strong growth was largely a result of
the liberalisation of telecommunications
markets and the successful adoption of
digital standards. Last year, digital cel-
lular phones for the first time accounted
for a significant share of the market -
approximately twenty percent.
Record number of new products
Nokia Mobile Phones focuses on devel-
opment of future standards and new
products. New analog and digital prod-
ucts launched during the year reached
an all-time high and attest to Nokia’s
leading role in mobile phone technology.
At the beginning of 1994, the Nokia
2100 family of digital handportables
was announced, with subsequent
launches of models for various digital
networks worldwide. In Japan, the
most significant new market, Nokia
commenced sales of digital phones in
May. In the summer, the introduction of
the Nokia 2010 featured the first digital

Nokia Mobile Phones built a new cel-
lular phone factory in Salo. The new
building is about double the size of
the production facility built in 1980.
Future needs in automated mass pro-
duction were taken into consideration in the new factory, to which the
production lines from the current Salo factory will be moved this
spring. Production in the new facilities commenced in spring 1995.
The distribution center of Nokia
Mobile Phones in Fort Worth, Texas
has moved to new premises at
the beginning of 1995. The center
supplies cellular phones primarily
for the North and South American markets. Upon completion, the sales
and distribution center will employ about 200 people. New production
facilities are being completed in the same compound, to which the cur-
rent factory will move at the end of 1995.
11

12
NOKIA MOBILE PHONES
The majority of phones made by Nokia Mo-
bile Phones are sold under the Nokia brand
name, the identity of which is promoted
through strong brand advertising.
The Nokia Cellular Data
Card enables files to be
transferred and e-mail
and telefaxes to be
sent in cellular net-
works.
handportable specifically designed for
the wider consumer market.
Over eighty percent of the world’s
cellular phones today are analog, and
analog cellular networks are expected
to remain viable well into the next cen-
tury. In 1994, Nokia substantially
updated its selection of analog phones
as well. The smallest phone Nokia has
ever produced - the Nokia 232 - was
introduced for the analog AMPS and
TACS networks. The Nokia 250, devel-
oped for the NMT 450 standard, was
launched in the Nordic countries and
Eastern Europe at the end of the year.
Also among the new products
Nokia Mobile Phones was first to intro-
duce in 1994 were cellular data cards
to support the expected strong growth
in wireless data communications in the
years ahead. The credit card-sized cel-
lular data cards connect portable com-
puters to cellular phones and allow for
the wireless transmission and reception
of e-mail, faxes, data files and text
messages.
Phones to a hundred countries
In addition to its growth in digital mar-
kets, Nokia Mobile Phones also ex-
panded its geographical focus. Mobile
phones are sold in approximately 100
countries today. In light of this expan-
sion, the company established new
sales units to strengthen its presence in
South Korea, India, Dubai, Hungary,
Belgium and Mexico. Nokia Mobile
Phones now has its own sales organi-
sation in over 20 countries.
The increasing competition among
operators and ongoing changes in dis-
tribution are having an impact on distri-
bution in several markets. In the United
States and some other countries,
increased emphasis was placed on the
Nokia brand name in 1994, long a
focus of the company’s marketing strat-
egy. The majority of phones manufac-
tured by Nokia Mobile Phones are
already sold under the Nokia brand
name, though a considerable share is
produced for major OEM (Original
Equipment Manufacturer) customers
and operators. The focus on consumer
sales and raising the recognition of the
Nokia brand are being supported by
vigorous brand advertising campaigns.
Production up at all factories
In manufacturing, all five of Nokia
Mobile Phones’ factories - in Salo,
Fort Worth, Bochum, Hong Kong and
Masan - increased production as
planned in 1994. New flexible working
arrangements in the factories had a
positive impact on the goal to increase
productivity and improve operations.
Additionally, substantial investments
were made to expand production
capacity.
A new production unit was built in
Salo, Finland, which commenced pro-
duction in January of 1995, while in
the U.S. city of Fort Worth construc-
tion was completed on a new distribu-
tion facility. By the end of 1995, the ex-
isting factory in Fort Worth will be relo-
cated to adjoin the new distribution
center. The space used for mobile
phone production at Bochum was also
expanded.
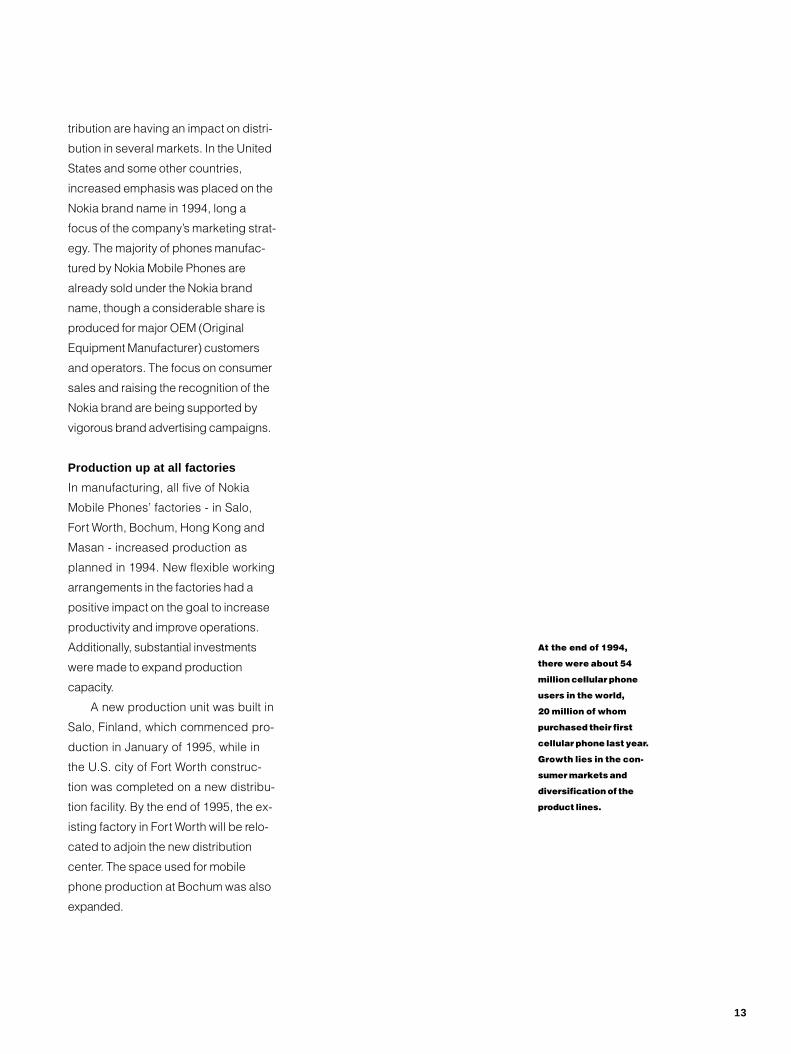
At the end of 1994,
there were about 54
million cellular phone
users in the world,
20 million of whom
purchased their first
cellular phone last year.
Growth lies in the con-
sumer markets and
diversification of the
product lines.
13

Digital Sound Processing enriches the
acoustic performance in the car. Radio,
CD-player or phone signals are digitally
corrected to compensate for and mini-
mise the influence of surrounding
noises in a moving car, and are again
converted into music and speech. The
DSP system enhances the sound qual-
ity but it also significantly improves car
safety. European car manufacturers
such as Porsche and Volkswagen have
adopted Nokia’s DSP system.
14
PALplus is a wide-screen standard
for terrestrial broadcasting intro-
duced in Europe in 1994. It resem-
bles a movie-format and allows the
viewing of movies on television
without the picture being “chopped”
or without black bars at the top and
bottom of the screen. PALplus im-
proves picture quality for consumers
and is the future-proof wide-screen
format.
The Nokia approach to product de-
sign combines complex technologies
with a sophisticated consumer-
friendly user-interface. This includes
ergonomic remote controls for tele-
visions, VCRs and satellite receiv-
ers, on-screen menus to guide the
user in adjusting settings, automatic
programming of TV-channels, prod-
uct design and user-manuals.
Nokia Consumer and Industrial Electronics’ productrange comprises home entertainment products, includ-ing televisions, VCRs, cable and satellite receivers andsystems, PC monitors for demanding professional us-ers, audio systems and other electronics for the auto-motive industry, as well as mobile phone chargers.
On the move toward a digital futureNOKIA CONSUMER AND INDUSTRIAL ELECTRONICS
In 1994 the European television market
remained at the previous year’s level
and the forecast for 1995 is for very
modest growth. Nokia’s sales in 1994
increased compared to the previous
year. The polarization of demand con-
tinued: small screen size and high-end
product segments grew, while demand
for the mid-range lost ground.
Nokia’s product range has been
adjusted to this trend. In the summer of
1994 Nokia launched its “Feature Plus”
television family for the high-end seg-
ment. The range includes both 100 Hz,
50 Hz and wide-screen products. The
user-interface of these products scored
accolades across Europe from both
consumers and the trade. In November
1994 Nokia was the first manufacturer
to launch wide-screen PALplus receiv-
ers. PALplus transmissions will be tri-
pled in 1995. In small screen sizes
Nokia introduced a new portable stereo
television.
In the cable and satellite field the
predominant issue is the move toward
a digital future. The digital market will
expand demand for cable and satellite
receivers. Nokia focuses on developing
digital products for the consumer mar-
ket, as well as strengthening ties with
partners to offer complete systems to
new service providers. Also the market
for analog satellite receivers will con-
tinue to grow over the next years, a
segment in which Nokia holds a leading
position.
The convergence of technologies
and the interactive future brings the PC
and the consumer electronics industry
together, bridging monitors and televi-
sions. Competition in the PC industry
continues to be extremely fierce. Nokia
has responded by shifting production
to bigger screen sizes and by equalis-
ing branded sales with OEM. The de-
mand for monitors continued to be
strong. Nokia successfully entered the
US market with branded monitors in
1994 and the Nokia Multigraph 447X
was awarded “Monitor of the Year” rec-
ognition by the American “PC Maga-
zine”.
Subcontractors to the European
automotive industry are shifting toward
a systems suppliers role. Nokia’s lead-
ing position as a sound systems sup-
plier was reinforced through contracts
with two new car manufacturers. At the
same time, volumes for airbag electron-
ics have increased significantly. In 1995
Nokia will continue to develop new
airbag solutions and make use of the
Group’s expertise in wireless communi-
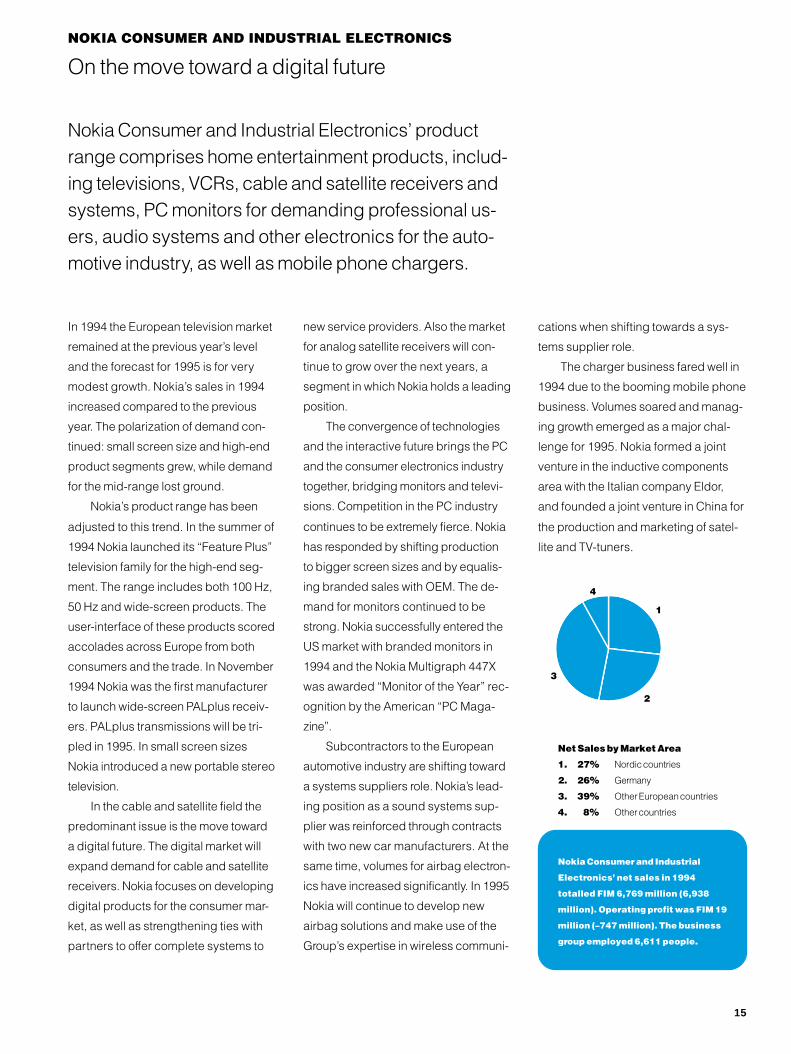
Net Sales by Market Area
1. 27% Nordic countries
2. 26% Germany
3. 39% Other European countries
4. 8% Other countries
Nokia Consumer and Industrial
Electronics’ net sales in 1994
totalled FIM 6,769 million (6,938
million). Operating profit was FIM 19
million (–747 million). The business
group employed 6,611 people.
4
1
2
3
cations when shifting towards a sys-
tems supplier role.
The charger business fared well in
1994 due to the booming mobile phone
business. Volumes soared and manag-
ing growth emerged as a major chal-
lenge for 1995. Nokia formed a joint
venture in the inductive components
area with the Italian company Eldor,
and founded a joint venture in China for
the production and marketing of satel-
lite and TV-tuners.
15

CABLES AND MACHINERY
Cables and Machinery intensifies production
Nokia Cables and Machinery manufactures opticaland copper cables for telecommunications, power,rubber and installation cables, optical ground wires,radio frequency and automation cables, and cablemachinery.
Cables and Machinery’s net sales in
1994 totalled FIM 4,768 million
(4,933 million). Operating profit was
FIM 191 million (261 million). The
business group employed 4,560
people.
1
2
3
4
5
Net Sales by Market Area
1. 20% Finland
2. 44% Other European Union countries
3. 11% Other European countries
4. 12% Asia/Pacific
5. 13% Other countries
16
Severe price competition in the cable
industry continued in 1994, while Eu-
rope’s economic recovery left overall
demand for cables unaffected. Nota-
ble exceptions were sales of optical ca-
bles and other cables requiring special-
ised expertise. Optical cable connec-
tions increased throughout the world
and the outlook for demand of other
types of cables is expected to improve.
Product responsibility redefined
Cable Industry’s customer base
decreased in 1994 primarily due to the
consolidation of the power industry
throughout Europe and the allying of
telecommunications operators. How-
ever, the European Union’s practice
of open bidding on public projects
increases the opportunities for Nokia.
In 1994, Nokia Cable Industry con-
tinued to strengthen its competitiveness
by boosting the efficiency of its produc-
tion, the division of product responsibil-
ity among its various units and by fur-
ther developing its range of products.
New product groups include RF cables,
used in cellular network exchanges,
and composite cables, which integrate
power transmission and optical fiber for
telecommunications in the same cable.
Nokia Cable Industry is a leading sup-
plier of cables in strategically important
market areas.
Nokia-Maillefer’s markets grow
Nokia-Maillefer strengthened its posi-
tion as the world’s leading supplier of
cable machinery and cable produc-
tion lines. Growth of its markets con-
tinued, and demand for power and
optical cable machinery is expected
to continue. By contrast, the demand
for machinery used in the production
of copper-based telecommunications
cables is declining.
Market development continues to
fluctuate substantially by market area.
In 1994 the strongest growth in
demand was again in Southeast Asia,
though South America is developing
into a significant cable machinery mar-
ket area. Nokia-Maillefer strengthened
its position in these areas by establish-
ing sales and service offices in China
and Brazil.

NKF, a part of Nokia Cable Industry, built the
Optopower connection between Holland and
the island of Texel.
The two three-phase composite subma-
rine cables with a 12-fiber optical element
were produced at the Delft factory.
Nokia Cables Oy and the Chinese company Cable-
Wire Group of Shanghai established a cable fac-
tory in Shanghai. The primary products of Shang-
hai Nokia Optical Cables Ltd (SNOC) are optical
cables incorporating the Spiral Space design.
The factory will start production in spring 1995.
Nokia-Maillefer will supply China with a pro-
duction facility to manufacture mainly plastic-in-
sulated medium-voltage cables. The factory will
be delivered on a turnkey basis, and equipment
deliveries are scheduled for 1995.
17
OTHER OPERATIONS
Nokia Power divested, Nokia Tyres to be floated
Other Operations in 1994 comprised Nokia Tyres, NokiaPower and Nokia Research Center among other units.
At year end, Nokia Power was sold,
for which Nokia received a profit net of
tax of FIM 760 million. In addition,
Nokia announced its intention to sell
the majority shareholding in Nokia Tyres
during 1995. After the sale, Nokia Tyres
- in which Nokia will remain a significant
minority shareholder - will be floated on
the Helsinki Stock Exchange.
Nokia Tyres is the leading tyre manu-
facturer in the Nordic countries. It de-
velops, manufactures and markets pas-
senger car and delivery van tyres,
heavy tyres, bicycle tyres and retread-
ing materials. It aspires to maintain its
leading position in all product groups in
the Nordic countries. In certain special-
ised products, such as winter tyres and
forest machinery tyres, it strives to
strengthen its position as a significant
supplier globally.
Car sales, like machinery and
equipment sales, started to grow in
1994, and development in Nokia Tyres’
main markets thus appears favourable.
In 1994 sales of passenger cars in the
Nordic countries increased 30%, which
Other Operations’ net sales in 1994
totalled FIM 1,589. They employed a
total of 1,786 people.
18
favourably affects the demand for tyres
as well.
With the supply of passenger car
tyres exceeding demand, fierce price
competition continued in 1994. Sales of
Nokia Tyres’ passenger car tyres
increased 11%, and the unit strength-
ened its position in its main market
areas.
The demand for heavy tyres grew
in all product groups and sales were
up 23%. The largest increase was in
original equipment sales to machinery
and equipment manufacturers. Favour-
able development in the bicycle indus-
try continued and even though compe-
tition intensified, Nokia Tyres boosted
its sales of bicycle tyres 12%. Thanks
to the modernisation of the Retreading
Materials’ production unit, it was possi-
ble to significantly increase the output
of retreading materials, and sales were
up 29%.
Profitability was weakened by the
strengthening of the Finnish markka as
well as by the rise in the cost of raw
materials that started at the end of
1994. In response to these challenges,
Nokia Tyres is updating its product line
while boosting production efficiency
and the quality of its products. Sales
are estimated to grow in 1995.
Nokia Research Center – Active Research Cooperation
Nokia Research Center’s mission is to enhance Nokia’stechnological competitiveness, core competencies andknowledge of new systems. Its efforts are carried out incooperation with Nokia’s business groups as well aswith universities, research institutions and telecommuni-cations companies.
Th
eration
ard, UM
System
1994. I
tivities
part to
ried ou
To date, the Research Center has co-
operated in over thirty European Union
programs and EUREKA projects. It will
participate in the forthcoming 4th Euro-
pean Framework Program.
Dating back to 1985, the Research
Center’s activities have been rapidly
growing in response to Nokia’s technol-
ogy requirements. Among its main ar-
eas of focus are fixed and mobile com-
munications systems, digital signal
processing, audio-visual signal
processing and other fields in software
development and electronics. The
number of employees in the Research
Center is approaching 400.
Strong expertise in digital
technology
In the area of GSM, the Nokia Research
Center has long been in the forefront,
having acquired substantial compe-
tence well before its widespread imple-
mentation in many parts of the world.
The success of GSM as a digital cellular
standard, service and platform technol-
ogy has been encouraging.
The Research Center will continue
its standardisation efforts and support
of open interfaces characteristic of
GSM and GSM-based technologies.
The next step in mob
communication
For the future, the are
and third-generation m
cations systems will b
Research activities in
across all technology
Research Center. In c
this, Nokia is organisi
tional program for mu
ogy in conjunction wit
tional Information High
Nokia Research Center
carries out long- and
medium-term research
and development for
Nokia’s core business
areas.
ile
as of multimedia
obile communi-
e key focuses.
to multimedia cut
areas at the Nokia
onnection with
ng a Finnish na-
ltimedia technol-
h the Finnish Na-
way Initiative.
e development of the third-gen-
mobile communications stand-
TS (Universal Mobile Telephone
), also gathered momentum in
nternational standardisation ac-
are currently underway due in
results from R&D projects car-
t with the support of the Euro-
pean Union. The Nokia Research
Center has participated in several key
projects related to UMTS and will con-
tinue to maintain an active role in its de-
velopment in the future.
19

Review by the Board of Directors
Nokia’s strategy is to invest in telecom-
munications and closely associated
business operations. It focuses on in-
dustry segments and geographic re-
gions that have good opportunities for
growth and profitability. In 1994 Nokia
continued to internationalise and to
concentrate on its core businesses.
The deregulation of telecommuni-
cations markets and the growing
number of cellular networks have cre-
ated growth opportunities for Nokia’s
telecommunications sector. The tele-
communications sector, which consists
of Nokia Telecommunications, Nokia
Mobile Phones and telecommunication
cables, generated 64% of the Group’s
FIM 30.2 billi
pared to 52%
At the tur
its Power divi
tention to sell
in Nokia Tyre
sumer and In
continued the
Tubes unit an
chinery sold u
ness. It focus
cables and c
ally, Nokia an
ment for the e
Nokia’s prefe
FINANCIAL STATEMENTS
20
on net sales in 1994 com-
of net sales in 1993.
n of the year, Nokia sold
sion and announced its in-
its majority shareholding
s during 1995. Nokia Con-
dustrial Electronics dis-
operations of its Picture
d Nokia Cables and Ma-
nits outside its core busi-
ed on its main products,
able machinery. Addition-
d ICL signed an agree-
arly redemption of
rred share interest in ICL.
Growth in North American and
Asia-Pacific markets
Nokia’s objective is to further establish
its position as a truly international tele-
communications company by continu-
ing to exploit the rapidly growing oppor-
tunities in the global telecommunica-
tions industry. During the year the
Group showed strongest growth in
North America and in the Asia-Pacific
region. These two areas accounted for
25% of the Group’s net sales; the cor-
responding figure for the previous year
was 20%. Europe remains Nokia’s larg-
est market area, and thus Finland’s de-
cision to join the European Union at the
beginning of 1995 was important for
Net Sales by Business Group 1.1. – 31.12.
1994 1993 ChangeMFIM % MFIM % %
Nokia Telecommunications 6 906 23 4 578 19 50.9Nokia Mobile Phones 10 702 36 6 314 27 69.5Nokia Consumer and Industrial Electronics 6 769 22 6 938 29 – 2.4Cables and Machinery 4 768 16 4 933 21 – 3.3Other Operations 1 589 5 1 500 6 5.9Inter-business group eliminations – 557 – 2 – 566 – 2Nokia Group 30 177 100 23 697 100 27.3
Exports from Finland and subsidiaries outside Finland 26 728 89 20 150 85 32.6
Operating Profit/Loss, IAS, 1.1. – 31.12.1994 % of 1993 % of
MFIM net sales MFIM net sales
Nokia Telecommunications 1 700 24.6 983 21.5Nokia Mobile Phones 1 745 16.3 950 15.0Nokia Consumer and Industrial Electronics 19 0.3 – 747 – 10.8Cables and Machinery 191 4.0 261 5.3Other Operations – 59 – 3.7 18 1.2
Nokia Group 3 596 11.9 1 465 6.2
Nokia. Of the Group’s 1994 net sales,
70% were generated in Europe. The
Finnish market now accounts for only
11% of net sales, compared to 15%
the previous year. Nevertheless, a size-
able share of Nokia’s telecommunica-
tions sector product development and
production operations are located in
Finland. The Group’s exports from Fin-
land increased 37%, from FIM 10 billion
to 14 billion.
Nokia continued internationalisation
of its businesses in July 1994 when it
became the first Finnish company to list
on the New York Stock Exchange. The
listing permitted the expansion of
Nokia’s foreign ownership base and in-
creases the liquidity of Nokia’s preferred
share. Nokia’s preferred shares are now
traded on five international stock ex-
changes in addition to Helsinki: New
York, London, Paris, Frankfurt and
Stockholm. In conjunction with the New
York listing, Nokia launched a share is-
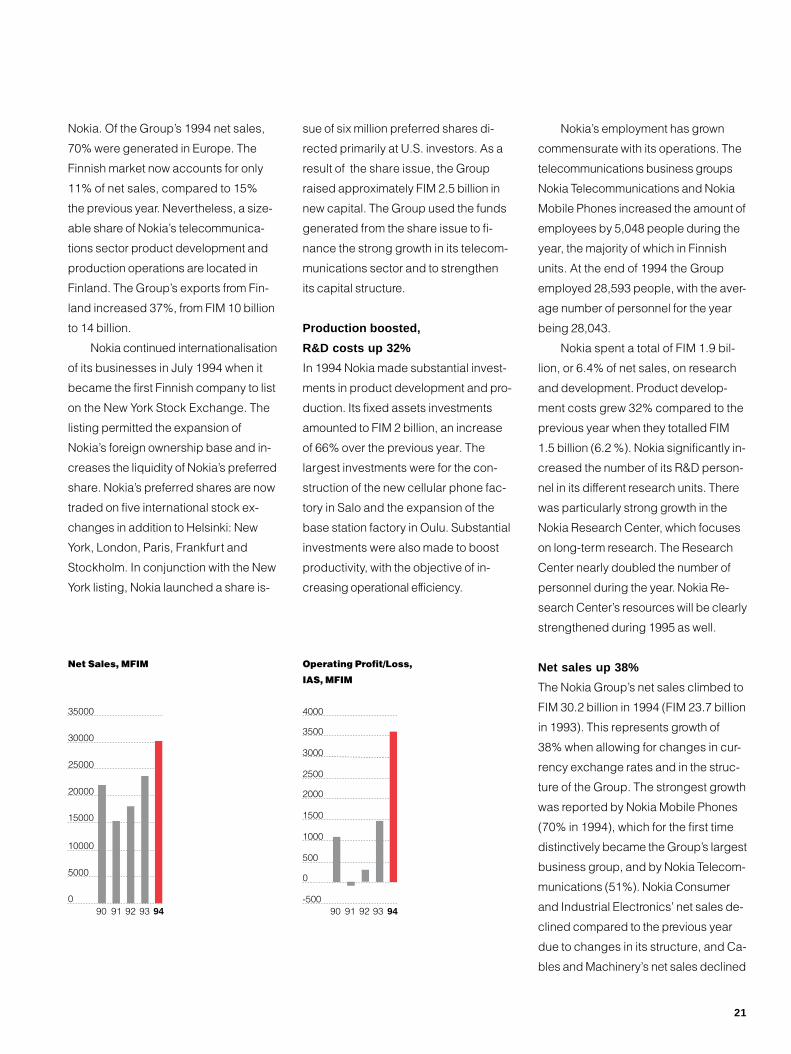
Net Sales, MFIM
90 91 92 93 940
5000
10000
15000
20000
25000
30000
35000
sue of six million preferred shares di-
rected primarily at U.S. investors. As a
result of the share issue, the Group
raised approximately FIM 2.5 billion in
new capital. The Group used the funds
generated from the share issue to fi-
nance the strong growth in its telecom-
munications sector and to strengthen
its capital structure.
Production boosted,
R&D costs up 32%
In 1994 Nokia made substantial invest-
ments in product development and pro-
duction. Its fixed assets investments
amounted to FIM 2 billion, an increase
of 66% over the previous year. The
largest investments were for the con-
struction of the new cellular phone fac-
tory in Salo and the expansion of the
base station factory in Oulu. Substantial
investments were also made to boost
productivity, with the objective of in-
creasing operational efficiency.
Operating Profit/Loss,
IAS, MFIM
90 91 92 93 94-500
0
500
1000
1500
2000
2500
3000
3500
4000
Nokia’s employment has grown
commensurate with its operations. The
telecommunications business groups
Nokia Telecommunications and Nokia
Mobile Phones increased the amount of
employees by 5,048 people during the
year, the majority of which in Finnish
units. At the end of 1994 the Group
employed 28,593 people, with the aver-
age number of personnel for the year
being 28,043.
Nokia spent a total of FIM 1.9 bil-
lion, or 6.4% of net sales, on research
and development. Product develop-
ment costs grew 32% compared to the
previous year when they totalled FIM
1.5 billion (6.2 %). Nokia significantly in-
creased the number of its R&D person-
nel in its different research units. There
was particularly strong growth in the
Nokia Research Center, which focuses
on long-term research. The Research
Center nearly doubled the number of
personnel during the year. Nokia Re-
search Center’s resources will be clearly
strengthened during 1995 as well.
Net sales up 38%
The Nokia Group’s net sales climbed to
FIM 30.2 billion in 1994 (FIM 23.7 billion
in 1993). This represents growth of
38% when allowing for changes in cur-
rency exchange rates and in the struc-
ture of the Group. The strongest growth
was reported by Nokia Mobile Phones
(70% in 1994), which for the first time
distinctively became the Group’s largest
business group, and by Nokia Telecom-
munications (51%). Nokia Consumer
and Industrial Electronics’ net sales de-
clined compared to the previous year
due to changes in its structure, and Ca-
bles and Machinery’s net sales declined
21

Review by the Board of Directors
slightly, due in part to the structural
changes carried out within the business
group.
Favourable profit trend continued
The Nokia Group’s operating profit (IAS)
increased 146% and was FIM 3,596
million (1,465 million in 1993). The op-
erating margin was 11.9% (6.2% in
1993). The continued favourable devel-
opment in the telecommunications sec-
tors as well as the distinct and positive
change in the results of Nokia Con-
sumer and Industrial Electronics con-
tributed to the increased operating
profit. Nokia Telecommunications’ op-
erating profit increased to FIM 1,700
million (983 million) and Nokia Mobile
Phones’ operating profit increased to
FIM 1,745 million (950 million). Nokia
Consumer and Industrial Electronics
also reported an operating profit of FIM
19 million compared to the previous
year when the business group reported
a loss of FIM 747 million. Cables and
Profit/Loss before Tax and
Minority Interests, IAS, MFIM
90 91 92 93 94-500
0
500
1000
1500
2000
2500
3000
3500
4000
4500
22
Machinery’s operating profit decreased
slightly and was FIM 191 million (261
million). Other Operations incurred an
operating loss of FIM 59 million (operat-
ing profit of 18 million in 1993).
The Group’s net financial items
were a gain of FIM 384 million, whereas
in the previous year they were a loss of
FIM 347 million. A reduction in net inter-
est expenses as well as exchange rate
gains of FIM 450 million contributed to
the change. The exchange rate gains
were incurred in connection with the
hedging of foreign currency flows when
the Finnish markka strengthened in
1994. Correspondingly, the weakening
of the markka in 1993 produced a FIM
134 million exchange rate loss in finan-
cial expenses. The Group’s profit before
taxes, minority interests and extraordi-
nary items (IAS) increased to FIM 4,002
million (1,146 million in 1993).
Minority shareholders’ share of
Nokia Group companies’ profits totalled
FIM 75 million (80 million). The Group’s
Liabilities and Shareholders’
equity, IAS, MFIM
90 91 92 93 940
5000
10000
15000
20000
25000
30000
Current liabilities
Long-term liabilities
Minority interest
Shareholders’ equity
taxes rose to FIM 932 million (299 mil-
lion).
The Group’s profit after taxes and
minority interests but before extraordi-
nary items was FIM 2,995 million (767
million). The profit per share was up
257% to FIM 43.89 (FIM 12.29 in
1993).
In addition to the FIM 760 million
profit net of tax incurred in the sale of
the Power business, the FIM 944 million
extraordinary item also includes, among
other things, the compensation on the
sale of the fixed assets from the dis-
continued TV picture tube factory. In
1993 the extraordinary item was an ex-
pense of FIM 1,917 million.
After extraordinary items, Nokia’s
profit for the financial period was FIM
3,939 million (a loss of 1,150 million).
Financing situation
clearly improved
The Group’s financing situation contin-
ued to improve during 1994 due to the
Net Debt to Equity, %
90 91 92 93 940
10
20
30
40
50
60
70
80
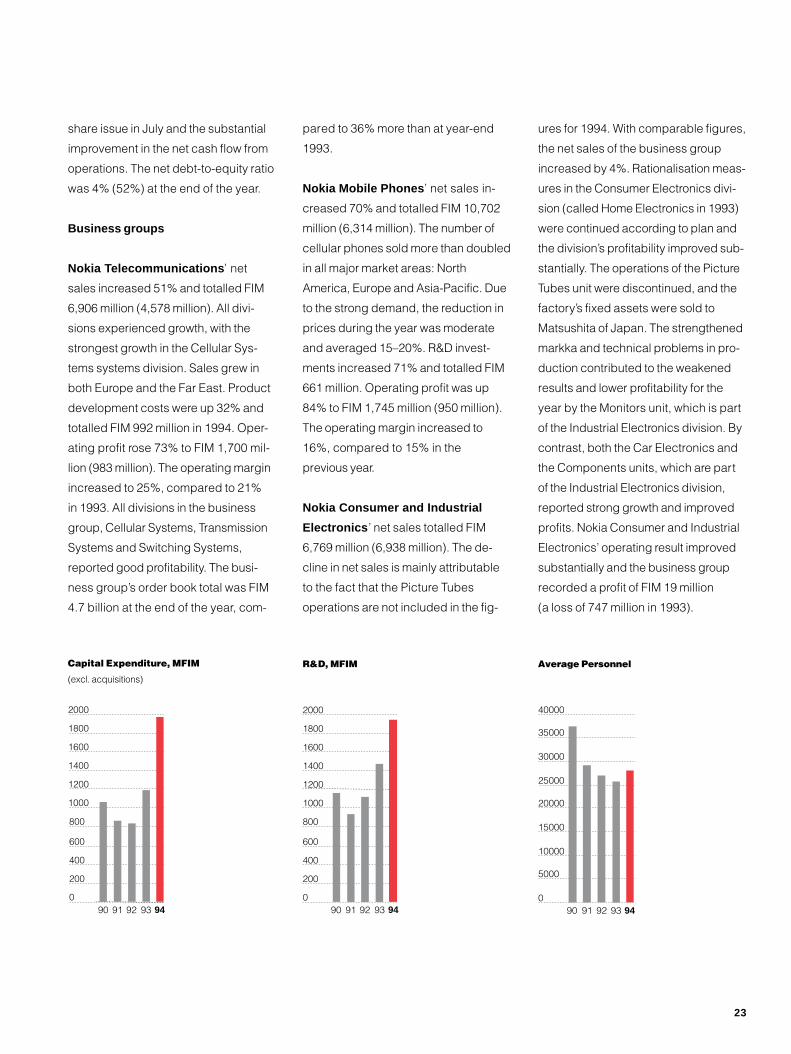
share issue in July and the substantial
improvement in the net cash flow from
operations. The net debt-to-equity ratio
was 4% (52%) at the end of the year.
Business groups
Nokia Telecommunications ’ net
sales increased 51% and totalled FIM
6,906 million (4,578 million). All divi-
sions experienced growth, with the
strongest growth in the Cellular Sys-
tems systems division. Sales grew in
both Europe and the Far East. Product
development costs were up 32% and
totalled FIM 992 million in 1994. Oper-
ating profit rose 73% to FIM 1,700 mil-
lion (983 million). The operating margin
increased to 25%, compared to 21%
in 1993. All divisions in the business
group, Cellular Systems, Transmission
Systems and Switching Systems,
reported good profitability. The busi-
ness group’s order book total was FIM
4.7 billion at the end of the year, com-
90 91 92 93 940
200
400
600
800
1000
1200
1400
1600
1800
2000
Capital Expenditure, MFIM
(excl. acquisitions)
pared to 36% more than at year-end
1993.
Nokia Mobile Phones ’ net sales in-
creased 70% and totalled FIM 10,702
million (6,314 million). The number of
cellular phones sold more than doubled
in all major market areas: North
America, Europe and Asia-Pacific. Due
to the strong demand, the reduction in
prices during the year was moderate
and averaged 15–20%. R&D invest-
ments increased 71% and totalled FIM
661 million. Operating profit was up
84% to FIM 1,745 million (950 million).
The operating margin increased to
16%, compared to 15% in the
previous year.
Nokia Consumer and Industrial
Electronics ’ net sales totalled FIM
6,769 million (6,938 million). The de-
cline in net sales is mainly attributable
to the fact that the Picture Tubes
operations are not included in the fig-
90 91 92 93 940
200
400
600
800
1000
1200
1400
1600
1800
2000
R&D, MFIM
ures for 1994. With comparable figures,
the net sales of the business group
increased by 4%. Rationalisation meas-
ures in the Consumer Electronics divi-
sion (called Home Electronics in 1993)
were continued according to plan and
the division’s profitability improved sub-
stantially. The operations of the Picture
Tubes unit were discontinued, and the
factory’s fixed assets were sold to
Matsushita of Japan. The strengthened
markka and technical problems in pro-
duction contributed to the weakened
results and lower profitability for the
year by the Monitors unit, which is part
of the Industrial Electronics division. By
contrast, both the Car Electronics and
the Components units, which are part
of the Industrial Electronics division,
reported strong growth and improved
profits. Nokia Consumer and Industrial
Electronics’ operating result improved
substantially and the business group
recorded a profit of FIM 19 million
(a loss of 747 million in 1993).
Average Personnel
90 91 92 93 940
5000
10000
15000
20000
25000
30000
35000
40000
23
Review by the Board of Directors (continued)
Cables and Machinery continued its
streamlining process in 1994. Further-
more, the business group will sell its
aluminium operations in 1995, after
which the group will consist only of the
cables and cable machinery divisions.
The business group’s net sales in 1994
totalled FIM 4,768 million (4,933 mil-
lion). Cable Industry’s net sales in-
creased to FIM 3,268 million (2,734 mil-
lion). The market situation in Germany
and the Netherlands continued to be
strained. The growth in Cable Industry’s
net sales is primarily attributable to the
fact that the net sales of the units
acquired from Germany in 1993 are
included in the cables division for all of
1994. The rationalisation measures in
24
the German units have progressed ac-
cording to plan. The division’s profitabil-
ity remained at the previous year’s level.
Net sales by the cable machinery
manufacturer Nokia-Maillefer increased
15% to FIM 1,117 million (973 million).
Nokia-Maillefer’s operating profit
remained at the previous year’s level.
Far Eastern markets again accounted
for the strongest growth. Net sales by
the Aluminium unit increased and its
results improved. Cables and Machin-
ery’s operating profit totalled
FIM 191 million (261 million).
Other Operations accounted for a
combined net sales figure of FIM 1,589
million (1,500 million). At the end of the
year, the Group sold its Power opera-
tions. In addition, it announced its
intention to sell its majority shareholding
in Nokia Tyres and to list the company
on the Helsinki Stock Exchange in
1995.
Outlook for 1995
The good development seen in 1994
and our strengthened financial situation
provide a solid foundation for favour-
able development in 1995.
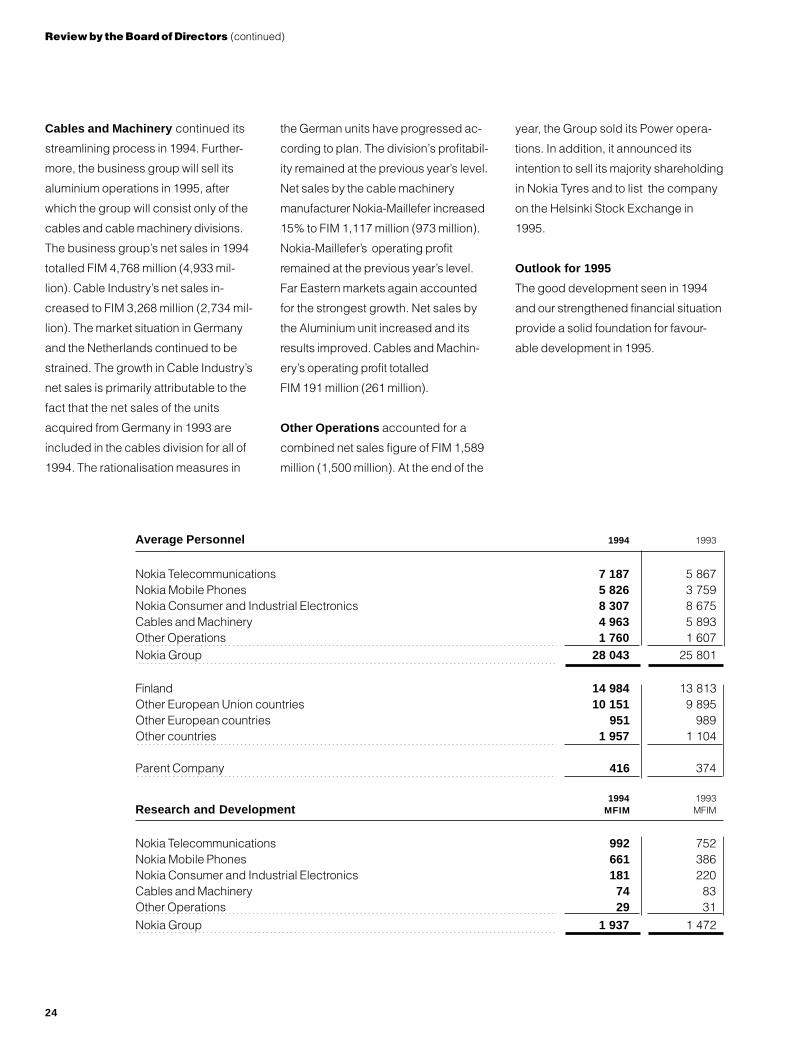
Average Personnel 1994 1993
Nokia Telecommunications 7 187 5 867Nokia Mobile Phones 5 826 3 759Nokia Consumer and Industrial Electronics 8 307 8 675Cables and Machinery 4 963 5 893Other Operations 1 760 1 607Nokia Group 28 043 25 801
Finland 14 984 13 813Other European Union countries 10 151 9 895Other European countries 951 989Other countries 1 957 1 104
Parent Company 416 374
1994 1993Research and Development MFIM MFIM
Nokia Telecommunications 992 752Nokia Mobile Phones 661 386Nokia Consumer and Industrial Electronics 181 220Cables and Machinery 74 83Other Operations 29 31
Nokia Group 1 937 1 472
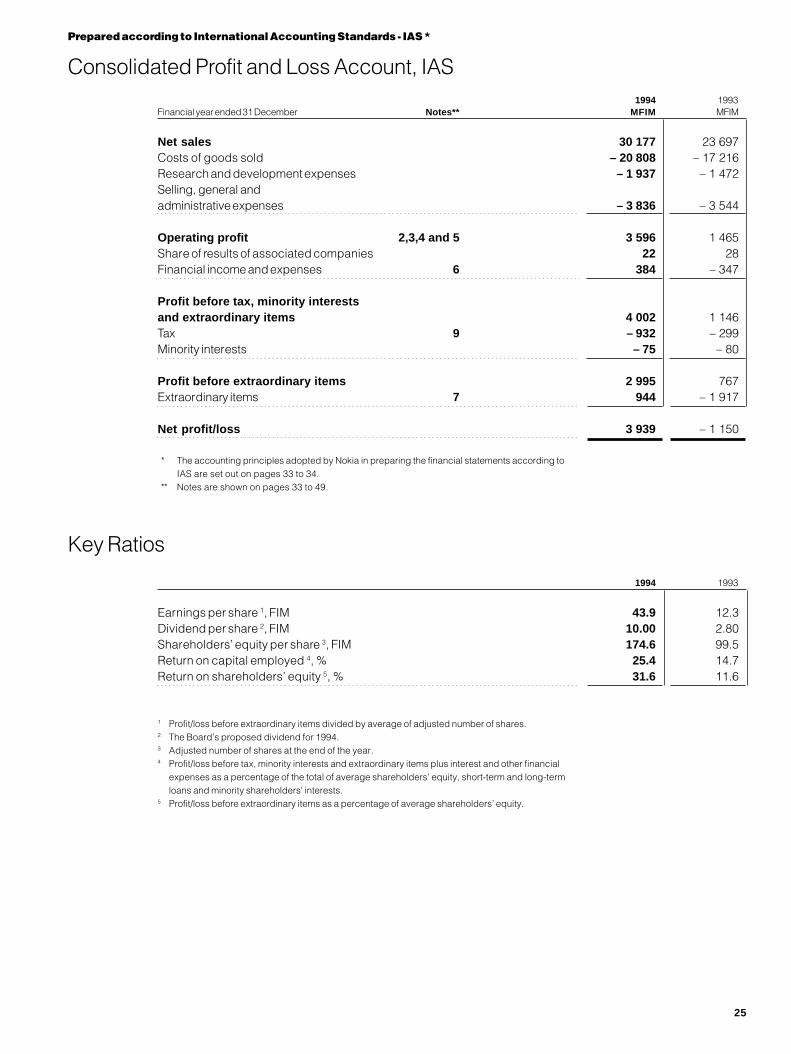
1994 1993Financial year ended 31 December Notes** MFIM MFIM
Net sales 30 177 23 697Costs of goods sold – 20 808 – 17 216Research and development expenses – 1 937 – 1 472Selling, general andadministrative expenses – 3 836 – 3 544
Operating profit 2,3,4 and 5 3 596 1 465Share of results of associated companies 22 28Financial income and expenses 6 384 – 347
Profit before tax, minority interestsand extraordinary items 4 002 1 146Tax 9 – 932 – 299Minority interests – 75 – 80
Profit before extraordinary items 2 995 767Extraordinary items 7 944 – 1 917
Net profit/loss 3 939 – 1 150
* The accounting principles adopted by Nokia in preparing the financial statements according toIAS are set out on pages 33 to 34.
** Notes are shown on pages 33 to 49.
1994 1993
Earnings per share 1, FIM 43.9 12.3Dividend per share 2, FIM 10.00 2.80Shareholders’ equity per share 3, FIM 174.6 99.5Return on capital employed 4, % 25.4 14.7Return on shareholders’ equity 5, % 31.6 11.6
1 Profit/loss before extraordinary items divided by average of adjusted number of shares.2 The Board’s proposed dividend for 1994.3 Adjusted number of shares at the end of the year.4 Profit/loss before tax, minority interests and extraordinary items plus interest and other financial
expenses as a percentage of the total of average shareholders’ equity, short-term and long-termloans and minority shareholders’ interests.
5 Profit/loss before extraordinary items as a percentage of average shareholders’ equity.
Consolidated Profit and Loss Account, IAS
Prepared according to International Accounting Standards - IAS *
Key Ratios
25

Prepared according to International Accounting Standards - IAS *
Consolidated Balance Sheet, IAS1994 1993
31 December Notes* MFIM MFIM
ASSETS
Fixed assets and other non-current assetsGoodwill and other intangible assets 10 541 590Property, plant and equipment 11 5 097 4 770Investments 12 1 810 2 092Long-term loan receivables 222 278Other non-current assets 273 264
7 943 7 994
Current assetsInventories 15 6 803 5 129Accounts receivable * 7 835 6 227Short-term investments 3 989 2 201Bank and cash 1 279 1 096
19 906 14 653
Total assets 27 849 22 647
* less allowances for doubtful accounts (31.12.1994 MFIM 197, 31.12.1993 MFIM 159)
1994 199331 December Notes* MFIM MFIM
SHAREHOLDERS’ EQUITY AND LIABILITIES
Shareholders’ equityShare capital 17 1 498 1 378Other restricted equity 17 5 494 3 329Treasury shares 17 – 437 – 348Untaxed reserves 17, 18 1 727 1 717Retained earnings 17 4 136 435
12 418 6 511
Minority interests 555 536
Long-term liabilities 20Long-term debt 3 071 3 397Other long-term liabilities 486 683
3 557 4 080
Current liabilitiesShort-term borrowings 2 453 3 435Current portion of long-term debt 20 278 139Accounts payable and accrued liabilities 23 8 086 5 976Advance payments 502 534Restructuring provision – 1 436
11 319 11 520
Total shareholders’ equity and liabilities 27 849 22 647
* Notes are shown on pages 33 to 49.
26

Consolidated Cash Flow Statement, IAS1994 1993
Financial year ended 31 December Notes* MFIM MFIM
Cash flow from operating activitiesProfit before tax, minority interests and extraordinary items 4 002 1 146
Adjustments, total 29 886 1 219
Operating profit before change in net working capital 4 888 2 365 Change in net working capital 29 – 1 450 – 1 064
Cash generated from operations 3 438 1 301 Interest received 349 531 Interest paid – 568 – 908 Income taxes paid – 326 – 133
Cash flow before extraordinary items 2 893 791 Extraordinary expenses paid – 350 – 86
Net cash from operating activities 2 543 705
Cash flow from investing activitiesAcquisition of Group companies, net of acquired cash – 80 – 471Treasury shares acquired – 78 –Investments in other shares – 351 – 100Capital expenditures – 1 967 – 1 186Proceeds from disposal of shares in Group companies, net of disposed cash 45 191Proceeds from sale of other shares 634 864Proceeds from sale of fixed assets 24 177Dividends received 142 152
Net cash used in investing activities – 1 631 – 373
Cash flow from financing activities Proceeds from issuance of share capital 2 490 918 Capital investment by minority shareholders 23 5 Proceeds from (+), payments of (–) long-term liabilities – 267 479 Proceeds from (+), payments of (–) short-term borrowings – 571 – 1 582 Proceeds from (+), payments of (–) long-term receivables 29 – 24 Proceeds from (+), payments of (–) short-term receivables – 145 116 Dividends paid – 211 – 173
Net cash from/used in financing activities 1 348 – 261
Net increase in cash and cash equivalents 2 260 71Cash and cash equivalents at beginning of period 3 008 3 226
Cash and cash equivalents at end of period 5 268 3 297
The above figures cannot be directly traced from the balance sheet without additional information as a result ofacquisitions and disposals of subsidiaries and net foreign exchange differences arising on consolidation.
The schedule shown below reconciles cash and cash equivalents at the end of the previously reportedperiod to cash and cash equivalents reported for the beginning of the current period.Reconciliation:
As previously reported for 1993 and 1992, respectively 3 297 3 118Foreign exchange adjustment – 289 108
3 008 3 226Net increase in cash and cash equivalents 2 260 71
As reported for 1994 and 1993 5 268 3 297
27

Reconciliation between the Financial Statements under FAS and IAS1994 1993
Notes* MFIM MFIM
Net profit/loss for the year under FAS 3 658 – 246Untaxed reserves 49 – 827
3 707 – 1 073
Share of results of associated companies 28 24 – 2
Financial income and expenses Dividend income from associated companies 28 – – 5
Minority interests – 6
Extraordinary items 7 208 – 76
Net profit/loss for the year under IAS 3 939 – 1 150
Shareholders’ equity under FAS 10 857 5 319Untaxed reserves 1 727 1 717
12 584 7 036
Associated companies – – 143Profit on the sale of fixed assets – 166 – 382
Shareholders’ equity under IAS 12 418 6 511
* Notes are shown on pages 33 to 49.
28
Consolidated Profit and Loss Account, FAS
Prepared according to Finnish Accounting Standards - FAS *
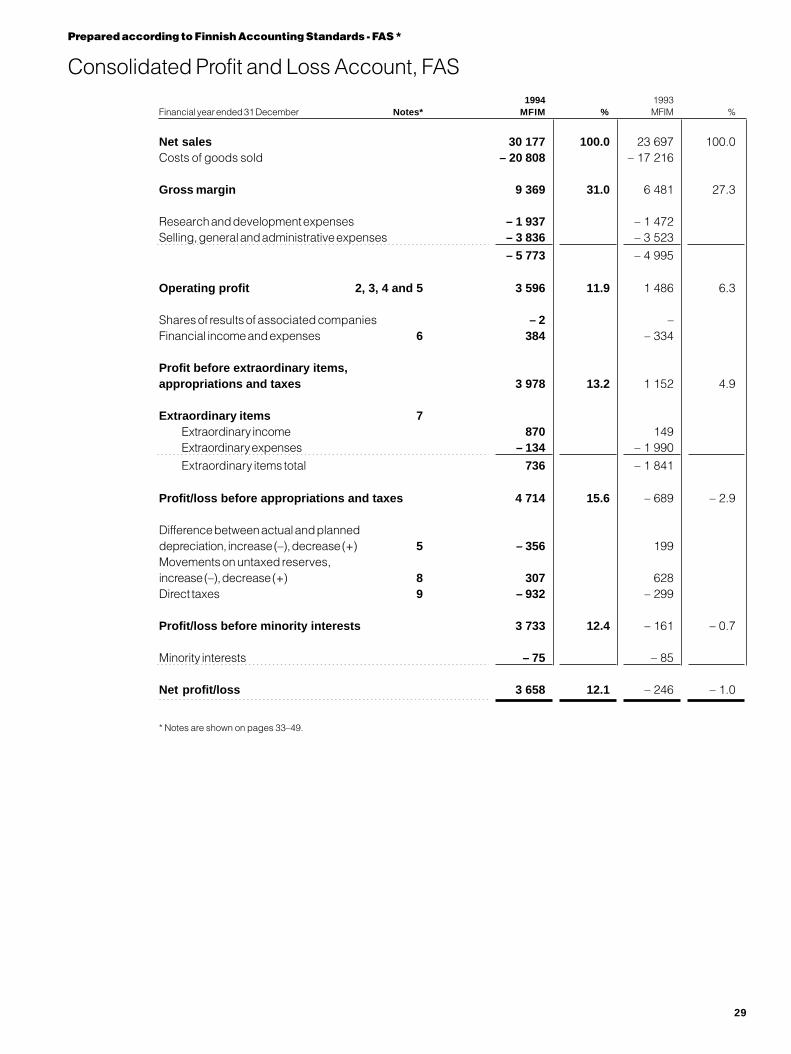
1994 1993Financial year ended 31 December Notes* MFIM % MFIM %
Net sales 30 177 100.0 23 697 100.0Costs of goods sold – 20 808 – 17 216
Gross margin 9 369 31.0 6 481 27.3
Research and development expenses – 1 937 – 1 472Selling, general and administrative expenses – 3 836 – 3 523
– 5 773 – 4 995
Operating profit 2, 3, 4 and 5 3 596 11.9 1 486 6.3
Shares of results of associated companies – 2 –Financial income and expenses 6 384 – 334
Profit before extraordinary items,appropriations and taxes 3 978 13.2 1 152 4.9
Extraordinary items 7Extraordinary income 870 149Extraordinary expenses – 134 – 1 990
Extraordinary items total 736 – 1 841
Profit/loss before appropriations and taxes 4 714 15.6 – 689 – 2.9
Difference between actual and planneddepreciation, increase (–), decrease (+) 5 – 356 199Movements on untaxed reserves,increase (–), decrease (+) 8 307 628Direct taxes 9 – 932 – 299
Profit/loss before minority interests 3 733 12.4 – 161 – 0.7
Minority interests – 75 – 85
Net profit/loss 3 658 12.1 – 246 – 1.0
* Notes are shown on pages 33–49.
29
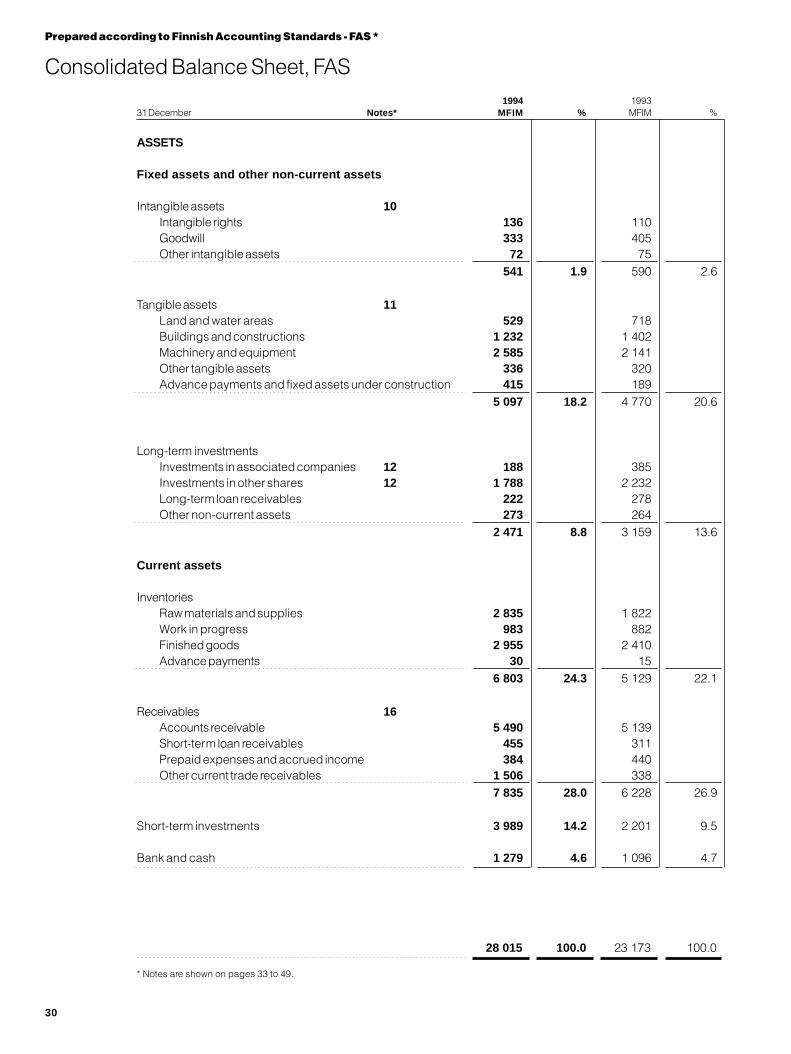
Consolidated Balance Sheet, FAS
Prepared according to Finnish Accounting Standards - FAS *
28 015 100.0 23 173 100.0
1994 199331 December Notes* MFIM % MFIM %
ASSETS
Fixed assets and other non-current assets
Intangible assets 10Intangible rights 136 110Goodwill 333 405Other intangible assets 72 75
541 1.9 590 2.6
Tangible assets 11Land and water areas 529 718Buildings and constructions 1 232 1 402Machinery and equipment 2 585 2 141Other tangible assets 336 320Advance payments and fixed assets under construction 415 189
5 097 18.2 4 770 20.6
Long-term investmentsInvestments in associated companies 12 188 385Investments in other shares 12 1 788 2 232Long-term loan receivables 222 278Other non-current assets 273 264
2 471 8.8 3 159 13.6
Current assets
InventoriesRaw materials and supplies 2 835 1 822Work in progress 983 882Finished goods 2 955 2 410Advance payments 30 15
6 803 24.3 5 129 22.1
Receivables 16Accounts receivable 5 490 5 139Short-term loan receivables 455 311Prepaid expenses and accrued income 384 440Other current trade receivables 1 506 338
7 835 28.0 6 228 26.9
Short-term investments 3 989 14.2 2 201 9.5
Bank and cash 1 279 4.6 1 096 4.7
* Notes are shown on pages 33 to 49.
30

Consolidated Balance Sheet, FAS
1994 199331 December Notes* MFIM % MFIM %
SHAREHOLDERS’ EQUITY AND LIABILITIES
Shareholders’ equity 17Restricted equity
Share capital 1 498 1 378Additional paid in capital 4 376 2 065Other restricted equity 870 1 076
6 744 4 519
Distributable reservesRetained earnings 455 1 046Net profit/loss for the year 3 658 – 246
4 113 800
Total shareholders’ equity 10 857 38.7 5 319 23.0
Minority interests 555 2.0 536 2.3
Accumulated appropriations 18Accumulated depreciation in excess of plan 976 3.5 653 2.8
Untaxed reservesInvestment reserve 21 22Other reserves 730 1 042
751 2.7 1 064 4.6
Provisions 19 486 1.7 301 1.3
LiabilitiesLong-term liabilities 20
Bonds 21 842 1 105Convertible bonds 22 24 42Loans from financial institutions 391 1 007Pension premium loans 1 719 1 166Other long-term finance loans 95 77Other long-term liabilities 486 683
3 557 12.7 4 080 17.6
Short-term liabilitiesCurrent finance liabilities 2 453 3 435Current maturities of long-term loans 278 139Advance payments 502 534Accounts payable 3 353 2 302Accrued expenses and prepaid income 3 699 2 945Restructuring provision – 1 436Other current trade liabilities 548 429
10 833 38.7 11 220 48.4
Total liabilities 14 390 51.4 15 300 66.0
28 015 100.0 23 173 100.0
31

Consolidated Cash Flow Statement, FAS
Prepared according to Finnish Accounting Standards - FAS
1994 1993Financial year ended 31 December Notes* MFIM MFIM
Cash flow from operating activitiesProfit before extraordinary items, appropriations and taxes 3 978 1 152
Adjustments, total 29 910 1 203Operating profit before change in net working capital 4 888 2 355
Change in net working capital 29 – 1 450 – 1 144Cash generated from operations 3 438 1 211
Interest received 349 531Interest paid - 568 – 899Income taxes paid – 326 – 133
Cash flow before extraordinary items 2 893 710Extraordinary expenses paid – 350 – 10
Net cash from operating activities 2 543 700
Cash flow from investing activitiesAcquisition of Group companies, net of acquired cash – 80 – 471Treasury shares acquired – 78 –Investments in other shares – 351 – 100Capital expenditures – 1 967 – 1 186Proceeds from disposal of shares in Group companies, net of disposed cash 45 191Proceeds from sale of other shares 634 864Proceeds from sale of fixed assets 24 177Dividends received 142 157
Net cash used in investing activities – 1 631 – 368
Cash flow from financing activitiesProceeds from issuance of share capital 2 490 918Capital investment by minority shareholders 23 5Proceeds from (+), payments of (–) long-term liabilities – 267 479Proceeds from (+), payments of (–) short-term borrowings – 571 – 1 582Proceeds from (+), payments of (–) long-term receivables 29 – 24Proceeds from (+), payments of (–) short-term receivables – 145 116Dividends paid – 211 – 173
Net cash from/used in financing activities 1 348 – 261
Net increase in cash and cash equivalents 2 260 71Cash and cash equivalents at beginning of period 3 008 3 226
Cash and cash equivalents at end of period 5 268 3 297
The above figures cannot be directly traced from the balance sheet without additional information as a result ofacquisitions and disposals of subsidiaries and net foreign exchange differences arising on consolidation.
The schedule shown below reconciles cash and cash equivalents at the end of the previously reportedperiod to cash and cash equivalents reported for the beginning of the current period.Reconciliation:
As previously reported for 1993 and 1992, respectively 3 297 3 118Foreign exchange adjustment – 289 108
3 008 3 226Net increase in cash and cash equivalents 2 260 71
As reported for 1994 and 1993 5 268 3 297
* Notes are shown on pages 33 to 49.
32

Notes to the Financial Statements
1. Accounting Principles
The consolidated financial statementsof Nokia Corporation (Nokia or theGroup) prepared in accordance with In-ternational Accounting Standards (IAS)are presented on pages 25 to 27, whilefinancial statements prepared in ac-cordance with Finnish AccountingStandards (FAS) are on pages 29 to 32and 50 to 53.
Apart from the exceptions indi-cated in italic type in the following, theaccounting principles adopted by Nokiaare in compliance with IAS. A reconcili-ation between the financial statementsunder FAS and IAS is presented onpage 28.
Changes in accounting principlesThe FAS accounts have been made forthe first time in accordance with thenew Finnish Accounting Act. The onlychange in principles effecting the profitand loss account is the associatedcompanies that have been included inthe consolidated accounts according tothe equity method. The opening bal-ance of retained earnings has been ad-justed with the accumulated shares ofresults of associated companies fromthe previous years. Certain changes tothe format of the previously reportedprofit and loss account and balancesheet have been made.
To reduce the effects of exchangerate fluctuations on the Group’s share-holders’ equity, part of the foreign sub-sidiaries’ shareholders’ equity and un-taxed reserves has been hedged during1994 with foreign currency loans and fi-nancial instruments. Exchange gainsand losses resulting from these loansand financial instruments have beenoffset against the translation differencesarising from consolidation.
Accounting conventionThe financial statements are presentedin Finnish markkas and are preparedunder the historical cost convention.
Principles of consolidationThe consolidated financial statementsinclude the accounts of the parent
company, Nokof those compdirectly or indiies, over 50 %accounts of ceNokia has manconsolidated.housing compcompanies whduring the finabeen left out ocial statementcompanies ondistributable recompanies acperiod have bdate the respotions was tranSimilarly the redivested durinincluded in thethe date of dis
All inter-coeliminated as process. Minosented separasults before exter taxes. Theyrately from shaabilities in the sheet.
Acquisitiocounted for usod. Goodwill rthe purchase assets less liapanies, after pganisation cosover a period n
The Grouplosses of assorights betweecluded in the closs account iequity methodGroup’s shareserves (retaineserves and othadded to the cpany investmebalance sheet
Profits incthe sale of fixe
ia Corporation, and eachanies in which it owns,rectly through subsidiar- of the voting rights. Thertain companies in whichagement control are also
Certain real estate andanies, as well as smallich had no operationsncial year, have, however,f the consolidated finan-s. The effect of these the Group’s result andserves is immaterial. The
quired during the financialeen consolidated from thensibility for their opera-sferred to the Group.sult of a Group companyg an accounting period is Group accounts only to
posal.mpany transactions are
part of the consolidationrity interests are pre-tely in arriving at the re-traordinary items but af- are also shown sepa-reholders’ equity and li-
consolidated balance
ns of companies are ac-ing the purchase meth-epresents the excess ofcost over the fair value ofbilities of acquired com-rovision for direct reor-ts. Goodwill is amortisedot exceeding ten years.’s share of profits and
ciated companies (votingn 20% and 50%) is in-onsolidated profit and
n accordance with the of accounting. The of post acquisition re-d earnings, untaxed re-er restricted equity) isost of associated com-nts in the consolidated
.urred in connection withd assets between the
Group and associated companies areeliminated in proportion to share owner-ship. The item is deducted from theGroup’s equity and fixed assets. Theeliminated sales profit is released inGroup accounts over the same periodas depreciation is made. Sales profitsarisen before 1 January 1994, have notbeen eliminated in FAS financial state-ments.
Investments in other companies(voting rights less than 20%) and alsosome joint ventures in the start-upphase are stated at cost; provision ismade where necessary to reduce thecost to estimated net realisable value.
Foreign currenciesTransactions in foreign currencies arerecorded at the rates of exchange pre-vailing at the dates of the transactions.At the end of the accounting period theunsettled balances on foreign currencyreceivables and liabilities are valued atthe rates of exchange prevailing at thebalance sheet date. Foreign exchangegains and losses related to normalbusiness operations are treated as ad-justments to sales and purchases. For-eign exchange gains and losses associ-ated with financing are entered as a netamount under financial income and ex-penses.
Foreign Group companiesIn the consolidated accounts all itemsin the profit and loss accounts of for-eign subsidiaries are translated intoFinnish markka at the average ex-change rates for the year. The balancesheets of foreign subsidiaries are trans-lated into Finnish markka at the rates ofexchange ruling at the balance sheetdate. Exchange differences arising fromthe application of the purchase methodare treated as an adjustment item af-fecting the consolidated shareholders’equity. Translation differences related tothe restricted equity at the acquisitionmoment are treated as a part of re-stricted equity. Differences resultingfrom the translation of profit and lossaccount items at the average rate and
33
Notes to the Financial Statements
the balance sheet items at the closingrate are taken to retained earnings.
Revenue recognitionSales are recorded upon shipment ofproducts and customer acceptance, ifany, or performance of services, net ofsales taxes and certain other sales re-lated expenses. Revenues from long-term contracts are recognised on thecompleted contract method.
Research and developmentResearch and development costs areexpensed in the financial period duringwhich they are incurred.
Maintenance, repairs and renewalsMaintenance, repairs and renewals aregenerally charged to expense duringthe financial year in which they are in-curred. However, major renovations arecapitalised and depreciated over theirexpected useful lives.
Pensions and coverageof pension liabilitiesThe Group companies have variouspension schemes in accordance withthe local conditions and practices in thecountries in which they operate. Theschemes are generally funded throughpayments to insurance companies or totrustee-administered funds as deter-mined by periodic actuarial calcula-tions. Any deficits or benefits requiringadditional contributions are fundedthrough payments allocated over a pe-riod of years not exceeding the ex-pected remaining working lives of theparticipating employees.
The Group has met minimum fund-ing requirements for the countries inwhich it maintains pension schemes.
Property, plant and equipmentProperty, plant and equipment arestated at cost less accumulated depre-ciation. Depreciation is recorded on astraight-line basis over the expecteduseful lives of the assets, based on thefollowing useful lives:
34
Buildings 20–40 yearsMachinery andequipment 3–15 years
Land and water areas are not depre-ciated.
Gains and losses on the disposalof fixed assets are included in operatingprofit/loss or extraordinary items de-pending on the nature of the transac-tion.
LeasingLeasing payments are treated asrentals. The Group has no significantfinance lease agreements.
InventoriesInventories are stated at the lower ofcost and net realisable value. Cost isdetermined on a first in first out (FIFO)basis. Net realisable value is theamount that can be realised from thesale of the asset in the normal course ofbusiness after allowing for the costs ofrealisation.
In addition to the cost of materialsand direct labour, an appropriate pro-portion of production overheads is in-cluded in the inventory values.
Cash and cash equivalentsCash and cash equivalents consist ofcash on hand and balances with banksand liquid financial instruments.
Extraordinary itemsCertain income and expenses of an ab-normal nature, such as divestments ofoperations, are presented net of tax asextraordinary items in the consolidatedprofit and loss account.
AppropriationsIn Finland and certain other countries,companies are permitted to reduce orincrease taxable income by net chargesor by income representing adjustmentsto untaxed reserve accounts, providedthat such amounts are reflected in theGroup’s financial statements.
In the consolidated IAS financialstatements, accumulated appropria-
tions are included in the balance sheetas part of shareholders’ equity as “Un-taxed reserves”. Transfers to and fromuntaxed reserves are reflected throughretained earnings.
TaxesThe consolidated financial statementsinclude direct taxes, which are basedon the results of the Group companiesand are calculated according to localtax rules.
Provision is made for deferred taxat corporate income tax rate in effect atthe end of the accounting period, ex-cept in the case of any tax reductionthat can reasonably be expected tocontinue in the foreseeable future. Be-cause no tax is expected to arise in theforeseeable future in respect of untaxedreserves, no provision for deferred taxhas been made.
DividendsDividends proposed by the Board of Di-rectors are not entered in the financialstatements but are recorded subject totheir approval by the Annual GeneralMeeting.
Consolidated cash flow statementThe amended IAS 7 Cash Flow State-ment, has been adopted by the Groupfor all the periods presented. The previ-ously reported statement of consoli-dated source and application of fundshas been changed to a cash basis cashflow statement.
Changes in InternationalAccounting StandardsEffective from the beginning of 1995,the Group will adopt the revised IAS 9,Research and development costs, andcapitalise the development expensesmeeting the criteria stated in the stand-ard.
From 1 January 1995, the Groupwill recognise the revenue of long-termcontracts in accordance with the per-centage of completion method, revisedIAS 11 (Construction Contracts).

ConsumerTelecommuni- Mobile and Industrial Cables and Other
2. Segment Information cations Phones Electronics Machinery Operations Eliminations Group total
Net Sales1994, MFIM 6 906 10 702 6 769 4 768 1 589 – 557 30 1771993, MFIM 4 578 6 314 6 938 4 933 1 500 – 566 23 697
Operating profit/loss, IAS1994, MFIM 1 700 1 745 19 191 – 59 – 3 5961993, MFIM 983 950 – 747 261 18 – 1 465
Capital expenditures*1994, MFIM 506 971 237 144 109 – 1 9671993, MFIM 236 358 392 95 105 – 1 186
Identifiable assets, IAS1994, MFIM 4 448 6 772 3 946 3 819 9 584 – 720 27 8491993, MFIM 3 044 4 204 4 497 4 298 6 917 – 313 22 647
* Excluding acquisitions.
GROUP PARENT COMPANY1994 1993 1994 1993
3. Personnel Expenses MFIM MFIM MFIM MFIM
Wages and salaries 4 409 4 248 87 73
Pension expenses 402 402 20 8
Other social expenses 704 834 20 18
Personnel expenses as per profit and loss account 5 515 5 484 127 99
Monetary value of fringe benefits 80 40 2 2
Total 5 595 5 524 129 101
Remuneration of the members of the Board of Directors,Group Executive Board, President and Chief Executive Officer,
and Presidents and Managing Directors * 72 66 3 2
* Salaries include incentives 4 1 1 –
Pension commitments for the management:The retirement age of the management of the Group companies has been agreed to be between 60 – 65 years.For the Chief Executive Officer of the Parent Company the retirement age has been agreed to be 60 years.
GROUP4. Selling and Marketing Expenses, Administration 1994 1993
Expenses and Other Operating Income and Expenses MFIM MFIM
Selling and marketing expenses – 2 501 – 2 276Administration expenses – 1 292 – 1 220Other operating expenses – 268 – 273Other operating income 225 246
Total, FAS – 3 836 – 3 523IAS-adjustments – – 21
Total, IAS – 3 836 – 3 544
35
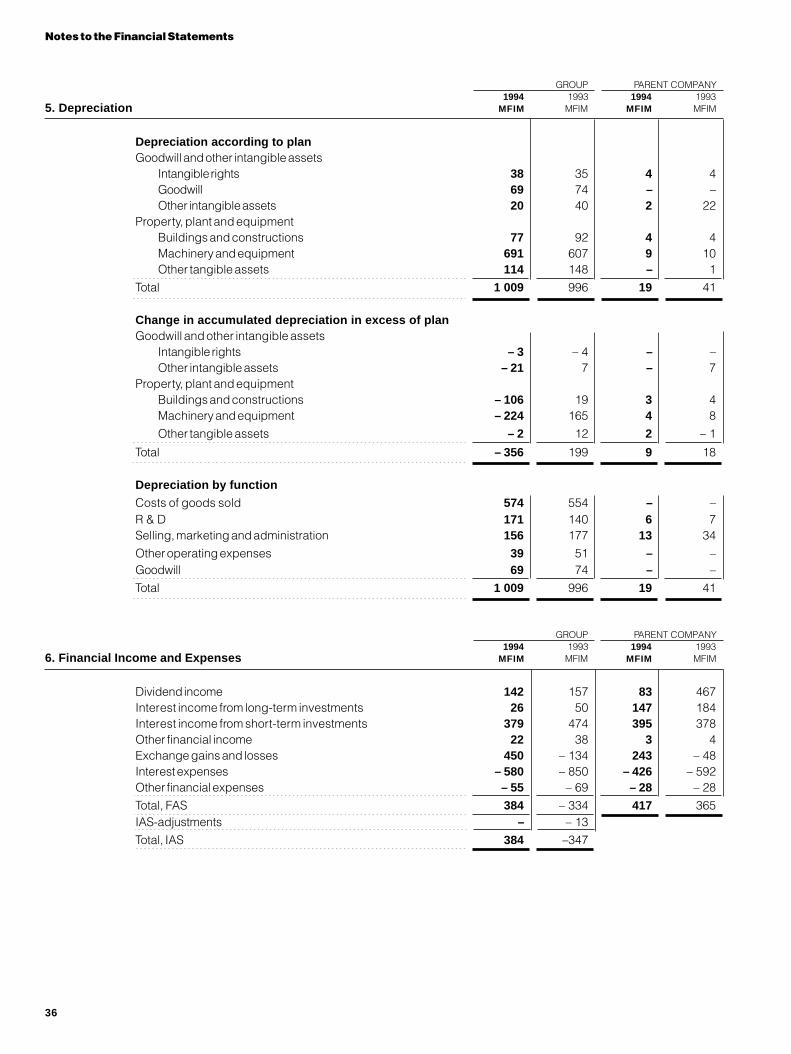
Notes to the Financial Statements
GROUP PARENT COMPANY1994 1993 1994 1993
5. Depreciation MFIM MFIM MFIM MFIM
Depreciation according to planGoodwill and other intangible assets
Intangible rights 38 35 4 4Goodwill 69 74 – –Other intangible assets 20 40 2 22
Property, plant and equipmentBuildings and constructions 77 92 4 4Machinery and equipment 691 607 9 10Other tangible assets 114 148 – 1
Total 1 009 996 19 41
Change in accumulated depreciation in excess of planGoodwill and other intangible assets
Intangible rights – 3 – 4 – –Other intangible assets – 21 7 – 7
Property, plant and equipmentBuildings and constructions – 106 19 3 4Machinery and equipment – 224 165 4 8
Other tangible assets – 2 12 2 – 1
Total – 356 199 9 18
Depreciation by function
Costs of goods sold 574 554 – –R & D 171 140 6 7Selling, marketing and administration 156 177 13 34
Other operating expenses 39 51 – –Goodwill 69 74 – –
Total 1 009 996 19 41
GROUP PARENT COMPANY1994 1993 1994 1993
6. Financial Income and Expenses MFIM MFIM MFIM MFIM
Dividend income 142 157 83 467Interest income from long-term investments 26 50 147 184Interest income from short-term investments 379 474 395 378Other financial income 22 38 3 4Exchange gains and losses 450 – 134 243 – 48Interest expenses – 580 – 850 – 426 – 592Other financial expenses – 55 – 69 – 28 – 28
Total, FAS 384 – 334 417 365IAS-adjustments – – 13
Total, IAS 384 –347
36
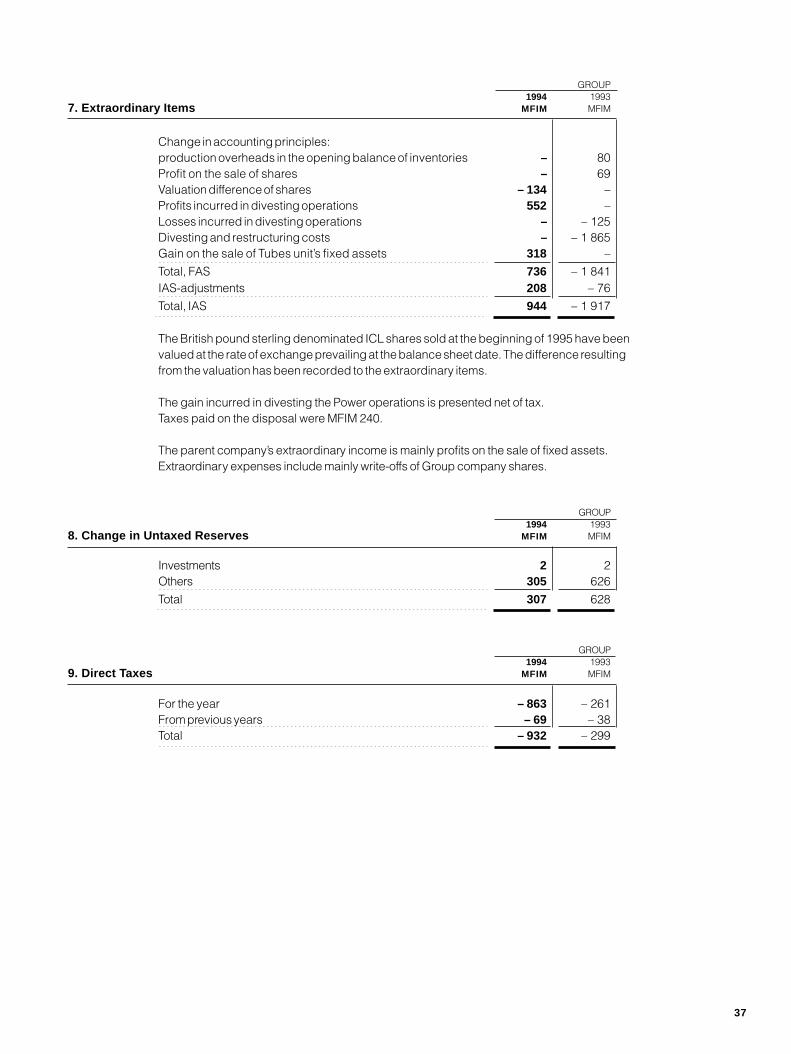
GROUP1994 1993
7. Extraordinary Items MFIM MFIM
Change in accounting principles:production overheads in the opening balance of inventories – 80Profit on the sale of shares – 69Valuation difference of shares – 134 –Profits incurred in divesting operations 552 –Losses incurred in divesting operations – – 125Divesting and restructuring costs – – 1 865Gain on the sale of Tubes unit’s fixed assets 318 –
Total, FAS 736 – 1 841IAS-adjustments 208 – 76
Total, IAS 944 – 1 917
The British pound sterling denominated ICL shares sold at the beginning of 1995 have beenvalued at the rate of exchange prevailing at the balance sheet date. The difference resultingfrom the valuation has been recorded to the extraordinary items.
The gain incurred in divesting the Power operations is presented net of tax.Taxes paid on the disposal were MFIM 240.
The parent company’s extraordinary income is mainly profits on the sale of fixed assets.Extraordinary expenses include mainly write-offs of Group company shares.
GROUP1994 1993
8. Change in Untaxed Reserves MFIM MFIM
Investments 2 2Others 305 626
Total 307 628
GROUP1994 1993
9. Direct Taxes MFIM MFIM
For the year – 863 – 261From previous years – 69 – 38Total – 932 – 299
37
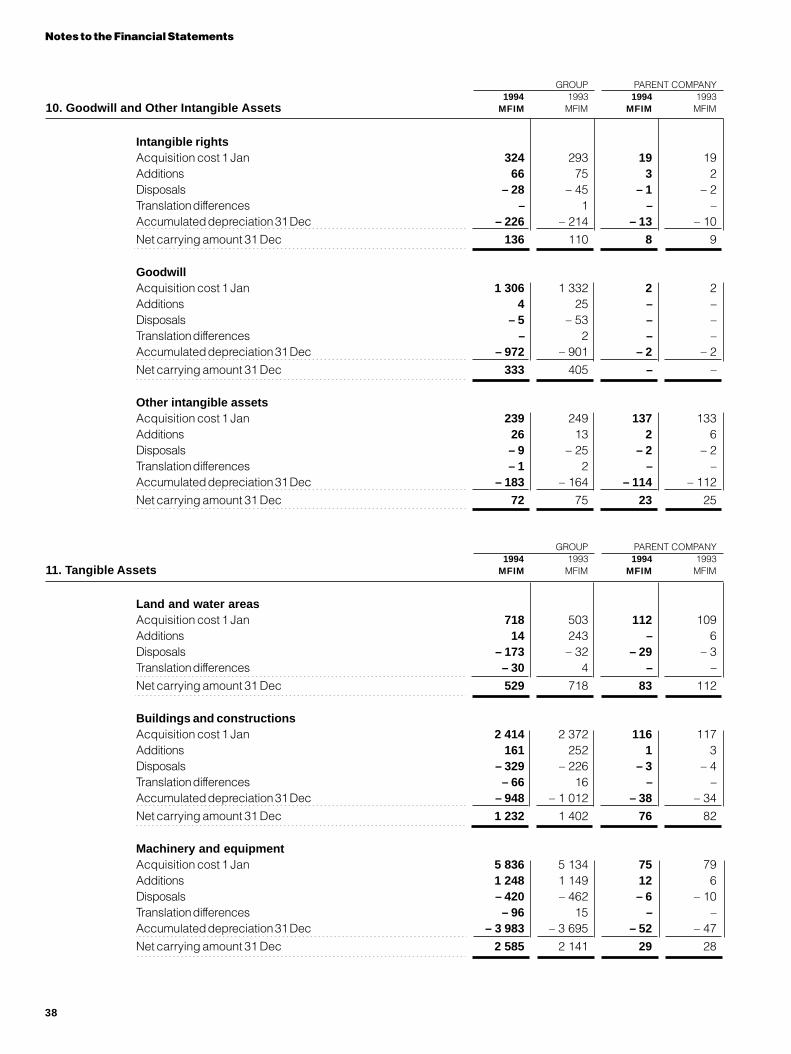
Notes to the Financial Statements
GROUP PARENT COMPANY1994 1993 1994 1993
10. Goodwill and Other Intangible Assets MFIM MFIM MFIM MFIM
Intangible rightsAcquisition cost 1 Jan 324 293 19 19Additions 66 75 3 2Disposals – 28 – 45 – 1 – 2Translation differences – 1 – –Accumulated depreciation 31 Dec – 226 – 214 – 13 – 10
Net carrying amount 31 Dec 136 110 8 9
GoodwillAcquisition cost 1 Jan 1 306 1 332 2 2Additions 4 25 – –Disposals – 5 – 53 – –Translation differences – 2 – –Accumulated depreciation 31 Dec – 972 – 901 – 2 – 2
Net carrying amount 31 Dec 333 405 – –
Other intangible assetsAcquisition cost 1 Jan 239 249 137 133Additions 26 13 2 6Disposals – 9 – 25 – 2 – 2Translation differences – 1 2 – –Accumulated depreciation 31 Dec – 183 – 164 – 114 – 112
Net carrying amount 31 Dec 72 75 23 25
GROUP PARENT COMPANY1994 1993 1994 1993
11. Tangible Assets MFIM MFIM MFIM MFIM
Land and water areasAcquisition cost 1 Jan 718 503 112 109Additions 14 243 – 6Disposals – 173 – 32 – 29 – 3Translation differences – 30 4 – –
Net carrying amount 31 Dec 529 718 83 112
Buildings and constructionsAcquisition cost 1 Jan 2 414 2 372 116 117Additions 161 252 1 3Disposals – 329 – 226 – 3 – 4Translation differences – 66 16 – –Accumulated depreciation 31 Dec – 948 – 1 012 – 38 – 34
Net carrying amount 31 Dec 1 232 1 402 76 82
Machinery and equipmentAcquisition cost 1 Jan 5 836 5 134 75 79Additions 1 248 1 149 12 6Disposals – 420 – 462 – 6 – 10Translation differences – 96 15 – –Accumulated depreciation 31 Dec – 3 983 – 3 695 – 52 – 47
Net carrying amount 31 Dec 2 585 2 141 29 28
38
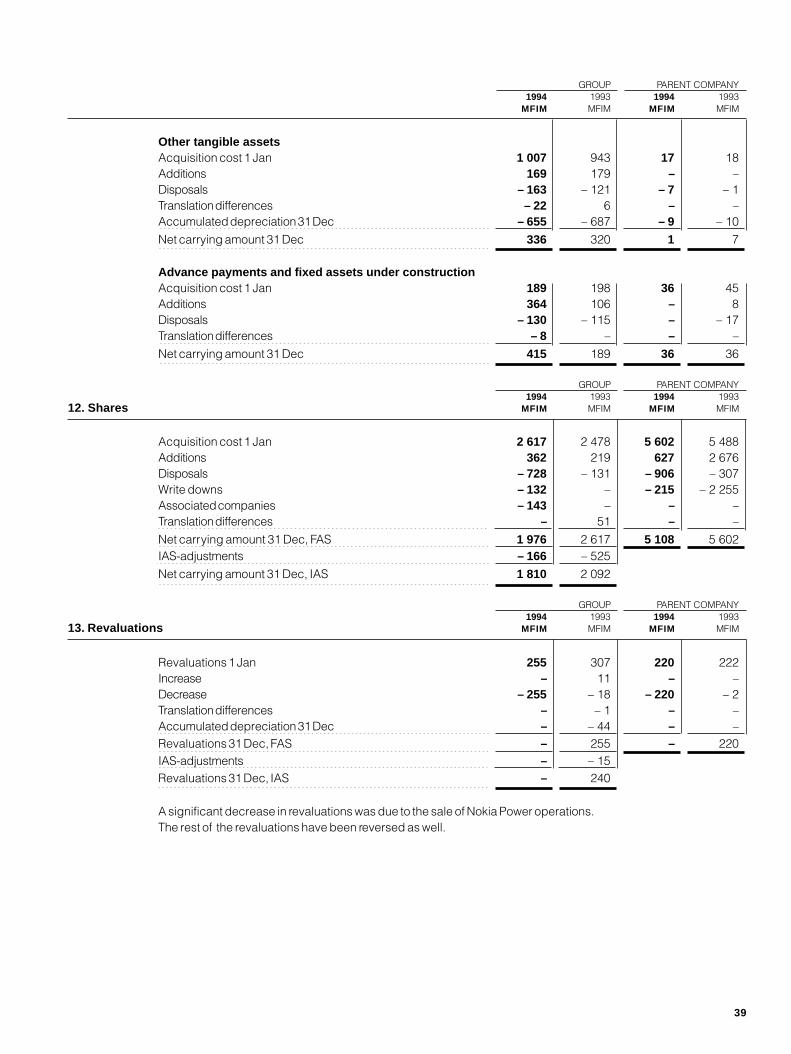
GROUP PARENT COMPANY1994 1993 1994 1993
MFIM MFIM MFIM MFIM
Other tangible assetsAcquisition cost 1 Jan 1 007 943 17 18Additions 169 179 – –Disposals – 163 – 121 – 7 – 1Translation differences – 22 6 – –Accumulated depreciation 31 Dec – 655 – 687 – 9 – 10
Net carrying amount 31 Dec 336 320 1 7
Advance payments and fixed assets under constructionAcquisition cost 1 Jan 189 198 36 45Additions 364 106 – 8Disposals – 130 – 115 – – 17Translation differences – 8 – – –
Net carrying amount 31 Dec 415 189 36 36
GROUP PARENT COMPANY1994 1993 1994 1993
12. Shares MFIM MFIM MFIM MFIM
Acquisition cost 1 Jan 2 617 2 478 5 602 5 488Additions 362 219 627 2 676Disposals – 728 – 131 – 906 – 307Write downs – 132 – – 215 – 2 255Associated companies – 143 – – –Translation differences – 51 – –
Net carrying amount 31 Dec, FAS 1 976 2 617 5 108 5 602IAS-adjustments – 166 – 525
Net carrying amount 31 Dec, IAS 1 810 2 092
GROUP PARENT COMPANY1994 1993 1994 1993
13. Revaluations MFIM MFIM MFIM MFIM
Revaluations 1 Jan 255 307 220 222Increase – 11 – –Decrease – 255 – 18 – 220 – 2Translation differences – – 1 – –Accumulated depreciation 31 Dec – – 44 – –Revaluations 31 Dec, FAS – 255 – 220IAS-adjustments – – 15Revaluations 31 Dec, IAS – 240
A significant decrease in revaluations was due to the sale of Nokia Power operations.The rest of the revaluations have been reversed as well.
39
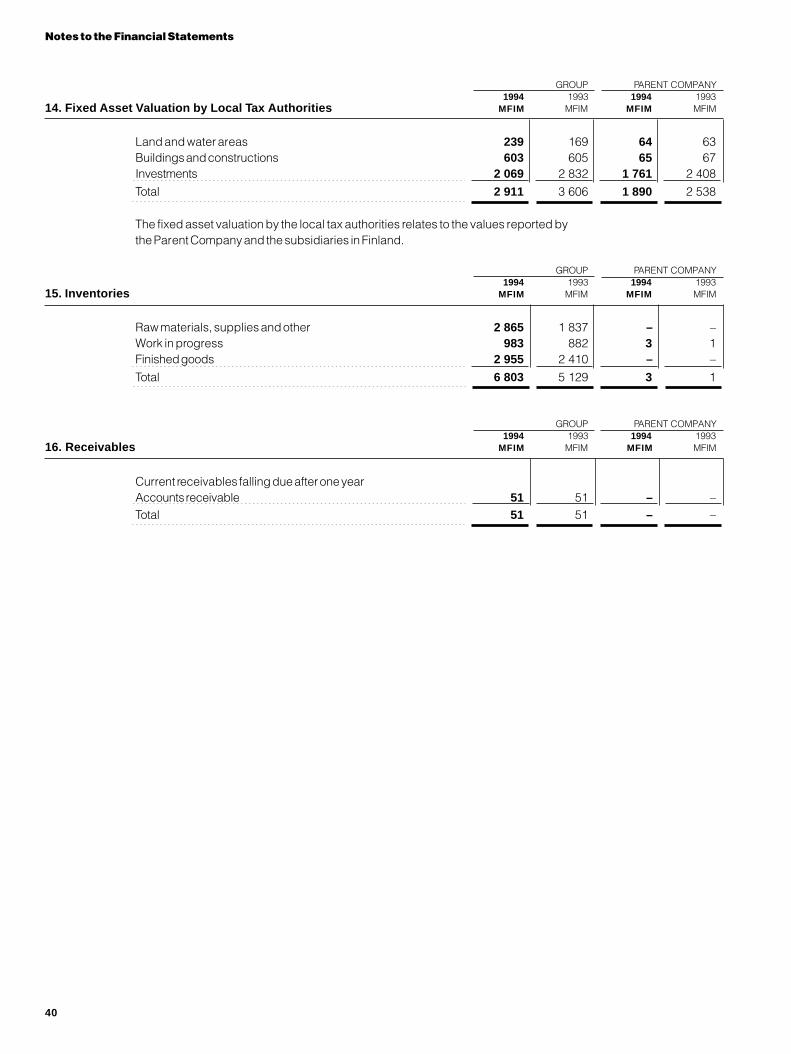
Notes to the Financial Statements
GROUP PARENT COMPANY1994 1993 1994 1993
14. Fixed Asset Valuation by Local Tax Authorities MFIM MFIM MFIM MFIM
Land and water areas 239 169 64 63Buildings and constructions 603 605 65 67Investments 2 069 2 832 1 761 2 408
Total 2 911 3 606 1 890 2 538
The fixed asset valuation by the local tax authorities relates to the values reported bythe Parent Company and the subsidiaries in Finland.
GROUP PARENT COMPANY1994 1993 1994 1993
15. Inventories MFIM MFIM MFIM MFIM
Raw materials, supplies and other 2 865 1 837 – –Work in progress 983 882 3 1Finished goods 2 955 2 410 – –
Total 6 803 5 129 3 1
GROUP PARENT COMPANY1994 1993 1994 1993
16. Receivables MFIM MFIM MFIM MFIM
Current receivables falling due after one yearAccounts receivable 51 51 – –Total 51 51 – –
40

Share capital Other restric- Treasury Untaxed Retained
17. Shareholders’ Equity Common Preferred ted equity shares reserves earnings Total
Group, MFIMIAS Balance at Dec 31, 1992 822 436 2 491 – 345 2 533 790 6 727
Share issue 120 798 918Dividend – 126 – 126Purchase of treasury shares – 3 – 3Translation differences 67 86 153Release of accumulated appropriations – 827 827 –Other increase/decrease, net – 27 11 8 – 8Net loss – 1 150 – 1 150
IAS Balance at Dec 31, 1993 822 556 3 329 – 348 1 717 435 6 511Share issue 120 2 370 2 490Dividend – 193 – 193Purchase of treasury shares – 89 – 89Translation differences – 206 14 – 192Release of accumulated appropriations 49 – 49 –Other increase/decrease, net – 101 101 1 – 39 – 10 – 48Net profit 3 939 3 939
IAS Balance at Dec 31, 1994 721 777 5 494 – 437 1 727 4 136 12 418IAS Balance at Dec 31,1993 822 556 3 329 – 348 1 717 435 6 511
Treasury shares – 188 348 -160 –Associated companies 143 143Other FAS-adjustments 382 382Untaxed reserves – 1 717 – 1 717
FAS Balance at Dec 31, 1993 822 556 3 141 – – 800 5 319
IAS Balance at Dec 31,1994 721 777 5 494 – 437 1 727 4 136 12 418Treasury shares – 248 437 – 189 –Other FAS-adjustments 166 166Untaxed reserves – 1 727 – 1 727
FAS Balance at Dec 31, 1994 721 777 5 246 – – 4 113 10 857
Exchange differences arisen from loans and financial instruments hedging equities in foreign subsidiaries in 1994amounted to MFIM 259 and were offset against the translation differences arising from consolidation.
Share capital Other restric- Contingency Retained
Common Preferred ted equity reserve earnings Total
Parent Company, MFIMBalance at Dec 31, 1992 822 436 1 455 127 1 664 4 504
Share issue 120 798 918Dividend – 126 – 126Reserved for public worthy causesdecided by the Board – 1 – 1Other decrease, net – 2 – 2Net profit 285 285
Balance at Dec 31, 1993 822 556 2 253 127 1 820 5 578Share issue 120 2 370 2 490Dividend – 193 – 193Reserved for public worthy causesdecided by the Board – 2 – 2Other increase/decrease, net – 101 101 – 20 – 20Net profit 1 455 1 455
Balance at Dec 31, 1994 721 777 4 623 127 3 060 9 308
41

Notes to the Financial Statements
GROUP PARENT COMPANY1994 1993 1994 1993
18. Accumulated Appropriations MFIM MFIM MFIM MFIM
Accumulated depreciation in excess of plan 976 653 68 77Untaxed reserves 751 1 064 428 621
Accumulated appropriations 1 727 1 717 496 698
For tax purposes, companies in Finland and in certain other countries have been able to claim substantial taxdeductions by charging income for tax purposes for adjustments to untaxed reserves and accumulating thesecharges in the balance sheet in untaxed reserve accounts. Due to changes in Finnish tax law, all untaxed reservesin Finnish companies, except for the depreciation in excess of plan reserve, must be utilised or released to incomefor tax purposes by the end of 1997.
No provision for deferred tax in respect of accumulated appropriations has been made under IAS, sincemanagement does not consider that the tax will become payable in the near future, either because– such reserves are unlikely to decrease and therefore tax will continue to be deferred; or– if they decrease, it is because they are used in a manner in line with fiscal legislation, in which event any liability
to tax would continue to be deferred.Deferred tax liability for the accumulated appropriations computed using the tax rate of 25% totalled MFIM 432.
19. Provisions
Provisions include those future expenditure or future losses to which the company is commited or the realisation ofwhich is considered to be probable and which are not likely to yield any further income. These include for instancewarranty accruals and litigation settlements.
GROUP PARENT COMPANYOutstanding Repayment Outstanding Repayment31 Dec 1994 date beyond 31 Dec 1994 date beyond
20. Long-term Liabilities MFIM 5 years MFIM 5 years
Long-term loans are repayable as follows:Bonds 842 150 882 150Convertible bonds 24 – – –Loans from financial institutions 391 9 5 –Pension loans 1 719 834 1 020 378Other long-term finance loans 95 11 72 –Other long-term liabilities 486 487 – –
3 557 1 491 1 979 528
The long-term liabilities as of 31 December 1994 mature as follows:
1995 278 7.2% 173 8.0%1996 843 22.0% 686 31.9%1997 900 23.5% 745 34.6%1998 158 4.1% 10 0.5%1999 165 4.3% 10 0.4%Thereafter 1 491 38.9% 528 24.6%
3 835 100.0% 2 152 100.0%
The currency mix of the Group long-term liabilities as at 31 December 1994
FIM DEM GBP CHF NLG Others
56.2% 16.3% 10.8% 8.7% 5.8% 2.2%
As permitted in Finland, the Group may borrow from its pension fund and related insurance companies amountscontributed during the year at minimum specified interest rates. The interest rate on pension fund loans was
42
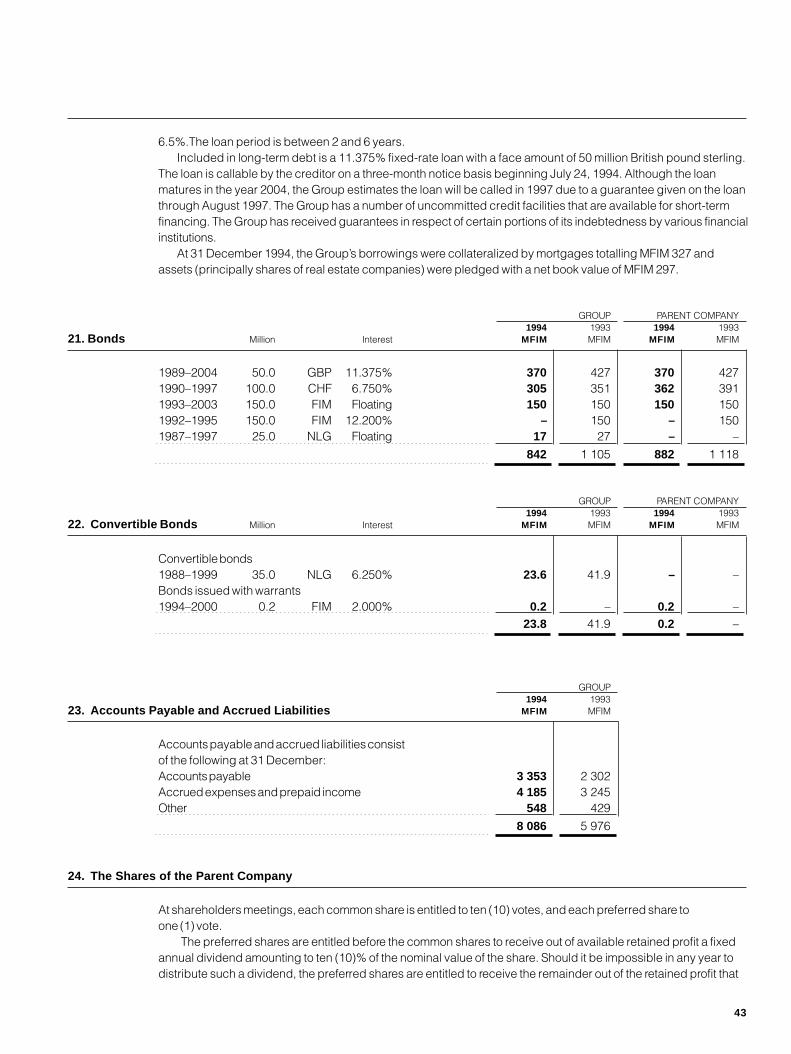
6.5%.The loan period is between 2 and 6 years.Included in long-term debt is a 11.375% fixed-rate loan with a face amount of 50 million British pound sterling.
The loan is callable by the creditor on a three-month notice basis beginning July 24, 1994. Although the loanmatures in the year 2004, the Group estimates the loan will be called in 1997 due to a guarantee given on the loanthrough August 1997. The Group has a number of uncommitted credit facilities that are available for short-termfinancing. The Group has received guarantees in respect of certain portions of its indebtedness by various financialinstitutions.
At 31 December 1994, the Group’s borrowings were collateralized by mortgages totalling MFIM 327 andassets (principally shares of real estate companies) were pledged with a net book value of MFIM 297.
GROUP PARENT COMPANY1994 1993 1994 1993
21. Bonds Million Interest MFIM MFIM MFIM MFIM
1989–2004 50.0 GBP 11.375% 370 427 370 4271990–1997 100.0 CHF 6.750% 305 351 362 3911993–2003 150.0 FIM Floating 150 150 150 1501992–1995 150.0 FIM 12.200% – 150 – 1501987–1997 25.0 NLG Floating 17 27 – –
842 1 105 882 1 118
GROUP PARENT COMPANY1994 1993 1994 1993
22. Convertible Bonds Million Interest MFIM MFIM MFIM MFIM
Convertible bonds1988–1999 35.0 NLG 6.250% 23.6 41.9 – –Bonds issued with warrants1994–2000 0.2 FIM 2.000% 0.2 – 0.2 –
23.8 41.9 0.2 –
GROUP1994 1993
23. Accounts Payable and Accrued Liabilities MFIM MFIM
Accounts payable and accrued liabilities consistof the following at 31 December:Accounts payable 3 353 2 302Accrued expenses and prepaid income 4 185 3 245Other 548 429
8 086 5 976
24. The Shares of the Parent Company
At shareholders meetings, each common share is entitled to ten (10) votes, and each preferred share toone (1) vote.
The preferred shares are entitled before the common shares to receive out of available retained profit a fixedannual dividend amounting to ten (10)% of the nominal value of the share. Should it be impossible in any year todistribute such a dividend, the preferred shares are entitled to receive the remainder out of the retained profit that
43

Notes to the Financial Statements
is available in the following year before any dividend can be distributed on the common shares. Should a dividendhigher than ten (10)% of the nominal value of the share be distributed on the common shares, a supplementarydividend is so distributed on the preferred shares that the dividends will be of equal size for both share classes.
Nokia Corporation’s Extraordinary General meeting held in June 1994 approved amendments to Nokia’sArticles of Association which established the right of holders of common shares to convert their holdings topreferred shares. By 31 December a total of 5 048 794 common shares had been converted to preferred shares.
The shares of the Parent Company are distributed into common shares and preferred shares as follows:
units FIM each FIM
Common shares 36 049 472 20 720 989 440Preferred shares 38 838 023 20 776 760 460
Total 74 887 495 20 1 497 749 900
The above mentioned shares include 3 745 125 shares owned by the Group.The minimum share capital stipulated in the Articles of Association is MFIM 957 and the authorised share
capital FIM 3 828 million. The share capital may be increased or reduced within these limits without amending theArticles of Association.
In April 1994, Nokia’s shareholders approved the issuance of MFIM 0.2 principal amount of 2% bonds withwarrants. Such bonds have been issued to certain members of Nokia’s management as part of an employeeincentive scheme. The term of the bonds is five years. The warrants attached thereto confer the right tosubscribe to an aggregate of 200,000 preferred shares during the period 1 December 1998 – 31 January2000. Such warrants are exercisable at FIM 374 per preferred share, which was the average closing price perpreferred share during March 1994 as reported by the Helsinki stock exchange.
GROUP PARENT COMPANY1994 1993 1994 1993
25. Contingent Liabilities MFIM MFIM MFIM MFIM
Pension fund liabilityLiability of pensions funds 1 27 53 – 20Group companies’ own pension liabilities – 28 – 23
Liability for Bills of Exchange 93 50 – –
MortgagesAs security for loans
For own debts 327 483 5 83Other mortgages
For own commitments 142 239 – 9For Group company commitments 78 10 – –
Assets pledgedAs security for own debt 240 192 169 149As security for debts of Group companies – – 21 21
GuaranteesAs security for loans of Group companies – – 1 797 1 469As security for loans of associated companies 340 363 325 363As security for loans of other companies 2 35 317 25 287
Other guaranteesAs security for own commitments 980 864 – –As security for Group company commitments 58 – 288 646On behalf of associated companies – 1 – –On behalf of other companies 2 1 97 – 95
44
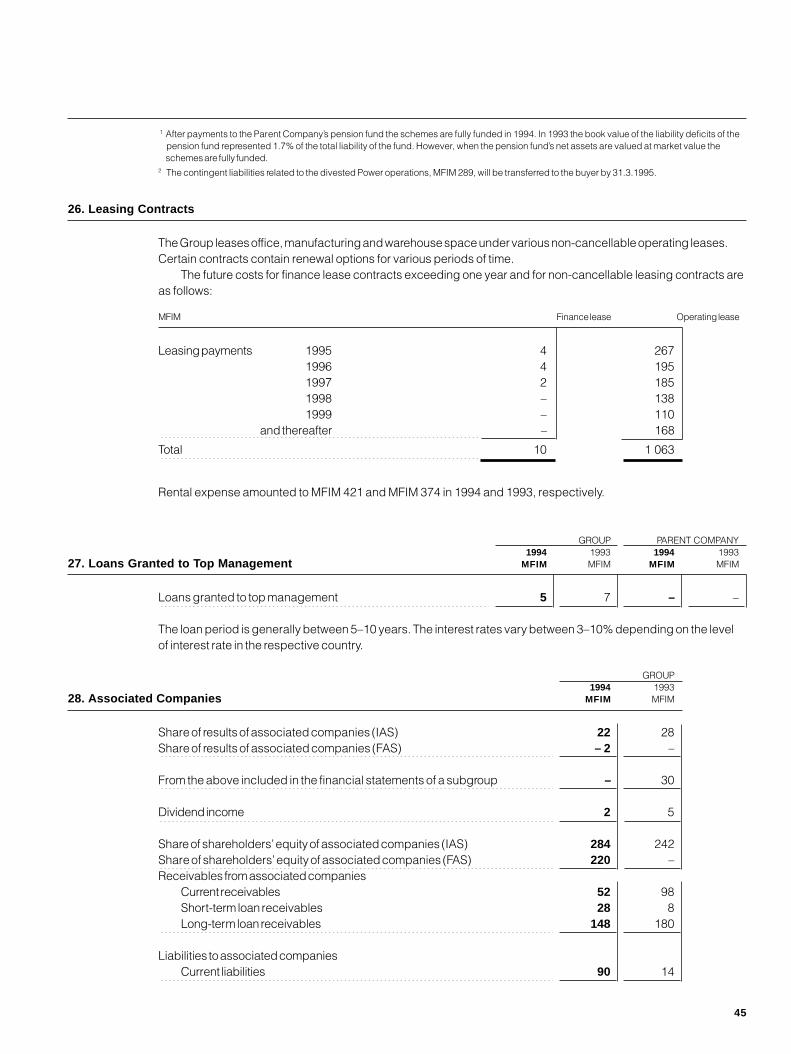
1 After payments to the Parent Company’s pension fund the schemes are fully funded in 1994. In 1993 the book value of the liability deficits of thepension fund represented 1.7% of the total liability of the fund. However, when the pension fund’s net assets are valued at market value theschemes are fully funded.
2 The contingent liabilities related to the divested Power operations, MFIM 289, will be transferred to the buyer by 31.3.1995.
26. Leasing Contracts
The Group leases office, manufacturing and warehouse space under various non-cancellable operating leases.Certain contracts contain renewal options for various periods of time.
The future costs for finance lease contracts exceeding one year and for non-cancellable leasing contracts areas follows:
MFIM Finance lease Operating lease
Leasing payments 1995 4 2671996 4 1951997 2 1851998 – 1381999 – 110
and thereafter – 168
Total 10 1 063
Rental expense amounted to MFIM 421 and MFIM 374 in 1994 and 1993, respectively.
GROUP PARENT COMPANY1994 1993 1994 1993
27. Loans Granted to Top Management MFIM MFIM MFIM MFIM
Loans granted to top management 5 7 – –
The loan period is generally between 5–10 years. The interest rates vary between 3–10% depending on the levelof interest rate in the respective country.
GROUP1994 1993
28. Associated Companies MFIM MFIM
Share of results of associated companies (IAS) 22 28Share of results of associated companies (FAS) – 2 –
From the above included in the financial statements of a subgroup – 30
Dividend income 2 5
Share of shareholders’ equity of associated companies (IAS) 284 242Share of shareholders’ equity of associated companies (FAS) 220 –Receivables from associated companies
Current receivables 52 98Short-term loan receivables 28 8Long-term loan receivables 148 180
Liabilities to associated companiesCurrent liabilities 90 14
45

Notes to the Financial Statements
GROUP PARENT COMPANY1994 1993 1994 1993
29. Notes to Cash Flow Statement MFIM MFIM MFIM MFIM
Adjustments for:
Depreciation 1 009 996 19 41Equity hedging 259 – – –Unrealised foreign exchange gains (–) and losses (+) – 171 79 – 170 185Share of result of associated companies 2 – – –Other operating income and expenses – 222 – 41 – 60 – 101Dividend income – 142 – 157 – 83 – 467Interest income – 405 – 524 – 542 – 562Interest expense 580 850 426 592
Adjustments, total FAS 910 1 203 – 410 – 312IAS-adjustments – 24 16
Adjustments, total IAS 886 1 219
Change in net working capitalShort-term trade receivables, increase (–), decrease (+) – 1 312 – 697 114 – 46Inventories, increase (–), decrease (+) – 2 262 – 1 262 – 2 1Interest-free short-term liabilities, increase (+), decrease (–) 2 124 815 43 6
Change in net working capital, FAS – 1 450 – 1 144 155 – 39IAS-adjustments – 80
Change in net working capital, IAS – 1 450 – 1 064
30. Financial Instruments and Risk Management
The Group operates internationally, giv-ing rise to significant exposure to mar-ket risks from changes in interest andforeign exchange rates. Derivative fi-nancial instruments are utilised by theGroup to reduce those risks, as ex-plained in this note. The Group doesnot currently hold or issue derivativesfor trading purposes.
The Group uses various method-ologies to assess the market risk of itsfinancial assets and liabilities, includingderivatives. Market risk represents thepotential losses for an instrument orportfolio from adverse changes in mar-ket factors. The Group estimates mar-ket risk across all its financial assetsand liabilities using, for instance, dura-tion based price risk techniques andmonitoring the exposures to these mar-ket factors closely.
The forward contracts, options andswap agreements contain an elementof risk that the counterparties may be
unable to mments. Howthe credit rilimiting themestic andnancial instnot expect given their instrumentsthe Group trisk consistbles. Concrespect to tdue to the lcomprisingand their dibusinesses
(a) ForeignRisk ManaThe Group foreign exctransactionTransaction
46
eet the terms of the agree-ever, the Group minimises
sk for these instruments by counterparties to major do- international banks and fi-itutions. Management doesthe counterparties to defaulthigh credit-ratings. Financial which potentially subjecto concentrations of credit principally of trade receiva-entrations of credit risk withrade receivables are limitedarge number of customers the Group’s customer base,spersion across different and geographic regions.
Exchangegemententers into various types ofhange contracts to hedge its risk in various currencies. risk is calculated in each
foreign currency and includes currencydenominated assets and liabilities andcertain off-balance sheet items such asfirm and probable purchase and salecommitments. The currency risks of theGroup occur in various currency combi-nations due to the fact that the Groupoperates and has production and salesin different countries world-wide. As of31 December 1994 and 31 December1993 the FIM equivalent of such for-ward foreign exchange contracts out-standing was FIM 16,575 million andFIM 12,608 million, respectively. The to-tal FIM amount of purchased currencyoptions outstanding as at year-end bal-ance sheet dates was FIM 5,298 millionand FIM 1,023 million, respectively, andof options written in combination withpurchased options FIM 5,328 millionand FIM 682 million, respectively. Theterm of the currency derivatives is rarelymore than one year.

The Group’s policy is to hedge cur-rency risk mostly based on net expo-sures. The impact of these hedgingtransactions is shown as a separateitem in net financial income and ex-pense. The impact of unrealised and re-alised hedging transactions on theprofit and loss account of 1994 wasFIM 450 million. The currency fluctua-tions have had a corresponding impacton the Group’s sale and purchasetransactions in 1994.
The impact of hedging transactionsof firm and anticipated commitments isshown as a part of the sale or purchasetransaction when it is recognised. De-ferred realised and unrealised gains andlosses from these transactions as of 31December 1994 are FIM 61 million andthey are expected to be recognized inincome during the year 1995.
As of the beginning of 1994, theGroup also uses foreign exchange con-tracts to hedge its net investments inforeign subsidiaries. The outstandingamount of forward foreign exchangecontracts used for hedging foreign cur-rency denominated net investments asof 31 December 1994 is FIM 1,834 mil-lion. Foreign exchange differences relat-ing to these contracts are reported intranslation differences in the Group’sequity.
(b) Interest Rate Risk ManagementThe Group enters into various types ofinterest rate derivative contracts tolower its funding costs, to diversifysources of funding, or to alter interestrate exposures arising from mismatchesbetween assets and liabilities.
Interest rate swaps allow the Groupto synthetically adjust the floating ratereceivables and borrowings into fixedrates or vice versa. The Group’s interestrate swaps outstanding as of 31 De-cember 1994 were FIM 937 million andas of 31 December 1993 FIM 1,064million, respectively. Swap contracts areprincipally between two and five yearsin maturity. Interest rate swaps are ac-counted for as hedges of designatedassets and liabilities on an accrual ba-sis. The interest payable and interestreceivable under the swap terms is ac-crued and recorded as an adjustmentto the interest income or expense onthe designated asset or liability.
Forward rate agreements and inter-est rate futures are used by the Groupto offset changes in the interest rateson short-term floating-rate debt orshort-term investments. As of 31 De-cember 1994 the FIM equivalent of in-terest rate forward and futures con-tracts outstanding was FIM 2,145 mil-lion. Most FRA’s are accounted for ashedges on short-term debt or short-term investments. The amounts re-
ceived or paid on cash settlementwhich represent the gain or loss on aninterest rate forward contract are de-ferred and recognized over the life ofthe underlying financial instrument asan adjustment to interest income or ex-pense.
The Group enters into interest rateoption contracts, including cap, floorand collar agreements, to reduce theimpact of changes in interest rates onits net interest rate exposure. Thoseagreements are normally entered intowhen the fixed rates available under in-terest rate swaps are considered toohigh relative to the Group’s view aboutthe level of future interest rates. The no-tional amount of interest rate optionsoutstanding as of 31 December 1994and 31 December 1993 was FIM 3,180million and FIM 882 million, respectively.The Group’s option contracts haveterms of up to five years.
The premiums paid for interest rateoptions purchased are included in othercurrent finance receivables and the pre-miums received for interest options soldin other current finance liabilities in thebalance sheet and are amortised to in-terest income or expense over theterms of the agreements. Amounts re-ceivable and payable under the agree-ments and gains or losses realised onoptions are recognised as yield adjust-ments over the life of the contract.
47
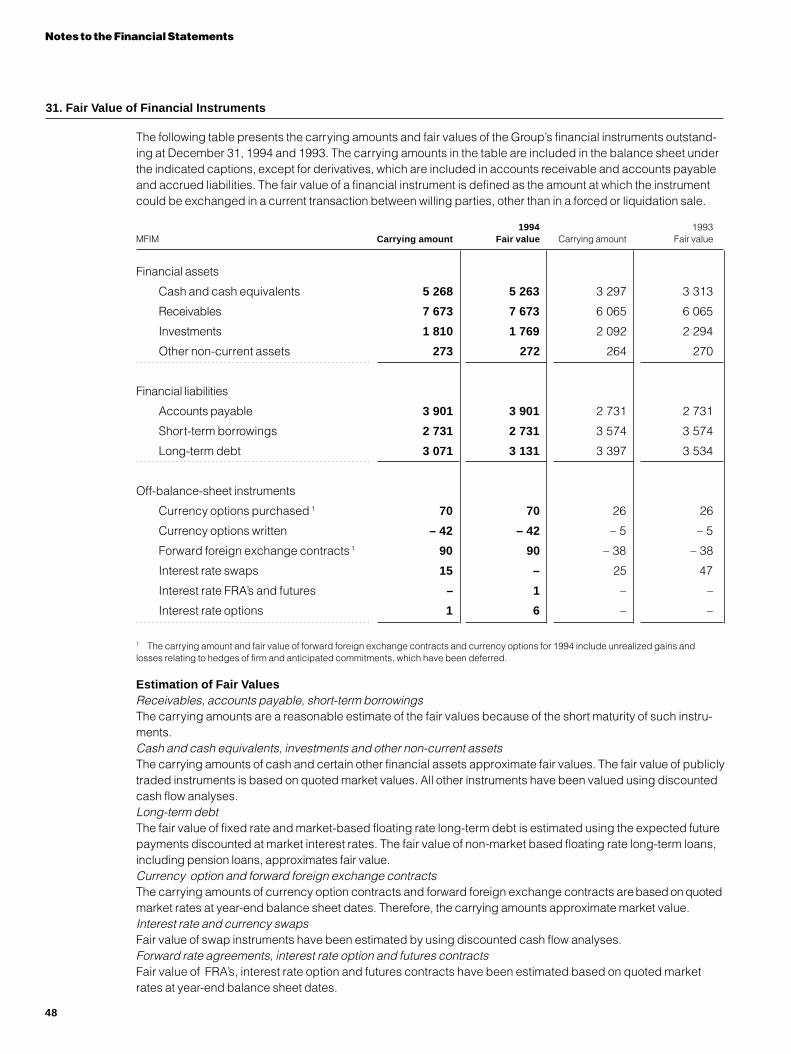
Notes to the Financial Statements
The following table presents the carrying amounts and fair values of the Group’s financial instruments outstand-ing at December 31, 1994 and 1993. The carrying amounts in the table are included in the balance sheet underthe indicated captions, except for derivatives, which are included in accounts receivable and accounts payableand accrued liabilities. The fair value of a financial instrument is defined as the amount at which the instrumentcould be exchanged in a current transaction between willing parties, other than in a forced or liquidation sale.
1994 1993MFIM Carrying amount Fair value Carrying amount Fair value
Financial assets
Cash and cash equivalents 5 268 5 263 3 297 3 313
Receivables 7 673 7 673 6 065 6 065
Investments 1 810 1 769 2 092 2 294
Other non-current assets 273 272 264 270
Financial liabilities
Accounts payable 3 901 3 901 2 731 2 731
Short-term borrowings 2 731 2 731 3 574 3 574
Long-term debt 3 071 3 131 3 397 3 534
Off-balance-sheet instruments
Currency options purchased 1 70 70 26 26
Currency options written – 42 – 42 – 5 – 5
Forward foreign exchange contracts 1 90 90 – 38 – 38
Interest rate swaps 15 – 25 47
Interest rate FRA’s and futures – 1 – –
Interest rate options 1 6 – –
1 The carrying amount and fair value of forward foreign exchange contracts and currency options for 1994 include unrealized gains andlosses relating to hedges of firm and anticipated commitments, which have been deferred.
Estimation of Fair ValuesReceivables, accounts payable, short-term borrowingsThe carrying amounts are a reasonable estimate of the fair values because of the short maturity of such instru-ments.Cash and cash equivalents, investments and other non-current assetsThe carrying amounts of cash and certain other financial assets approximate fair values. The fair value of publiclytraded instruments is based on quoted market values. All other instruments have been valued using discountedcash flow analyses.Long-term debtThe fair value of fixed rate and market-based floating rate long-term debt is estimated using the expected futurepayments discounted at market interest rates. The fair value of non-market based floating rate long-term loans,including pension loans, approximates fair value.Currency option and forward foreign exchange contractsThe carrying amounts of currency option contracts and forward foreign exchange contracts are based on quotedmarket rates at year-end balance sheet dates. Therefore, the carrying amounts approximate market value.Interest rate and currency swapsFair value of swap instruments have been estimated by using discounted cash flow analyses.Forward rate agreements, interest rate option and futures contractsFair value of FRA’s, interest rate option and futures contracts have been estimated based on quoted marketrates at year-end balance sheet dates.
31. Fair Value of Financial Instruments
48

Net Number Parent Group Total nominal Book32. Principal Nokia Group Companies sales of holding majority value in value
on 31 December 1994 MFIM shares % % 1 000 units FIM 1 000
Nokia TelecommunicationsFI Nokia Cellular Systems Oy 3 220 36 000 100.0 36 000 FIM 36 000FI Nokia Telecommunications Oy 2 559 226 000 100.0 100.0 226 000 FIM 376 000GB Nokia Telecommunications Ltd 1 793 7 300 000 100.0 7 300 GBP 54 086
Nokia Mobile PhonesFI Nokia Matkapuhelimet Oy 6 117 665 60.2 100.0 33 250 FIM 106 704HK Nokia Mobile Phones (HK) Ltd 2 062 5 000 000 100.0 5 000 HKD 11 607KR TMC Company Limited 1 795 232 080 100.0 100.0 2 320 800 KRW 134 332DE Nokia Mobile Phones Produktions-
gesellschaft mbH 1 793 2 100.0 90 DEM 276US Nokia Mobile Phones Manu-
facturing (USA) Inc. 1 002 100 100.0 0.1 USD 168 384
Nokia Consumer and IndustrialElectronics
DE Nokia Unterhaltungselektronik GmbH 2 309 5 100.0 18 001 DEM 56 335FI Salcomp Oy 1 865 30 000 100.0 100.0 30 000 FIM 30 000DE Nokia Electronics Bochum GmbH 1 376 2 100.0 5 000 DEM 15 308FI Nokia Kulutuselektroniikka Oy 1 039 500 000 100.0 50 000 FIM 54 349SE Nokia Satellite Systems AB 714 1 050 100.0 1 050 SEK 72 631
Nokia Cables and MachineryCable IndustryFI Nokia Kaapeli Oy/Nokia Cables Ltd 1 036 79 000 100.0 79 000 FIM 110 000NL NKF Kabel B.V. 987 30 000 55.6 30 000 NLG 82 011DE Nokia Kabel GmbH 708 55.6 50 DEM 61 306DE Kaiser Kabel GmbH 434 3000 55.6 3000 DEM 120 972
MachineryFI Nokia-Maillefer Oy 724 50 015 61.5 50 015 FIM 88 037CH Nokia-Maillefer S.A. 539 15 000 61.5 1 500 CHF 60 066
Other OperationsNokia TyresFI Nokia Renkaat Oy/Nokia Tyres Ltd 767 80 000 80.0 80.0 80 000 FIM 80 000OtherNL Nokia Finance International B.V. 229 99.6 100.0 229 NLG 1 119 105
* The Group’s voting rights are 74%.
Shares in other listed companiesGroup holding more than 5% Group holding % Group voting %
Tietotehdas Oy 8.2 10.0
A complete list of all shareholdings is included in Nokia’s Statutory Accounts.
*
49
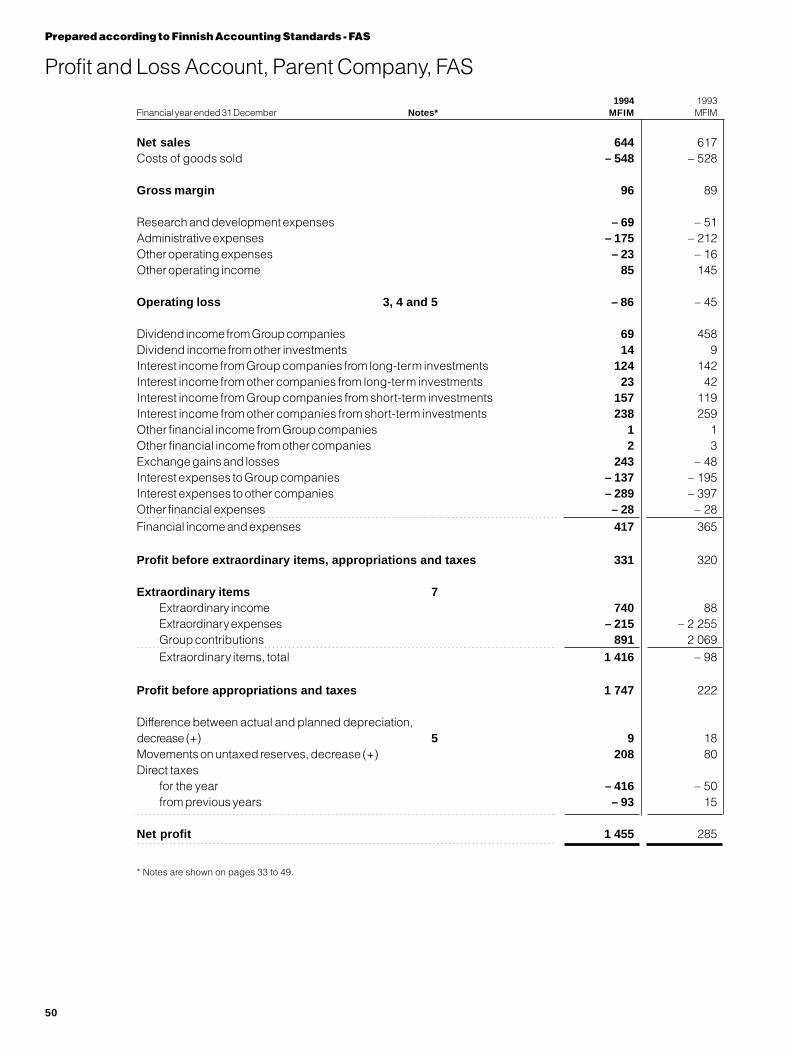
Profit and Loss Account, Parent Company, FAS
Prepared according to Finnish Accounting Standards - FAS
1994 1993Financial year ended 31 December Notes* MFIM MFIM
Net sales 644 617Costs of goods sold – 548 – 528
Gross margin 96 89
Research and development expenses – 69 – 51Administrative expenses – 175 – 212Other operating expenses – 23 – 16Other operating income 85 145
Operating loss 3, 4 and 5 – 86 – 45
Dividend income from Group companies 69 458Dividend income from other investments 14 9Interest income from Group companies from long-term investments 124 142Interest income from other companies from long-term investments 23 42Interest income from Group companies from short-term investments 157 119Interest income from other companies from short-term investments 238 259Other financial income from Group companies 1 1Other financial income from other companies 2 3Exchange gains and losses 243 – 48Interest expenses to Group companies – 137 – 195Interest expenses to other companies – 289 – 397Other financial expenses – 28 – 28Financial income and expenses 417 365
Profit before extraordinary items, appropriations and taxes 331 320
Extraordinary items 7Extraordinary income 740 88Extraordinary expenses – 215 – 2 255Group contributions 891 2 069Extraordinary items, total 1 416 – 98
Profit before appropriations and taxes 1 747 222
Difference between actual and planned depreciation,decrease (+) 5 9 18Movements on untaxed reserves, decrease (+) 208 80Direct taxes
for the year – 416 – 50from previous years – 93 15
Net profit 1 455 285
* Notes are shown on pages 33 to 49.
50

Cash Flow Statement, Parent Company, FAS1994 1993
Financial year ended 31 December Notes* MFIM MFIM
Cash flow from operating activitiesProfit before extraordinary items, approriations and taxes 331 320Adjustments, total 29 – 410 – 312
Operating profit/loss before change in net working capital – 79 8Change in net working capital 29 155 – 39
Cash generated from operations 76 – 31Interest received 511 584Interest paid – 496 – 643Income taxes paid – 110 – 21
Cash flow before extraordinary items – 19 – 111Extraordinary expenses paid 2 071 – 32
Net cash from/used in operating activities 2 052 – 143
Cash flow from investing activities Investments in shares – 584 – 2 556 Capital expenditures – 19 – 23 Proceeds from sale of shares 669 612 Proceeds from sale of fixed assets 9 8 Dividends received 83 467
Net cash from/used in investing activities 158 – 1 492
Cash flow from financing activities Proceeds from issuance of share capital 2 490 918 Proceeds from (+), payments of (–) long-term liabilities – 295 403 Proceeds from (+), payments of (–) short-term borrowings – 1 740 389 Proceeds from (+), payments of (–) long-term receivables 626 – 351 Proceeds from (+), payments of (–) short-term receivables – 929 350 Dividends paid – 195 – 127
Net cash used in/from financing activities – 43 1 582
Net increase (+), decrease (–) in cash and cash equivalents 2 167 – 53Cash and cash equivalents at beginning of period 1 425 1 478
Cash and cash equivalents at end of period 3 592 1 425
51
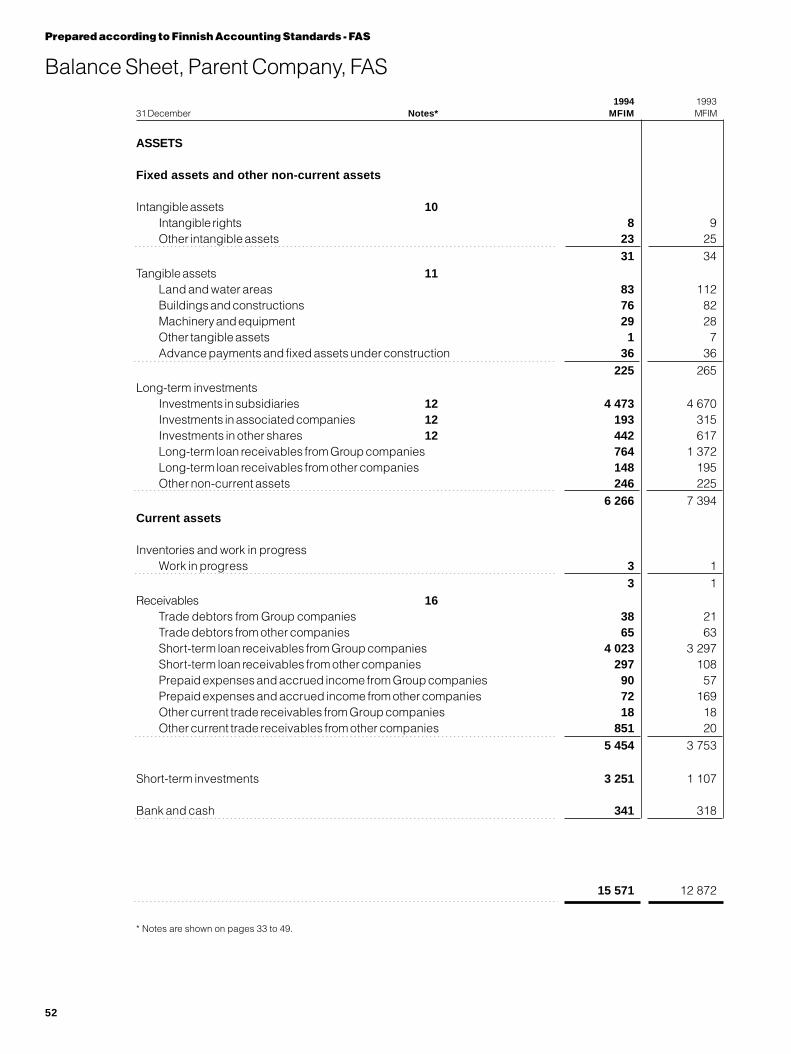
Prepared according to Finnish Accounting Standards - FAS
1994 199331 December Notes* MFIM MFIM
ASSETS
Fixed assets and other non-current assets
Intangible assets 10Intangible rights 8 9Other intangible assets 23 25
31 34Tangible assets 11
Land and water areas 83 112Buildings and constructions 76 82Machinery and equipment 29 28Other tangible assets 1 7Advance payments and fixed assets under construction 36 36
225 265Long-term investments
Investments in subsidiaries 12 4 473 4 670Investments in associated companies 12 193 315Investments in other shares 12 442 617Long-term loan receivables from Group companies 764 1 372Long-term loan receivables from other companies 148 195Other non-current assets 246 225
6 266 7 394Current assets
Inventories and work in progressWork in progress 3 1
3 1Receivables 16
Trade debtors from Group companies 38 21Trade debtors from other companies 65 63Short-term loan receivables from Group companies 4 023 3 297Short-term loan receivables from other companies 297 108Prepaid expenses and accrued income from Group companies 90 57Prepaid expenses and accrued income from other companies 72 169Other current trade receivables from Group companies 18 18Other current trade receivables from other companies 851 20
5 454 3 753
Short-term investments 3 251 1 107
Bank and cash 341 318
15 571 12 872
* Notes are shown on pages 33 to 49.
Balance Sheet, Parent Company, FAS
52
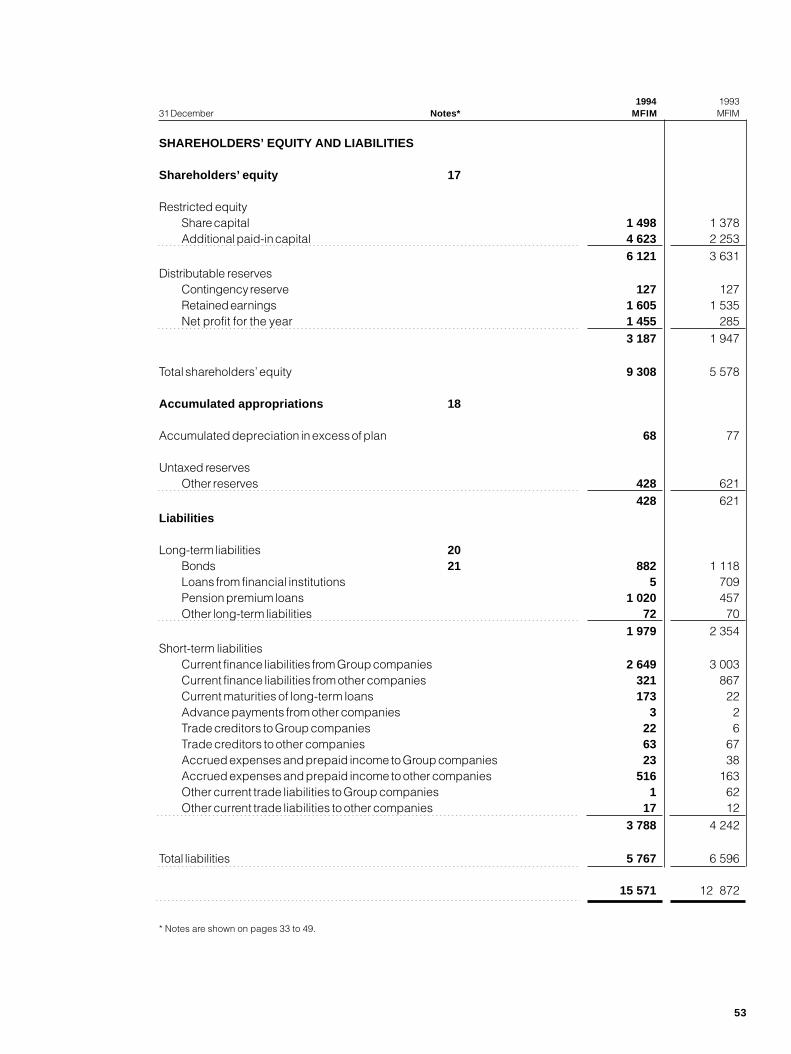
1994 199331 December Notes* MFIM MFIM
SHAREHOLDERS’ EQUITY AND LIABILITIES
Shareholders’ equity 17
Restricted equityShare capital 1 498 1 378Additional paid-in capital 4 623 2 253
6 121 3 631Distributable reserves
Contingency reserve 127 127Retained earnings 1 605 1 535Net profit for the year 1 455 285
3 187 1 947
Total shareholders’ equity 9 308 5 578
Accumulated appropriations 18
Accumulated depreciation in excess of plan 68 77
Untaxed reservesOther reserves 428 621
428 621Liabilities
Long-term liabilities 20Bonds 21 882 1 118Loans from financial institutions 5 709Pension premium loans 1 020 457Other long-term liabilities 72 70
1 979 2 354Short-term liabilities
Current finance liabilities from Group companies 2 649 3 003Current finance liabilities from other companies 321 867Current maturities of long-term loans 173 22Advance payments from other companies 3 2Trade creditors to Group companies 22 6Trade creditors to other companies 63 67Accrued expenses and prepaid income to Group companies 23 38Accrued expenses and prepaid income to other companies 516 163Other current trade liabilities to Group companies 1 62Other current trade liabilities to other companies 17 12
3 788 4 242
Total liabilities 5 767 6 596
15 571 12 872
* Notes are shown on pages 33 to 49.
53

Proposal of the Board to the Annual General Meeting
The distributable reserves in the balance sheet of the Group amount to FIM 4 113 million and thoseof the Company to FIM 3 187 million.
The Board proposes that the funds at the disposal of the Annual General Meeting be paid out as follows:
– a dividend of 50% (FIM 10.00 per share) be paid on 36 049 472common shares (nominal value FIM 721 million) FIM 361 million
– a dividend of 50% (FIM 10.00 per share) be paid on 38 838 023preferred shares (nominal value FIM 777 million) FIM 388 million
FIM 749 million
Helsinki, 28 February 1995
Casimir Ehrnrooth Yrjö Niskanen
Pirkko Alitalo Edward Andersson Ahti Hirvonen
Jouko K. Leskinen Vesa Vainio
Jorma OllilaPresident and CEO
54
Auditors’ Report
To the shareholders of Oy Nokia Ab
We have audited the accounting records, the accounts and the administration of Oy Nokia Ab for the yearended 31 December 1994. The accounts prepared by the Board of Directors and the President and ChiefExecutive Officer include the report of the Board of Directors, consolidated financial statements prepared inaccordance with International Accounting Standards (IAS), consolidated and Parent company profit and lossaccounts, balance sheets, cash flow statements and notes to the financial statements. Based on our audit weexpress an opinion on these accounts and the Parent company’s administration.
We conducted our audit in accordance with Finnish Generally Accepted Auditing Standards. Thosestandards require that we plan and perform the audit in order to obtain reasonable assurance about whether thefinancial statements are free of material misstatement. An audit includes examining, on a test basis, evidencesupporting the amounts and disclosures in the financial statements, assessing the accounting principles usedand significant estimates made by the management, as well as evaluating the overall financial statementpresentation. The purpose of our audit of the administration has been to examine that the Board of Directorsand the President and Chief Executive Officer have complied with the rules of the Finnish Companies’ Act.
In our opinion, the financial statements prepared in accordance with International Accounting Standards(IAS) present fairly, in all material respects, the financial position of Nokia Corporation and subsidiary companiesat the end of the financial period and the consolidated results of their operations, for the year then ended inaccordance with International Accounting Standards.
The accounts showing a consolidated profit of FIM 3 657 834 000 have been prepared in accordancewith the Accounting Act and other rules and regulations governing the preparation of financial statements inFinland. The financial statements give a true and fair view, as defined in the Accounting Act, of both theconsolidated and Parent company result of operations, as well as of the financial position. The accounts can beadopted and the members of the Board of Directors and the President and Chief Executive Officer of the Parentcompany can be discharged from liability for the period audited by us. The proposal made by the Board ofDirectors concerning the disposition of the profit for the year is in compliance with the Companies’ Act.
We have acquainted ourselves with the interim reports published by the company during the year. In ouropinion they have been prepared in accordance with the rules and regulations governing the preparation of suchreports in Finland.
Helsinki, 28 February 1995
Eric Haglund , Lars Blomquist ,Authorised Public Accountant Authorised Public Accountant
(KPMG) (Coopers & Lybrand)
Jussi Hyyppä Heikki Niskakangas Henry Wiklund
55
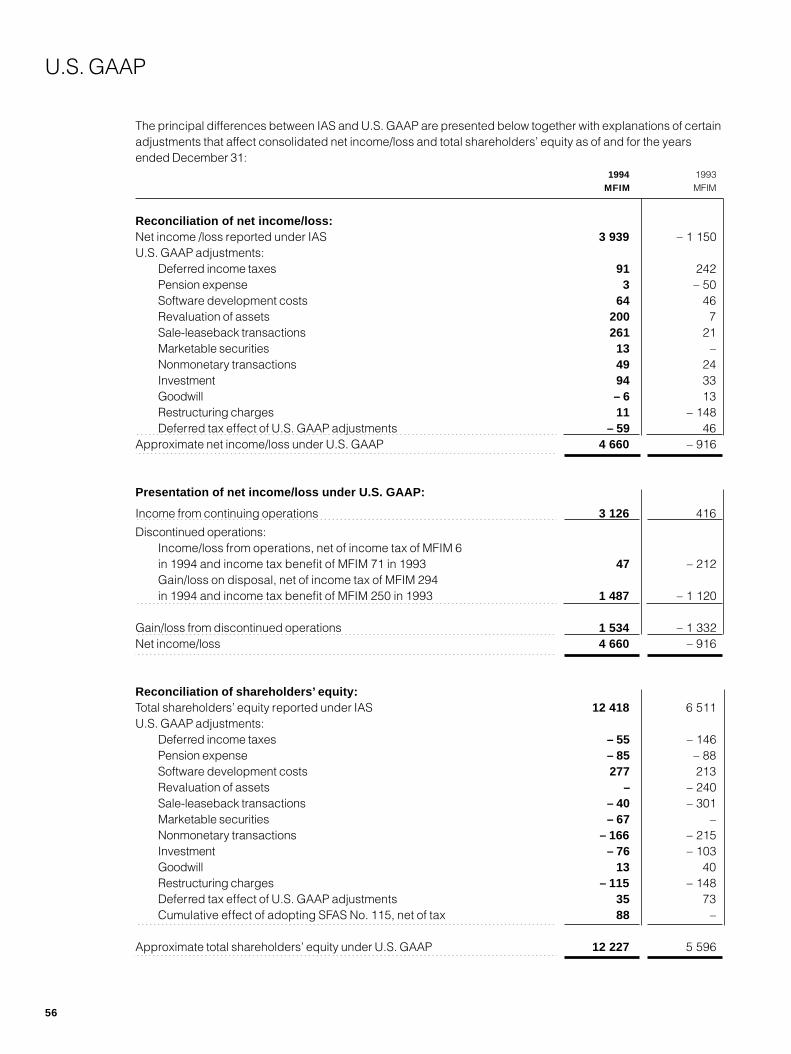
U.S. GAAP
The principal differences between IAS and U.S. GAAP are presented below together with explanations of certainadjustments that affect consolidated net income/loss and total shareholders’ equity as of and for the yearsended December 31:
1994 1993MFIM MFIM
Reconciliation of net income/loss:Net income /loss reported under IAS 3 939 – 1 150U.S. GAAP adjustments:
Deferred income taxes 91 242Pension expense 3 – 50Software development costs 64 46Revaluation of assets 200 7Sale-leaseback transactions 261 21Marketable securities 13 –Nonmonetary transactions 49 24Investment 94 33Goodwill – 6 13Restructuring charges 11 – 148Deferred tax effect of U.S. GAAP adjustments – 59 46
Approximate net income/loss under U.S. GAAP 4 660 – 916
Presentation of net income/loss under U.S. GAAP:
Income from continuing operations 3 126 416
Discontinued operations:Income/loss from operations, net of income tax of MFIM 6in 1994 and income tax benefit of MFIM 71 in 1993 47 – 212Gain/loss on disposal, net of income tax of MFIM 294in 1994 and income tax benefit of MFIM 250 in 1993 1 487 – 1 120
Gain/loss from discontinued operations 1 534 – 1 332Net income/loss 4 660 – 916
Reconciliation of shareholders’ equity:Total shareholders’ equity reported under IAS 12 418 6 511U.S. GAAP adjustments:
Deferred income taxes – 55 – 146Pension expense – 85 – 88Software development costs 277 213Revaluation of assets – – 240Sale-leaseback transactions – 40 – 301Marketable securities – 67 –Nonmonetary transactions – 166 – 215Investment – 76 – 103Goodwill 13 40Restructuring charges – 115 – 148Deferred tax effect of U.S. GAAP adjustments 35 73Cumulative effect of adopting SFAS No. 115, net of tax 88 –
Approximate total shareholders’ equity under U.S. GAAP 12 227 5 596
56
Deferred income taxesUnder IAS deferred income taxes havenot been provided for differences be-tween taxable income and accountingincome that are not expected to re-verse for some considerable period.U.S. GAAP requires recognition of de-ferred income taxes on a comprehen-sive basis for all temporary differences.Under this method, deferred tax liabili-ties and assets are determined basedon the difference between the financialstatement and tax bases of assets andliabilities using enacted tax rates in ef-fect at year-end.
No deferred tax liability has beenrecognised for undistributed earningsof domestic subsidiaries since, in mostcases, such earnings can be trans-ferred to the parent company withouttax consequences. The Group alsodoes not provide deferred income taxeson undistributed earnings of foreignsubsidiaries because such earnings areintended to be permanently reinvestedin those operations.
Pension expenseUnder IAS, the determination of pen-sion expense for defined benefit plansdiffers from the methodology set forthin U.S. GAAP. For purposes of U.S.GAAP, the Group has estimated the ef-fect on net income/loss and sharehold-ers’ equity assuming the application ofSFAS No. 87 in calculating pension ex-pense as of 1 January 1992.
The Group maintains many pensionplans for its operations throughout theworld. Most of these programs are de-
fined benefit pension schemes with re-tirement, disability, death and termina-tion income benefits. The retirement in-come benefits are generally a functionof years of employment and final salarywith Nokia and are generally coordi-nated with local national pensions. TheGroup’s policy for funding its definedbenefit plans is to satisfy local statutoryfunding requirements for tax deductiblecontributions. The Group also maintainssome fully insured schemes, multiem-ployer pension arrangements and de-fined contribution pension arrange-ments.
Software development costsUnder IAS, software development costshave been expensed in the year in-curred. Under U.S. GAAP, such costswould be capitalised after the productinvolved has reached a certain degreeof technical feasibility. Capitalisationceases and depreciation would beginwhen the product becomes available tocustomers. The depreciation period ofthese capitalised assets would be fromthree to five years.
Nonmonetary transactionsUnder IAS, gains were recorded fromcertain nonmonetary transactions in-volving exchanges of assets. UnderU.S. GAAP, such gains would be fully orpartially reversed.
Restructuring chargesIn 1993, negative goodwill was re-corded under IAS based on two acqui-sitions that were made in contemplation
of restructuring of certain Group opera-tions. In addition, charges related to therestructuring of entities that are unre-lated to the two acquired companieswere charged against such negativegoodwill. Net goodwill was recorded asa result.
Under U.S. GAAP, such negativegoodwill would be reversed pursuant topurchase accounting under which cer-tain non-current assets would first bewritten down. Moreover, the restructur-ing charges would be charged to con-tinuing operations since such chargeswould not be considered acquisitioncosts related to the purchased entities.
Discontinued operationsIn 1993, the Group established the planto discontinue the Picture Tubes divi-sion of the Consumer and IndustrialElectronics business group. In 1994,the Group discontinued production andliquidated the operations for an amountin excess of the plan. Accordingly, again on disposal was realised in 1994.
In 1993, the Group sold its electricalwholesale division and certain busi-nesses of the electrotechnical industry,both of which formed part of the Ca-bles and Machinery business group. Inaddition, in 1993 the Group recordedan adjustment to the 1991 disposal ofits computer hardware company, NokiaData.
In 1994, the Group sold its invest-ments in power companies and in thepower division, which formed part ofthe business group entitled Other Op-erations.
57
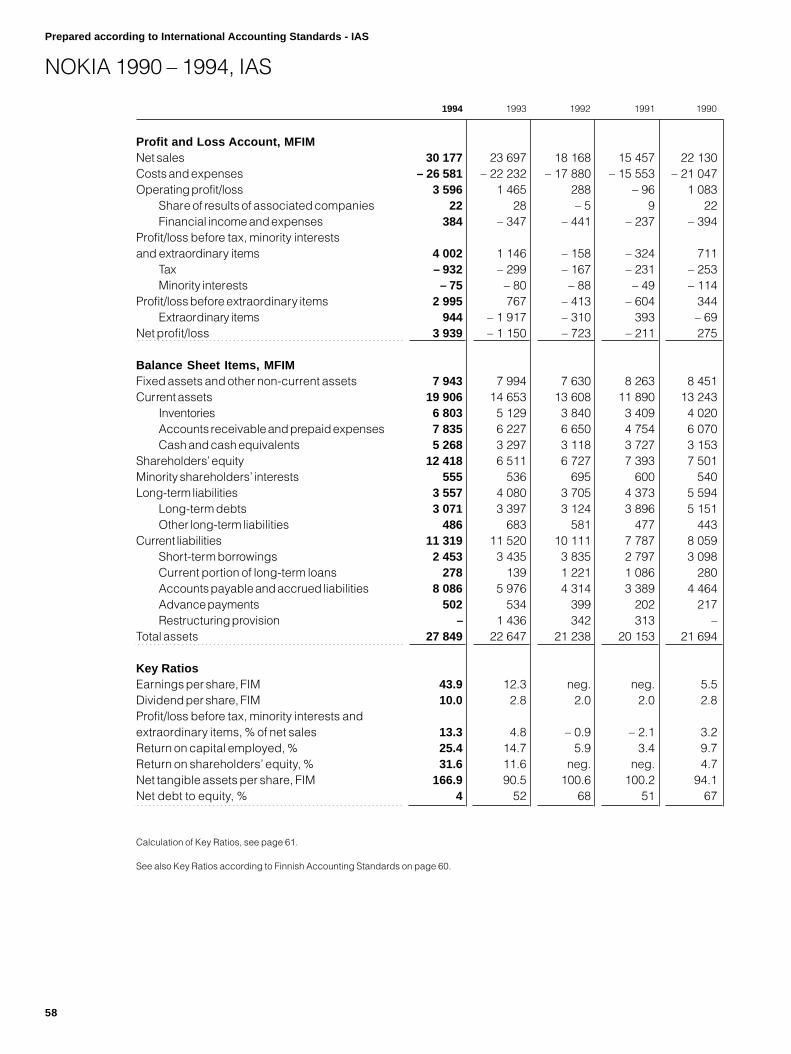
1994 1993 1992 1991 1990
Profit and Loss Account, MFIMNet sales 30 177 23 697 18 168 15 457 22 130Costs and expenses – 26 581 – 22 232 – 17 880 – 15 553 – 21 047Operating profit/loss 3 596 1 465 288 – 96 1 083
Share of results of associated companies 22 28 – 5 9 22Financial income and expenses 384 – 347 – 441 – 237 – 394
Profit/loss before tax, minority interestsand extraordinary items 4 002 1 146 – 158 – 324 711
Tax – 932 – 299 – 167 – 231 – 253Minority interests – 75 – 80 – 88 – 49 – 114
Profit/loss before extraordinary items 2 995 767 – 413 – 604 344Extraordinary items 944 – 1 917 – 310 393 – 69
Net profit/loss 3 939 – 1 150 – 723 – 211 275
Balance Sheet Items, MFIMFixed assets and other non-current assets 7 943 7 994 7 630 8 263 8 451Current assets 19 906 14 653 13 608 11 890 13 243
Inventories 6 803 5 129 3 840 3 409 4 020Accounts receivable and prepaid expenses 7 835 6 227 6 650 4 754 6 070Cash and cash equivalents 5 268 3 297 3 118 3 727 3 153
Shareholders’ equity 12 418 6 511 6 727 7 393 7 501Minority shareholders’ interests 555 536 695 600 540Long-term liabilities 3 557 4 080 3 705 4 373 5 594
Long-term debts 3 071 3 397 3 124 3 896 5 151Other long-term liabilities 486 683 581 477 443
Current liabilities 11 319 11 520 10 111 7 787 8 059Short-term borrowings 2 453 3 435 3 835 2 797 3 098Current portion of long-term loans 278 139 1 221 1 086 280Accounts payable and accrued liabilities 8 086 5 976 4 314 3 389 4 464Advance payments 502 534 399 202 217Restructuring provision – 1 436 342 313 –
Total assets 27 849 22 647 21 238 20 153 21 694
Key RatiosEarnings per share, FIM 43.9 12.3 neg. neg. 5.5Dividend per share, FIM 10.0 2.8 2.0 2.0 2.8Profit/loss before tax, minority interests andextraordinary items, % of net sales 13.3 4.8 – 0.9 – 2.1 3.2Return on capital employed, % 25.4 14.7 5.9 3.4 9.7Return on shareholders’ equity, % 31.6 11.6 neg. neg. 4.7Net tangible assets per share, FIM 166.9 90.5 100.6 100.2 94.1Net debt to equity, % 4 52 68 51 67
Calculation of Key Ratios, see page 61.
See also Key Ratios according to Finnish Accounting Standards on page 60.
Prepared according to International Accounting Standards - IAS
NOKIA 1990 – 1994, IAS
58

* 1992–1994 Nokia Tyres and Nokia Power are included in the group "Other Operations".
** Nokia Data was included in Electronics business groups in 1990.
Net Sales by Business Group, MFIM 1994 1993 1992 1991 1990
Nokia Telecommunications 6 906 4 578 3 207 1 849 2 503Nokia Mobile Phones 10 702 6 314 3 641 2 516 2 333Nokia Consumer and Industrial Electronics 6 769 6 938 5 761 5 281 6 399Nokia Data – – – – 4 893Cables and Machinery 4 768 4 933 4 619 4 719 5 359Basic Industries * – – – 1 525 1 821Other Operations 1 589 1 500 1 354 – –Inter-business group eliminations – 557 – 566 – 414 – 433 – 1 178
Nokia Group 30 177 23 697 18 168 15 457 22 130
Net Sales by Market Area, MFIM 1994 1993 1992 1991 1990
Finland 3 449 3 547 3 691 4 014 6 579Other European countries 17 758 14 448 10 693 8 877 13 581North America and Mexico 3 496 1 985 1 532 768 564Asia/Pacific 3 821 2 768 1 383 1 141 834Other countries 1 653 949 869 657 572
Total 30 177 23 697 18 168 15 457 22 130
Operating Profit/Loss, MFIM 1994 1993 1992 1991 1990
Nokia Telecommunications 1 700 983 427Nokia Mobile Phones 1 745 950 437Nokia Consumer and Industrial Electronics 19 – 747 – 783Electronics business group total ** – 230 522Cables and Machinery 191 261 114 97 383Basic Industries * – – – 216 246Other Operations – 59 18 93 – 179 – 68
Nokia Group 3 596 1 465 288 – 96 1 083
Average Personnel 1994 1993 1992 1991 1990
Nokia Telecommunications 7 187 5 867 4 905 4 474 3 821Nokia Mobile Phones 5 826 3 759 3 147 3 545 3 271Nokia Consumer and Industrial Electronics 8 307 8 675 10 261 10 854 11 573Nokia Data – – – – 7 719Cables and Machinery 4 963 5 893 6 682 7 766 8 373Basic Industries * – – – 1 874 2 112Other Operations 1 760 1 607 1 775 654 467
Nokia Group 28 043 25 801 26 770 29 167 37 336
In Finland 14 984 13 813 13 752 14 588 18 096
Outside Finland 13 059 11 988 13 018 14 579 19 240
59
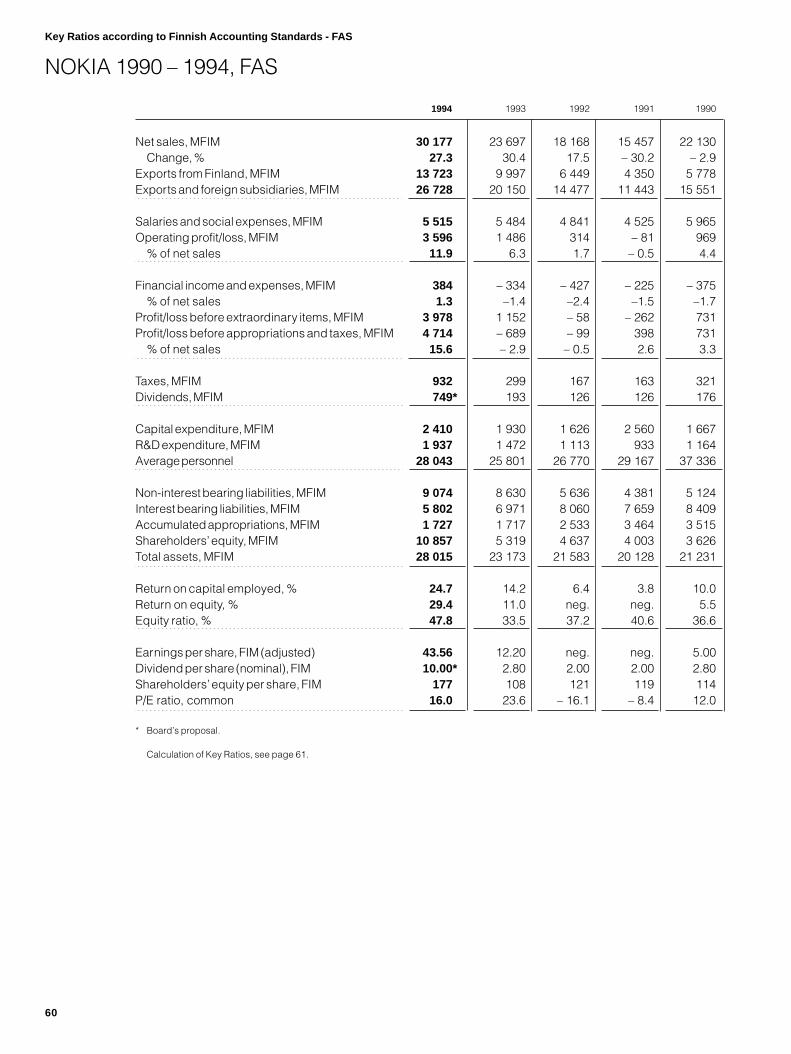
NOKIA 1990 – 1994, FAS
1994 1993 1992 1991 1990
Net sales, MFIM 30 177 23 697 18 168 15 457 22 130Change, % 27.3 30.4 17.5 – 30.2 – 2.9
Exports from Finland, MFIM 13 723 9 997 6 449 4 350 5 778Exports and foreign subsidiaries, MFIM 26 728 20 150 14 477 11 443 15 551
Salaries and social expenses, MFIM 5 515 5 484 4 841 4 525 5 965Operating profit/loss, MFIM 3 596 1 486 314 – 81 969
% of net sales 11.9 6.3 1.7 – 0.5 4.4
Financial income and expenses, MFIM 384 – 334 – 427 – 225 – 375% of net sales 1.3 –1.4 –2.4 –1.5 –1.7
Profit/loss before extraordinary items, MFIM 3 978 1 152 – 58 – 262 731Profit/loss before appropriations and taxes, MFIM 4 714 – 689 – 99 398 731
% of net sales 15.6 – 2.9 – 0.5 2.6 3.3
Taxes, MFIM 932 299 167 163 321Dividends, MFIM 749* 193 126 126 176
Capital expenditure, MFIM 2 410 1 930 1 626 2 560 1 667R&D expenditure, MFIM 1 937 1 472 1 113 933 1 164Average personnel 28 043 25 801 26 770 29 167 37 336
Non-interest bearing liabilities, MFIM 9 074 8 630 5 636 4 381 5 124Interest bearing liabilities, MFIM 5 802 6 971 8 060 7 659 8 409Accumulated appropriations, MFIM 1 727 1 717 2 533 3 464 3 515Shareholders’ equity, MFIM 10 857 5 319 4 637 4 003 3 626Total assets, MFIM 28 015 23 173 21 583 20 128 21 231
Return on capital employed, % 24.7 14.2 6.4 3.8 10.0Return on equity, % 29.4 11.0 neg. neg. 5.5Equity ratio, % 47.8 33.5 37.2 40.6 36.6
Earnings per share, FIM (adjusted) 43.56 12.20 neg. neg. 5.00Dividend per share (nominal), FIM 10.00* 2.80 2.00 2.00 2.80Shareholders’ equity per share, FIM 177 108 121 119 114P/E ratio, common 16.0 23.6 – 16.1 – 8.4 12.0
* Board’s proposal.
Calculation of Key Ratios, see page 61.
Key Ratios according to Finnish Accounting Standards - FAS
60

Calculation of Key Ratios
Key Ratios under IAS
Operating profit/loss =Profit/loss after depreciation
Shareholders’ equity =Share capital + reserves
Earnings per share =Profit/loss before extraordinary itemsAverage of adjusted number of shares during the year
P/E ratio =Adjusted share price, 31 DecemberEarnings per share
Cash flow per share =Profit/loss before extraordinary items +minority interests + depreciationAverage of adjusted number of shares during the year
Dividend per share =Nominal dividend per shareThe adjustment coefficients of the share issues that havetaken place during or after the year in question
Dividend cover =Earnings per shareDividend per share
Dividend yield, % =Nominal dividend per shareShare price
Shareholders’ equity per share =Shareholders’ equityAdjusted number of shares at year end
Market capitalisation =Number of shares x share price per share class
Adjusted average share price =Amount traded, in FIM, during the periodAdjusted number of shares traded during the period
Share turnover, % =Number of shares traded during the periodAverage number of shares during the period
Return on capital employed, % =Profit/loss before taxes, minority interests andextraordinary items + interest and other financial expensesAverage shareholders’ equity + short-term borrowings+ long-term loans (including the current portionthereof) + minority shareholders’ interests
Return on shareholders’ equity, % =Profit/loss before extraordinary itemsAverage shareholders’ equity during the year
Net tangible assets per share =Shareholders’ equity – goodwill and other intangible assetsAdjusted number of shares at year end
Net debt to equity, % =Long-term loans (including the current portion thereof)+ short-term borrowings – cash and cash equivalentsShareholders’ equity + minority shareholders’ interests
Key Ratios under FAS
Return on capital employed, % =Profit/loss before extraordinary items + interest and other financial expensesAverage total assets – interest-free liabilities
Return on equity, % =Profit/loss before extraordinary items – taxesAverage shareholders’ equity + minority shareholders’interests + accumulated appropriations
Equity ratio, % =Shareholders’ equity + minority shareholders’ interests +accumulated appropriationsTotal assets – advance payments received
Earnings per share =Profit/loss before extraordinary items – taxes– minority shareholder’s interestsAverage of adjusted number of shares outstanding
Shareholders’ equity per share =Shareholders’ equity + accumulated appropriationsAdjusted number of shares outstanding at the year end
P/E ratio =Adjusted share price, 31 DecemberEarnings per share
Currency Rates 31 Dec.
1994 1993 1992 1991 1990
USD 4.743 5.785 5.245 4.125 3.626GBP 7.409 8.554 7.957 7.718 6.954SEK 0.636 0.695 0.744 0.743 0.642DEM 3.062 3.335 3.249 2.719 2.411FRF 0.887 0.982 0.953 0.794 0.708
Average Rates
1994 1993 1992 1991 1990
5.230 5.692 4.475 4.031 3.8297.989 8.541 7.827 7.129 6.7800.675 0.731 0.765 0.669 0.6453.217 3.447 2.872 2.444 2.3640.941 1.008 0.846 0.717 0.700
61

Board of Directors, Group Executive Board and Auditors, 1 March 1995
62
Board of Directors
ChairmanCasimir Ehrnrooth, 63Chairman of the Board,Kymmene Corporation
Vice ChairmanYrjö Niskanen, 62Chairman and CEO,Pohjola Insurance Company Ltd
Pirkko Alitalo, 45Chief Financial Officer,Pohjola Insurance Company Ltd
Edward Andersson, 61Professor,University of Helsinki
Ahti Hirvonen, 63Chairman of the Board,Unitas Ltd
Jouko K. Leskinen, 51CEO,Sampo Insurance Company Ltd
Vesa Vainio, 52President and CEO,Unitas Ltd
SecretaryHarry Collin
Group Executive Board
ChairmanJorma Ollila, 44President and CEO
Matti Alahuhta, 42Pekka Ala-Pietilä, 38Sari Baldauf, 39Hannu Bergholm, 45Tapio Hintikka, 52Olli-Pekka Kallasvuo, 41Yrjö Neuvo, 51Paavo Rantanen, 61
Auditors
Eric Haglund, 60Authorised Public Accountant (KPMG)Lars Blomquist, 51Authorised Public Accountant(Coopers & Lybrand)Jussi Hyyppä, 64Heikki Niskakangas, 47Henry Wiklund, 46
DeputiesKPMG Wideri Oy AbAuthorised Public Accountant(Deputy to Eric Haglund)Paavo Hohti, 50Jorma Routti, 56
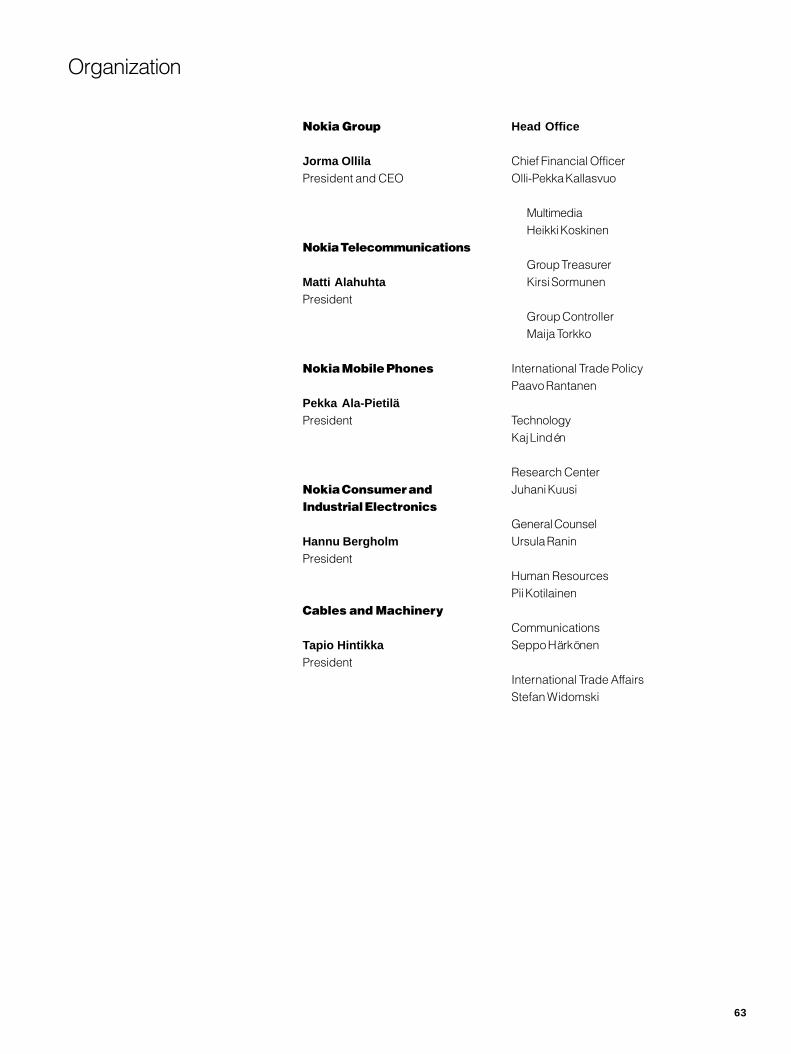
Organization
Nokia Group
Jorma OllilaPresident and CEO
Nokia Telecommunications
Matti AlahuhtaPresident
Nokia Mobile Phones
Pekka Ala-PietiläPresident
Nokia Consumer andIndustrial Electronics
Hannu BergholmPresident
Cables and Machinery
Tapio HintikkaPresident
Head Office
Chief Financial OfficerOlli-Pekka Kallasvuo
MultimediaHeikki Koskinen
Group TreasurerKirsi Sormunen
Group ControllerMaija Torkko
International Trade PolicyPaavo Rantanen
TechnologyKaj Lindén
Research CenterJuhani Kuusi
General CounselUrsula Ranin
Human ResourcesPii Kotilainen
CommunicationsSeppo Härkönen
International Trade AffairsStefan Widomski
63

Nokia TelecommunicationsMatti Alahuhta
Cellular Systems Sari BaldaufMobile Switching Lauri MelamiesBase Stations Christian KurténNew Radio Technologies Eero VallströmUS PCS 1900 Jyrki SaloPrivate Mobile Radio Tapio Heikkilä
Network and Access Systems Mikko HeikkonenNetwork Systems Mikael v. HertzenAccess Systems Kari SuneliCellular Transmission Jukka T. Bergqvist
System Platforms and Customer ServicesTero LaaksonenSwitching Platforms Keijo OlkkolaIntelligent Networks andNetwork Management SystemsJussi IlmarinenCustomer Services Pekka Oranen
Special Systems Pentti Koponen
Area Management - Europe Pekka VartiainenArea Management - Southeast Asiaand Pacific Kari AholaArea Management - Greater ChinaFolke Ahlbäck
Finance and Control Tapio LindforsBusiness Planning Aarne Sipilä(as of 1 April 1995)Legal Affairs Timo RuikkaHuman Resources Raimo NordforsCommunications Martin SandelinArja Suominen (as of 1 April 1995 )
Business Groups
64
Nokia Mobile PhonesPekka Ala-Pietilä
Sales and MarketingAmericas Kari-Pekka WilskaEurope and Africa Anssi VanjokiAPAC and Gulf Jouko HäyrynenProduct Marketing Nigel Litchfield
Research and Development Yrjö NeuvoProduct Development Pekka Valjus
Production Frank McGovern
Sourcing Veikko Laakko
Control and Planning Tuomo AlamäkiLegal Affairs Urho IlmonenHuman Resources Juhani HokkanenQuality Paul MalyonCommunications Lauri Kivinen
Nokia Consumer and Industrial ElectronicsHannu Bergholm
Nokia Consumer Electronics
Televisions Markku AlasaariVCR Hartmut VossSatellite and Cable ProductsHannu BergholmMonitors Reijo Lantto
Technology and New BusinessesHelmut SteinMarketing Michael SchmohlSales and Channel ManagementStefan Majurin
Finance and Control Riitta-Liisa HiillosPersonnel Maila BergmanLegal Affairs Juhani AnttilaStrategic Planning Timo Ellilä
Nokia Industrial ElectronicsHannu Suominen
Audio Systems Ulrich GammCar Electronics Sami BaghdadiComponents Kari Kiiskinen
Control Matthew Symcox
Nokia Group has opera-
tions in over 40 coun-
tries, including 13 with
manufacturing facilities.
The Corporate Head
Office is in Helsinki.

Cables and MachineryTapio Hintikka
Business Development Risto SuonioAdministration and Finance Ove KarlssonLegal Affairs Risto RämöPersonnel Tuula Granroth
Nokia Cable IndustryTapio Hintikka
Central Region Tonn van de LaarTelecommunication CablesHans-Peter FriedrichsenPower Cables Winfried WollekProjects Tonn van de Laar
Northern Region Petteri WalldénTelecommunication Cables Pekka BöökPower Cables Olli-Heikki KyllönenInstallation Cables Kirsi VäljäOptical Fibres Claus Hohenthal
Turkey Jan Cieremans
Cable MachineryJaakko Asanti
Telecommunication Cable MachineryKari SaarinenSales and Marketing & Research andDevelopmentPlants ProjectsTero Larmia
Tapio LanoPower Cable Machinery Oiva MiettinenFibre Optic Cable MachineryMarkku Ellilä
Pentti HätäläBuilding, Appliance and AutomotiveCable Machinery Christian KohlerTubes and Conducts MachineryFranz JermannCustomer Service Georges Duruz
Business Development Pentti HätäläFinance and Administration Jouko VirtaLegal Affairs Pirjo Lattion-AutioHuman Resources Mikael Frisk
Nokia TyresLasse Kurkilahti
Car and Van Tyres Kim GranHeavy Tyres Antero TurunenBicycle Hannu HemánusRetreading Materials Keijo VikmanRetail Matti Vesala
Finance and Control Jukka LahtiMarketing Pentti RantalaProduction Reijo KorpelaProduct Development Antero JuopperiQuality Ari ArvioPurchasing Vesa RantanenPersonnel Sirkka HagmanCommunications Raila Hietala-Hellman
65

Key Ratios 31.12., IAS 1994 1993 1992 1991 1990
Share CapitalCommon 721 822 701 701 701Free common 121 121 121Preferred 777 556 308 308 308Free preferred 128 128 128
Total 1 498 1 378 1 258 1 258 1 258
Shares (1 000, nominal value FIM 20)Common 36 049 41 098 35 065 35 065 35 065Free common 6 033 6 033 6 033Preferred 38 838 27 789 15 401 15 401 15 401Free preferred 6 388 6 388 6 388
Total 74 887 68 887 62 887 62 887 62 887
Shares owned by the Groupat year end (1 000) 3 745 3 445 3 385
Number of shares excl. sharesowned by the Group at year end (1 000) 71 142 65 442 59 502 62 887 62 887
Average number of shares excl. sharesowned by the Group during the year (1 000) 68 232 62 407 60 349 62 887 62 887
Earnings per share, FIM 43.89 12.29 – 6.84 – 9.60 5.47
P/E ratioCommon 15.9 23.4 neg. neg. 11.0Free common neg. neg. 10.4Preferred 15.9 23.5 neg. neg. 6.6Free preferred neg. neg. 10.1
Cash flow per share, FIM 59.8 29.5 10.4 6.1 25.0
Nominal dividend per share, FIM 10.00* 2.80 2.00 2.00 2.80Total dividends paid, MFIM 749* 193 126 126 176Dividend per share, FIM 10.00* 2.80 2.00 2.00 2.80Dividend cover 4.4 4.4 neg. neg. 1.95
Dividend yield, %Common 1.4 1.0 2.2 3.1 4.7Free common 2.1 3.0 4.9Preferred 1.4 1.0 2.5 4.2 7.8Free preferred 2.4 4.3 5.1
Shareholders’ equity per share, FIM 174.6 99.5 113.1 117.6 119.3Market capitalisation, MFIM 49 657 18 875 5 267 3 692 3 354Number of shareholders 24 770 31 486 38 041 50 924 50 975
* ProposedCalculation of key ratios, see page 61.
Data on Nokia Shares
66
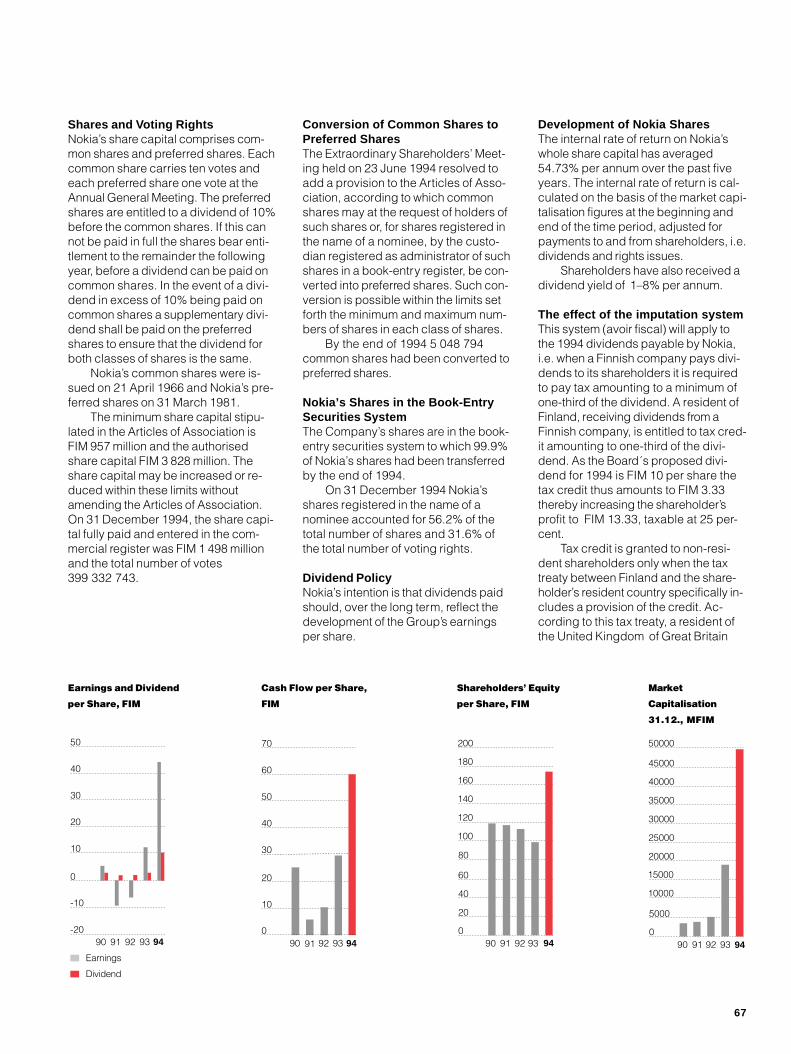
Shares and Voting RightsNokia’s share capital comprises com-mon shares and preferred shares. Eachcommon share carries ten votes andeach preferred share one vote at theAnnual General Meeting. The preferredshares are entitled to a dividend of 10%before the common shares. If this cannot be paid in full the shares bear enti-tlement to the remainder the followingyear, before a dividend can be paid oncommon shares. In the event of a divi-dend in excess of 10% being paid oncommon shares a supplementary divi-dend shall be paid on the preferredshares to ensure that the dividend forboth classes of shares is the same.
Nokia’s common shares were is-sued on 21 April 1966 and Nokia’s pre-ferred shares on 31 March 1981.
The minimum share capital stipu-lated in the Articles of Association isFIM 957 million and the authorisedshare capital FIM 3 828 million. Theshare capital may be increased or re-duced within these limits withoutamending the Articles of Association.On 31 December 1994, the share capi-tal fully paid and entered in the com-mercial register was FIM 1 498 millionand the total number of votes399 332 743.
Conversion of Common Shares toPreferred SharesThe Extraordinary Shareholders’ Meet-ing held on 23 June 1994 resolved toadd a provision to the Articles of Asso-ciation, according to which commonshares may at the request of holders ofsuch shares or, for shares registered inthe name of a nominee, by the custo-dian registered as administrator of suchshares in a book-entry register, be con-verted into preferred shares. Such con-version is possible within the limits setforth the minimum and maximum num-bers of shares in each class of shares.
By the end of 1994 5 048 794common shares had been converted topreferred shares.
Nokia’s Shares in the Book-EntrySecurities SystemThe Company’s shares are in the book-entry securities system to which 99.9%of Nokia’s shares had been transferredby the end of 1994.
On 31 December 1994 Nokia’sshares registered in the name of anominee accounted for 56.2% of thetotal number of shares and 31.6% ofthe total number of voting rights.
Dividend PolicyNokia’s intention is that dividends paidshould, over the long term, reflect thedevelopment of the Group’s earningsper share.
Development of Nokia SharesThe internal rate of return on Nokia’swhole share capital has averaged54.73% per annum over the past fiveyears. The internal rate of return is cal-culated on the basis of the market capi-talisation figures at the beginning andend of the time period, adjusted forpayments to and from shareholders, i.e.dividends and rights issues.
Shareholders have also received adividend yield of 1–8% per annum.
The effect of the imputation systemThis system (avoir fiscal) will apply tothe 1994 dividends payable by Nokia,i.e. when a Finnish company pays divi-dends to its shareholders it is requiredto pay tax amounting to a minimum ofone-third of the dividend. A resident ofFinland, receiving dividends from aFinnish company, is entitled to tax cred-it amounting to one-third of the divi-dend. As the Board´s proposed divi-dend for 1994 is FIM 10 per share thetax credit thus amounts to FIM 3.33thereby increasing the shareholder’sprofit to FIM 13.33, taxable at 25 per-cent.
Tax credit is granted to non-resi-dent shareholders only when the taxtreaty between Finland and the share-holder’s resident country specifically in-cludes a provision of the credit. Ac-cording to this tax treaty, a resident ofthe United Kingdom of Great Britain
Earnings and Dividend
per Share, FIM
90 91 92 93 94-20
-10
0
10
20
30
40
50
90 91 92 93 940
10
20
30
40
50
60
70
Earnings
Dividend
Cash Flow per Share,
FIM
90 91 92 93 940
5000
10000
15000
20000
25000
30000
35000
40000
45000
50000
90 91 92 93 940
20
40
60
80
100
120
140
160
180
200
Shareholders’ Equity
per Share, FIM
Market
Capitalisation
31.12., MFIM
67
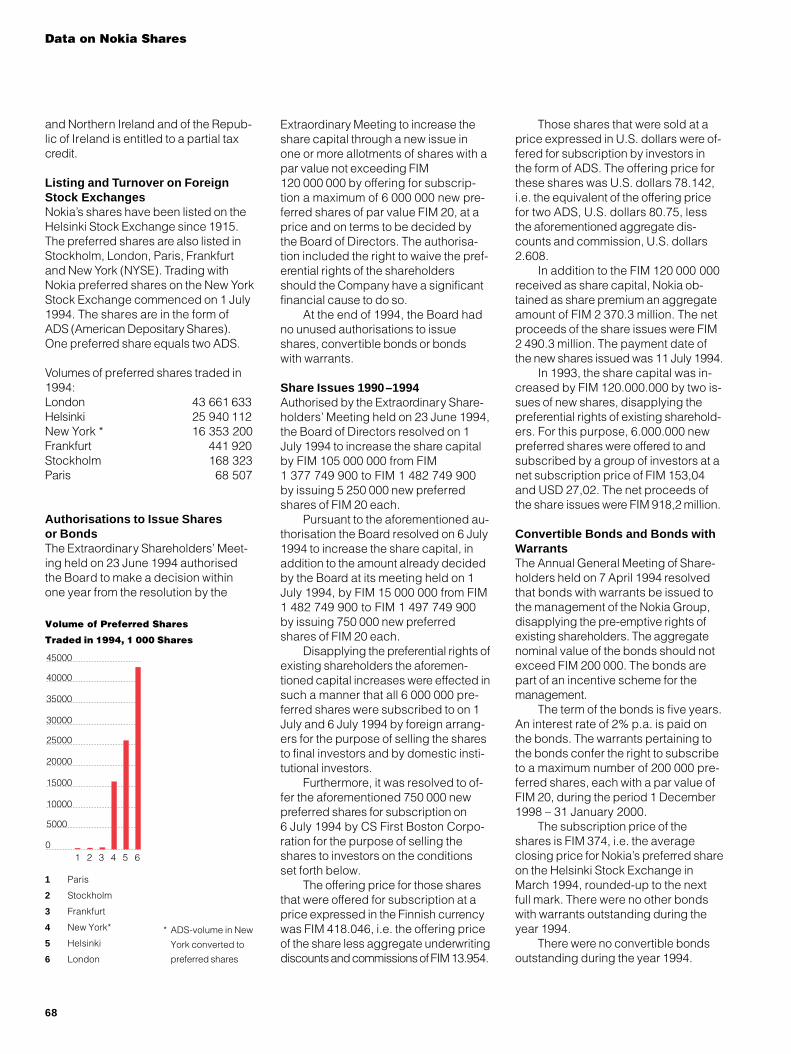
Data on Nokia Shares
and Northern Ireland and of the Repub-lic of Ireland is entitled to a partial taxcredit.
Listing and Turnover on ForeignStock ExchangesNokia’s shares have been listed on theHelsinki Stock Exchange since 1915.The preferred shares are also listed inStockholm, London, Paris, Frankfurtand New York (NYSE). Trading withNokia preferred shares on the New YorkStock Exchange commenced on 1 July1994. The shares are in the form ofADS (American Depositary Shares).One preferred share equals two ADS.
Volumes of preferred shares traded in1994:London 43 661 633Helsinki 25 940 112New York * 16 353 200Frankfurt 441 920Stockholm 168 323Paris 68 507
Authorisations to Issue Sharesor BondsThe Extraordinary Shareholders’ Meet-ing held on 23 June 1994 authorisedthe Board to make a decision withinone year from the resolution by the
1 2 3 4 5 60
5000
10000
15000
20000
25000
30000
35000
40000
45000
Volume of Preferred Shares
Traded in 1994, 1 000 Shares
1 Paris
2 Stockholm
3 Frankfurt
4 New York*
5 Helsinki
6 London
* ADS-volume in New
York converted to
preferred shares
68
Extraordinary Meeting to increase theshare capital through a new issue inone or more allotments of shares with apar value not exceeding FIM120 000 000 by offering for subscrip-tion a maximum of 6 000 000 new pre-ferred shares of par value FIM 20, at aprice and on terms to be decided bythe Board of Directors. The authorisa-tion included the right to waive the pref-erential rights of the shareholdersshould the Company have a significantfinancial cause to do so.
At the end of 1994, the Board hadno unused authorisations to issueshares, convertible bonds or bondswith warrants.
Share Issues 1990–1994Authorised by the Extraordinary Share-holders’ Meeting held on 23 June 1994,the Board of Directors resolved on 1July 1994 to increase the share capitalby FIM 105 000 000 from FIM1 377 749 900 to FIM 1 482 749 900by issuing 5 250 000 new preferredshares of FIM 20 each.
Pursuant to the aforementioned au-thorisation the Board resolved on 6 July1994 to increase the share capital, inaddition to the amount already decidedby the Board at its meeting held on 1July 1994, by FIM 15 000 000 from FIM1 482 749 900 to FIM 1 497 749 900by issuing 750 000 new preferredshares of FIM 20 each.
Disapplying the preferential rights ofexisting shareholders the aforemen-tioned capital increases were effected insuch a manner that all 6 000 000 pre-ferred shares were subscribed to on 1July and 6 July 1994 by foreign arrang-ers for the purpose of selling the sharesto final investors and by domestic insti-tutional investors.
Furthermore, it was resolved to of-fer the aforementioned 750 000 newpreferred shares for subscription on6 July 1994 by CS First Boston Corpo-ration for the purpose of selling theshares to investors on the conditionsset forth below.
The offering price for those sharesthat were offered for subscription at aprice expressed in the Finnish currencywas FIM 418.046, i.e. the offering priceof the share less aggregate underwritingdiscounts and commissions of FIM 13.954.
Those shares that were sold at aprice expressed in U.S. dollars were of-fered for subscription by investors inthe form of ADS. The offering price forthese shares was U.S. dollars 78.142,i.e. the equivalent of the offering pricefor two ADS, U.S. dollars 80.75, lessthe aforementioned aggregate dis-counts and commission, U.S. dollars2.608.
In addition to the FIM 120 000 000received as share capital, Nokia ob-tained as share premium an aggregateamount of FIM 2 370.3 million. The netproceeds of the share issues were FIM2 490.3 million. The payment date ofthe new shares issued was 11 July 1994.
In 1993, the share capital was in-creased by FIM 120.000.000 by two is-sues of new shares, disapplying thepreferential rights of existing sharehold-ers. For this purpose, 6.000.000 newpreferred shares were offered to andsubscribed by a group of investors at anet subscription price of FIM 153,04and USD 27,02. The net proceeds ofthe share issues were FIM 918,2 million.
Convertible Bonds and Bonds withWarrantsThe Annual General Meeting of Share-holders held on 7 April 1994 resolvedthat bonds with warrants be issued tothe management of the Nokia Group,disapplying the pre-emptive rights ofexisting shareholders. The aggregatenominal value of the bonds should notexceed FIM 200 000. The bonds arepart of an incentive scheme for themanagement.
The term of the bonds is five years.An interest rate of 2% p.a. is paid onthe bonds. The warrants pertaining tothe bonds confer the right to subscribeto a maximum number of 200 000 pre-ferred shares, each with a par value ofFIM 20, during the period 1 December1998 – 31 January 2000.
The subscription price of theshares is FIM 374, i.e. the averageclosing price for Nokia’s preferred shareon the Helsinki Stock Exchange inMarch 1994, rounded-up to the nextfull mark. There were no other bondswith warrants outstanding during theyear 1994.
There were no convertible bondsoutstanding during the year 1994.
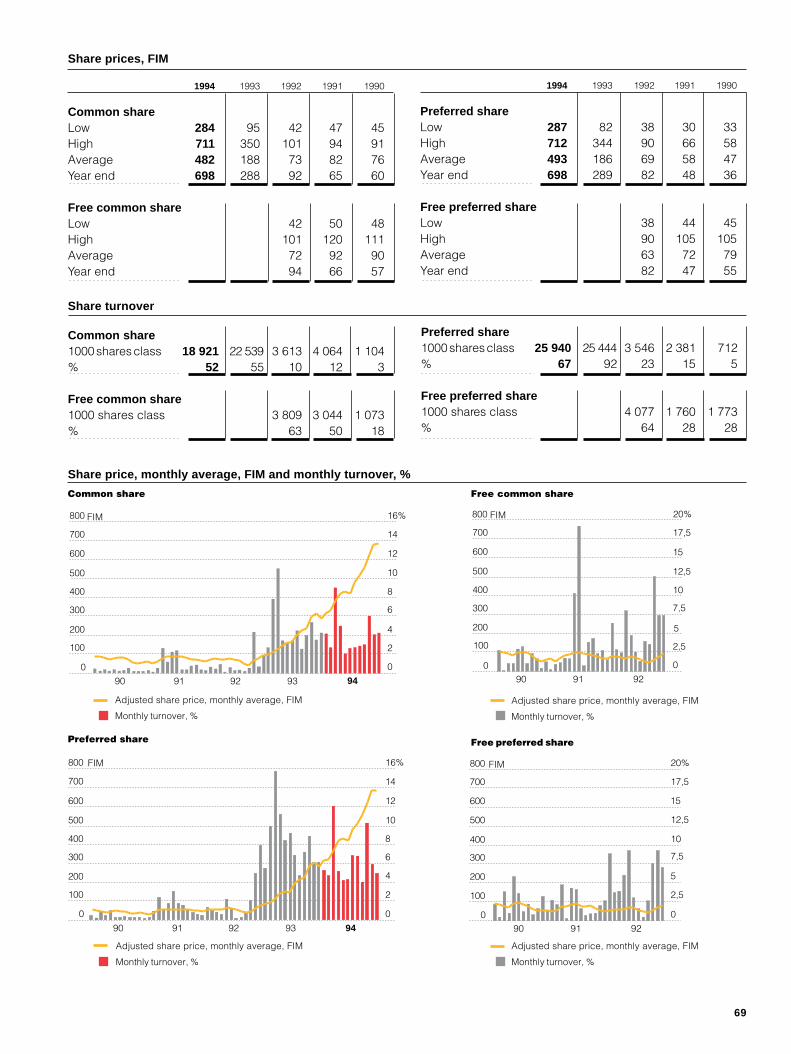
Share prices, FIM
1994 1993 1992 1991 1990
Common shareLow 284 95 42 47 45High 711 350 101 94 91Average 482 188 73 82 76Year end 698 288 92 65 60
Free common shareLow 42 50 48High 101 120 111Average 72 92 90Year end 94 66 57
Share turnover
Common share1000 shares class 18 921 22 539 3 613 4 064 1 104% 52 55 10 12 3
Free common share1000 shares class 3 809 3 044 1 073% 63 50 18
1994 1993 1992 1991 1990
Preferred shareLow 287 82 38 30 33High 712 344 90 66 58Average 493 186 69 58 47Year end 698 289 82 48 36
Free preferred shareLow 38 44 45High 90 105 105Average 63 72 79Year end 82 47 55
Preferred share1000 shares class 25 940 25 444 3 546 2 381 712% 67 92 23 15 5
Free preferred share1000 shares class 4 077 1 760 1 773% 64 28 28
90
0
2
4
6
8
10
12
14
16%
0
100
200
300
400
500
600
700
800
91 92 93 94
90
0
2
4
6
8
10
12
14
16%
0
100
200
300
400
500
600
700
800
91 92 93 94
Adjusted share price, monthly average, FIM
Monthly turnover, %
Preferred share
Adjusted share price, monthly average, FIM
Monthly turnover, %
Share price, monthly average, FIM and monthly turnover, %
Common share
FIM
FIM
0
2,5
5
7,5
10
12,5
15
17,5
20%
0
100
200
300
400
500
600
700
800
90 91 92
0
2,5
5
7,5
10
12,5
15
17,5
20%
0
100
200
300
400
500
600
700
90 91 92
800
Adjusted share price, monthly average, FIM
Monthly turnover, %
Free preferred share
Free common share
Adjusted share price, monthly average, FIM
Monthly turnover, %
FIM
FIM
69
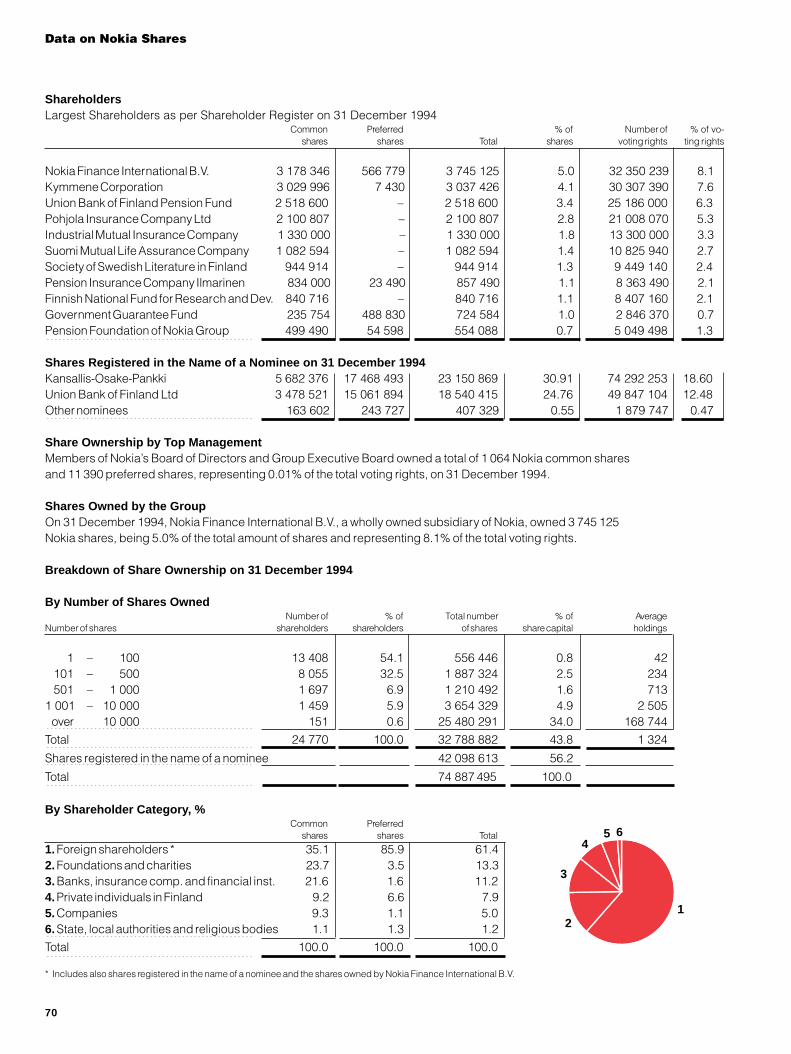
f vo-rights
.1
.6.3.3.3.7.4.1.1.7.3
087
Data on Nokia Shares
ShareholdersLargest Shareholders as per Shareholder Register on 31 December 1994
Common Preferred % of Number of % oshares shares Total shares voting rights ting
Nokia Finance International B.V. 3 178 346 566 779 3 745 125 5.0 32 350 239 8Kymmene Corporation 3 029 996 7 430 3 037 426 4.1 30 307 390 7Union Bank of Finland Pension Fund 2 518 600 – 2 518 600 3.4 25 186 000 6Pohjola Insurance Company Ltd 2 100 807 – 2 100 807 2.8 21 008 070 5Industrial Mutual Insurance Company 1 330 000 – 1 330 000 1.8 13 300 000 3Suomi Mutual Life Assurance Company 1 082 594 – 1 082 594 1.4 10 825 940 2Society of Swedish Literature in Finland 944 914 – 944 914 1.3 9 449 140 2Pension Insurance Company Ilmarinen 834 000 23 490 857 490 1.1 8 363 490 2Finnish National Fund for Research and Dev. 840 716 – 840 716 1.1 8 407 160 2Government Guarantee Fund 235 754 488 830 724 584 1.0 2 846 370 0Pension Foundation of Nokia Group 499 490 54 598 554 088 0.7 5 049 498 1
Shares Registered in the Name of a Nominee on 31 December 1994Kansallis-Osake-Pankki 5 682 376 17 468 493 23 150 869 30.91 74 292 253 18.6Union Bank of Finland Ltd 3 478 521 15 061 894 18 540 415 24.76 49 847 104 12.4Other nominees 163 602 243 727 407 329 0.55 1 879 747 0.4
Share Ownership by Top ManagementMembers of Nokia’s Board of Directors and Group Executive Board owned a total of 1 064 Nokia common sharesand 11 390 preferred shares, representing 0.01% of the total voting rights, on 31 December 1994.
Shares Owned by the GroupOn 31 December 1994, Nokia Finance International B.V., a wholly owned subsidiary of Nokia, owned 3 745 125Nokia shares, being 5.0% of the total amount of shares and representing 8.1% of the total voting rights.
Breakdown of Share Ownership on 31 December 1994
By Number of Shares OwnedNumber of % of Total number % of Average
Number of shares shareholders shareholders of shares share capital holdings
1 – 100 13 408 54.1 556 446 0.8 42101 – 500 8 055 32.5 1 887 324 2.5 234501 – 1 000 1 697 6.9 1 210 492 1.6 713
1 001 – 10 000 1 459 5.9 3 654 329 4.9 2 505over 10 000 151 0.6 25 480 291 34.0 168 744
Total 24 770 100.0 32 788 882 43.8 1 324
Shares registered in the name of a nominee 42 098 613 56.2
Total 74 887 495 100.0
By Shareholder Category, %Common Preferred
shares shares Total
1. Foreign shareholders * 35.1 85.9 61.42. Foundations and charities 23.7 3.5 13.33. Banks, insurance comp. and financial inst. 21.6 1.6 11.24. Private individuals in Finland 9.2 6.6 7.95. Companies 9.3 1.1 5.06. State, local authorities and religious bodies 1.1 1.3 1.2
Total 100.0 100.0 100.0
* Includes also shares registered in the name of a nominee and the shares owned by Nokia Finance International B.V.
6
12
3
45
70
AddressesNOKIA GROUP
Eteläesplanadi 12
P.O. Box 226,
FIN-00101 HELSINKI
Tel. +358 0 180 71
Fax +358 0 656 388
Nokia Research Center
Heikkiläntie 7
P.O. Box 45,
FIN-00211 HELSINKI
Tel. +358 0 437 61
Fax +358 0 437 6227
NOKIATELECOMMUNICATIONS
Upseerinkatu 1
P.O. Box 33, FIN-02601 ESPOO
Tel. +358 0 511 21
Fax +358 0 5112 5560
Nokia Cellular Systems
Upseerinkatu 1
P.O. Box 44, FIN-02601 ESPOO
Tel. +358 0 511 21
Fax +358 0 5112 3435
Network and Access Systems
Karaniityntie 1
P.O. Box 12, FIN-02611 ESPOO
Tel. +358 0 511 21
Fax +358 0 5112 4302
Customer Services and
System Platforms
Mäkkylän puistotie 1
P.O. Box 33, FIN-02601 ESPOO
Tel. +358 0 511 21
Fax +358 0 5112 5298
NOKIA MOBILE PHONES
Metsänneidonkuja 6
P.O. Box 47, FIN-02131 ESPOO
Tel. +358 10 5051
Fax +358 10 505 5768
Nokia Paging
Örninkatu 11
P.O. Box 86, FIN-24101 SALO
Tel. +358 10 5051
Fax +358 10 505 4481
NOKIA CONSUMER ANDINDUSTRIAL ELECTRONICS
Nokia Consumer Electronics
Metsänneidonkuja 6
P.O. Box 46, FIN-02131 ESPOO
Tel. +358 0 682 571
Fax +358 0 5024 0430
Nokia Consumer Electronics
Opitzstraße 12
Postfach 33 04 04
D-40437 DÜSSELDORF
Tel. +49 211 908 9502
Fax +49 211 9089 5505
Nokia Industrial Electronics
Salorankatu 5-7
P.O. Box 14, FIN-24101 Salo
Tel. +358 24 7711
Fax +358 24 771 2024
CABLES AND MACHINERY
Cable Industry
NKF Holding N.V.
Schieweg 9
P.O. Box 26
NL-2600 MC DELFT
Tel. +31 15 605 905
Fax +31 15 615 489
Nokia Cables Ltd
Kimmeltie 1, Espoo
P.O. Box 419,
FIN-00101 HELSINKI
Tel. +358 0 682 51
Fax +358 0 682 1545
Cable Machinery
Nokia-Maillefer Holding S.A.
Route du Bois 37
P.O. Box 259
CH-1024 ECUBLENS-LAUSANNE
Tel. +41 21 694 4111
Fax +41 21 694 4714
OTHER OPERATIONS
Nokia Tyres
P.O. Box 20, FIN-37101 NOKIA
Tel. +358 31 340 7111
Fax +358 31 342 0677, 342 0101
71

72
Nokia publishes theAnnual Report in Finnishas well as translations inSwedish and English
Corporate Communicationstel. +358 0 180 71fax +358 0 652 409
Investor Relationstel. +358 0 180 7424fax +358 0 176 406P.O. Box 226FIN 00101 HELSINKI, Finland
Investor Relations, USAtel. +1 214 257 9880fax +1 214 257 98312300 Valley View LaneSuite 100IrvingTexas, 75062USA


![[A2DP] [AVRCP]...Nokia 2660 ———— — Nokia 2730 classic — Nokia 3109 classic — — Nokia 3110 classic — — Nokia 3120 classic — Nokia 3500 classic — — Nokia 5130](https://img.dokumen.tips/doc/110x75/61006683abc96516e4462928/a2dp-avrcp-nokia-2660-aaaa-a-nokia-2730-classic-a-nokia-3109.jpg)