Embed Size (px)
Citation preview

NoizCrowd: A Crowd-Based Data Gatheringand Management System for Noise Level Data
Mariusz Wisniewski1, Gianluca Demartini1, Apostolos Malatras2,and Philippe Cudre-Mauroux1
1 eXascale Infolab, University of Fribourg—Switzerland2 Pervasive and Artificial Intelligence Group, University of Fribourg—Switzerland
{firstname.lastname}@unifr.ch
Abstract. Many systems require access to very large amounts of datato properly function, like systems allowing to visualize or predict me-teorological changes in a country over a given period of time, or anyother system holding, processing and displaying scientific or sensor data.However, filling out a database with large amounts of valuable data canbe a difficult, costly and time-consuming task. In this paper, we presenttechniques to create large amounts of data by combining crowdsourc-ing, data generation models, mobile computing, and big data analytics.We have implemented our methods in a system, NoizCrowd, allowing tocrowdsource noise levels in a given region and to generate noise modelsby using state-of-the-art noise propagation models and array data man-agement techniques. The resulting models and data can then be accessedusing a visual interface.
1 Introduction
Big data has become a key element to support decision making at different levelsof granularity, for example on continuous streams of data generated by sensorsspread around a given environment (e.g., meteorological stations in cities). An-alytics on sensor data is of high importance to support many critical decisions,such as when stopping the car traffic on certain days to limit pollution. However,sensors are expensive to install and maintain and need to be placed at specificgeographical locations, which are typically application and context-dependent.Acquiring, deploying, and maintaining a large-scale sensing infrastructure for agiven problem is hence difficult, costly and time-consuming.
In this paper we propose NoizCrowd: a crowd-sensing approach to big datageneration using commodity sensors. The proposed system, built on top of adatabase management system for data-intensive applications, is able to collectstreams of data from participating users’ mobile devices and generate additionaldata thanks to statistical models based on the crowd input. NoizCrowd alsoprovides dynamic visualizations of both sensor and model data to support userdecision queries, for instance to determine regions with low noise levels in a givenneighborhood to build a house or buy an apartment.
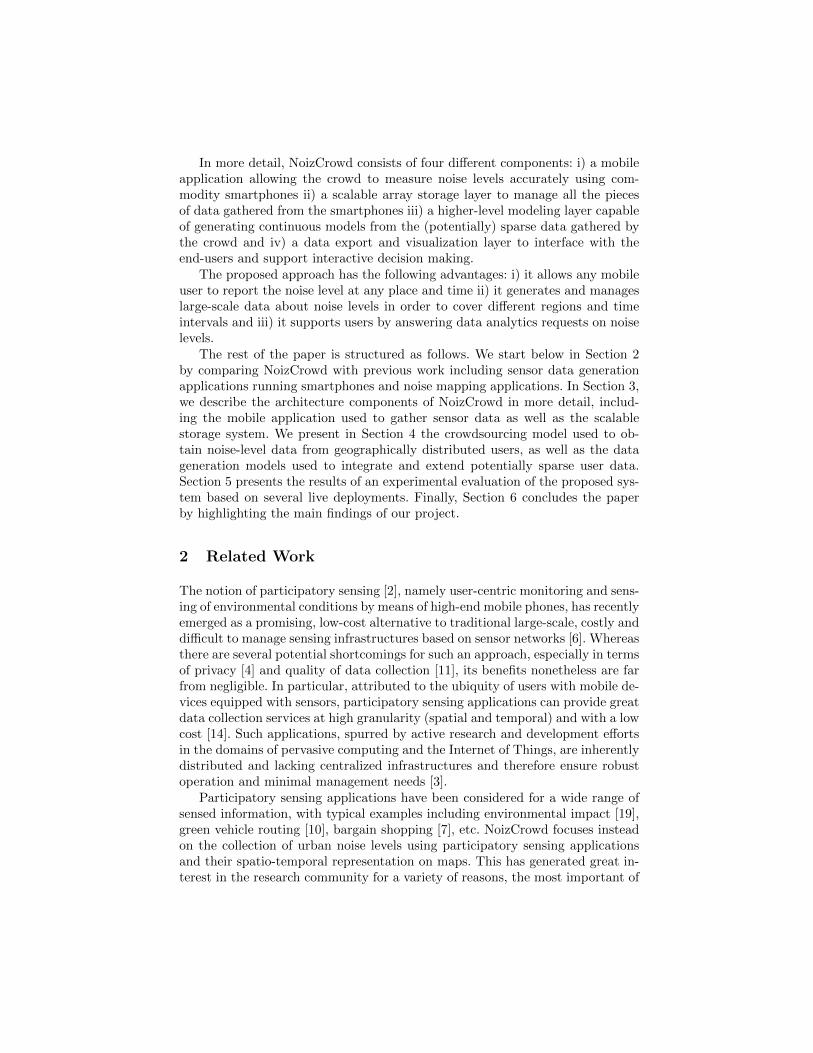
In more detail, NoizCrowd consists of four different components: i) a mobileapplication allowing the crowd to measure noise levels accurately using com-modity smartphones ii) a scalable array storage layer to manage all the piecesof data gathered from the smartphones iii) a higher-level modeling layer capableof generating continuous models from the (potentially) sparse data gathered bythe crowd and iv) a data export and visualization layer to interface with theend-users and support interactive decision making.
The proposed approach has the following advantages: i) it allows any mobileuser to report the noise level at any place and time ii) it generates and manageslarge-scale data about noise levels in order to cover different regions and timeintervals and iii) it supports users by answering data analytics requests on noiselevels.
The rest of the paper is structured as follows. We start below in Section 2by comparing NoizCrowd with previous work including sensor data generationapplications running smartphones and noise mapping applications. In Section 3,we describe the architecture components of NoizCrowd in more detail, includ-ing the mobile application used to gather sensor data as well as the scalablestorage system. We present in Section 4 the crowdsourcing model used to ob-tain noise-level data from geographically distributed users, as well as the datageneration models used to integrate and extend potentially sparse user data.Section 5 presents the results of an experimental evaluation of the proposed sys-tem based on several live deployments. Finally, Section 6 concludes the paperby highlighting the main findings of our project.
2 Related Work
The notion of participatory sensing [2], namely user-centric monitoring and sens-ing of environmental conditions by means of high-end mobile phones, has recentlyemerged as a promising, low-cost alternative to traditional large-scale, costly anddifficult to manage sensing infrastructures based on sensor networks [6]. Whereasthere are several potential shortcomings for such an approach, especially in termsof privacy [4] and quality of data collection [11], its benefits nonetheless are farfrom negligible. In particular, attributed to the ubiquity of users with mobile de-vices equipped with sensors, participatory sensing applications can provide greatdata collection services at high granularity (spatial and temporal) and with a lowcost [14]. Such applications, spurred by active research and development effortsin the domains of pervasive computing and the Internet of Things, are inherentlydistributed and lacking centralized infrastructures and therefore ensure robustoperation and minimal management needs [3].
Participatory sensing applications have been considered for a wide range ofsensed information, with typical examples including environmental impact [19],green vehicle routing [10], bargain shopping [7], etc. NoizCrowd focuses insteadon the collection of urban noise levels using participatory sensing applicationsand their spatio-temporal representation on maps. This has generated great in-terest in the research community for a variety of reasons, the most important of
which is the ubiquity of sound sensors, i.e. microphones, in current mobile de-vices. Moreover, urban noise levels are becoming increasingly important due tothe related health concerns [18], as well as the associated regulatory frameworksand citizen concerns [1]. It is noteworthy that during an experiment regardingcitizen engagement based on participatory sensing applications [8], people iden-tified noise pollution as one of the most prominent information that should bemonitored using applications like NoizCrowd.
NoiseTube [9] is one of the most interesting participatory noise mappingapplications. It has been made available to the public through an open-sourcelicense and this has led to its widespread usage leading to contributions regard-ing noise levels for more than 250 locations around the world. NoiseTube allowsusers to annotate their data readings with social tags, thus allowing for semanticanalysis of the collected data, while it additionally provides powerful signal pro-cessing techniques on the mobile phones to process received sound levels with ahigh degree of accuracy. NoiseMap [24] is an application built on the same prin-ciples as NoiseTube, with the distinctive characteristics of allowing users controlover the collected data, while in parallel supporting real-time representation ofuser submitted data. Another application that maps noise levels in a city exploit-ing participatory sensing readings is SoundOfTheCity [23], in which semantictags are also used to annotate noise readings. The SoundSense framework [15]also collects audio data from the user’s vicinity, but instead of submitting rawdata to the centralized participatory application it instead utilizes lightweightyet powerful machine learning algorithms to classify sound-related events that itthen depicts on a map. Amongst other similar systems, we distinguish the Nois-eSPY [12] application that maps noise levels using users’ smartphones as sensors;the latter pre-processes the data prior to making it available, by calculating noiselevels according to specific guidelines. This ensures more homogeneous data be-ing represented on the map, namely classes of different noise levels, as well asreduced communication overhead in terms of information reporting.
As compared to existing systems, the advantages of NoizCrowd are twofold:NoizCrowd is capable of producing noise data in RDF format. This enablesnew kind of semantic applications by linking the generated data with otherdatasets in the Linked Open Data cloud3. Furthermore, the use of a scalablestorage system together with noise propagation models to generate missing dataguarantee better coverage of user requests both in time and space.
Regarding the collected data, there are a lot of issues concerning their gran-ularity, i.e., lack of data for particular locations, which can compromise theoperation of such participatory sensing applications. The Ear-Phone participa-tory noise mapping system [21] has a functional behavior similar to that of theprevious applications and aims to address the problem of incomplete data inthe context of noise collection. In this respect, it employs compressive sensingtechniques and data projection models to enhance and account for the aforemen-tioned problem. The simulation and real-world deployment evaluation resultsregarding data optimization are quite promising. In the same line of thinking,
3 http://linkeddata.org
Mendez et al. present several data interpolation methods to improve the qualityof incomplete and random data in participatory sensing applications targetingenvironmental monitoring [17]. With the same optimization goal, the DrOPSsystem that was recently presented in [20] utilizes model-driven approaches andonline learning mechanisms to predict missing data readings from existing ones.We diverge from this work by focusing on noise data collection and their par-ticularities, i.e. sound dissipation. Lastly, one of the biggest concerns in partici-patory sensing is ensuring that users are actively contributing and sharing theirdata [22], since it could eventually lead to poor performance due to the lack ofaccurate and informative representations. This problem has also been consid-ered in the context of noise mapping, where a persuasive, motivating game wasconsidered in [16] to stimulate user data collection and sharing.
3 Architecture
As stated above, NoizCrowd consists of a scalable system allowing the crowd toaccurately measure noise levels using their mobile phones, an array-based storagecomponent for data-intensive applications, a model generation and managementlayer, as well as a data export and a visualization interface to support decisionmaking. The overall system architecture is depicted in Figure 1. The rest of thissection presents each of those four components in more detail.
3.1 Data Gathering
For a noise level mapping system such as NoizCrowd, gathering vast amounts ofdata over wide areas is key. Deploying noise sensors over a large geographical areawould introduce substantial deployment and maintenance costs. Our approach tosolve this problems is to use crowdsourcing. Indeed, nowadays many people usesmartphones with an integrated global positioning system (GPS), a microphoneas well as an Internet connection. These are the elements needed to record noiselevels, measure the coordinates of the location where it was measured, and sendsuch data to the NoizCrowd back-end server.
Since smartphones were typically not designed as noise meters, the first prob-lem we face is to map the sound levels one can capture with his or her smart-phones to standards decibels. This requires a third-party sound level meter tocalibrate the microphone of the smartphone. Since such devices are relativelyuncommon, we decided to crowdsource this problem too; For each smartphonemodel, any user from the crowd can enter through our application a conversiontable linking the noise levels as recorded by his or her device to real decibelsas recorded by a sound level meter. Such conversion tables are then shared toall other participants having a similar smartphone through our application. Weapply a majority-vote algorithm to select the most popular values in those con-version tables when several participants register different values for a given soundlevel.
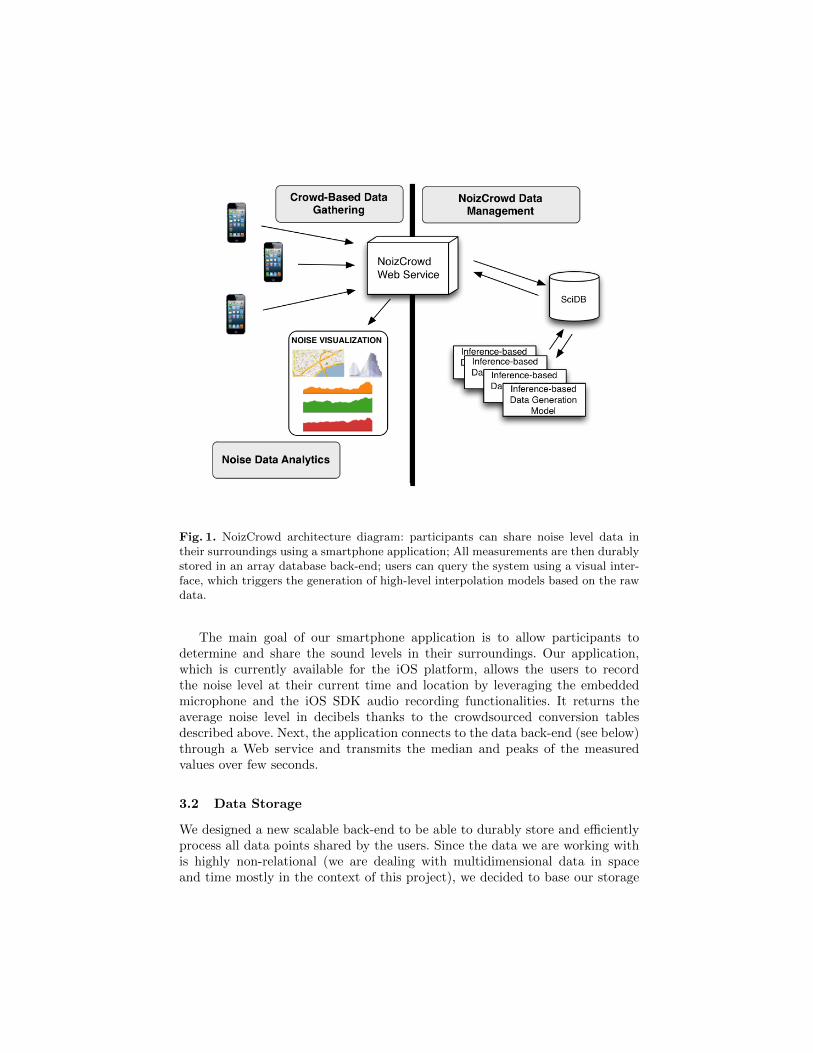
Fig. 1. NoizCrowd architecture diagram: participants can share noise level data intheir surroundings using a smartphone application; All measurements are then durablystored in an array database back-end; users can query the system using a visual inter-face, which triggers the generation of high-level interpolation models based on the rawdata.
The main goal of our smartphone application is to allow participants todetermine and share the sound levels in their surroundings. Our application,which is currently available for the iOS platform, allows the users to recordthe noise level at their current time and location by leveraging the embeddedmicrophone and the iOS SDK audio recording functionalities. It returns theaverage noise level in decibels thanks to the crowdsourced conversion tablesdescribed above. Next, the application connects to the data back-end (see below)through a Web service and transmits the median and peaks of the measuredvalues over few seconds.
3.2 Data Storage
We designed a new scalable back-end to be able to durably store and efficientlyprocess all data points shared by the users. Since the data we are working withis highly non-relational (we are dealing with multidimensional data in spaceand time mostly in the context of this project), we decided to base our storage
components on SciDB [5], a new array-based open-source database system fordata-intensive applications. The back-end of NoizCrowd is responsible for threemain tasks: receiving and durably storing all the data points shared by the users,providing all the required data to build higher-level models, and transformingand exporting relevant data for visualization purposes.
We store all value points shared by the user in multidimensional arrays. Twoof the array dimensions represent spatial information (latitude and longitude),discretized using a fixed grid size4. The third array dimension represents anunbounded temporal axis, also discretized every hour in order to regroup tem-porally close measurements into one single value. All array values received bythe crowd are durably stored in the database; the cell values are versioned [25]such that if a new value is received for a given array cell within one hour, it isstored as new versions of the older value.
This potentially extremely large array is stored as a compressed and sparsematrix on disk (i.e., only those cells that contain an actual value are materializedon disk). The array is chunked (i.e., split) both in time and space, and theresulting array chunks are stored on clusters of commodity machines if very largeamounts of data are received from the crowd (see [5] for details on chunking anddistributed storage in SciDB).
This array database layer is used to efficiently build higher-level data models(see below Section 3.3) by selecting slices of values in space and time. It isused in a similar manner by the data export and visualization component toextract relevant data and present them to the end-user to support aggregatedinformation visualization and decision making.
3.3 Noise Modeling
The noise level values captured by the crowd are intrinsically sparse and noisy.We cannot expect all areas and time periods to be covered by end-users. Re-alistically, the data gathered will hence be highly skewed, with urban areasreceiving way more data points than remote areas for instance. Also, the valuescollected by the users are inherently noisy, because of potential hardware dif-ferences between the smartphones (e.g., slightly different microphones used fora given smartphone model), and the high variability of ambient noise levels inurban areas.
To tackle both data sparsity and data fluctuations, NoizCrowd does not pro-vide raw measurements to the end-users but builds instead higher-layer modelsfrom the data gathered. The modeling component that integrates overlappingvalues and generates missing data by interpolating crowdsourced observations isdescribed in more detail in Section 4, while our interpolation models are exper-imentally validated in 5.
4 Typically, we use a grid size of 10m given the accuracy of current smartphone posi-tioning systems.
3.4 Data Export and Visualization
The data gathered from the crowd as well as the data generated by means ofinterpolation can then be used by end-users, either as an RDF export, or througha data visualization layer.
The export component regularly pulls data from the models and convertsthem into RDF triples for export. We use our own dipLODocus[RDF] system [26]to compactly store all data and to expose a SPARQL interface to whomever isinterested in querying some of the exported data.
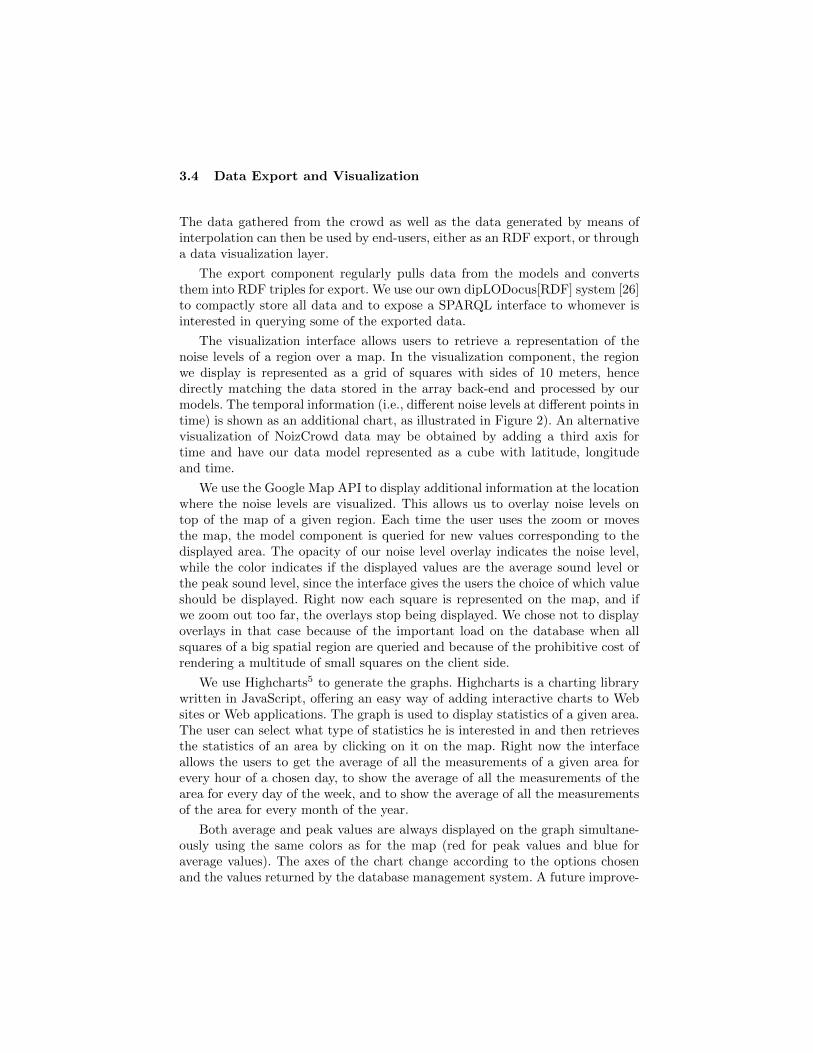
The visualization interface allows users to retrieve a representation of thenoise levels of a region over a map. In the visualization component, the regionwe display is represented as a grid of squares with sides of 10 meters, hencedirectly matching the data stored in the array back-end and processed by ourmodels. The temporal information (i.e., different noise levels at different points intime) is shown as an additional chart, as illustrated in Figure 2). An alternativevisualization of NoizCrowd data may be obtained by adding a third axis fortime and have our data model represented as a cube with latitude, longitudeand time.
We use the Google Map API to display additional information at the locationwhere the noise levels are visualized. This allows us to overlay noise levels ontop of the map of a given region. Each time the user uses the zoom or movesthe map, the model component is queried for new values corresponding to thedisplayed area. The opacity of our noise level overlay indicates the noise level,while the color indicates if the displayed values are the average sound level orthe peak sound level, since the interface gives the users the choice of which valueshould be displayed. Right now each square is represented on the map, and ifwe zoom out too far, the overlays stop being displayed. We chose not to displayoverlays in that case because of the important load on the database when allsquares of a big spatial region are queried and because of the prohibitive cost ofrendering a multitude of small squares on the client side.
We use Highcharts5 to generate the graphs. Highcharts is a charting librarywritten in JavaScript, offering an easy way of adding interactive charts to Websites or Web applications. The graph is used to display statistics of a given area.The user can select what type of statistics he is interested in and then retrievesthe statistics of an area by clicking on it on the map. Right now the interfaceallows the users to get the average of all the measurements of a given area forevery hour of a chosen day, to show the average of all the measurements of thearea for every day of the week, and to show the average of all the measurementsof the area for every month of the year.
Both average and peak values are always displayed on the graph simultane-ously using the same colors as for the map (red for peak values and blue foraverage values). The axes of the chart change according to the options chosenand the values returned by the database management system. A future improve-
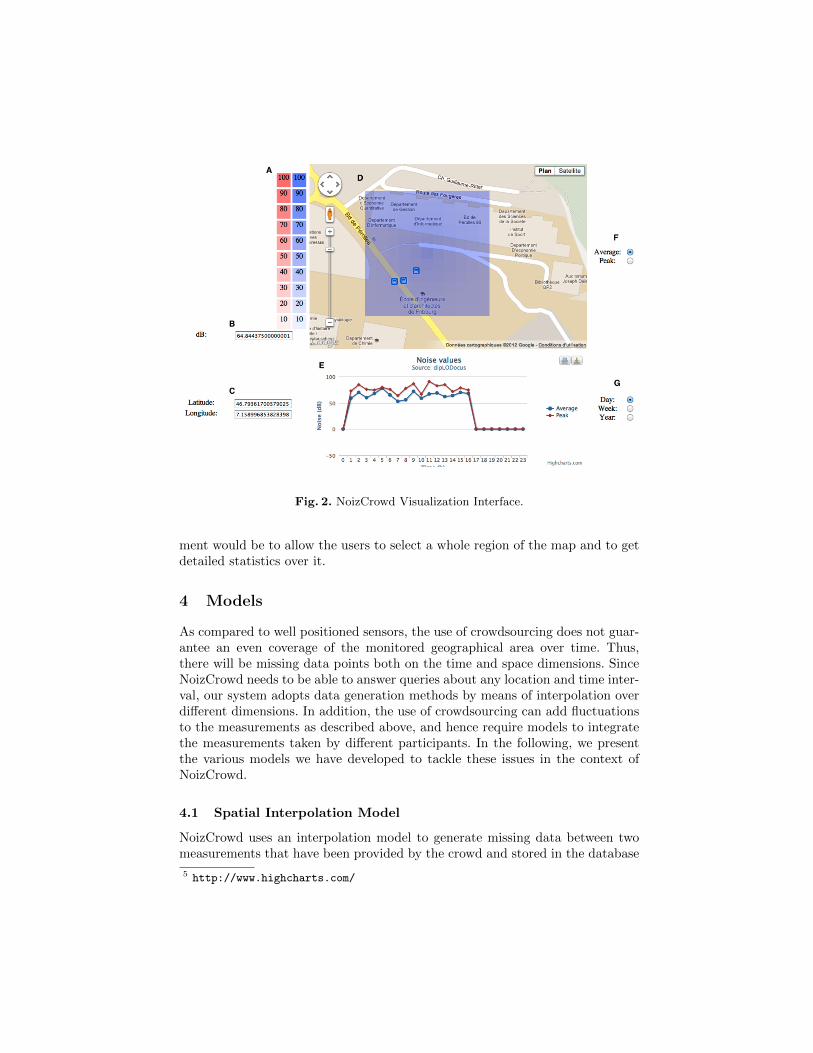
Fig. 2. NoizCrowd Visualization Interface.
ment would be to allow the users to select a whole region of the map and to getdetailed statistics over it.
4 Models
As compared to well positioned sensors, the use of crowdsourcing does not guar-antee an even coverage of the monitored geographical area over time. Thus,there will be missing data points both on the time and space dimensions. SinceNoizCrowd needs to be able to answer queries about any location and time inter-val, our system adopts data generation methods by means of interpolation overdifferent dimensions. In addition, the use of crowdsourcing can add fluctuationsto the measurements as described above, and hence require models to integratethe measurements taken by different participants. In the following, we presentthe various models we have developed to tackle these issues in the context ofNoizCrowd.
4.1 Spatial Interpolation Model
NoizCrowd uses an interpolation model to generate missing data between twomeasurements that have been provided by the crowd and stored in the database
5 http://www.highcharts.com/
over the same time interval. In order to obtain valuable interpolations we needto carefully select different measurements based on their geographical distance.Note that we do not consider temporal interpolation at this point and focus onspace solely in the following. To restrict the inference to adjacent measurementsonly, NoizCrowd defines a maximal distance threshold on the distance betweentwo measurements used for inference6. In order to maintain the computationalcomplexity of the inference tractable given the large-scale data NoizCrowd poten-tially needs to handle, we defined computationally simple interpolation modelsspecifically tailored for our array database back-end. User queries can be gen-eralized in our case as slab queries, i.e., bi-dimensional range queries in space:q = {xi, xj , yi, yj}. Once such a query is received, the back-end proceeds toa full-scan of the array values overlapping the slab (such slab scans are ex-tremely optimized in SciDB, since the data is store in a compressed, vertical andsparse format using multidimensional chunks). Once all the values stored in thedatabase for the given query are selected, we interpolate the data and computethe noise level for every cell value v in the slab by using a k-nearest neighborinterpolation based on the Manhattan distance:
vi,j = MD
n∑k=1
vkmd−1(vi,j , vk)
where md represents the Manhattan distance between two cells and MD is anormalization factor (MD = 1/
∑nk=1md
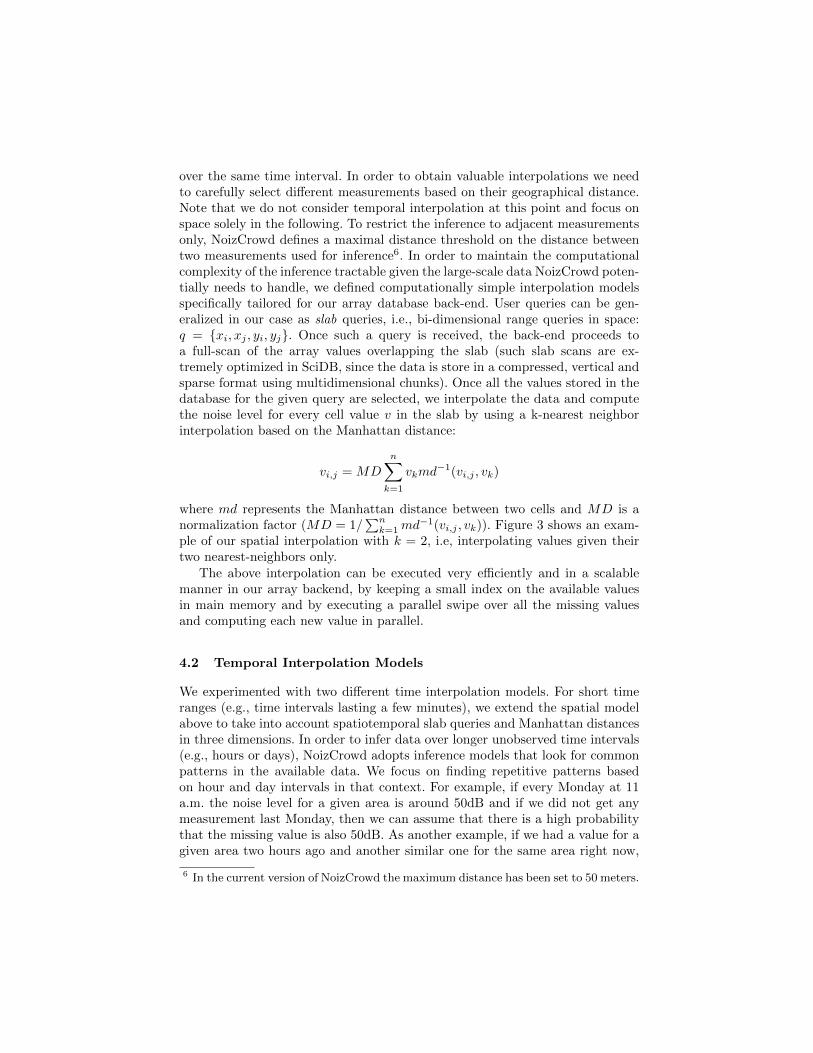
−1(vi,j , vk)). Figure 3 shows an exam-ple of our spatial interpolation with k = 2, i.e, interpolating values given theirtwo nearest-neighbors only.
The above interpolation can be executed very efficiently and in a scalablemanner in our array backend, by keeping a small index on the available valuesin main memory and by executing a parallel swipe over all the missing valuesand computing each new value in parallel.
4.2 Temporal Interpolation Models
We experimented with two different time interpolation models. For short timeranges (e.g., time intervals lasting a few minutes), we extend the spatial modelabove to take into account spatiotemporal slab queries and Manhattan distancesin three dimensions. In order to infer data over longer unobserved time intervals(e.g., hours or days), NoizCrowd adopts inference models that look for commonpatterns in the available data. We focus on finding repetitive patterns basedon hour and day intervals in that context. For example, if every Monday at 11a.m. the noise level for a given area is around 50dB and if we did not get anymeasurement last Monday, then we can assume that there is a high probabilitythat the missing value is also 50dB. As another example, if we had a value for agiven area two hours ago and another similar one for the same area right now,
6 In the current version of NoizCrowd the maximum distance has been set to 50 meters.
Fig. 3. Noise signal interpolation using two nearest-neighbors and three noise sources.The noise value of each region is computed as the average noise level of the two nearestnoise sources.
then we can assume that doing an interpolation over those two values mightlead to reasonable results. On the other hand, NoizCrowd does not performinterpolation for such cases when the values are too dissimilar (i.e., when forlonger time intervals |vt1 − vt2| > τ , where τ is a system constant).
4.3 Noise Propagation Models
In addition to the interpolation models described above, we have created a modelimplementing the formula for the propagation of sound in real atmosphere basedon Lamancusa’s model [13]. Such complex models can be particularly useful incase we know the location of a sound source or want to locate a particular sourcegiven some measurement. The sound pressure level Lp is derived in this modelas follows:
Lp = Lw − 20log(r)− 11 +DI −Aabs−Ae
Where Lw stands for the sound power level, r is the distance from the source inmeters, DI is a directivity index, Aabs is the atmospheric absorption, and Ae isthe excess attenuation.
In free space, the directivity index value is 0dB while it is 3dB on a perfectlyreflecting surface. Our models take the case of a perfectly reflecting surface intoconsideration. The atmospheric absorption is the energy dissipated in the air byviscous loss and relaxational processes over some distance. While the concept iseasy to understand, it is difficult to measure such parameters using smartphones.However, we can set this variable as a constant if the region we take our measuresin is known a priori.
The excess attenuation variable is defined as follows:
Ae = Aweather +Aground+Aturbulence+Abarrier +Avegetation
where Aweather represents the meteorological conditions including the effects ofwind and temperature. In our case, we only take the temperature into account(since we can get it directly using smartphone sensors or by looking up valuesgiven the GPS coordinates and time). Aground represents the ground interactionand Aturbulence the atmospheric turbulence. We take standard values for bothparameters due to the difficulty of measuring/looking up such parameters in ourcontext. Abarrier and Avegetation represent obstructions and vegetation. Wedo not take these parameters into account.
By using the formula above, our model can generates accurate data valuesfor the area surrounding a noise source. Locating the source of some sound byusing three or more measurements in decibels can also be performed using thesound propagation in atmosphere formula. For each of the measurement we giveto the model, we check each nearby cell and measure the value it would haveif it were the source. The square that has the closest resulting values for eachmeasurement is selected as the most likely source. We experiment with suchmodels in Section 5.
4.4 Models & Late Materialization
As described above, we store data in two different ways: We store raw measure-ments in our SciDB backend, and higher-level, cleaned and interpolated datausing higher-level models. As for traditional view mechanisms in database sys-tems, we thus have to choose how we materialize (i.e., precompute and store) themodel data. Since some of the models described above can be computationallyintensive, and since the total time and geographical areas covered by the sys-tem can be very large, we decided to opt for late materialization strategies. Thematerialization of the models is thus performed at query-time: NoizCrowd onlygenerates model data when a request is sent by the visualization interface abouta specific spatiotemporal range. The resulting data is then cached and indexedas a new array in our backend, and can also be cached for future requests.
The model views are stored using a dedicated storage space in SciDB and arereplaced using a scalable clock-replacement policy. When new data is insertedinto the system, all views overlapping with the new data are selected. Twooutcomes can then occur depending on the view: If the view can be updated(i.e., for the spatial and temporal models described above), then our backendupdates the view incrementally by inserting the new data only and recomputesparts of the values only. It the view cannot be updated incrementally (i.e., forthe noise propagation model), then the view is dropped and will have to bematerialized again for future queries.
5 Performance Evaluation
In order to test the validity of our models, we performed series of live deploymentsusing smartphones and mobile sound sources. We report below on a few of suchexperiments.
5.1 Spatial Interpolation
We tested our interpolation model through 30 outdoor deployments, 10 timesusing 2 smartphones simultaneously, 10 times with 3 smartphones, and 10 timeswith 4 smartphones. The location of the smartphones in the deployments wererandomly selected in a given flat region of 50 by 50 meters. We chose a relativelybusy neighborhood in an urban setting with relatively constant noise levels. Wetook a professional-grade noise level meter to measure the real values of thesound levels we were trying to interpolate using the smartphones available andour model.
In summary, the results we obtained were as follows: 85% of the resultinginterpolated data was with an error of less than 6dB to the real values, with 63%of those values within 4dB or less. We find those results very encouraging giventhe setting chosen and the few values recorded.
5.2 Sound Dissipation and Source Location
We used a controlled setting to test our sound dissipation and source localizationapproaches. We picked a 100dB sound source on a 60 by 60 meter baseball field,covered in snow to avoid reverberation. We placed the source in one corner ofthe field, and then measured the sound levels in the neighboring area using ourapplication and three smartphones. Figure 4 shows the results. Normally, thevalues should steadily decrease as we get further and further from the source.However, as we can observe on the figure, this is not strictly the case in practice,given that the measurements were taken over several minutes in an open areausing different smartphones.
We then tested our sound propagation and source localization models giventhis relatively noisy input (which is in our opinion close to what the crowd wouldgive us in a larger-scale deployment). We performed 10 tests using 3 randommeasurements picked from our live deployment, 10 using 4 measurements, and10 others using 5 measurements.
In summary, the results we obtained are as follows: the error on the soundlevel value of the source determined by sound dissipation and our smartphonemeasurements decreases steadily with the number of measurements available:on average, the error is 16% for 3 available measurements, 10% with 4 measure-ments, and 9% with 5 measurements. The sound localization performed well too,as we were able to locate the source within a 3 meter radius on average.
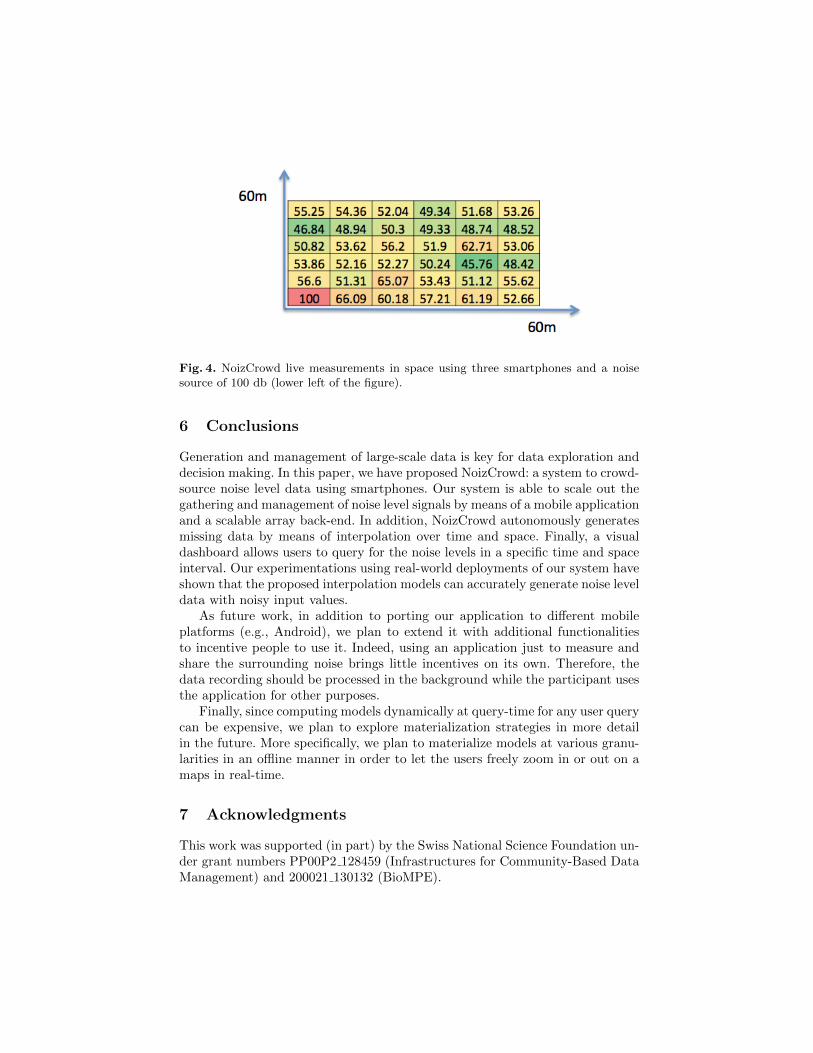
Fig. 4. NoizCrowd live measurements in space using three smartphones and a noisesource of 100 db (lower left of the figure).
6 Conclusions
Generation and management of large-scale data is key for data exploration anddecision making. In this paper, we have proposed NoizCrowd: a system to crowd-source noise level data using smartphones. Our system is able to scale out thegathering and management of noise level signals by means of a mobile applicationand a scalable array back-end. In addition, NoizCrowd autonomously generatesmissing data by means of interpolation over time and space. Finally, a visualdashboard allows users to query for the noise levels in a specific time and spaceinterval. Our experimentations using real-world deployments of our system haveshown that the proposed interpolation models can accurately generate noise leveldata with noisy input values.
As future work, in addition to porting our application to different mobileplatforms (e.g., Android), we plan to extend it with additional functionalitiesto incentive people to use it. Indeed, using an application just to measure andshare the surrounding noise brings little incentives on its own. Therefore, thedata recording should be processed in the background while the participant usesthe application for other purposes.
Finally, since computing models dynamically at query-time for any user querycan be expensive, we plan to explore materialization strategies in more detailin the future. More specifically, we plan to materialize models at various granu-larities in an offline manner in order to let the users freely zoom in or out on amaps in real-time.
7 Acknowledgments
This work was supported (in part) by the Swiss National Science Foundation un-der grant numbers PP00P2 128459 (Infrastructures for Community-Based DataManagement) and 200021 130132 (BioMPE).
References
1. Jess Barreiro-Hurl, Mercedes Sanchez, and Montserrat Viladrich-Grau. How muchare people willing to pay for silence? a contingent valuation study. Applied Eco-nomics, 37(11):1233–1246, 2005.
2. J. Burke, D. Estrin, M. Hansen, A. Parker, N. Ramanathan, S. Reddy, andM. B. Srivastava. Participatory sensing. In In: Workshop on World-Sensor-Web(WSW06): Mobile Device Centric Sensor Networks and Applications, pages 117–134, 2006.
3. A.T. Campbell, S.B. Eisenman, N.D. Lane, E. Miluzzo, R.A. Peterson, Hong Lu,Xiao Zheng, M. Musolesi, K. Fodor, and Gahng-Seop Ahn. The rise of people-centric sensing. Internet Computing, IEEE, 12(4):12–21, 2008.
4. Delphine Christin, Andreas Reinhardt, Salil S. Kanhere, and Matthias Hollick. Asurvey on privacy in mobile participatory sensing applications. Journal of Systemsand Software, 84(11):1928 – 1946, 2011.
5. Philippe Cudre-Mauroux, Hideaki Kimura, Kian-Tat Lim, Jennie Rogers, RomanSimakov, Emad Soroush, Pavel Velikhov, Daniel L. Wang, Magdalena Balazinska,Jacek Becla, David J. DeWitt, Bobbi Heath, David Maier, Samuel Madden, Jig-nesh M. Patel, Michael Stonebraker, and Stanley B. Zdonik. A Demonstration ofSciDB: A Science-Oriented DBMS. PVLDB, 2(2):1534–1537, 2009.
6. Dana Cuff, Mark Hansen, and Jerry Kang. Urban sensing: out of the woods. ACMCommunications, 51(3):24–33, March 2008.
7. Linda Deng and Landon P. Cox. Livecompare: grocery bargain hunting throughparticipatory sensing. In Proceedings of the 10th workshop on Mobile ComputingSystems and Applications, HotMobile ’09, pages 4:1–4:6, New York, NY, USA,2009. ACM.
8. Carl DiSalvo, Illah Nourbakhsh, David Holstius, Ayca Akin, and Marti Louw. Theneighborhood networks project: a case study of critical engagement and creativeexpression through participatory design. In Proceedings of the Tenth AnniversaryConference on Participatory Design 2008, PDC ’08, pages 41–50, Indianapolis, IN,USA, 2008. Indiana University.
9. Ellie DHondt, Matthias Stevens, and An Jacobs. Participatory noise mappingworks! an evaluation of participatory sensing as an alternative to standard tech-niques for environmental monitoring. Pervasive and Mobile Computing, (0):–, 2012.
10. Raghu K. Ganti, Nam Pham, Hossein Ahmadi, Saurabh Nangia, and Tarek F.Abdelzaher. Greengps: a participatory sensing fuel-efficient maps application. InProceedings of the 8th international conference on Mobile systems, applications,and services, MobiSys ’10, pages 151–164, New York, NY, USA, 2010. ACM.
11. R.K. Ganti, Fan Ye, and Hui Lei. Mobile crowdsensing: current state and futurechallenges. Communications Magazine, IEEE, 49(11):32–39, 2011.
12. Eiman Kanjo. Noisespy: A real-time mobile phone platform for urban noise mon-itoring and mapping. Mob. Netw. Appl., 15(4):562–574, August 2010.
13. J. S. Lamancusa. Outdoor sound propagation. PA: Penn State University. pp.10.610.7.
14. N.D. Lane, E. Miluzzo, Hong Lu, D. Peebles, T. Choudhury, and A.T. Campbell. Asurvey of mobile phone sensing. Communications Magazine, IEEE, 48(9):140–150,2010.
15. Hong Lu, Wei Pan, Nicholas D. Lane, Tanzeem Choudhury, and Andrew T. Camp-bell. Soundsense: scalable sound sensing for people-centric applications on mobile
phones. In Proceedings of the 7th international conference on Mobile systems, ap-plications, and services, MobiSys ’09, pages 165–178, New York, NY, USA, 2009.ACM.
16. Irene Garcia Martı, Luis E. Rodrıguez, Mauricia Benedito, Sergi Trilles, ArturoBeltran, Laura Dıaz, and Joaquın Huerta. Mobile application for noise pollutionmonitoring through gamification techniques. In Marc Herrlich, Rainer Malaka,and Maic Masuch, editors, Entertainment Computing - ICEC 2012, volume 7522of Lecture Notes in Computer Science, pages 562–571. Springer Berlin Heidelberg,2012.
17. D. Mendez, M. Labrador, and K. Ramachandran. Data interpolation for partic-ipatory sensing systems. Pervasive and Mobile Computing, 9(1):132 – 148, 2013.Special Section: Pervasive Sustainability.
18. Anne Vernez Moudon. Real noise from the urban environment: How ambientcommunity noise affects health and what can be done about it. American Journalof Preventive Medicine, 37(2):167 – 171, 2009.
19. Min Mun, Sasank Reddy, Katie Shilton, Nathan Yau, Jeff Burke, Deborah Estrin,Mark Hansen, Eric Howard, Ruth West, and Peter Boda. Peir, the personal envi-ronmental impact report, as a platform for participatory sensing systems research.In Proceedings of the 7th international conference on Mobile systems, applications,and services, MobiSys ’09, pages 55–68, New York, NY, USA, 2009. ACM.
20. Damian Philipp, Jaroslaw Stachowiak, Patrick Alt, Frank Durr, and Kurt Rother-mel. DrOPS: Model-Driven Optimization for Public Sensing Systems. In 2013IEEE International Conference on Pervasive Computing and Communications(PerCom) (PerCom 2013), pages 1–8, San Diego, CA, USA, March 2013. IEEEComputer Society.
21. Rajib Kumar Rana, Chun Tung Chou, Salil S. Kanhere, Nirupama Bulusu, andWen Hu. Ear-phone: an end-to-end participatory urban noise mapping system.In Proceedings of the 9th ACM/IEEE International Conference on InformationProcessing in Sensor Networks, IPSN ’10, pages 105–116, New York, NY, USA,2010. ACM.
22. Sasank Reddy, Deborah Estrin, and Mani Srivastava. Recruitment frameworkfor participatory sensing data collections. In Patrik Floren, Antonio Krger, andMirjana Spasojevic, editors, Pervasive Computing, volume 6030 of Lecture Notesin Computer Science, pages 138–155. Springer Berlin Heidelberg, 2010.
23. Lukas Ruge, Bashar Altakrouri, and Andreas Schrader. Soundofthecity - con-tinuous noise monitoring for a healthy city. In 5th International Workshop onSmart Environments and Ambient Intelligence (SENAmI 2013) at IEEE Interna-tional Conference on Pervasive Computing and Communication (PerCom 2013),San Diego, California, USA, March 18-22 2013.
24. Immanuel Schweizer, Roman Bartl, Axel Schulz, Florian Probst, and MaxMuhlhauser. Noisemap - real-time participatory noise maps. In Second Interna-tional Workshop on Sensing Applications on Mobile Phones, ACM SenSys 2011,2011.
25. Adam Seering, Philippe Cudre-Mauroux, Samuel Madden, and Michael Stone-braker. Efficient Versioning for Scientific Array Databases. In ICDE, pages 1013–1024. IEEE Computer Society, 2012.
26. Marcin Wylot, Jige Pont, Mariusz Wisniewski, and Philippe Cudre-Mauroux.dipLODocus[RDF] - Short and Long-Tail RDF Analytics for Massive Webs ofData. In International Semantic Web Conference, pages 778–793, 2011.