Embed Size (px)
Citation preview

Berkeley
Noise in Communication Systems
Prof. Ali M. Niknejad
U.C. BerkeleyCopyright c© 2015 by Ali M. Niknejad
1 / 19
Introduction to Noise
vo(t)
t
All electronic amplifiers generate noise. This noise originatesfrom the random thermal motion of carriers and thediscreteness of charge.
Noise signals are random and must be treated by statisticalmeans. Even though we cannot predict the actual noisewaveform, we can predict the statistics such as the mean(average) and variance.
2 / 19

Noise Power
The average value of the noise waveform is zero
vn(t) =< vn(t) >=1
T
∫T
vn(t)dt = 0
The mean is also zero if we freeze time and take an infinitenumber of samples from identical amplifiers.
The variance, though, is non-zero. Equivalently, we may saythat the signal power is non-zero
vn(t)2 =1
T
∫T
v2n (t)dt 6= 0
The RMS (root-mean-square) voltage is given by
vn,rms =
√vn(t)2
3 / 19

Power Spectrum of Noise
S(ω)
ω
“white” noise is flat
The power spectrum ofthe noise shows the con-centration of noise powerat any given frequency.Many noise sources are“white” in that the spec-trum is flat (up to ex-tremely high frequencies)
In such cases the noise waveform is totally unpredictable as afunction of time. In other words, there is absolutely nocorrelation between the noise waveform at time t1 and somelater time t1 + δ, no matter how small we make δ.
4 / 19
Noise in Communication Systems
Noise is an ever present part of all systems. Any receiver mustcontend with noise and the resulting degradation in thequality of the transmitted and received signal.
In analog systems, noise deteriorates the quality of thereceived signal, e.g. the appearance of “snow” on the TVscreen, or “static” sounds during an audio transmission.
In digital communication systems, noise degrades thethroughput because it requires retransmission of data packetsor extra coding to recover the data in the presence of errors.
5 / 19

BER Plot
0 10 20 30 40 50
0.0001
0.001
0.01
0. 1
1
SNR (dB)
Bit Error Rate
It’s typical to plot the Bit-Error-Rate (BER) in a digitalcommunication system.
This shows the average rate of errors for a givensignal-to-noise-ratio (SNR)
6 / 19
SNR
In general, then, we strive to maximize the signal to noiseratio in a communication system. If we receive a signal withaverage power Psig , and the average noise power level isPnoise , then the SNR is simply
SNR =S
N
SNR(dB) = 10 · logPsig
Pnoise
We distinguish between random noise and “noise” due tointerferers or distortion generated by the amplifier
7 / 19
Spurious Free Dynamic Range
fund
distortionspur
SFDRSNR
ω
S(ω)
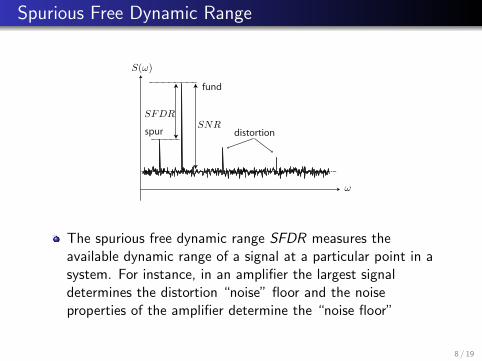
The spurious free dynamic range SFDR measures theavailable dynamic range of a signal at a particular point in asystem. For instance, in an amplifier the largest signaldetermines the distortion “noise” floor and the noiseproperties of the amplifier determine the “noise floor”
8 / 19

Noise Figure
The Noise Figure (NF ) of an amplifier is a block (e.g. anamplifier) is a measure of the degradation of the SNR
F =SNRi
SNRo
NF = 10 · log(F ) (dB)
The noise figure is measured (or calculated) by specifying astandard input noise level through the source resistance Rs
and the temperature
For RF communication systems, this is usually specified asRs = 50Ω and T = 293K .
9 / 19

Noise Figure of an Amplifier
Suppose an amplifier has a gain G and apply the definition ofNF
SNRi =Psig
Ns
SNRo =GPsig
GNs + Namp,o
The term Namp,o is the total output noise due to the amplifierin absence of any input noise.
SNRo =Psig
Ns +Namp,o
G
10 / 19

Input Referred Noise (I)
Let Namp,i denote the total input referred noise of theamplifier
SNRo =Psig
Ns + Namp,i
The noise figure is therefore
F =SNRi
SNRo=
PsigNs×
Ns + Namp,i
Psig
F = 1 +Namp,i
Ns≥ 1
All amplifiers have a noise figure ≥ 1. Any real systemdegrades the SNR since all circuit blocks add additional noise.
11 / 19
Input Referred Noise (II)
+Pin + Ns
Namp,i
G
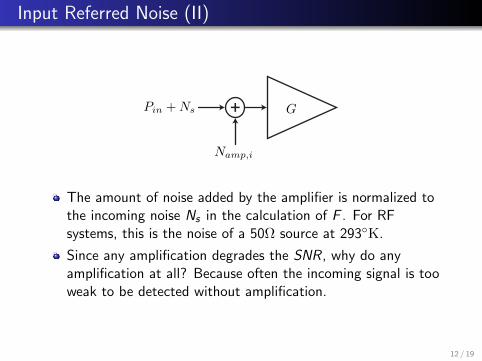
The amount of noise added by the amplifier is normalized tothe incoming noise Ns in the calculation of F . For RFsystems, this is the noise of a 50Ω source at 293K.
Since any amplification degrades the SNR, why do anyamplification at all? Because often the incoming signal is tooweak to be detected without amplification.
12 / 19

Noise Figure of Cascaded Blocks
Pin + NsG1 G2
F1 F2
G1G2
F
If two blocks are cascaded, we would like to derive the noisefigure of the total system.
Assume the blocks are impedance matched properly to resultin a gain G = G1G2. For each amplifier in cascade, we have
Fi = 1 +Namp,i
Ns
13 / 19

Total Input Noise for Cascade
By definition, the noise added by each amplifier to the input isgiven by
Namp,i = Ns(F − 1)
where Ns represents some standard input noise. If we nowinput refer all the noise in the system we have
N ′amp,i = Ns(F1 − 1) +Ns(F2 − 1)
G1
Which gives us the total noise figure of the amplifier
F = 1 +N ′amp,i
Ns= 1 + (F1 − 1) +
F2 − 1
G1= F1 +
F2 − 1
G1
14 / 19
General Cascade Formula
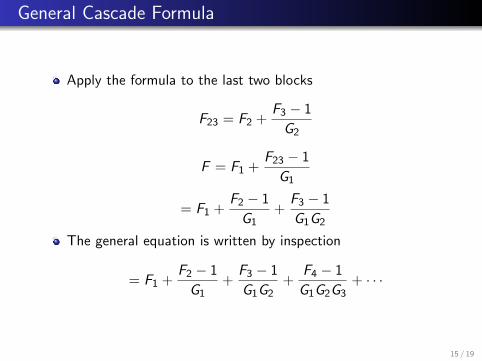
Apply the formula to the last two blocks
F23 = F2 +F3 − 1
G2
F = F1 +F23 − 1
G1
= F1 +F2 − 1
G1+
F3 − 1
G1G2
The general equation is written by inspection
= F1 +F2 − 1
G1+
F3 − 1
G1G2+
F4 − 1
G1G2G3+ · · ·
15 / 19
Cascade Formula Interpretation
Rest of Front-EndLNA
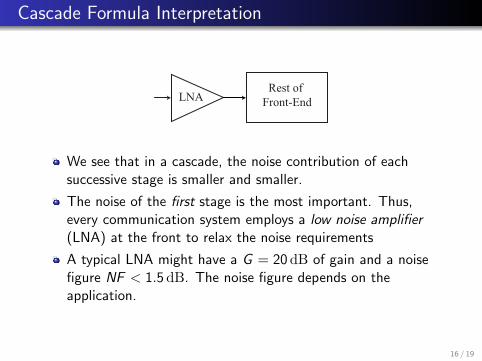
We see that in a cascade, the noise contribution of eachsuccessive stage is smaller and smaller.
The noise of the first stage is the most important. Thus,every communication system employs a low noise amplifier(LNA) at the front to relax the noise requirements
A typical LNA might have a G = 20 dB of gain and a noisefigure NF < 1.5 dB. The noise figure depends on theapplication.
16 / 19
NF Cascade Example
LNA VGA
LO
G1 G2
F1 F2
G3
F3
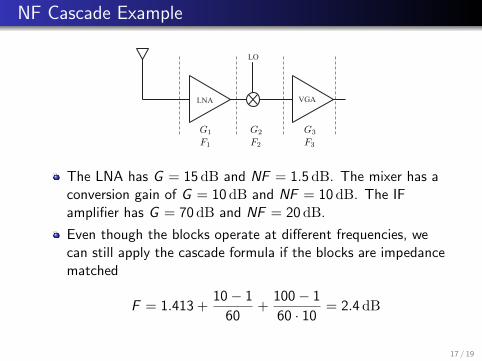
The LNA has G = 15 dB and NF = 1.5 dB. The mixer has aconversion gain of G = 10 dB and NF = 10 dB. The IFamplifier has G = 70 dB and NF = 20 dB.
Even though the blocks operate at different frequencies, wecan still apply the cascade formula if the blocks are impedancematched
F = 1.413 +10− 1
60+
100− 1
60 · 10= 2.4 dB
17 / 19
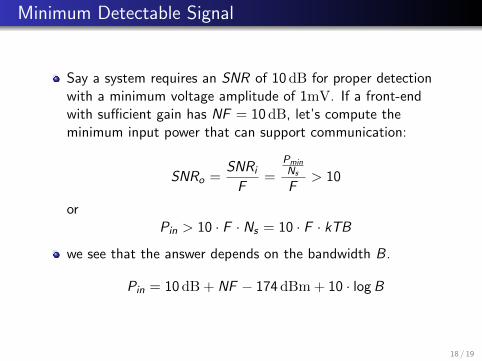
Minimum Detectable Signal
Say a system requires an SNR of 10 dB for proper detectionwith a minimum voltage amplitude of 1mV. If a front-endwith sufficient gain has NF = 10 dB, let’s compute theminimum input power that can support communication:
SNRo =SNRi
F=
PminNs
F> 10
orPin > 10 · F · Ns = 10 · F · kTB
we see that the answer depends on the bandwidth B.
Pin = 10 dB + NF − 174 dBm + 10 · log B
18 / 19

Minimum Signal (cont)
For wireless data, B ∼ 10MHz:
Pin = 10 dB + 10 dB− 174 dB + 70 dB = −84 dBm
We see that the noise figure has a dB for dB impact on theminimum detectable input signal. Since the received powerdrops > 20 dB per decade of distance, a few dB improved NFmay dramatically improve the coverage area of acommunication link.
Otherwise the transmitter has to boost the TX power, whichrequires excess power consumption due to the efficiency η ofthe transmitter.
19 / 19