Embed Size (px)
Citation preview

A noise control package for vibrating screens1),2)
1) The findinauthor(s) National Mention does not c
2) This is thtopic of M
a) NIOSH, Pittsburgh
b) NIOSH, Pittsburgh
c) NIOSH, Pittsburgh
d) United StPA 1520Work repo
e) NIOSH, Pittsburgh
M. Jenae Lowea), David S. Yantekb), Junyi Yangc), Kevin C. Schusterd) and Jessie J. Mechlinge)
Hearing loss was the second-most common illness reported to the Mine Safety and Health Administration (MSHA) in 2009. Furthermore, between 2000 and 2010, 30% of all noise-related injury complaints reported to MSHA were for coal preparation plant employees. Previous National Institute for Occupational Safety and Health (NIOSH) studies have shown that vibrating screens are key noise sources to address in order to reduce coal preparation plant noise. In response, NIOSH researchers have developed a suite of noise controls for vibrating screens consisting of constrained layer damping (CLD) treatments, a tuned mechanism suspension, an acoustic enclosure, and spring inserts. Laboratory testing demonstrates that this noise control suite reduces the A-weighted sound power level of the vibrating screen by 6 dB. To provide a comparison to laboratory results and prove durability, field testing of two noise controls was performed on a vibrating screen in a working coal preparation plant. The spring inserts and CLD treatments were selected due to their ease of installation and practicability. Field testing of these controls yielded reductions that were comparable to laboratory results.
1 INTRODUCTION Of all occupational illnesses reported to the U.S.
Bureau of Labor Statistics in 2004 and 2005, 11% were due to noise-induced hearing loss (NIHL)1, making it one of the most common occupational illnesses in the United States2. As such, hearing loss prevention is one of twenty-one Priority Research Areas listed in the National Institute for Occupational Safety and Health (NIOSH) National Occupational Research Agenda3. Of all industries, mining has the
gs and conclusions in this report are those of the and do not necessarily represent the views of the Institute for Occupational Safety and Health. of any company name, product, or software onstitute endorsement by NIOSH. e fourth paper published in NCEJ on the special ining Noise. 626 Cochrans Mill Rd, P.O. Box 18070, , PA 15236 USA; email: [email protected]. 626 Cochrans Mill Rd, P.O. Box 18070, , PA 15236 USA; email: [email protected]. 626 Cochrans Mill Rd, P.O. Box 18070, , PA 15236 USA; email: [email protected]. ates Steel Corporation, 5706 Ollie St, Pittsburgh, 7 USA; email: [email protected] rted here was undertaken while at CDC. 626 Cochrans Mill Rd, P.O. Box 18070, , PA 15236 USA; email: [email protected]
highest prevalence of hazardous noise exposure, with 76% of employees reporting hazardous noise exposure on the job4. Despite leading the nation in reported hearing protector use4, miners have the second-highest incidence of reported hearing difficulty of all occupations—in a National Health Interview Survey that spanned 1997 to 2003, nearly one-fourth of all miners reported a hearing difficulty5. Because hearing conservation programs alone do not solve the problem of NIHL, it is important to use engineering noise controls as the first line of defense6, thus reducing harmful noise exposure for miners. The Mine Safety and Health Administration reinforced this message in 1999 by revising the Health Standard for Occupational Noise Exposure (30 CFR Part 62), which no longer gives credit for hearing protection in determining a worker’s noise dose7. As a result, the regulation has reemphasized the use of noise controls to reduce worker noise exposure.
The Office of Mine Safety and Health Research (OMSHR) Hearing Loss Prevention Branch (HLPB) develops such noise controls for miners. One area where the OMSHR HLPB has focused its research is within coal preparation plants. According to MSHA data, 30% of all noise-related injury complaints since the year 2000 have involved preparation plant employees. In 2009, there were 37,405 employees at mine facilities with preparation plants and 8,343 workers who were

categorized as preparation plant employees at these facilities8.
A recent NIOSH study shows that 43.5% of employees within preparation plants are overexposed to noise. Furthermore, the study found that not only were vibrating screens one of the loudest pieces of equipment at the preparation plants, they were also the most numerous, thus making vibrating screens a key noise source to address9. Vibrating screens are a major noise problem in coal preparation plants because screens are used extensively in the plants, are usually located in high traffic areas, and can generate high sound levels10. Coal preparation plants use horizontal vibrating screens more frequently because their smaller height allows for shorter floors and less overall building volume in a preparation plant. Typically the sound levels around these machines range from 90 to 95 dB during clean bituminous coal processing, and from 95
a
b
suspension springs
electric motor
rib
A-frame
A-frame rail
mechanism housings
belt guard
screening deck
DISCHARGE END
Fig. 1—A horizontal vibrating screen used to proc(b) discharge end.
to 100 dB during refuse and anthracite processing11. To reduce noise exposure within the preparation plants, NIOSH developed engineering noise controls for vibrating screens in a partnership with Conn-Weld Industries, Inc.
A horizontal vibrating screen (Fig. 1) is a large machine used to process coal. The screen body has four sides made of steel plates with a bottom screening surface—also known as a screen deck—made of steel wire welded to a frame with small gaps between the wires. The body of the screen is supported on a steel coil spring suspension. Vibration mechanisms are mounted to a steel beam that spans the width of the screen. These vibration mechanisms, which use rotating eccentric shafts to generate vibration, are belt-driven by an electric motor.
The screen is designed in such a way that it vibrates on roughly a 45-degree angle from horizontal. In
feedbox
H-beam
round cross-tube
FEED END
electric motor
H-beam A-frame
A-frame rail
left side screen body
ess coal viewed from (a) feed end and

operation, coal flows into the feed end of the screen from a delivery chute. As the screen vibrates, the material moves along the deck and under a water spray that rinses the coal. The liquid and fine coal particles pass through the gaps in the screening deck as the material flows toward the discharge end of the screen. Finally, the rinsed coal falls off of the discharge end of the screen to continue with further processing.
In general, there are two primary mechanisms of noise generation on a vibrating screen: material flow noise generated from either impacts between the material and the screen surfaces or between individual pieces of the material itself, and noise generated by vibration of the screen through its operation. As Ungar et al. notes, “In general, coal impact noise predominates in screens handling coarse coal, and drive mechanism noise predominates in screens handling finer coal12,” and the same relationship between material feed size and noise sources in screens has been found for the screens used in the aggregate industry13. The solution to material flow noise is well understood, as the majority of prior efforts to reduce vibrating screen noise have focused on reducing material flow noise through the use of rubber screen decks11,12,14–25, various screen deck isolation or attachment techniques26,27, and chute liners11,12,14–18,28 . However, less work has been done to reduce the noise from the screen itself. The most common solution to this problem has been to isolate the screen from its support structure in the plant through the use of rubber isolation mounts or air bags instead of springs11,20,23,24,29.
Previous NIOSH studies of a horizontal vibrating screen used to process clean coal at a preparation plant indicated that noise due to vibration of the screen itself was the dominant noise source, whereas noise from material flow was less significant30. This is due to the smaller material feed size for these particular screens. Further research in the lab, using the same make and model of screen found in the aforementioned preparation plant, showed that most of the noise due to screen vibration is radiated by the screen body and the mechanism housings31,32. One of these studies showed that the suspension springs were also one of the three main noise sources of the screen31. Therefore, it was not possible to use the traditional noise controls for reducing material flow noise, although spring alternatives were a possibility. Replacing the springs with rubber isolators was attempted, but the results were unfavorable due to an increase in building vibration30.
As a consequence, a unique noise control solution was necessary for the screens under study in this project. Prior noise source identification studies in the lab showed that screen body noise is the main noise source below about 1 kHz, while mechanism housing noise is
the primary source above 1 kHz. The sound energy at frequencies below 1 kHz accounts for about 80% of the overall A-weighted sound power level. In addition, operating deflection shape analysis revealed significant response on the screen sides and feedbox33. As mentioned previously, the suspension springs were also found to be one of the three main noise sources31. Asa result, noise control efforts were split between developing noise controls to reduce noise above 1 kHz from the mechanism housings, below 1 kHz from the screen body, and from spring chatter. NIOSH developed a final suite of controls which included spring inserts, constrained layer damping treatments34, a tuned mechanism suspension, and an acoustic enclosure34,35.
Other researchers have attempted some novel solutions for controlling screen noise for the sources listed above. Several researchers have recommended treatment of the screen body panels and cross beams with free-layer or constrained-layer damping11,16,19–24,36. This has been attempted in previous NIOSH studies30
but would be cumbersome to manufacture. The use of constrained layer damping on the mechanism housings proved successful34, as it did for Wu et al.22. Stiffening the body structure by adding a center divider plate, such as in Ref. 24, is also an effective method to reduce screen body noise.
To address the excitation noise of the screen, which includes the motor, eccentric mechanisms, and drive belt, several different designs have been developed. Jakobs37 invented a system of multiple tuned excitation rods connected to the screen surface which produced quieter operation, but there was no data on the noise reduction achieved. Others have created a resilient connection between the mechanism gears and the eccentric weights38, or developed multi-part flexible gears to reduce noise20,39,40. Tighter gear and bearing tolerances have also been employed11,25, and a number of researchers have installed an isolator ring around the bearings24,41,42. Hollyfield and Jackson developed a tuned suspension system for exciting the screen deck coupled with motor isolation43, and motor isolation alone was employed by Wang25. Two other research teams have isolated the mechanism housings from their attachment plates through the use of various elastomeric devices21,25,44. As an evolution of this idea, the authors modeled45 and further developed a tuned mechanism suspension system which also eliminates high-motion transients during startup and shutdown. Complete mechanism redesigns have been accomplished to lower sound levels20,24,36 as well.
Enclosures have also been commonly recommended to reduce screen excitation noise. Most of the enclosures employed have been for the entire screen11,14–17,19,28, or operator booths have been recommended16,17,19. While

a
b
Fig. 2—Thermocouple locations on the vibrating screen mechanism housings. (a) Left mechanism locations (b) Right mechanism locations.
the idea of an enclosure for the mechanism housings has been presented in the past11, experimental results for this idea have only been presented by Zhu et al.20,39
and the authors34,35. The work by Zhu et al. in Refs. 20 and 39 provides little information on the enclosure design, nor does he address the problem of cooling the enclosure as is presented in this work.
As mentioned above, the common solution to reducing spring noise is to use rubber isolators. Alternate solutions have been to redesign the spring supports to use multiple lower-stiffness springs24, and to isolate the spring from its mounting pad with Bakelite plates25
or resilient pads11. The spring insert design to separate the contacting spring coils which is presented herein is singular in the literature.
This work is unique in that the noise controls’ effectiveness has been determined by measuring sound power in the lab per ISO 3743-246. The great majority of the prior work measured sound pressure without specifying the microphone locations or measurement method. In addition, the authors present a unique design of a noise control for spring chatter, the development of an improved isolation system for the mechanism housings, and the development of a mechanism housing enclosure that also provides adequate cooling performance. This paper discusses the influence of each noise control in the final package of spring inserts, constrained layer damping treatments34, a tuned mechanism suspension, and an acoustic enclosure34,35. Finally, confirmation of the laboratory results for two of the noise controls in a production environment is presented.
2 EXPERIMENTAL SETUP 2.1 Sound Measurements
All measurements were taken on a Conn-Weld 2.44-m x 4.88-m (8-ft x 16-ft) horizontal vibrating screen with dual G-Master 1000 vibration mechanisms, as shown in Fig. 1. The screen was placed in the center of the OMSHR National Voluntary Laboratory Accreditation Program (NVLAP)-accredited reverberation chamber47 and rested on the floor with wooden wedges driven under the frame rails to prevent the screen from rocking during operation. The belt guard was removed to avoid measurement inconsistencies from rattling observed in previous testing34. The screen was run without coal or water feed, since previous studies had shown that coal and water flow noise was not a significant contributor to sound levels in the plant environment30. Sound power tests were performed per ISO 3743-246. Data were simultaneously recorded from 15 microphones arranged in a random distribution47. Three 30-second measurements were taken for each test configuration and logarithmically averaged.
2.2 Temperature Measurements Temperature measurements were made for those
noise controls installed on the vibrating screen that had an effect on mechanism temperatures. To avoid mechanical failure of the bearings or other components, the screen manufacturer, Conn-Weld, recommends that the mechanisms run at a maximum temperature of 82.2°C (180°F) for standard oil and an absolute maximum temperature of 90.6°C (195°F) for high-temperature oil when measured at the surface of the housings. A variety of cooling methods were attempted to keep the operating temperature within acceptable limits after the noise controls were installed.
Five type J thermocouples were connected to the mechanism housings with thermally conductive cement (Fig. 2). A sixth thermocouple measured ambient air temperature. The thermocouples were connected to a DATAQ DI-715B data acquisition device, which recorded the data to a laptop. Temperatures were recorded until steady state was reached, until it was

apparent that a cooling method was unsuccessful, or until the temperature reached 82.2–90.6°C (180– 195°F).
3 BASELINE MEASUREMENTS Baseline measurements of the vibrating screen reveal
a bimodal distribution of sound energy with an overall A-weighted sound power level of 100.5 dB, as shown in Fig. 3. Two humps appear in the data with the first centered at the 315 Hz 1/3-octave band, and the second centered at the 2 kHz 1/3-octave band. The distributions from the humps meet at 1 kHz. As mentioned previously, prior studies showed that the frequencies below 1 kHz are attributable to screen body noise, while the frequencies above 1 kHz are due to mechanism housing noise31,32. A package of engineering noise controls was developed to address these noise sources, as well as spring chatter noise.
4 NOISE CONTROL DESIGN A suite of noise controls was designed to address the
different noise sources discovered on the vibrating screen. The spring inserts were designed to eliminate spring chatter as a noise source and to ensure testing repeatability because the level of spring chatter was highly variable. The constrained layer damping treatments and acoustic enclosure were applied to the mechanism housings to reduce their contribution to the frequencies above 1 kHz. The tuned mechanism suspension was designed to reduce screen body noise below 1 kHz by decoupling the mechanical energy of
100
125
160
200
250
315
400
500
630
800
1,00
0
110
Baseline w/o CLD on Mechanism Hou
A-w
eig
hte
d S
ou
nd
Po
wer
Lev
el (
dB
)
100
90
80
70
60
50
1/3-Octave-Band C
Fig. 3—1/3-Octave-band plot of A-weighted soun8′ x 16′ horizontal vibrating screen.
the mechanisms from the noise-radiating structure of the screen body.
4.1 Spring Insert Evolution Spring inserts were designed to eliminate spring
chatter noise by preventing the last full coils and the cut and ground coils on each of the spring ends from coming into contact. An earlier prototype of the inserts, tested in the lab, was a curved slab of 70 durometer natural rubber with tapered grooves to seat the spring coils. The final inserts developed for field testing were composed of 70 durometer natural rubber bonded to a 6.4-mm-thick (1/4-inch-thick) curved steel shell along the outer perimeter. The steel shell was intended to provide a striking surface for hammering the spring inserts into place between the spring coils. The rubber portions of the inserts were tapered to match the contours of the springs for better contact, and had a lip to prevent them from sliding out of place during screen operation, as shown in Fig. 4. Spring inserts were designed for both the inner and outer springs of the vibrating screen, so that all springs on the screen were prevented from chattering.
4.2 Constrained Layer Damping Constrained layer damping (CLD) is commonly used
to treat a vibrating surface that is generating noise. It consists of a layer of flexible damping material applied to the vibrating surface, with the other side of the damping layer constrained by a more rigid material such as steel. Vibration energy from the base layer is
2,00
0
4,00
05,
000
8,00
010
,000
Ove
rall
1,25
0
3,15
0
1,60
0
2,50
0
6,30
0
100.5sings, w / Spring Chatter
enter Frequency (Hz)
d power levels of the unmodified Conn-Weld

Fig. 4—Examples of small (left) and large (right) spring inserts. Note that the metal backing plate has been removed from the small spring insert.
transformed into a shear deformation within the damping layer, which reduces the noise radiated by the system while generating a small amount of heat.
For this application, a thin sheet of 80 durometer, 0.64-mm-thick (0.025-inch-thick) elastomeric damping material was bonded on one side to the flat faces on the front, top, and back of each mechanism housing using epoxy. These layers of damping material were then constrained by being bonded to 6.4-mm-thick (1/4inch-thick) steel plates. Figure 5 shows constrained layer damping treatments on the top and front face of the mechanism housings. To ensure a good bond between the housings, damping material, and constraining plates, the paint from the housings was removed using a grinder and the constraining plates were sandblasted and
Front face treatments
Top face treatments
Fig. 5—Constrained layer damping treatments applied to the top and front faces of the mechanism housings.
cleaned with isopropyl alcohol prior to applying the treatments.
4.3 Tuned Mechanism Suspension A tuned mechanism suspension (TUMS) was
developed to selectively transmit forces at the mechanism rotation speed of 900 RPM, while attenuating forces at higher frequencies that resulted from the gears and bearings. The mechanism suspension is “tuned” by adjusting the spring rates of the mechanism suspension to shift the rigid body resonant frequencies of the screen with the added mechanism suspension to either a higher or a lower frequency. In a previous publication45, amodel of the screen and TUMS was examined within ANSYS to determine the approximate spring rates that would be needed. The goal was to have the rigid body frequencies fall above the operating speed of the screen and below a target value for isolation at 100 Hz45.
The TUMS consisted of a mounting plate, or “raft,” for the mechanisms, a modified H-beam, a series of gussets to support the added material to the H-beam, and a series of two-piece vibration isolators between the raft and the H-beam, as shown in Fig. 6. In combination, these elements decouple the mechanism housings and the H-beam. The vibration mechanisms were mounted on top of a large steel plate, or raft, which was in turn mounted to the modified H-beam through the vibration isolators. The goal of adding a mechanism suspension is to separate the primary source of mechanical energy from the noise-radiating structure, but without degrading the performance of the screen.
The H-beam was modified by adding a “cap,” as illustrated in Fig. 7, over top of the H-beam to create a wider platform for mounting the tuned mechanism suspension in order to avoid problems with the pitching modes involving the mechanism housings being close to the operating frequency of the screen45. The resulting modified H-beam was 7.3 cm (2–7/8 inch) thick and 64.1 cm (25.25 inch) wide. Eight 1.9-cmthick (3/4-inch-thick) gussets supported the H-beam cap and attached it to the H-beam. Twenty-four natural rubber two-piece vibration isolators, as shown in Fig. 8, were used to separate the raft from the modified H-beam. The isolators used an external steel structure to prevent the rubber from being cut by the H-beam cap or mounting hardware once the mount was compressed.
4.4 Acoustic Enclosure An acoustic enclosure was designed that surrounds
both mechanism housings and is attached to the H-beam34,35. The motor and drive belts were not enclosed due to space constraints in coal preparation plants. Additionally, they were not found to be

Mechanisms Vibration
Isolators
Raft
Modified H-Beam
Gussets
Motor
a b
Fig. 6—Model of TUMS system (a) and picture of TUMS system installed on the vibrating screen (b).
significant contributors to noise32. We created a modular panel-on-frame design with components that weigh less than 222 N (50 lb.) and can be hand-carried and installed on any Conn-Weld 2.44-m x 4.88-m (8-ft 16-ft) horizontal vibrating screen. The modular nature
x
of this design accommodates different numbers and spacing of vibration mechanism housings and the design can be modified to adapt to different sizes and types of vibrating screens.
A
H-Beam cap
Raft
Fig. 7—Illustration showing placement of the H-b
As shown in Fig. 9, the enclosure consists of a steel frame, which provides a stiff structure, and panels that enclose the noise source. The frame is made up of a series of sub-frames that can be bolted together to make a larger or smaller enclosure as needed. The panels act as a barrier to contain the noise, while a layer of acoustic foam on the inside of the enclosure prevents the reverberant build-up of noise. The bolt-on panels can be easily removed to reach a fill port,
s-built H-Beam
Width increase
eam cap, vibration isolators, and raft.

Inner steel sleeve
Bonded outer steel sleeve
Fig. 8—Illustration of Tuned Mechanism Suspension vibration isolators.
drain plug, or bearing cover, as shown in Fig. 9. Anentire frame section with the panels attached can be removed to change a mechanism. Cooling ducts bolt onto the side panels separately and can be reconfigured as necessary, as shown in Fig. 10.
Enclosure construction involved a variety of materials and screen modifications. The frame was composed of steel angle stock and U-channel. It was isolated from the H-beam using strips of 57 durometer natural rubber. Panels were fabricated with 3.2-mm-thick (1/8-inchthick) Dynalam™ damped steel (a CLD steel). The insides of the panels were lined with 25.4-mm-thick (1-inch-thick) PolydampW acoustic foam. A boss made of 57 durometer natural rubber isolated the right panel from the bearing cover plate.
a b
2” X 5/8” U-channel, 1/4” thick
2” X 2” angle, 3/16” thick
Bolts
Weld nuts
Fig. 9—Steel frame for the second enclosure showframe assembly with most panels installed
Because the enclosure consists of damped steel panels and is lined with acoustic foam, it makes a good thermal insulator. As a consequence, temperatures at the mechanism housings increase with the enclosure installed. A variety of methods to cool the enclosure were explored, including cooling the entire enclosure with compressed air, adding an 80.2-L/s (170-CFM) push– pull fan system at the inlet and exhaust ducts of the enclosure, exhausting the enclosure air with a 330.3-L/s (700-CFM) fan attached to a modified enclosure duct, and running this same fan at 75% airflow.
5 EXPERIMENTAL RESULTS AND DISCUSSION
5.1 Spring Inserts Early in the project, we observed spring chatter both
in the lab and in the field. Later, through a beamforming study, it was shown that the suspension springs were one of the three main noise sources of the screen31. Itwas also shown that the spring chatter resulted from impacts between the cut and ground coils on the spring ends and the coils that they contact48. When separating the contact between these coils with wooden wedges or pieces of closed-cell foam, the spring chatter was eliminated and noise was reduced in the 1/3-octave-bands from 3150 Hz and above49. Because spring chatter is intermittent and variable, the maximum potential reduction from the spring inserts is not known. However, spring inserts have been used consistently throughout all testing to eliminate a known noise source, which also eliminates a source of variability when testing the other noise controls.
ing (a) one frame section and (b) the entire on a vibrating screen.

Panels
Duct
Fig. 10—Enclosure installed on vibrating screen.
5.2 CLD and Spring Inserts After eliminating the spring chatter with the spring
inserts, the next controls installed were the constrained layer damping treatments. As shown in Fig. 11, the greatest reductions were achieved above 1 kHz, which is the frequency range that the spring inserts and CLD plates were designed to address, and where the mechanism housings are the most significant noise source. Overall, the combination of both noise controls reduced the sound power level by 2.7 dB.
5.3 Tuned Mechanism Suspension The TUMS system was installed on the screen next,
in addition to the spring inserts and CLD plates. With
100
125
160
200
250
315
400
500
630
800
1,00
01
Baseline w/o CLD on Mechanism Hou
Constrained Layer Damping + Spring I
50
60
70
80
90
100
110
A-w
eig
hte
d S
ou
nd
Po
wer
Lev
el (
dB
)
1/3-Octave-Band Ce
Fig. 11—1/3-Octave-band plot of A-weighted sounscreen with constrained layer damping p
the original 67 durometer vibration isolators, the bolt heads impacted against the modified H-beam, causing the noise to increase during operation. The sound power level increase was primarily due to a lack of clearance between the mechanism bolt heads and the modified H-beam.
In addition, the first set of vibration isolators was not stiff enough to hold all of the components together during operation. Examining the operation of the screen with a stroboscope revealed that the tops of the isolators were losing contact with the top of the modified H-beam. When the two-piece mounts are installed, the mounts are pre-compressed so that both the top and bottom of the mounts undergo static deflection. Because the top half of the isolator is slightly stiffer than the bottom half of the isolator, the static deflection of the top half of the isolator is slightly less than the static deflection of the bottom half of the isolator. The relative motion between the raft and the modified H-beam exceeded the static deflection of the top half of the isolator. This caused the top half of the isolator to become unloaded and allowed separation of the isolator from the top of the H-beam.
Several changes were made to address these problems. The height of the isolator tops was increased to 3.2 cm (1.25 inch) to reduce the spring rate of the top half of the isolator relative to the bottom half. This ensured that the top half would have enough static deflection to prevent the components from separating under operation. The durometer of the mounts was also increased to increase the mount stiffness. Finally, various spacers were used to increase the preload on the
2,00
0
4,00
05,
000
8,00
010
,000
Ove
rall
,250
3,15
0
1,60
0
2,50
0
6,30
0
100.5 97.8
sings, w/ Spring Chatter
nserts Installed
nter Frequency (Hz)
d power levels of the baseline screen vs. the lates and spring inserts installed.

Table 1—A-weighted sound power levels for successful tuned mechanism suspension (TUMS) iterations. The baseline configuration included constrained layer damping on the mechanism housings and spring inserts.
Durometer Top Washer
Bottom Washer
A-weighted Sound Power Level (dB)
N/A (Baseline)
N/A (Baseline)
N/A (Baseline)
97.8
80 1/4 in. 1/8 in. 97.0 80 1/4 in. None 96.4 90 1/8 in. 1/8 in. 96.8 90 1/8 in. None 96.4
vibration isolators and the clearance of the bolt heads from the modified H-beam, as shown in Fig. 12. These changes ultimately resulted in the “tuning” of the system that was desired.
Sound power level reductions were achieved with these design changes to increase preload, clearance, and mount stiffness. Table 1 is a summary of the successful iterations of TUMS development. The greatest reductions were accomplished by both the 80 durometer mounts with a 6.4-mm (1/4-inch) spacer on top and none on the bottom and the 90 durometer mounts with a 3.2-mm (1/8-inch) spacer on top and none on the bottom—each of which yielded a 1.4-dB improvement versus baseline.
Performance for individual 1/3-octave bands varied with durometer and preload, as shown in Fig. 13. The 80 durometer mounts had better performance than the 90 durometer version in the 125–315 Hz frequency range. All mounts increased the sound power level compared to the baseline in the 2–10 kHz range, but the combination of 80 durometer mounts with the 6.4-mm (1/4-inch) top spacers and the 3.2-mm (1/8inch) bottom spacers showed the highest increase in this range.
Another concern in mount selection was heating of the mounts under operation, which caused the sound power level to increase over time. Previous measurements of failed mount configurations showed a trend of increasing sound power as the testing progressed. Thermocouples were installed on one of the earlier mount prototypes to observe how they were heating up. The results showed that the mount temperature increased as the vibrating screen continued to run. When the mount temperature reached 93.3°C (200°F), the test was aborted per the isolator manufacturer’s recommendation that the mount temperature should not exceed 93.3°C (200°F). Due to internal damping, the isolators heated up during operation as the rubber stretched and compressed. As the isolators increased in temperature,
Spacers
Fig. 12—Spacers installed above and below the to
their stiffness was reduced. The design of the TUMS is such that the vibration mode characterized by relative motion between the raft and the modified H-beam occurs at a frequency much higher than the 15-Hz operating frequency of the screen. As the mount temperatures increase and the mount spring rates decrease, the frequency of this vibration mode shifts closer to the operating speed of the screen. This results in an increase in motion of the mechanisms, which in turn causes the impact forces within the gears and bearings to increase. The temperature increase is a probable cause for the increase in noise from the early prototypes.
While the 80 durometer mounts with spacers on top and bottom showed the greatest stability in terms of sound power levels over time, their overall poor performance in sound power level reductions eliminated them as a candidate. Removing the bottom spacers from the 80 durometer mounts caused the mounts to increase in temperature and exhibit the same trend of increasing sound power levels over time. However, the 90
p portion of the vibration isolators.

100
125
160
200
250
315
400
500
630
800
1,00
0
2,00
0
4,00
05,
000
8,00
010
,000
1,25
0
3,15
0
1,60
0
2,50
0
6,30
0
60
65
70
75
80
85
90
95
CLD with Spring Inserts
TUMS 80 Durometer with 1/4" top spacers, 1/8" bottom spacers TUMS 80 Duro no 1/8" bottom spacers
TUMS 90 Durometer, 1/8" top and bottom washers
TUMS 90 Durometer, 1/8" top washers only
A-w
eig
hte
d S
ou
nd
Po
wer
(d
B)
Frequency (Hz)
Fig. 13—A-weighted sound power for baseline vs. four iterations of the tuned mechanism suspension (TUMS).
durometer mounts showed a trend of decreasing sound power levels with time, suggesting that the ideal mount stiffness is between 80 and 90 durometer if the stiffness could remain constant with temperature. For durability concerns, the 90 durometer mount configuration with minimum preload was selected. This configuration yields a sound power level reduction from the CLD and spring insert combination of 1.4 dB (Table 1).
100
125
160
200
250
315
400
500
630
800
1
60
65
70
75
80
85
90
95
Baseline w/o CLD on Mechanism HChatter, 100.5 dB(A) Constrained Layer Damping + Sprin97.8 dB(A) CLD, Spring Inserts, and Tuned Me96.4 dB(A) CLD, Spring Inserts, TUMS, and En
A-w
eig
hte
d S
ou
nd
Po
wer
Lev
el (
dB
)
1/3-Octave-Band C
Fig. 14—A-weighted sound power comparison for
5.4 Acoustic Enclosure Finally, an acoustic enclosure was added to the noise
control package. Originally, the enclosure had been installed directly onto the H-beam in previous testing34,35, but due to installation of the TUMS the enclosure frame had to be modified so it could be welded directly onto the TUMS “raft.” Figure 14 shows that the enclosure
,000
2,00
0
4,00
05,
000
8,00
010
,000
1,25
0
3,15
0
1,60
0
2,50
0
6,30
0
ousings, w/ Spring
g Inserts Installed,
chanism Suspension,
closure, 94.9 dB(A)
enter Frequency (Hz)
all configurations tested.

reduces overall A-weighted sound power levels by 1.5 dB from the configuration with CLD, spring inserts, and the TUMS. The reductions are seen from the 315 Hz 1/3-octave-band and higher, with some degradation in the 1/3-octave-bands below 315 Hz. This decrease in performance at these frequencies was not observed when the enclosure was originally tested and compared to baseline34,35, and Fig. 14 shows that the enclosure is an improvement over baseline even in this lower frequency range. The extra surface area due to the addition of the enclosure could radiate more noise than the TUMS configuration alone, and may be an attribute to investigate further.
As shown in Fig. 14, the entire noise control package reduced the overall A-weighted sound power level by 5.6 dB, which is nearly a 75% reduction in sound power. All 1/3-octave-band levels are reduced with the exception of a small increase in the 160 Hz 1/3-octave band. The greatest reductions are seen at the 250 Hz 1/3-octave band and above.
As a consequence of adding the acoustic enclosure, temperature data were taken as discussed previously to determine if the enclosure would cause premature damage to the bearings due to excessive heat. For all tests the thermocouple located at position 4 (see Fig. 2) recorded the highest temperature. Since maximum temperature is the main concern, all plots show the temperature data recorded from position 4. Initial measurements indicated that the system reached the critical temperature of 90.6°C (195°F) in less than five hours with the enclosure installed. This result
80
90
20
30
40
50
60
70
0 100 200 300
Tem
per
atu
re (
°C)
Time elaps
Baseline
Enclosure
Enclosure, 330.3 L/s e
Enclosure, 330.3 L/s e
Fig. 15—Comparison of 330.30-L/s (700-CFM) exenclosure only configurations.
compares unfavorably to the baseline, where a maximum temperature of 79.4°C (175°F) was reached after 12 hours.
Next, several cooling methods for the enclosure were evaluated. Because the free convection provided by the enclosure ducts was not sufficient for cooling, the enclosure was cooled using shop air, because that may be more convenient for the end user. An air line was run to the enclosure duct and an adapter was made for the duct-to-air line connection. However, the cooling performance was only slightly better than free convection, so this option was not pursued further. To create a push–pull system of airflow, 80.2-L/s (170-CFM) fans were then installed at the inlet and exhaust ducts. This showed moderate success (10 degrees cooler than the enclosure-only configuration after 4 hours), but because it was clear that the cooling was not sufficient, the test was aborted.
The final cooling configuration utilized a 330.3-L/s (700-CFM) exhaust fan. Additionally, the enclosure duct was modified to connect the top of the duct to a remotely located exhaust fan. As shown in Fig. 15, after 10.5 hours, this configuration reached 84.4°C (184°F) running at full flow with an initial ambient temperature of 23.3°C (74°F), which is sufficient cooling for a production day in a prep plant. Running at 75% of flow, the critical temperature of 90.6°C (195°F) is reached in 10 hours and 50 minutes with an initial ambient temperature of 26.7°C (80°F).
The 330.3-L/s (700-CFM) exhaust fan for the enclosure provides adequate cooling. However, further
400 500 600 700
ed (minutes)
xhaust fan, modified duct
xhaust fan, 75% flow, modified duct
haust fan configurations with baseline and

efficiencies could be gained by optimizing the cooling system to improve interior air flow. This may result in reduced airflow requirements for the fan. For example, the current duct configuration could be modified to reduce turbulence from bends and sharp corners. This has the potential to eliminate airflow losses in the duct. Further, during the testing described above for the 80.2-L/s (170-CFM) fans, the coolest mechanism housing temperature location at point 3 (Fig. 2) waspredicted to reach the critical temperature after 9 hours, while the hottest housing location (point 4) was predicted to reach the critical temperature after 5.5 hours. It may be possible to reduce airflow requirements of the fan by better mixing of the interior air in the enclosure, thus improving cooling efficiency.
6 FIELD TESTING In order to prove the effectiveness of the noise
control concepts that NIOSH had developed and the durability of the materials in the designs, NIOSH performed field testing at a nearby coal preparation plant in northern WV. If the noise controls in this testing were proven to be successful in a harsh production environment, then our industry partner would be able to incorporate these concepts into future designs. The preparation plant leadership expressed interest in trying two of the four laboratory-tested noise controls: the constrained layer damping (CLD) treatments and the spring inserts. These controls were selected for their ease of installation and practicability. The other
Microphone locations
Fig. 16—Plan view of microphone positions and bscreen #169.
noise controls require significant modification to the screen in order to be installed.
6.1 Experimental Setup 6.1.1 Plant setup and methodology
NIOSH researchers selected screen #169 (Fig. 16) on the fourth floor of the preparation plant because it was the same size and model of screen used in the Pittsburgh Office of Mine Safety and Health Research (OMSHR) lab for developmental research. This screen is one in a bank of eight 2.44-m x 4.88-m (8-ft x 16-ft) horizontal vibrating screens used to rinse the coal and remove the liquid and fine coal particles as the coal moves along the screen. Ideally, when evaluating noise controls, the machine under study would be measured in isolation so that only the noise of the machine in question would be captured. Otherwise, noise from surrounding equipment could affect the sound level that was measured. Without already knowing the sound levels that one machine generates, it would not be possible to determine the true sound level of the machine under test.
However, it was not possible to study a machine in isolation at the preparation plant because of the control system in the plant. The plant is set up such that the bank of eight screens is split into two groups of four screens each, called Side 1 and Side 2. Side 1 or Side 2 may have the coal feed to their screens shut off, one screen in either Side 1 or Side 2 may be entirely shut down while the others continue to vibrate and process coal, and one side at a time may be entirely shut down.
arrier-absorber curtain location surrounding
However, due to the required downtime involved and production needs, shutting down an entire side of the plant was not feasible. Thus, it was not possible to run only one screen with coal while shutting down all of the other screens.
Given the above constraint, in order to determine the effect of the noise controls, the influence from the surrounding machines had to be minimized. To accomplish this, the screen under test was isolated from its surroundings through the use of quilted acoustic barrier-absorber material to block and absorb a portion of the surrounding noise. To determine the effectiveness of the barrier-absorber material at reducing background noise, measurements needed to be taken before and after installation to determine the background noise reduction. Background noise was considered to be the noise due to all other machines in the plant except for screen #169. If background noise were reduced enough to minimize its effect on the overall levels, sound level measurements could then be made with the package of noise controls in place to determine their effect on the vibrating screen.
6.1.2 Data acquisition setup Six microphones were placed around the vibrating
screen along the feed end and the left side to match previous testing conducted at the preparation plant30. The microphones were located 0.61 m (2 ft) from a reference box surrounding the test screen, which is the metal perimeter placed around the screen and set into the plant floor. All microphones were positioned at a height of 1.52 m (5 ft) to approximate the ear height of an average employee. Figures 16 and 17 illustrate the microphone placement at the preparation plant.
Three recordings of 30 seconds each were taken for each test configuration. The data were stored by a data
Microphones
Fig. 17—Microphone positions 3–6 on the left side of the screen.
acquisition system for post-processing. The same microphone locations and data acquisition system position were used for all measurements.
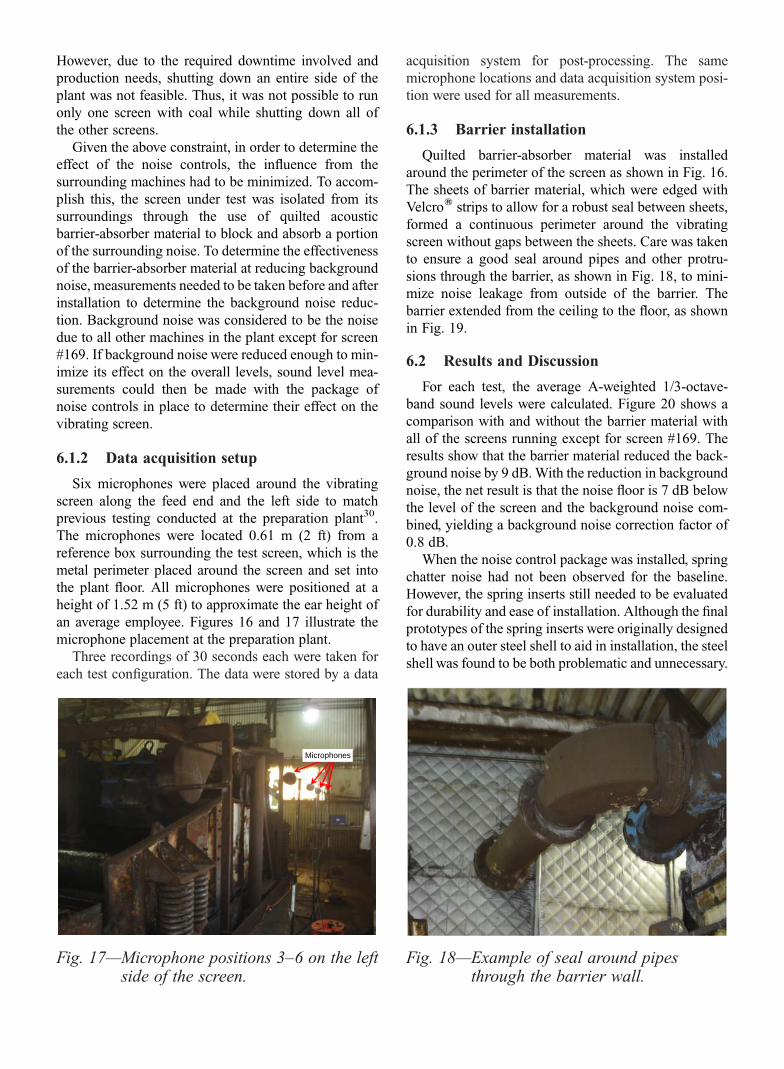
6.1.3 Barrier installation Quilted barrier-absorber material was installed
around the perimeter of the screen as shown in Fig. 16. The sheets of barrier material, which were edged with VelcroW strips to allow for a robust seal between sheets, formed a continuous perimeter around the vibrating screen without gaps between the sheets. Care was taken to ensure a good seal around pipes and other protrusions through the barrier, as shown in Fig. 18, to minimize noise leakage from outside of the barrier. The barrier extended from the ceiling to the floor, as shown in Fig. 19.
6.2 Results and Discussion For each test, the average A-weighted 1/3-octave
band sound levels were calculated. Figure 20 shows a comparison with and without the barrier material with all of the screens running except for screen #169. The results show that the barrier material reduced the background noise by 9 dB. With the reduction in background noise, the net result is that the noise floor is 7 dB below the level of the screen and the background noise combined, yielding a background noise correction factor of 0.8 dB.
When the noise control package was installed, spring chatter noise had not been observed for the baseline. However, the spring inserts still needed to be evaluated for durability and ease of installation. Although the final prototypes of the spring inserts were originally designed to have an outer steel shell to aid in installation, the steel shell was found to be both problematic and unnecessary.
Fig. 18—Example of seal around pipes through the barrier wall.

Fig. 19—Barrier wall surrounding the screen.
First of all, prior to the field testing, it was determined that the prototype inserts for the inner spring did not fit within the outer spring, so all of the inner spring inserts were modified by removing the outer steel shell (Fig. 4). Later, during installation at the preparation plant, we found that hammering on the steel shell to install the spring inserts was not as effective as prying the end coils apart and placing the inserts in the proper position. Figure 21 shows the spring inserts in place with the springs installed on the vibrating screen.
100
125
160
200
250
315
400
500
630
800
1,00
01,
2
95
So
un
d P
ress
ure
Lev
el, d
B(A
)
90
85
80
75
70
65
60
55
50
1/3-Octave-Band Ce
Fig. 20—1/3-Octave-band sound pressure level comwithout the barrier-absorber material ins
To determine the effect of the noise controls on overall sound levels, it is necessary to compare the data from all of the screens running with the barrier material in place versus the same conditions with the noise controls installed. This makes it possible to determine the reduction in sound level due to the noise controls. A comparison of these conditions in Fig. 22 shows that the overall sound level was reduced by 1 dB, with reductions across most of the frequency range.
A prior study conducted in the lab showed that the CLD plates alone reduced the overall sound power levels by 1 dB34. We were expecting at least a 1-dB reduction with some additional improvement from the spring inserts. However, given that no spring chatter was observed on screen #169 before the installation of the noise controls, the spring inserts are not likely to have affected the noise generated on this particular screen. Therefore, the results achieved in the plant are in line with expectations when the test conditions and past laboratory results are considered.
7 CONCLUSIONS NIOSH researchers at the Office of Mine Safety and
Health Research developed four noise controls for a horizontal vibrating screen used in coal preparation plants. Spring inserts combined with constrained layer damping treatments on the mechanism housings reduced overall A-weighted sound power levels by 2.7 dB. The addition of a tuned mechanism suspension
2,00
0
4,00
05,
000
8,00
010
,000
Overa
ll 50
3,15
0
1,60
0
2,50
0
6,30
0
Baseline
Barrier Installed
94
85
nter Frequency (Hz)
parison with screen #169 shut down, with and talled.

Fig. 21—Spring inserts in place and springs installed on the vibrating screen.
reduced the overall A-weighted sound power levels by an additional 1.4 dB. Finally, adding an enclosure to the noise control package improved the results by another 1.5 dB, which resulted in an overall reduction in A-weighted sound power level of nearly 6 dB—or a 75% reduction in A-weighted sound power—as a result of the entire noise control package. If implemented on all vibrating screens within a preparation plant, the entire noise control package has great potential to reduce overall levels in many areas of the facility.
100
125
160
200
250
315
400
500
630
800
1,00
01,
2
95
So
un
d P
ress
ure
Lev
el, d
B(A
)
90
85
80
75
70
65
60
55
50
1/3-Octave-Band Ce
Fig. 22—1/3-Octave-band sound pressure level cobarrier-absorber material installed, with
To ensure that an acoustic enclosure would be practical to implement on a vibrating screen and that the mechanism temperatures would remain within the manufacturer’s limits, several cooling options were explored. A 330.3-L/s (700-CFM) exhaust fan for the enclosure running at 100% flow was found to provide sufficient cooling. A potential area for future work would be to design a more efficient cooling system by using lower-speed fans, redesigning the ductwork, and improving the air circulation within the enclosure. Better circulation of the air within the enclosure would be achieved by mounting fan blades on the spinning coupler ring between the two mechanism housings so that the air within the enclosure is mixed as the mechanisms turn. Better air mixing could potentially allow a shift-long run time with only the 80.2-L/s (170-CFM) fans. However, the current cooling system with the 330.3 L/s (700 CFM) fan does make it possible to utilize an acoustic enclosure in a production environment.
The two controls evaluated at the preparation plant— the CLD plates and spring inserts—met the dual goals of reducing sound levels and demonstrating sufficient durability in a production environment. However, for this particular trial, the spring chatter that the spring inserts are designed to address was not observed in the field prior to installation. When spring chatter was observed in the lab, the spring inserts and CLD plates in combination reduced the A-weighted sound power levels by 2.7 dB. The combination of spring inserts and CLD plates in the field reduced sound levels by
2,00
0
4,00
05,
000
8,00
010
,000
Overa
ll 50
3,15
0
1,60
0
2,50
0
6,30
0
93 92
Baseline (with Barrier)
Spring Inserts + CLD Plates
nter Frequency (Hz)
mparison with all equipment running with and without noise controls.

1 dB. Given the lack of pre-existing spring chatter in this case, it is unlikely that the spring inserts had any effect on the sound levels produced, and the reduction observed is likely due to the CLD plates alone. In this context, the field results are comparable to the laboratory results since prior lab testing showed a 1-dB reduction in the overall A-weighted sound power levels due to the CLD plates alone34.
Notably, this 1-dB reduction achieved from the CLD treatments is just one example of what can be obtained from the final package of noise controls. As mentioned above, previous lab results showed a 1-dB reduction in overall A-weighted sound power levels from the CLD plates alone34, and the results presented herein show a 6-dB reduction in overall A-weighted sound power levels from the complete package of noise controls including the enclosure, tuned mechanism suspension, CLD plates, and spring inserts. If the noise controls are incorporated directly into the final product design, even greater reductions could be achieved. Some noise control concepts, such as the CLD plates, are limited in their success by being add-on features rather than existing as two cast shells for the mechanism housings with damping material in between. The optimum noise control solution would be to integrate the control principles defined here into the development of a new design for a horizontal screen. Such a design would combine reduced noise with practicality for maintenance and operation, and possibly reduced overall cost compared to add-on treatments.
8 ACKNOWLEDGEMENTS
The authors would like to thank the employees at our partner preparation plant for their assistance with our field study, and NIOSH OMSHR employees: Pat McElhinney and Jeff Yonkey for their assistance with the field testing, Vincent Conteen and Andy Lawczniak for preparing the CLD plates for installation, Vincent Conteen for modifying the spring inserts, and Lynn Alcorn for help with the TUMS installations.
9 REFERENCES 1. Bureau of Labor Statistics, “Workplace injuries and illnesses in
2005”, United States Department of Labor, (2006). 2. John R. Franks, Mark R. Stephenson and Carol J. Merry,
“Preventing occupational hearing loss—a practical guide”, Technical Report No. 96–110, National Institute for Occupational Safety and Health, (1996).
3. National Institute for Occupational Safety and Health, National Occupational Research Agenda — Update 2003, DHHS (NIOSH) Publication No. 2003-148, (2003).
4. SangWoo Tak, Rickie R. Davis and Geoffrey M. Calvert, “Exposure to hazardous workplace noise and use of hearing protection devices among US workers—NHANES, 1999– 2004”, Am. J. Industrial Medicine, 52, 358–371, (2009).
5. SangWoo Tak and Geoffrey M. Calvert, “Hearing difficulty attributable to employment by industry and occupation: an analysis of the National Health Interview Survey—United States, 1997 to 2003”, J. Occupational and Environmental Medicine, 50, 46–56, (2008).
6. National Institute for Occupational Safety and Health, “Preventing Occupational Hearing Loss: A Practical Guide”, DHHS (NIOSH) Publication No. 96-110, 19–25, (1996).
7. Federal Register, “Health Standards for Occupational Noise Exposure; Final Rule”, Department of Labor, Mine Safety and Health Administration, 30 CFR Part 62, 64(176), 49630– 49634, (1999).
8. PEIR, “Mine Data Retrieval System”, United States Department of Labor Mine Safety and Health Administration, <http://www.msha.gov/OpenGovernmentData/OGIMSHA. asp> downloaded December 9, 2010, with the exception of the MSHA Accident data file, which was downloaded December 27, 2010.
9. J.S. Vipperman, E.R. Bauer and D.R. Babich, D.R., “Survey of noise in coal preparation plants”, J. Acoust. Soc. of Am., 121, 197–205, (2007).
10. M.N. Rubin, A.R. Thompson, R.K. Cleworth and R.F. Olson, “Noise Control Techniques for the Design of Coal Preparation Plants”, BuMines OFR 42–84, (1982).
11. E.E. Ungar, G.E. Fax, W.N. Patterson and H.L. Fox, “Coal Cleaning Plant Noise and Its Control”, BuMines OFR 44–74, (1974).
12. Eric E. Ungar, Clive L. Dym and Matthew H. Rubin, “Practical reduction of noise from chutes and screens in coal cleaning plants”, BBN Report No. 3337, (1976).
13. M. Jenae Lowe and David S. Yantek, “Noise survey of aggregate industry vibrating screens”, NoiseCon11, (2011).
14. Matthew N. Rubin, “Demonstrating the noise control of a coal preparation plant — Volume I. Initial installation and treatment evaluation”, BBN Report No. 3631, (1977).
15. Matthew N. Rubin, “Demonstrating the noise control of a coal preparation plant — Volume II. Long-term treatment evaluation”, BBN Report No. 4922, (1982).
16. R. J. Pokora, T. G. Bobick and T. L. Muldoon, “Retrofit noise control modifications for crushing and screening equipment in the nonmetallic mining industry, an applications manual”, Information Circular No. 8975, U.S. Department of the Interior, Bureau of Mines, (1984).
17. Harsha Vardhan, Y.V. Rao and N.C. Karmakar, “Noise analysis of heavy earth moving machinery deployed in opencast mines and development of suitable maintenance guidelines for its attenuation — Part 1”, Noise & Vibration Worldwide, 35(8), 11-24, (2004).
18. Kevin S. Hennings and Kenneth N. Allan, “Noise reduction from vibrating screens”, 1977 Coal Convention of the American Mining Congress Session Papers, 1–12, (1977).
19. Robert J. Pokora and Terry L. Muldoon, “Demonstration of noise control techniques for the crushing and screening of nonmetallic minerals”, BM-8001, Foster-Miller Associates, Inc., (1982).
20. Hua Zhu, Shirong Ge and Yu Xiaoyan, “A novel low-noise vibrating screen”, Coal Preparation, 24(1–2), 85–96, (2004).
21. K. Hennings, “Noise abatement of vibrating screens using nonmetallic decks and vibration treatments”, OFR 120-82, Allis-Chalmers Corporation, (1980).
22. Wu Miao et al., “Dynamic characteristics analysis of 2065A two-axle vibrating screen and its noise control”, Journal of China University of Mining & Technology, 22(2), 8–12 (1993), (in Chinese).
23. Yueming Zhu, “Noise control of vibrating screen”, Journal of Liaoning Technical University, 18(5), 494-496, (1999), (in Chinese).
24. Wei An, Hua Zhu and Xin Lu, “Development of low noise two-channel linear vibration screen”, China Mechanical Engineering, 15(4), 300–302, (2004), (in Chinese).

25. Xuedong Wang, “Technical innovation of high-frequency vibrating screen”, Journal of Hebei Energy Institute of Vocation and Technology, 3(20), 78–80, (2006), (in Chinese).
26. Jean-Guy St-Pierre and André Godbout, “Screening apparatus for efficiently separating coarse material from finer material”, U.S. Patent 5,232,098, (1993).
27. Louis W. Johnson and Bruce G. Johnson, “Shaker screen”, U.S. Patent 4,529,510, (1985).
28. Jun Luo and Yimin Wang, “Noise control of vibrating screen”, Environmental Engineering, 24(3), 57–59, (2006), (in Chinese).
29. Daiguang Song, Bu Xiangquan and Yanjun Zhao, “Using analysis of YA1340 vibrating screen”, Coal Mine Machinery, 28(7), 156–157, (2007), (in Chinese).
30. D.S. Yantek, P. Jurovcik and E.R. Bauer, “Noise and vibration reduction of a vibrating screen”, Transactions of the Soc. for Mining, Metallurgy, and Exploration, 318, 201–213, (2005).
31. D.S. Yantek, H.E. Camargo and R.J. Matetic, “Application of a microphone phased array to identify noise sources on a horizontal vibrating screen”, 2008 National Conf. on Noise Control Engineering, (2008).
32. H.E. Camargo, P.A. Ravetta, R.A. Burdisso and D.S. Yantek, “Noise source identification on a horizontal vibrating screen”, Mining Engineering, 61(7), 47–51, (2009).
33. D.S. Yantek and H.E. Camargo, “Structural vibration as a noise source on vibrating screens”, ASME 2009 International Mechanical Engineering Congress & Exposition, (2009).
34. M.J. Lowe, D.S. Yantek, H.E. Camargo, L.A. Alcorn and M. Shields, “Noise controls for vibrating screen mechanisms”, Transactions of the Soc. for Mining, Metallurgy, and Exploration, 330, 446–451, (2011).
35. M. Jenae Lowe, David S. Yantek, Hugo E. Camargo and Lynn A. Alcorn, “Acoustic enclosure to reduce noise from vibrating screen mechanism housings”, U.S. Department of Health and Human Services, Public Health Service, Centers for Disease Control and Prevention, National Institute for Occupational Safety and Health, DHHS (NIOSH), Technology News, 538, (2009).
36. Renzhi Wei et al, “Research and design of new type low noise vibration screen”, Coal Science and Technology, 23(12), 1–4, (1995), (in Chinese).
37. Hans Jakobs, “Screen structure”, U.S. Patent 3,024,912, (1962).
38. P.O. Edmond Booth, “Vibrating screen mechanism with resilient connection between gear and counterweight”, U.S. Patent 2766,629, (1956).
39. Hua Zhu, Gu Yuhua, Wu Miao and Renzhi Wei, “Development of low noise two-axle vibrating screen”, Chinese Journal of Mechanical Engineering, 34(4), 96–101, (1998), (in Chinese).
40. Renzhi Wei and Wu Miao, “The experimental study on flexible web gear”, MPT 91 JSME, International Conference on Motion and Power Transmissions, (1991).
41. Jie Li and Hu Ping, “Reducing the noise of vibrating screen using double-body structure”, Mechanics in Engineering, 20 (5), 27–29, (1998), (in Chinese).
42. Weiyuan Song, Lei Wang and Zhihui Zhang, “Vibrating Isolation Ring Applied in Noise Control in Vibrating Screen”, Journal of Liaoning Technical University, 22(6), 782–784, (2003), (in Chinese).
43. Clifford G. Hollyfield and Allen S. Jackson, “Vibrating screen separator”, U.S. Patent 5199,574, (1993).
44. James E. Shahan, “Vibratory screen having noise level reduction by isolation”, U.S. Patent 4, 180,458, (1979).
45. David S. Yantek and M. Jenae Lowe, “Analysis of a mechanism suspension to reduce noise from horizontal vibrating screens”, Noise Control Engr. J., 59(6), 568–580, (2011).
46. Acoustics — Determination of sound power levels and sound energy levels of noise sources using sound pressure — Engineering methods for small movable sources in reverberant fields Part 1: Comparison method for a hard-walled test room, International Standard ISO 3743-2:1994, International Organization for Standardization, (1994).
47. J. Shawn Peterson, David Yantek and Adam K. Smith, “Acoustic testing facilities at the Office of Mine Safety and Health Research”, Noise Control Engr. J., 60(1), 85–96, (2012).
48. David S. Yantek and M. Jenae Lowe, “Horizontal Vibrating Screens: Noise in Coal Preparation Plants, Dominant Noise Sources, and Noise Controls”, International Coal Prep 2012—Annual Coal Processing Exhibition and Conference, (2012).
49. David S. Yantek, presented at the Office of Mine Safety and Health Research mid-year project reviews, April 30, 2009, (unpublished).