Embed Size (px)
Citation preview
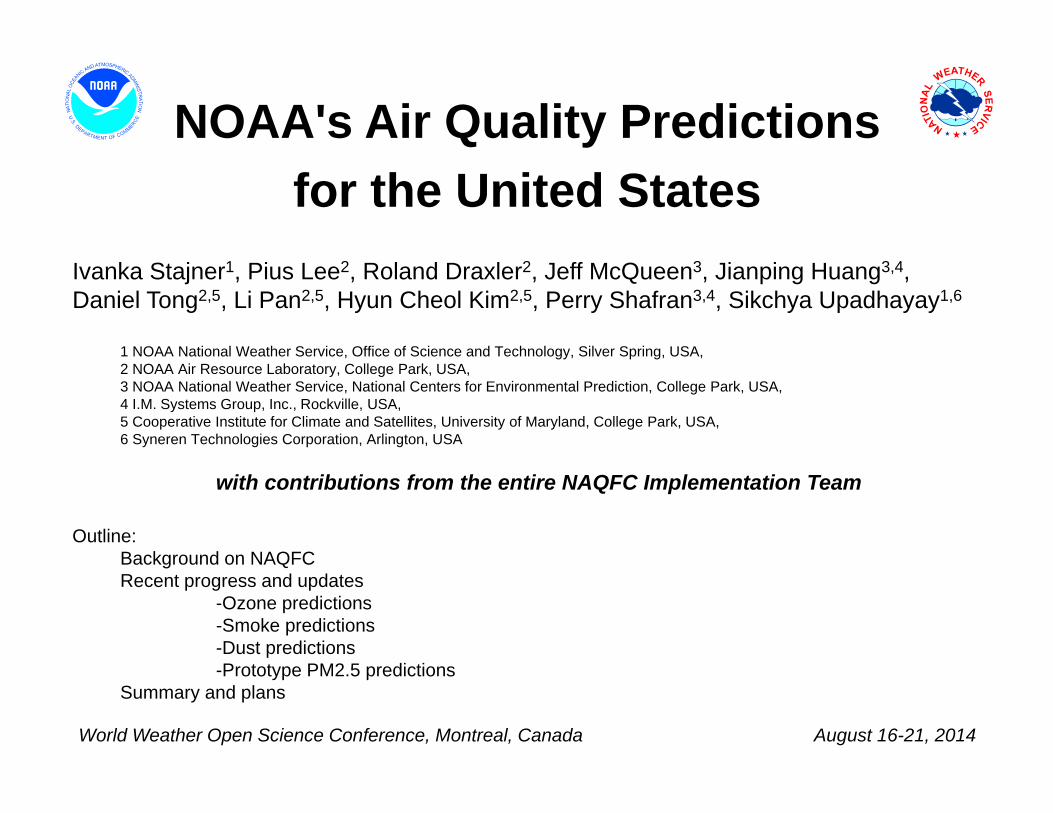
NOAA's Air Quality Predictions for the United States
Ivanka Stajner1, Pius Lee2, Roland Draxler2, Jeff McQueen3, Jianping Huang3,4, Daniel Tong2,5, Li Pan2,5, Hyun Cheol Kim2,5, Perry Shafran3,4, Sikchya Upadhayay1,6
1 NOAA National Weather Service, Office of Science and Technology, Silver Spring, USA, 2 NOAA Air Resource Laboratory, College Park, USA, 3 NOAA National Weather Service, National Centers for Environmental Prediction, College Park, USA, 4 I.M. Systems Group, Inc., Rockville, USA, 5 Cooperative Institute for Climate and Satellites, University of Maryland, College Park, USA, 6 Syneren Technologies Corporation, Arlington, USA
with contributions from the entire NAQFC Implementation Team
Outline: Background on NAQFCRecent progress and updates
-Ozone predictions-Smoke predictions-Dust predictions-Prototype PM2.5 predictions
Summary and plans
World Weather Open Science Conference, Montreal, Canada August 16-21, 2014

National Air Quality Forecast CapabilityCapabilities as of 8/2014
• Improving the basis for air quality alerts• Providing air quality information for people at risk
Prediction Capabilities: • Operations:
Ozone nationwideSmoke nationwideDust over CONUS
• Experimental testing:Ozone predictions
• Developmental testing: Components for particulate matter (PM) predictions
2004: ozone
2005: ozone
2007: ozone and smoke2012: dust
2009: smoke2010: ozone
2010: ozone and smoke
2

Model: Linked numerical prediction systemOperationally integrated on NCEP’s supercomputer• NOAA NCEP mesoscale numerical weather prediction• NOAA/EPA community model for air quality: CMAQ • NOAA HYSPLIT model for smoke and dust predictionObservational Input: • NWS weather observations; NESDIS fire locations;
climatology of regions with dust emission potential • EPA emissions inventory
National Air Quality Forecast CapabilityEnd-to-End Operational Capability
Gridded forecast guidance products• On NWS servers: airquality.weather.gov
and ftp-servers (12km resolution, hourly for 48 hours)
• On EPA servers• Updated 2x daily
Verification basis, near-real time:• Ground-level AIRNow observations
of surface ozone• Satellite observations of smoke and dust
Customer outreach/feedback• State & Local AQ forecasters coordinated with EPA• Public and Private Sector AQ constituents
AIRNow
ozone
dust
smoke
3

Air Quality Forecasting in the US• Exposure to fine particulate matter
and ozone pollution leads to premature deaths of more than 50,000 annually in the US (Science, 2005; recently updated to 100,000 deaths; Fann, 2011, Risk Analysis)
• Air quality forecasting in the US relies on a partnership among NOAA, EPA, state and local agencies
• NOAA air quality forecasting team includes NWS, OAR and NESDIS
4
NOAAdevelop & evaluate models; provide operational AQ predictions
State and local agencies
provide emissions, monitoring dataAQI forecasts
EPAmaintain national emissions,
monitoring data; disseminate/interpret AQ
forecasts
http://airquality.weather.gov/
http://airnow.gov/
ozone smoke
dust
4

Ozone predictionsOperational predictions at http://airquality.weather.gov
over expanding domains since 2004
1-Hr Average Ozone
8-Hr Average Ozone
1-Hr Average Ozone8-Hr Average Ozone
1-Hr Average Ozone8-Hr Average Ozone
CONUS, wrt 75 ppb ThresholdOperational
Maintaining prediction accuracy as the warning threshold was lowered and emissions of pollutants are changing
0.99 0.99 0.98 0.98 0.98
0.9
0.95
1
4/1/2013 5/1/2013 5/31/2013 6/30/2013 7/30/2013 8/29/2013
Fraction correct of daily maximum of 8h average wrt 75 ppb threshold
5
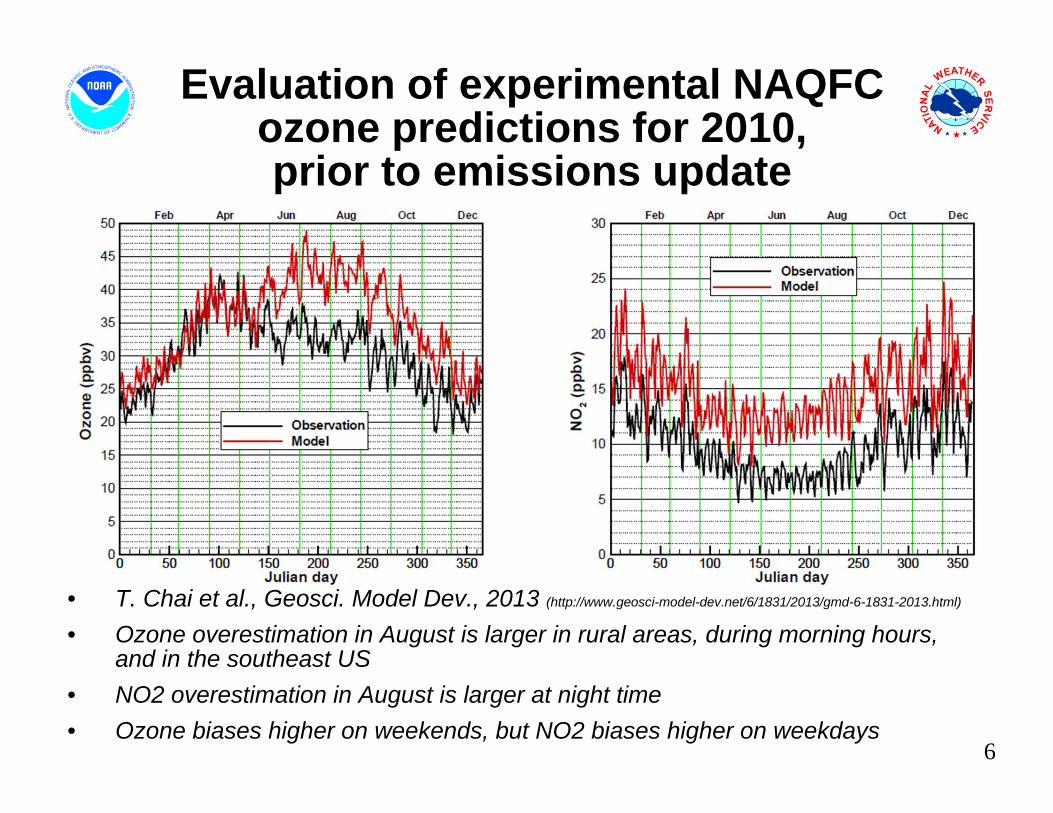
Evaluation of experimental NAQFC ozone predictions for 2010, prior to emissions update
• T. Chai et al., Geosci. Model Dev., 2013 (http://www.geosci-model-dev.net/6/1831/2013/gmd-6-1831-2013.html)
• Ozone overestimation in August is larger in rural areas, during morning hours, and in the southeast US
• NO2 overestimation in August is larger at night time• Ozone biases higher on weekends, but NO2 biases higher on weekdays
6

Summary of Emission Data Sources
Area Sources US EPA Projected 2012 Nonroad + 2005 NEIs for other sectors; Canada 2006 Emission Inventory; Mexico 1996 EI for six border states;
Mobile Sources (onroad) 2005 NEI with Cross‐State Air Pollution Rule (CSAPR) projection for US sources Canada 2006 Emission Inventory;
Point Sources (EGUs and non‐EGUs) NEI 2005 for base year; Updated with 2012 Continuous Emission Monitoring (CEM) data for EGUs; Projected into forecast year using DOE Annual Energy Outlook (2014) factors;
Natural Sources Terrestrial biogenic emission: BEIS model v3.14 Sea‐salt emission: CMAQ online Sea‐salt emission model;
7
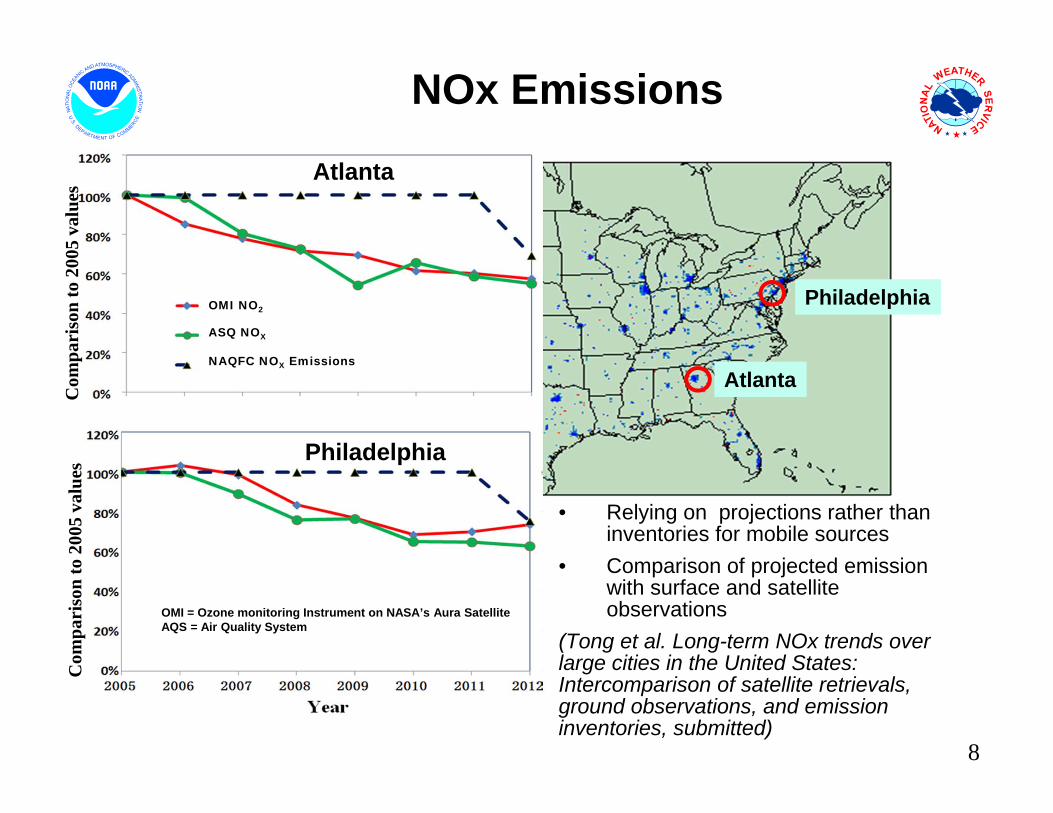
NOx Emissions
Atlanta
Philadelphia
8
Com
pari
son
to 2
005
valu
esC
ompa
riso
n to
200
5 va
lues
OMI NO2
ASQ NOX
NAQFC NOX Emissions
OMI = Ozone monitoring Instrument on NASA’s Aura SatelliteAQS = Air Quality System
• Relying on projections rather than inventories for mobile sources
• Comparison of projected emission with surface and satellite observations
(Tong et al. Long-term NOx trends over large cities in the United States: Intercomparison of satellite retrievals, ground observations, and emission inventories, submitted)
Atlanta
Philadelphia

Testing of ozone prediction updates
Model updates
• CB05 chemical mechanism
• Lateral boundary conditions
• Dry deposition• Minimum PBL
height
9
Western US Eastern US
Mea
nFr
actio
n co
rrec
t wrt
75pp
b th
resh
old
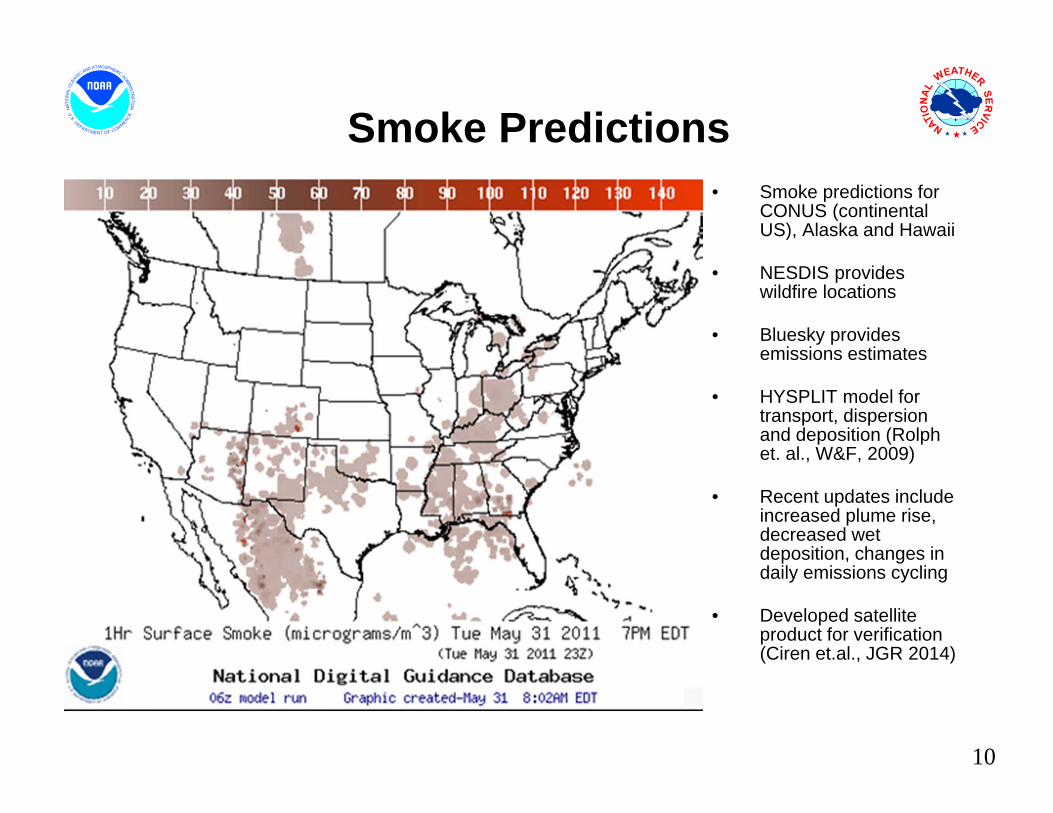
Smoke Predictions• Smoke predictions for
CONUS (continental US), Alaska and Hawaii
• NESDIS provides wildfire locations
• Bluesky provides emissions estimates
• HYSPLIT model for transport, dispersion and deposition (Rolphet. al., W&F, 2009)
• Recent updates include increased plume rise, decreased wet deposition, changes in daily emissions cycling
• Developed satellite product for verification (Ciren et.al., JGR 2014)
10

Okanogan-Wenatchee National Forest Fire in Washington State
• Okanogan-Wenatchee National Forest fire- the largest recorded wildfire in Washington state history (http://blogs.seattletimes.com/today/2014/07/okanogan-county-fire-now-largest-in-state-history/)
• About 300 homes have burned in Okanogan County(http://seattletimes.com/html/localnews/2024165302_firesaturdayxml.html)

7/13/09, 17-18Z, Prediction:
Smoke Verification: July 13, 2009
7/13/09, 17-18Z, Observation:
GOES smoke product: Confirms areal extent of peak concentrations
FMS = 30%, for column-averaged smoke > 1 ug/m3
Manuscript about smoke verification product is in preparation 12

Figure of merit in space (FMS), which is a fraction of overlap between predicted and observed smoke plumes, threshold is 0.08 marked by red line
NESDIS GOES Aerosol/Smoke Product is used for verification Since July 26, 2013, the model includes the following updates: increased plume rise, decreased
deposition, changes in daily emissions cycling
Verification of smoke predictionsfor CONUS
Daily time series of FMS for smoke concentrations larger than 1um/m3
00.050.10.150.20.250.30.350.40.450.5
7/1/13
7/3/13
7/5/13
7/7/13
7/9/13
7/11/13
7/13/13
7/15/13
7/17/13
7/19/13
7/21/13
7/23/13
7/25/13
7/27/13
7/29/13
7/31/13
Threat Score
Date
July 2013
00.050.10.150.20.250.30.350.40.450.5
8/1/13
8/3/13
8/5/13
8/7/13
8/9/13
8/11/13
8/13/13
8/15/13
8/17/13
8/19/13
8/21/13
8/23/13
8/25/13
8/27/13
8/29/13
8/31/13
Date
August 2013
13

Standalone prediction of airborne dust from dust storms:
•Wind-driven dust emitted where surface winds exceed thresholds over source regions
• Source regions with emission potential estimated from MODIS deep blue climatology (2003-2006).
• Emissions modulated by real-time soil moisture.
• HYSPLIT model for transport, dispersion and deposition (Draxler et al., JGR, 2010)
• Wet deposition updates in July 2013
• Developed satellite product for verification (Ciren et.al., JGR 2014)
CONUS Dust PredictionsOperational Predictions at http://airquality.weather.gov/
14

• Improving sources for wildfire smoke and dust – now in testing
• Chemical mechanisms eg. SOA• Meteorology eg. PBL height• Chemical boundary conditions/trans-
boundary inputs
Testing of PM2.5 Predictions
Forecast challenges
AQ Forecaster Focus group access only, real-time as resources permit
Aerosols over CONUS From NEI sources only CMAQ:
CB05 gases, AERO-4 aerosols Sea salt emissions
• Show seasonal bias-- winter, overprediction; summer, underprediction
15NAQFC PM2.5 test predictions

16
Blowing Dust Event in testing of PM2.5 predictions
Independent NOAA/NESDIS analysis narrative based onsatellite imagery:

Impact of forest fires in testing of PM2.5 predictions
Difference between two PM2.5 predictions: with-minus-without fire emissions
NOAA NESDIS Hazard Mapping System Fire and Smoke Analysis

Seasonal Bias in PM2.5 prediction
The bias in the total mass of PM2.5 is dominated by overpredictions of unspecified PM in the winter and by underpredictions of carbon aerosols in the summer. (Foley et. al., Incremental testing of the Community Multiscale Air Quality (CMAQ) modeling system version 4.7, Geosci. Model Dev., 3, 205-226, 2010)
Saylor et. al. found same type of seasonal speciation biases in the CMAQ v4.6 for IMPROVE sites.
Mean (star), median (triangle), and inter-quartile ranges of model bias (model value – observed value) for multiple fine-particle species measured at CSN sites in the 12km domain. The number of model/observation pairs for each species is shown above the x-axis.
18

Removal of Bias in PM2.5 predictions
19
Unsystematic component of the RMSE (top panel) and systematic component of RMSE (bottom panel) using hourly values for the month of November evaluated at the 518 AIRNow PM2.5 sites.
Raw: Hourly AIRNow data available in real-time
PERS: Persistence forecast
7-day: 7-day running mean subtraction
KF: Kalman-filter approach
ANKF: Analog forecast technique followed by Kalman filter approach
AN: Analog Forecast technique
KF-AN: Kalman-filter approach followed by Analog forecast technique
•Quality control of the observations is essential•Five different post-processing techniques were tested
I. Djalalova, L. Delle Monache, and J. Wilczak: PM2.5 analog forecast and Kalman filter post-processing for the Community Multiscale Air Quality (CMAQ) model, manuscript in preparation
Acknowledgments:AQF Implementation Team Members
Special thanks to Paula Davidson, OST chief scientist and former NAQFC Manager and to Jim Meager former NOAA AQ Matrix Manager
NOAA/NWS/OST Ivanka Stajner NAQFC ManagerNWS/OCWWS Jannie Ferrell Outreach, FeedbackNWS/OPS/TOC Cynthia Jones Data CommunicationsNWS/OST/MDL Jerry Gorline, Marc Saccucci, Dev. Verification, NDGD Product Development
Dave RuthNWS/OST Sikchya Upadhayay Program SupportNESDIS/NCDC Alan Hall Product ArchivingNWS/NCEP
Jeff McQueen, Jianping Huang Perry Shafran AQF model interface development, testing, & integration*Sarah Lu Global dust aerosol and feedback testing *Brad Ferrier, *Eric Rogers, NAM coordination*Hui-Ya ChuangGeoff Manikin Smoke and dust product testing and integrationAllan Darling, Chris Magee NCO transition and systems testingMike Bodner, Andrew Orrison HPC coordination and AQF webdrawer
NOAA/OAR/ARLPius Lee, Daniel Tong, Tianfeng Chai CMAQ development, adaptation of AQ simulations for AQFHyun-Cheol Kim Roland Draxler, Glenn Rolph, Ariel Stein HYSPLIT adaptations
NESDIS/STAR Shobha Kondragunta Smoke and dust verification product development
NESDIS/OSDPD Liqun Ma, Mark Ruminski Production of smoke and dust verification products,
HMS product integration with smoke forecast tool
EPA/OAQPS partners:
Chet Wayland, Phil Dickerson, Brad Johns, John White AIRNow development, coordination with NAQFC
* Guest Contributors20
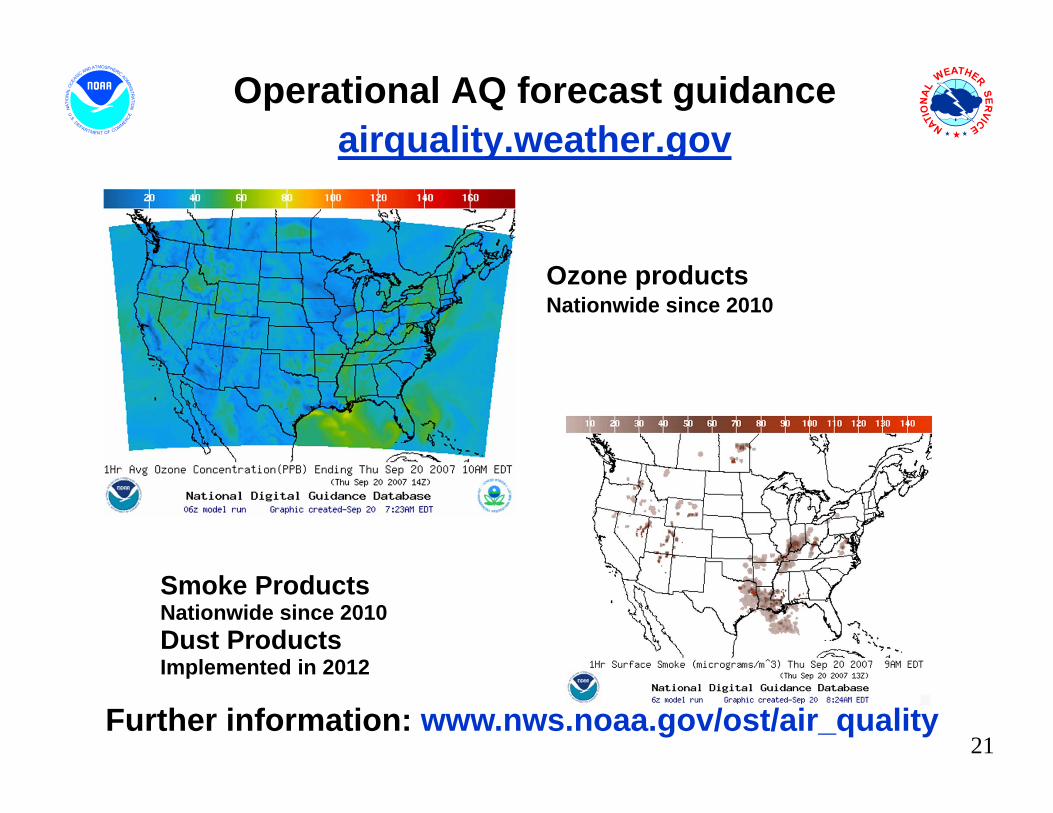
Operational AQ forecast guidanceairquality.weather.gov
Further information: www.nws.noaa.gov/ost/air_quality
Ozone productsNationwide since 2010
Smoke ProductsNationwide since 2010Dust ProductsImplemented in 2012
21
Summary and Future PlansUS national AQ forecasting capability and recent updates:
• Operational ozone prediction nationwide; substantial emission update in 2012
• Operational smoke prediction nationwide; recent plume rise update
• Operational dust prediction for CONUS sources; emissions moderated by soil moisture
• Experimental ozone predictions for CONUS; updated emissions, CB05 mechanism, lateral boundary conditions, deposition, minimum PBL height
• Prototype CMAQ aerosol predictions with NEI sources, wildfire and dust emissions
If/when resources allow we plan to:• Maintain operational AQ predictions• Transition currently experimental ozone into operations• Use lateral boundary conditions from global dust predictions in testing of PM2.5 predictions• Test of smoke predictions with 4 km meteorology and emission updates 22
Back up slides
23

Testing of Incremental upgrades
observations
experimental
2012 emissions
Old recycled emission from 2012 (emission 2012)
2014 New actual 2014 emission: new point, area and mobile
snow 2014 + PM‐emission modulated by ice and snow cover
NTR snow + NTR_fast (kinematic rate*10) i.e. sink as HNO3 faster
smoke NTR + HMS‐Bluesky, plume‐rise wild fire
RMSE for 48 contiguous states (CONUS)
Mean for Northeastern USObservations
Experimental
2012 emissions
2014
Snow
NTR
smoke

Texas dust event on November 2, 2011
A widespread dust event occurred on Nov 2 beginning around 18Z in west central Texas. This event was the result of ~25kt synoptic scale winds ahead of a cold front. Through 0Z (Nov 3) the dust blew south covering all of west Texas and parts of southeast New Mexico.
Previous model: emissions not modulated by soil moisture
Current model: emissions modulated by real time soil moisture using Bowen ratio (sensible heating / latent heating)
Predicted dust concentration (ug/m3) at the surface
• Longer time step (10 min vs. 6 min) provides comparable predictions, but 30% faster
• Reduced wet deposition
Dust prediction updates• Modulating dust emissions using real-time soil moisture information
25
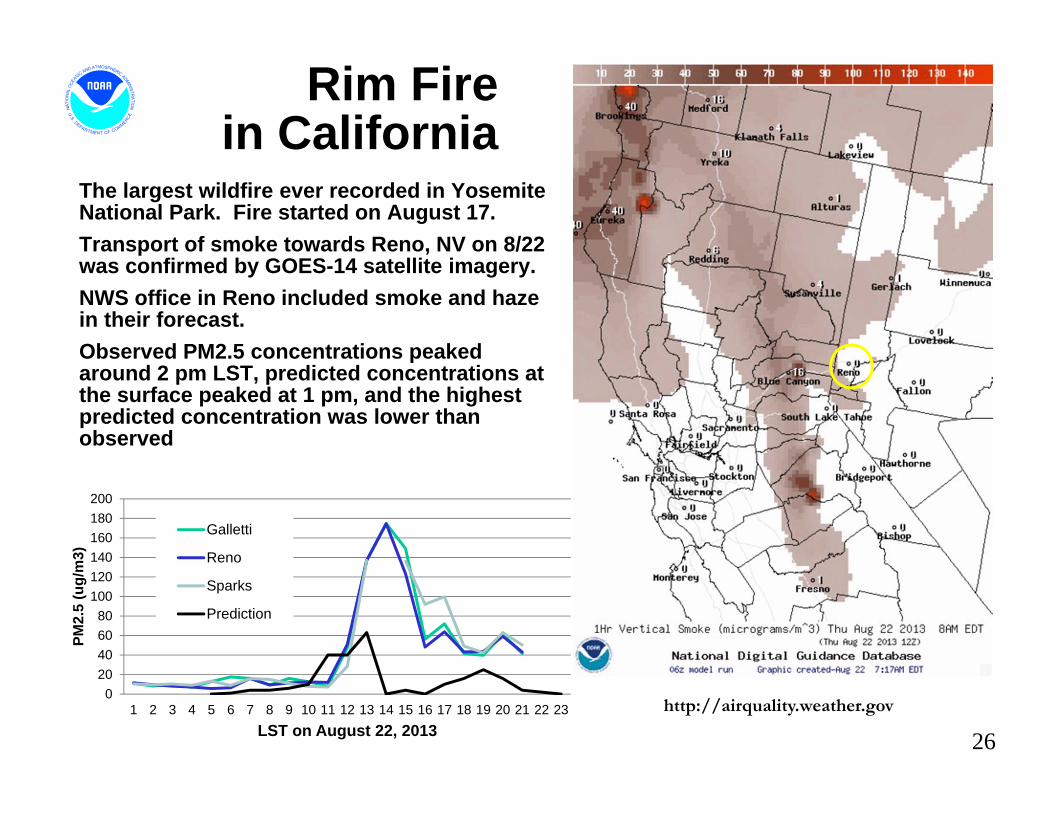
Rim Fire in California
The largest wildfire ever recorded in Yosemite National Park. Fire started on August 17. Transport of smoke towards Reno, NV on 8/22 was confirmed by GOES-14 satellite imagery.NWS office in Reno included smoke and haze in their forecast. Observed PM2.5 concentrations peaked around 2 pm LST, predicted concentrations at the surface peaked at 1 pm, and the highest predicted concentration was lower than observed
020406080
100120140160180200
1 2 3 4 5 6 7 8 9 10 11 12 13 14 15 16 17 18 19 20 21 22 23
PM2.
5 (u
g/m
3)
LST on August 22, 2013
Galletti
Reno
Sparks
Prediction
http://airquality.weather.gov
26

Smoke Forecast ToolMajor Components
NWP Model
NAM/NMMB
NOAA/NWS
HYSPLIT Module: NOAA/OAR
Weather Observations
USFS’s BlueSky
Emissions Inventory:
USFS
NESDIS HMSFire Locations
Verification: NESDIS/GASP Smoke
NOAA
USFS
http://airquality.weather.gov/ 27

Dust Forecast Tool for CONUSMajor Components
NWP Model
NMMB
NOAA/NWS
HYSPLIT Module: NOAA/OAR
Weather Observations
NOAA/GFDLMap of possible
dust sources
NWP Post-processorsfor AQ Modules
Verification: NESDIS Dust
0
10
20
30
40
FMS (%
)
http://airquality.weather.gov/28