Embed Size (px)
DESCRIPTION
presentation / case study in progress
Citation preview

Corina RiveraData Visualization

National Oceanic and Atmospheric Administration (NOAA)
NOAA is an agency that enriches life through science. Their reach goes from the surface of the sun to the depths of the ocean floor as they work to keep citizens informed of the changing environment around them.
From daily weather forecasts, severe storm warnings and climate monitoring to fisheries management, coastal restoration and supporting marine commerce, NOAA’s products and services support economic vitality and affect more than one-third of America’s gross domestic product. NOAA’s dedicated scientists use cutting-edge research and high-tech instrumentation to provide citi-zens, planners, emergency managers and other decision makers with reliable information they need when they need it.
NOAA’s roots date back to 1807, when the Nation’s first scientific agency, the Survey of the Coast, was estab-lished. Since then, NOAA has evolved to meet the needs of a changing country. NOAA maintains a presence in every state and has emerged as an international leader on scientific and environmental matters.
NOAA seeks to improve their graphics to clearly repre-sent the statistics involving the rising climate affects on the ocean in an intriguing way in hopes of educating the public.
To create an informational graphic poster that will edu-cate young adults about the consequences the ocean will face due to rising climate changes.
18-28
Welcoming, Educational, Direct
Print/Web
Client Objective
Solution
Audience
Tone
Media
Background
Project Statement

Whats out There

Mood Board

ResearchSalinity
Although seawater is not uniformly saline throughout the world, the vast majority of seawater has a salinity level between 3.1 percent and 3.8 percent. Ocean salinity has been stable for billions of years, however scientists have observed that the salinity of seawater has been changing over the course of the last five decades.
These changes in salinity are accelerating the water cycle. As global temperatures get warmer, evaporation increases, altering the frequency, strength and distribution of rainfall around the planet.Salinity, water cycle, temperature and weather are interconnected phenomenon. Ocean salinity is important because it affects ocean circulation; this in turn affects ocean temperatures, which can alter the weather.Seawater which is high in saline can cause radical alterations in weather patterns. Salty water has a tendency to sink while warmer water rises to the surface, this im-pacts ocean currents which then impact the weather.Research published in the journal Nature in 2006, indicated that sudden decreases in temperature over Greenland and tropical rainfall patterns during the last Ice Age are linked to rapid changes in the salinity of the North Atlantic Ocean.
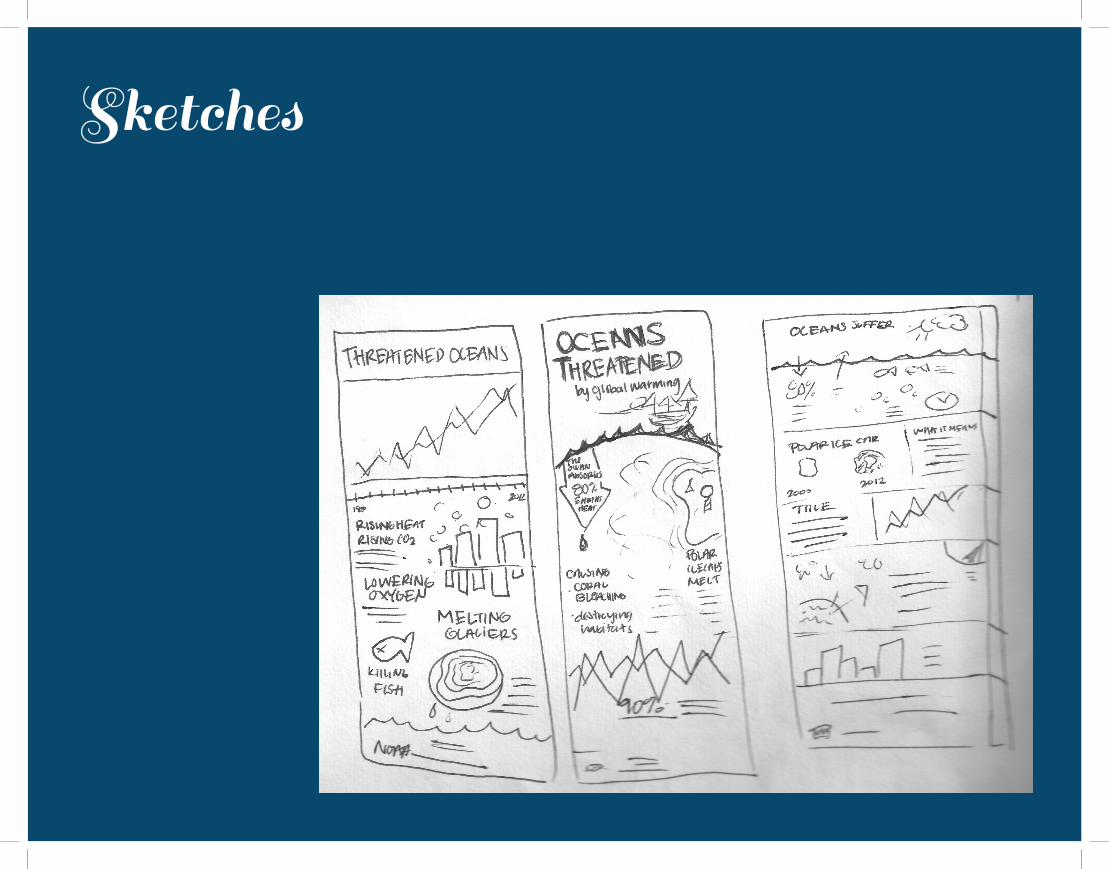
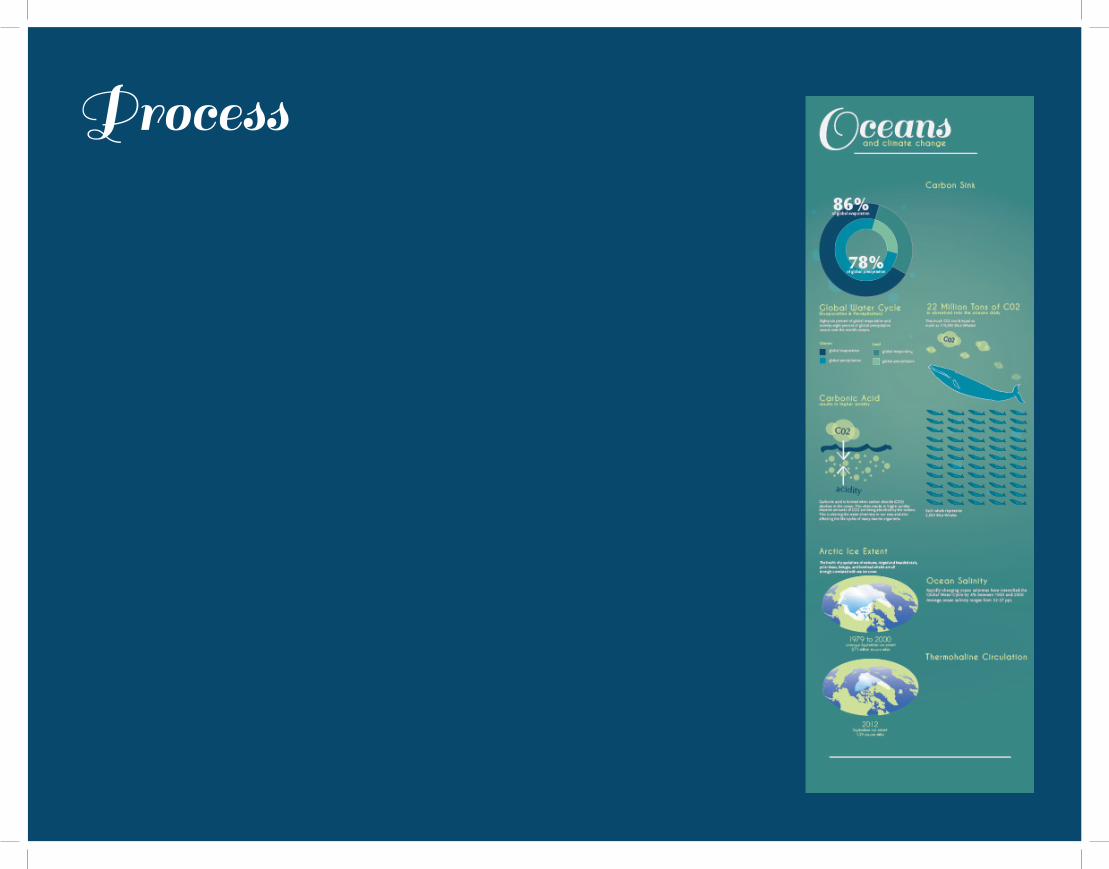
A warming planet can accelerate the water cycle making dry regions drier and high rainfall regions wetter. Although factors like wind can affect ocean salinity, the primary factor appears to be evaporation caused by warming. According to NASA’s Salinity Processes in the Upper Ocean Regional Study (SPURS), we see 86 percent of global evaporation and 78 percent of global precipitation over the world’s oceans. The oceans have more evaporation as compared to precipitation, which makes the water saltier, whereas in areas where there is more precipitation, the water is fresher.
What can salinity tell us?By observing states and changes of the concentrations of ocean salinity we are able to learn something new about ocean circulation, the water cycle, and climate change. The Aquarius satellite mission will provide monthly maps of global SSS over a three-year period. These maps will allow us to witness small variations in SSS that may have a dramatic impact on the water cycle and ocean circulation. Further, long-term accurate global maps of SSS are crucial to increase understanding of Earth’s climate.
SSS will tell us how global precipitation, evaporation, and the water cycle are changing. As salinity is a key surface tracer of fresh water input to output from the ocean, SSS provides much-needed information for global water cycle research. Thus Aquarius data will augment spaceborne measurements of: • Precipitation • Evaporation • Soil moisture • Atmospheric water vapor • Sea ice extent
By tracking SSS we can directly monitor variations in the water cycle: land runoff, sea ice freezing and melting, evaporation and precipitation over the oceans. These changes may reflect changes in the global Earth system or other natural or human-induced changes. To track changes in SSS patterns over time, scientists monitor the relationship between two primary processes in the oceans: evaporation, which controls the loss of water; and precipitation which governs the gain of water. Data from the Aquarius mission will enable scientists to produce accurate maps of global balance of evaporation and precipitation. Thus, for the first time we will observe how the ocean responds to variability in the water cycle, from season-to-season and year-to-year.
A Global View of Salinity
The cycling of water and energy through the atmosphere and oceans is crucial to life on Earth, but the ties among the water cycle, ocean circulation, and climate are poorly understood. Global measurement of SSS over time will provide insight to interactions among these relationships.For example, in the tropics, increased precipitation can lead to fresh water sur-face layers on the ocean, which heat up and modify the energy exchange with the atmosphere, affecting El Niño and Monsoon processes. At high latitudes, melting sea ice, increased precipitation, and/or river inputs will also make ocean surface water less salty. This density change could disrupt thermohaline circulation, which could restrict the ocean-atmosphere heat pump that normally warms the atmosphere, lead-ing to possible dramatic changes in climate.Another important mission objective is demonstrating how monitoring salinity-driven ocean circulation -- and its subsequent feedback on climate and events such as El Niño and La Niña -- can benefit society as whole. For example, observations of salinity can significantly improve predictions of an El Niño event. When changes in salinity occur, they affect the El Niño event for the next 6 to 12 months. In this lag time, salinity changes have the potential to modify the layers of the ocean and affect the heat content of the western Pacific Ocean. This is the region where the unusual atmospheric and oceanic behavior associated to El Niño first develops. Thus, includ-ing SSS measurements in forecast models could help predict El Niño events 6 to 12 months in advance. Global SSS data will allow us to create unprecedented computer models that bridge ocean-atmosphere-land-ice systems, with the goal of predicting future climate conditions.
HIGH TIDEMark Lynas
Alaskan mountain glaciers are losing ice at a rate fast enough to have a measurable impact on global sea levels, whilst other glaciers and snowfields are disappearing throughout the region.
Arctic Ice has had a thinning trend of over 40% over the last thirty years.The total area of Arctic sea ice is also diminishing rapidly: satellite data shows an

area one and a half times the size of Wales is lost every year.
The health of populations of walruses, ringed and bearded seals, polar bears, belugas, and bowhead whales are all strongly cor-related with sea ice cover.
Arctic National Wildlife Refuge
Increasing temperatures, melting glaciers, reduced surface area and thickness of sea ice, thawing permafrost, and rising sea level are all indications of warming throughout the Arctic. Available data from Alaska and western Canada indicate that winter temperatures in this area have increased as much as 5 to 7°F in the past 50 years(2).precipitation has increased across the Arctic by about 8% over the past 100 years, with much of the increase occurring as rain-on-snow during the winter(2). Snow-covered areas have decreased by about 10% over the past 30 years, with the most significant decreases occurring in April and May(3). Permafrost temperatures in boreholes within the Arctic Refuge were up to 5°F warmer in 2004 than they were in 1985.
Arctic Sea Ice NSIDC
**fg1 imageFollowing the record minimum that was set on September 16, 2012, Arctic sea ice has started its seasonal pattern of growth; maximum seasonal extent is expected to be reached by the end of March of next year.Arctic sea ice extent averaged for September 2012 was 3.61 mil-lion square kilometers (1.39 million square miles). This was 3.43 million square kilometers (1.32 million square miles) below the 1979 to 2000 average extent. September 2012 ice extent was 690,000 square kilometers (266,000 square miles) less than the previous record low for the month that occurred in 2007.
**fg2 imageBetween the seasonal maximum extent that occurred on March 20, 2012 and the September 16 minimum, the Arctic Ocean lost a total of 11.83 million square kilometers (4.57 million square miles) of ice; this is by far the largest seasonal loss of sea ice in the satellite record. The second largest seasonal loss was 10.65 million square kilometers (4.11 million square miles), in 2008. Due in part to transfers of heat from extensive open water areas to
the atmosphere, air temperatures at the 925 hPa level averaged for September 2012 were from 2 to 5 degrees Celsius (4 to 9 degrees Fahrenheit) above average over much of the Arctic Ocean; much larger departures from average were the rule at levels closer to the surface.
**fig3 image
September 2012 compared to previous years
Arctic sea ice extent averaged for September 2012 was the lowest in the satellite record, and was 16% lower than the previous low for the month, which occurred in 2007. Through 2012, the linear rate of decline for September Arctic ice extent over the satellite record is now 13.0% per decade, relative to the 1979 to 2000 aver-age. The six lowest September ice extents over the satellite record have all occurred in the last six years. Compared to the 1979 to 2000 average ice conditions, the September 2012 ice cover represents a 49% reduction in the area of the Arctic Ocean covered by sea ice. It is 2.91 million square kilometers (1.12 million square miles), or 45%, below the 30-year average over 1981 to 2010.
**fig4 image
Summer weather conditions 2012 compared to 2007While weather was a factor in the 2007 record low extent, the 2012 record extent occurred during near average weather condi-tions.
Weather conditions prevailing over the summer of 2012 were quite different from those in 2007. The summer of 2007 featured unusu-ally high sea level pressure centered north of the Beaufort Sea and Greenland, and unusually low pressure along northern Eurasia, bringing in warm southerly winds along the shores of the East Si-berian and Chukchi seas (3 to 5 degrees Celsius, or 5 to 9 degrees Fahrenheit above normal), favoring strong ice melt in these sectors and pushing the ice away from the coast, leaving open water. The pressure pattern also favored the transport of ice out of the Arctic Ocean and into the North Atlantic through Fram Strait.In contrast, the summer of 2012 saw unusually low pressure along the Eurasian coastal seas and extending eastward into the Beaufort sea, most prominently over the East Siberian Sea, with unusually high pressure centered over Greenland and the northern North Atlantic. Air temperatures for summer 2012 were above average
over most of the Arctic Ocean (1 to 3 degrees Celsius, or 2 to 5 degrees Fahrenheit), most prominently over the Beaufort Sea, where, because of the pressure pattern, winds were anomalously from the south. Melt began two to three weeks earlier than average in the Barents and Kara seas, leading to earlier retreat of sea ice in the region; however, air temperatures remained below average dur-ing summer in this region. This points to the impact the continued loss of old, thick ice is having on the ability of the sea ice cover to survive summer melt. Other than the August storm, the pres-sure pattern in 2012 does not appear to have been as favorable in promoting ice loss as was the case in 2007, and yet a new record low occurred.
***fig 5
Entering the melt season, a thinner ice cover made the Arctic sea ice cover more vulnerable to weather, such as the storm that tracked through the Arctic in early August. Because the ice was thin and already decaying by the time of the storm, it was quickly broken up and melted by winds and waves.The end-of-summer sea ice cover was not only the least extensive in the satellite record, but also very likely the lowest volume, based on combined model-observation estimates from the University of Washington, and inferred from ice age. The extent of ice of nearly all age categories declined from last year and remained at record low levels. The only category that increased was 4-year-old ice. This is ice that has aged since the previous record low minimum extent in 2007, when substantial amounts of first-year ice were lost. This 4-year-old ice will now age into the 5+ year category as the ice-growth season begins. However, even with this replenish-ment this winter will see only approximately 20% of the old (5+ year) ice compared to the 1980s. Because of the record summer ice loss, this winter will see the Arctic Ocean region even more dominated by the thinner first-year ice. As shown in Figure 5, the amount of ice in nearly all age categories has decreased since 2007, particularly the oldest ice.Figure 5. These images from September 2007 (top, left) and Sep-tember 2012 (top, right) show the decline of multiyear ice since the previous record minimum extent was set in 2007. The chart at bottom shows the changes in multiyear ice from 1983 to 2012. Ice of all ages has declined; 5+ year old ice has declined quite sharply. Much of the Arctic ice cover now consists of first-year ice (shown in purple), which tends to melt rapidly in summer’s warmth.

Arctic sea ice extent averaged for September 2012 was the lowest in the satellite record, according to the monthly summary from the National Snow and Ice Data Center; the long-term trend in the September (summer) minimum ice extent is now -13% per decade. All six of the smallest September average ice extents in the satellite record have occurred in the last six years, part of the evidence of the decades-long trend in Arctic warming.But surface area isn’t the only quality of the ice that is changing. Wind and ocean circulation patterns are conspiring with a warmer climate to reduce the amount of year-round (multi-year) ice, trans-forming the remaining ice into a younger, thinner version of its old self.
One difference between the patterns of surface extent and volume, however, is that measurements of sea ice extent show that, until 2012, no minimum extents matched the record low from the sum-mer of 2007. But the Polar Science Center’s calculations of volume show that the summer of 2012 was not the only summer when volume fell below the 2007 value: sea ice volumes in the summers of 2010 and 2011 were also lower than 2007.This difference is consistent with the loss of old, thick ice. While the presence of first or second year ice will boost ice extent (or area) in some years, it will add little to the volume because it is so young and thin.
Polar Science CenterPSC researchers are working towards a better understanding of the processes that control the properties and circulation of the Polar Oceans. How is the ocean changing in response to sea ice loss and other environmental changes? How do these changes affect ecosys-tems, ice, and the atmosphere, both locally and on a global scale? To answer these questions, we conduct field experiments, install and maintain in-situ instruments, measure polar ocean properties from space and develop computer models. Learning about the Polar Ocean is key to the improvement of our understanding of the global climate system.
WWF Marine Problems: Climate Change
Acidic oceansAfter absorbing a large proportion of the carbon dioxide released by human activities, the oceans are becoming acidic. If it weren’t for the oceans, the level of carbon dioxide in the atmosphere would be much higher.
The effect could be that fish, squid, and other gilled marine animals may find it harder to “breathe”, as the dissolved oxygen essential for their life becomes difficult to extract as water becomes more acidic. And shellfish, crabs, lobsters, and corals may find it more difficult to build their calcium carbonate shells. In some areas, calcium carbonate shells may even start to dissolve.
Global sea levels may rise by as much as 69cm during the next 100 years due to melting of glaciers and polar ice, and thermal expan-
sion of warmer water.
Rising water levels will have serious impacts on marine eco-systems. The amount of light reaching offshore plants and algae dependent on photosynthesis could be reduced, while coastal habitats are already being flooded.
Rapid sea level rise will likely be the greatest climate change chal-lenge to mangrove ecosystems, which require stable sea levels for long-term survival.
Altered lifestyles Rising temperatures can directly affect the metabolism, life cycle, and behaviour of marine species.
For many species, temperature serves as a cue for reproduction. Clearly, changes in sea temperature could affect their successful breeding.
The number of male and female offspring is determined by tem-perature for marine turtles, as well as some fish and copepods (tiny shrimp-like animals on which many other marine animals feed). Changing climate could therefore skew sex ratios and threaten population survival.
The Intergovernmental Panel on Climate Change predicts a further rise of between 1.4°C and 5.8°C by the end of the century. Climate change could therefore well be the knock-out punch for many species which are already under stress from overfishing and habitat loss.
Several Pacific island states are threatened with total disappearance and 2 uninhabited islands in the Kiribati chain have already disap-peared due to sea level rise.
The people of Funafti in Tuvalu and on Kiribati island are lobby-ing to find new homes: salt water intrusion has made groundwater undrinkable and these islands are suffering increasing impacts from hurricanes and heavy seas. In the village of Saoluafata in Samoa, villagers have noticed that their coastline has retreated by as much as 50 metres in the last decade. Many of these people have had to move further inland as a result.
Coastal areas around the world will also be threatened by rising sea levels. This will not only affect agricultural areas around the coast but also cities – 13 of the 15 largest cities in the world are on coastal plains. The IPCC confirms that sea level rise is already affecting coastal ecosystems, including coral reefs, mangroves and salt-marshes.
Anisimov, O. and Fritzharris, B. 2011 Polar Regions Climate Change 2001 Impacts Adaption, and Vulnerability
“Marine Problems: Climate Change.” WWF. N.p., n.d. Web. 13 Nov. 2012. <http://wwf.panda.org/about_our_earth/blue_planet/problems/climate_change/>.
“Arctic Sea Ice Volume Anomaly, Version 2.” Polar Science Center. University of Washington, n.d. Web. 13 Nov. 2012. <http://psc.apl.washington.edu/wordpress/research/projects/arctic-sea-ice-volume-anomaly/>.
Tschudi, M., and J. Maslanik. “Arctic Sea Ice Getting Thinner, Younger.” ClimateWatch Magazine. University of Colorado, n.d. Web. 13 Nov. 2012. <http://www.climatewatch.noaa.gov/ar-ticle/2012/arctic-sea-ice-getting-thinner-younger>.http://neven1.typepad.com/blog/nsidc/
“Poles Apart: A Record-breaking Summer and Winter.” Arctic News and Analysis RSS. National Snow and Ice Data Center, n.d. Web. 13 Nov. 2012. <http://nsidc.org/arcticseaicenews/2012/10/poles-apart-a-record-breaking-summer-and-winter/>.
Lynas, Mark. High Tide: The Truth about Our Climate Crisis. New York: Picador, 2004. Print.
“Salinity.” NASA Science: Earth. NASA, n.d. Web. 13 Nov. 2012. <http://science.nasa.gov/earth-science/oceanography/physical-ocean/salinity/>.
“Scientists Are Concerned about Mysterious Rise in Ocean Salini-ty.” Global Warming Is Real. N.p., n.d. Web. 13 Nov. 2012. <http://globalwarmingisreal.com/2012/09/12/scientists-are-concerned-about-mysterious-ocean-salinity/>.
Sources:

Sketches
Sketches

Sketches

Process
Process