Embed Size (px)
Citation preview

NOAA TECHNICAL MEMORANDUM NWSWR-239
CLIMATE OF PORTLAND, OR
Clinton C. D. Rocky <j National Weather Service Forecast Office
Portland, Oregon
May 1996
u.s. DEPARTMENT OF I COMMERCE
National Oceanic and
Atmospheric Administration I National Weather
Service

NOAA TECHNICAL MEMORANDA National Weather Service, Western Region Subseries
The National Weather Service (NWS) Western Region (WR) Subseries provides an informal medium for the documantation and quick dlaaemlnatlon of results not appropriate, or not yet ready, for formal publication. The aeries is uaed to report on work in progress, to dascriba technical procedures and practices, or to relate progress tc a linilad audience. These Teclvllcel Memaanda will report on investigations davoted primarily to regional and local problems of Interest mainly to personnel, and henca will not be widely distributed.
Papers 1 to 25 lll'll In the formar series, ESSA Technicel Marnoranda, Westarn Region Technicel Marnoranda (WRTM); papers 24 to 59 are in the former series, ESSA Technicel Marnoranda, Weather Bureau Technicel Marnoranda (WBTM). Beginning with 60, the papers ara part of the series, NOAA Technicel Memoranda NWS. Out-of-prinl memoranda are not listed.
Papers 2to 22, exoapt for 5 (ravlsed edHion), ara available from the National Weather Service Westem Region, ScientifocSarvices Division, 125 South State Street· Rm 1210, SaH Lake CHy, Utah 84138-1102. Paper 5 (revised edHion), and all others beginning with 25 are available from the National Technical Information Sarvice, U.S. Department of Commerce, Sills Building, 5286 Port Royal Reed, Springfield, Vrglnls22161. Prices VII}' for all paper copies; miaofiche are $3.50. Order by accession numbar lhown In paranlheses at end of each entry.
ESSA Technical Memor.nda (WRTM)
2 Climatological PrecipHation Probabilities. Compiled by Lucianne Miller, Decembar 1985. 3 Western Region Pre- and Poat-FP-3 Program, December 1, 1965, to February 20, 1966. Edward D.
Diemer, March 1966. 5 Station Descriptions of Local Effects on Synoptic Weather Patterns. Philip 11\/illiams, Jr., April1966
(Revised Novarnbar 1967, Odobar 1969). (PB-17600) 8 Interpreting the RAREP. Harbert P. Benner, May 1966 (Revised January 1967). 11 Some Eledricel Procasses In the Atmosphere. J. Lathem, June 1966. 17 A Digitalized SummaryofRadarEchoeswllhin 100 Miles of Sacramento, Cal~ornia. J. A Youngberg
and L. B. Overaas, Decembar 1966. 21 An Olljac:live Aid for Forecasli1g the End of East 11\/inds In the Columbia Gorge, ~ly through Odobar.
D. John Coperanis, April1967. 22 Derivation of Radar Horizons in Mountainous Tarrain. Roger G. Pappas, April1967.
ESSA TechniQJ Momo...,da, WN!her BurNu Technical Memoranda (WBTll)
25 Verification of Operation Prol>abilily of Pracipitalion FOI'IICUts, Apri11966-Miwl:h 1967. W. W. Dickey, Odobar 1967. (PB-176240)
26 A Study of Winds in the Lake Mead Recreation Ansa. R. P. Augulls, January 1968. (PB-177830) 28 Weather Exlremas. R J. Sc:IYniclli, April1968 (Revised March 1986). (PB86 177672/AS). (Revised
Odobar 1991· PB92·115062/AS) 29 Small-Scale Analysis end Prediction. Philip Williams, Jr., May 1968. (PB178425) 30 Numerical Weather Prediction and Synoptic Meteorology. CPT Thomas D. Murphy, USAF, May
1968. (AD 673365) 31 Pracipitalion Del8clion Prol>abilities by SaU Lake ARTC Redars. Robart K Balesky, July 1968. (PB
179084) 32 ProbabiiHy F~-A Problem Analyail with Releranca to the Portland Fire Weather District.
Harold S. Ayar, July 1968. (PB 179289) 36 Temperalln Trends in Sac:ramanto-Anolher Heat Island. Anthony D. Lentini, February 1969. (PB
183055) 37 Disposal of Logging Residues Without Damage to Air QuaiHy. Owen P. Cramer, March 1969. (PB
183057) 39 Upper-Air Lows Ovar Northwestern UnHed States. AL. Jacobson, April1969. PB 184296) 40 The Man-Mac:line Mix in Applied Weather Forecasting in the 1970s. LW. Snellman, Auguat1969.
(PB 185068) 43 Forecasting Maximum Tarnperatures at Helena, Montana. David E. Olsen, Odobar 1969. (PB
185762) 44 Estimated Return Periods for Short-Duration Precipitation In Arizona. Paul C. Kangleser, Odobar
1969. (PB 187763) 46 App1lcelions of the Net Radiometer to Short~ Fog and Stratus Forecasting at Eugene, Oregon.
L. Yee and E. Bates, December 1969. (PB 190476) 47 Statis1ical Analysis as a Flood Routing Tool. Robart J.C. Bumuh, Decambar 1969. (PB 186744) 46 Tsunami. Richard P. Augulis, February 1970. (PB 190157) 49 Pradlding PrecipHation Type. Robart J.C. Burnash end Floyd E. Hug, March 1970. (PB 190962) 50 Statlsticel Report on Aaroallergens (Pollens and Molds) Fort Huachuca, Arizona, 1969. Wayne S.
Johnson, April1970. (PB 191743) 51 Westem Region Sea State and Surf Forecaster's Manual. Gordon C. Shields and Garald B.
Burdwell, July 1970. (PB 193102) 52 Sacramento Weather Redar Climatology. RG. Pappas and C. M. Valiquette, July 1970. (PB
193347) 54 A Refinement of the Vollicity Field ID Delineate Ansas of Significant PradpHation. Barry B. AronovHch,
August 1970. 55 Application of the SSARR Model to a Basin without Discharge Record. Vall Schermerhorn and Donal
W. Kuehl, August 1970. (PB 194394) 56 Areal Covarage of Precipllstion In Northwastem Utah. Philip 11\/illiams, Jr., and Werner J. Heck,
Septarnber 1970. (PB 194369) 57 Preliminary Report on Agria.oltlnl Field Buming va. Atmospheric VislbiiHy In the 11\/illamette Valley of
Oregon. EaM M. Bates end David 0. Chilcote, Saptembar 1970. (PB 194710) 5B IVr Pollution by Jet Ai'cnft at SaaiiJe..Tacoma Airport. Wallaca R. Donaldson, Odobar 1970. (COM
71 00017) 59 Application of PE Model Foracaat Parametara to LocaJ.Araa Forecasting. Leonard W. Snellmen,
Odobar 1970. (COM 71 00016) 60 An Aid for Foracastlng the Mininum Temperalln at Medford, Oregon, Allhur W. Fritz, Odobar 1970.
(COM 71 00120) 63 7DO-mb Warm Air Advedion as a Forecasting Tool for Montana end Northem Idaho. Norris E.
Wbarnar, February 1971. (COM 71 00349) 64 Wind and Weather Regimas at Great Falls, Montana. Werran B. Prioa, March 1971. S5 Climate of Sacramento, CaiHornia. Tony Martini, April1990. (Fmh Revision) (PBB9 207781/AS) 66 A Preliminary Report on Comstation of ARTCC Radar Echoes and PrecipHation. Wilbur K Hall, June
1971. (COM 71 00829) 69 National Weather Service Support to Soaring Aclivilies. Ellis Burton, August 1971. (COM 71 00956) 71 Westem Region Synoptic Analysis-Problems and Metinods. Philip 11\/illiams, Jr., February 1972.
(COM 7210433)
74 1"l'ulderstorms and Heil Days ProbabiiHies in Nevada. Clarence M. Sakamoto April1972. (COM 7210554) '
75 A Study of the Low Level Jet Stream of the San Joaquin Valley. Ronald A Willis and Philip 11\/illiams, Jr., May 1972. (COM 7210707)
76 Monthly Cllmatologicel Charts of the Behavior of Fog and Low Stretus at Los Angeles lntemational Airport. Donald M. Gales, July 1972. (COM 7211140)
77 A Study of Radar Echo Distribution in Arizona During July and Augusl John E. Hales, Jr. July 1972. (COM7211136) '
78 Forecasting PrecipHation at Bakersfoeld, Cal~ornia, Using Prassura Gradient Vedors. Earl T. Riddiough, July 1972. (COM 7211146)
79 Climate of Stockton, Cal~mia. Robart C. Nelson, July 1972. (COM 7210920) 60 Estimation of Number of Days Above or Balow Seledad Temperatura&. Clararoce M. Sakamoto,
Odobar 1972. (COM 7210021) 81 An Aid for Forecasting Summer .Maximum Temperatures at Seattle, Washington. Edgar G.
Johnson, November 1972. (COM 73 1 0150) B2 Flash Flood Forecasting and Weming Program in the Weatarn Region. Philip 11\/illiams, Jr., Chester
L. Glenn, and Roland L. Raatz, Decembar 1972, (Revised March 1978). (COM 7310251) 83 A camperlaon of Manual and Sarnlautomalic Methods of DigHizingAnalog 11\/ind Records. Glenn
E. Rasch, March 1973. (COM 7310869) B6 Conditional ProbabiiHies for Sequences of Wet Days at Phoenix, Arizona. Paul C. Kangieser, June
1973. (COM 73 11284) 87 A Refinement of the Use of K-Valuas in Forecasting Thunderstorms In Washington and Oregon.
Robart Y.G. Lee, June 1973. (COM 7311276) 89 Objedive Forecast Pt8cipita1ion Over the Western Region of the UnHed States. Julia N. Peegle and
Larry P. KleruHf, September 1973. (COM 73 11946/3AS) 91 Arizona "Edcly''Tomedoes. Robart S.lngram, Odober 1973. (COM 7310465) 92 Smo!<e Management In the Willamette Valley. EaM M. Bates, May 1974. (COM 7411277/AS) 93 An Operational Evaluation of SQO.mb Type Regression Equation&. Alexander E. MacDonald, June
1974. (COM 7411407/AS) 94 Conditional ProbabiiHy of VosibiiHy Less than One-HaH Mile in Radiation Fog at Fresno, Cal~ornia.
John D. Thomas, August1974. (COM 7411555/AS) 95 Climate of Flagllaff, Arizona. Paul W. Sorenson, and updated by Reginald W. Presion, January
1987. (PB87 143160/AS) 96 Map type PrecipHation Probabilfties for the Westem Region. Glenn E. Rasch and Alexander E.
MacDonald, February 1975. (COM 7510428/AS) 97 Eastarn Pacific Cut-Off Low of April21-28, 1974. 11\/illiam J. Alder end George R. Miller January
1976. (PB 250 711/AS) . ' 9B Study on a S~nt PrecipHation Episode in Westarn UnHed States. Ira S. Brenner, Apri11976.
(COM 7510719/AS) 99 A Study of Flash Flood SuaoaptibiiHy-A Basin in Southem Arizona. Gerald Williams, August 1975.
(COM 7511360/AS) 102 A Sat of Rules for Forecasting Tarnperaturas in Napa and Sonoma Counties. Wesley L Tuft,
Odobar 1975. (PB 246 902/AS) 103 Application of the National Weather Sarvice Flash-Flood Program in the Western Region. Gerald
Williams, January 1976. (PB 253 053/AS) 104 Objective Aids for Forecasting Minimum Tempera!•....,• at Reno, Neveda, During the Summer
Months. Christopher D. Hill, January 1976. (PB 252 866/AS) 105 Forecasting the Mono 11\/ind. Charles P. Ruacha, Jr., Febnuary 1976. (PB 254650) 106 Use of MOS Forecast Parametara in Temperatura Forecasting. John C. Plankinton, Jr., March
1976. (PB 254 649) 107 Map Types as Aids In Uaing MOS PePsin Western United States. Ira S. Branner, August 1976.
(PB259594) 106 Other Kinds ofll\lind Shear. Chrialopher D. Hill, August 1976. (PB 260 437/AS) 109 Forecasting North 11\/inds in the Upper Sacramento Valley and Adjoining Forests. Christopher E.
Fontana, Saptarnber 1976. (PB 273 677/AS) 110 Cool Inflow as a Weakening Influence on Eaatem Pacific Tropicel Cyclones. William J. Denney,
Novarnbar 1976. (PB 264 655/AS) 112 The MANIMOS Program. A1exanclar E. MacDonald, February 1977. (PB 265 941/AS) 113 11\/inter ~ Minimum Tarnperatura Formula for Bakersfoeld, CaiHomla, Using MuUiple
Regreuoon. Michael J. Oard, February 1977. (PB 273 694/AS) 114 Tropical Cyclone Kathleen. James R. Fors, February 1977. (PB 273 676/AS) 116 A Study ofll\lind Gusts on Lake Mead. Bradley Colman, April1977. (PB 268 847) 117 The Relative Frequency of Cumulonimbus Clouds at the Naveda Tast SHe as a Fundion of K-Value.
R.F. Quiring, Apri11977. (PB 272 831) 118 Moisll.n Dlslribullon Modifocalion by Upward Vertical Motion. Ira S. Brenner, April1977. (PB 266
740) 119 Relative Frequency t;Jf Oaurenca of Warm Season Echo AdivHy as e Fundion of StabiiHy lndicas
Computed from the Yucca Fla~ Naveda, Rawinaonde. Darryl Randerson, June 1977. (PB 271 290/AS)
121 Clinatological Prediction of Cumulonimbus Clouds In the Yoclnily of the Yucca Flat Weather Station. R.F. Quiring, June 1977. (PB 271 704/AS)
122 A Method for Transforming Temperallnl DistribWon to NormaiHy. Morris S. Webb, Jr., June 1977. (PB 271 742/AS)
124 Statistical Guidance for Predldion of Eastarn North Pacific Tropical Cydone Mclllon ·Part I. Cherles J. Neumam and Preston W. Leftwich, August 1977. (PB 272 661)
125 Statistical Guidance on the Prediction of Eaatem North Pacific Tropical Cyclone Motion. Part 11. Preston W. Leftwich and Charles J. Neumann, August 1977. (PB 273 155/AS)
126 Climate of San Franc:isc:o. E. Jan Null, February 1978. Revised by George T. Perich!, April1986. (PB86 208624/AS)
127 Development of a ProbabiiHy Equation for Wmter-Type PrecipHation Patterns in Great Falls, Montana. Kenneth B. Mielke, February 1978. (PB 281 387/AS)
128 Hand Cak:ulalor Progam ID Cornputa Parcel Thermal Dynamics. Den Gulgel, April1978. (PB 283 080/AS)
129 Fire whirls. David W. Goens, May 1978. (PB 283 866/AS) 130 Flash-Flood Procadura. Ralph C. Hatch and Garald 11\/illiams, May 1978. (PB 286 014/AS) 131 Automated Fire-Weather Foracasts. Mark A Molinar and David E. Olsen, September 1978. (PB
289916/AS) 132 Estimates of the Effects of Terrain Blocking on the Los Angeles WSR-74C Weather Redar. R.G.
Pappas, R.Y. Lee, B.W. Finke, Odobar 1978. (PB 289767/AS) 133 Spedral Techniques In Ocean Wave Forecasting. John A Jamuzzl, October 1978.
(PB291317/AS) 134 Solar Rediation. John A Jamuzzl, November 1978. (PB2911951AS) 135 Application of a Spectsum Analyzer in Forecaatlng Ocaan Swell In Southam CaiHomla Coastal
Watara. Lawrance P. KieruHf, January 1979. (PB29271BIAS) 136 Basic Hydrologic Principles. Thomas L. Dielrlch, January 1979. (PB292247/AS) 137 LFM 24-Hour Prediction of Eastem Pacific Cyclones Refined by Satellite Images. John R.
Zimmerman and Cherles P. Ruscha, Jr., January 1979. (PB294324/AS) 138 A Simple Analysis/Diagnosis System for Real Time Evaluation of Vertical Mellon. Scott Haflick and
James R. Fors, February 1979. (PB294216/AS) 139 Aids for Forecasting Minimum Temperatura In the Wenatchee Frost District. Robart s. Robinson,
April1979. (PB29B339/AS) 140 Influence of Clcudiness on Summertime Temperatures in the Eastem Waahlngton Fire Weather
district. James Holcomb, April1979. (PB29867 4/AS)
( \
\ _;.../

NOAA TECHNICAL MEMORANDUM ·NWSWR-239
CLIMATE OF PORTLAND, OR
Clinton C. D. Rocky National Weather Service Forecast Office Portland, Oregon
May 1996
UNITED STATES National Oceanic and
DEPARI'MENT OF COMMERCE Atmospheric Acinrinistration
Mickey Kantor, Secretary D. James Baker, Under Secretary
and Administrator
National Weather Service
Elbert W. Friday, Jr., Assistant
Acinrinistrator for Weather Services

This· publication has been reviewed
and is. approved for publication by
Scientific Services Division,
Western Region
Lt.A~~ief Scientific Services Division
Salt Lake City, Utah
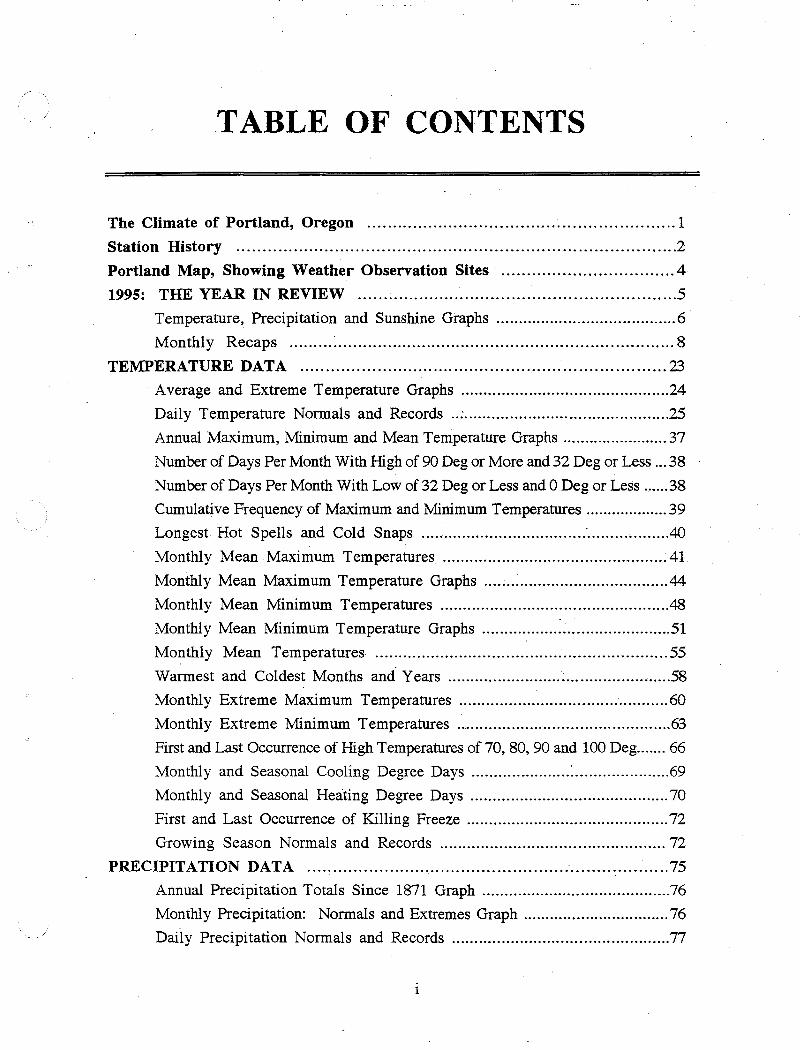
TABLE OF CONTENTS
The Climate of Portland, Oregon ............................................................ 1
Station History ..................................................................................... 2
Portland Map, Showing Weather Observation Sites .................................. 4
1995: THE YEAR IN REVIEW .............................................................. 5
Temperature, Precipitation and Sunshine Graphs ........................................ 6
Monthly Recaps ......... : .................................................................... 8
TEMPERATURE DATA ........................................................................ 23
· Average and Extreme Temperature Graphs .............................................. 24
Daily Temperature Normals and Records .. : ............................................. 25
Annual Maximum, Minimum and Mean Temperature Graphs ........................ 37
Number of Days Per Month With High of 90 Deg or More and 32 Deg or Less ... 38
Number of Days Per Month With Low of 32 Deg or Less and 0 Deg or Less ...... 38
Cumulative Frequency of Maximum and Minimum Temperatures ................... 39
Longest Hot Spells and Cold Snaps .................................... · ................. .40
Monthly Mean Maximum Temperatures ................................................. 41
Monthly Mean Maximum Temperature Graphs ....... : ................................. 44
Monthly Mean Minimum Temperatures ................................................. .48
Monthly Mean Minimum Temperature Graphs .......................................... 51
Monthly Mean Temperatures .................... ~ ......................................... 55 Warmest and Coldest Months and Years ................................................. 58
Monthly Extreme Maximum Temperatures .............................................. 60
Monthly Extreme Minimum Temperatures ............................................... 63
First and Last Occurrence of High Temperatures of 70, 80, 90 and 100 Deg ....... 66
Monthly and Seasonal Cooling Degree Days ...................... : ..................... 69
Monthly and Seasonal Heating Degree Days ............................................ 70
First and Last Occurrence of Killing Freeze ............................................. 72
Growing Season Normals and Records ................................................. 72
PRECIPITATION DATA .................................................. : ................... 75
Annual Precipitation Totals Since 1871 Graph .......................................... 76
Monthly Precipitation: Normals and Extremes Graph ................................. 76
Daily Precipitation Normals and Records ................................................ 77

PRECIPITATION DATA (continued)
Monthly Precipitation Data ................................................................ 83
Wettest and Driest Months and Years .................................................... 86
Greatest 24-Hour Preciptation and Longest Rainy and Dry Periods .................. 88
Greatest Short Duration Rainfall Records . . . .. .. . . . . .. . . . .. . . .. .. .. . . . . . .. ... .. .. . . . . . . . 89
Days with Measurable Rainfall since 1940 .............................................. 90
Daily Probability of Measurable Precipitation ........................................... 91
Daily Probability of Measurable-Precipitation Graph ................................... 92
Probability of Receiving 0.01 Inch of Rain Based on Time of Day .................. 93
Probability of Receiving 0.25 Inch of Rain Based on Time of Day .................. 94
Probability of Receiving 0.50 Inch of Rain Based on Time of Day .................. 95
Probability of Receiving 1.00 Inch of Rain Based on Time of Day .................. 96
Probability of Receiving 2.00 Inch of Rain Based on Time of Day .... · .............. 96
Monthly and Seasonal Snowfall Data .................................................... g-J
Snowfall Extremes ........................................................................ 100
SUNSHINE AND CLOUD DATA ......................................................... 101
Days Cloudy, Partly Cloudy and Clear ................................................. 102
Fog Data .................. .-................................................................. 103
Monthly and Annual Percentage of Possible Sunshine Received at Portland ...... 104
Sunniest and Cloudiest Months and Years ............................................. 107
Sunrise and Sunset Data for the Year 1996 ............................................ 108
OTHER CLIMATIC DATA .................................................................. 109
Pressure: Monthly Normal and Extreme Values ....................................... 110
Wind Normals and Extremes ............................................................. 111
Windiest Months and Years .............................................................. 111
Relative Humidity Normals Based on Time of Day ................................... 112
Rose Parade Weather ..................................................................... 113
11

THE CLIMATE OF PORTLAND OREGON
Portland is situated about 65 miles inland from the Pacific Ocean and midway between the northerly oriented low coast range on the west and the higher Cascade range on the east, each about 30 miles distant. The coast range provides limited shielding from the Pacific Ocean. The Cascades provide a steep slope for orographic lift of moisture-laden westerly winds and consequent moderate rainfall. The Cascades also act as a barrier, preventing the colder continental air masses originating in Canada from penetrating western Oregon. Airflow is usually northwesterly in Portland during the spring and summer and southeasterly in the fall and winter. The Portland airport location is drier than most surrounding locations.
Rain is a part of life during the winter months in Portland. Approximately 88 percent of the annual total rainfall occurs in the months from October through May. Nine percent falls in June and September, and only three percent comes in July and August. Precipitation is mostly raiu, as on the average there are only five days per year with measurable snow. Snowfall accumulations are rarely more than a couple of inches and generally stay on the ground only a few days.
The winter season is marked by relatively mild temperatures, cloudy skies, and rain with southeasterly surface winds predominating. Summer produces pleasantly mild temperatures, northwesterly wind, and very little precipitation. Autumn and spring are transitional in nature. Autumn and early winter are times with the most frequent fog. October is the foggiest of the months.
At all times, marine air invasions are a frequent moderating influence, bringing cool and moist air from the Pacific Ocean. Outbreaks of continental high pressure from east of the Cascade Mountains produce strong easterly winds through the Columbia Gorge into the Portland area. In winter, this brings the coldest weather with extremes of low temperature registered in the cold air mass. Freezing rain and glaze ice are
1
sometimes transitional effects. Temperatures below zero are rare, occurring only about six times over the last 125 years. In summer, hot, dry continental air brings the highest temperatures. Temperatures above 100 are infrequent. Temperatures of 90 degrees or higher are usually reached each year, but seldom persist for more than two or three days. Based on the 1961-1990 period, the average first pccurrence of temperatures 32 degrees or lower in autumn is November 8 and the last occurrence in the spring is March 30.
Destructive storms are infrequent in the Portland area Surface winds seldom exceed gale force and rarely in the period of record have winds reached higher than 75 mph. Thunderstorms occur about once a month during the spring and summer months. Heavy downpours are infrequent but gentle rains and mist occur almost daily during the winter months.
Portland is located in the Willamette Valley, a rich and diverse agricultural area. Farm products grown in the valley include grass seed, hay, grapes for wine production, mint, as well as a large variety of fruits and vegetables for fresh markets and processing. The long growing season with mild temperatures and ample moisture makes the area an ideal location for the nursery and seed industries. Portland is known as the Rose City because its mild climate creates nearly perfect growing conditions for roses and rhododendrons. Portland is home to test rose gardens and the Rose Festival and Parade each June celebrates Portland's connection with these floral products. I
1 Oimate Description drawn in part from the Annual Local Climatological Data of Portland Oregon, 1994, provided by the National Climatic Data Center.

STAJ'ION HISTORY
Official weather records were begun in Portland on November 1, 1871, when a station was established by the Signal Corps of the United States Army. Only fragmentary records were :tcept previous to that time. Weather observations were made by the Signal Corps until the end of June, 1891. On July 1, 1891, the meteorological work of the federal government was taken over by the United States Weather Bureau, a part of the Department of Agriculture. On July 1, 1940, the Weather Bureau was transferred to the Department of Commerce.
The station was first located in the Gilman Building, at what is now known as th~ comer of SW First Avenue and Alder Street. On December 21, 1872, it Was moved to the Parish Building at SW Front A venue and .. Washington Street Then on January 1, 1878, the station moved to the Oregon and Washington Trust Company's bank building at 48 (old number) SW Front A venue. On August 1, 1885, it moved to the Kamm Bui~ding at SW First A venue and Pine Stre~t. A fire in the Kamm Building forced another move on October 5, 1892, to the Oregonian Building at SW Sixth A venue and Alder Street. Finally the station moved on June 8, 1902 to the U. S. Custom House at 220 NW Eighth A venue. A map at the end of this section shows the moves in relation to downtown Portland.
At first, the thermometers were mounted in a shelter attached to a north window, but when the move was made to the Kamm Building, the shelter was placed oh the roof, and subsequent exposures of the shelter have been roof exposures.
Throughout the entire period of record, the rain gauges have been exposed on the roof. The height of the Gilman Building is not known, however subsequent elevations of the rain gauge above ground are as follows:
Parish Building 47 feet, Ore/Wash Trust Bldg 51 feet, Kamm Building 76 feet,. Oregonian Building 196 feet, Custom House 63 feet.
2
A self-recording weig~ing type rain gauge was installed on February 11, 1890. It was replaced by a bucket-type recording gauge on June 8, 1902. Exposure of wind instrume11ts, has been similar to that of the rain gauges, but only a few feet higher. The highest · exposure of the anemometer was 209 feet ' above,ground on the Oregoni~ Building. At the Custom House, it is 106 feet above. ground level. Self -registering thermometers, indicating the highest and lowest temperature · for the day, were installed in July 1874. A thermograph was installed in June 1888, .. allowing for a continuous written record of temperature data. Relative humidity records were begun in January 1872 and a sunshine recorder was installed in January 1891.
The Portland Airport weather station opened, .· onJuly 16, 1928. It was located at what was. then known as the Porthmd Airport, where .. , :, . the Swan Island Shipyard is now located. At the ai~_,rt, the anemometer, thermometers~.:: and rru~~ gauge were on the roof of the . Administration Building. On September 30, 1940, the airport station was moved again,. this time to the Portland International Airport · near the Columbia River, about 9 miles northeast of the Custom House. At this location, the thermometers and rain gauges were at ground level. The anemometer was on the roof of the United Airlines hangar unti~. February 1, 1949, when it was moved about .. 250feet west of the hangar and placed on the roof of the service building. It was 62 feet above ground level while on the United Airlines hangar and then 33 feet above . ground level on the service building.
During the summer of 1948, the infamous Vanport Flood occurred. The V anport flood, , was .the greatest flood on the Columbia RJ:ver : since 1894. As a result of heavy rainf~l ~d large snowmelt on the Upper Columbia Basin, a river dike collapsed near Vanport, <
now known as the Delta Park area. The flood waters inundated the river valley for over 40 days forcing the office to temporarily relocate to the Custom House in downtown Portland. The office returned to the Portland International Airport location on Northeast· Marine Drive during August 1948.

In July 1994, the office moved to its present location on NE 122nd A venue, about 4 miles east of the Portland International Airport However, weather observations continued at the airport office on Marine Drive. On November 1, 1995, ASOS, the Automatic Surface Observing System, became operational. The table below shows site information and changes concerning the observating equipment during the office's history.
Acknowledgements: I would like to thank the many dedicated National Weather Service observers that diligently took observations and maintained climate records over the past 125 years. Special thanks to Traci Hodgson who contributed much time and thoughtfulness to the design and layout of this project, and to Paul Tolleson and Bill Schneider for their useful reviews.
STATION LOCATION PORTLAND OREGON '
L L ELEVATION N!O/E A -~ A 0 u I N L~L GRO.H) T ~~~ G 0 T f "G- w E p s T R l 8 H ME S = ASOS u [ X s u I A y A Q W =AWlS ~ ~ ~ N T y N n l ~ IV D R c s N
E u E H H ~ x H c 0 c p
N I M R I I H T "' 0 N E 0 ~ N ~ g ij LOCATION OCOPIED OCOPIED · AIRLINE NCIHH loEST s "'
G G G R REMARKS FRCM TO DISTANCES T T T E SE A R S T
Nl) E S R H T s u R I "' ~ * DIR~~ONS ~ f u i ~ w c ~ N 0
"' I I( M v PREV!aJS E E E "' T T N G .f I LOCATION R N 0 c A N
~ ~ ~ H x ~ ~ G
u T· G R E E ... E ~
Q.!l - • NOTE: For per odNowm lei" 1, 18 r'! thra,q, aruary , 1870, refef" to. ll"~i IUS 1dit a-s :
Or'fffl·Was~t~ta'l Trust 1!1178 8/1/85 1200 ft. 45"31 I 122"40 1 28 ~ 45 51 g.- ~ter. ";?:,. Bu1 dirG, st Street NW · - W1 Verve.
,ll'<ll'T'
~ann aui ldiW st & P11-e S reet 8/1/85 1115192 600 ft. sw 45°31 I 122"40 1 28 92 84 84 t:rlc c76 76 ~.J~:tm~~ 1/1/91.
grfi9r ~ildire th Ad er St. 1115/92 6/8/02 2000 ft.SW 45"31 I 122"40 1 40 209 200 200 t:rlc 197 197.
220. CUstan House Dav1 s-Everett en Park
6/8/02 6/8/38 2000 ft. N 45"32 1 122"40 1 30 ,~· 68 68 95e63 63 ~: ~t!~6~~/06. 320 CUstan House 6/8138 111/50 Charee i" 45"32.1 122"40 1 30 106 68 68 95. 63 63 Davis-Everett en Park roan en y
321.~tan House 1/1/50 711173 NA 45"32' 122"40 1 30 68 68 63 63 .. SUlsh~ recorder ard wi~ Dav1 s- verett en Park reco l!"g ~1~ trm erred to a1 rport· ta 1M 1/1/ •
AIRPCRT 7/14/28 5/7/30 ~~3~. N'ol 45"34 1 .122"43 1 33 ~~~~rt
Aclninjsf~i1? Sui ldirg swan s 1 rport 5/7/30 10/13/40 NA 45"34' 122"43 1 33 46 29 29 25
UAr aui ldi~Portlard-Co Llltl1a Al rt
10/13/40 9/30/43 6 mi. ENE 45°36 1 122"361 20 62 5 5 4
Port[~ Sui ldir:g Port co Ultl1 a AP 9/30/43 5/31/48 75 ft. E 45"361 122"361 20 62 5· 5· 4
322 ~tanH~ NW Par ard Dav1 s
5/31148 8/24148 9mi. SSW 45"32 1 122"40 1 30 106 68 68 63 63 field f~QOded operated at c1 ty of 1ce site.
UAL ~~dir:g Port A 1 rport 8/24/48 2!4149 9 mi. NNE 45"36 1 122"36 1 21 62 5 . 5 4 4 Relocated at ai~ in UAL
Hargar t~rar1 y.
Aclnir~ratia'l aui ldioo 2!4149 5!17157 0.13 mi. II 45"36 1 122"36 1 21 33 6 5 f4 f4 4 h f - Installed 1/3/50. Port Intemat1cnal A1rport
Adnin~ratia~ Sui ldirg 5/17157 Present NA 45"36 1 122"36 1 21
~ g6 gS~ ~ 5 NA ~ NA ~ - No! rroved 5117/57. Portl Intemat1cnal - ~e ltlMer ~) Al rport I I - ro _ l~iJ: m1 ."se o o~fic:e
l - Re ocated ~~ ~ - MQved to r /64. - M1nor~ I .
m - Lower /1 • n - M1nor ~JUS~j~/18182. p- T~ aree I .
3

® Downtown Locations, 1871-1928 ® Swan Island Airport, 1928-1940 ® Portland International Airport, 1940-Present

1995 THE YEAR IN REVIEW
5

1995 RECAP: MINIMUM AND MAXIMUM TEMPERATURES
1995 RECAP: MINIMUM TEMPERATURES
DegF
28 1995 Average Minimums
20.0 1--+--~-+---,f---H ____ •···· Normals (1961-90 data) 1---!---+--1---+--1
--o- 1995 EXtreme Minimums
JAN FEB MAR APR MAY JUN JUL AUG SEP ocr NOV DEC
1995 RECAP: MAXIMUM TEMPERATURES
100.0 92
90.0
80.0
DegF
70.0 62
60.0
·' . ·•• 67 ,,-"---· --·······-r--······ ·····-·· ·····' ...... ·····-· ··-;--·- ·-·-
---fr- 1995 Average Maximum
50.0 -1--bll~.....-r----r-"'"i ····•···· Normals (1961-90 data)
--o- 1995 Extreme Maximum
40.0]_~--~--~--=+===+==~==~==~==~~--~--~--4-_l JAN FEB MAR APR. MAY JUN JUL AUG SEP ocr NOV DEC
6

1995 RECAP: PRECIPITATION AND SUNSHINE DATA
1995 RECAP: PRECIPITATION
12.0
11.0 m 1995 10.0 EJ NORMAL
9.0
8.0
Inches 7.0
6.0 Normal
5.0
4.0
3.0
2.0
1.0
0.0 JAN FEB MAR APR MAY JUN JUL AUG SEP ocr NOV DEC
1995 RECAP: AVAILABLE SUNSHINE RECEIVED
80
70 1995
Normal (1961-90)
60
Percent 50
40
30
20
10
0 JAN FEB MAR APR MAY JUN JUL AUG SEP ocr NOV DEC
"'Sunshine recording equipment disconnected on November 1, 1995.
7

JANUARY 1995 RECAP
TEMPERATURE 65 c---.--.----.---;-----,----, 60
55
~ so
6 II 16 21 26
DayofMonth
___.. Max Temp
mmum1mumm NOR11 Max Min Temp NORM Min
31
The beginning of January was dry with a large blocking ridge of high pressure over Idaho and eastern Oregon. This diverted storms to the north into Canada and to the south into California. By mid-month, however, the ridge moved east into the northern Rockies. Onshore flow and storms returned to western Oregon. Between the 6th and the 18th, nearly 3 inches of rain fell. Then a weak ridge attempted to build northward into the area, but a strong upper
JANUARY 1995 STATISTICS
Temperature ... Extremes... Maximum: 62 on the3 Oth
Minimum: 29 on the 5th Averages... Maximum: 48.2 deg
2.8 deg above normal Minimum: 38.5 deg 4. 8 deg above normal Mean: 43.3 deg 3. 7 deg above normal
Precipitation ... Monthly Total: 5.56 inches
0.21 inch above normal Greatest 24-hour Rainfall:
0.93 inch on the 30th-31st Snowfall Total: Trace (on 6-7th)
8
PRECIPITATION.
0.9
0.8
0.7
0.6 = t.J 0.5
= 0.4
0.3
0.2
0.1
o. I
I 5 9 13 . 17 21 25 29
DAY OF MONTH
level low remained over the northeastern Pacific. This low moved back into Oregon toward the end of the month bringing rain and record warmth due !O southerly winds.
January was not a foggy month, but was quite cloudy with 23 cloudy days and only 4 clear days. Despite the clouds, Portland was able to get 36% of the possible sunshine compared to a normal of 28%.
Wind ... Averages... Wind Speed: 15.1 mph
Direction: East Fastest 2-Minute: East at 35 mph Peak wind: East at 45 mph
NEW RECORDS SET .•. Record High... 62 deg on the 30th
breaks record of61 set in 1984 Record High... 61 deg on the 31st
breaks record of 58 set in 1992.

FEBRUARY 1995 RECAP
TEMPERATURE
II 16 21
DayofMonth
- MaxTemp m•••••••mm•••m• NORM Max
Min Temp
NORM Min
February started with a bit of rain early but a ridge began building over eastern Oregon and Idaho on the 3rd. This brought dry air and balmy conditions over western Oregon for the first week. Around the 7th the ridge moved east into the northern Rockies but an area of high pressure developed over the northeastern Pacific. This forced the jetstream into Alaska then southward over western Oregon and Washington. On the 11th a disturbance in the jetstream intensified over western British Columbia and moved southward paralleling the coast. Cold air from eastern Oregon spilled through the Columbia Gorge chilling Portland from the 12th through the 14th. The storm brought snow to the Portland area with many
FEBRUARY 1995 STATISTICS
Temperature ... Extremes... Maximum: 67 on the 23rd
Minimum: 16 on the 14th Averages... Maximum: 54.9 deg
3. 9 deg above normal Minimum: 38.0 deg 1.9 deg above normal Mean: 46.5 deg 2.9 deg above normal
9
PRECIPITATION
0.9
0.8
0.7
0.6 = (.) 0.5 25
0.4
0.3
0.2
0.1
I 0 I I I I I I
I 9 13 17 21 25
DAY OF MONTH
locations on east side of the metropolitan area measuring up to 14 inches of snow. On the 12th cold air and snow continued moving south into the Willamette Valley. After the 15th a strong westerly flow returned moderating temperatures again. Another storm moved through Portland from the_ 17th to the 19th. The rest of the month brg_ught dry and mild conditions to western Oreg9n as high pressure centered over northern California.
Despite the rainy mid-month weather, Portland received 50% of its available sunshine which is more than the normal38%. There were 18 cloudy days and only 5 clear days.
Precipitation ... Monthly Total: 3.19 inches
0. 66 inch below normal Greatest 24-hour Rainfall:
1.10 inches on the 16th-17th Snowfall Total: 3. 6 inches Greatest 24-hour Snowfall:
3.6 inches on the 12th Greatest Snow Depth:
4.0 inches on the 13th
FEBRUARY1995. RECAP (cont.) ·.,
Wind ... NEW RECORDS SET ... Averages... Wind Speed: 9.0 mph Record High... 58 deg on the 5th
Direction: East ties record of 58 set in 1961 Fastest 2-Minute: East at 37 mph Record High... 58 deg on the 6th Peak wind: East at 48 mph ties record of 58 set in 1993
Record High... 64 deg on the 8th breaks record of 60 set in 1970
Record Low... 16 deg on the 14th breaks record of 20 set in 1990
Record High... 67 deg on the 23rd breaks record of 63 set in 1983,
'.:'
10

MARCH 1995 RECAP
TEMPERATURE
II 16 21 26
DayofMonth
- MaxTemp NORM Max
Min Temp
NORM Min
31
March came in like a lion with rain and wind to western Oregon. Thunderstorms brought small hail to Portland area on the 4th. A broad area of low pressure was over the eastern Pacific, bringing an onshore flow and occasional rain to Portland. Mid-March was definitely rainy as storm after storm moved in from the Pacific. On the 22nd and the 23rd showers and thunderstorms brought more small hail. Unlike February, heavy snow fell in the Cascades while valley locations
MARCH 1995 STATISTICS
Tern perature ... Extremes... Maximum: 72 on the 30th
Minimum: 28 on the 7th Averages... Maximum: 57.5 deg
1. 5 deg above normal Minimum: 3 9. 0 deg 0.4 deg above normal Mean... 48.3 deg 1.0 deg above normal
Precipitation ... Monthly Total: 3. 82 inches
0.26 inch above normal Greatest 24-hour Rainfall:
0.78 inch on the 4-5th Snowfall Total: 0.40 inch
(mostly as hail on the 20th)
11
PRECIPITATION
0.6 f---111-f--...--+---+---+---1--+---1
0.5 i-----fl-i---lll--+---+---+---1--+-1
:I: . 0.4 1------B-lu 25 0.3 i---11-!-
0.2
0.1
I I I I ~l"-h·-;-r-r+'~
9 13 17 21 25 29
DAY OF MONTH
received beneficial rainfall. Weak high pressure developed during the third week, but another strong upper level low began developing over the eastern Pacific. By the end of the month, clouds and rain moved back into the area.
Portland received 49% of its available sunshine which is close to the normal 47%. There were 19 cloudy days and only 7 clear days.
Wind ... Averages... Wind Speed: 10.1 mph
Direction: Southeast Fastest 2-Minute: South at 35 mph Peak Wind: South at 59 mph
NEW RECORDS SET ... Record High... 67 deg on the 9th
breaks record of 66 set in 1992 Record Low... 31 deg on the 26th
ties record of31 set in 1957 Record Daily Rainfall... 0.61 inch
on the 4th breaks record set in 1992.

APRIL 1995 RECAP
r.t.o : 55 Q so
6
TEMPERATURE
11 16 21 26
DayofMonth
........,. MaxTemp
1nummuunm1 NORM Max Min Temp
NORM Min
April began uneventfully with weak fronts moving over the region. During t.he first few . days of April, a high pressure ridge · developed over the eastern Pacific. A cut-off low formed over the Great Basin area keeping a northerly flow. over Oregon. By the 4th, the ridge moved inland which allowed thejet stream to take aim at Oregon. Front after front moved across the area for the next several weeks. bringing a persistent onshore flow, clouds, and rain. By the 21st, a ridge of high pressure over California and just offshore of Oregon brought a temporary end to the rain. Temperatures rose well
APRIL 1995 STATISTICS
Temperature ... Extremes... Maximum: 79 on the 23rd
Minimum: 3 5 on the 22nd Averages... Maximum: 60.6 deg
0. 0 deg above normal Minimums: 41.9 deg 0. 6 deg above normal Mean: 51.3 deg 0.3 deg above normal
Precipitation ... Monthly Total: 3.49 inches
1.10 inch above normal
12
PRECIPITATION o.li .---------,--,.---,----,-----,----r-,
0.7 F------l--+---1!1-+-~-+---+----+---1
0.6 F------l--+--lll-+---+---+----+---1
9 13 17 21 25 29
DAY OF MONTH
above normal with sunshine and dry northerly flow across the region. However, the pleasant skies ended on the 27th as an area of low pressure moved to just off.the central Oregon coast. This kept temperatu~es mild, but rain and clouds returned with·the onshore flow. Temperatures averaged nearly normal over ~he. month while precipitation was above normal.
There were 21 cloudy days and only 4 clear days resulting in only 41% of available sunshine, quite a bit below the normal 52%.
Greatest 24-hour Rainfall: 0.75 inch on the 12th
Wind ... Averages... Wind Speed: 7.5 mph
Direction: South Fastest 2-Minute: South at 28 mph Peak Wind: West at 33 mph
NEW RECORDS SET ... Record High... 7 5 deg on the 3 rd
ties record of75 set in 1951 Record Low... 79 deg on the 23rd
breaks record of 7 6 set in 1977.

MAY 1995 RECAP
TEMPERATURE
6 II 16 21 26
DayofMonth
- MaxTemp
mmuumnruu1 NOR.11 Max Min Temp
NORM Min
31
May began with several fronts moving into the region with clouds and rain. A brief break occurred between the 6th and 8th when high pressure formed over British Columbia. This pushed the jetstream into Alaska taking storms with it. Western Oregon still had clouds with the onshore flow, but no rain. The high retreated northward on the 9th, allowing low pressure to return to the Pacific Northwest. Rain and a few thunderstorms returned to Portland from the 9th through the 12th. By the 14th, the low moved into
MAY 1995 STATISTICS
Temperature ... Extremes... Maximum: 87 on the 28th
Minimum: 43 on the 13th Averages... Maximum: 71.6 deg
4.5 deg above normal Minimum: 49.8 deg 2.8 deg above normal Mean: 60.7 deg 3. 6 deg above normal
Precipitation ... Monthly Total: 1.65 inches
0.41 inch below normal
13
PRECIPITATION 0.5 r--,----...,-----,----;-----,--.,.--,
0.4lll--t---+---f----+---l--+-1
0.3 111--11-i--+---+---+----f--H
0.1
I I I
9 13 17 21 25 29
DAY OF MONTH
northern California taking the rain south of Oregon. A high pressure ridge over the eastern Pacific intensified over the s~cond half of the month bringing above normal temperatures and sunshine to w~stern
Oregon. ~;:..::.
Portland had 14 cloudy days and 8 clear" days resulting in 58% of the available sunshine which is very close to the normal of 57% sunshine.
Precipitation (continued) ... Greatest 24-hour Rainfall:
0.56 inch on the 1st-2nd
Wind ... Averages... Wind Speed: 7.4 mph
Direction: Northwest Fastest 2-Minute: North at 23 mph Peak Wind: North at 35 mph
NEW RECORDS SET ... No records set.

~NE 1995 RECAP
TEMPERATURE
6 11 16 21 26
DayofMonth
- MaxTemp MinTemp 111111111111111111111 NORM Max 111 111 111 NORM Min
June was the month of two completely different weather patterns. The high pressure 'ridge that developed over the eastern Pacific in late May moved into the Rocky Mountains by the 4th allowing an area oflow pressure to take up residence west of Vancouver Island. This low moved across the area on the 4th through the 6th bringing rain and · few thunderstorms. A series of strong lows followed the same track between the 1Oth and the 20th, each bringing more rain, clouds and onshore flow that kept temperatures cool. By the 22nd, the weather pattern changed, becoming more summer-like, just in time for
JUNE 1995 STATISTICS Temperature... _ Extremes... Maximum: 97 on the 30th
Minimum: 4 7 on the 11th Averages... Maximum: 74.1 deg
0.1 deg above normal Minimum: 53.4 deg 0. 5 deg above normal Mean: 63.8 deg 0.3 deg above normal
Precipitation ••• Monthly Total: 2.62 inches
14
PRECIPITATION
o.s 1--11!11-11---1--+---illlt-1---+---+-1
0.4 1--11!11-11---1--+---illlt-1---+---+-1
= ~ 0.3
0.2
0.1
I I I I I I I I s 13 17 21 25 29
DAY OF MONTH
the summer solstice. On the 22nd, high pressure developed over northern California arid south~rn Oregon, . diverting the storms irito Canada and bringing sun and warm temperatures to Oregon. On the 29th aild 30th, the high moved into the eastern Pacific as thermal low pressure formed over northern California. Resulting offshore flow brought record temperatures to western Oregon.
Portland had 14 cloudy days and 8 clear days resulting in 52% of available sunshine while the normal sunshine received at Portland is 56%.'
Precipitation (continued) ... 1.14 inch above normal
Greatest 24-hour Rainfall: 0.81 inch on the 18th-19th
Wind .•. Averages... Wind Speed: 8.2 mph
Direction: Northwest Fastest 2-Minute: North at 26 mph Peak Wind: West at 36 xp.ph
NEW RECORDS SET ••• Record Daily Rainfall. .. 0.54 inch on the 18th breaks old record of0.22 set in 1971.

JULY 1995 RECAP
~ .. 0
Q
TEMPERATURE
11
- MaxTemp uuun•mnmm NORM~
16
DayofMonth 21 26
Min Temp
NORM Min
31
July was dominated by offshore flow for most of the month. At the beginning of the month, an area of thermal low pressure over northern California extended northward into the Willamette Valley. The result was warm downslope winds off the Cascades along with a few late afternoon thunderstorms. By the 5th, the thermal moved east and cool marine air invaded the Willamette Valley. On the 8th, a large area of high pressure strengthened over the Great Basin forcing storms moving over the Pacific to stall just offshore from Oregon. A vigorous front moved across the area on the 9th bringing heavy rain. The rain event on the 9th brought 86% of the month's rainfall. The area of low pressure offshore became cut off from the jet stream and
JULY 1995 STATISTICS
Temperature ... Extremes... Maximum: 99 on the 17th
Minimum: 52 on the 30th Averages... Maximum: 81.6 deg
1. 7 deg above normal Minimum: 59.5 deg 3. 0 deg above normal Mean: 70.6 deg 2.4 deg above normal
Precipitation •.• Monthly Total: 1.23 inches
15
1.1
0.9
0.8
0.7
:: 0.6 Q ~ 0.5
0.4
0.3
0.2
0.1
Jill I
PRECIPITATION
'II I I I I I I I I I I I I I I I I 9 u rr n ~ 3
DAY OF MONTH
I
meandered over southwestern Oregon and the adjacent coastal area until eventually dissipating on the 20th. Each time it passed in southwestern Oregon, thunderstorms developed, but remained south of Portland. Despite the stormy weather to the south, Portland remained dry as weak fronts moved across western Oregon. By the 22nd, high pressure over the southwestern United States intensified, bringing more sun and warmth to Portland.
Despite the two major sunny periods, the first part of July was cloudy enough to keep Portland at only 59% of the available sunshine, well below the normal of . 70%. There were 15 cloudy days and 11 clear days.
Precipitation (continued) ••• 0. 60 inch above normal
Greatest 24-hour Rainfall: 1. 06 inch on the 9th
Wind •.• Averages... Wind Speed: 7.7 mph
Direction: Northwest Fastest 2-Minute: Northwest at 22 mph Peak Wind: Northwest at 30 mph
NEW RECORDS SET .•• Record Daily Rainfall... 1. 06 inches on the 9th breaks record of0.26 set in 1954.

AUGUST 1995 RECAP
90 85 80
fZo 75 to 70
Q 65
60 ss so
6
TEMPERATURE
11 !6 21 26
DayofMonth
-- MaxTemp nuuuuummm NORM Max
Min Temp NORM Min
Thermal . low pressure over northern California kept an offshore. flow over western Oregon during the first few days of August allowing temperatures to remain warm. Then on . the 5th low pressure moved into southwestern British Columbia allowing a front to move into northwestern Oregon. Clouds and cool marine air brought rain to Portland on the 6th through the 1Oth. Weak high pressure on the 11th through the 14th brought. partly cloudy skies to Portland. On the 15th, another low pressure area moved to just west of British Columbia. The result was a series of cool fronts to move into northwestern Oregon through the. 18th. These fronts brought little rain, but continued the cool onshore flow.
AUGUST 1995 STATISTICS
Temperature .•• Extremes... Maximum: 92 oil the 20th
Minimum: 48 on the 24th Averages... Maximum: 78.9 deg
1.4 deg below normal Minimum: 55.6 deg 1.3 deg below normal Mean: 67.3 deg 1.3 deg below normal
16
PRECIPITATION
0.15 f----11----il!ll--+-11111--t---+---+--l = u a; 0.1 1----+---illf---+
0 II I I I I I s 9 13 17 21 25 29
DAY OF MONTI!
By the 20th, high pressure once again · intensified, this time over Colorado, forcing storms to move farther north of Portland into · British Columbia. Temperatures warmed back above normal levels after the 22nd. Toward the end of the month, another low .. moved to just west of Astoria resulting in a·.· mild southerly flow over western Oregon with·· only a scattered showers on the 28th and 29th. The occasional cool marine air over Portland kept monthly temperatures below normal while rainfall was below normal.
Portland had 10 cloudy days and 12 clear days resulting in 61% of available sunshine while the normal sunshine received at Portland is 66%.
Precipitation .•• Monthly Total: 0.81 inches
0.28 inch below normal Greatest 24-hour Rainfall:
0.24 inch on the 16th-17th Wind ... Averages... Wind Speed: 7.3 mph
Direction: Northwest Fastest 2-Minute: Southwest at 20 mph Peak Wind: Southwest at 31 mph NEW RECORDS SET... None.

SEPTEMBER 1995 RECAP
~ 75
: 10 Cl 65
TEMPERATURE
6 11 16 21 26
DayofMonth
- MaxTemp muummu•;•••• NORM Max
Min Temp
NORM Min
September started hot with the mercury soaring to 91 degrees on the 1st. However, on the 2nd, a low pressure area lingering offshore pushed cool marine air into western Oregon. Occasional light rain and cool air dominated the weather pattern from the 2nd throughthe 8th as the low moved across northwestern Oregon into Washington. As soon as the low moved east of Portland on the 8th, high pressure redeveloped over the eastern Pacific bringing warm temperatures to western Oregon through the 24th. On the 23rd, the high pressure ridge extended into the Yukon
SEPTEMBER 1995 STATISTICS
Temperature ... Extremes... Maximum: 92 on the 14th
Minimum: 48 on the 23rd Average... Maximum: 77.6 deg
3. 0 deg above normal Minimum: 56.6 deg 4.6 deg above normal Mean: 67.1 deg 3. 8 deg above normal
Precipitation ... Monthly Total: 1.31 inches
0.44 inch below normal
17
PRECIPITATION
:c 0.2 f---1---+---+---+---0
= 0.1 r--t---+---+---+--
I I I I I I I I I I I I I 9 13 17 21 25 29
DAY OF MONTH
province of Canada, with the center slowing moving north across British Columbia. On the 25th, the ridge split over the Pacific Northwest allowing a strong area of low pressure to move in the area. Once again onshore flow with cool marine air invaded
~'!«'
western Oregon bringing an abrupt end to the ,.,,. warm late summer weather.
Portland had 13 cloudy days and 7 clear day. The cool marine air allowed Portland to receive only 53% of available sunshine compared to the normal of 62%.
Precipitation (continued) ... Greatest 24-hour Rainfall:
0.42 inch on the 26th-27th
Wind ... Averages... Wind Speed: 7.0 mph
Direction: South Fastest 2-Minute: East at 28 mph Peak Wind: East at 44 mph
NEW RECORDS SET ... Record High.. 92 on the 14th ties old record set in 1979.

OCTOBER 1995 RECAP
~ ss ~ so Q 45
6
TE1\'1PERATURE
II 16 21 26
DayofMonth
- Max Temp Min Temp mmuumnnm1 NORM Max ••• ••• ••• NORM Min
31
October was close to normal with front after front moving across western Oregon with only a day or two between them. Ground fog frequented the ·Portland area on many mornings with skies clearing during the night. On the 27th, an area of high pressure developed over central California, forcing the storm track · north l')f Portland across Washington into Idaho. Western Oregon enjoyed drier weather but temperatures remained near normal.
OCTOBER 1995 STATISTICS
Temperature •.• Extremes... Maximum: 75 on the 14th
Minimum: 28 on the 30th , Averages... Maximum: 63.3 deg
0. 7 deg below normal Minimum: 45.7 deg 0. 8 deg above normal Mean: 54.5 deg exactly normal for October
Precipitation ••• Monthly Total: 3.15 inches
0.48 inch above normal Greatest 24-hour Rainfall:
1.38 inch on the 10th-11th
18
PRECIPITATION 0.8 c:----.--,---...,----.-----,----,---,
::c
0.7 E-----t---
0.6 E----t---
0.5 E----t---
~ 0.4
0.1
0 I I I II I s 9 13 17 21 25 29
DAY OF MONTH
Climatologically, October is the foggiest month with an average of 7 days with fog that has 1/4 mile or less visibility. Fog in October 1995 was not as thick, with only 1 day of the. heavy fog reported. · ·
Portland had 15 cloudy days and only 2 dear : days which enabled Portland to receive 46% ·· of the available sunshine compared to. a ·normal of 43%.
Wind ••• Averages... Wind Speed: 6.7 mph
Direction: Southeast Fastest 2-Minute: East at 24 mph Peak Wind: East at 3 5 mph
NEW RECORDS SET ••• No records set in October.
NOVEMBER 1995 RECAP
TEMPERATURE 70~--,----,----,---.----,----,
65
60
55
6 11 16 21 26 DayofMonth
- Max Temp Min Temp nnnmmnanm NORM Max . , a • , • ••• NORM Min
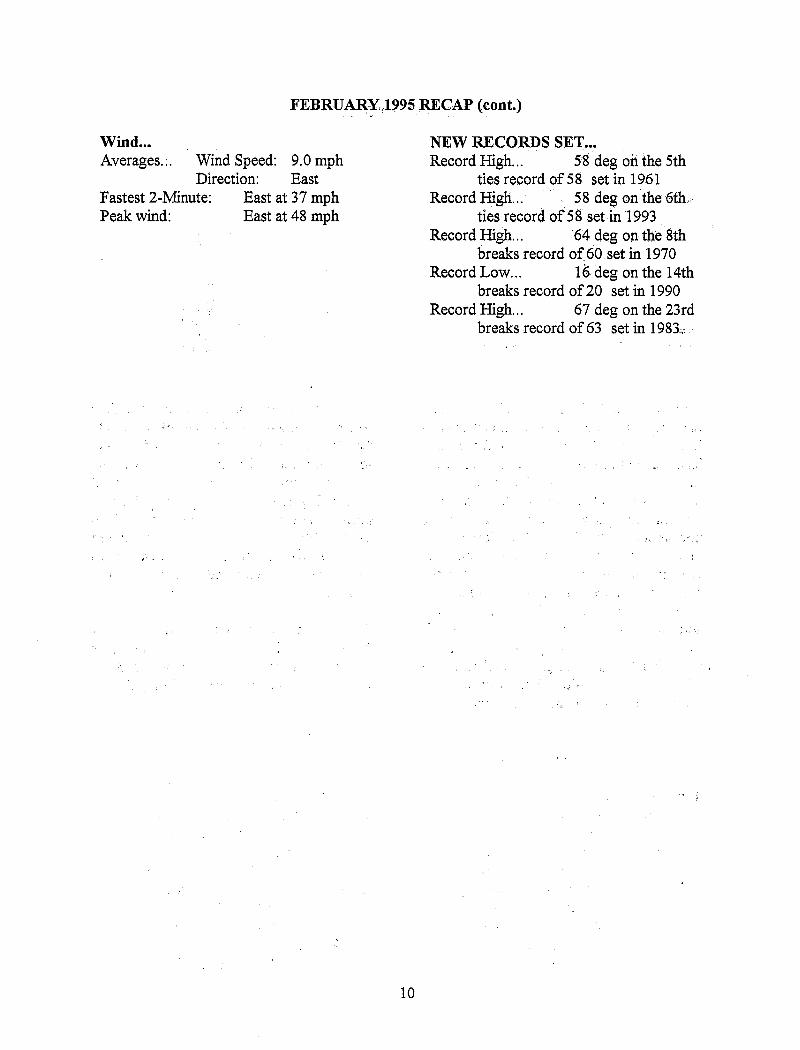
The high pressure ridge that developed over California in late October weakened by the 4th ofNovember. Upper air patterns began to change. On the 5th, an area of low pressure moved into the northeastern Pacific, allowing front after front to bombard western Oregon. In addition, the position of the low opened the Pineapple Expressway that pulled sub-tropical moisture northward, enhancing rainfall along the fronts. The most intense rainfall arrived on the 1Oth with heavy rain falling over much of northwestern Oregon. Many streams became bank-full, but flooding was isolated. Many locations around the Portland area measured 3 to 4 inches of rain between the lOth and the 12th. A short reprieve occurred on the 15th as a high over northern California pushed the storm track north of Portland before a weak front arrived on the 17th. Another strong low pressure area moved into northeastern Pacific as the ridge of high pressure moved to the Rocky Mountains and intensified on the 22nd. Again, the Pineapple Expressway was reopened. This kept several moisture-laded fronts moving into western Oregon. The sub-tropical air also brought high snow levels and record warm air into Oregon. Flooding was isolated in the Portland ·
19
PRECIPITATION
2~~==~~~====~==~==~ 1.8 f----+-----Hitll---+-----+----+-----+-t 1.6 F-----+----+11!!1----+----+-----+----+--l
1.4 1-----+----HI!lll-----+----1------+-lll!l--+--l
= 1.2 1-----t-----+l!lll-----t----1-----+-ll!lll--+-t
~ 1F----+----±IIl!l---+----+--~+-lll!l--+--l
0.6f----l-
0.4 f----+ 0.2
0
5 9 13 17 21 25 29
DAY OF MONTH
area, but was more widespread over the north Oregon coastal and western Washington streams. However, during the final week of November, rain-swollen streams began to flood throughout northwestern Oregon. ·The Willamette and Columbia rivers became bank-
~~E
full and flooded unprotected lowlands. S!feet flooding was a problem in many parts of the Portland metropolitan area due to fallen leaves that clogged storm drains.
Fog was reported in Portland on all but 3 days during November. On average, there are 6 days with heavy fog, defined as fog with visibilities of 1/4 mile or less. November 1995 recorded 2 such days.
ASOS, the Automated Surface Observing System, became operation on November 1. Sunshine information was not available due to technical difficulty.
Temperatures were well above normal during November. In fact during the latter half of the month, overnight lows were near the average high temperatures! November 1995 became the warmest and the 3 rd wettest month on record.
NO~MBER 1995 RECAP (cont.)
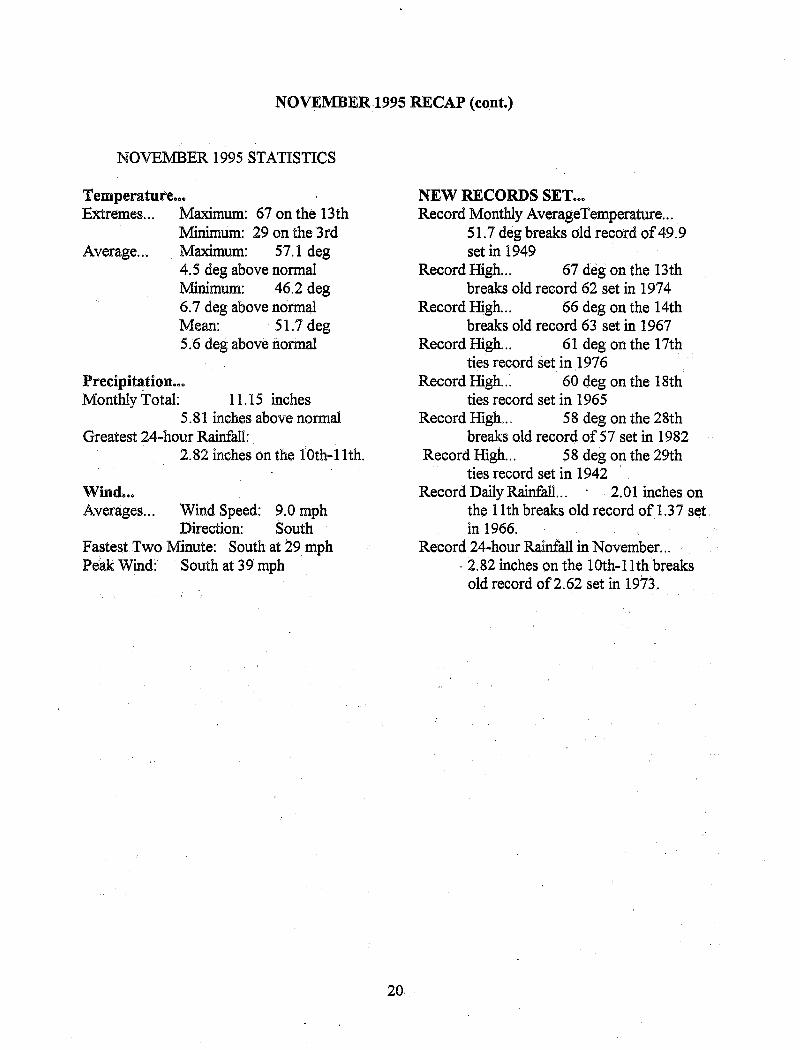
NOVEMBER 1995 STATISTICS
Temperature ••• Extremes... Maximum: 67 on the 13th
Minimum: 29 on the 3rd Average... Maximum: 57.1 deg
4.5 deg above normal Minimum: 46.2 deg 6.7 deg above normal Mean: 51.7 deg 5.6 deg above normal
Precipit~tion ..• Monthly Total: 11.15 inches
5. 81 inches above normal Greatest 24-hour Rainfall:
2.82 inches on the 10th-11th.
Wind ••• Averages... Wind Speed: 9.0 mph
Direction: South Fastest Two Minute: South at 29 mph Peak Wind: South at 39 mph
20
NEW RECORDS SET ••• Record Monthly Average Temperature ...
51.7 deg breaks old record of 49.9 set in 1949
Record High... 67 deg on the 13th breaks old record 62 set in 197 4
Record High... 66 deg on the 14th breaks old record 63 set in 1967
Record High... 61 deg on the 17th ties record set in 197 6
Record High... 60 deg on the 18th ties record set in 1965
Record High... 58 deg on the 28th breaks old record of 57 set in 1982
Record High... 58 deg on the 29th ties record set in 1942
Record Daily Rainfall... · 2. 01 inches on . the 11th breaks old record of 1.37 sc;:t in 1966.
Record 24-hour Rainfall in November ... . 2.82 inches on the 10th-11thbreaks
old record of2.62 set in 1973.

'- .. _ .. /
DECEMBER 1995 RECAP
TEMPERATURE
6 11 16 21 26
DayofMonth
- MaxTemp muunm1mm11 NORM Max
Min Temp
NORM Min
31
Weather during December took a roller coaster ride ranging from icy. weather to wet and windy to beautiful sunny postcard-perfect days. The beginning of the month continued where November left off--with lots of rain and warm weather. The broad area of low pressure over the Pacific Ocean weakened a bit on the 4th allowing a cold ridge of high pressure to establish itself over Nevada extending into British Columbia. The southward progression of strong arctic cold fronts were slowed by the Cascade and Rocky Mountain ranges of British Columbia and Washington. Eventually the modified arctic air arrived at Portland on the 7th, progressing southward to Eugene by the 8th. A strong pressure gradient from Portland to Pendleton created strong east winds through the Columbia Gorge. Cold air rode these winds into the Portland metropolitan area with temperatures dropping below freezing on the 8th and 9th. On the 9th, a warm front slowly moved northward across western Oregon. Ahead of the front, moderate rain fell, with freezing rain in the sub-freezing air in the Portland area and near the Gorge. Ice accumulations reached 114 to 112 inch with heavier accumulations in the Columbia Gorge where cold air lingered until the 11th. Warm
21
PRECIPITATION 1.1
0.9
0.8
0.7
= 0.6 u = 0.5
0.4
0.3
0.2
0.1
I I I I 13 17 21 25 29
DAY OF MONil:l
air arrived late on the 1Oth and turned freezing rain to rain in the Portland area. As soon as the ice storm was over, an intense low pressure area developed over the eastern Pacific. By early on the 12th, winds of over 1 00 mph were reported along the Oregon coast. During the day of the 12th, wind·~and rain intensified over Portland. The strongest winds at Portland were recorded around 3pm on the 12th as the center of low pressure passed near Astoria on its way into British Columbia. Winds of over 60 mph were recorded at the Portland airport with many gusts in the metropolitan area reported at near 90 mph. Fallen trees caused the most damage, crashing into homes, blocking roadways, and causing many power outages. ·The storm dissipated near Vancouver Island by 11 pm on the 12th and winds in the Portland area had subsided by 10 pm. Atmospheric pressure records, including the state-wide all-time lowest, were broken at many locations in northwestern Oregon on the 12th. A broad area of low pressure remained over the northern Pacific, sending a series of storms into western Oregon between the 13th and the 19th. The strongest storm arrived on the 13th, taking a track similar to the December 12 storm. Heavy rains with these storms

DECEMBER 1995 RECAP (cont.)
aggravated an already serious flooding situation on many northwestern Oregon streams and rivers. The Columbia and Willamette Rivers both ran bank-full most of the first two weeks ofDecember with flooding reported in the unprotected lowlands along both rivers. The confluence of the Clackamas and the Willamette rivers near Oregon City created more lowland flooding.
On the 20th, a ridge of high pressure redeveloped over eastern Oregon and Idaho.
DECEMBER 1995 STATISTICS
Temperature ••• Extremes... Maximum: 63 on the 12th
Minimum: 28 on the 26th Averages... Maximum: 47.4 deg
1.8 deg above normal Minimum: 3 7.5 deg 2. 7 deg above normal Mean: 42.5 deg 2.3 deg above normal.
Precipitation .•• Monthly Total: 5.91 inches
0.22 inch below normal Greatest 24-hour Rainfall:
1.18 inches on the 10-llth Snowfall Total: Trace Greatest 24- hour Snowfall:
Trace on the 9th
Wind ... Averages... Wind Speed: 11.1 mph
Direction: Southeast . Fastest Two Minute Wind:
South at 51 mph Peak Wind: South at 62 mph
22
The ridge blocked the storms from reaching the Portland area, splitting the storm track, with some storms moving into California and some moving into British Columbia. Postcard perfect weather with blue skies returned to the Portland area on the 22nd through the 24th. On the 25th, the low pressure area over the north Pacific moved back toward British Columbia forcing the high eastward into Montana. Rain and mild air returned on the 27th through the 31st.
NEW RECORDS SET .•• Record High .. , 63 deg on the 12th
breaks old record 58 set in 1956 December--- 2nd Lowest Atmospheric . Pressure ...
28.71 inches on the 12th breaks old record of28.72 inches, and is 2nd on the all-time lowest pressure recorded at Portland. The lowest pressure ever is 28.56 inches on January 9, 1880.
December Peak Wind... 62 mph, recorded by ASOS on the 12th, breaks the old record of 58 mph set in 1956, Unofficial gust recorders at the site recorded 7 4 mph.
NEW ALL-TIME STATE RECORD ... Lowest Atmospheric Pressure ...
28.51 inches recorded at Astoria on the 12th breaks old record of28.56 inches set in Portland on January 9, 1880.

TEMP~RATURE. DATA
23

degF
DegF
AVERAGE AND EXTREME MONTHLY TEMPERATURES
AVERAGE TEMPERATURES (1961-1990)
85.o~r---T1 --~1--~J--~~~~--r---~--~--~--~--~~ !:--~-These are the 30-Year -'--"""i---:.C---«;~.;::---+--+--1----11-:1 80·° Climatic Normals ... , ! ./ ""'
:::: ·- ............ ..! ........................... _ .... ::J4 .. :::;; _, ......... ~ .... ~.i _ .. ,_ .............. ·-65.0 / fi ""' 'l\ 60.0 V r l '" " 55.0 . ~ ~ ~ '" ",
50.0 ·-m~~.~~ .. -- ........................ -~~~-45· 0 ./{ .,./ --c- Maximum "' ~). 40.0 -.; .J..-.--"Ir'" --o- Mean "-..
35.0 I:""'" & Minimum
3o.o~r---+---+---~--~--~--~---+---+--~--~~--~
Jan Feb Mar Apr May . Jun Jul Aug Sep Oct Nov Dec
EXTREME TEMPERATURES ( 1871-1995)
110.0 .----~--~--r----:----,----,-----r---~----r-----,~--r-----.
100.0 1---1---+---+
90. 0 1----!f--~
80.0 1--..........f.
70.0
60.0
50.0
40.0
30.0
20.0
10.0
0.0
-10.0 1----+---+---1---+--~--+----+-----i----+-----1--t--~
Jan Feb Mar Apr May Jun Jul Aug Sep. Oct Nov Dec
24

' __ j
JANUARY TEMPERATURE DATA (1871-1995)
* HDD are Heating Degree Days and CDD are Cooling Degree Days.
DAILY TEMPERATURE
# HDD and CDD monthly average values based on actual occurrences rather than the total of daily normal values.
25

DAILY TEMPERATURE
FEBRUARY TEMPERATURE DATA (187lal995)
* HDD are Heating Degree Days and CDD are Cooling Degree Days. # HDD and CDD monthly average values based on actual occurrences rather than the total of daily normal values.
26

MARCH TEMPERATURE DATA (1871-1995)
* HDD are Heating Degree Days and CDD are Cooling Degree Days.
DAILY TEMPERATURE
# HDD and CDD monthly average values based on actual occurrences rather than the total of daily normal values.
27

DAILYT:a1PERA TURE
APRIL TEMPERATURE DATA (1871-1995)
* HDD are Heating Degree Days and CDD are Cooling Degree Days. # HDD and CDD monthly average values based on actual occurrences rather than the total of daily normal values.
28

MAY TEMPERATURE DATA (1871-1995)
* HDD are Heating Degree Days and CDD are Cooling Degree Days.
DAILY TEMPERATURE
#HDD and CDD monthly average values based on actual occurrences rather than the total of daily normal values.
29

DAILY TE1v1PERA TURE
JUNE TEMPERATURE DATA (1871-1995)
* HDD are Heating Degree Days and CDD are Cooling Degree Days. #HDD and CDD monthly average values based on actual occurrences rather than the total of daily normal values.
30

' -- _/
JULY TEMPERATURE DATA (1871-1995)
*HDD are Heating Degree Days and CDD are Cooling Degree Days.
DAILY TEivfPERA TURE
#HDD and CDD monthly average values based on actual occurrences rather than the total of daily normal values.
31

DAILY TEMPERATURE
AUGUST TEMPERATURE DATA (187lml995)
*HDD are Heating Degree Days and CDD are Cooling Degree Days. #HDD and CDD monthly average values based on actual occurrences rather than the total of daily normal values.
32

SEPTEMBER TEMPERATURE DATA (1871-1995)
"'HDD are Heating Degree Days and CDD are Cooling Degree Days.
DAILY TBvfPERA TURE
#HDD and CDD monthly average values based on actual occurrences rather than the total of daily normal values.
33

DAILY TEMPERATURE
OCTOBER TEMPERATURE DATA (1871-1995)
"'HDD are Heating Degree Days and CDD are Cooling Degree Days. #HDD and CDD monthly average values based on actual occurrences rather than the total of daily normal values,
34

NOVEMBER TEMPERATURE DATA (1871-1995)
* HDD are Heating Degree Days and CDD are Cooling Degree Days.
DAILY TEMPERATURE
# HDD and CCD monthly average values based on actual occurrences rather than the total of daily normal values.
35

DAILY TEMPERATURE
DECEMBER TEMPERATURE DATA (1871-1995)
* HDD are Heating Degree Days and CDD are Cooling Degree Days. # HDD and CCD monthly average values based on actual occurrences rather than the total of daily normal values.
36

degF
degF
degF
TEMPERA TUREDATA
ANNUAL MEAN TEMPERATURE 58.0
AVERiGES 1961-90 53.6 deg
J r-1872-1995 53.4 deg
~I t
~hA A~ 1 ,. ll w j ,.. tv... IY\ • i~ ,~ .,
1\ .. ~ ~~~-I
A IV \ N} ~ oil v~ ~ .Ll 7 \ pt1
'" ~ ~
56.0
54.0
52.0
~ 50.0
1870 1895 1920 1945 1970 1995
ANNUAL AVERAGE MAXIMUM TEMPERATURE 68.0
66.0
64.0
62.0
60.0
t A A ,.
' l
... Ai J A ~rt I t ~ 111 ~~ ~l -.i A /1"'\. I Y' j ~ IV
it' rt"l I ~' ll\ ~. 11'1 ~
u .A V'\NJ ~
v ~ . y
AVERAGES 58.0 1961-90 62.6 deg
1870-1995 61.9 deg 56.0 : I
1870 1895 1920 1945 1970 1995
ANNUAL AVERAGE MINIMUM TEMPERATURE 50.0 .....-------.-----~-----.-----.-------,..,..
" 48.0 ................................ ································· .......................................................................................... !.
AVERAGES 42.0 -+-----+--1961-90 44.5 deg --+---=---tt--t-----++
1874-1995 45.0 deg
40.0 -t-.,..-..--......... --t--.---.--.--....-;-..,........,.....-T--.--+---r-....-.....--.,........oj--..---.--.---.---i-l-1870 1895 1920 1945 1970 1995
37

I-ITOH/LOW--90/32/0
NUMBER OF DAYS PER MONTH WITH MAXIMUM TEMPERATURE •..
--------------,--- I-ITGHS of 90+ DEG ----,--------- -------- HIGHS of 32 DEG or LESS ----MONTH .. AVG* MOST YEAR LEAST YEAR AVG* MOST YEAR LEAST YEAR
January 0 0 1995 0 i995 2.2 18 1930 0 Many February 0 0 1995 0 1995 0.3 7 1936 0 Many March 0 0 1995 0 1995 < 0.5 1 1960 0 Many April 0 2 1926 0 1995 0 May 0.3 3 1987 0 1995 0 June 1.2 6 1970 0 1994 0 July 3.6 11 1985 0 1993 0 August 3.8 13 1967 0 1989 0 September 1.8 7 . 1991 0 1985 0 October 0.1 1 1987 0 1995 0 November 0 0 1995 0 1995 0.2 7 1985 0 Many December 0 0 1995 0 1995 0.9 11 1972 0 Many
ANNUALLY 10.8 23 1987 0 19.54 3.6 2i 1916 0 1994
NUMBER OF DAYS PER MONTH WITH MINIMUM TEMPERATURE OF •••
---------- LOWS of 32 DEG or LESS ------------MONTH AVG* MOST YEAR LEAST YEAR
January 13.1 30 1949 0 1939 February 8.2 21 1887 0 1961 March 4.6 14 1955 0 1986 April 1.0 4 1972 0 1995 May 0.1 2 1964 0 1995 June 0 0 1995 0 1994 July 0 0 1995 0 1993 August 0 0 1995 0 1989 September 0 0 1995 0 1985 October 0.6 4 1987 0 1995 November 5.2 19 1978 0 1995 December 9.6 25 1985 0 1953
ANNUALLY 42.4 84 1985 0 1934
NOTES: Most recent year of occurrence listed. *Averages are the Climatic Normals for 1961-90.
38
------------ LOWS of 0 DEG or LESS ----AVG* MOST YEAR LEAST YEAR
<0.05 2 1888 0 Many <0.05 1 1950 0 Many
0 0 0 0 0· 0 0 0 0 0
<0.05 2 1950 0 Many years

TEMP FREQUENCY
CUMULATIVE FREQUENCY OF MAXIMUM TEMPERATURE (based on data from 1926-1990)
How to use the table: For example, the maximum temperature in July is warmer than 75 degrees 70.0% of the time.
TEMP JAN FEB MAR APR MAY JUN JUL AUG SEP Ocr NOV DEC ANNUAL
>=105 0 0 0 0 0 0 0.2 0.2 0.1 0 >=100 0 0 0 0 0.1 0.1 1.5 1.5 0.1 0 >=95 0 0 0 0 0.2 1.1 4.5 4.4 0.9 0 >= 90 0 0 0 0.2 1.1 4.4 11.6 12.3 4.5 0.2 >= 85 0 0 0 0.6 5.0 12.1 26.9 25.9 12.8 1.0 >= 80 0 0 0.1 2.2 11.4 23.4 47.4 44.5 25.4 2. 7 >=75 0 0 0.5 7.6 21.9 39.3 70.0 70.2 43.6 9.1 >=70 0 0.1 4.0 17.9 36.9 61.9 89.5 90.4 66.1 20.7 >=65 0.1 1.1 11.0 31.1 55.7 85.0 98.4 98.5 87.6 42.4 >= 60 1.3 7.2 25.1 52.1 81.0 97.4 100 99.9 98.2 71.3 >=55 8.5 23.3 51.6 80.5 96.6 99.8 100 100 99.8 91.3 >=50 26.9 54.7 82.5 96.3 99.9 100 100 100 100 98.7 >= 45 54.7 82.3 96.5 99.7 100 100 100 100 100 99.7 >= 40 76.6 93.0 99.4 99.9 100 100 100 100 100 99.9 >= 35 88.2 97.0 99.9 100 100 100 100 100 100 100 >= 30 95.5 99.0 99.9 100 100 100 100 100 100 100 >= 25 98.4 99.6 100 100 100 100 100 100 100 100 >= 20 99.8 99.8 100 100 100 100 100 100 100 100 >= 15 100 100 100 100 100 100 100 100 100 100 >- 10 100 100 100 100 100 100 100 100 100 100 NORMAL MAXIMUM.TEMPERATURES (based on data from 1961-90) T (deg F) 45.4 51.0 56.0 · 60.6 67.1 74.0 79.9 80.3 74.6 64.0
0 0 0 0 0 0 0 0 0 0 0 0 0 0
0.2 0 2.4 0
12.7 1.7 39.9 9.9 70.4 32.2 89.8 61.3 97.5 86.6 99.1 95.4 99.4 98.0 100 99.0 100 99.6 100 99.9 100 100
52.6 . 45.6
<0.05 0.3 0.9 2.9 7.1
13.2 22.0 32.5 43.0 54.2 67.0 80.2 90.3 96.1 98.3 99.3 99.8 99.9 100* 100
62.6
CUMULATIVE FREQUENCY OF MINIMUM TEMPERATURE (based on data from 1926-1990)
How to use the table: For example, the minimum temperature in May is warmer than 45 degrees 74.1% of the time.
TEMP JAN FEB MAR APR MAY JUN JUL AUG SEP Ocr NOV DEC ANNUAL
>= 70 0 0 0 0 0 0 0.5 0 0 >= 65 0 0 0 0 0 0.4 2.5 1.7 0 >= 60 0 0 0 0.1 0.6 6.1 19.4 24.3 5.6 >=55 0 0.1 0.2 0.9 7.8 38.2 72.5 73.9 36.2 >=50 0.9 1.2 2.0 9.5 33.2 79.4 96.1 95.3 71.6 >= 45 6.5 8.3 15.8 33.1 74.1 98.2 99.9 99.8 91.8 >=40 23.8 33.6 48.7 69.2 95.1 99.9 100 100 98.6 >= 35 50.3 63.3 79.3 92.8 99.5 100 100 100 99.9 >= 30 74.9 85.8 95.0 99.9 99.9 100 100 100 100 >= 25 87.4 95.1 99.4 100 100 100 100 100 100 >= 20 93.8 97.9 99.9 100 100 100 100 100 100 >= 15 97.8 99.4 100 100 100 100 100 100 100 >= 10 99.5 99.7 100 100 100 100 100 100 100 >= 5 99.9 99.8 100 100 100 100 100 100 100 >= 0 99.9 99.9 100 100 100 100 100 100 100 >= -5 100 100 100 100 . 100 100 100 100 100 NORMAL MINIMUM TEMPERATURES (basedondatafrom 1961-90) T (deg F) 33.7 36.1 38.6 41.3 47.0 52.9 56.5 56.9 52.0
0 0 0 0.1 0 0 0.4 0 0.1 5.9 0.5 0.2
29.1 5.6 1.4 60.7 25.7 8.3 85.0 54.5 31.2 96.8 78.9 . 61.3 99.6 92.1 83.4 100 98.1 94.2 100 99.5 . 97.6 100 99.9 99.0 100 100 99.7 100 100 100 100 100 100 100 100 100
44.9 39.5 34.8
< 0.05 0.4 4.8
19.9 35.7 52.1 70.1 85.3 94.2 97.8 99.1 99.7 99.9 100* 100* 100
44.5
*Actual value is slightly less than 100. Due to rounding of the decimal point, the value is listed as 100%.
39

HOT SPELLS/COLD SNAPS
LONGEST HOT SPELLS iAND COLD SNAPS (1~74m19,95)
CONSECUTIVE DAYS: DATEs TEMPERATURES
HIGHS of 90 Deg 8 August 12-19, 1967 92/95/97/98/97/92/91194 or Above 7 August 3-9, 1972 94/92/95/102/104/96/91
7 September 4-10, 1944 93/101190/93/92/92/98 . 7 July 12-18, 1911 91197/92/94/97/95/94 7 July 17-23, 1988 97/95/93/93/94/93/90 6 Occurs many times
HIGHS of 100 Deg 5 July 13-17, 1941 10111031103/102/100 or Above 4 August 8-10, 1981 103/107/105/107
3 July 19-21, 1981 102/103/101 3 August 10-12,1977 101/102/104 3 June 30-July 3, 1942 100/105/102
HIGHS of 32 Deg 19 January 8-26, 1930 32/32/29/27/30/28/26/23/22/18 or Below 19/26/26/24/22/26/30/32/30
12 January 18-29, 1956 30/26/29/32/31130/30/26/28/22 26/25
10 December4-13, 1972 3 2/27/27/25/26/21!,/28/24/31132 9 Jan 27-Feb 4, 1950 22/25/20/25/16/25/18/20/30 7 Dec 29•Jan 4, 1978-79 29/24/19/21125/3113·1
LOWSof32Deg 38 Jan 1-Feb 7, 1949 30/25/22/22/24127/32/23/16/16 or Below 19/19/16/23/26/26/29/26/23/15
22/9/11110/11118/19/10/26/30 27/27/29/27/29/28/32/32
25 Dec 9-Jan 2, 1985-86 30/26/22/23/25/25/29/27/26/25 21126/22/22/23/25/23/23/24/24 25/21129/28/29
24 January 6-29, 1930 30/24/25/21/20/18/18/17/19/19 15/13/14/16/16/15/15/18/19/19 22/27/24/31
22 January 2-23, 1888 32/30/26/20/17/12/10/10/1217 28/1114/-2/0/6/8114/20/19/19/20
20 Jan 27-Feb 15, 1929 20/16/15/18/18/27/28/29/27/26 22/16/19/16/18/17/20/19/22/24
LOWS of 10 Deg 7 Jan 28-Feb 3, 1950 10/8/10/-2/11-3/4 or Below 6 January 8-13, 1909 10/10/10/9/6/8
5 January 14-18, 1888 4/-2/0/6/8 4 January 13-16, 1875 4/3/10/9 2 December30-31, 1968 8/9
40

MONTHLYMAXTEMP
MONTHLY MEAN MAXIMUM TEMPERATURES (1871-1995)
OFFICIAL RECORDS START NOVEMBER 1, 1871 1871 I 1872 Maximum Temperature Data missing from 1871-June 1874 1873 1874 --- --- --- -- --- --- 77.8 73.5 71.8 66.1 51.3 48.3 ---1875 35.9 47.9 50.6 66.6 64.1 70.2 82.9 77.0 74.2 66.0 50.9 52.7 63.2 1876 46.0 51.8 51.5 57.9 63.7 73.7 75.3 73.5 72.9 65.2 54.0 47.0 61.0 1877 48.1 54.0 57.0 62.3 64.8 70.7 76.5 76.6 68.8 61.4 54.5 48.3 62.0 1878 47.0 51.3 59.2 60.5 67.7 76.3 74.5 77.5 68.8 58.6 52.6 44.7 61.6 1879 43.5 50.2 55.5 60.8 62.7 68.9 75.2 78.3 73.5 59.0 50.2 43.5 60.2 1880 45.7 43.3 48.5 59.5 62.8 69.8 76.7 73.6 69.8 62.1 48.3 45.1 58.8 1881 44.3 50.6 57.3 63.2 67.2 69.9 75.2 73.3 69.5 55.8 50.1 49.5 60.5
1882 45.4 44.0 52.6 57.8 68.2 74.8 79.2 77.4 72.4 58.1 51.3 51.4 61.0 1883 44.3 42.0 61.8 59.0 69.8 75.7 80.0 73.8 72.3 58.4 52.8 49.0 61.6 1884 46.3 44.4 55.6 65.1 73.6 74.9 75.0 81.9 66.5 61.9 54.6 37.5 61.5 1885 41.6 53.2 63.5 68.3 74.5 73.7 83.1 82.5 73.8 69.1 57.6 50.0 66.0 1886 43.3 53.4 54.3 59.9 69.9 75.5 81.2 79.9 74.6 60.2 48.8 50.8 62.6 1887 47.7 38.4 58.8 59.5 69.3 71.4 78.5 75.8 71.9 63.4 50.6 47.0 61.0 1888 36.5 51.6 55.7 66.5 75.1 71.3 80.3 81.8 77.3 63.7 49.1 48.6 63.1 1889 44.7 53.4 63.9 65.2 70.9 79.4 84.4 77.1 73.4 65.6 54.1 43.0 64.6 1890 36.7 45.1 52.4 63.2 72.5 71.5 76.6 76.9 74.6 61.9 55.8 48.3 61.3 1891 48.8 42.3 51.8 60.5 70.4 68.7 80.5 82.1 70.1 65.0 53.6 46.1 61.7 1892 44.7 50.0 57.4 56.8 69.2 72.4 75.0 78.5 72.7 61.2 50.5 42.7 60.9 1893 39.5 42.9 49.9 51.1 62.5 65.3 75.1 77.3 65.2 56.3 51.4 48.5 57.1 1894 44.9 42.9 50.7 57.1 64.5 66.3 78.8 80.9 68.3 59.5 54.5 44.3 59.4 1895 42.1 48.6 54.1 61.2 64.0 72.7 75.8 76.9 65.7 65.9 50.3 45.1 60.2 1896 48.6 52.1 53.4 54.1 59.6 70.5 81.5 74.7 70.9 64.7 43.2 48.2 60.1 1897 43.4 47.4 45.7 65.6 71.9 69.1 74.1 82.3 68.7 62.4 49.9 47.8 60.7 1898 42.9 50.6 51.3 60.6 65.5 71.3 77.2 77.8 71.5 60.2 49.0 42.1 60.0 1899 45.0 45.0 50.9 56.7 57.5 67.4 77.6 69.1 74.6 58.8 57.1 47.7 59.0 1900 49.3 47.1 59.5 60.9 64.4 72.4 77.1 72.3 68.6 59.3 51.5 50.3 61.1 1901 44.7 48.8 53.7 57.3 65.0 65.4 72.8 80.2 67.0 67.1 53.8 45.3 60.1 1902 43.7 49.9 50.5 56.7 63.5 71.0 75.2 78.8 72.8 64.7 50.9 44.5 60.2
1903 47.1 48.4 53.9 57.6 66.3 73.3 74.0 75.6 71.9 64.0 51.1 45.8 60.8 1904 46.0 46.1 48.7 63.9 67.7 73.6 77.5 79.8 74.7 64.7 56.5 47.7 62.2 1905 45.0 48.9 58.0 65.6 64.4 70.1 80.2 76.8 71.0 58.6 51.8 45.0 61.3 1906 47.4 50.0 52.7 66.6 65.5 69.3 84.8 80.4 71.7 63.4 50.8 47.4 62.5 1907 38.8 51.2 51.3 61.4 69.3 71.7 78.5 73.9 71.9 64.2 55.5 48.8 61.4 1908 47.4 48.4 53.2 62.2 60.9 71.1 80.4 76.5 70.9 60.4 55.1 43.3 60.8
1909 38.0 48.2 55.2 60.0 64.3 73.1 73.2 76.7 73.8 62.4 52.3 40.4 59.8 1910 42.3 44.5 60.8 62.8 69.7 69.3 78.1 74.3 69.2 62.4 51.7 46.9 61.0 1911 42.6 46.0 58.8 58.4 62.2 68.6 81.1 77.0 66.0 62.5 51.6 45.5 60.0 1912 46.1 50.8 54.5 58.0 68.8 73.6 76.9 75.1 72.3 59.3 52.4 45.9 61.1 1913 42.8 46.1 50.9 59.4 66.4 72.1 78.2 78.8 72.7 60.4 52.1 44.3 60.4
41

MONTHLYMAXTEMP
MONTHLY MEAN MAXIMUM TEMPERATURES (cont.)
Year Jan Feb Mar Apr May June July Aug Sep Oct Nov Dec Ann
1914 50.5 48.0 58.0 62.7 71.6 70.5 80.1 79.1 67.3 64.1 52.5 41.5 62.2 1915 43.6 51.2 60.6 65.7 66.5 72.0 76.1 82.7 71.7 63.3 49.9 46.1 62.4 1916 34.1 48.0 53.2 62.1 63.3 71.6 72.7 78.5 72.4 63.1 49.1 41.8 59.2 1917 44.3 46.4 48.6 55.9 61.6 72.0 80.6 82.1 71.5 66.9 57.4 52.5 61.6.
1918 49.5 47.2 53.7 63.3 64.5 78.8 78.4 77.3 78.0 63.5 51.7 46.9 62.7 1919 47.6 47.1 55.5 61.9 66.8 70.8 79.8 80.1 71.4 58.3 50.3 38.5 60.7 1920 44.6 50.0 52.8 55.8 65.7 71.8 78.9 80.6 69.1 59.0 52.7 47.7 60.7 1921 46.4 50.6 54.7 58.9 66.5 72.9 76.6 77.5 69.7 65.5 54.5 44.0 61.5 1922 40.4 45.5 49.8 .56.4 67.9 76.2 79.6 77.2 73.9 62.1 48.8 42.5 60.0 1923 46.9 43.2 55.5 63.5 66.1 71.7 77.5 81.5 74.7 64.8 57.3 46.3 62.4 1924 43.5 53.8 53.6 63.4 72.4 74.7 78.2 75.9 73.7 61.4 50.5 41.3 61.9 192.5 49.4 51.6 55.4 62.5 71.0 73.5 81.3 76.1 73.1 64.4. 51.2 50.9 63.2 1926 47.5 54.5 63.4 70.4 68.1 77.7 82.8 79.6 70.9 65.5 56.5 45.6 65.2 1927 43.2 51.8 54.3 61.3 62.9 73.7 78.9 79.9 69.5 62.5 54.8 42.4 61.3 1928 43.2 50.7 57.5 58.7 74.1 69.8 79.2 78.3 70.2 61.2 51.9 45.2 61.7 1929 39.3 41.9 54.6 57.4 68.3 71.3 80.0 80.9 75.6 67.6 51.8 49.9 61.6 1930 32.6 53.1 58.9 64.5 63.8 71.9 77.6 80.7 72.4 61.4 52.3 44.7 61.2 . 1931 49.8 51.2 55.9 65.2 73.5 72.6 82.1 81.1 71.5 64.0 49.6 44.4 63.4 1932 44.2 47.1 53.5 61.5 66.5 76.5 75.7 77.3 77.2 64.5 55.1 42.7 61.8 1933 43.6 43.8 . 54.0 61.5 61.0 71.4 79.1 ·80.4 67.4 65.3 51.6 50.5 60.8 1934 51.5 56.4 64.0 70.0 70.8 74.0 76.8 80.5 72.3 65.5 54.9 48.1 65.4 1935 46.0 52.5 50.3 60.5 68.9 74.4 78.7 79.7 78.1 60.5 48.2 46.6 62.0 1936 48.5 38.9 52.5 64.5 70.7 73.8 77.7 80.4 73.2 68.2 53.0 47.3 62.4 1937 34.4 47.0 56.1 57.1 68.4 74.8 78.5 76.6 72.5 67.5 54.1 49.0 61.3 1938 46.5 48.1 53.4 63.3 69.8 75.3 82.8 76.7 77.6 64.6 49.6 48.1 63.0 1939 47.9 46.0 57.5 66.1 70.9 69.7 80.5 81.5 75.1 63.6 56.4 51.0 63.8 1940 47.3 52.0 59.2 63.5 73.3 79.2 79.2 81.9 73.7 65.5 49.7 49.0 64.5 1941 47.4 55.1 63.5 65.8 67.1 71.6 84.5 77.6 68.8 62.5 54.8 47.7 63.9 1942 39.8 49.2 55.6 62.1 65.1 70.4 80.2 80.5 76.2 65.5 50.4 47.7 61.9 1943 40.0 52.6 53.4 64.1 65.2 69.6 78.9 78.0 79.5 62.5 53.5 46.3 62.0 1944 45.5 49.0 54.7 59.9 68.4 71.7 80.2 78.0 77.8 67.9 51.6 44.8 62.5 1945 48.5 50.8 52.0 58.7 68.4 73.0 82.0 80.4 72.1 64.1 50.3 44.9 62.1 1946 46.7 49.4 54.4 61.5 70.6 70.6 79.1 80.0 72.5 58.8 51.0 47.2 61.8 1947 43.6 53.8 59.8 64.6 73.3 71.1 77.2 76.9 75.6 61.8 .52.6 48.3 63.2 1948 45.7 47.5 52.4 56.5 65.0 75.9 76.5 74.2 72.7 62.3 49.5 42.8 60.1 1949 34.5 45.2 53.0 63.0 69.8 72.9 77.1 77.4 75.0 57.6 58.4 46.3 60.9 1950 32.8 45.5 51.5 57.9 65.8 71.3 79.0 81.8 74.5 58.7 51.6 51.4 60.2 1951 44.5 49.7 49.4 66.0 67.0 77.1 78.4 77.9 76.0 61.6 51.2 42.6 61.8 1952 40.4 48.4 52.4 64.4 68.5 69.4 80.9 79.6 79.0 71.8 49.5 46.8 62.6 1953 52.0 51.3 53.5 58.8 63.3 66.4 78.0 76.1 74.6 64.4 55.0 49.1 61.9 1954 44.2 49.8 54.0 59.3 67.4 66.2 72.6 71.6 69.9 63.0 55.8 46.0 60.0 1955 44.8 47.3 49.2 55.0 63.0 70.7 72.2 77.2 71.9 61.0 46.9 44.7 58.7 1956 45.2 40.9 51.8 63.6 69.7 67.6 80.1 75.7 72.0 59.0 50.6 46.0 60.2 1957, 36.5 50.1 52.9 61.4 67.5 71.5 76.6 75.2, 79.1 61.3 53.0 49.3 61.2
42

MONTHLY MAXTEMP
'- /'
43

MAX TEMP GRAPHS
JANUARY MAXIMUM TEMPERATURE 55.0
50.0
45.0
degF
~At. I ~ N ~ ti ~ J ~ ~~ N
'
degF
VIlli ;j I "l .. "'i • i i i
40.0 :
j
~ 35.0 -............. AVERAGES uoo ouofuuouoou ooo'uooo oooouo'o ..... ......................... .......... .................... .o.
30.0 1870
60.0
55.0
1961-90 45.4 deg i 1874-1995 44.6 deg
:
i 1895 19'20 1945 1970
FEBRUARY MAXIMUM TEMPERATURE
J 1. ~~ I
I E
• 1995
i 1-
i A · · ·~ .. ·~t·A ... ·k· .. .. ~.~- -~ A ~ J - ................ .... . ., .. .... V .. 'tl·Y·· ... 1-
J 'V V \. VVi ~ ff\ r 50.0
45.0
40.0
35.0 1870
65.0
60.0
~
u .. I
...._ AVERAGES 1961-90 51.0 deg 1874-1995 49.3 deg
I
1895 1920 1945 1970 1995
MARCH MAXIMUM TEMPERATURE
~
I ~~ t
degF ~· ll ~~ 1\ .. 55.0 -..........
50.0
45.0 1870
' ...... .. .... ....
1895
. .... ti tl
v ~r~ l' ~ II
I 1920
44
·t· T ~?~~ . .......
~
I AVERAGES I 1961-90 56.0 deg 1874-1995 55.1 deg !
! i . 1945 1970 1995

MAX TEMP GRAPHS
APRIL MAXIMUM TEMPERATURE 75.0
AVERAGml 1961-90 60.6 deg
70.0 1874-1995 61.1 deg
65.0
degF
Pl. 11 • h ~
l ~ \ ~K ~ fL !Y~ 1\t ~ ~N ~N
60.0 111\11 I ¥1 & , .. &
~~ v A ~ ~ ~ v~ ' I v
55.0 .......... uu ................ ............................. ..................................... . ........................... ....... -················--~·r
50.0 I
1870 1895 1920 1945 1970 1995
MAY MAXIMUM TEMPERATURE 80.0
75.0
70.0
degF
f ~ ~ .. A 1'1 t 4 t I, t ll
lXV r A A ., V It 1\J i
65.0 -····~1 ···············~ -~-V. -v "' _____ \L !~ ···~V'· ·-l~r!l-t lool
60.0
55.0 1870
80.0
. 75.0
degF
70.0
65.0 1870
A y
If
j
AVERAGES 1961-90 67.1 1874-1995 67.1
I
1895 1920 1945 1970 1995
JUNE MAXIMUM TEMPERATURE
J ~ f[1 ~l ~ LA.
f1 t .. ~ 1\ v ' 1\ ~J ~ r \f )! l' t '
AVERAGES 1961-90 74.0 1874-1995 72.3 Aj
!
1895 1920 1945 1970 1995
45

MAX TEMP GRAPHS
degF
90.0
85.0
80.0
75.0
70.0 1870
t
y
~~ ..
JULY ·MAXIMUM TEMPERATURE
AVERAGES 1961-90 79.9 deg 1874-1995 78.9 deg
~ ~· ~ ~ t ~I t t :
A lVI .II !.{\, v
N~ I ~ k'" Vll' J ~ \f • • !
p i !
! 1895 1920 1945 1970 1995
. AUGUST MAXIMUM TEMPERATURE 90.0~------~~-------r--------~------~--------~
80.01=:~JJ~~~~~~~~1P1A~~~nnJA~~~~~rr degF
75.0
AVERAGES 70.0 -+------+-¥---1961-90 80;3 deg ----~------!+
1874-1995 78.6 deg
65.0~~~~~~~~~-+-r~~~+-~~~~~~~-r~
1870 1895 1920 1945 1970
SEPTEMBER MAXIMUM TEMPERATURE 85.0
AVJRAGES 1961-90 74.6 deg
80.0 - ················1874-1995 73.1 deg ...... ............................. i' ............................ ....... '"~-~
degF
75.0
fl 70.0
65.0 1870
r .......
~~ J ~ A
n
I~ I~
1895
~ t t
f\ ~ !flf'
~ ~~ ~ J 'I \ ~ ~ "
1920 1945 1970
46
1995
~-+ ! ' I i i
1995

MAX TEMP GRAPHS
OCTOBER MAXIMUM TEMPERATURE 75.0 -,---------,------r-------.-----.....----""""":""T""
AVERAGES 1%1-90 64.0 deg
70.0 -+-----t-1874-1995 63.2 deg ---+---t-----i-----,fl---++-
degF 1
degF
55.0+-~-r--~~--.-~~~+-~~~-+~~~~~~~~~
1870 1895 1920 1945 1970
NOVEMBER MAXIMUM TEMPERATURE 60.0
t
~ I ~ ~ ~ II .t~ I~ l~ aJ. \1 ltl 'l ·~ 1 ~-, ·~ u~ 1\ \ r~t ..
v [I
55.0
50.0
AVERAGES 45.0 -................................ ................ 1961-90 52.6 deg
..... ..................................... .............
40.0 1870
1874-1995 52.7 deg
I 1895 1920 1945 1970
DECEMBER MAXIMUM TEMPERATURE
1995
• IV\
\ ~
ououoooou •
1995
55.0 ...,-------r-----:-------,-----r------:-r
-~;-~-- ~--~·-· ~-- ··;~·-· .. -... ·--~·-; In;-·rc~---~ .1¥ Ill\ \ 1.1 Ill ;
45.o-+--tv~~~~.~~~~+\~--~**~-~-+r~,~rr~1,~~
50.0
degF v ~ 1%~~ERA~~ deg ~ "t',,_ 1874-1995 46.2 deg
! 35.0+-~~~-+~~~~+-~~~-~.~~~~~~...,-T-~.
40.0 +---+--+-----:.:.........~--
1870 1895 1920 1945 1970 1995
47

MONTHLY MIN TEMP
MONTHLY MEAN MINIMUM TEMPERATURES (1871-1995)
OFFICIAL RECORDS START NOVEMBER,l, 1871 1871 I 1872 Minimum Temperature Datamissine from 1871-Aurost 1874 ,.
1873 1874 --- --- --- --- --- --- --- 53.5 49.3 45.5 38.9 38.2 ---1875 24.6 34.4 38.9 43.5 47.4 51.2 58.0 55.2 52.3 50.9 38.9 42.7 45.7 1876 33.2 38.8 38.6 42.3 45.9 54.3 56.2 52.1 53.2 50.5 40.9 33.9 45.0 1877 35.8 38.6 42.5 41.6 45.4 50.1 55.1 55.5 49.9 44.9 41.8 36.4 44.5 1878 35.5 39.0 42.7 41.4 45.4 51.0 53.4 54.3 49.5 43.8 40.7 34.3 44.2 1879 32.2 37.1 41.7 44.2 47.6 51.9 55.3 55.2 53.9 46.0 36.9 34.3 44.7 1880 37.6 33.6 35.0 40.7 44.5 51.2 54.4 54.1 50.2 44.6 36.3 34.4 43.0
1881 34.6 40.4 42.0 47.5 46.4 52.4 54.0 53.3 50.5 44.8 38.4 38.4 45.2
1882 35.2 33.2 36.9 40.8 47.0 54.3 55.2 54.8 50.6 45.7 37.7 41.6 44.4
1883 32.5 25.8 41.1 42.1 48.4 53.2 57.0 54.2 52.6 45.4 42.0 36.8 43.4
1884 33.3 29.4 37.8 45.3 48.7 53.7 55.9 57.7 49.4 45.0 42.0 25.5 43.6
1885 31.6 41.5 42.9 41.5 48.9 50.5 57.3 52.8 51.1 46.0 40.7 37.8 45.2
1886 31.7 39.1 37.5 42.6 48.5 53.5 56.4 55.3 52.2 44.5 34.6 40.2 44.7
1887 36.8 25.7 40.9 42.0 48.2 50.4 54.2 54.9 49.3 45.0 38.5 37.9 43.6
1888 22.0 36.0 36.4 44.1 49.6 54.5 54.8 56.3 54.7 48.9 38.7 38.8 44.5
1889 32.2 35.1 43.7 43.4 49.7 52.5 56.4 52.4 49.3 48.7 41.2 34.1 44.9
1890 26.8 31.9 37.9 41.7 48.8 52.2 54.4 54.9 50.2 43.3 38.6 37.6 43.2
1891 37.5 31.7 36.3 44.1 49.4 51.6 57.0 57.8 51.4 50.1 44.3 37.5 45.7
1892 35.1 36.9 42.4 41.3 48.9 51.9 54.4 55.2 53.1 45.1 40.9 33.9 44.9
1893 28.7 31.4 38.9 40.7 46.3 49.9 53.9 55.2 50.6 42.7 39.9 39.2 43.1
1894 35.8 32.2 37.4 42.0 46.5 51.4 55.7 57.5 51.6 45.5 42.6 34.7 44.4
1895 32.5 37.1 37.7 41.8 47.8 51.7 55.5 53.8 49.1 46.2 37.4 36.6 43.9
1896 37.0 40.3 37.6 39.9 44.9 51.8 58.7 57.9 51.1 47.1 34.0 39.6 45.0
1897 34.1 37.2 35.3 44.4 50.9 53.2 55.1 59.9 51.3 46.1 39.5 38.5 45.5
1898 35.1 40.8 36.3 42.7 47.7 53.7 55.6 58.5 54.1 45.7 38.8 32.9 45.2
1899 36.1 33.7 36,8 40.8 44.7 50.2 56.1 53.9 53.6 44.8 47.9 38.5 44.8
1900 38.8 36.6 44.2 43.6 49.2 54.5 56.1 53.9 51.4 45.1 40.2 39.4 46.1
1901 34.3 37.2 39.4 40.3 48.4 50.7 52.9 56.7 49.6 51.1 43.0 36.9 45.0
1902 33.2 39.4 39.5 41.4 49.0 51.7 55.1 54.8 51.2 48.4 41.3 36.2 45.1
1903 38.6 33.7 37.6 42.0 47.5 55.1 54.4 56.4 51.0 47.2 41.2 36.3 45.1
1904 38.2 36.4 38.2 45.7 47.5 52.2 56.6 55.1 52.5 48.3 46.2 38.9 46.3
1905 35.9 36.4 43.5 45.3 48.1 52.6 56.8 55.5 53.1 44.0 37.0 36.3 45.4
1906 38.5 39.9 38.2 44.7 48.3 50.8 59.8 56.0 51.8 47.9 41.6 38.8 46.4
1907 29.1 39.2 38.5 42.9 49.0 53.6 57.3 55.2 53.6 50.4 42.0 39.2 45.8
1908 37.1 37.1 39.4 43.3 44.8 51.3 59.0 55.5 49.2 45.4 42.5 34.8 45.0
1909 27.6 38.4 40.0 42.1 45.4 52.3 54.6 53.2 52.7 46.8 42.1 30.8 43.8
1910 32.8 34.1 43.6 44.7 50.4 51.3 56.1 53.5 50.9 49.6 47.8 38.9 45.6
1911 34.2 34.5 39.5 39.2 46.4 50.6 57.9 57.1 50.9 46.0 40.5 37.2 44.5
1912 36.6 39.8 38.2 41.8 49.5 53.6 57.8 56.4 52.2 44.0 41.8 37.0 45.7
1913 33.5 33.3 38.3 42.7 48.7 53.7 57.5 58.5 51.9 46.0 42.9 37.1 45.3
48

MONTHLY WN TEMP
MONTHLY MEAN MINIMUM TEMPERATURES (cont.)
Year Jan Feb Mar Apr May June July Ang Sep Oct Nov Dec Ann 1914 41.2 38.8 44.2 44.8 50.6 52.4 57.1 57.0 51.4 50.6 41.6 32.1 46.8
1915 34.8 39.5 44.5 45.6 48.9 53.3 58.3 59.8 53.0 48.2 40.9 38.0 47.1 1916 25.2 36.5 40.7 44.0 46.2 52.3 55.6 57.5 52.6 43.4 38.3 34.4 43.9 1917 35.0 36.6 36.5 42.8 47.5 51.6 57.4 58.5 54.7 47.7 43.9 44.3 46.4 1918 41.4 36.1 39.6 42.3 46.6 55.4 57.1 57.4 56.9 49.3 41.6 37.7 46.8 1919 36.9 38.0 40.8 44.8 47.7 50.4 56.1 57.0 53.6 43.5 39.7 28.6 44.8 1920 34.1 34.4 38.9 40.7 44.5 52.4 57.1 58.0 53.3 47.2 40.9 40.5 45.2 1921 36.8 39.9 41.2 42.6 47.7 56.0 54.8 56.6 51.3 48.6 43.0 34.2 46.1 1922 29.9 34.3 36.8 41.0 48.2 54.8 56.9 57.3 53.8 48.8 38.3 33.6 44.5
1923 38.8 31.6 38.9 45.0 49.1 53.3 58.1 59.6 54.3 49.4 43.5 36.7 46.5
1924 33.5 42.2 38.1 42.7 50.1 53.9 55.8 57.1 53.1 47.8 40.7 31.8 45.6
1925 40.3 41.1 39.5 45.8 51.4 53.3 58.4 55.8 54.5 47.1 40.9 40.6 47.4
1926 38.0 42.9 43.6 50.0 50.3 56.2 58.2 58.7 52.3 50.2 44.6 36.3 48.4
1927 34.9 39.4 39.5 42.6 47.8 55.0 58.2 58.4 54.3 47.4 44.8 33.2 46.3 1928 34.0 37.7 44.1 44.1 50.7 54.7 58.8 56.7 52.8 48.2 41.2 35.0 46.5 1929 29.0 29.4 40.8 40.9 48.8 53.6 56.6 57.3 54.0 49.4 37.7 40.7 44.8 1930 23.5 39.5 41.7 47.1 46.3 52.5 55.7 59.0 55.0 46.0. .. 39.8 36.2 45.2 1931 39.6 38.8 41.8 45.9 51.9 54.6 58.1 57.3 54.0 47.6 38.3 35.9 47.0 .. 1932 35.3 35.8 42.4 44.9 48.7 55.2 55.8 58.8 53.9 49.8 43.5 33.5 46.5 .. 1933 36.0 32.6 40.1 41.8 ·46.8 53.2 56.9 58.8 51.8 49.0 41.4 42.8 45.9 .... ,, 1934 42.3 42.5 . 46.4 49.5 52.1 54.1 57.1 58.5 53.2 49.2 45.7 40.1 49.2 _..,.,..._,,
1935 34.9 40.0 37.8 42.9 46.8 54.4 56.9 57.1 56.3 46.1 36.5 37.7 45.6 -' -~ ... ,
1936 39.8 28.9 38.1 46.6 51.7 56.5 57.8 58.6 53.7 49.1 38.1 40.2 46.6 [:;::: 1937 25.4 36.5 43.3 43.0 48.5 56.1 58.4 57.0 55.2 51.0 45.2 39.0 46.6 .,,
1938 36.3 38.6 40.5 45.4 49.0 54.5 59.2 55.8 57.4 49.9 40.1 39.2 47.6 1939 39.6 35.6 41.3 45.8 50.4 52.9 58.3 58.4 55.7 49.5 43.5 41.7 47.7 1940 37.2 42.4 44.5 47.1 51.9 55.8 58.7 59.0 57.5 51.8 38.8 39.0 48.6 1941 35.2 37.1 40.6 43.1 48.1 54.8 58.3 58.0 52.0 46.8 41.3 38.1 45.1 1942 30.9 36.3 37.1 43.5 47.8 51.6 58.6 57.6 50.3 45.8 39.4 38.3 44.8 1943 26.5 34.3 37.4 44.5 46.0 51.0 55.5 55.7 52.0 47.2 38.7 33.6 43.5 1944 32.8 35.4 36.0 41.8 46.6 51.6 55.6 55.6 52.5 49.1 38.9 33.9 44.2 1945 36.3 38.0 38.4 42.1 49.2 50.6 56.0 55.4 49.5 44.2 39.9 34.7 44.5 1946 35.1 36.0 38.7 41.4 48.8 51.8 56.1 55.5 51.5 42.4 35.3 36.5 44.1 1947 30.9 36.6 39.7 43.2 48.3 52.8 56.4 54.8 51.7 48.9 41.4 37.5 45.3
1948 33.3 34.0 37.1 41.3 47.1 57.1 56.9 57.4 53.2 44.8 37.9 33.3 44.4 1949 21.0 33.0 38.3 41.8 48.5 50.5 54.6 55.5 51.3 39.5 41.3 36.5 42.7 1950 21.2 32.1 38.6 39.2 43.2 52.2 54.7 55.7 53.8 46.1 41.2 41.4 43.3
' 1951 35.0 36.0 34.5 40.9 46.5 ~ 51.9 55.7 53.4 50.2 45.7 40.2 32.4 43.5 1952 30.8 35.0 38.3 40.4 46.5 51.1 55.0 56.1 50.6 45.5 31.8 36.4 43.1 1953 42.6 36.3 38.2 40.9 45.5 50.8 54.4 55.0 50.3 44.2 42.2 38.3 44.9
1954 33.8 35.3 33.6 39.8 46.0 49.7 53.5 55.0 50.4 43.1 43.5 35.7 43.3 1955 34.6 33.5 33.8 37.9 42.8 50.7 54.7 53.7 48.9 46.2 35.9 33.7 42.2 1956 34.6 30.8 36.5 41.7 48.4 50.4 55.9 55.1 49.6 44.4 34.6 35.3 43.1 1957 25.9 33.2 39.4 42.2 50.2 52.6 54.5 53.8 51.4 44.3 34.9 38.5 43.4
49

MONTHLY MIN TEMP
50

degF
degF
MIN TEMP GRAPHS
JANUARY MINIMUM TEMPERATURE 45.0
AVERAGES 1961-90 33.7 deg
40.0
35.0
1874-1995 33.9 deg- r-
,.J A~N Ai ~ ~ J ~ ~.~ IL•l ~ I\
llc\J
·~ \l , ... r
30.0
25.0 ..... ............... ................................. . ................. .... ........ . ..... . ........................ .. .............................. ..... r
20.0 1870 1895 1920 1945 1970 1995
FEBRUARY MINIMUM TEMPERATURE 45.0
I ~ i
' !
M ~I) ~ r1JI ~ ~ ~,A /!. lA ~
40.0
l'!. II 11 H .\ Y\ ll rvr 1/
~~Y I
~ \ ..
• 35.0
30.0 ··············· ........... ................................. ............... · ··········· ·····A:v:E.RAo'Es·· ······················· ····· ... r-
25.0 1870
1961-90 36.1 deg 1874-1995 36.2 deg
l ~ I
1895 1920 1945 1970
MARCH MINIMUM TEMPERATURE
1995
50.0~--------~------~~------~---------r--------~
.. 45.0
degF ·---· ···-····--····-r-···· .. --·············--·--r
40.0
35.0;---~----+L----~A~V~ERA~G~E~S~----+-~+-~~~-------4+
1961-90 38.6 deg 1874-199~ 39.2 deg
30.0,_~~~~+-~~~~~~~~-+~~~-r~-r~~~~
1870 1895 1920 1945 1970 1995
51

MIN TEMP GRAPHS
degF
degF
45.0
APRIL MINIMUM TEMPERATURE
41.3 deg 1874-1995 42.6 deg
35.0+-~~~~~~-T-r-r~~~~+-r-~~~~-r-r~~
1870 1895 1no 1945 1970 1995
MAY ~MINIMUM TEMPERATURE ·. 54.0 ...,.. _......._ __ """r"----r-----.,..-----.-..,...----,..,..
50.0
46.0
AVERAGES
42.0 -r-----........,r--1961-90 47.0 deg --+----+-+------++ 1874-1995 47.7 deg
40.0-t-~~~~~~~-T~-r~~~+-r-r-~~~-T-r-r~
1870 1895 1920 1945 1970 1995
JUNE . MINIMU~ TEMPERATURE 58.0
AVERAGES l
56.0
54.0
52.0
50.0
1961-90 529deg 1 - ··········1874-1995 52.8 deg ............ i, ..... ···········~········· ·. .......................... .. ............................... i·r
i. ~A t ~ I : J
r~ ~ ~~ ~ \j ~ 't J'\ I~ t ~j, I
~ It ~ \ I It ~~ .II ..
·~ ~~ l\ i ~ 1/\~ r .II r : r i
48.0 : '·
I
1870 1895 1920 .··1945 1970 1995
52

degF
degF
degF
MIN TEMP GRAPHS
JULY MINIMUM TEMPERATURE 62.0
60.0
58.0
56.0
·:
.IP. ~
t i J ll ~
~~ N ~~ i,l • lA. N 'y .1"1 l ~.
lj I Ill
54.0
52.0
...... ~wJ~ ---lN-~~ ~-·········· AVERAGES ................................ I 1961-90 56.5 deg 1874-1995 56.4 deg
1870 1895 1920 1945 1970 1995
AUGUST MINIMUM TEMPERATURE 61.0 ..,...-------.-----....------.-----....-------,...,-
t t 59.0 +------ttt---11-~~+t--~~~~ ....-+-~ -~~~ -1\--!+i
57
.
0
t:tJ~ttt~~~~Vf\ld~~~~~=~rclo,~1Jtlc1f~11tlm"'rr·FJtj 55. o +-+ J'l'ri-:HY\~'11&.1 • r=-~--m.~ ............... !----++--+U.I~~I#--H--t-=----~ ............... ,....._;..j-
53. O -t--t-' J--il-t--+---=--- AVERAGES 1961-90 56.9 deg 1874-1995 56.4 d~g
51.0 -t-....--.,........, ........... -+--,-.....,.....~-.-+-,.--.,---.---.---+-.--.....--.-....--t--,...--.---.--.....~ 1870 1895 1920 1945 1970 1995
SEPTEMBER MINIMUM TEMPERATURE 58.0
56.0 ~ t I'
54.0
52.0
50.0
.t A II
~ A~ ~v~ ~ '
AI \IV, t I r\t tat I
~I \l i/~ I ~- 1V1 v f! ~M 11 I H\ U r
:
A 1 1 v AVERAGES 48.0 1961-90 520 deg
1874-1995 52.1 deg 46.0 I !
I I
1870 1895 1920 1945 1970 1995
53

MIN TEMP GRAPHS
degF
degF
degF
OCTOBER MINIMUM TEMPERATURE 55.0 -r-------.----...--------r----...-------""!"-r
40_0 +---..-....- AVERAGES 1961-90 . 44.9 deg 1874-199.5 46.2 deg
35.0+-~-r-~~~~~~+-~~~-4~~~~+-~~~-4·
1870 1895 1920 1945 1995
NOVEMBER MINIMUM TEMPERATURE .50.0
45.0 ,. ~
_A n • J ~ ~ ~I ,] I~ ~ lA " A~ 40.0 .l'tf 35.0
30.0 1870
45.0 ,,
40.0 ~
35.0
'·
lA !~
30.0 .............. u ••
25.0 1870
~I ~.I ~ 1\-
m 'I ., \
AVEJGES. r
1961-90 39.5 deg 1874-199~ 40.1 deg
1895 ,1920 1945 1970
DECEMBER MINIMUM TEMPERATURE
,J ~ ."AM ~ v~\
!A A·~ ~ WA
~ , ~
J.ll v ~ vijv ............ ................................ ........... AVERAGES ........... .........
'. 1961-90 34,8 deg .. 1874-1995 36.2 deg '· I
"' I "
1895 1920 1945 1970
;-.54
~ ~ i ; ; I i : :
I I
1995
~ .~ rt ~ ~· ~~
; .. ..... .... ·····+·-
I ;
1995

MONTHLY MEANTHv1P
MONTHLY MEAN TEMPERATURES (1871-1995)
OFFICIAL RECORDS START NOVEMBER 1, 1871 1871 --- --- --- --- --- --- --- --- --- --- 45.3 38.1 -1872 38.0 42.3 49.3 45.6 56.4 62.7 66.1 64.2 59.5 52.5 41.7 41.9 51.7 1873 44.4 40.6 48.1 51.3 55.9 61.5 68.0 67.7 61.9 49.9 47.4 37.0 52.8 1874 42.9 42.7 45.1 53.9 59.7 60.2 68.3 63.5 60.6 55.8 45.1 43.2 53.4 1875 30.2 41.2 44.8 55.0 55.8 60.7 70.4 66.1 63.2 58.4 44.9 47.7 53.2 1876 39.6 45.3 45.0 50.1 54.8 64.0 65.8 62.8 63.0 57.8 47.4 40.4 53.0 1877 42.0 46.3 49.8 50.2 55.1 60.4 65.8 66.0 59.4 53.2 48.2 42.4 53.2 1878 41.2 45.2 51.0 51.0 56.6 63.6 64.0 65.9 59.2 51.2 46.6 39.5 53.0 1879 37.8 43.6 48.6 52.5 55.2 60.4 65.2 66.8 63.7 52.5 43.6 38.9 52.4 1880 41.6 38.4 41.8 50.1 53.6 60.5 65.6 63.8 60.0 53.4 42.3 39.8 50.9
1881 39.4 45.5 49.6 55.4 56.8 61.2 64.6 63.3 60.0 50.3 44.2 44.0 52.9
1882 40.3 38.6 44.8 49.3 57.6 64.6 67.2 66.1 61.5 51.9 44.5 46.5 52.7
1883 38.4 33.9 51.4 50.6 59.1 64.4 68.5 64.0 62.4 51.9 47.4 42.9 52.9
1884 39.8 36.9 46.7 55.2 61.2 64.3. 65.4 69.8 58.0 53.4 48.3 31.5 52.6
1885 36.6 47.4 53.2 54.9 61.7 62.1 70.2 67.6 62.4 57.6 49.2 43.9 55.6
1886 37.5 43.8 45.9 51.2 59.2 64.5 68.8 67.6 63.4 52.4 41.7 45.5 53.6
1887 42.2 32.0 49.8 50.8 58.8 60.9 66.4 65.4 60.6 54.2 44.6 42.4 52.3
1888 29.2 43.8 46.0 55.3. 62.4 62.9 67.6 69.0 66.0 56.3 43.9 43.7 53.8
1889 38.4 44.2 53.8 54.3 60.3 66.0 70.4 64.8 61.4 57.2 47.6 38.6 54.8
1890 31.8 38.5 45.2 52.4 60.6 61.8 65.5 65.9 62.4 52.6 47.2 43.0 52.2
1891 43.2 37.0 44.0 52.3 59.9 60.2 68.8 70.0 60.8 57.6 49.0 41.8 53.7
1892 39.9 43.4 49.9 49.0 59.0 62.2 64.7 66.8 62.9 53.2 45.7 38.3 52.9 1893 34.1 37.2 44.4 45.9 54.4 57.6 64.5 66.2 57.9 49.5 45.6 43.8 50.1
1894 40.4 37.6 44.0 49.6 55.5 58.8 67.2 69.2 60.0 52.5 48.6 39.5 51.9 1895 37.3 42.8 45.9 51.5 55.9 62.2 65.6 65.4 57.4 56.0 43.8 40.8 52.0 1896 42.8 46.2 45.5 47.0 52.0 61.2 70.1 66.3 61.0 55.9 38.6 4'3.9 52.6
1897 38.8 42.3 40.5 55.0 61.4 61.2 64.6 71.1 60.0 54.2 44.7 43.2 53.1
1898 39.0 45.7 43.8 51.6 56.6 62.5 66.4 68.2 62.8 53.0 43.9 37.5 52.6
1899 40.6 39.3 43.8 48.8 51.1 58.8 66.8 61.5 64.1 51.8 52.5 43.1 51.9
1900 44.0 41.8 51.8 52.2 56.8 63.5 66.6 63.1 60.0 52.2 45.8 44.8 53.5
1901 39.5 43.0 46.6 48.8 56.7 58.0 62.8 68.4 58.3 59.1 48.4 41.1 52.6
1902 38.4 44.6 45.0 49.0 56.2 61.4 65.2 66.8 62.0 56.6 46.1 40.4 52.6
1903 42.8 41.0 45.8 49.8 56.9 64.2 64.2 66.0 61.4 55.6 46.2 41.0 52.9
1904 42.1 41.2 43.4 54.8 57.6 62.9 67.0 67.4 63.6 56.5 51.4 43.3 54.3
1905 40.4 42.6 50.8 55.4 56.2 61.4 68.5 66.2 62.0 51.3 44.4 40.6 53.3
1906 43.0 45.0 45.4 55.6 56.9 60.0 72.3 68.2 61.8 55.6 46.2 43.1 54.4
1907 34.0 45.2 44.9 52.2 59.2 62.6 67.9 64.6 62.8 57.3 48.8 44.0 53.6
1908 42.2 42.8 46.3 52.8 52.8 61.2 69.7 66.0 60.0 52.9 48.8 39.0 52.9
1909 32.8 43.3 47.6 51.0 54.8 62.7 63.9 65.0 63.2 54.6 47.2 35.6 51.8 1910 37.6 39.3 52.2 53.8 60.0 60.3 67.1 63.9 60.0 56.0 46.8 42.9 53.3 1911 38.4 40.2 49.2 48.8 54.3 59.6 69.5 67.0 58.4 54.2 46.0 41.4 52.2
1912 41.4 45.3 46.4 49.9 59.2 63.6 67.4 65.8 62.2 51.6 47.1 41.4 53.4 1913 38.2 39.7 44.6 51.0 57.6 62.9 67.8 68.6 62.3 53.2 47.5 40.7 52.8
55

MONTHLYMEANTEMP
MONTHLY MEAN TEMPERATUREs cont.)
Year Jan ~ . Feb Mar Apr May June July Aug; Sep Oct Nov I>ec Ann
1914 ~ 45.8 43.4 51.2 53.7 61.1 61.4 68.6 68.0 59.4 57.4 47.0· 36.8 54.5
1915 39.2 45.4 52.6 55.6 57.7 62.6 67.2 71.2 62.4 55.8 45.4 42.0 54.8 ''·
1916 29.6 42.2 47.0 ' 53.0 54.8 62.0 64.2 68.0 62.5 53.2 43.7 38.1 51.5,
1917 39.6 41.5 42.6 49.4 54.6 61.8 69.0 70.3 63.1 57.3 50.6 48.4 54.0
1918 45.4 41.6 46.7 52.8 55.6 67.1 67.8 67.4 67.4 56.4 46.6 42.3 54.8
1919 42.2 42.6 48.2 53.4 57.2 60.6 68.0 68.6 62.5 50.9 45.0 33.6 52.7
1920 39.4 42.2 45.8 48.2 55.1 62.1 68.0 69.3 6(2 53.1 46.8 44.1 52.9 ,
-!1 1921 41.6 45.2 48.0 50.8 57.1 64.4 65.7 67.0 60.5 57.0 48.8 39.1 53.8' :
1922 35.2 39.9 43.3 48.7 58.0 65.5 68.2 67.2 63.8 55.4 43.6 38.0 ,· .52.2
1923 42.8 37.4 47.2 54.2 57.6 62.5 67.8 70.6 64.5 57.1 50.4 41.5 54.5
1924 38.5 48.0 45.8 53.0 61.2 64.3 67.0 66.5 63.4 54.6 45.6 36.6 53.7
1925 44.8 46.4 47.4 54.2 61.2 63.4 ' 69.8 66.0 62.9 55.8 46.0 45.8 55.3'
1926 42.8 48.7 53.5 60.2 59.2 67.0 70.5 69.2 61.6 57.8 50.6 41.0 56.8
1927 39.0 45.6 46.9 52.0 55.4 '64.4 68.6 69.2 61.9 54.9 49.8 37.8 53.8
1928 38.6 44.2 ~ 50.8 51.4 62.4 62.2 69.0 67.5 61.5 54.7 46.6 40.1 54.1
1929 34.2 35.6 47.7 49.2 58.6 62.4 68.4 69.1 64.8 58.5 44.8 45.3 53.2
1930 28.0 46.3 50.3 55.8 55.0 62.2 66.6 69.8 63.7 53.7 46.0 40.4 53.2 '
1931 44.7 45.0 48.8 55.6 62.7 63.6 70.1 69.2 62.8 55.8 44.0 40.2 55.2
1932 39.8 41.4 48.0 53.2 57.6 65.8 65.8 68.0 65.6 57.2 49.3 38.1 54.2
1933 39.8 38.2 47.0 51.6 53.9 62.3 68.0 69.6 59.6 57.2 46.5 46.6 53.4 1934 46.9 49.4 55.2 59.8 61.4 64.0 67.0 69.5 62.8 57.4 50.3 44.1 57.3 -1935 40.4 46.2 44.0 51.7 57.8 64.4 67.8 68.4 67.2 53.3 42.4 42.2 53.8 1936 44.2 33.9 45.3 55.6 61.2 65.2 67.8 69.5 63.4 58.6 45.6 43.8 54.5
1937 29.9 41.8 49.7 50.0 58.4 65.4 68.4 66.8 63.8 59.2 49.6 44.0 53.9 1938 41.4 43.4 47.0 54.4 59.4 64.9 71.0 66.2· 67.5 57.2 44.8 43.6 55.1
1939 43.8 40.8 49.4 56.0 60.6 61.3 69.4 70.0 65.4 56.6 50.0 46.4 55.8
1940 42.2 47.2 51.8 55.3 62.6 67.5 69.0 70.4 65.6 58.6 44.2 44.0 56.5
1941 41.3 46.1 52.0 54.4 57.6 62.1 71.4 67.8 60.4 54.6 48.0 42.9 54.9 1942 35.4 42.8 46.4 52.8 56.4 61.0 69.4 69.0 63.2 55.6 44.9 43.0 53.3 1943 33.2 43.4 45.5 54.3 55.6 60.3. 67.2 66.8 65.8 54.8 46.1 40.0 52.8
1944' 39.2 42.2 45.4 50.8 57.5 61.6 67.9 66.8 65.2 58.5 45.2 39.4 53.3
1945 42.4 44.4 45.2 50.4 58.8 61.8 69.0 67.9 60.8 54.2 45.1 39.8 53.3 1946 40.9 42.7 46.6 51.4 59.7 61.2 67.6 67.8 62.0 50.6 43.2 41.8 53.0 1947 37.2 45.2 49.8 53.9 61.3 62.0 66.8 65.8 63.6 55.4 47.0 42.9 54.2
1948 39.5 40.8 44.8 48.9 56.0 66.5 66.8 65.8 61.8 53.5 43.7 38.1 52.2 1949 27.6 39.1 45.7 52.4 59.2 61.7 65.9 66.5 63.2 48.6 49.9 41.4 51.7 1950 27.0 38.8 45.1 48.6 54.5 61.8 66.9 68.8 61.8 52.4 46.4 46.4 51.5 i.
1951 39.8 42.9 42.0 53.5 56.8 64.5 67.1 65.7 63.1 53.7 45.7. 37.5 52.7 1952 35.6 41.7 45.4 52.4 57.5 60.3 68.0 67.9 64.8 58.7 40.7 41.6 52.9
1953 47.3 43.8 45.9 49.9 54.4 58.6 66.2 65.6 62.5 54.3 48.6 43.7 53.4 1954 39.0 42.6 43.8 49.6 56.7 58.0 63.1 63.3 60.2 53.1 49.7 40.9 51.7 1955 39.7 40.4 41.5 46.5 52.9 60.7 63.5 65.5 60.4 53.6 41.4 39.2 50.4 1956 39.9 35.9 44.2 52.7 59.1 59.0 68.0 65.4 60.8 51.7 42.6 40.7 51.7 1957 31.2 41.7 46.2 51.8 58.9 62.1 65.6 64.5 65.3 52.8 44.0 43.9 52.3
56

MONTHLY MEANTE:rviP
57

WARMEST/COLDESTMONTHS
MONTHLY and ANNiJAL TEMPERATURE DATA WARMEST AND COLDEST S*
A VERAGEMAXIMUM Wannest 5 . Coldest 5
JAN
FEB
52.0 1953 51.5 1934 .5t.2 1981 50.5 1992 .50.4 . 1983 NORMAL
57.8 1968 57.7 1991 56.4 1934 .56.2 1992 55.3 1963 NORMAL
MAR 64.0 1934 63.9 1889 63.7 1992 63.5 1941
'63.4 1926 NORMAL
APRIL . 70.4 1926 70.0 1934 68.3 1885 66.8 1989 66.6 1875 NORMAL
MAY · 76.6 1992 75.1 1881 74.5 1885 74.1 1928 73.6 1884 NORMAL
JUNE 79.5 1992 79.4 "1889 79.3 1987 79.2 1940 78.8 1918 NORMAL
JULY 87.5 1985 84.8 1906
.. 84.6 1994 84.5 1941 84.4 1889 NORMAL
32.6 1930 32.8 1950 34.1 1916 34.4 1937 34.5 1949 45.4deg
38.4 1887 38.9 1936 40.9 1956 41.9 1929 42;0 .1883 5l.Odeg
45.7 1897 48.5 1880 48.6 1917 48.7 1904 49.2 1955 56.0deg
51.1 1893 54.1 1896 55.0 1955 55.8 1920 55.9 1963 60.6deg
57.5 1899 . 59.6 1896 60.9 1908 61.0 1933 61.6 1962 67.1deg
65.3 1893 65.4. 1901 66.2 1954 66.3 1894 66.4 1953 74.0deg
72.0 1963 72.2 1955 72.6 1954 72.7 1916 . 72.8 ·1901 79.9deg
A VERAGEMINIMUM Wannest 5 Coldest 5 .
42.6 1953 42.3 1934 41.4 1918 41.2 1914 40.3 1925 NORMAL
42.9 1926 42.6 1958 42.5 1934 42.4 1940. 42.2 1924 NORMAL
46.4 1934 44.5 1940 44.2 1914 44.1 1928 43.7 1889 NORMAL
50.0 1926 49.5 1934 47.5 1881 47.1 1940 46.6 1936 NORMAL
52.1 1934 51.9 1940 51.7 1936 51.4 192.5
. 50.9 1993
. NORMAL
57,1 1948 56.9 1969 56.8 . 1958 56.5 1936 56.2 1926 NORMAL
60.7 1985 59.8 1906 59~5 1995 59.2 1938 59.0 1908 NORMAL
58
21.0 1949 21.2 1950 22.0 1888 ... 23.5 1930 24.6 1875 33.7deg
25.7 1887 25.8 1883 28.5 1989 28.9 1936 29.4 1929 36.1 deg
33.6 1954 33.8 1955. 34.1 1969 34.5 1951 35.0 1880 38.6deg
37.4 1964 37.6 1967 37.9 1955 38.0 1975 38.2 1968 41.3deg
41.9 1964 42.8 1955 43.2 1950 44.0 1965 44.3 1966 47.0deg
49.0 1964 49.7 1965 49.9 1976 50.1 1877 50.2 1899 52.9deg
52.9 1901 53.1 1964 53.4 1878 53.5 1954 53.8 1962 56.5deg
:MEAN Warmest 5 Coldest 5
47:3 .1953 46 .. 9 1934 45.8 1914 45.4 1918 44.8 1925 NORMAL
49.4 1934 48.8 1991 48.7 1926 48.6 1958 48.2 1968 NORMAL
·55.2 1934 53.8 1889 53.5 1926 53.2 1885 52.6 1915 NORMAL
60.2 1926 59.8 1934 56.0 1989 55.8 1930 55.6 1936 NORMAL
63.1 1992 62.7 1931
' 62.6 1940 62.4 1928 61.8 1958 NORMAL.
' 67.5 1940 67.4 .1992 67.1 1918 67.0 1926 66.5 1987 NORMAL
74.1 1985 72.3 1906 71.4 1941 71.2 1990 71.1 1994 NORMAL
27..0 1950 I
27.6 1949, 28.0 1930 29.2 1888 29.6 1916 39.6 deg · ·· >i
32.o 1881 33.9 1936. ;: 35.6 i929' -:.• 35.9 1956 36.0 1989 43.6.deg
40.5 1897 41.5 1955 41.8 1880 42.0 1951 42 .. 6 1917 47.3deg
45.6 1872 45.9 1893 46.5 1955 46.7. 1964 ·46.9 1967 51.0deg
51.1 1899 52.0 1896 52.6 1964' 52.8 1908 52.9 1955 57,1 deg.
57.6 1893 58.0 1~54 58.6 1953 58.7 1964 58.8 1894 63.5cleg
62.8 1901 63.1 1963 63.5 1955 63.9 1909 64.0 1878 68.2deg
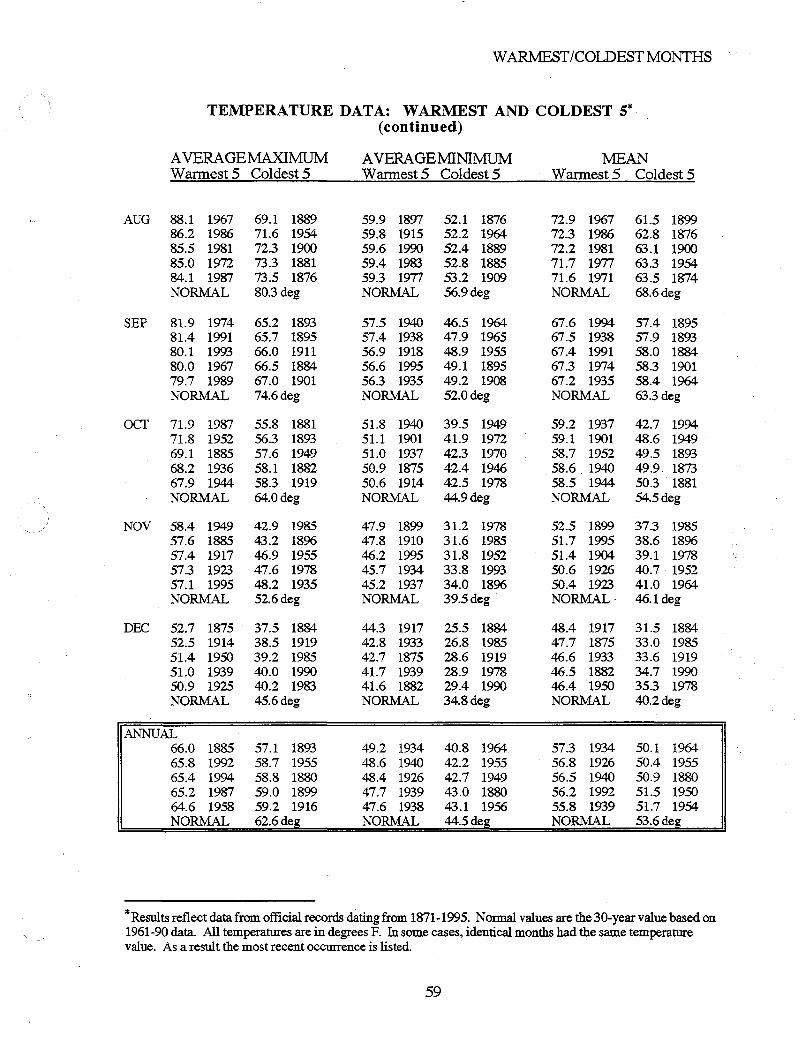
WARMEST/COLDESTMONTHS
TEMPERATURE DATA: WARMEST AND COLDEST 5* (continued)
AVERAGEMAXIMUM Warmest 5 Coldest 5
AUG 88.1 1%7 86.2 1986 85.5 1981 85.0 1972 84.1 1987 NORMAL
SEP 81.9 1974 81.4 1991 80.1 1993 80.0 1967 79.7 1989 NORMAL
ocr 71.9 1987 71.8 1952 69.1 1885 68.2 1936 67.9 1944 NORMAL
NOV 58.4 1949 57.6 1885 57.4 1917 57.3 1923 57.1 1995 NORMAL
DEC 52.7 1875 52.5 1914 51.4 1950 51.0 1939 50.9 1925 NORMAL
ANNUAL 66.0 1885 65.8 1992 65.4 1994 65.2 1987 64.6 1958 NORMAL
69.1 1889 71.6 1954 72.3 1900 73.3 1881 73.5 1876 80.3deg
65.2 1893 65.7 1895 66.0 1911 66.5 1884 67.0 1901 74.6deg
55.8 1881 56.3 1893 57.6 1949 58.1 1882 58.3 1919 64.0deg
42.9 1985 43.2 1896 46.9 1955 47.6 1978 48.2 1935 52.6deg
37.5 1884 38.5 1919 39.2 1985 40.0 1990 40.2 1983 45.6deg
57.1 1893 58.7 1955 58.8 1880 59.0 1899 59.2 1916 62.6deg
A VERAGEMINIMUM Warm est 5 Coldest 5
59.9 1897 52.1 1876 59.8 1915 52.2 1964 59.6 1990 52.4 1889 59.4 1983 52.8 1885 59.3 1977 53.2 1909 NORMAL 56.9deg
57.5 1940 46.5 1964 57.4 1938 47.9 1965 56.9 1918 48.9 1955 56.6 1995 49.1 1895 56.3 1935 49.2 1908 NORMAL 52.0deg
51.8 1940 39.5 1949 51.1 1901 41.9 1972 51.0 1937 42.3 1970 50.9 1875 42.4 1946 50.6 1914 42.5 1978 NORMAL 44.9deg
47.9 1899 31.2 1978 47.8 1910 31.6 1985 46.2 1995 31.8 1952 45.7 1934 33.8 1993 45.2 1937 34.0 1896 NORMAL 39.5deg
44.3 1917 25.5 1884 42.8 1933 26.8 1985 42.7 1875 28.6 1919 41.7 1939 28.9 1978 41.6 1882 29.4 1990 NORMAL 34.8deg
49.2 1934 40.8 1964 48.6 1940 42.2 1955 48.4 1926 42.7 1949 47.7 1939 43.0 1880 47.6 1938 43.1 1956 NORMAL 44.5deg
MEAN Warmest 5 Coldest 5
72.9 1967 72.3 1986 72.2 1981 71.7 1977 71.6 1971 NORMAL
67.6 1994 67.5 1938 67.4 1991 67.3 1974 67.2 1935 NORMAL
59.2 1937 59.1 1901 58.7 1952 58.6. 1940 58.5 1944 NORMAL
52.5 1899 51.7 1995 51.4 1904 50.6 1926 50.4 1923 NORMAL·
48.4 1917 47.7 1875 46.6 1933 46.5 1882 46.4 1950 NORMAL
57.3 1934 56.8 1926 56.5 1940 56.2 1992 55.8 1939 NORMAL
61.5 1899 62.8 1876 63.1 1900 63.3 1954 63.5 1874 68.6deg
57.4 1895 51.9 1893 58.0 1884 58.3 1901 58.4 1964 63.3 deg
42.7 1994 48.6 1949 49.5 1893 49.9. 1873 50.3 . 1881 54.5deg
37.3 1985 38.6 1896 39.1 1978 40.7 1952 41.0 1964 46.1 deg
31.5 1884 33.0 1985 33.6 1919 34.7 1990 35.3 1978 40.2deg
50.1 1964 50.4 1955 50.9 1880 51.5 1950 51.7 1954 53.6deg
*Results reflect data from official records cbttingfrom 1871-1995. Normal values are the30-yearvalue based on 1961-90 data. All temperatures are in degrees F. In some cases, identical months had the same temperatme value. As a result the most recent occurrence is listed.
59

EXTREME MAX TEMP
MONTHLY_ EXTREME_ MAXIMUM TEMPERATURES (187lml995)
OFFICIAL RECORDS START NOVEMBER 1, 1871 1871 I . 1872 Maximum Temperature Data missing; from 1871-June 1874 1873 1874 --- --- --- --- --- 82 88 84 88 77 63 51 ---1875 53 54 83 75 82 82 96 88 86 78 63 63 96 1876 58 59 59 67 82. 99 90 84 90 79 63 . 56 99 1877 58 62 68 78 79 86 91 89 88 73 62 62 91 1878· 55 58 69 74 86 97 85 87 86 70 62 59 97 1879 52 60 74 77 82 82 92 87 85 68 61 58 92 1880 57 .. 52 58 85 76 90 92 88 80 74 64 63 92
,. 1881 51 63 76 80 82. 85 90 85 84 64 58 58 90 1882 55 52 70 78 85 94 95 91 85 67 60 60 95 1883 56 60 15 74 84 87. 94 80 87 64 60 56 94 1884 59 65 67 80 90 89 84 94 72 72 63 .55 94 1885 55 59 72 82 94 86 99 94 85 82 65 59 99 1886 60 65 79 74 89 95 94 90 93 76 . 58 65 95 1887 58 63 75 69 99 95 93 90 87 75 68 57 99 1888. . 62 61 6& 84 91 87 97 92 90 82 58 59 97 1889 55 64 78 77 88 94 96 87 89 80 64 53 96 1890 55 60 66 85 87 82 95 96 84 72 73 57 96 1891 61 48 60 72 84 87 102 97 . 88 83 68 58 102 1892 58 60 76 76 93 94 88 90 90 82 62 55 94 1893 56 53 62 62 78 81 92 94 77 67 62 58 94 1894 61 54 67 76 89 90 94 94 89 73 57 56 94 1895 57 58 66 82 86 97 94 91 79 79 63 57 97 1896 61 62 68 67 81 90 93 91 89 78 60 62 93 1897 57 58 56 89 93 83 92 95 89 81 66 59 95 1898 50 61 63 81 85 90 95 97 88 70 57 55 97 1899 58 59 61 73 68 81 93 84 87 77 66 58 93 1900 61 57 .76 84 78 90 90 81 87 74 63 60 90 1901 57 68 67 70 87 87 83 94 85 78 62 56 94 1902 61 66 62 72 90 86 95 97 87 82 62 58 97
1903 57 59 72 73 84 97 91 90 86 77 65 54 97 1904 58 58 61 87 .81 99 . 100 95 87 80 67 55 100 1905 58 68 77 84 83 83 99 90 87 69 66 54 99 1906 56 59 70 90 89 92 101 89 84 83 65 60 101 1907 55 60 67 79 93 91 102 86 93 80 66 59 102 1908 54 60 66 82 77 92 92 94 86 79 70 54 94 1909 59 60 70 78 86 90 88 91 93 80 63 58 93 1910 53 56 74 89 86 94 97 91 82 75 65 56 97 1911 54 52 75 79 84 87 99 90 82 78 63 55 99 1912 58 60 71 72 89 93 96 93 84 72 61 54 96 1913 54 63 67 76 84 87 98 93 87 75 60 55 .. 98
60

EXTREME MAX TEMP
MONTHLY EXTREME :MAXIMUM TEMPERATURES (cont.) Year Jan Feb Mar Apr May June July Aug Sep Oct Nov Dec Ann 1914 62 57 71 76 87 94 94 93 84 72 64 51 94 1915 50 60 79 82 81 95 100 97 84 74 59 55 100 1916 54 58 68 73 81 92 86 96 85 73 58 51 96 1917 55 61 59 67 78 90 91 92 83 85 66 65 92 1918 59 59 76 82 79 91 91 94 90 78 60 61 94 1919 61 53 73 75 82 83 100 96 85 78 65 61 100 1920 57 60 62 78 87 87 97 98 89 73 61 58 98 1921 57 64 69 73 80 83 89 90 78 79 68 62 90 1922 52 56 63 72 94 89 95 92 93 78 56 61 95 1923 56 62 82 85 85 94 93 95 95 86 67 55 95 1924 60 64 60 80 88 98 99 88 92 71 59 60 99 1925 58 60 65 79 88 101 90 96 90 78 60 62 101 1926 60 65 76 93 87 99 104 91 90 77 69 63 104 1927 56 57 68 81 86 92 101 96 84 75 70 59 101 1928 59 60 76 74 93 86 99 88 90 74 61 59 99 1929 51 52 66 75 82 89 93 95 87 80 67 59 95 1930 54 63 83 77 78 94 92 96 97 69 69 55 97 1931 64 58 65 86 93 91 101 96 89 79 67 59 101 1932 54 68 67 75 81 91 86 95 91 86 67 57 95 1933 58 58 63 76 80 91 94 102 82 81 62 60 102 1934 59 62 76 90 90 88 88 95 95 85 68 57 95 1935 65 58 62 75 83 96 105 100 93 81 55 55 105 1936 55 56 67 85 89 85 88 97 88 88 64 58 97 1937 44 60 66 67 84 92 89 92 97 79 63 60 97 1938 56 57 69 75 89 92 101 86 95 78 57 61 101 1939 58 53 76 84 96 86 100 100 88 80 66 62 100 1940 60 58 72 82 91 98 92 99 88 78 59 62 99 1941 55 61 75 79 86 95 103 96 80 71 66 60 103 1942 54 55 74 77 80 100 105 96 91 81 59 57 105 1943 52 63 61 82 82 88 91 91 91 83 62 57 91 1944 55 57 68 79 90 90 104 95 101 78 60 58 104 1945 62 60 61 75 89 91 93 100 92 84 59 64 100 1946 55 58 69 79 85 86 102 93 86 71 58 57 102 1947 58 62 80 86 92 85 91 88 91 76 63 55 92 1948 52 65 72 70 85 93 92 85 94 73 55 52 93 1949 41 62 61 74 86 87 93 93 91 68 68 56 93 1950 48 61 62 77 85 88 90 93 91 72 60 64 93 1951 58 62 63 81 85 97 93 94 91 79 64 51 97 1952 57 59 65 76 85 83 98 99 96 89 62 56 99 1953 60 58 72 70 86 80 91 95 88 77 61 59 95 1954 58 60 63 73 86 84 82 82 83 72 69 54 86 1955 52 55 60 73 77 95 86 90 98 75 61 60 95 1956 57 50 70 84 89 81 102 89 85 81 58 58 102 1957 54 62 62 87 83 79 87 86 92 72 60 58 92
61

EXTREME MAX TEMP
MONTHLY EXTREME MAXIMUM TEMPERATURES (cont.) Year Jan Feb. Mar Apr May June July. Aug Sep Oct Nov Dec Ann 1958 62 . 66 67 77 89 95 102 95 97 84 61 62 102 1959 57 61 65 . 77 83 86 98 88 89 73 62 . 59 98 .•
.1960 58 57 73 77 79 86 97 100 89 78 61 54 100-1961 59 60 65 71 91 94 104 98 83 80 61 .59 104 1962 59 59 69 80 70 85 92 87 93 75 67 58 93 . 1963 55 65 67 70 91 90 83 93 89 74 59 52 93
,1964 53 60, 74 67 84 83 89 94 81 80 56 59 94 1965 55 61 72 80 78 93 107 91 88 82 63 60 107 1966 55 60 74 75 87 95 89 93 91 81 66 58 95 1967 58 62 61 66 87 91 99 102 94 73 63 58 102 1968 56 70 67 81 79 93 99 92 92 72 62 52 99 1969 53 57 73 72 88 97 91 88 92 74 7o 56 97 1970 61 64 65 66 86 98 102 97 88 90 69 59 102 1971 60 62 65 76 91 90 97 101 82 82 60 55 . 101 1972 58 62 72 78 92 88 97 104 97 78 63 61 104 1973 59 63 68 74 92 93 99 94 97 70 58 56 99 1974 62 56 70 75 78 90 94 95 96 81 66 60 96 1975 59 64 63 72 88 90 95 87 92 86 73 60 95 1976 58 60 66 82 84 89 92 86 87 82 68 54 92 1977 56 68 64 79 76 88 93 105 88 72 63 61 105 1978 55 64 71 74 84 91 98 101 80 78 61 54 101 1979 49 57 73 83 88 92 104 88 92 86 64 62 104 1980 55 59 64 81 79 80 101 95 93 90 69 64 101 1981 60 64 67 79 82 87 95 107 99 72 67 57. 107 1982 55 65 73 79 85 100 91 99 91 76 62. 60 100 1983 58 63 67 78 100 88 93 91 80 72 62 .55 100 1984 62 58 68 79 80 87 100 95 85 82 61 51 100 1985 53 61 66 79 88 96 101 93 82 78 65 48 101 1986 63 68 70 78 92 96 88 100 91 77 64 53 100 1987 55 61 71 86 93 95 93 102 94 92 68 60 102
.,.,._
1988 58 71. 71 80 88 89 100 101 105 91 63' 60 105 1989 60 54 64 81 80 93 87 87 92 78 65 61 93 1990 61 64 71 82 86 93 99 101 93 72 63 55. 101 1991 62 67 71 78 75 83 100 92 94 86 63 54 100 1992 60 64 71 80 93 100 101 101 86 75 59 52 101 1993 59 58 67 70 87 86 85 97 93 84 62 65 97 1994 57 55 77 76 85 84 103 93 93 78 56 59 103 1995 62 67 72 79 87 97 99 92 92 75 67 63 .99
lii~~;i~tlmllllln;;;l~ Monthly EXTREME MAXIMUM TEMP ALL YEARS (1874-1995) . jllmlli~Iijlliilllil;j; Temp 64 71 83 93 100 101 107 107 105 92 73 65 107 Year 1931 1988 1930 1926 1983 1925 1965 1981 1988 1987 1975 1993 1981
~~illll~~~~~~~lllli~llil Monthly EXTREME MAXIMUM TEMP (1941-1995) AUG Temp 63 71 80 87 100 100 107 107 105 92 73 65 107 Year 1986 1988 1947 1957 1983 1992 1965 1981 1988 1987 1975 1993 198i
.62

EXTREME MIN TEMP
MONTHLY EXTREME MINIMUM TEMPERATURES (1871-1995)
OFFICIAL RECORDS START NOVEMBER 1, 1871 1871 I I 1872 Minimum Temperature Data missine from 1871-June 1874 1873 1874 --- -- --- --- -- 43 50 46 30 32 27 31 ---1875 3 24 34 28 40 39 46 46 44 36 28 33 3 1876 20 32 33 33 36 45 49 43 44 42 34 24 20 1877 27 25 31 35 38 44 47 48 39 31 32 25 25 1878 18 33 31 32 33 44 49 47 43 33 32 23 18 1879 20 25 33 36 41 44 48 50 44 37 25 3 3 1880 26 26 26 33 35 42 46 46 42 34 22 19 19 1881 24 26 31 40 40 45 46 46 40 32 29 29 24 1882 26 18 29 31 36 48 47 44 39 37 28 31 18 1883 8 7 34 36 40 44 48 44 45 37 34 24 7 1884 25 7 28 40 40 47 48 51 43 36 34 12 7 1885 17 32 33 35 40 42 49 48 41 34 34 27 17 1886 15 31 30 36 36 46 50 48 44 34 26 30 15 1887 29 9 31 31 34 44 46 45 40 33 25 29 9 1888 -2 30 24 32 38 48 46 52 44 37 31 31 -2 1889 24 23 35 33 42 43 46 46 38 38 32 25 23
1890 12 10 24 32 40 45 48 48 40 35 30 28 10 1891 25 25 23 37 39 42 50 51 39 40 34 28 23
1892 26 27 36 33 39 42 47 47 42 38 33 20 20 1893 12 8 32 32 40 44 48 46 43 33 28 28 8 1894 27 18 30 34 32 43 49 48 44 39 32 27 18 1895 25 28 27 32 36 44 47 44 36 31 27 30 25 1896 23 29 20 34 37 43 53 55 42 40 11 27 11
1897 22 30 23 36 40 41 50 51 42 37 29 27 22 1898 25 32 27 32 39 43 48 52 44 41 29 21 21 1899 20 9 31 31 38 39 51 46 46 34 38 30 9 1900 28 19 35 34 43 49 48 45 41 37 19 25 19 1901 26 28 34 33 41 43 45 50 41 44 35 26 26 1902 13 25 30 34 41 43 46 44 39 42 31 30 13
1903 29 24 30 34 39 45 48 49 41 38 31 29 24 1904 30 29 30 32 38 45 43 48 42 40 37 28 28 1905 25 17 32 37 41 48 51 46 45 32 30 27 17 1906 31 31 22 34 40 43 54 48 41 35 30 29 22 1907 13 28 32 35 41 46 52 49 46 44 34 32 13 1908 27 25 30 34 38 42 51 46 35 35 32 23 23
1909 6 33 34 36 37 43 47 46 41 40 28 24 6 1910 21 23 33 34 44 44 51 48 45 40 34 31 21 1911 23 27 31 30 39 43 47 51 43 34 24 29 23
1912 20 32 30 34 43 45 53 50 42 38 31 30 20
/ 1913 22 26 29 36 41 47 51 50 44 38 34 30 22
63

EXTREME MIN TEMP
MONTHLY EXTREME MINIMUM TEMPERATURES cont.)
Year Jan Feb Mar Apr May June July Aug Sep Oct Nov Dec Ann 1914 33 28 38 37 40 42 50 49 45 43 33 22 22 1915 26 30 38 37 36 47 54 54 46 38 32 26 26 1916. 13 22 32 36 36 41 50 46 45 34 29 24 13 1917 22 30 29 37 39 43 50 51 50 34 34 34 22 1918 24 22 31 32 40 44 48 48 45 38 34 25 22 '
1919 23 33 33 34 39 44 49 50 44 30 26 3 3. 1920 23 30 32 35 38 43 50 44 48 38 34 31 23 ·.
1921 27 31 34 32 40 50 46 50 44 42 29 21 21. 1922 16 22 30 35 37 46 49 52 .48 39 28 18 16 1923 26 14 27 39 40 48 52 53 45 39 32 17 14 1924 14 32 32 32 41 46 50 47 43 37 30 11 11 1925 29 34 ·32 38 45 47 52 47 48 .. 38 29 32 29 1926 .. 31 37 35 41 42 48 51 54 43 41 36 ·19 19 . 1927 12 31 34 34 43 46 53 49 47 34 34 14 12 1928 15 31 32 37 40 48 50 52 43 35 31 25 15 1929 15 16 33 33 43 47 53 50 45 38 30 34 15 1930 13 31 33 38 37 45 50 51 44 38 29 28 13
1931 30 32 33 37 40 47 53 52 45 39 25 25 25 1932 22 22 31 38 41 46 49 54 46 40 33 16 16 1933 23 12 33 34 43 45 52 52 40 38 35 34 12 . 1934 34 33 38 39 43 47 52 53 39 42 39 34 33 1935 12 29 32 36 41 42 49 49 50 29 23 28 12 1936 27 14 31 31 41 51 53 52 44 36 30 27 14 1937 14 19 36 38 39 47 50 48 44 44 38 32 14 1938 26 31 34 38 40 46 50 49 53 39 32 29 26 1939 33 24 32 38 40 47 52 49 47. 38 35 28 24 1940 27 32 39 40 44 46 51 52 46 41 30 29 27.
1941 28 28 30 37 38 46 49 51 43 39 28 24 27 1942 19 26 31 37 38 45 51 48 40 37 29 31 19 1943 3 29 31 36 37 45 48 48 42 39 32 27 3 1944 27 27 24 34 37 . 43 47 48 42 40 28 25 24 1945 24 28 29 31 43 43 47 48 37 35 29 22 22 1946 27 27 31 32 40 46 49 48 38 26 28 20 20 · ..
1947 18 25 30. 34 41 45 50 46 40 42 29 31 18 '
1948 24 24 30 32 34 52 48 50 41 32 29 22 22 1949 9 23 31 32 36 41 48 45 40 27 29 28 9 1950 -2 -3 28 31 38 45 48 48 36 33 26 35 -3 1951 16 26 26 29 37 46 48 44 39 31 31 22 16 1952 20 28 28 32 33 42 47 49 42 37 18 25 18 1953 29 27 28 31 37 43 48 48 38 33 31 33 27 1954 19 25 23 31 29 42 45 48 35 32 27 30 26 1955 29 20 19 29 36 44 43 45 38 38 13 23 13 1956 13 16 24 30 36 46 48 48 42 35 22 23 13 1957 6 22 27 32 43 46 46 47 39 34 26 32 6
64

EXTREME MIN TEMP
MONTHLY EXTREME MINIMUM TEMPERATURES cont.)
Year Jan Feb Mar Apr May June July Aug Sep Oct Nov IX:c Ann
19.58 26 27 27 34 36 50 51 50 42 30 23 27 23
1959 16 29 31 33 38 45 47 46 43 31 25 22 16 1960 22 19 22 33 33 47 47 47 41 33 30 23 19 1961 23 35 30 33 39 42 49 51 34 32 23 21 21 1962 9 20 28 35 34 44 44 46 42 38 31 22 9 1963 11 32 28 33 36 44 46 47 44 30 26 20 11
1964 28 23 29 30 32 42 47 46 39 32 25 6 6 1965 29 29 25 32 35 41 50 46 34 36 32 19 19 1966 24 26 29 32 37 39 52 48 46 34 33 32 24 1967 31 27 25 31 39 46 52 51 43 36 25 13 13
1968 24 26 27 30 38 45 48 49 44 35 31 8 8 1969 16 23 22 33 36 50 49 46 42 31 28 24 16 1970 23 31 29 30 37 45 50 45 36 29 27 26 23
1971 20 23 22 30 40 45 46 52 40 26 27 23 20 1972 18 18 29 30 37 47 49 51 39 30 30 8 8 1973 22 26 33 33 40 44 50 45 44 37 29 30 22 -1974 12 29 25 34 39 45 49 48 43 35 31 28 12 1975 26 27 27 30 37 45 51 48 42 36 29 26 26 1976 26 24 25 31 41 42 46 49 45 33 22 23 22 1977 17 28 29 31 40 41 46 51 42 37 27 26 17· 1978 23 27 28 33 35 47 49 48 44 31 18 13 13 1979 14 16 33 38 42 44 47 52 45 38 30 28 14 .
1980 13 25 33 31 42 45 53 44 44 33 33 22 13
1981 28 25 28 31 40 48 45 50 43 34 26 29 25 1982 14 21 31 31 37 47 49 47 43 35 24 22 14 1983 25 28 34 33 43 49 50 51 37 36 29 12 12 1984 19 30 32 36 42 46 50 50 42 35 31 18 18 1985 21 15 27 36 37 45 53 50 39 30 13 20 13
1986 28 25 33 33 37 46 47 50 42 39 30 27 25 1987 23 25 32 34 43 45 51 50 45 37 28 23 23
1988 22 22 29 32 38 42 48 50 44 35 31 26 22 1989 28 9 19 33 42 47 51 51 44 32 32 25 9
1990 26 20 29 36 38 49 51 50 47 37 32 12 12 1991 20 30 32 33 40 42 52 49 47 27 30 26 20 1992 29 29 31 37 39 46 54 47 42 33 31 27 27 1993 20 24 31 38 42 47 50 48 42 39 18 25 18 1994 27 22 29 36 41 46 51 51 49 38 28 24 22 1995 29 16 28 35 43 47 52 48 48 28 29 28 16
tt~tt~~;m~~~~r Monthly EXTREME MINIMUM TEMP ALL YEARS (187 4-1995 ~r~~fl~t~~llllj~f Temp -2 -3 19 28 29 39 43 44 30 26 11 3 -3 Year 1950 1950 1989 1875 1954 1966 1955 1980 1874 1971 1896 1919 1950
~i~i~~~~t~~~~~~fltj Monthly EXTREME MINIMUM TEMP (1941-1995) FEB Temp -2 -3 19 29 29 39 43 44 34 26 13 6 -3 Year 1950 1950 1989 1955 1954 1966 1955 1980 1965 1971 1985 1964 1950
65

FIRST AND LAST HIGHS
FIRST AND LAST OCCURRENCE OF HIGH TEMPERATURE OF AT LEAST ...
tttrrrr 70 De2rees 80 De2rees 90 De2rees 100 De2rees Year First Date Last Date First Date Last Date First Date Last Date First Date Last Date 1875 73 4/10 75 10/14 80 4/12 80 9/25 90 7/4 90 7/26 - - - -1876 72 517 72 10/14 82 5/8 82 9/30 92 6/16 90 9/1 - - ·- -1877 74 4/25 73 10/17 80 6/8 83 9/2 90 7/15 91 7/16 - ~ -1878 72 4/1 70 10/4 82 517 86 9/10 90 6/5 92 6/19 ~ - - -1879 74 3/31 71 9/26 82 5/31 80 9/20 91 7/25 92 7/26 - - -·· -1880 77 4/8 74 10/4 80 4/28 80 9125 90 6/27 92 7/16 -'- - - -· 1881 76 3/29 72 9/22 80 4/2 81 9/14 90 7/23 90 7/23 - - - -1882 70 3/30 77 9/26 80 5/21 82 10/7 94 6/2 91 8/30 - - - -1883 71 3/14 74 9/23 84 5/10 87 9/21 90 7/5 94 717 - - ....; -1884 73 4/5 72 10/17 80 4/7 87 8/29 90 5/31 90 8/8 - "- -· -1885 70 3/14. 70 10/21 80 4/10 80 9/30 94 515 90 8/28 - - - -1886 79 3/29 76 10/3 81 5/16 81 9/29 95 6/2 90 9/12 - ...: - .. -1887 75 3/22 71 10/30 80 5!15 84 9/28 90 5/17 90 8/10 - - - -1888 77 4/11 72 10/11 84 4/19 82 10/5 91:. 5/28 90 9/2 -'-
I• - ~ -1889 70 3/4 70 10/21 82 5/10 80 10/4 94 6/2 91 7/26 - - - -1890 70 4/9 73 1112 85 4/28 83 9/28 92 6/6 96 8/13 - - - -1891 70 4/15 72 10/18 80 512 82 10/8 92 6/26 90 8/28 102 . 7/23 102 7/23 I·
1892 76 3/10 71 1017 84 5/19 82 10/2 93 5/20 90 9/11 - - ,-_.
1893 74 516 72 9/25 81 6/4 80 8/31 90 7/30 94 8/31 : - - - -1894 76 4/19 73 10/4 80 5/18 89 9/10 90 6/2 94 8/27 - . - -· -1895 78 4/21 73 10/20 82 4/22 83 8/29 91 6/26 91 8/5 - - ,.... -1896 74 5/21 75 10/17 81 5129 80 9/22 90 6125 90 8/23 - - - -1897 77 4/9 71 10/17 83 4/15 81 10/6 92 5/12 91 8/21 ...;. - -· -1898 70 4/12 70 10/7 80 4/12 80 9/17 90 6/6 90 8/24 - - - -1899 73 4/7 73 10/5 81 6/16 80 9/28 93 7/26 91 7/27 - .. - - -1900 72 3/14 72 10/16 84. 4/29 87 9/12 90 6/12 90 7/20 - i - - -1901 70 4/10 75 10/25 87 5!25 81 9/19 92 8/4 91 8/22 - '• - - -. 1902 72 4/15 73 10/11 81 5125 82 10/3 90 5126 97 8/10 - - - _;
1903 70 3/22 72 10/23 84 515 83 9/27 97 617 90 8/11 - - - ....;
1904 72 4/8 73 10/25 81 4/10 80 . 10/1 99 6/29 95 8/4 100 7/25 100 7/25 1905 72 317 70 9/23 84 4/23 81 9/23 99 7/8 90 8/8 - - - -1906 70 3/28 70 10/26 80 4/6 83 10/9 90 4/20 92 7/27 101 7/3 101 7/3:. 1907 71 4/12 76 10/11 85 5!15 80 10/10 95 5130 93 9/9 102 7/30 102 7/30 1908 70 4/11 75 10/8 82 4/30 82 9/30 92 6/30 92 8/19 - ....; - -. 1909 78 4/8 70 10/15 86 5/2 80 10/11 90 6/10 93 915 - - .. - -1910 70 3/11 74 10/15 84 4/18 80 9/19 94 6/10 91 8/16 - - ·- _;.
1911 70 3/19 70 10/15 82 5/29 82 9/1 91 7/12 90 8/23 - - - "'-
1912 71 3/30 70 10/14 83 517 82 9/21 93 6/6 90. 8/22 - ·- -' 1913 70 4/9 75 10/1 84 5/6 85 9/20 92 7/18 91 8/21 - - - :;__
1914 71 3/18 71 10/27 80 5/1 81 9/24 94 6/15 90 8/13 - - - -1915 72 3/20 70 10/28 82 4/16 84 9/20 95 6/30 94 8/29 100 7/20 ·100 7/20 . 1916 70 4/2 73 10/10 81 512 84 9/21 91 6115 92 8/25 - - - -1917 78 5/8 70 10/14 80 6/13 84 . 10/8 90 6/13 90 8/24 - - - -1918 78 4/19 71 10/12 82 4/20 88 9/27 91 6/5 90 9/16 - - - -1919 71 3/22 77 1017 82 5/21 83 9125 90 7/14 92 8/24 100 7/14 100 7/14 1920 71 4/25 70 10/5 82 516 82 9/29 97 717 91 8/21 - - - ....,
I
1921 71 4/8 71 10/10 80 5/13 80 8/29 90 817 90 8/7 - - - -1922 71 5/12 78 10/8 84 5/15 81 9/25 90 5130 93 9/11 - - - -1923 71 3/26 70 10/20 82 3/29 86 10/1 94 6/28 95 917 - - -·· -
66

FIRST AND LAST HIGHS
l~~~ft~ttHll 70 De2rees 80 De2:rees 90 Degrees 100 Degrees Year First Date Last Date First Date Last Date First Date Last Date First Date Last Date 1924 73 4/6 70 10/22 80 4/26 82 10/28 90 6/1 92 9/12 - - - -1925 78 4/8 71 10/21 82 5/4 80 9/23 99 6/24 90 9/23 101 6125 101 6125 1926 70 3/2 70 10/24 82 4/13 80 9/11 93 4/27 90 9/4 104 7/10 104 7/10 1927 70 4/12 70 1113 81 4/24 81 9/11 92 6/20 94 8/17 101 7/23 101 7/23 1928 73 3/18 74 10/8 81 5/13 80 9/22 91 5/20 90 9/22 - - - -1929 72 4/24 73 10/24 81 5/18 80 10/15 90 7/1 95 8/10 - - - -1930 72 3/26 75 9/26 83 3/28 83 9/20 94 6/15 97 9/2 - - - -1931 70 4/9 79 10/15 81 4/26 89 514 91 5129 96 8/28 101 7/19 101 7/19 1932 73 4/9 70 1017 81 515 86 10/4 91 6/10 91 9/10 - - - -1933 70 4/5 72 10/23 80 5/28 80 10/6 91 6/12 91 8/26 102 8/13 102 8/13 1934 75 3/11 10 10/10 82 4/11 85 10/10 90 5/22 95 9/3 - - - -1935 70 4/10 71 10/17 83 5120 81 10/1 90 615 93 9/8 105 7/13 100 8/12 1936 71 4/11 70 10/18 83 5/10 88 10/10 90 8/20 97 8/28 - - - -1937 76 5/1 70 10/27 84 512 80 9/14 90 6/1 97 9/14 - - - -1938 70 417 75 10/22 80 5/19 80 9/27 92 6/6 95 9/17 101 7/20 101 7/21 1939 70 3/18 70 10/20 81 5/11 80 10/13 96 5/13 94 8/19 100 8/2 100 8/2 1940 70 3/21 79 10/19 82 5/1 80 10/18 97 6/11 94 8/29 - - - -1941 70 3/25 71 10/22 84 5/10 80 9/24 95 6/11 93 8/19 101 7/13 100 7/17 1942 74 3/30 73 10/18 80 5120 80 10/9 91 6/29 90 8/24 100 6/30 102 7/2 1943 77 4/11 71 10/14 82 4/12 83 1017 91 7/20 90 9/24 - - - -1944 73 4/1 75 10/27 80 5/3 83 9/27 90 5/27 98 9/10 104 7/18 101 915 1945 70 4/19 76 10/14 83 5/1 80 10/8 91 6/17 92 9/12 100 8/5 100 8/5 1946 77 4/17 71 10/11 81 512 80 9/29 99 7/19 90 8/22 102 7/20 102 7/20 1947 74 3/14 71 10/12 80 3/16 87 9/24 90 5123 91 9/23 - - - -1948 72 3/28 73 10/2 85 5124 86 9/12 90 6/6 93 5/10 - - - -1949 74 4/4 70 9/29 81 516 80 9/27 93 7/14 91 9/27 - - - -1950 77 4/19 79 9/23 80 5111 80 9/22 90 7/12 91 9/21 - - - -1951 70 4/2 75 10/9 81 4/12 84 9/21 95 6/28 91 9114 - - - -1952 77 5110 72 10/25 85 5/16 89 10/6 92 717 93 9/22 - - - -1953 70 4/19 70 10/8 80 514 82 9/20 91 7/6 95 8/14 - - - -1954 72 4/11 71 10/31 81 517 83 9/25 - - - - - - - -1955 73 4/6 73 10/17 85 617 86 916 94 6/8 93 915 ~ - - -1956 70 3/17 76 1017 80 4/19 81 10/6 98 717 93 8/12 102 7/19 102 7/19 1957 72 4/27 70 10/11 81 4/28 80 9/30 90 9/13 90 9/22 - - - -1958 77 4/12 70 10/17 81 5/14 80 10/3 92 6/5 96 917 102 7/26 102 7/26 1959 73 4/9 71 10/23 82 5/12 82 9/10 90 7/17 95 7/31 - - - -1960 73 3/19 71 10/18 81 6/1 86 9/29 94 7/5 94 8/9 100 8/8 100 8/8 1961 71 4/28 73 10/18 80 5/17 80 10/14 91 5119 92 8/21 104 7/11 102 7/12 1%2 75 4/12 70 10/29 80 4/18 82 9/24 91 7/22 93 9/17 - - - -
1963 70 4/28 70 10/16 84 5/17 85 9/27 91 5120 93 8/8 - - - -
1964 71 5119 74 10/22 84 5/30 80 10/5 90 8/10 94 10/24 - - - -1965 70 3/6 73 10/26 80 4/26 82 ; 10/2 93 6/30 90 8/31 107 7/30 102 7/31 1966 74 3/25 70 10/10 82 5/3 81 j 10/4 95 6/15 91 9/4 - : - - -1967 71 515 71 10/17 85 5116 82 9/28 90 6/18 94 9/27 102 l 8/9 102 8/28 1968 70 2/28 72 10/3 81 4/28 81 9/8 93 6/25 92 915 - - - -1%9 71 3/25 70 11/1 87 517 87 9/11 94 6/16 90 9/10 - - - -1970 70 511 71 10/16 82 5/3 85 9/28 94 611 90 10/2 102 7/15 102 7/15 1971 73 4/4 78 10/9 82 517 82 10/8 91 5/11 90 8/12 100 8/8 100 8/11 1972 72 3/16 71 10/17 83 5/12 83 9/15 92 5/28 93 9/3 102 8/6 104 817 1973 70 4/3 70 10/17 87 5/12 82 9/28 92 5113 95 9/10 - - - -1974 70 3/26 73 10/24 83 6/1 81 10/1 90 6/29 % 9/24 - - . - -
67

FIRST AND LAST HIGHS
68

CDD
MONTHLY AND SEASONAL COOLING DEGREE DAY UNITS 1969-9
HOW TO CALCULATE COOLING DEGREEDA YS:
Subtract 65 from the mean daily temperature. The difference is the number of cooling degree day units. All negative values are recorded as 0. Monthly and annual values are sums of the daily values during the appropriate period.
For example: Mean Temperature on July 4 was 69 deg F. According to the formula, 69- 65 = 4, so there were 4 Cooling Degree Day units on July 4.
* Most recent occurrence listed. In the case of a month with value of 0, no year is listed.
69

HDD
Season 1940-41 1941-42 1942-43 1943-44 1944-45 1945-46 1946-47 1947-48 1948-49 1949-50 1950-51 1951-52 1952-53 1953-54 1954-55 1955-56 1956-57 1957-58 1958-59 1959-60 1960-61 1961-62 1962-63 1963-64 1964-65 1965-66 1966-67 1967-68 1968-69 1969-70 1970-71 1971-72.
. 1972-73 1973-74 1974-75 1975-76 1976-77 1977-78 1978-79 1979-80 1980-81 1981-82 1982-83
MONTHLY AND SEASONAL HEATING DEGREE DAY UNITS (1941-95)
Jul Aug Sep Oct Nov Dec Jan Feb Mar Apr May Jun
- - - - - - 735 529 402 328 245 102 5 28 144 319 502 689 921 627 569 370 282 154 9 18 71 289 599 683 985 601 606 328 290 160
26 34 156 321 568 776 800 659 608 424 208 125 21 28 80 201 591 796 699 575 613 434 202 131 21 15 138 332 554 780 749 628 570 404 167 124 28 18 116 442 656 716 862 557 470 329 141 103 15 35 83 299 541 684 7'07 701 630 484 283 49 32 17 143 356 634 832 1154 726 593 381 191 114 48 30 99 511 452 731 1172 727 611 4'07 319 115 20 17 120 382 548 571 776 612 709 337 253 64 18 43 90 343 570 845 901 667 600 371 230 144 18 15 66 197 725 718 539 586 586 445 326 186 32 41 91 323 485 653 797 624 649 456 254 205 63 57 142 .365 452 741 777 681 724 552 368 152 80 33 173 346 701 793 770 838 639 364 201 174 22 47 120 407 662 746 1041 648 578 390 190 95 25 35 45 370 624 644 656 451 599 420 128 62 3 5 105 295 579 657 755 618 559 375 280 89 26 32 142 326 6S9 781 910 653 612 424. 337 78 18 52 114 316 548 807 654 494 530 442 261 66 11 4 169 359 656 740 811 613 605 364 339 118 49 19 71 299 515 6'07 925 477 606 486 272 168 72 24 41 329 561 830 739 718 650 539 380 182 67 81 191 358 711 860 761 599 533 388 325 113 22 16 139 227 451 786 759 620 545 425 249 99 27 16 56 345 531 635 655 591 647 535 246 50 3 0 29 306 558 758 789 482 515 500 261 110 17 43 123 395 544 852 1022 703 570 442 178 51 17 22 85 357 526 678 751 526 553 493 246 71 14 14 130 369 530 771 757 615 653 454 253 149 33 5 123 388 578 756 793 607 466 501 174 61·· 10 6 153 363 497 848 799 560 525 378 202 89 6 47 59 326 618 624 832 610 545 403 282 72
32 16 29 301 500 640 722 660 615 523 240 127 24 41 48 354 565 686 698 658 632 437 258 155 15 41 47. 319 536 783 901 564 596 358 340 68 40 19 131 339 644 707 764 561 485 430 317 58 29 26 134 312 772 915 1058 615 434 351 162 57 8 2 19 214 592 631 920 647 575 329 232 125 15 25 64 284 485 644 650 583 494 372 229 108 23 . 5 76 355 4'07 6'07 780 596 502 472 229 71 22 10 99 307 614 715 635 492 435 363· 184 81
70
Total 2341 4610 4639 4705 4371 4482 4438 4591 5173 5180 ~10
4822 4407
4610 5074 5112 4946 4059 4320 4980 4302
4789 4574 5065 49'07 4338 4334 4311 4940 4325 4709 4485 4430 4424 4405 4556 4568 4495 4865 4294 3953 4274 3957

'85 '86 '95
80 81 191 '55 '64 '64
HOW TO CALCULATEHEA TING DEGREE DAYS:
387 263 1992 1989 '92 '92 ..
724 552 380 205 1955 1955 '64 '54
HDD
Subtract the mean daily temperature from 65. The difference is the number of heating degree rniy units. All negative values are recorded as 0. Monthly and annual values are sums of the daily-~·values during the appropriate period.
For example: Mean Temperature on Oct 4 was 45 deg F. According to the formula, 65 - 45 = 20, so there were 20 Heating Degree Day units on Oct 4.
Utility companies use cooling and heating degree days for determining energy consumption requirements.
# Most recent occurrence listed.
71

FREEZEDATA
FREEZE DATA
Latest Killing in Spring, Earliest Killing in Autumn and Growing Season
72

FREEZEDATA
FREEZE DATES
Average Last Freeze ........... March 30 Average First Freeze ............ November 8 Latest Date in Spring .......... May 2, 1964 Earliest Date in Autumn ....... October 8, 1985
AVERAGE GROWING SEASON ........ 223 Days (based on 1961-1990 data)
LONGEST GROWING SEASON 1934 with 365 days (no killing spring or autumn freeze)
SHORTEST GROWING SEASON 1954 with 179 days.
73

This page left intentionally blank.
74

PRECIPITATION DATA
75

ANNUAL AND MONTHLY PRECIPITATION
ANNUAL PRECIPITATION
70.0,---------~--------~~~--------~~----------r----------rr
1871-1995 Average 39.64 inches 65.0 -1.---t---+--1960-1990 Average 36.30 inches-----+------++
:::: ~ -- M .. ·········-·-··!···-····-··········--· ... ·· .............. _ ................... ····--·······-... ·· ···--······················· ... ··"""
Inches
50. 0 -t] ........................ t-···.... ........................ ................. . ................................................................................ ~
45.o : l l- ~ d. .~ ~ I ~ 40. o l(l ~ i ,r r \ u ~ t ~-- ,} • II ,
35.0 ~ , ~- "'--~ r_~ IW1_j 30.0-1--------~-----~~~+-~~~~--~rr~~~~~-~
. i 25.0- .................................... , ............................................................................................................................................ ··1-
20.0~~~~~-+~~~~~~~~+-+-+-~~~~~~~~~~~
1870 1895 1920 1945 1970 1995
1871-1995
PRECIPITATION EXTREMES (1871-1995) 22.0
20.0 MAXIMUM
18.0 MINIMUM
16.0 NORMALS (1960-90)
14.0
12.0
Inches 10.0
8.0
6.0
4.0
2.0
0.0 Jan Feb Mar Apr May Jun Ju1 Aug Sep Oct Nov Dec
76

'-1 '-1
JANUARY PRECIPITATION DATA 1871ml995
* The WaterY ear begins on October 1st and ends September 30th.

'-1 DO
MARCH PRECIPITATION DATA 1871-1995
',
* The WaterY ear begins on October 1st and ends September 30th.
APRIL PRECIPITATION DATA
,: ~

'-l ~
MAY PRECIPITATION DATA 1871-1995
*The Water Year begins on October 1st and ends September 30th.
>~ i! ·'"' ;i

00 0
JULY PRECIPITATION DATA 1871-1995
* The Water Year begins on October 1st and ends September 30th.
AUGUST PRECIPITATION DATA 1-19
'•J,

00 1-'
SEPTEMBER PRECIPITATION DATA 1871-1995
*The Water Year begins on October 1st and ends September 30th.
~t :~; ~
~;:

00 N
NOVEMBER PRECIPITATION DATA 1871-1995
* The WaterY ear begins on October 1st and ends September 30th.
DECEMBER PRECIPITATION DATA 1-1
i;'" .:<:.

MONfHL Y PRECIPITATION
MONTHLY PRECIPITATION (1871-1995)
Year Jan Feb Mar April May June July Aug_ Sept Oct Nov Dec Ann OFFICIAL PRECIPITATION RECORDS START JAN 1871
1871 7.60 5.06 9.84 3.64 5.18 0.50 0.55 0.45 1.15 1.19 2.77 7.62 45.55 1872 6.56 12.13 5.28 2.96 0.92 1.52 0.20 0.13 1.26 1.80 4.67 9.47 46.90 1873 8.49 6.58 12.76 2.35 2.18 2.% 1.02 0.84 0.00 3.86 4.33 5.15 50.52 1874 9.46 4.28 5.15 3.68 2.38 2.68 0.19 0.83 1.70 0.36 10.22 5.24 46.17 1875 4.49 1.99 9.41 2.10 2.87 2.07 0.02 0.53 0.71 6.73 15.77 13.41 60.10 1876 4.80 7.50 9.12 5.34 1.88 2.35 0.96 0.56 1.09 10.53 9.93 0.88 54.94 1877 2.75 7.56 11.31 2.44 2.24 2.05 0.54 1.70 3.36 5.03 12.45 6.87 58.30 1878 6.67 12.16 6.23 1.85 2.17 0.13 1.10 0.50 3.54 3.22 5.61 4.52 47.70 1879 5.28 13.22 11.70 2.19 6.60 2.18 1.75 0.97 2.18 4.23 4.56 7.36 62.22 1880 12.27 5.67 4.48 2.92 3.13 1.59 0.59 1.31 1.34 1.47 3.17 13.93 51.87
1881 8.57 13.36 2.83 3.51 1.38 2.34 1.16 2.11 2.64 6.60 5.91 6.64 57.05
1882 5.06 10.49 2.53 4.60 1.84 1.91 0.95 0.07 0.91 11.63 7.11 20.14 67.24 1883 13.71 2.34 6.40 7.88 1.67 0.08 0.00 0.19 0.67 3.91 8.26 6.34 51.45
1884 3.70 4.88 2.25 3.57 1.34 1.42 1.80 0.33 4.25 4.01 3.24 7.52 38.31
1885 4.57 6.72 0.63 1.12 4.69 1.77 0.24 0.00 2.48 1.68 8.52 7.17 39.59
1886 9.37 1.96 5.39 3.16 1.32 0.67 0.32 0.03 1.19 2.87 1.00 11.52 38.76 .. 1887 12.31 2.81 8.00 5.06 4.77 1.44 0.03 0.58 3.06 1.34 3.43 11.34 54.17 1888 8.50 2.42 2.87 . 2.06 0.68 5.38 1.04 0.05 1.13 4.97 4.47 5.19 38.76 1889 4.78 1.07 1.80 2.72 4.02 0.51 T 0.90 1.61 4.59 3.97 5.79" 31.76 1890 11.13 9.85 6.23 1.41 1.08 2.23 0.59 0.13 0.10 2.79 0.50 4.34 40.38
/ 1891 3.62 6.26 2.06 4.00 1.83 4.07 0.24 0.93 2.17 5.04 5.74 11.45·: 47.41 .>,:;:,,,
1892 4.79 2.48 2.82 4.82 1.57 1.41 0.70 0.17 1.63 2.16 4.34 6.69::~. 33.58 1893 2.12 5.19 3.48 4.89 2.30 0.99 0.14 T 2.56 5.01 7.74 4.61''1: 39.03
1894 9.65 5.16 7.48 2.57 1.09 2.16 0.10 T 1.32 3.56 2.76 3.47 39.32 1895 8.53 1.01 2.84 1.91 3.42 0.57 0.23 0.37 1.16 T 2.93 7.79 30.76 18% 6.52 3.44 2.19 4.09 3.55 1.41 T 1.32 0.47 1.76 13.12 6.26 44.13
1897 3.25 5.57 4.00 1.76 0.90 1.35 0.65 0.26 2.79 1.99 11.65 8.84 43.01
1898 3.91 6.51 2.17 2.12 1.78 1.88 0.79 0.15 2.69 1.58 6.03 4.29 33.90 1899 6.42 4.20 2.30 3.73 3.16 0.62 0.47 2.50 1.37 3.97 7.56 5.91 42.21
1900 4.58 3.36 4.63 1.30 3.90 1.76 0.34 2.04 1.93 3.87 4.50 6.01 38.22 1901 7.80 6.52 4.12 4.05 2.41 1.39 0.12 0.17 3.57 0.75 6.14 4.01 41.05 1902 3.11 8.66 5.79 3.71 2.19 0.80 1.76 0.44 1.15 1.72 9.94 10.28 50.15
1903 5.43 1.44 4.29 2.25 1.71 2.00 0.51 0.81 1.13 2.20 10.71 3.14 35.62 1904 5.22 11.08 8.73 2.26 0.59 0.45 0.73 0.20 0.28 2.29 7.40 7.14 46.37 1905 3.66 1.77 5.03 1.71 2.56 2.12 0.12 0.19 2.79 4.73 3.01 6.41 34.10
1906 5.72 6.76 2.23 2.02 2.00 3.03 T 0.05 2.20 3.43 8.30 7.55 43.29 1907 8.23 3.54 3.86 3.57 1.37 1.84 1.19 1.02 1.73 0.93 6.51 9.10 42.89 1908 4.73 2.85 4.39 3.38 4.66 0.67 0.05 1.34 0.23 5.17 3.10 3.80 34.37 1909 9.29 7.03 2.35 0.89 1.79 0.17 2.26 0.05 0.95 2.01 12.49 4.47 43.75 1910 6.26 6.45 2.25 3.78 1.82 1.61 T 0.13 1.15 3.43 8.24 3.53 38.65 1911 8.53 3.34 0.63 2.11 3.95 0.87 0.01 0.28 5.19 0.99 2.64 4.74 33.28 1912 8.01 4.85 1.41 2.04 1.89 3.03 0.48 3.39 1.18 3.36 5.80 8.03 43.47 1913 6.25 1.13 4.04 2.94 1.63 4.24 0.24 0.76 2.58 3.62 5.39 3.48 36.30
83

MONTHLY PRECIPITATION
MONTHLY PRECIPITATION (cont.)
Year Jan Feb March April Mav June Julv Aug Sept Oct Nov Dec Ann 1914 11.53 4.19 2.28 3.08 1.22 1.52 0.01 0.01 3.10 3.47 3.70 2.56 36.67 1915 5.90 3.07 2.15 2.03 2.59 1.47 1.52 0.01 0.53 1.98 11.32 8.73 4i..30 1916 5.69 7.87 10.57 2.85 2.05 1.83 2.55 0.27 0.71 1.26 6.31 3.81 45.77 1917 2.54 3.32 5.33 5.36 2.31 1.17 0.01 T 1.96 0.03 4.24 14.23 40.50 1918 4.68 6.77 3.47 1.13 1.38 0.12 1.08 0.31 0.66 4.47 4.30 3.13 31.50 1919 9.08 8.36 4.64 3.60 1.95 0.91 0.23 0.10 3.18 1.43 7.44 4.78 45.70 1920 4.84 0.16 3.94 4.75 0.91 2.11 1.18 1.25 4.16 3.71 5.84 8.32 41.17 1921 7.82 7.21 4.28 2.26. 0.99 1.36 T . 0.30 3.08 2.78 10.04 3.09 43.21 1922 3.08 3.29 6.57 3.05 1.60 0.14 T 2.06. 1.90 4.70 2.94 9.43 38.76 1923 9.57 1.81 1.83 1.90 1.48 1.19 2.17 0.26 0.59 1.61 4.15 6.25 32.81 1924 3.94 5.21 . 1.40 0.91 0.45 0.68 0.03 0.62 1.93 5.50 6.11 4.44 31.22 1925 6.94 6.46 1.76 1.92 0.74 0.73 T 0.71 1.50 0.02 5.44 5.14 31.36 1926 3.64 7.71 0.80 0.80 2.83 0.35 0.00 1.95 2.14 5.26 9.78 5.91 41.17 1927 9;18 6.95 2.11 1.69 2.24 2.68 0.95 0.35 5.52 2.65 7.99 3.47 45.78 1928 5.11 . 1.19 7.21 4.47 0.74 0.44 0.42 T 0.65 1.65 5.30 7.51 34.69 1929 3.50 0.97 2.90 4.06 1.14 2.19 0.02 0.23 0.31 1.33 0.67 8.79 26.11 1930 3.43 5.03 2.21 2.72 3,08 0.69 T 0.06 1.79 2.15 2.84 3.16 27.16 1931. 4.30 2.40 8.12 2.40 1.09 3.13 T 0.04 2.10 4.32 6.38 8.40 42.68 1932 5.63 2.58 6.08 3.57 1.50 0.07 0.48 0.45 0.11 3.76 7.88 7.87 39.98 1933 7.94 4.26 5.10 0.95 3.59 2.60 T 0.86 2.97 4.59 2.54 17.45 52.85 1934 6.02 1.40 5.18 2.46 1.60 0.96 0.11 0.33 1.32 5.30 10.47 10.83 45.98 1935 3.45 3.17 5.28 2.48 0.61 0.50 0.28 0.20 0.86 3.20 3.27 5.89 29.19 1936 8.55 4.73 3.10 0.80 3.72 2.43 0.40 0.07 1.41 0.44 0.36 8.28. 34.29 1937 6.02 6.34 2.81 6.22 1.06 3.88 0.20 1.41 2.06 2.91 10.08 13.86 56.85 1938 5.06 7.83 6.42 2.02 0.65 0.45 0.25 0.35 1.38 2.87 4.83 4.16 36.27 1939 4.69 5.26 2.29 0.55 1.08 1.73 0.79 1.52 0.60 2.14 1.73 8.37 30.75 1940 2.36 10.82 5.12 2.76 1.57 0.06 0.39 0.07 3.56 4.26 4.82 5.03 40.82 1941 5.24 1.45 2.01 1.56 4.97 1.05 T 1.63 3.58 2.45 4.62 10.38 38.94 1942 3.63 3.64 1.63 2.38 2.84 1.94 1.40 0.17 0.06 3.49 11.57 9.37 42.12 1943 5.50 3.27 5.54 2~21 1.42 2.80 0.32 1.39 0.06 5.59 2.20 2.70 33.00 1944 2.81 3.11 1.93 2.28 1.07 0.81 0.06 0.03 2.73 1.64 5.00 1.90 23.37 1945 4.10 4.36 5.30 2.42 4.57 0.07 0.51 0.37 3.96 2.11 8.58 5.61 41.96 1946 5.12 4.99 4.23 0.78 1.24 1.91 1.08 0.18 1.15 4.81 7.57 5.47 38.53 1947 3.72 2.77 4.11 1.81 0.66 2.93 0.94 0.29 1.06 8.04 4.08 4.64 35.05 1948 5.87 5.02 4.24 3.41 3;76 ** ** ** 3.28 2.39 6.89 8.06 ** 1949 1.02 9.46 2.78 0.72 2.12 0.68 0.91 0.24 1.66 2.35 5.56 4.86 32.36 1950 10.10 5.77 4.76 2.74 0.57 2.50 0.50 0.72 1.45 7.00 8.67 6.31 51.09 1951 7.71 5.02 3.86 1.14 1.75 0.03 0.28 0.02 2.55 6.81 5.31 5.06 39.54 1952 4.40 3.59 3.82 1.45 0.78 2.23 T 0.18 0.33 0.72 1.44 6.76 25.70 1953 12.83 3.71 3.82 1.89 3.45 2.04 0.03 1.79 1.16 3.56 6.16 7.85 48.29 1954 8.95 4.57 2.55 2.54 1.83 3.58 1.24 1.92 0.85 3.40 5.09 5.01 41.53 1955 2.30 3.37 3.06 4.72 1.24 1.83 0.89 T 2.86 6.69 7.34 10.14 44.44 1956 11.66 3.03 4.30 0.53 2.50 2.03 0.01 2.56 1.12 5.10 1.47 3.64 37.95 1957 2.23 4.14 7.52 1.84 1.97 0.73 0.19 0.69 0.49 3.53 3.07 6.15 32.55
84

MONTHLY PRECIPITATION
. ~:-}'
85

WETTEST/DRIESTMONTHS
MONTHLY and ANNUAL PRECIPITATION: WETTEST AND DRIEST 5
1871-1995 DATA 1941-1995 DATA WEITEST 5. DRIESTS. WETTEST5 DRIEST 5
JANUARY 13.71 18!,G 0.06 1985 12.83 1953 O.Q6 1985 . 12.83 1953 1.02 1949 11.81 1970 1.02 1979
12.31 1887 1.07 .. 1977 11.66 1956 1.07 1977 . 12.27 1880 1.47 1981 10.10 1950 1.47 1981 11.81 . 1970 1.58 1962 9.64 1964 .1.58 1962
AVERAGE 5.88 inches AVERAGE (1961-90) 5.35 :inches
FEBRUARY 13.36 1881 0.16 1920 9.46 1949 .0.72 1993 13.22 1879 0.72 1993 8.92 1961 0.78 1964. 12.16 1878 0.78 1964 7.78 1983 1.70 1966 12.13 1872 0.97 1929 6.64 1968 1.79 i985 11.08 1904 1.01 1889 6.53 1979 1.94 1973
AVERAGE 4.69 inches AVERAGE (1961790) 3.85 inches
MARCH 12.76 1873 0.63 1911 7.52 1957 1.10 1965 11.70 ~879 0.80 1926 6.80 1983 1.13 1969 11.31 1877 L10 1965 6.73 1989 1.49 1979 10.57 1916 1.13 1969 6.04 1961 1.63 1942 9.84 1871 1.40 1924 5.65 1974 1.84 1994
AVERAGE 4.15 inches AVERAGE (1961-90) 3.56 inches
APRIL 7.88 1883 0.53 19.56 5.26 1993 0.53 1956 6.22 1937 0.55 1939 4.72 1955 0.72 1949 5.36 1917 0.72 1949 4.57 1988 0.78 1946 .5.34 1876 0.78 1946 4.05 1991 0.85 1966. 5.26 1993 0.80 1926 3,96 1978 0.92 1959
AVERAGE 2.67 inches AVERAGE (1961~90) 2.39 inches
MAY 6.60 1879 0.10 1992 4.57 1945 0.10 1992 5.18 1871 0.45 1924 4.36 1993 0.46 1982 4.97 1941 0.46 1982 4.30 1977 0.56 1994 4.77 1887 0.56 1994 3.76 1948 0.57 1950 4.69 1885 0.57 1950 3.63 1968 0.66 1947
AVERAGE 2.12 inch~s . AVERAGE (1961-90) 2.06 inches
JUNE 5.38 1888 0.03 1951 4.06 1984 0.03 1951' 4.24 1913 0.06 1940 3.58 1954 0.07 1945 4.07 1891 0.07 1945* 3.23 . 1981 0.14 1987 4.06 1984 0.08 1883 3.04 1958 0.23 1986 3.88 1937 0,12 1918 2.99 1969 0.47 1961
AVERAGE 1.57 inches AVERAGE (1961-90) 1.~ inches
JULY 2.68 1983 0.00 1967* 2.68 1983 0.00 .1967 2.55 1916 Trnce 1984* 2.41 1993 Trnce 1984* 2.41 . .. 1993 0.01 . 1956* 2.01 1974 0.01 1956 2.26 1909 0.02 1929* 1.40 1942 0.03 1953 2.17 .1923 0.03 1953*. 1.36 1978 0.05 1970
AVERAGE 0.56inch AVERAGE (1961-90) 0.63 inch
,.._. ·,

WETIEST /DRIEST MONTHS
WETTEST AND DRIEST 5 MONTHS (cont.)
1871-1995 DATA WETTEST 5 DRIEST 5
AUGUST 4.53 1968 0.00 1885 3.39 1912 Trace 1970* 3.29 1976 0.01 1915* 3.26 1977 0.02 1958* 2.56 19.56 0.03 1944
AVERAGE 0.73 inch
SEPTEMBER 5.52 1927 0.00 1873 5.19 1911 Trace 1993 4.30 1986 0.01 1965 4.25 1884 0.02 1991 4.16 1920 0.06 1943
AVERAGE 1.74inches
OCTOBER 11.63 1882 Ttaee 1895 10.53 1876 0.02 1925 8.41 1994 0.03 1917 8.04 1947 0.19 1988 7.00 1950 0.27 1987
AVERAGE 3.19 inches
NOVEMBER 15.77 1875 0.36 1936 13.12 1896 0.50 1890 12.49 1909 0.67 1929 12.45 1877 0.77 1976 11.65 1897 1.00 1886
AVERAGE 5.84inches
DECEMBER 20.14 1882 0.88 1876 17.45 1933 1.38 1976 14.23 1917 1.90 1944 13.93 1880 2.19 1985 13.86 1937 2.37 1988
AVERAGE 6.54 inches
ANNUAL 67.24 1882 22.48 1985 62.22 1879 23.37 1944 60.10 1875 25.70 1952 58.30 1877 26.11 1929 57.05 1881 26.71 1976
AVERAGE 39.64 inches
NOTES: * indicates most recent occurrence is listed All totals are in units of inches.
1941-1995DATA WETTEST 5 DRIEST 5
4.53 1968 Trn.ce 1970* 3.29 1976 0.02 1958 3.26 1977 0.03 1944 2.56 19.56 0.04 19()9 2.29 1983 0.07 1974 AVERAGE (1961-90) 1.09 inches
4.30 1986 Trace 1993 3.38 1982 0.01 1965 3.96 1945 0.02 1991 3'.86 1969 0.21 1974 3.53 1973 0.30 1987 AVERAGE (1961-90) 1.75 inches
8.41 1994 0.19 1988 8.04 1947 0.27 1987 7.00 1950 0.36 1978 6.81 1951 0.72 1952 6.69 1955 0.84 1964 AVERAGE (1961-90) 2.67 inches
11.57 1942 0.77 1976 11.55 1973 1.44 1952 11.15 1995 1.47 19.56 9.74 1984 1.50 1993 9.32 1962 1.96 1987
AVERAGE (1961-90) 5.34 inches
11.12 1968 1.38 1976 10.14 1955 1.90 1944 9.93 1973 2.19 1985 9.92 1964 2.37 1988 9.72 1980 2.40 - 1990
AVERAGE (1961-90) 6.13 inches
51.09 1950 22.48 1985 50.89 1968 23.37 1944 48.29 1953 25.70 1952 47.19 1983 26.71 1976 44.44 1955 29.24 1967 AVERAGE (1961-90) 36.30 inches
87

MQRERAINFALLRECORDS
January February March April May June July August September October· November December
Greatest
MORE.RAINFALL RECORDS
Greatest 24~Hour Rainfall Records 1941-1995 1872~1995
2.61 inches 14-15th 1974 January 6.86 inches 5-6th 1883 2.46 inches 23-24th 1994 February 3.81 inches 1-2nd 1890 1.83 inches 30·31st 1943 March 2.50 inches 30-31st 1931 1.47 inches 26-27th 1962 April l.96 inches 12-13th 1937 1.47 inches 19th 1968 May L83 inches l4-15th 1908 1.82 inches 5-6th 1958 June 2.16 inches 8-9th 1933 1. 09 Lnches 15-i6th 1978 July 1.35 inches 1-2nd 1902 1.54 inches 25-26th 1977 August 1.75 inches 8-9th 1900 2.38 inches 19-20th 1982 Sept. , 2.88 inches 4-5th 1911 4.44 inches 26-27th 1994 October 4.44inches 26-27th 1994 ~.82 inches . 10'-llth 1995 Nov. 4A3 inches 19-20th 1921 2.59 inches 12-13th 1977 December 7.66 inches 12-13th 1882
4.44inches Oct 26-27, 1994 Greatest 7.66 inches Dec 12-13, 1882
Consecutive Days with Measurable Rain (more than 0.01 inch) (1871-1995)
40 days 37 days 29 days 26 days 24days 24days 24days 23. days 22 days 22days
15.50 inches 17.02 inches 10.01 inches 7.73 inches
10.78 inches 6.30 inches
10.25 inches 10.62 inches 7.23 inches 9.46 inches
February 6-March 16, 1872 January 15-February 20, 1878 January 2-31, 1950 February21-March 18, 1919 December 18, 1964-January 10, 1965 January 29-February 21, 1885 February 6-29, 1872 December 23, 1965-January 14, 1966 February 8-March 1, 1983 February 1-22, 1949
Consecutive Days with No Rainfall (1941-1995)
71 days 62 days 55 days 55 days 53 days 52 days 47 days 46 days 42 days 41 days
June 23-September 1, 1967 June 30-August 30, 1984 June 20-August 13, 1960 June 30-August 23, 1952 July 5-August 26, 1980 June 7-July 30,' 1985 · July 13-August 28, 1981 August 11-September 25, 1957 August 25-0ctober 5, 1993 July 7-August 16, 1990
88

00 \.[)
/
GREATEST RAINFALL (inches) DURING A TIME SPAN OF ...
PDX Airport Location (19.53-1995)
Month 5 I 10
Min. Date Min. Date JAN 0.18 ~ 22/1970 I 0.27 22/1970 FEB o.12 ~ 7/1978 nrr5 7/1978 MAR 0.12 ~ 12/19721 0.19 12/1972 APR 0.15 1 29/1992 I 0.17 29/1992 MAY 0.30 i 19/1968 I 0.42 19/1968 JUNE 0.40 ~ 14/1978 I 0.43 14/1978 JULY 0.28 1 30/I982 I 0.34 30/1982 AUG 0.35 1 30/1954 I 0.52 19/1968 SEPf 0.28 i 11/19661 0.41 9/1972 ocr 0.22 i 6/1982 I 0.25 6/1982 NOV 0.15 i 3/1983 I 0.21 13/1966 DEC 0.16 i 9/1953 I 0.23 6/1981
Greatest I 0.40 June 141 0.52 I Aug 19 1953-95 1978 1968
15 !
Min. i Date 0.31 1 22/1970 0.25 1 7/1978 0.29 i 12/1970 0.18 l 29/1992 0.52 i 19/1968 0.44 i 14/1978 0.37 i 30/1982 0.61 l 19/1968 0.46 l 19/1988 0.26 l 25/1984 0.24 i 13/1966 0.24 i 6/1981 0.61 Aug 19
1968
30 I I 1 Min. Date Hr 0.48 I 22/1970 I 0.92 0.36-T-7/1978 I 0.36 0.34 I 29/1983 I 0.43 0.24 I 7/1991 I 0.35 0.55 I 1911968 I 0.67 0.44 I 14/1978 I 0.44 0.48 I 8/1983 I 0.50 0.82 I 19/1968T0.89 0.51 I 19/T988 10.59 0.30 I 25/1984 I 0.42 0.28 I 8/1980 I 0.43 0.28 I 2/1980 I 0.40 0.82 I Aug 19 I 0.92
1968
ALL YEARS: Citv Office (1890-1950) and A. t Locat" ( 1953-1995) 5 10 15 30 1
Month Min. Date Min. Date Min. Date Min. Date Hr JAN 0.18 22/1970 0.27 22/1970 0.31 22/1970 0.48 22/1970 0.92 FEB 0.15 4/1942 0.21 4/1942 0.25 7/1978 0.36 7/1978 0.41 MAR 0.16 30/1947 0.27 28/1934 0.37 28/1934 0.50 28/1934 0.56 APR 0.17 27/1930 0.26 25/1906 0.34 25/1906 0.35 25/1906 0.43 MAY 0.30 19/1968 0.42 19/1968 0.52 19/1968 0.55 19/1968 0.67 JUNE 0.40 14/1978 0.46 7/1927 0.64 7/1927 1.06 7/1927 1.31 JULY 0.28 30/1982 0.34 30/1982 0.39 2/1907 0.69 2/1907 0.82 AUG 0.40 8/1900 0.70 8/1900 0.83 8/1900 1.10 8/1900 1.25 SEPf 0.28 1111966 0.53 6/1927 0.61 6/1927 0.69 6/1927 0.87 ocr 0.22 6/1982 0.25 6/1982 0.28 28/1933 0.42 28/1933 0.50 NOV 0.21 2/1933 0.25 2/1933 0.28 2/1933 0.37 8/1937 0.49 DEC 0.16 9/1953 0.23 6/1981 0.24 6/1981 0.28 2/1980 0.42
Greatest 0.40 June 14 0.70 Aug8 0.83 Aug8 1.10 Aug8 1.31 Ali Years 1978 1900 1900 1900
2 Date I Hrs.
22/1970 11.16 20/1991 I 0.56 9/1983 I 0.69 7/1984 I 0.52 19/1968 I 0.82 14/1978 I 0.47 9/1995 I 0.65 19/1968 I 0.89 17/1970 I 0.99 25/1984 I 0.69 12/1989 I 0.65 10/1992 I 0.68 Jan 22 11.16 1970
2 Date Hrs.
22/1970 1.16 5/1938 0.76
28/1934 0.69 27/1930 0.55 19/1968 0.82 7/1927 1.74 2/1907 0.93 8/1900 1.25 6/1927 1.09
28/1933 0.69 14/1896 0.84 6/1923 0.68 June7 1.74 1927
3 Date I Hrs·
22/197011.28 111961 I 0.71 911983 I 0.79 25/198910.75 19/19681 0.94 6/1990 I 0.50 9/199.5-10.94 19/19681 0.89 17/197011.36 26/199410.94 12/198910.73 10/199211.05 Jan 22 11.36 1970
Date 22/1970 5/1938 9/1983 27/1930 19/1968 7/1927 2/1907 8/1900 28/1927 26/1994 20/1921 10/1992 June7 1927
Date 22/1970 25/1957 21/1953 25/1989 19/1968 6/1950 911995 19/1968 17/1970 26/1994 15/1973 4/1968 Sept17
1970

\,!) 0
~IItli~~~li~j~j~~~l~~l~If~j~t DAYS WITH MEASURABLE PRECIPITATION OF 0.01 INCH OR MORE, 1940-1995* DAY JAN FEB MAR APRIL MAY JUNE JULY AUG SEPf .OCT NOV
1 34 34 33 35 23 15 10 5 13 12 32 .2 34 27 32 26 27 11 12 5 9 18 24 3 33 29 35 21 24 19 10 8 11 15 29 4 31 32 34 28 25 20 14 5 14 20 34 5 35 31 30 28 24 23 13 2 10 16 34 6 27 28 29 28 21 26 9 7 12 21 35 7 34 28 24 24 20 17 8 8 . 16 21 37 8 37 30 29 31 24 11 11 4 12 19 32 9 35 32 33 32 23 17 10 3 14 22 38 10 39 30 31 29 22 21 11 4 17 27 33 11 36 36 34 26 22 19 5 5 11 23 37 12 38 39 33 23 24 22 5 6 10 25 35 13 37 28 34 24 23 21 4 9 13 19 38 14 33 36 34 25 28 26 - 7 8 19 16 36 15 38 39 33 28 23 15 10 9 19 12 34 16 40 37 29 29 17 19 6 11 15 14 34· 17 35 35 29 26 19 16 6 6 18 19 44 18 29 32 30 27 17 13 3 6 17 20 35 19 26 33 26 30 26 16 5 12 17 20 39 20 27 27 29 26 16 14 8 5 19 30 34 21 28 26 27 31 17 11 5 10 13 28 35 22 34 31 36 28 24 13 2 11 13 28 31 23 35 33 35 30 20 13 3 15 12 28 36 24 36 31 33 28 22 18 5 16 14 25 40
. 25 33 25 33 24 20 18 7 16 18 31 36 26 33 33 30 25 26 13 6 11 19 27 33 27 30 30 27 27 22 17 7 11 15 28 40 28 27 31 27 32 21 20 5 15 17 31 30 29 32 7 31 22 17 16 3 15 10 28 33 30 30 32 27- 18 21 4 16 16 32 39 31 36 35 20 4 13 29
*Based on observations taken at the Natio_na1 Weather Service office on Marine Drive near Portland Iiiteinatioria1 Ai.i'pol,t .. - . - . . ·. I . ~ • ':. . \.. ' . ,. '
~~~~~~Irf~~~I~~ll1Il~~~1flii~~ DEC
43 36 41 39 39 39 37 37 36 32 32 31 31 31 32 30 29 35 34 36 38 34 35 35 32 37 37 36 36 35 35

\.0 1--'
l~~Ill~j~J~I~~f~I~~liii~~f~j~j;[ DAILY PROBABILITY OF MEASURABLE PRECIPITATION (0.01 inch or greater)* DAY JAN I FEB MAR APRIL MAY JUNE . JULY AUG SEPT OCT NOV
1 61.8 61.8 60.0 63.6 41.8 27.3 18.2 9.1 23.6 21.8 58.2 2 61.8 49.1 58.2 47.3 49.1 20.0 21.8 9.1 16.4 32.7 43.6 3 60.0 52.7 63.6 38.2 43.6 34.5 18.2 14.5 20.0 27.3 52.7 4 56.4 58.2 61.8 50.9 45.5 36.4· 25.5 9.1 25.5 36.4 61.8 5 63.6 56.4 54.5 50.9 43.6 41.2 23.6 3.6 18.2 29.1 61.8 6 . 49.1 50.9 52.7 50.9 38.2 47.3 16.4 12.7 21.8 38.2 63.6 7 61.8 50.9 43.6 43.6 36.4 30.9 14.5 14.5 29.1 38.2 67.3 8 67.3 54.5 52.7 56.4 43.6 20.0 20.0 7.3 21.8 34.5 58.2 9 63.6 58.2 60.0 58.2 41.8 30.9 18.2 5.5 25.5 40.0 69.1 10 70.9 54.5 56.4 52.7 40.0 38.2 20.0 7.3 30.9 49.1 60.0 11 65.5 65.5 61.8 47.3 40.0 34.5 9.1 9.1 20.0 41.8 67.3 12 69.1 70.9 60.0 41.8 43.6 40.0 9.1 10.9 18.2 45.5 .63.6 13 67.3 50.9 61.8 43.6 41.8 38.2 7.3 16.4 23.6 34.5 69.1 14 60.0 65.5 61.8 45.5 50.9 47.3 12.7 14.5 34.5 29.1 65.5 15 69.1 70.9 60.0 50.9 41.8 27.3 18.2 16.4 34.5 21.8 61.8 16 72.7 67.3 52.7 52.7 30.9 34.5 10.9 20.0 27.3 25.5 61.8 17 63.6 63.6 52.7 47.2 34.5 29.1 10.9 10.9 32.7 34.5 80.0 18 52.7 58.2 54.5 49.1 30.9 23.6 5.5 10.9 30.9 36.4 63.6 19 47.3 60.0 47.3 54.5 47.3 29.1 9.1 21.8 30.9 36.4 70.9 20 49.1 49.1 52.7 47.3 29.1 25.5 14.5 . 9.1 34.5 54.5 61.8 21 50.9 47.3 49.1 56.4 30.9 20.0 9.1 18.2 23.6 50.9 63.6 22 61.8 56.4 65.5 50.9 43.6 23.6 3.6 20.0 23.6 50.9 56.4 23 63.6 60.0 63.6 54.5 36.4 23.6 5.5 27.3 21.8 50.9 65.5 24 65.5 56.4 60.0 50.9 40.0 32.7 9.1 29.1 25.5 45.5 72.7 25 60.0 45.5 60.0 43.6 36.4 32.7 12.7 29.1 32.7 56.4 65.5 26 60.0 60.5 54.5 45.5 47.3 23.6 10.9 20.0 34.5 49.1 60.0 27 54.5 54.5 49.1 49.1 40.0 30.9 12.7 20.0 27.3 50.9 72.7 28 49.1 56.4 49.1 58.2 38.2 36.4 9.1 27.3 30.9 56.4 54.5 29 58.2 50.9 56.4 40.0 30.9 29.1 5.5 27.3 18.2 50.9 60.0 30 54.5 58.2 49.1 32.7 38.2 7.3 29.1 29.1 58.2 70.9 31 65.5 63.6 36.4 .. 7.3 23.6 52.7
*Probabilities based on rainfall measurements taken at the National Weather Service office on Marine Drive near Portland International Airport from 1940 through 1995. ·
m~~~~~~tlj~lt~[~~l\1\~f~j\jjj\lt~jjj DEC 78.2 65.5 74.5 70.9 70.9 70.9 67.3 67.3 65.5 58.2 58.2 56.4 56.4 56.4 58.2 54.5 52.7 63.6 61.8 65.5 69.1 61.8 63.6 63.6 58.2 67.3 67.3 65.5 65.5 63.6 63.6

?!
DAIL-Y PROBABILITY OF RAINFALL (based on, rainfall data 19 40-19 9 5)
" 10 .....
90.0
80;0
70.0 ~
-f--) 60.0 ~ (J)
50.0 () ~
~ I (J) p.
40.0 :J ,__. CQ I 30.0 -< ~ 8: I 20.0
:J I 10.0 ~ ,__.
I 0.0 ~ ~ ,__.
C§ Day of Year (Jan-Dec)

RAINFALLPROBABIUTY
PROBABILITY OF RECEIVING 0.01 INCH OR MORE OF RAINFALL BASED ON TIME OF DAY*
PROBABILITY OF RECEIVING AT LEAST 0.01 INCH 70·0 DIT!-T-r---;:=:::::r::==c::=c;---,-T!t
-a-- 00-06
····0···· 06-12 12-18
50.0 -·-·~-·- 18-24
40.0 per cent
3 0. 0 +-lftF--t--"'(~:-;i;---+--'"0--t--t----?if''--1,.._..,.'-+---i-+
Jan Feb Mar Apr May Jun Jul Aug Sep Oct Nov Dec
PROBABILITY(%) OF RECEIVING AT LEAST 0.01 INCH
INTERVALOFTIMEOFDAY MONTH 00-06 06-12 12-18 18-24 00-12 12-24 00-24
January 31.5 28.3 29.3 29.5 40.7 37.5 50.6 February 36.8 36.2 38.4 38.1 49.6 51.8 64.0 March 28.6 29.8 31.5 33.0 39.6 43.9 53.2 April 28.5 22.8 22.8 26.9 36.4 36.9 49.2 May 21.8 14.6 21.3 23.3 25.6 30.8 39.0 June 15.7 15.4 17.7 16.9 21.6 23.3 29.8
July 7.2 6.0 6.7 5.7 9.9 10.7 15.1 August 7.9 9.9 9.9 11.4 12.7 13.9 19.9 September 14.4 16.7 13.6 13.3 21.8 18.7 28.7 October 19.1 20.8 20.6 20.1 29.3 27.4 37.9 November 36.9 37.2 40.3 36.4 48.7 50.8 61.8 December 38.7 37.5 38.5 37.7 49.1 50.4 64.8
*NOTE: Time of day is denoted in military clock hours. For example 00-06 represents the interval between midnight and 6 am. Data is based on 1972-1985 rainfall data.
93

RAINfALLPROBABIUTY
PROBABILITY OF RECEIVING 0.25 INCH. OR MORE OF RAINFALL BASED ON TIME OF DAY*
PROBABILITY OF RECEIVING 0.2$ INCH OR MORE 8. 0 .,.-r--...,.-~-""'F"'_,.; -..,.---r--'1--:--r--r--...,----,.-r-
: ! ' 7. 0 ... ~· ............................ ..! . .r-......... __.,. ........... ~-11 ---£1-- 00-06
6.0 +-i~-!--+-+1---,...o--- 06-12 ~t-----+-l--+h~'-+
---·-6····. 12-18 5. 0 ~ll::-----1--+--H • 18-24 ~t-----+--l-4--IH-.-......{-F-
Jan Feb Mar Apr May Jun. Jul. Aug Sep Oct Nov Dec
PROBABILITY{%) OF RECEIVING AT LEAST 0.25 INCH
INTERVAL OFTI~OFDAY MONTH 00-06 06-12 12-18. 18 ... 24 00-12 12-24 .Q0-24
January 4.0 5.0 5.0 5.0 8.9 10.7 18.9 February 4.1 4.1 3.8 3.0 10.9 9.0 22.6 March 2.5 1.5 2.5 1.5 6~7 5.7 16.7 April 1.3 1.5 0.0 1.3 4.6 3.3 11.0 May 1.0 0.5 Q.7· 3.0 ·2.7 5.2 8.4 June 1.5 1.3 2.1 2.1 3.1 4.9 7.5
July 1.2 0.7 0.5 0.5 2.0 1.0 2.7 August 3.0 0.7 0.1 1.2 3.5 3.0 6.2 September 1.8 2.3 1.3 1.0 4.4 3,8 8.7 October 2.5 2.0 2.5 1.5 5.5 4.5 12.2 November 6.9 4.9 5.4 5.6 12.8 11.0 24.9 December 6.2 6.9 7.2 6.7 14.4 12.7 26.8
*NOTE: Time of day is denoted in military clock hours. For example 00-06 represents the interval between midnight and 6 am. Data is based on 1972-1985 rainfall data.,
94

RAINFALL PROBABILITY
PROBABILITY OF RECEIVING 0.50 INCH OR MORE OF RAINFALL BASED ON TIME OF DAY*
PROBABILITY OF RECEIVING 0.50 INCH OR MORE
:::_ .................... -e- ~0-0~ .......................... ····················t····· ...... . -... <)···. 06-12
per cent2 .0 .................... M·-·=-·- ~~~~: ................................................. ~:~ .... . 1.5 f/.
~ ~~/:
Jan Feb Mar Apr May Jun Jul Aug Sep Oct Nov Dec
PROBABILITY(%) OF RECEIVING AT LEAST 0.50 INCH
INTERVALOFTIMEOFDAY MONTH 00-06 06-12 12-18 18-24 00-12 12-24 00-24
January 0.7 0.7 1.2 1.2 3.7 4.0 8.7 February 1.1 0.5 0.8 0.3 3.3 2.2 9.0 March 0.2 0.2 0.0 0.5 1.5 1.0 5.0 April 0.0 0.0 0.0 0.3 0.3 0.3 0.3 May 0.2 0.0 0.0 0.2 0.2 1.2 2.7 June 0.3 0.0 0.0 0.0 0.8 1.3 3.3
July 0.5 0.0 0.0 0.0 0.5 0.0 1.2 August 1.2 0.0 0.2 0.2 1.5 0.5 2.7 September 0.3 0.5 0.3 0.0 1.3 1.0 3.1 October 0.2 1.0 0.7 0.0 1.5 1.7 4.7 November 1.3 0.8 1.3 1.5 4.4 4.1 11.0 December 3.2 1.7 1.7 1.7 5.7 5.7 14.4
*NOTE: Time of day is denoted in military clock hours. For example 00-06 represents the interval between midnight and 6 am. Data is based on 1972-1985 rainfall data.
95

RAINFALL PROBABILITY
PROBABILITY OF RECEIVING 1.00 .INCH OR MORE OF. RAINFALL BASED ONTIMEOF DAY* . c·.· .. ' ..
PROBABILITY(%) OF RECEIVING AT LEAST 1.00 INCH
' . . . '
INTERVAL.OFTIMEOFDAY MONTH 00-06 06-12 12-18 18~24 00-12 .12-24. . 00-24
January 0.0 0.2 .. 0.2 o,o 1.0 0 .. 5 3.7 February 0.0 0.0 0.3 0.0 0.0 0.3 1.1 March 0.0 0.0 0.0 0;0 0.0 0.2 .0.5 April 0.0 0.0 0.0 0.0 0.0 0.0 0;0 May 0.0 0~0 . 0.0 0.0 0.0 0.0 0.5 June 0.0 0.0 0.0 0.0 0.0 0.0 0.3
July 0.0 0.0 0.0 0.0 . 0.0 0.0 0.2 August 0.0 0.0 0.0 0.0 0.2 0.0 0.5 September 0.0 0.3. 0.0. 0.0 0.3 0.0 0.5 October 0.0 0.0 0.0 0.0 0.2 0.0 0.7 November 0.0 0.0 0.0 0.0 1.0 1.0 2.8 December 0.0 0.2 0.5 0.0 1.5 1.5 5.2
,. '
PROBABILITY(%) OF RECEIVING AT LEAST 2.00 INCH
INTERVAL OFTI:ME OF DAY· MONTH 00-06 06-12 12-18 18-24 00-12 12-24 00-24
January 0.0 0.0 0.0 0.0 0.0 0.0 0.2 February 0.0 0.0 0.0 0.0 '0.0 0.0 0.3 March· 0.0: ., 0.0 0.0 0.0 0.0 0.0 0.0 April 0.0. 0.0 0.0 0.0·' 0.0 0.0' 0.0 May 0.0 0.0:- 0.0 0.0 0.0 . 0.0
,.
0.0 June 0.0 0.0 0.0 0.0 0.0 0.0 0.0
July 0.0 0.0 0.0 0.0 0.0: 0.0 . 0.0 August 0.0 0.0 0.0 0.0 0.0 '0.0 .. 0;0 September 0.0 0.0 0.0 0.0 0.0 0.0 0.3 October 0.0 0.0 0.0 0.0 0.0 0.0 0.0 November 0.0 ·o.o 0.0 0.0 0.0 0.0 0.5 December 0.0 0.0 0.0 0.0 0.0 0.0 0.2
"' '
*NOTE: Time of day is denoted in military clock hqurs. For example 00-06 represents the interval betwe~ midnight and 6 am. Data is based on 1972-1985 rainfall data.
96:

Season Jul 1871-72 0 1872-73 0 1873-74 0 1874-75 0 1875-76 0 1876-77 0 1877-78 0 1878-79 0 1879-80 0
1880-81 0 1881-82 0 1882-83 0
1883-84 0 1884-85 0 1885-86 0 1886-87 0 1887-88 0 1888-89 0
1889-90 0 1890-91 0 1891-92 0 1892-93 0 1893-94 0 1894-95 0 1895-96 0 1896-97 0 1897-98 0 1898-99 0
1899-1900 0 1900-01 0
1901-02 0 1902-03 0 1903-04 0 1904-05 0 1905-06 0 1906-07 0 1907-08 0 1908-09 0 1909-10 0 1910-11 0 1911-12 0 1912-13 0 1913-14 0
' ' '
MONTHLY AND SEASONAL SNOWFALL (1871-1995) (includes accumulations of snow sleet ice pellets and hail)
Aug Sep Oct Nov Dec Jan Feb Mar Apr May 0 0 0 5.0 25.0 4.6 15.4 0 0 0 0 0 0 8.6 20.0 0 1.7 0 0 0 0 0 0 T 4.9 12.9 3.1 15.2 0 0 0 0 0 0 0 3.2 0 0 0 0 0 0 0 7.8 13.6 5.5 2.0 0 0 0 0 0 0 0 .0 T 3.4 0 0 0 0 0 0 0 0 1.0 0 0 0 0 0 0 0 0 0.5 2.0 9.0 0 0 0 0 0 0 0 9.1 9.5 0.1 0.1 0 0 0 0 0 0.4 6.1 4.7 10.6 T 0 0 0 0 0 0 0.4 4.7 7.2 0 0 0 0 0 0 0 0 2.0 1.0 0 0 0
0 0 0 0 0 7.0 18.5 0 0 0 0 0 0 0 34.1 1.0 0 0 0 0 0 0 0 0 0 9.3 0 0 0 0
0 0 0 0 0 12.3 18.9 T 0 0 0 0 0 2.0 T 12.0 0 0 0 0 0 0 0 0 0 . 0.3 1.0 0 0 0
0 0 0 0 5.9 35.3 0.4 T T 0 0 0 0 0 0 0 11.4 1.6 0 0 0 0 0 0 0.7 0 0 0 0 0
0 0 0 0 29.0 11.8 20.0 . 0.1 0 0 0 0 0 T 0 4.1 10.0 2.4 0 0 0 0 0 0 1.0 20.4 1.5 T 0.1 0
0 0 0 0 1.1 6.0 0.8 1.2 0 0 0 0 0 2.0 0 1.8 T 5.0 0 0 0 0 0 3.0 0.2 1.8 T 1.5 0 0 0 0 0 0.3 5.7 11.6 5.8 0.4 0 0 0 0 0 0 0 0 1.4 0 0 0
0 0 0 0 0 15.7 T 0 0.2 0
0 0 0 0 T 6.8 0.4 T T 0 0 0 0 0 0.7 0.8 0.6 2.6 0.2 0
0 0 0 0 0 0.9 1.5 T T 0
0 0 0 0 T 2.5 0.1 T 0 0
0 0 0 T T T 0 4.0 0 0 0 0 0 0 0 3.0 3.5 T 0 0
0 0 0 0 0.1 T 1.8 0 0 0 0 0 0 0 0.7 15.1 0 0 T 0 0 0 0 0 10.3 2.1 2.1 0 0 0 0 0 0 0 0 5.1 0.2 0 T 0 0 0 0 2.2 T 7.9 0 T T 0 0 0 0 0 T 11.3 T 1.2 0 0 0 0 0 0 T 1.5 T 0 0 0
97
SNOWFALL
Jun Total 0 50.0 0 30.3 0 36.1 0 3.2 0 28.6 0 3.4 0 1.0 0 11.5 0 18.8
0 21.8 0 12.3 0 3.0 0 25.5 0 35.1 0 9.3 0 31.2 0 14.0 0 1.3 0 41.6 0 13.0 0 0.7 0 60.9 { ;.
0 16.5 0 23.0
0 9.1 0 8.8 0 6.5 0 23.8 0 1.4 0 15.9 0 7.2 0 4.9 0 2.4
0 2.6 0 4.0 0 6.5 0 1.9 0 15.8 0 14.5 0 5.3 0 10.1 0 12.5 0 1.5

SNOWFALL
Season Jul Aug Sep Oct Nov Dec Jati Feb·. Mar Apr May Jun Total 1914-15 0 0 0 0 0 T T 0 0 0 0 0 T 1915-16 0 0 0 0 0 . T 32.9 8.2 1.9. 0 0 0 43.0 1916-17 0 0 0 0 b 1.6 4.5 13.3 0.2 0 0 0 19.6 1917-18 0 0 0 b . 0 0 0 6.6 T 0 0 0 6.6' 1918-19 o· 0 0 0 0 0 0 T b 0 0 0 T 1919-20 0 0 0 0 0 17.5 T T 1.5 T 0 0 19.0 1920-21 0 0 0 0 T 0.1 0.7 . 2.4 T T 0 0 3.2 192h22 0 0 0 0. 0 4.3 1.7 T. .T T T 0 6.0 1922-23 0 0 0 0 T 7.9 1.0 13.3. T 0 0 0 22.2 1923-24 0 0 0 0 0 0.1 .4.8 .0 T 0.1' 0 0 5.0 1924-25 0 0 0 0 0 3.7 ... T 0 b 0 0 0 3.7 1925-26 0 0 0 .0 0 0 I o_ 0 0 0 0 0 0
1926-27 0 0 0 0 .0 .. 4.2 16.2 0 0 T 0 0 .20.4 1927-28 .0 . 0 0 0 0 . .. 2.3 2.0 T 0 T 0 0 4.3 1928-29 0 0 0 0 0 0.2 13.2 T 0.2 T T 0 13.6
1929-30 0 0 0 0 0 T 16.4. T 0 0 0 0 16.4 1930-31 0 0 0 0 . 0 T 0 0 T 0 0. 0 T 1931-32 0 0 0 0 0 1.0 9.8 4.3 T 0 0 0 15.1 1932-33 0 0 0 0 0 .1.2, 8.7 2.4 T 1.7 0 0 14.0 1933-34 0 0 0 0 0 0.1 0 0 0 0 0 0 0.1 1934-35 0 0 0 0 0 T 6.7 0 T 0 0 0 6.7 1935-36 0 0 0 0.6 0 0 0 3.3 1.6 5.2 0 0 10.7 1936-37 0 0 0 0 0 0.5 18.0 15.9 0 0 0 0 34.3 1937-38 0 0 0 0 0 2.4 0.9 1.4 . 0.7 0 0 0 5.4 1938-39 0 0 0 0 T 0.6 T 5.4 T 0 0 0 6.1)
1939-40 0 0 0 0 0 0 T 0 0 0 0 0 T 1940-41 0 0 0 0 0 0 T 0 0 0 0 0 T. 1941-42 0 0 0 0 0 T 0.5 T 0 0 0 0 0.5 1942-43 0 0 0 0 0 2.0 17.3. T .T 0 0 0 . 19.3 1943-44 0 0 0 0 0 0 0.2 0 0 0 0 '0 0.2 1944-45 0 0 0. 0 0. 0 0 0 T. 0 0 0 .t 1945-46 0 0 0 0 0 0 . .T T 0.6 ' 0 0 0 . 0.6 1946-47 O· 0 0 0 .0.5 0 2.0 0 0 0 0 0 2.5
1947-48 0 0 0 () 0 0 0.9 0.3 T T 0 0 1.2 1948-49 0 0 0. 0 0 T 9.8 13.2 0 0 0 0 23.0 < I•
1949-50 0 0 T 0 0 0.2 41.4 2.1 0.8 0 T 0. 44.5 1950-51 0 0 0 0.2 0 0 0.2 T 12.9 0 0 0 13.3 1951-52 0 0 0 0 ,, 0 0.7 8.9 T T T 0 0 9.6 1952-53 0 0 0 0 T T T .T T 0 0.6 0 0.6 1953-54 0 0 0 0 T T 10.6 0 T T 0 0 10.6 1954-55 0 0 0 0 0 1.2 1.1 L3 0.8 T T 0 4.4 1955-56 0 0 0 T 8.2 2.0 9.3 1.1 1.8 0 0 0 22.4 1956-57 0 0 0 0 0 2.6 4.2 1.4 T 0 0 .0 8.2 1957-58 0 0 0 0 0 T 0 0 0 0 0 0 T 1958-59 0 0 0 0 T 0 0.9 2.0 t b 0 0 2.9
98

SNOWFALL
99

SNOWFALL EXTREMES
SNOWFALL EXTREMES
MOST CONSECUTIVE DAYS WITH SNOW ON THE GROUND OF ... (1950-1995)
Accumulation Days Dates . Daily Snow Depth (inches)
1 Inch or More 28 days Jan 12-Feb 12, 1950 7/817/8/8/8/13/12/8/6/4/5/4/ Accumulation 6/11112/12/15/15/14113/13/
14/13/9/6/3/2 12 days Jan 27-Feb 8, 1956 9/6/3/2/2/1/1/1/1/1/1/1 10 days Dec 29, 1968-Jan 7, 1969 1/5/9/9/7/7/7/5/4/1 8days Jan 26-Feb 3, 1969 4/8/6/6/10/8/5/3 6days January 3-7, 1952 115/4/5/4/1 5days January 8-14, 1980 2/5/1017/2
· 5 days · January 19-26, 1960 · ' ' f/5151111 "
3::.4 days occurred often, especially irt the 1960s ..
6 Inches or More 13 days Jan 26-Feb 7, 1950 6/11112/12/15/15/14113/13/ Accumulation 14/13/9/6
10 days · January 13-22, 1050 7/817/8/8/8/13/12/8/6 5days Dec 31, 1968-Jan 4, 1969 9/9171717 2days January 10-11, 1980 1017 2days December 19-20, 1964 1117 2days January 27-28, 1956 1117
12 Inches or More 9days Jan 28-Feb 5 1950 12/12/15/15/14/13/13/14/13 Accumulation 2days January 19-20, 1950 13/12
1 Precipitation fell as hail.
100
"''

SUNSHINE AND CLOUD DATA
101

DAYS PC/CLEAR/CLOUDY
DAYS CLOUDY, PARTLY CLOUDY, AND CLEAR
NUMBER OF DAYS CLOUDY, PARTLY CLOUDY, AND CLEAR 30.0
25.0
20.0
days
15.0
10.0
5.0
0.0
.
.YN """"'!
! I ~ :~ ~
I I I
-a--
---o--
1~. \< .,t_; _..
Cloudy Partly Cloudy . .,/' Clear /
.v I
~ C>< .v
I"""' ........... ~ ~ ~ ~
Jan Feb Mar Apr May Jun Jul Aug Sep Oct Nov Dec
1961-90 Normals
AVERAGE DAYS CLEAR/PARTLY CLOUDY/CLOUDY*
MONTH CLR P.C. CLDY MONTH CLR P.C. CLDY
JANUARY 2.9 3.6 24.5 JULY 12.7 8.6 9.8 FEBRUARY 2.9 3.8 21.6 AUGUST 11.4 9.6 10.1 MARCH 3.2 4.9 22.9 SEPTEMBER 10.3 8.1 11.6 APRIL 3.5 5.8 20.7 OCTOBER 5.5 7.5 18.0 MAY 4.9 7.2 19.0 NOVEMBER 2.8 4.3 22.9 JUNE 6.2 7.7 16.1 DECEMBER 2.1 3.3 25.5
ANNUALLY 68.3 74.3 222.7
TERMINOLOGY: CLEAR= 0.0 to 0.3 cloud cover, PARTLY CLOUDY= 0.4 to 0.7 cloud cover, CLOUDY = 0.8 to 1.0 cloud cover.
NOTE: Values based on 1961-90 Normals.
LONGEST PERIODS WITH CONSECUTIVE DAYS WITH .•• (1949-1995)
CLOUDY SKIES:
CLEARDAYS:
61 days 54 days 38 days 35 days 35 days 35 days 34days 34days
12 days 11 days 11 days 11 days 10 days 9days
102
December 1, 1966-January 30, 1967 February 1-March 26, 1961 November 4-December 11, 1953 January 5-February 8, 1953 January 3-February 6, 1952 December 2, 1950-January 5, 1951 December 14, 1989-January 16, 1990 January 16-February 18, 1978
August 23-September, 3 1972 July 16-26, 1988 July 14-24, 1960 July 15-25, 1956 July 25-August 3, 1966 Occurs frequently

EQQ
DAYS WITH DENSE FOG (Visibility 114 mile or less)
Month Normals Greatest Year
January 4.3 days 11 days 1963 February 3.7 days 9days 1988 March 2.4 days 6days 1981 April 1.1 days 4days 1979 May 0.2 days 2days 1965 June 0.1 day 1 day 1985 July 0.1 day 1 day 1983 August 0.2 day 4days 1984 September 2.7 days 10 days 1950 October 7.2 days 16 days 1949 November 6.1 days 18 days 1976 December 4.9 days 17 days 1976
Annually 32.9 days 63 days 1976
NOTE: Normals based on 1961-90dataandgreatestvalues areforperiodofrecord 1911-1995. Most recent occurrence listed.
MOST CONSECUTIVE DAYS WITH ..• (1949-1995)
DENSE FOG: (visibility 114 mile or less)
ALL FOG: (no visibility restrictions)
10 days October 14-23, 1986 8 days October 18-25, 1949 7 days February 12-18, 1985 5 days November 7-11, 1993 5 days December 16-20, 1993 4 days January 16-19, 1991 ·· 4 days December 5-8, 1984 3 days are common, especially in October through December.
20 days October 13-November 1, 1983 17 days November 5-21, 1993 15 days December 29, 1983-January 13, 1984 14days, November21-December4, 1995 13 days December 19-31, 1989 11 days · November 28-December 8, 1959 10 days* November 10-19, 1995 9 days* October 18-26, 1988 8 days* February 11-18, 1985 7 days December 9-15, 1995 6 days are common, especially October through December.
* Has occurred frequently, most recent occurrence is listed.
103
FOG

MONTHLY SUNSHINE
1891 1892 1893 1894 1895 1896 1897 1898 1899 1900 1901 1902 1903 1904 1905 1906 1907 1908 1909 1910 1911 1912 1913 1914 1915 1916 1917 1918 1919 1920 1921 1922 1923 1924 1925 1926 1927 1928 1929 1930 1931 1932
MONTHLY PERCENTAGE OF POSSIBLE SUNSHINE RECEIVED IN PORTLAND (1891-1995)
OFFICIAL RECORDS START ·JANUARY 1, 1891 34 24 32 24 54 31 72 65 47 43 20 17 39 22 35 40 30 56 52 58 59 39 47 31 33 42 38 18 30 22 38 42 72 66 37 44 31 16 38 16 23 24 37 45 34 79 72 44 30 28 43 39 23 38 48 57 44. 73 71 93 48 66 31 13 48 26 30 44 30 34 62 87 44 .. 63 59 23 13 42 24 25 27 65 61 45 69 82 45 58 23 28 49 31 27 54 56 56 66 74 62 . 59 41 20 32 51 8 22 39 41 24 55 70 38 60 33 19 23 36
34 22 47 . 47 32 44 62 52 49 29 32 14 39 23 31 38 51 46- 40 66 72 48 43 13 13 40
27 14 22 33 34 62 74. 79 62 47 20 23 41 29 52 48 49 53 54 65 . 63 62 47 20 34 48 17 29 23 49 58 73 63 67 55 46 16 23 43 33 56 41 66 40 48 83 71 49 45 38 8 48 17 49 48 63 54 50 81 63 43 39 22 17 45 28 35 27 57 62 63 79 67 66 49 47 28 51 42 28 37 58 43 60 79 67 56 36 37 22 47 17 20 50 51 48 69 58 78 64 43 17 36 46
15 20 53 55 63 56 76 53 39 27 12 19 41 11 40 57 54 32 .51 70 60 29 44 19 17 40 20 34 49 21 56 55 52 44 52 32 17 17 37 14 46 29 39 50 44 55 63 64 39 21 30 41 9 26 41 44 62 44 72 69 29 35 22 35 41
30 29 47 57 37 61 55 75 35 35 6 15 38 11 37 24 50 38 . 48 50 66 54 63 35 15 41 31 27 32 21 26 63 80 72 37 60 46 4 42 16 31 37 65 59 76 69 54 ·.75 43 29 30 49 40 29 .48 44 60 69 78 .72 60 40 33 50 52 52 63 33 45 76 60 68 74 44 29 55 20 52 26 31 43 51 68 62 81 75 66 48 20 28 50 30 47 45 53 64 76 81 . 74 64 34 42 17 . 53 19 47. 63 70 67 54 60 73 63 50 42 19 53 25 25 41 59 63 62 80 63 64 32 32 32 47 18 25 38 52. 62 70 83 70 54 52 22 42 49 50 33 64 64 45 70 . 79 60 55 36 17 11 49 18 33 37 56 33 40 65 69 42 32 5 20 38 19 40 32 39 71 38 62 60 45 29 22 31 41 29 48 34 37 53 50 79 73 76 60 48 18 50 39 31 63 45 48 58 71 69 49 49 40 30 49 30 33 34 62 69 56 83 81 47 45 39 20 50 22 32 28 48 47 72 69 62 80 34 18 37 46
104

MONTHLY SUNSHINE
105

.MONTHLY .SUNSHINE
NORMAL PERCENTAGE OF POSSIBLE SUNSHINE , y RECEIVED AT PORTLAND ... .
75 70 65
.. 60 55 50
percent 45 40 35 30 25 20 15 10
5 0
(based on 1961-90 data)
Jan Feb Mar Apr May Jun Jul Aug Sep Oct Nov Dec
106

SUNNIEST/CLOUDIEST MONTHS
MONTHLY and ANNUAL PERCENTAGE OF POSSIBLE SUNSHINE RECEIVED AT PORTLAND
FIVE LEAST AND MOST SUNNY*
MOST LEAST MOST LEAST JANUARY 56% 1980 7% 1982 FEBRUARY 63% 1987 7% 1961
53 1987 8 1971 61 1980 14 1902 52 1920 9 1914 60 1993 15 1956 51 1977 11 1916 58 1970 16 1933 50 1985 13 1960 56 1905 18 1979
AVERAGE (1961-90) 28% AVERAGE (1961-90) 38%
MARCH 79% 1978 20% 1957 APRIL 76% 1977 21% 1917 74 1969 22 1902 75 1981 22 1963 73 1981 23 1904 70 1987 24 1955 68 1976 24 1916 69 1983 29 1953 67 1985 27 1907 68 1952 30 1896
AVERAGE (1961-90) 48% AVERAGE (1961-90) 52%
MAY 82% 1979 24% 1899 JUNE 88% 1987 27% 1953 79 1992 26 1917 82 1979 31 1891 76 1920 27 1962 77 1940 34 1894 75 1987 31 1953 76 1922 36 1959 73 1938 32 1911 75 1961 37 1956
AVERAGE (1961-90) 57% AVERAGE (1961-90) 56%
JULY 88% 1984 34% 1993 AUGUST 93% 1895 38% 1899 87 1896 38 1955 89 1984 40 1954 85 1985 41 1963 82 1958 43. 1953 84 1979 50 1916 81 1967 44 1912 83 1933 52 1912 79 1972 49 1968
AVERAGE (1961-90) 69% AVERAGE (1961-90) 66%
SEPTEMBER 81% 1975 29% 1914 OCTOBER 69% 1978 14% 1956 80 1932 33 1941 68 1987 22 1975 79 1991 35 1915 66 1895 27 1984 78 1989 36 1959 63 1952 28 1955 77 1983 37 1917 62 1991 29 1940
AVERAGE (1961-90) 62% AVERAGE (1961-90) 44%,
NOVEMBER 64% 1936 5% 1927 DECEMBER 60% 1985 4% 1933 55 1920 6 1915 50 1919 6 1936 54 1961 11 1971 49 1943 7 1942 50 1979 12 1953 47 1986 8 1981 48 1952 13 1934 46 1979 9 1971
AVERAGE (1961-90) 28% AVERAGE (1961-90) 23%
ANNUALLY MOST SUNNY YEARS LEAST SUNNY YEARS 64% 1987 36% 1955
AVERAGE (1961-90) 63 1979 37 1912 48% 62 1978 38 1927
60 1981 39 1963 59 1985 40 1956
*Some months of different years may have same percentage. In this case the most recent occurrence is listed
107

SUNRISE AND SUNSET
WSFO PORTLAND OREGON
SUNRISE AND SUNSET TIMES FOR THE YEAR 1996
Calculated for the location at latitude : 45 deg 36 min H, longitude : 122 deg 36 lin M Local standard tiaes are listed. Add +8 hours to convert td UTC. Add 1 hour to convert to daylight savings tile when it is in use.
:::::::::::::::::::::::::::::~:::::::~~::::::~::::::::::::::::::::::::::::::::::::::~:::::::::~::::::::::::::::::::::::::::::::::
\l JAN l F'EB .. l l liAR l APR l l . KAY l JUN l l JUL l AUG l l SEP l OCT l l HOV l DEC l DAYl SR - SS l SR - SS l l SR - SS l SR - SS :1 SR- SS l SR - SS l l SR - SS l SR - SS l l SR - SS l SR - SS l l SR - SS l SR - SS l
01 0751-1636 0732•1715 02 0751-1637 0731-1716 03 0751~1638 0730-1718 04 0751-1639 0728-1719
05 0751-1640 0727-1721 06 0750-1641 072671722 07 0750-1642 0725-1723 08 0750-1643 0723-1725
09 0750-1644 0722-1726 10 0749-1645 0720~1728 11 0749-1646 0719-1729 12 0749-1648 0717-1731
13 0748-1649 0716-1732 14 0748-1650 0714-1734 ~5 0747-1651 0713:-1735 16 0747-1653 0711~1737
17 0746-1654 0710-1738 18 0745-1655 0708-1739 19 0745-1656 0707-1741 20 0744-1658 0705-1742
0648-1756 OS50-1838 0458-1917 0425~1952 0646-1758 0548-1839 0456-1918 0424-1953 0644-1759 0.546-1841 0455-1919 0424-1953 064.3-1801 0544-'1842 0453-1921 0423-1954
0641-1802 05'42-1843 0452~1922 0423-1955 06$9-1803 0540-1844 0451-1923 0422-1956 0637-1805 0539-1846 0449-1924 0422-1956 0635-'1806 053.7-1847 0448-1926 0422-1957
0633J1807 0535-1848 .0447-1927 0422-1958 0631-1809 0533-1850 0445-1928 0421-1958 '0630-1810 0531~1851 0444-1929 0421-1959 0628-1812 0529-1852. 0443-1930 0421-1959
0626-1813 0528·1854, 0442-1932 0421-2000 0624•1814 0526-1855 0440-1933 0421-2001 0622-1816 0524-1856 0439-1934 0421-2001 0620-1817 0522-1.857 0438-1935 0421-2001
0618-1818 0521-1859 0437-1936 0421-2002 0616-1820 0519-1900 0436-1937 0421-2002 0614-1821 0517-1901. 0435-1939 0421-2002 0613-1822 0515-1903. 0434-1940 0421-2003
0426-2003 0455-1939 0426-2003 0456-1938 0427-2003 0457-1937 0427-2002 0458-1935
053Z:-1849 0609-1752 0533~1847 0610-1750 0535-1845 0612-1748 0536-1843 0613-1746
0428-2002 0459-1934 •0537-1842 0614-1744 0429-2002 0500-1932 0538-1840 0616-1742 0430-2001 0502-1931 0539-1838 0617-1740 0430-2001 0503-1930 0541:-1836 0618-1739
0431-2000 0504-1928 05~2-1834 0620-1737 0432-2000 050S-1927 0543-1832 0621-1735 0433-1959 0506-1925 0544-1830 0622-1733 0434-1959 0508-1923 0546-1828 0623-1731
0435-1958 0509-1922 0435-1957 0510-1920 0436-1957 0511-1919 0437-1956 0513-1917
0438-1955 0514-1915 0439-1954,0515-1914 0440-1953 0516-1912 0441-1952 0517-1~10
0547-1826 0625-1729 0548-1824 0626G1728 0549-1823 0627-1726 0551-1821 0629-1724
0552-1819 0630-1722 0553•1817 0631-1721 0554-1815 0633-1719 0555-1813 0634-1717
'
0651-1658 0731-1629 0652-1657 0732-1628 0654-1655 0733-1628 0655-1654 0734-1628
0656-1653 0735-1627 0658-1651 0736-1627 0659-1650·0737-1627 0701-1649 0738-1627
0702-1647 0739-1627 0703-1646 0740-1627 0705-1645 0741-1627 0706-1644 0742-1627
0708-1643 0743-1627 0709-1642 0744-1627 0710-1641 0744-1627 0712-1640 0745-1628
0713-1639 0746-1628 0715-1638 0746-1628 0716-1637 0747-1628 0717-1636 0747-1629
21 0743-1659 0703-1744 0611-1824 0514-1904 0433-1941 0422-2003 0442-1951 0519-1909 0557-1811 0636-.1715 0719-1635 0748-1629 22' 0742-1701 0702-1745 0609-1825 0512-1905 0432-1942 0422-2003 0443-1951 0520-1907 0558-1809 0637-1714 0720-1634 0748-1630 23 0741-1702 0700.,.1747 060(d826 0510•1906 0431-1943 0422-~003 0444-1950 0521-1905 0559-1807 0638-1712 0721-1633 0749-1630 24 0740-1703 0658-1748 0605-1827,0509-1908 -0430-1944 0422-2003 0446-19~9 9522-1904 0600-1805 0640-1711 0722-1633 0749-1631
25 0740-1705 0657-1749 0603~1829.0507-1909 0429-1945 0423-2003 0447-1947 0524-1902 0602-1803 0641-1709 0724-1632 0750-1632 26 0739-1706 0655-1751 0601-1830 0506-1910 0429-1946 0423-2003 0448-1946 0525-1900 0603-1801 0642-1707 0725-1631 0750-1632 27 0738-1708 0653-1752 0559-1831 0504-1912 0428-1947 0424-2003 0449-1945 0526-1858 0604-1759 0644-1706 0726-1631 0750-1633 28 0737-1709 0651-1754 0557-1833 0502-1913 0427-1948 0424-2003 0450-1944 0527-1856 0605-1757 0645-1704 0727-1630 0750-1634
29 0735-1710 0650-1755 0555-1834 0501-1914 0427-1949 0425-2003 0451-1943 0528~1855 0607-1755 0647-1703 0729-1630 0751-1634 30 0734-1712 0554-1835 0459·1915 0426-1950 0425~2003 0452-1942 0530-1853 0608-1754 0648-1701 0730-1629 0751-16~5 31 0733-1713 0552-1837 0425-1951 0453-1940 0531-1851 0649-1700 0751-1636 ::::::::::::::::::;:::::::::::::::::::::::::::::::::::::::::~:::::::::::::::::::::::::::::::::::::::::::::::::::::::::::::::::::
This table Kas calculated using an algoritha f.ro1 UHITED STATES NAVAL OBSERVATORY CIRCULAR HO. 171 1 Feb. 19, 1987
108

OTHER CLIMATIC DATA
109

PRESSURE
PRESSURE: MONTHLY NORMAL AND EXTREME VALUES*
PRESSURE: MONTHLY NORMALS AND EXTREMES 30.90
30.70 30.50
30.30
30.10
,.I; i : ; ..}, ..!, _.... -"·f····""""~' .......... -. .... HIGHESTRECORDED ...... ?"'""'" ......... .... T----m- : i · /"
HIGHEST EVER: 30.54" ~ . --· _,. on February 2, 1880 .......... !"""""t""""" .......... ......... NORMAL"' ....
29.90
inches 29.70
29.50
29.30
29.10 28.90
28.70
28.50
~ LOWESTRECORDED ,V. --1 ~
~ \. / ' ~ ~ / LOWEST EVER: 28.56
""" / on Janu~ry 9, 1880
Jan Feb Mar Apr May Jun Jul Aug Sep Oct Nov Dec
PRESSURE: MONTHLY NORMAL AND EXTREME VALUES IN INCHES
MONTH NORMAL HIGHEST LOWEST
January 30.08 30.78 in 1888 & 1963 28.56 in 1880 February 30.02 30.84 in 1880 28.92 in 1958 March 29.99 30.70 ~n 1955 28.93 in 1904 April 30.03 30.68 in 1936 29.12 in 1958 May 30.01 30.59 in 1931 29.27 in 1906 June 30.01 30.51 in 1895 29.37 in 1907
July 30.01 30.41 in 1875 & 1944 29.54 in 1879 August 29.98 30.39 in 1876 29.44 in 1951 September 29.98 30.49 in 1937 29.35 in 1920 October 30.04 30.63 in 1932 & 1935 28.84 in 1962 November 30.04 30.74 in 1928 29.03 in 1871 December 30.08 30.79 in 1879 28.71 in 1995
EXTREME RECORDS 30.84 on Feb 2,1880 28.56 in Jan 9,1880
*Extreme values are for records from 1871 through 1995. Normals are from the 30-yearvalues (1961-90).
110

WIND
WIND DATA*
MONTHLY AND ANNUAL AVERAGE WIND SPEED: S WINDIEST* (1951-1995)
January· 15.1 1995 February 12.2 1993 March 10.9 1956 13.5 1993 12.1 1989 10.2 1989 12.7 1961 11.4 1982 10.1 1995_ 12.2 1973 11.0 1976 9.8 1975-12.0 1974 10.9 1976 9.7 1957'
April 9.3 1981 May 8.6 1963 June 9.1 197~-9.2 1958 8.5 1974 8.8 1979 8.9 1993 8.4 1975 8.6 1962 8.5 1955 8.2 1978 8.5 1977 8.4 1980 8.1 1979 8.3 1981
July 8.9 1962 August 8.7 1966 September 8.0 1961 8.8 1981 8.3 1975 7.9 1971 8.7 1967 8.2 1994 7.8 1981 8.6 1961 8.1 1963 7.7 1979 8.5 1994 8.0 1981 7.4 1977
October 8.4 1975 November 11.2 1979 December 12.9 1977 8.3 1957 11.0 1963 12.0 1955 8.2 1982 10.7 1977 11.9 1972 8.0 1963 10.4 1983 11.8 1968 7.8 1979 10.1 1970 11.7 1964
FIVE WINDIEST YEARS 8.8 1995 8.5 1957 8.3 1994 8.6 1961 8.4 1963
* Wind speed are in miles per hour (mph). Year of most recent occurrence listed. # The Fastest Mile is the speed it takes for one mile of wind to pass a given point in one minute. % Estimated peak wind, due to breakage of wind gauge equipment during Columbus Day windstorm. + Tbis peak wind gust recorded after ASOS (Automatic Smface Observation System) became operational. Unofficial peak wind from gust recorders was 74 mph.
111

RELA TIVEHUMIDITY
AVERAGE RELATIVE HUMIDITY BASED. ON TIME OF DAY*
70
% 60
MONTH· 0400
JANUARY 86 FEBRUARY 86 MARCH 86 'APRIL 86 MAY 85 JUNE 84
RELATIVE IIUMIDITY
Jan Feb Mar Apr May Jun Jul Aug Sep .Oct Nov Dec AVERAGE VALUES FROM 1961-90
AVERAGE RELATIVE HUMIDITY (in percentage)
HOUR (LST) MONTH HOUR(LST) 1000 1600 2200 0400 1000 1600 2200
'82 75 83 JULY 82 62 45 68 80 67 81 AUGUST 84 64 46 70 73 60 78 SEPTEMBER 87 67. 48 75 69 55 75 OCTOBER 90 78 62 84 66 53 74 NOVEMBER 88 82 74 84 65 49 7i DECEMBER 87 84 .. 78 85
ANNUMLY 86 73 59 77
*Averages based on 1961-90 data. ·
112

ROSEPARADEWEATHER
ROSE PARADE WEATHER
The annual Rose Parade is held in downtown Portland during early June, a time of transition from spring into summer. The weather can be cool and rainy or hot and dry.
Twenty-seven of the last 77 parade days have had measurable rainfall. The wettest parade day was June 9, 1950 when 0.57 inch felL The next wettest was June 12, 1982 with 0.50 inch of rain.
The warmest parade day was June 15, 1963 when the mercury rose to 93 degrees while the coldest day was June 9, 1933 with a cool 57 degrees. Over the past 77 years, the average parade day temperature was 70.7 degrees.
More detailed climate data has been available since 1955. The following are some parade time averages between the years 1955-1995:
Temperature................ 63 F Relative Humidity.................. 64% Wind................ NW at 7 mph Probability of rain (early June) ... .33% Cloudy days ... 25 Partly cloudy days ... 8 Sunny days ... 8 Rainy days ... 11.
Here is a detailed account of the early parade day weather history:
DATE TE11PERATURE "RAIN DATE TE11PERATURE RAIN HI LO inch HI LO inch
June 4 1908 64 49 0 June9 1933 57 46 0.31 8 1909 82 51 0 14 1934 75 53 0 9 1910 74 48 0 7 1935 72 58 0 8 . 1911 63 47 0 12 1936 78 58 0 13 1912 66 51 0.12 11 1937 70 55 0.40 12 1913 73 56 0.09 10 1938 82 48 0 11 1914 77 55 0 9 1939 71 55 Trace 10 1915 62 48 0.25 7 1940 68 54 0.03 8 1916 66 50 0 13 1941 69 55 0 12 1919 72 49 0.13 7 1946 70 51 0.17 24 1920 59 45 0.11 13 1947 69 54 Trace 13 1923 58 49 0.03 12 1948 66 56 0.19 12 1924 72 56 0 10 1949 71 58 0 18 1925 74 53 0 9 1950 77 53 0.57 16 1927 70 54 0.08 8 1951 72 49 0 13 1930 66 50 0 13 1952 69 46 0.04 12 1931 80 53 Trace 12 1953 61 52 0.38 17 1932 75 46 0 12 1954 65 54 0.11
Missing years are due to no parade (such as during World War II) or incomplete data.
...., ___
,.,._.,.
The next page shows continued parade weather history with more detail during the last 40 years (1955-1995).
113

ROSEPARADEWEATHER
PARADE DAY WEATHER (1955-1995)
Date Sky Parade Afternoon Morning Avg Avg. Wind Rainfrut Condition Tem12 High · Low R.H. lOam-Noon (inches}
6.11.55 Mostly Cloudy 58 76 66 66% NW 8mph 0 6.09.56 Cloudy 66 77 56 66 E 6 0.12 6.15.57 Cloudy 58 67 50 75 NW 3 Trace 6.14.58 Cloudy 63 75 58 70 NW 10 0 6.13.59 Partly Cloudy 61 64 53 67 w 6 0
6.11.60 Cloudy 61 75 52 63 NW 9 0 6.10.61 Sunny 58 71 47 60 w 6 0.06 6.16.62 Mostly Cloudy 60 74 53 56 NW 7 0 6.15.63 Mostly Sunny 75 93 66 48 NW 4 0 6.13.64 Cloudy 62 72 55 65 NW 6 '0.02 6.12.65 Partly Cloudy 57 68 45 55 w 6 0 6.11.66 Cloudy 59 66 51 77 s 8 0.04 6.10.67 Cloudy 56 66 42 80 SE 13 Trace 6.08.68 Cloudy 57 61 54 74 NW 9 0 6.14.69 Sunny 65 82 61 63 w 10 Trace
6.13.70 Cloudy 64 70 58 58 CAlM Trace 6.12.71 Cloudy 60 64 49 61 NW 3 0 6.10.72 Sunny 60 70 47 58 N 3 0 6.09.73 Mostly Cloudy 61. 69 50 45 N 5 0 6.15.74 Cloudy 66 71 59 56 NW 6 0 6.14.75 Partly Cloudy 70 84 58 55 N 5 b 6.12.76 Cloudy 59 . ·.·63 43 57 NW 8 0 6.11.77 Cloudy 58 65 52 70 NE 5 0 6.10.78 Cloudy 58 63 53 82 sw 12 0.24 6.09.79 Sunny 74 85 53 50 NW 8 ,0
6.12.80 Cloudy 60 62 56 75 sw 5 0.06 6.13.81 Mostly Cloudy 55 66 48 72 NW ~0 0 6.12.82 Light Rain 55 60. 55 90 s 4. 0.50 6.11.83 Cloudy 60 66 53 65 s 6 0.19 evening 6.09.84 Cloudy 56 66 52 71 NW 5 , 0.09 am rain 6.08.85 Partly Cloudy 62 71 45 64 NW 8 0 6.07.86 Cl,oudy , 59 69 53 75 NW 6 Trace 6.06.87 Sunny 61 75 51 64 NW 1 ·o , 6.11.88 Sunny 59 73 ' 46 55 w 7' 0 6.10.89 Sunny 61 78 50 65 NW 4 0
6.09.90 Cloudy 59 65 58 80 NW 8 0.43 6.08.91 Partly Cloudy 65 73 54 65 NW 6 0 6.06.92 Partly Cloudy 69 82 52 55 NW 7 0 6.12.93 Partly Cloudy 59 71 51 65 NW 4 Trace 6.11.94 Partly Cloudy 63 81 58 61 w 7 0 6.10.95 Cloudy 61 64 50 72 s 8 0.10
114
141 Comparison of LFM and MFM Precipitation Guidance for Nevada During Doreen. Christopher Hill, April1979. (PB2986131AS)
142 The Usefulness of Data from Mountaintop Fire Lookout Stations in Determiring Atmospheric Stability. Jonathan W. Corey, April 1979. (PB298899/AS)
143 The Depth of the Marine Layer at San Diego as Related to Subsequent Cool Season Precipitation Episodes in Arizona. Ira S. Brenner, May 1979. (PB298817/AS)
144 Arizona Cool Season Climatological Surface VVind and Pressure Gradient Study. Ira S. Brenner, May 1979. (PB298900/AS)
148 The BART Experiment MorrisS. Webb, October 1979. (PB80 155112) 147 Occurrence end Distribution of Flash Floods in the Western Region. Thomas L. Dietrich, December
1979. (PBSO 160344) 149 Misinterpretations of Precipitation Probability Forecasts. Allan H. Murphy, Sarah Lichtenstein, Baruch
Fischhoff, and Robert L. VVinkler, February 1980. (PBSO 174575) 150 Annual Data and Verification Tabulation - Eastern and Central North Pacific Tropical Storms and
Hurricanes 1979. Emil B. Gunther and Staff, EPHC, April1980. (PBBO 220486) 151 NMC Model Performance in the Northeast Pacific. James E. Overtand, PMEL-ERL, April1980.
(PB80 198033) 152 Climate of Satt Lake City, Utah. VVilliam J. Alder, Sean T. Buchanan, VVilliam Cope (Retired), James
A Cisco, Craig C. Schmidt, Alexander R. Smith (Retired, VVilbur E. F~ggins (Retired) April1996 -Sixth Revision)
153 An Automatic Lightning Detection System in Northam California. James E. Rea and Chris E. Fontana, June 1980. (PBSO 225592)
154 Regression Equation for the Peak VVind Gust 6 to 12 Hours in Advance at Great Falls During Strong Downslope Wnd Storms. Michael J. Oard, July 1980. (PB91 1 08367)
155 A Raininess Index for the Arizona Monsoon. John H. Ten Harl<el, July 1980. (PB81 106494) 156 The Effects of Terrain Distribution on Summer Thunderstorm Activity at Reno, Nevada. Christopher
Dean Hill, July 1960. (PB81102501) 157 An Operational Evaluation of the Scofield/Oiiver Technique for Estimating Precipitation Rates from
Satellite Imagery. Richard Ochoa, August 1980. (PB81 108227) 156 Hydrology Practicum. Thomas Dietrich, September 1980. (PB81134033) 159 Tropical Cyclone Effects on California. Arnold Count October 1980. (PB81 133779) 160 Eastern North Pacific Tropical Cyclone Occurrences During lntraseasonal Periods. Preston W.
Leftwich and Gail M. Brown, February 1981. (PB81 205494) 161 Solar Radiation as a Sole Source of Energy for Photovoitaics in Las Vegas, Nevada, for July and
December. Darryl Randerson, April1981. (PB81 224503) 162 A Systems Approach to Real-Time Runoff Analysis with a Deterministic Rainfall-Runoff Model.
Robert J.C. Bumash and R. Larry Ferral, April1981. (PB81 224495) 163 A Comparison of Two Methods for Forecasting Thunderstorms at Luke Air Force Base, Arizona. LTC
Kenh R. Cooley, April1981. (PB81 225393) 154 An Objective Aid for Forecasting Afternoon Relative Humidity Along the Washington Cascade East
Slopes. RobertS. Robinson, April1981. (PB81 23078) 165 Annual Data and VerifiCation Tabulation, Eastern North Pacific Tropical Storms and Hurricanes 1980.
Emil B. Gunther and Staff, May 1981. (PB82 230336) 186 Preliminary Estimates of VVind Power Potential at the Nevada Test Site. Howard G. Booth, June
1981. (PB82127036) 167 ARAP User's Guide. Mank Mathewson, July 1981, Revised September 1981. (PB82 196783) 168 Forecesting the Onset of Coastal Gales Off Washington-Oregon. John R. Zimmerman and VVilliam
D. Burton, August 1981. (PB82127051) 169 A Statistical-Dynamical Model for Prediction of Tropical Cyclone Motion in the Eastern North Pacific
Ocean. Preston W. Leftwich, Jr., October 1981. (PB82195298) 170 An Enhanced Plotter for Surface Airways Observations. Andrew J. Spry and Jeffrey L. Anderson,
October 1981. (PB82 153883) 171 Verification of 72-Hour 500-MB Map-Type Predictions. R.F. Quiring, November 1981. (PB82
158098) 172 Forecasting Heavy Snow at Wenatchee, Washington. James W. Holcomb, December 1981. (PB82
177783) 173 Central San Joaquin Valley Type Maps. Thomas R. Crossan, December 1981. (P882 196064) 174 ARAP Test Results. MankA Mathewson, December 1981. (PB82196103) 176 Approximations to the Peak Surface VVind Gusts from Desert Thunderstorms. Darryl Randerson,
June 1982. (PB82 253089) 177 Climate of Phoenix, Artzona. Robert J. Schmidli, April 1969 (Revised December 1986). (PBS?
142063/AS) 178 Annual Data end Verifteation Tabulation, Eastern North PacifiC Tropical Storms and Hurricanes 1982.
E.B. Gunther, June 1983. (PB85 106078) 179 Stratified Maximum Temperature Relationships Between Sixteen Zone Stations in Arizona and
Respective Key Stations. Ina S. Brenner, June 1983. (PB83 249904) 180 Standard Hydrologic Exchange Format (SHEF) Version I. Phillip A Pasteris, Vernon C. Bisset, David
G. Bennett, August 1983. (PB8S 106052) 181 Quantitative end Spacial Distribution of VVinter Precipitation along Utah's Wasatch Front Lawrence
B. Dunn, August 1983. (PBSS 106912) 182 500 Millibar Sign Frequency Teleconnection Charts- VVinter. Lawrence B. Dunn, December 1983.
(PBSS 1 06276) 183 SOC Millibar Sign Frequency Teleconnection Charts- Spring. Lawrence B. Dunn, January 1984.
(P88S 111367) 184 Collection and Use of Lightning Strike Data in the Western U.S. During Summer 1983. Glenn Rasch
and Marl< Mathewson, February 1984. (PBSS 110534) 185 500 Millibar Sign Frequency Teleconnection Charts - Summer. Lawrence B. Dunn, March 1984.
(PBSS 111359) 186 Annual Data and Verifteation Tabulation eastern North Pacific Tropical Storms and Hurricanes 1983.
E. B. Gunther, March 1984. (PBSS 1 09635) 187 500 Millibar Sign Frequency Teleconnection Charts- Fall. Lawrence B. Dunn, May 1984. (P88S
110930) 186 The Use and Interpretation of Isentropic Analyses. Jeffrey L. Anderson, October 1984. (PB85
132694) 189 Annual Data & Verification Tabulation Eastern North Pacific Tropical Storms and Hurricanes 1984.
E. B. Gunther and R.L. Cross, April1985. (PB851878687AS) 190 Great Sa~ Lake Effect Snowfall: Some Notes and An Example. David M. Carpenter, October 1985.
(P8861191S3/AS) 191 Large Scale Patterns Associated with Major Freeze Episodes in the Agricultural Southwest. Ronald
S. Hamitton and Glenn R. Lussky, December 1985. (P886144474AS) 192 NWR Voice Synthesis Project Phase I. GlenW. Sampson, January 1986. (P886145604/AS) 193 The MCC -An Overview and Case Study on Its Impact in the Western United States. Glenn R.
Lussky, March 1986. (PB86 170651/AS) 194 Annual Data end Verification Tabulation Eastern North Pacific Tropical Storms and Hurricanes 1985.
E.B. Gunther and R.L Cross, March 1986. (PB86170941/AS) 195 Redid Interpretation Guidelines. Roger G. Pappas, March 1986. (PB86177680/AS) 196 A Mesoscale Convective Complex Type Storm over the Desert Southwest Darryl Randerson, Aprtl
1986. (P886190998/AS) 197 The Effects of Eastern North Pacific Tropical Cyclones on the Southwestern United States. Wetter
Smith, August 1986. (PB87 106258AS) 196 Preliminary Lightning Climatology Studies for Idaho. Christopher D. Hill, Cart J. Gorski, and Michael
C. Conger, April1987. (P887 180196/AS)
199 Heavy Rains and Flooding in Montana: A Case for Slantwise Convection. Glenn R. Lussky, April 1987. (P887 1 85229/AS)
200 Annual Data and Verification Tabulation Eastern North Pacific Tropical Storms and ftlrricanes 1986. Roger L. Cross and Kenneth B. Mielke, September 1987. (Peas 110895/AS)
201 An Inexpensive Solution for the Mass Distribution of Satellite Images. Glen W. Sampson and George Clarl<, September 1987. (P888 114038/AS)
202 Annual Data and Verifteation Tabulation Eastern North PacifiC Tropical Storms and ftlrricanes 1987. Roger L Cross and Kenneth B. Mielke, September 1988. (PB88 101935/AS) .
203 An Investigation of the 24 September 1986 "Cold Sector'' Tornado Outbreak in Northern California. John P. Monteverdi and Scott A Braun, October 1988. (PB89 121297/AS)
204 Preliminary Analysis of Cloud-To-Ground Lightning in the Vicinity of the Nevada Test Stte. Carven Scott, November 1988. (P889128649/AS)
205 Forecast Guidelines For Fire Weather and Forecasters- How Nighttime Humidity Affects Wildland Fuels. David W. Goens, February 1989. (PB89162549/AS)
206 A Collection of Papers Related to Heavy Precipitation Forecasting. Western Region Headquarters. Scientific Services Division, August 1969. (PB89 230633/AS)
207 The Las Vegas McCarran International Airport Microburst of August 8, 1989. Carven A Scott, June 1990. (PBS0-240268)
208 Meteorological Factors Contributing to the Canyon Creek Fire Blowup, September 6 and 7, 1986. David W. Goens, June 1990. (PBS0-245085)
209 Stratus Surge Prediction Along the Central California Coast Peter Fetsch and Woodrow Whitlatch, December 1990. (PB91-129239)
210 Hydrotools. Tom Egger. January 1991. (P891-151787/AS) 211 A Northam Utah Soaker. Marl< E. Struthwo~. February 1991. (PB91-168716) 212 Preliminary Analysis of the San Francisco Rainfall Record: 1849-1990. Jan Null, May 1991.
(PB91-208439) 213 Idaho Zone Preforms~ Temperature Guidance, and Verification. Marl< A Mollner, July 1991.
(PB91-227 405/AS) 214 Emergency Operstional Meteorological Considerations During an Accidental Release of Hazardous
Chemicals. Peter Mueller and Jerry Galt, August 1991. (PB91-235424) 215 WeatherTools. Tom Egger, October 1991. (PB93-1849SO) 216 Creating MOS Equations for RAWS Stations Using Digital Model Data. Dennis D. Gettman,
December 1991. (PB92-131473/AS) 217 Forecasting Heavy Snow Events in Missoula, Montana Mike Richmond, May 1992. (PB92-196104) 218 NWS VVinter Weather Worl<shop in Portland, Oregon. Various Authors, December 1992. (P893-
146785) 219 A Case Study of the Operational Usefulness of the Sharp Worl<station in Forecasting a
Mesocycione-lnduced Cold Sector Tornado Event in California. John P. Monteverdi, March 1993. (PB93-178697)
220 Climate of Pendleton, Oregon. Claudia Bell, August 1993. (PB93-227536) 221 Utilization of the Bulk Richardson Number, Heiicity and Sounding Modification in the Assessment
of the Severe Convective Storms of 3 August 1992. Eric C. Evenson, September 1993. (PB94-131943)
222 Convective and Rotational Parameters Associated with Three Tornado Episodes in Northern and Central California. John P. Monteverdi and John Quadros, September 1993. (PB94-131943)
223 Climate of San Luis Obispo. California. Gary Ryan, February 1994. (PB94-162062) 224 Climate of Wenatchee, Washington. Michael W. McFartand, Roger G. Buckman, and Gregory E.
Matzen, March 1994. (PB94-184308) 225 Climate of Santa Barbana, California. Gary Ryan, December 1994. (PB95-173720) 226 Climate of Yakima, Washington. Greg DeVoir, David Hogan, and Jay Neher, December 1994.
(PB95-173686) 227 Climate of Kalispell, Montana. Chris Maier, December 1994. (PB95-169488) 228 Forecasting Minimum Temperatures in the Santa Maria Agricultural District VVi~red Pi and Peter
Fetsch, December 1994. (PB95-171088) 229 The 10 February 1994 Oroville Tornado-A Case Study. Mike Staudenmaier, Jr., April 1995.
(PB95-241873) 230 Santa Ana \"'lnds and the Fire Outbreak of Fall1993. Ivory Small, June 1995. (PB95-24186S) 231 Washington State Tornadoes. Treste Huse, July 1995. (P896-107024) 232 Fog Climatology at Spokane, Washington. Paul Frisbie, July 1995. (PB96-106604) 233 Storm Relative Isentropic Motion Associated with Cold Fronts in Northern Utah. Kevin B. Baker,
Kathleen A Hadley, and Lawrence B. Dunn, July 1995. (PB96-106596) 234 Some Climatological and Synoptic Aspects of Severe Weather Development in the Nortliwestem
United States. Eric C. Evenson and Robert H. Johns, October 1995. (PB96-112958) 235 Climate of Las Vegas, Nevada. Paul H. Skrbac and Scott Cordero, December 1995. (PB96-
13SSS3) . 236 Climate of Astoria, Oregon. Marl< A Mcinerney, January 1996. 237 The 6 July 1995 Severe Weather Events in the Northwestern United States: Recent Examples of
SSWEs. Eric C. Evenson, April1996. 236 Significant Weather Patterns Affecting West Central Montana. Joe Lester, May 1996.

NOAA SCIENTIFIC AND TECHNICAL PUBLICATIONS
The National Oceanic and Atmospheric Administration was established as part of the Department of Commerce on October 3, 1970. The mission responsibilities of NOAA are to assess the socioeconomi:: impact of natural and technological changes in the environment and to monitor and predict the state of the solid Earth, the oceans and their living resources, the atmosphere, and the space environment of the Earth.
The major components of NOAA regularly produce various types of scientific and technical information in the following kinds of publications.
PROFESSIONAL PAPERS-Important definic tive research results, major techniques, and special investigations.
CONTRACT AND GRANT REPORTS-Reports prepared by contractors or grantees under NOAA sponsorship.
ATLAS-Presentation of analyzed data generally in the form of maps showing distribution of rainfall, chemical and physical conditions of oceans and atmosphere, distribution of fishes and marine mammals, ionospheric conditions, etc.
TECHNICAL SERVICE PUBLICATIONS -Reports containing data, observations, instructions, etc. A partial listing includes data serials; prediction and outlook periodicals; technical manuals, training papers, planning reports, and information serials; and miscellaneous technical publications.
TECHNICAL REPORTS-Journal quality with extensive details, mathematical developments, or data listings.
TECHNICAL MEMORANDUMS-Reports of preliminary, partial, or negative research or technology results, interim instructions, and the like.
Information on availability of NOAA publications can be obtained from:
NATIONAL TECHNICAL INFORMATION SERVICE
U. S. DEPARTMENT OF COMMERCE
5285 PORT ROYAL ROAD
SPRINGFIELD, VA 22161