Embed Size (px)
Citation preview

NOAA Climate Change & Water Sector Webinar Series
March 20, 2015
Presentation Outline
• CRWU History
• Adaptation Strategies Guide
• Extreme Events Workshop Planner
• CREAT• Projections Map• Storm Surge Inundation and Hurricane Frequency
Map
• Pilots• Outreach
• Q&A 2

Housekeeping
• Please keep your lines on mute• Q&A breaks throughout presentation
– Type your questions into the chat box– Ask over the phone at the end of the
presentation
3

CRWU History
4
National Drinking Water Advisory Council Climate Ready Water Utilities (CRWU) Report
Final report provides EPA with recommendations on developing a CRWU initiative to support water sector climate resiliency.
Developing an Adaptive Response Framework
Fundamental guide to build out the concept of a climate ready water utility, integrates with other tools.

Mission Statement
To provide the water sector (drinking water, wastewater,
and stormwater utilities) with the practical tools, training, and technical assistance needed to adapt to
climate change by promoting a clear understanding of climate science and adaptation options.
5
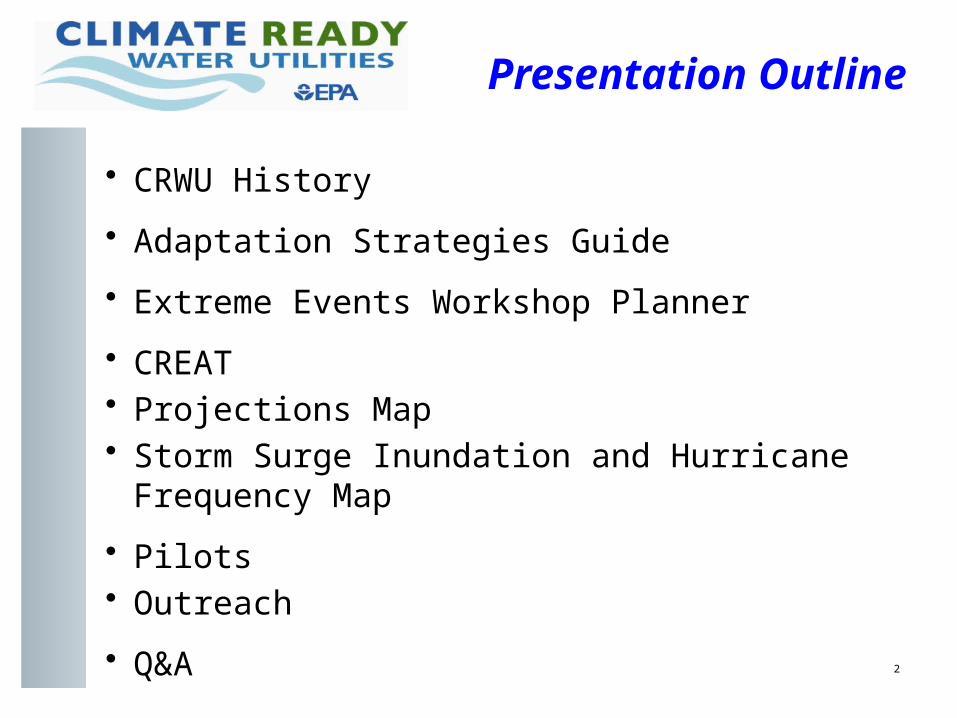
Climate Ready Process
Climate Ready Tools & Resources
6
Assess Risks and
Evaluate Opportunities
Collaborate with
Partners
Research and Gather
Information
Learn Climate and
Adaptation Basics
Explore
Elements of
Climate Readiness
Climate Resilience Evaluation
and
Awareness Tool
Extreme Events
Workshop Planner
ToolboxAdaptation
Strategies Guide
Adaptive Response
Framework

Adaptation Strategies Guide
7
Promoting a Clear Understanding of Adaptation Options

Overview
• Guide for utilities to consider climate change in utility planning
• Navigate guide like a website
• Goals:– Present easy-to-understand climate
science, translating data into impacts for utilities
– List adaptation strategies related to impacts
– Assist in the adaptation planning process
• Updates – Water conservation practices
– Climate data– Energy Management– Green Infrastructure 8

ASG Overview
9

Climate Region Briefs
10
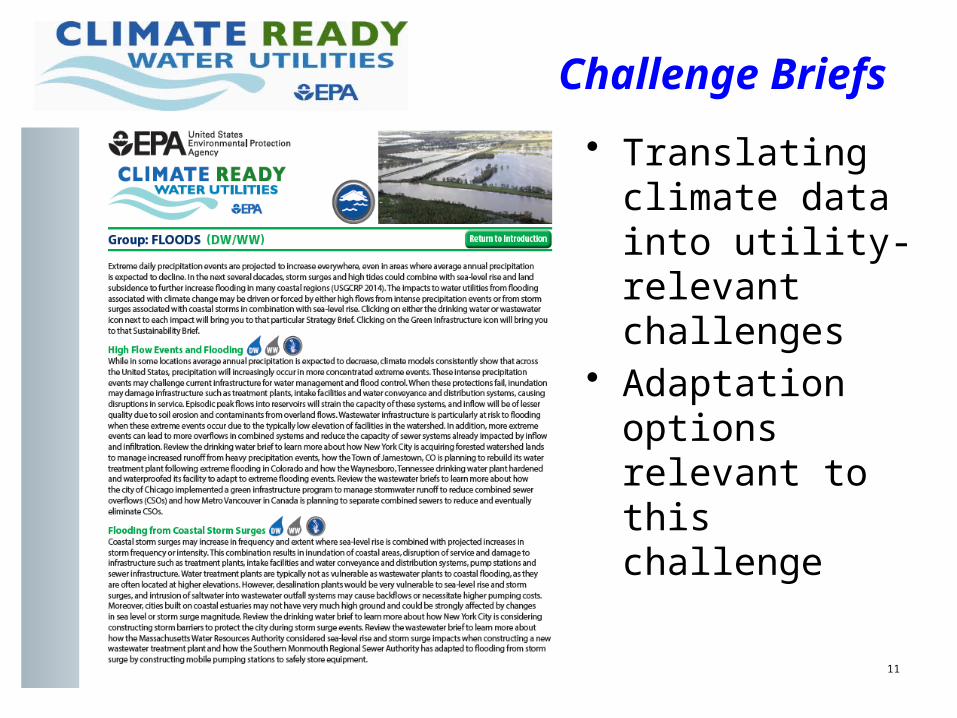
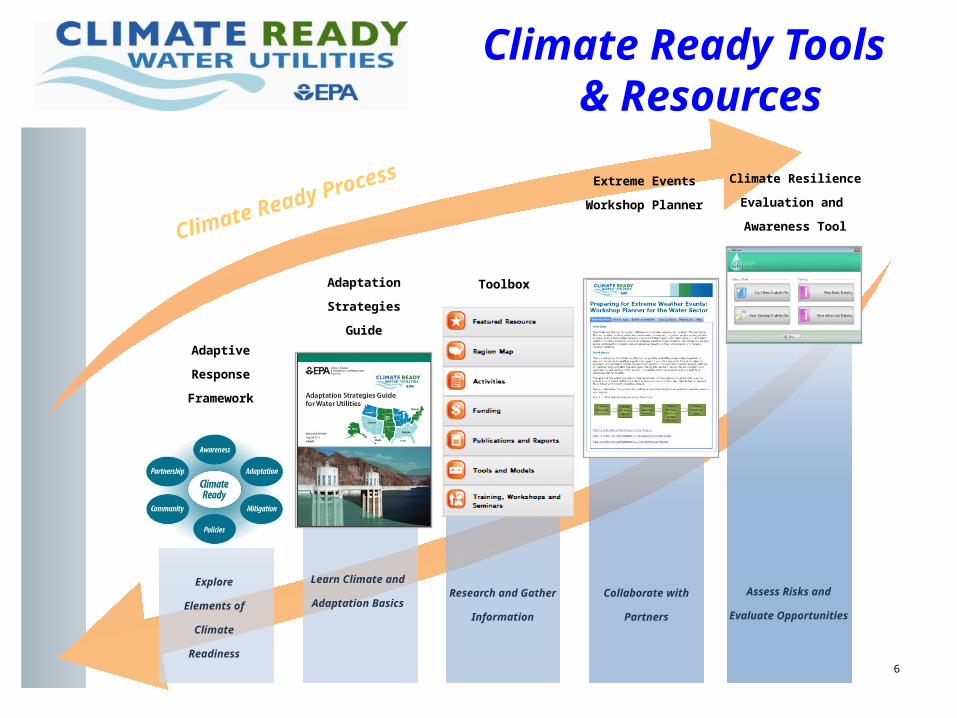
Challenge Briefs
• Translating climate data into utility-relevant challenges
• Adaptation options relevant to this challenge
11

Adaptation Options
• Options provided in three categories– Planning– Operational– Capital/
Infrastructure• Relative cost ($-$$
$)• No Regrets• Utility Examples
12

Sustainability Briefs
• Information on green infrastructure, energy management, and water demand management– benefits – how to get started– relevant
adaptation options– examples – links to further
resources
13

Preparing for Extreme Weather Events: Workshop Planner for the Water Sector
14
Developing long term plans to increase resiliency

Extreme Weather Events Workshop Planner
• Walks users through all of the steps of planning, conducting, and evaluating a workshop
• Goal is to determine actions that a utility or community can take today to become more resilient to more frequent and intense extreme events
• Open lines of communication between utilities and other local partners to assess potential impacts and adaptation to extreme events
15

Workshop Planner Scenarios
• Five scenarios are included:– Flooding– Drought– Sea-level rise– Wildfire– Reduced snowpack
• Available on CRWU websitehttp://www.epa.gov/climatereadyutilities
16

Pilot Workshops
• Bisbee, AZ– Drought, wildfire, flooding– Worked with other agencies and emergency
sectors to develop emergency management plans
– Developed outreach at schools and town halls• New Orleans; Erie, PA; Ft. Pierre, SD;
Fresno, CA• Updating tool with Rural Community
Assistance Program 17

• Provides easy “point and click” access to the 3 CREAT climate scenarios for any location within the U.S.
Scenario-based Projected Changes Map
18
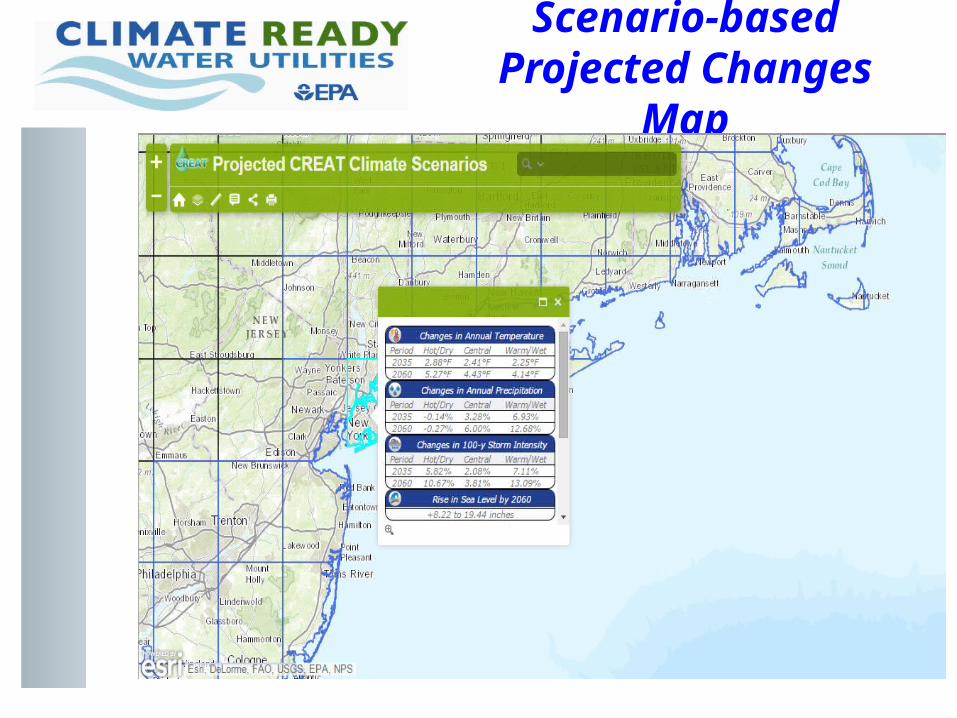
Scenario-based Projected Changes Map
19

Storm Surge Inundation & Hurricane Frequency
Map
20
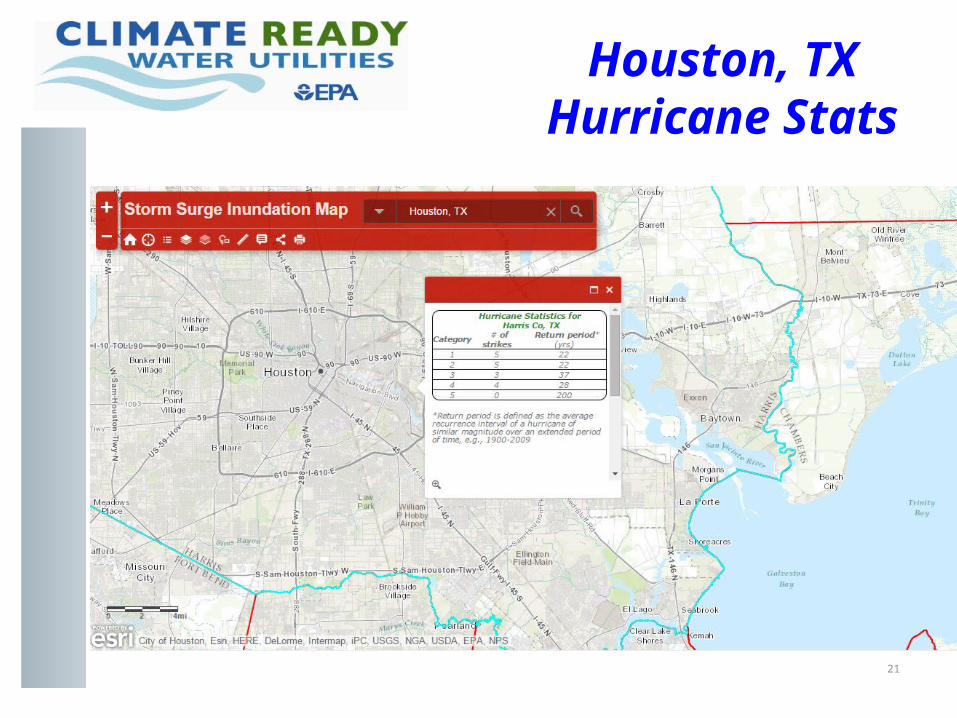
Houston, TX Hurricane Stats
21

Houston, TXFEMA Flood Maps
22

Houston, TX SLOSH
23
Climate Resilience Evaluation & Awareness Tool (CREAT)
24

• Software tool for conducting risk assessment of potential climate change impacts at your utility
• Multiple climate scenarios provided to help capture uncertainty
• Assessments will help inform adaptation planning
• Results from CREAT help utilities compare potential costs, risk reduction and energy implications of different options
25
About CREAT

Process
26
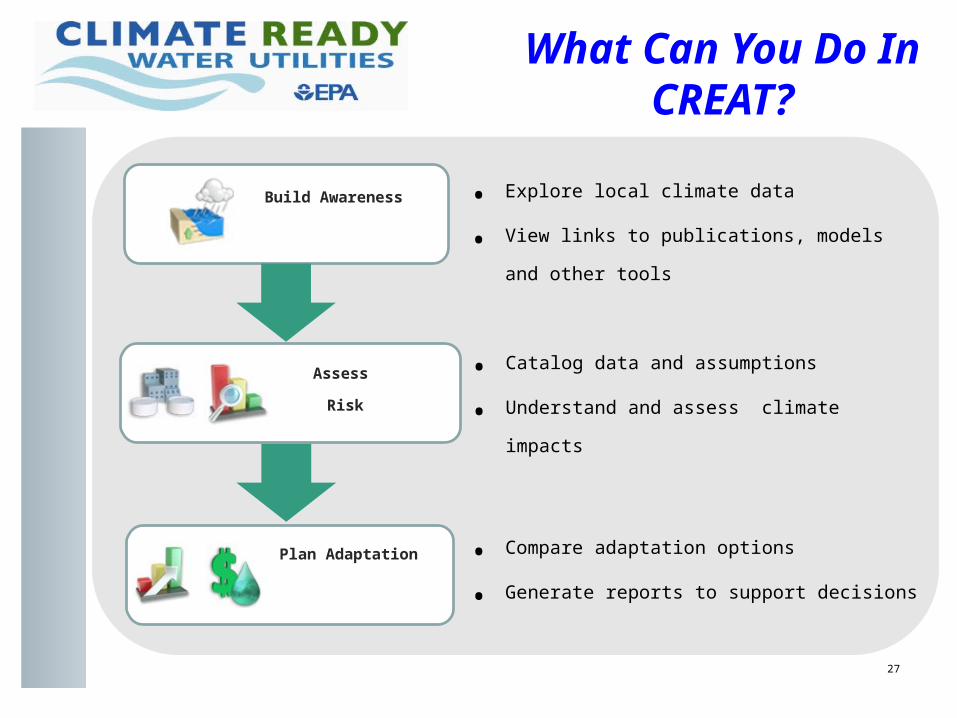
What Can You Do In CREAT?
• Explore local climate data
• View links to publications, models and other tools
Build Awareness
• Compare adaptation options
• Generate reports to support decisions
Plan Adaptation
• Catalog data and assumptions
• Understand and assess climate impacts
Assess
Risk
27

CREAT Process
28
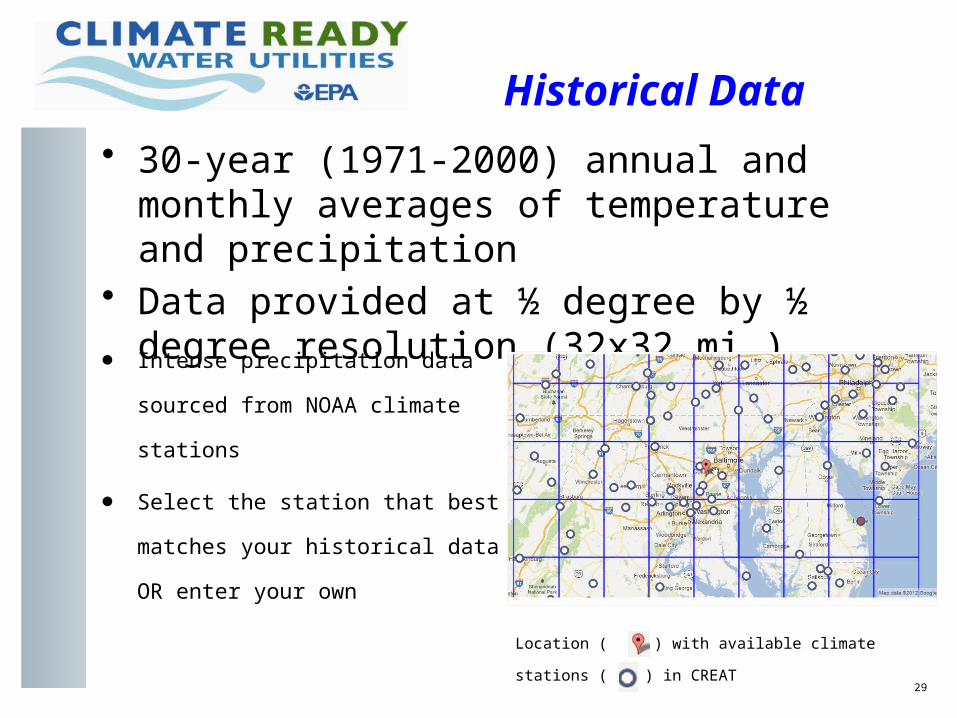
Historical Data
• 30-year (1971-2000) annual and monthly averages of temperature and precipitation
• Data provided at ½ degree by ½ degree resolution (32x32 mi.)
29
Location ( ) with available climate stations ( ) in CREAT
• Intense precipitation data sourced from
NOAA climate stations
• Select the station that best matches
your historical data OR enter your own

Projected Climate Change
• CREAT provides projected changes in – Temperature– Precipitation– Intense precipitation– Sea level
• Rather than rely on a single projection, three scenarios are provided to support assessments over a range of possible future conditions
30
31
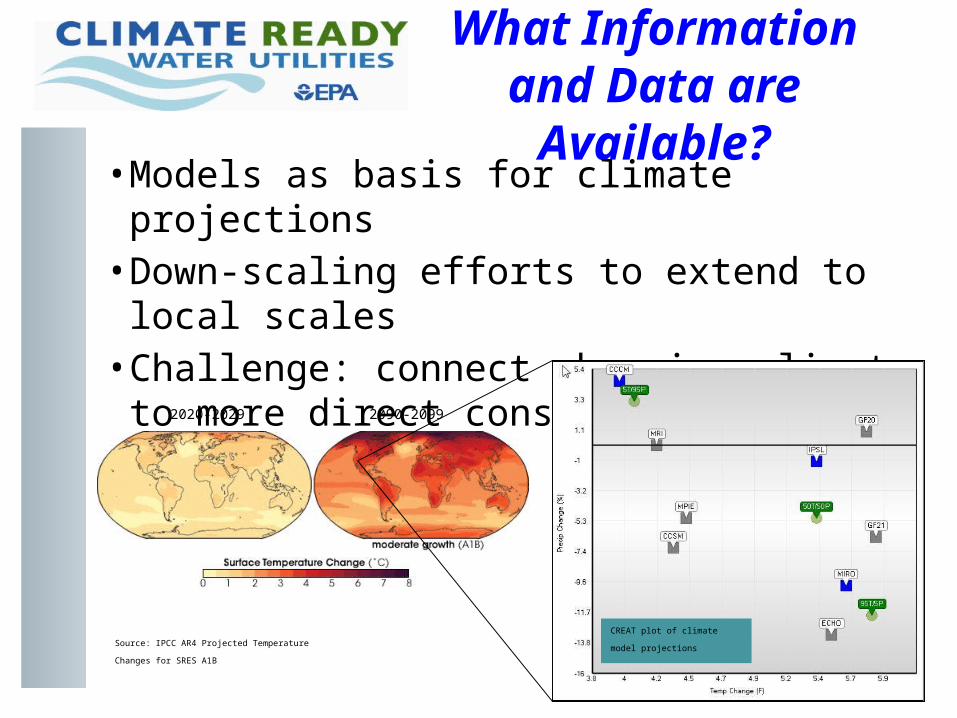
What Information and Data are Available?
• Models as basis for climate projections• Down-scaling efforts to extend to local scales• Challenge: connect changing climate to more
direct consequences to water resources
2020-2029 2090-2099
Source: IPCC AR4 Projected Temperature Changes for SRES
A1B
CREAT plot of climate model
projections
32
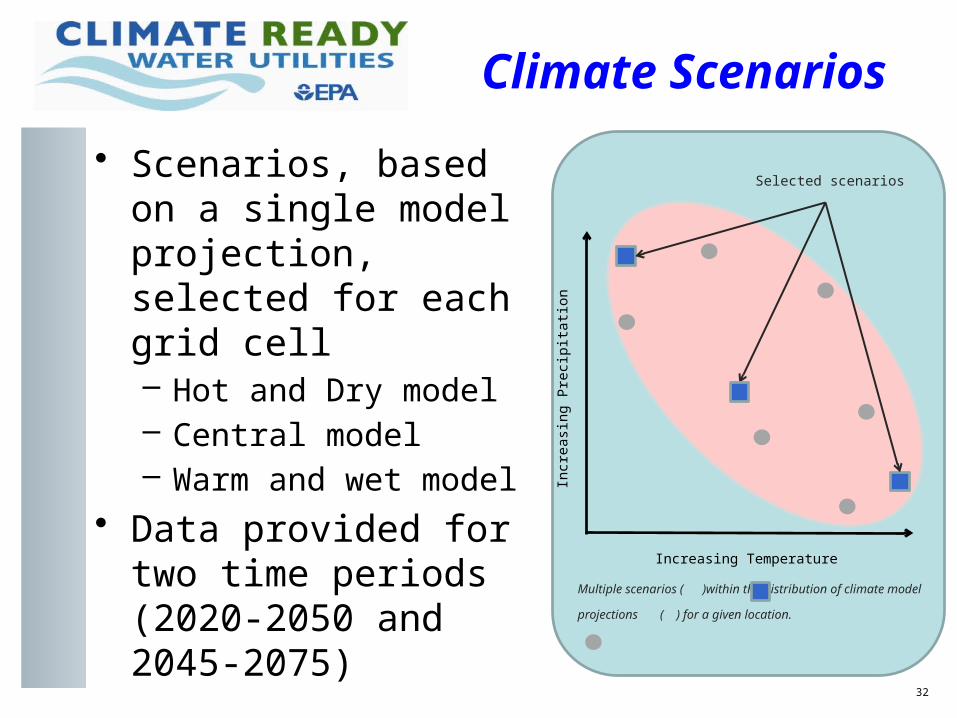
Climate Scenarios
• Scenarios, based on a single model projection, selected for each grid cell– Hot and Dry model– Central model– Warm and wet model
• Data provided for two time periods (2020-2050 and 2045-2075)
Multiple scenarios ( )within the distribution of climate model
projections ( ) for a given location.
Incr
easi
ng P
reci
pita
tion
Increasing Temperature
Selected scenarios

Climate Data in CREAT
33
View data from multiple
climate stations, scenarios, and
time periods
Annual and monthly
temperature and precipitation
Intense precipitation events
and sea- level rise

• Consider those assets vulnerable to identified threats
• Pairs are the basis for all risk assessments • Risk assessed for each scenario and time
period when a threat is applicable
Asset-Threat Pairs
34
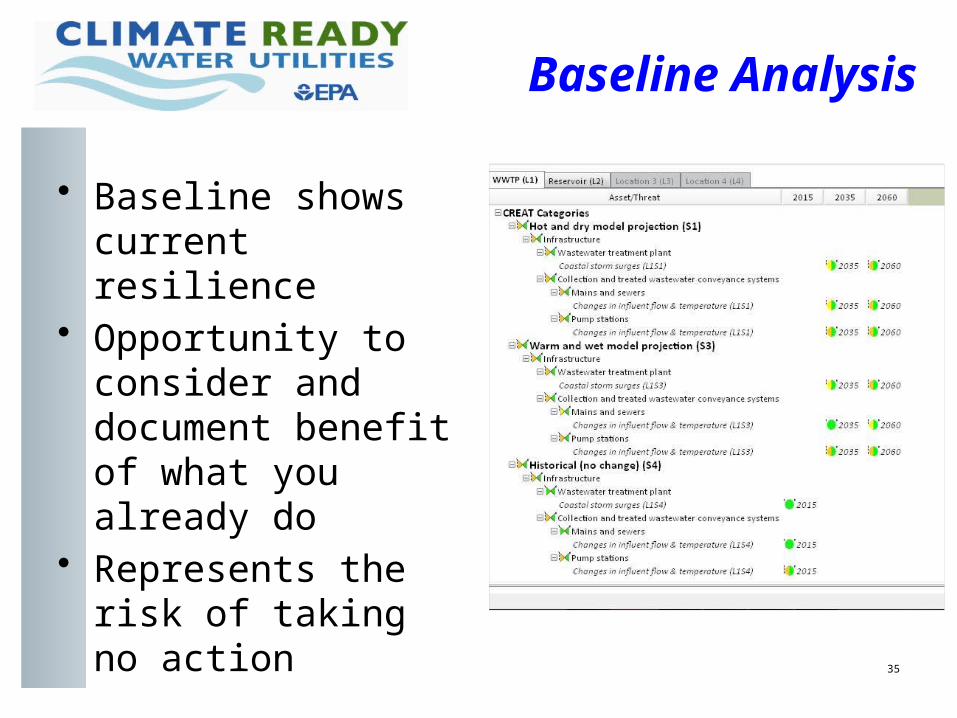
• Baseline shows current resilience
• Opportunity to consider and document benefit of what you already do
• Represents the risk of taking no action
Baseline Analysis
35
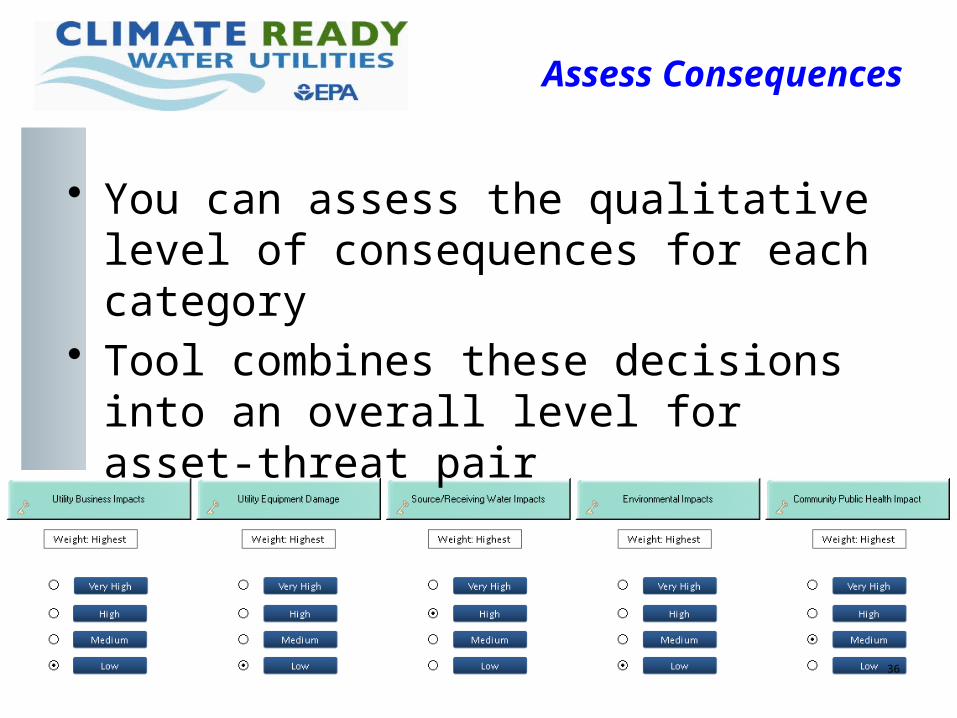
• You can assess the qualitative level of consequences for each category
• Tool combines these decisions into an overall level for asset-threat pair
Assess Consequences
36
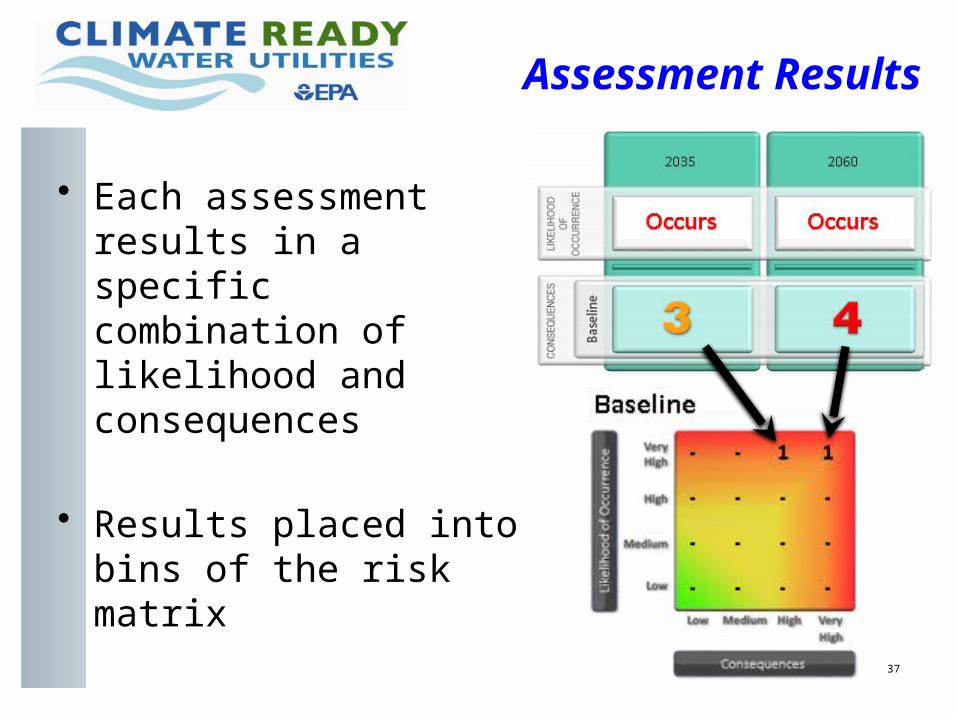
• Each assessment results in a specific combination of likelihood and consequences
• Results placed into bins of the risk matrix
Assessment Results
37

• Resilience Analysis results represent the benefits from adaptation
• As in Baseline, assessments conducted for asset-threat pairs and time periods
• Similar process encourages you to consider options for reducing risk
Resilience Analysis
38

• Continue to build a list of adaptation options by identifying those that could be implemented to provide additional protection
• Explore ability to modify or improve existing measures, not just new practices or infrastructure
Select and Modify Measures
39
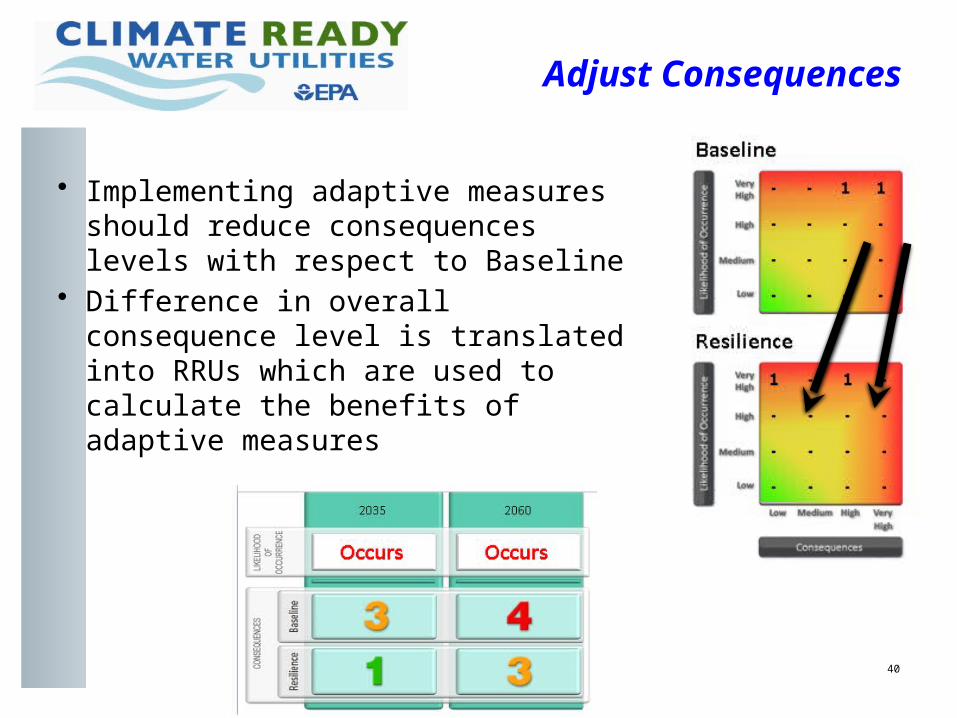
• Implementing adaptive measures should reduce consequences levels with respect to Baseline
• Difference in overall consequence level is translated into RRUs which are used to calculate the benefits of adaptive measures
Adjust Consequences
40

• Adaptation packages are possible plans for adapting to climate change
• Each measure contributes costs and RRUs as a measure of benefit
• Packages also defined in terms of energy implications of adaptive measures
Building Packages
41

Results provided as • Risk matrices:
assessment results by likelihood and consequence
• Risk profiles: results counted by overall consequence
• Indices based on RRUs and distribution ofresults in matrices
Quantitative Results
42

CREAT 3.0
• Updated climate data• Monetized risk values for comparison of risk• Streamlined analysis option for new users and
small system users• Web-based / More user-friendly• Includes a library of energy management,
green infrastructure and water demand management resources for planning purposes
43
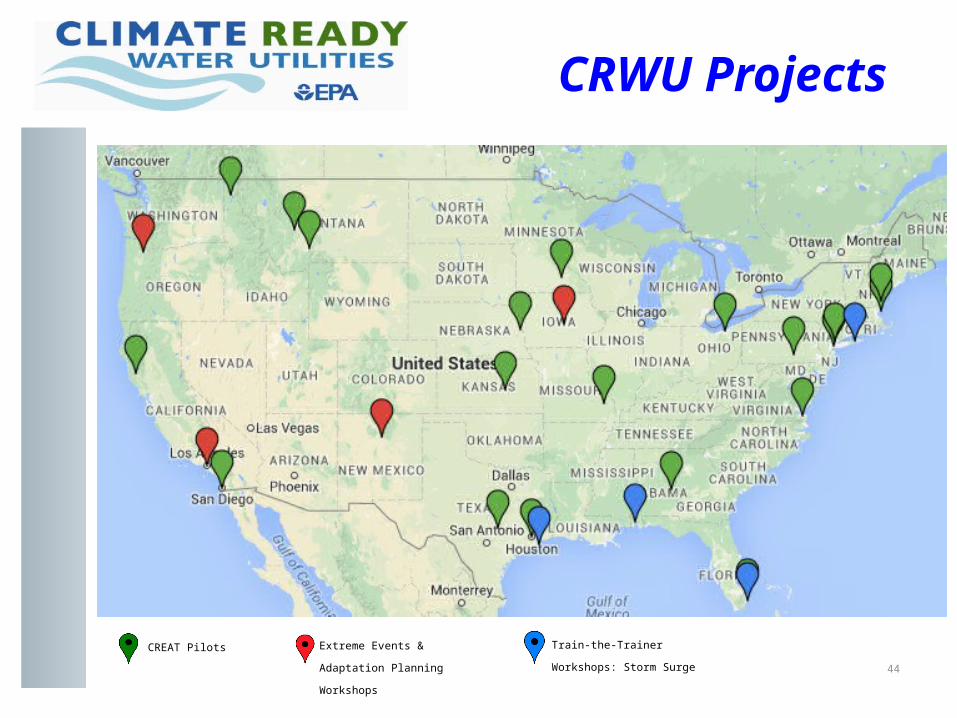
CRWU Projects
44
CREAT Pilots Extreme Events & Adaptation
Planning Workshops
Train-the-Trainer Workshops:
Storm Surge

Thank you!
Contact the Team• Curt Baranowski
• Mike Maier– [email protected]
ov• Laura Dubin
– [email protected] • Jordan Page
Get Updates!• Join our mailing list:
• Visit us on the web:– www.epa.gov/climater
eadyutilities
45