Embed Size (px)
Citation preview

(c) 2005-2008 USC CSSE1
University of Southern CaliforniaCenter for Software EngineeringC S E
USC
COCOMO Suite
Ray MadachyA Winsor Brown
AWBrown Madachyuscedu
CSCI 510 September 24 2008
(c) 2005-2008 USC CSSE2
University of Southern CaliforniaCenter for Software EngineeringC S E
USC
Agendabull COCOMO II refresherbull Modeling methodology and model statusbull Suite overviewbull Emerging extensionsbull Model unificationbull Addendum selected model detailsbull References and further information
(c) 2005-2008 USC CSSE3
University of Southern CaliforniaCenter for Software EngineeringC S E
USC
COCOMO II OverviewSoftware product size estimate
Software product process computer and personal attributes
Software reuse maintenance and increment parameters
Software organizationrsquos Project data
COCOMO
Software development and maintenancebull Costs (effort)bull Schedule estimatesbull Distributed by phase activity increment
COCOMO locally calibrated to organizationrsquos data
(c) 2005-2008 USC CSSE4
University of Southern CaliforniaCenter for Software EngineeringC S E
USC
Purpose of COCOMO IIbull To help people reason about the cost and schedule
implications of their software decisionsndash Software investment decisions
bull When to develop reuse or purchasebull What legacy software to modify or phase out
ndash Setting project budgets and schedulesndash Negotiating costscheduleperformance tradeoffsndash Making software risk management decisionsndash Making software improvement decisions
bull Reuse tools process maturity outsourcing
(c) 2005-2008 USC CSSE5
University of Southern CaliforniaCenter for Software EngineeringC S E
USC
Feasibility
Concept ofOperation
RqtsSpec
Plansand
Rqts
ProductDesign
ProductDesignSpec
DetailDesignSpec
DetailDesign
Develand Test
AcceptedSoftware
Phases and Milestones
RelativeSize Range x
4x
2x
125x
15x
025x
05x ApplicationsComposition
(3 parameters)
Early Design(13 parameters)
Post-Architecture(23 parameters)067x
08x
COCOMO II Model Stages
(c) 2005-2008 USC CSSE6
University of Southern CaliforniaCenter for Software EngineeringC S E
USC
COCOMO II Scope of Outputsbull Provides the estimated software
development effort and schedule for MBASERUPndash Elaborationndash Construction
LCO LCA IOC
(c) 2005-2008 USC CSSE7
University of Southern CaliforniaCenter for Software EngineeringC S E
USC
Agenda
bull COCOMO II refresherbull COCOMO II in modern SysDLCsbull Modeling methodology and model statusbull Suite overviewbull Emerging extensionsbull Model unificationbull Addendum selected model detailsbull References and further information
(c) 2005-2008 USC CSSE8
University of Southern CaliforniaCenter for Software EngineeringC S E
USC
COCOMO II in Modern SysDLCsbull COCOMO I for Waterfallbull COCOMO II for MBASE[ICM]RUP
ndash Allows Waterfall as a subsetndash MBASE [ICM] recognize
bull Concurrent EngineeringActivitiesbull System vs Software in Software Intensive Systemsbull ldquoPhasesrdquo beyond Elaboration and Construction
[Architecting and Implementing]
bull See separate presentationEC-09b(SDLCsIntro)V2doc
(c) 2005-2008 USC CSSE9
University of Southern CaliforniaCenter for Software EngineeringC S E
USC
Agenda
bull COCOMO II refresherbull Modeling methodology and model statusbull Suite overviewbull Emerging extensionsbull Model unificationbull Addendum selected model detailsbull References and further information
(c) 2005-2008 USC CSSE10
University of Southern CaliforniaCenter for Software EngineeringC S E
USC
Analyze existing literature
Step 1 Perform Behavioral analysesStep 2 Identify relative
significance
Step 3 Perform expert-judgment Delphi assessment formulate a-priori modelStep 4 Gather project
data
Step 5Determine Bayesian A-Posteriori modelStep 6
Gather more data refine modelStep 7
Concurrency and feedback impliedhellip
USC-CSE Modeling Methodology
(c) 2005-2008 USC CSSE11
University of Southern CaliforniaCenter for Software EngineeringC S E
USC Status of ModelsModel Docrsquod Literature Behavior Significant
VariablesExpert Delphi
Data Bayesian
Tool
COCOMO II SwCEwCIISwCEwCII
CORADMO SwCEwCII 10 N ExcelCOPROMO SwCEwCII ExcelCOQUALMO SwCEwCII 6 Y ExcelCOCOTS SwCEwCII 20 N Excel
COSECMO COINCOMO
PhD ThesisPhD Thesis
PhD Thesis
gt161 Y ProductCOPSEMO TimeofLCA Excel
COINCOMO
iDAVE ExcelCOPLIMO Excel
COSYSMO 42 N ExcelCOSOSIMO Excel
(c) 2005-2008 USC CSSE12
University of Southern CaliforniaCenter for Software EngineeringC S E
USC
General COCOMO FormPM = A (Σ Size)ΣB Π(EM)
ADDITIVE EXPONENTIAL
MULTIPLICATIVE
WherePM = Person Months
A = calibration factor
Size = measure(s) of functional size of a software module that has an additive effect on software development effort
B = scale factor(s) that have an exponential or nonlinear effect on software development effort
EM = effort multipliers that influence software development effort
(c) 2005-2008 USC CSSE13
University of Southern CaliforniaCenter for Software EngineeringC S E
USC
Agendabull COCOMO II refresherbull Modeling methodology and model statusbull Suite overviewbull Emerging extensionsbull Model unificationbull Addendum selected model detailsbull References and further information
(c) 2005-2008 USC CSSE14
University of Southern CaliforniaCenter for Software EngineeringC S E
USC
COCOMO Suite Quantities Estimated
Model EffortEffort
by Phase
Schedule Defects ROI
COCOMO II
X
X
COQUALMO
iDAVE
COPLIMO
CORADMO
COPROMO
COCOTS
COSYSMO
COSOSIMO
Improvement Graphs
X X XX X X
XX X XX X XXXX
(c) 2005-2008 USC CSSE15
University of Southern CaliforniaCenter for Software EngineeringC S E
USC
COCOMO Suite Sizing
Model SLO
C
FP + Lang
Requirem
ents
Interfaces Scenarios
Algorithm
s C
omponents
Com
plexity R
euse V
olatility
COCOMO II Module Module X X
CORADMO X X X X
COQUALMO X X X X
COSYSMO X X X X X X X
COSOSIMO Glue X X X X X X
COCOTS Glue Glue X
(c) 2005-2008 USC CSSE16
University of Southern CaliforniaCenter for Software EngineeringC S E
USC
COCOMO Suite PhaseActivity Distribution
Model Inception Elaboration Construction TransitionCOCOMO II
COQUALMO
iDAVE
COPLIMO
CORADMO
COPROMO
COCOTS
COSYSMO
COSOSIMO
(c) 2005-2008 USC CSSE17
University of Southern CaliforniaCenter for Software EngineeringC S E
USC
Typical Model Usage
Usehellip When scope of work to be performed ishellip COCOMO II Development of software components (software development)
COCOTS Assessment tailoring and integration of COTS products
COSYSMO Design specification and integration (system engineering) of system components to be separately developed for a single system
COSOSIMO Specification procurement and integration of two or more separately system-engineered and developed systems
COCOMO II with COCOTS Development of software components (software development) and a software system including assessment tailoring and glue-code for integration of COTS
COSYSMO and COCOMO II System engineering and software development for a single system with software-intensive components
COSYSMO and COSOSIMO System engineering of individual systems and integration of the multiple systems
COCOMO II COSYSMO COCOTS and COSOSIMO
System engineering software development and integration of multiple software-intensive systems and COTS products
(c) 2005-2008 USC CSSE18
University of Southern CaliforniaCenter for Software EngineeringC S E
USC
High Level Partitioning of Cost Models
RequirementsAnalysis
PreliminaryDesign
DetailedDesign
Coding
Unit Test
Integration
Software Acceptance Test
LegendCOCOMOCOSYSMOCOSOSIMO
SOS
SystemSystem
IntegrationTest
System of System
SoftwareArchitecting
ArchitectingCOSOSIMOCOSYSMO
COCOMO II
IntegrationTest
COCOTS
(c) 2005-2008 USC CSSE19
University of Southern CaliforniaCenter for Software EngineeringC S E
USC
Agendabull COCOMO II refresherbull Modeling methodology and model statusbull Suite overviewbull Emerging extensionsbull Model unificationbull Addendum selected model detailsbull References and further information
(c) 2005-2008 USC CSSE20
University of Southern CaliforniaCenter for Software EngineeringC S E
USC
Emerging Extensionsbull COCOMO-Dependent Extensions
ndash COQUALMO software qualityndash iDAVE software dependabilityndash COPLIMO product line investmentndash CORADMO rapid application software development ndash COPROMO productivity improvement
bull Emerging Independent Extensionsndash COCOTS software commercial off the shelfndash COSYSMO systems engineeringndash COSOSIMO systems of systemsndash Dynamic COCOMO dynamic vs static modeling
(c) 2005-2008 USC CSSE21
University of Southern CaliforniaCenter for Software EngineeringC S E
USC
Constructive Quality Model COQUALMO
bull Predicts the number of residual defects in a software product
bull Enables what-if analyses that demonstrate the impact of ndash various defect removal techniquesndash effects of personnel project product and platform characteristics
on software quality
bull Provides insights into ndash Probable ship timendash Assessment of payoffs for quality investmentsndash Understanding of interactions amongst quality strategies
(c) 2005-2008 USC CSSE22
University of Southern CaliforniaCenter for Software EngineeringC S E
USC
COQUALMO Operational ConceptCOCOMO II
COQUALMO
DefectIntroduction
Model
DefectRemoval
Model
Software platform Project product and personnel attributes
Software Size Estimate
Defect removal profile levelsAutomation Reviews Testing
Software development effort cost and schedule estimate
Number of residual defectsDefect density per unit of size
(c) 2005-2008 USC CSSE23
University of Southern CaliforniaCenter for Software EngineeringC S E
USC
COQUALMO Defect Removal Rating Scales
Highly advanced
tools model-based test
More advance test tools
preparationDist-
monitoring
Well-defined test seq and
basic test coverage tool
system
Basic testTest criteria
based on checklist
Ad-hoc test and debug
No testingExecution Testing and
Tools
Extensive review
checklistStatistical
control
Root cause analysis
formal followUsing
historical data
Formal review roles and Well-trained people
and basic checklist
Well-defined preparation
review minimal
follow-up
Ad-hoc informal walk-
through
No peer review
Peer Reviews
Formalized specification verificationAdvanced
dist-processing
More elaborate
reqdesignBasic dist-processing
Intermediate-level module
Simple reqdesign
Compiler extension
Basic req and design
consistency
Basic compiler capabilities
Simple compiler syntax
checking
Automated Analysis
Extra HighVery HighHighNominalLowVery Low
(c) 2005-2008 USC CSSE24
University of Southern CaliforniaCenter for Software EngineeringC S E
USC
COQUALMO Defect Removal Estimates- Nominal Defect Introduction Rates
60
285
14375
35 160
10
20
30
40
50
60
70
VL Low Nom High VH XH
Delivered Defects KSLOC
Composite Defect Removal Rating
(c) 2005-2008 USC CSSE25
University of Southern CaliforniaCenter for Software EngineeringC S E
USC
Information Dependability Attribute Value Estimator iDAVE
bull iDAVE estimates and tracks software dependability Return on Investment (ROI)ndash Help determine how much dependability is enoughndash Help analyze and select the most cost-effective combination of software
dependability techniquesndash Use estimates as a basis for tracking performance
bull Based on COCOMO II and COQUALMO cost models and Value Estimating Relationships (VERs)
bull Used to reason about the ROI of software dependability investments bull Dependability defined as a composite property that integrates such
attributes as availability reliability safety security survivability and maintainability
(c) 2005-2008 USC CSSE26
University of Southern CaliforniaCenter for Software EngineeringC S E
USC
iDAVE Operational ConceptTime-phased information processing capabilities
Project attributes
Time-phased dependability investments
IP Capabilities (size) project attributes
Cost estimating relationships (CERrsquos)
Dependability investments project attributes
Dependability attribute estimating relationships (DERrsquos)
Cost = f
Di = gi
Value estimating relationships (VERrsquos)
Vj = hjIP Capabilities dependability levels Di
Time-phased Cost
Dependability attribute levels Di
Value components Vj
Return on Investment
(c) 2005-2008 USC CSSE27
University of Southern CaliforniaCenter for Software EngineeringC S E
USC
Constructive Product Line Investment Model COPLIMO
bull Supports software product line cost estimation and ROI analysis within the scope of product line life cycle
bull Consists of two componentsndash Product line development cost modelndash Annualized post-development life cycle extension
bull Based on COCOMO II software cost modelndash Statistically calibrated to 161 projects representing 18
diverse organizations
(c) 2005-2008 USC CSSE28
University of Southern CaliforniaCenter for Software EngineeringC S E
USC
COPLIMO Operational Concept
COPLIMO
For set of productsbull Average product size
(COCOMO II cost drivers)
bull Percent mission-unique reused-with-modifications black-box reuse
bull Relative cost of reuse (RCR) and relative cost of writing for reuse (RCWR) factors
As functions of products years in life cyclebull Non-product line
effortbull Product line
investment (effort)bull Product line savings
(ROI)
(c) 2005-2008 USC CSSE29
University of Southern CaliforniaCenter for Software EngineeringC S E
USC
Constructive Rapid Application Development Model CORADMO
bull Calculatespredicts for smaller rapid application development projectsndash Schedulendash Personnelndash Adjusted effort
bull Allocates effort and schedule to the stages which are anchored at points in a development life cycle
bull Scope includes inception elaboration and construction
(c) 2005-2008 USC CSSE30
University of Southern CaliforniaCenter for Software EngineeringC S E
USC
Where What amp How
bull Where is CORADMO along the USC-CSSE Cost Estimating Modeling Methodology
bull CORADMO driversbull Illustrated need for COPSEMO
(c) 2005-2008 USC CSSE31
University of Southern CaliforniaCenter for Software EngineeringC S E
USC
Analyze existing literature
Step 1 Perform Behavioral analysesStep 2 Identify relative
significance
Step 3 Perform expert-judgment Delphi assessment formulate a-priori modelStep 4 Gather project
data
Step 5Determine Bayesian A-Posteriori modelStep 6
Gather more data refine modelStep 7
Concurrency and feedback impliedhellip
USC-CSSE Cost Estimating Modeling Methodology
(c) 2005-2008 USC CSSE32
University of Southern CaliforniaCenter for Software EngineeringC S E
USC
CORADMO Factors
bull Reuse and Very High Level Languagesbull Development Process Reengineering and
Streamliningbull Collaboration Efficiencybull ArchitectureRisk Resolutionbull Prepositioning Assetsbull RAD Capability and Experience
(c) 2005-2008 USC CSSE33
University of Southern CaliforniaCenter for Software EngineeringC S E
USC
CORADMO Driver ExampleArchitecture Risk Resolution (RESL)
bull Same as COCOMO II RESL rating scalebull Enables parallel construction
ndash Assumes higher level of staffing available and used ndash Otherwise no schedule compression
ScheduleMultipliers
(Effort Unchanged)VL L N H VH EH
Inception 10 10 10 10 10 10
Elaboration 10 10 10 10 10 10
Construction 10 10 10 91 83 75
(c) 2005-2008 USC CSSE34
University of Southern CaliforniaCenter for Software EngineeringC S E
USC
MBASERUP Concurrent Activities
(c) 2005-2008 USC CSSE35
University of Southern CaliforniaCenter for Software EngineeringC S E
USC
RUP amp [Instructional] ICM for Sw Phase Distributions
(c) 2005-2008 USC CSSE36
University of Southern CaliforniaCenter for Software EngineeringC S E
USC COPSEMO Distributes Effort amp Schedule
(c) 2005-2008 USC CSSE37
University of Southern CaliforniaCenter for Software EngineeringC S E
USC
COPSEMO Demo
bull Done live in Class based on CSCI 577a bull See CSCI 577a Tutorials (soon) for update
(c) 2005-2008 USC CSSE38
University of Southern CaliforniaCenter for Software EngineeringC S E
USC
Constructive Productivity Model COPROMO
bull Determines impact of technology investments on model parameter settings
bull Predicts the most cost effective allocation of investment resources in new technologies intended to improve productivity
bull Uses COCOMO II COPSEMO and CORADMO models as assessment frameworkndash Well-calibrated to 161 projects for effort schedulendash Subset of 106 1990rsquos projects for current-practice baselinendash Extensions for Rapid Application Development formulated
(c) 2005-2008 USC CSSE39
University of Southern CaliforniaCenter for Software EngineeringC S E
USC
Constructive COTS Model COCOTSbull Estimates the effort associated with the integration of
Commercial-Off-The-Shelf (COTS) software productsbull Scope includes inception elaboration and constructionbull Model has four components
ndash Assessmentndash Tailoringndash ldquoGluerdquo codendash System volatility
bull Effort reported by COCOTS is the sum of the efforts from each of the four components
bull Can be used in conjunction with COCOMO II to estimate new software development with COTS integration
(c) 2005-2008 USC CSSE40
University of Southern CaliforniaCenter for Software EngineeringC S E
USC
COCOTS Operational Conceptbull COTS Classes
bull CandidatesClass
bull Tailoring Complexity
bull Glue code size amp cost drivers
bull COCOMO II application effort (separate from COTS)
bull COTS volatility rework ()
bull Rework due to COTS requirements changes ()
bull Rework due to non-COTS requirements changes ()
Assessment
COCOTS
Tailoring
Volatility via
COCOMOII
ldquoGluerdquoCode
Effort
(c) 2005-2008 USC CSSE41
University of Southern CaliforniaCenter for Software EngineeringC S E
USC
STA
FFIN
G
TIME
COCOMO vs COCOTS Cost Sources
(c) 2005-2008 USC CSSE42
University of Southern CaliforniaCenter for Software EngineeringC S E
USC
Constructive System Engineering Cost Model COSYSMO
bull Covers full system engineering lifecycle (maps to ISOIEC 15288)
Life cycle stages being used in COSYSMO Project
bull Estimates standard Systems Engineering WBS tasks (based on EIAANSI 632)
bull Developed with USC-CSE Corporate Affiliate sponsorship and INCOSE participation
Conceptualize DevelopOper Test amp Eval
Transition to
Operation
Operate Maintain or Enhance
Replace or
Dismantle
(c) 2005-2008 USC CSSE43
University of Southern CaliforniaCenter for Software EngineeringC S E
USC
COSYSMO Operational Concept
Requirements Interfaces Scenarios Algorithms
+3 Volatility Factors
SizeDrivers
COSYSMO EffortEffortMultipliers
- Application factors-8 factors
- Team factors-6 factors
- Schedule driver
CalibrationWBS guided by EIAANSI 632
(c) 2005-2008 USC CSSE44
University of Southern CaliforniaCenter for Software EngineeringC S E
USC
COSYSMO Effort Multipliers
bull Team Factorsndash Stakeholder team
cohesion ndash Personnelteam
capability ndash Personnel
experiencecontinuity ndash Process maturity ndash Multisite coordination ndash Tool support
bull Application Factorsndash Requirements
understanding ndash Architecture complexity ndash Level of service
requirementsndash Migration complexity ndash Technology Maturity ndash Documentation Match to
Life Cycle Needsndash and Diversity of
InstallationsPlatformsndash of Recursive Levels in the
Design
(c) 2005-2008 USC CSSE45
University of Southern CaliforniaCenter for Software EngineeringC S E
USC
Constructive System-of-System Cost Model COSOSIMO
bull Parametric model to estimate the effort associated with the definition and integration of software-intensive ldquosystem of systemsrdquo componentsndash SoS abstractionndash Architectingndash Source selectionndash Systems acquisitionndash Integration and testndash Change management effort
bull Includes at least one size driver and 6 exponential scale factors related to effort
bull Targets input parameters that can be determined in early phases
(c) 2005-2008 USC CSSE46
University of Southern CaliforniaCenter for Software EngineeringC S E
USC
Size Drivers
SoSDefinition andIntegrationEffort
Exponential Scale Factors
Calibration
bull Interface-related eKSLOCbull Number of logical
interfaces at SoS levelbull Number of operational
scenariosbull Number of components
bull Integration simplicitybull Integration risk resolutionbull Integration stabilitybull Component readinessbull Integration capabilitybull Integration processes
COSOSIMO
COSOSIMO Operational Concept
(c) 2005-2008 USC CSSE47
University of Southern CaliforniaCenter for Software EngineeringC S E
USC
Agendabull COCOMO II refresherbull Modeling methodology and model statusbull Suite overviewbull Emerging extensionsbull Model unificationbull Addendum selected model detailsbull References and further information
(c) 2005-2008 USC CSSE48
University of Southern CaliforniaCenter for Software EngineeringC S E
USC
Model Unification Main IssuesFor each individual model as well as the unified model
1 Objectives amp Strategies2 Inputsscope of work3 Outputscope of estimate4 Assumptions of each model5 Stakeholders for each model6 Counting Rules7 Sponsorship (FCS Model-Based Acq)8 PhD dissertation critical mass9 Data sources
(c) 2005-2008 USC CSSE49
University of Southern CaliforniaCenter for Software EngineeringC S E
USC
Unification Goalsbull Allow more
comprehensive cost exploration with respect to
ndash Development decisionsndash Investment decisionsndash Established project budget and
schedulesndash Client negotiations and
requested changesndash Cost schedule performance
and functionality tradeoffsndash Risk management decisionsndash Process improvement decisions
bull Affiliate request Provide a single unified tool to allow users to ndash Specify
bull System and software components comprising the software system of interest
bull Composition and characteristics of components
ndash Receive bull A set of comprehensive outputs
for system engineering software development and system-of-systems integration
bull Adjusted using the appropriate special-purpose extensions
(c) 2005-2008 USC CSSE50
University of Southern CaliforniaCenter for Software EngineeringC S E
USC
Issue 1 Objectives amp Strategies
bull First pass and future enhancementsbull Framework (Goal-Quality-Metric model approach)bull Restate objectives for existing models
ndash COCOMO IIndash COCOTSndash COSYSMOndash COSOSIMOndash CORADMOndash COQUALMO
bull Develop objectives for unified cost modelbull Operational scenario(s) for each model
(c) 2005-2008 USC CSSE51
University of Southern CaliforniaCenter for Software EngineeringC S E
USC
Issue 2 Inputsscope of workbull Need to define on several levels
ndash To determine scope of work to be estimatedndash To determine system of interestviewpoint and system
component characteristicsndash To determine specific sub-model inputs
bull Life cycle modelbull Single user interfacebull A single definition for each parameterdriver (eg TEAM
PMAT etc) vs context-specific definitions for parameters with common names across models
bull Need to determine which ldquocomponentsrdquo can be estimated as relatively independent pieces vs tightly coupled components
(c) 2005-2008 USC CSSE52
University of Southern CaliforniaCenter for Software EngineeringC S E
USC
Issue 3 Outputscope of estimatebull Single value for all integrated models (default 152 hours per person-
month)ndash Normalized PM for calibration
bull Backward compatibility to existing modelsbull What set of ldquobinsrdquo should be used for initial effort outputsbull What additional levels of granularity should be provided
ndash By phasestagendash By labor categoryndash By activitiesndash Break out by sub-modelsndash Increments (ie COINCOMO)
bull How will an Integrated Master Schedule be developedbull Effort amp schedule as a function of riskbull Projected productivity
(c) 2005-2008 USC CSSE53
University of Southern CaliforniaCenter for Software EngineeringC S E
USC
Issue 4 Assumptions of each modelModel Life Cycle Stages
COCOMO II
COCOTS
COSYSMO
COSOSIMO
(c) 2005-2008 USC CSSE54
University of Southern CaliforniaCenter for Software EngineeringC S E
USC Integration of Life Cycle Stages
(c) 2005-2008 USC CSSE55
University of Southern CaliforniaCenter for Software EngineeringC S E
USC
Vision for COINCOMO
COQUALMOCORADMO
COCOTS
COSYSMO
COSOSIMO
COINCOMO(AKA
COPSEMO + DBACOCOMO II)
(c) 2005-2008 USC CSSE56
University of Southern CaliforniaCenter for Software EngineeringC S E
USC
Issue 5 Users for each model
Acquirers SW developers estimators systems engineers managers executives or accountants who are interested inndash Software development (COCOMO II)ndash Commercial off the shelf software (COCOTS)ndash Systems engineering (COSYSMO)ndash Software quality (COQUALMO)ndash Software rapid application development (COPSEMO
CORADMO)ndash Software system of systems integration (COSOSIMO)ndash ROIInvestment analysis (iDave COPLIMO)
(c) 2005-2008 USC CSSE57
University of Southern CaliforniaCenter for Software EngineeringC S E
USC
Issue 6 Counting Rules amp Definitions
bull Inputsndash Size drivers (VHLLs FPs APs Use Case Points
KSLOC REQS ALG IF SCEN Components etc)ndash Model inputs (cost drivers scale factors)
bull Outputsndash Effort distributions
bull Phase activity or labor categoriesndash Schedulendash Defectsndash $ costndash Riskndash Productivity
(c) 2005-2008 USC CSSE58
University of Southern CaliforniaCenter for Software EngineeringC S E
USC
Additional Analysis in Progress
bull Cost Driversbull Scale Factors
(c) 2005-2008 USC CSSE59
University of Southern CaliforniaCenter for Software EngineeringC S E
USC
Long Term Vision
UnifiedInterface
COSOSIMO
COSYSMO
COCOMOIICOQUALMO
COCOTS
COCOMOII extensionsbullRAD securitybullIncremental phaseactivitybullAgile risk Monte CarlobullROI (product line dependability)bullMaintenance
COCOMOII extensionsbullRAD securitybullIncremental phaseactivitybullAgile risk Monte CarlobullROI (product line dependability)bullMaintenance
Output Analysis and Report Generation
Unified Model
(c) 2005-2008 USC CSSE60
University of Southern CaliforniaCenter for Software EngineeringC S E
USC
Agendabull COCOMO II refresherbull Modeling methodology and model statusbull Suite overviewbull Emerging extensionsbull Model unificationbull Addendum selected model details
ndash COCOTSndash COPLIMOndash COSYSMOndash COSOSIMO
bull References and further information
(c) 2005-2008 USC CSSE61
University of Southern CaliforniaCenter for Software EngineeringC S E
USC
COTS Software Integration Lifecycle
1) Qualify COTS product
2) Perform system requirements
3) Administer COTS software acquisition
4) Prototype the system including COTS software
5) Fully integrate COTS software and interface code
6) Test completed prototype
COTS Software Integration Lifecycle
(c) 2005-2008 USC CSSE62
University of Southern CaliforniaCenter for Software EngineeringC S E
USC
COTS Integration Sources of Effort
bull COTS Assessment (pre- and post- commitment)ndash Of functionality performance interoperability etc
bull COTS Tailoring and Tuningndash Effects of platform other COTS products
bull Glue Code Developmentndash Similar to other Cost Xpert estimation
bull Application Volatility Due to COTSndash COTS volatility shortfalls learning curve
bull Added Application VampV Effortndash COTS option and stress testingndash Debugging complications incorrect fixes
(c) 2005-2008 USC CSSE63
University of Southern CaliforniaCenter for Software EngineeringC S E
USC
Traditional vs COTS Cost Sources
Time
1) COTSAssessment
3) COTSApplication GlueCode Development
and Test2) COTSTailoring
4) Increased Application Effort due to COTS Volatility
bullLCO ReqtsReview
Application Code Development
bull LCADesign Review
bull IOCBeta Test
COCOMO II COTS model
Sta
ffing
(c) 2005-2008 USC CSSE64
University of Southern CaliforniaCenter for Software EngineeringC S E
USC
Current Scope of COTS Model
bull COTS model coversndash assessmentndash tailoringndash glue code development and integrationndash impact of new releases (volatility)
bull It does not coverndash cost of re-engineering business processesndash vendor managementndash licensesndash training (for COTS integrators or end users)ndash COTS platform or tool experience or maturity
bull Covered by PLEX LTEX PVOL TOOL environmental factors
(c) 2005-2008 USC CSSE65
University of Southern CaliforniaCenter for Software EngineeringC S E
USC
Assessment Effort Inputs
bull Initial Filtering of COTS productsndash estimate of the total number of candidate COTS
components to be filtered
bull More detailed assessment of specific candidates against attributes that are importantndash class(es) of COTS components to be assessedndash for each class
bull number assessedbull attributes considered
(c) 2005-2008 USC CSSE66
University of Southern CaliforniaCenter for Software EngineeringC S E
USC
Assessment Submodel
COTS Candidates in classfiltered
Initial Filtering Effort (IFE) =Average Filtering Effort for
product class)( )(ΣOver
all classes
COTS Candidates in classdetailed assessed
Detailed Assessment Effort (DAE) =
Average Assessment Effort for product class)( )(Σ
Overall classesby project
domainFinal Project Assessment Effort (FPAE) = IFE + DAE
Qualified by assessment attributesmost associated with that class
(c) 2005-2008 USC CSSE67
University of Southern CaliforniaCenter for Software EngineeringC S E
USC
Assessment AttributesCorrectness Understandability Portability
Accuracy Documentation quality PortabilityCorrectness Simplicity
Testability FunctionalityAvailabilityRobustness Functionality
Availability Ease of useFail safe UsabilityHuman Factors PriceFail soft Initial purchaselease
Fault tolerance Version Compatibility Recurring costsInput error tolerance Downward compatibility
Redundancy Upward compatibility MaturityReliability Product Maturity
Robustness Inter-component Compatibility Vendor MaturitySafety Compatibility with other components
Interoperability Vendor SupportSecurity Response time for critical problems
Security (Access related) Flexibility SupportSecurity (sabotage related) Extendability Warranty
FlexibilityProduct Performance User Training
Execution performance InstallationUpgrade Ease User trainingInformationdata capacity Installation Ease
Precision UpgradeRefresh ease Vendor ConcessionsMemory performance Willingness to escrow source code
Response time Willingness to make modificationsThroughput
(c) 2005-2008 USC CSSE68
University of Southern CaliforniaCenter for Software EngineeringC S E
USC
Tailoring Effort Inputs
bull COTS tailoring - activities required to prepare or initialize a component for use in a specific system
bull Tailoring includesndash parameter specificationndash script writingndash GUI screen specificationndash Report specificationndash SecurityAccess Protocol initialization and set up
bull For each class of COTS componentndash rate the complexity of tailoring for each of the above
activities
(c) 2005-2008 USC CSSE69
University of Southern CaliforniaCenter for Software EngineeringC S E
USC
Tailoring Submodel
where
COTS Tailored in class
Project Tailoring Effort (PTE) =
Average Tailoring Effortfor product class)[( )(Σ
Overall classesby project
domain
bull TCQr class]
TCQrclass = Tailoring Complexity Qualifier calibrated within a class for each of five possible ratings from Very Low to Very Highand with the TCQNOMINAL = 10
(c) 2005-2008 USC CSSE70
University of Southern CaliforniaCenter for Software EngineeringC S E
USC
Tailoring Complexity TableIndividual Activity amp Aid Complexity Ratings
TailoringActivities amp Aids
Very Low(point value = 1)
Low(point value = 2)
Nominal(point value = 3)
High(point value = 4)
Very High(point value = 5)
Corre-sponding
PointsParameter
SpecificationZero to 50 parms to
be initialized51 to 100 parms to
be initialized101 to 500 parmsto be initialized
501 to 1000 parmsto be initialized
1001 or moreparms to beinitialized
-------Script Writing Menu driven
1 to 5 line scripts 1 to 5 scripts
needed
Menu driven6 to 10 line scripts
6 to 15 scriptsneeded
Hand written 11 to 25 line
scripts 16 to 30 scripts
needed
Hand written 26 to 50 line
scripts 31 to 50 scripts
needed
Hand written 51 or more line
scripts 51 or more scripts
needed-------
IO Report amp GUIScreen Specification amp
Layout
Automated orstandard templates
used 1 to 5
reportsscreensneeded
Automated orstandard templates
used 6 to 15
reportsscreensneeded
Automated orstandard templates
used 16 to 25
reportsscreensneeded
Hand written orcustom designed
26 to 50reportsscreens
needed
Hand written orcustom designed
51 or morereportsscreens
needed -------
SecurityAccessProtocol Initialization
amp Set-up
1 security level1 to 20 user
profiles1 input screenuser
2 security levels21 to 50 user
profiles2 input
screensuser
3 security levels51 to 75 user
profiles3 input
screensuser
4 security levels76 to 100 user
profiles4 input
screensuser
5 or more securitylevels
101 or more userprofiles
5 or more inputscreensuser
-------
Availability of COTSTailoring Tools
No tools available NA NA NA Tools are available
-------
Total Point Score =y Low Low Nominal High Very Hight Total lt 10 11 lt Point Total lt 15 16 lt Point Total lt 20 21lt Point Total lt 25 26 lt Point Total lt 30
(c) 2005-2008 USC CSSE71
University of Southern CaliforniaCenter for Software EngineeringC S E
USC
Glue Code Inputs
bull Definition of glue codendash code needed to facilitate data or information exchange
between the COTS component and the system into which it is being integrated
ndash code needed to provide required functionality missing in the COTS component AND which depends on or must interact with the COTS component
bull Estimate of the total delivered lines of glue codebull Estimate of glue code rework due to COTS
volatility or requirements volatility
(c) 2005-2008 USC CSSE72
University of Southern CaliforniaCenter for Software EngineeringC S E
USC
Glue Code Inputs (continued)bull Integration Personnel
ndash Integrator experience with product (VL - VH)ndash Integrator personnel capability (VL - VH)ndash Integrator experience with COTS integration process (L - VH)ndash Integrator personnel continuity (VL - VH)
bull COTS Componentndash COTS product maturity (VL - VH)ndash COTS supplier product extension willingness (L - VH)ndash COTS product interface complexity (L - VH)ndash COTS supplier product support (L - VH)ndash COTS supplier provided training and documentation (VL - VH)
(c) 2005-2008 USC CSSE73
University of Southern CaliforniaCenter for Software EngineeringC S E
USC
Glue Code Inputs (continued)
bull ApplicationSystemndash Constraints on systemsubsystem reliability (L -
VH)ndash Constraints on systemsubsystem technical
performance (N-VH)ndash System portability (N - VH)ndash Application architectural engineering (VL -
VH)
(c) 2005-2008 USC CSSE74
University of Southern CaliforniaCenter for Software EngineeringC S E
USC
Glue Code SubmodelΠ[(size)(1+breakage)]Total Effort =A
B(effort multipliers)
bull A - a linear scaling constantbull Size - of the glue code in SLOC or FPbull Breakage - of the glue code due to change in
requirements andor COTS volatilitybull Effort Multipliers - 13 parameters each with settings
ranging VL to VHbull B - an architectural scale factor with settings VL to VH
(c) 2005-2008 USC CSSE75
University of Southern CaliforniaCenter for Software EngineeringC S E
USC
Glue Code Cost Drivers Personnel Drivers
1) ACIEP - COTS Integrator Experience with Product2) ACIPC - COTS Integrator Personnel Capability3) AXCIP - Integrator Experience with COTS Integration Processes4) APCON - Integrator Personnel Continuity
COTS Component Drivers
5) ACPMT - COTS Product Maturity6) ACSEW - COTS Supplier Product Extension Willingness7) APCPX - COTS Product Interface Complexity8) ACPPS - COTS Supplier Product Support9) ACPTD - COTS Supplier Provided Training and Documentation
ApplicationSystem Drivers
10) ACREL - Constraints on Application SystemSubsystem Reliability11) AACPX - Application Interface Complexity12) ACPER - Constraints on COTS Technical Performance13) ASPRT - Application System Portability
Nonlinear Scale Factor
1) AAREN - Application Architectural Engineering
(c) 2005-2008 USC CSSE76
University of Southern CaliforniaCenter for Software EngineeringC S E
USC
Volatility Inputs
bull Captures impact of new COTS releases on the customnew application effort
bull Inputsndash Estimate of new development effort (derived
via Cost Xpert - traditional)ndash Percentage of new development rework due to
bull requirements changesbull COTS volatility
bull Note This submodel is being revised
(c) 2005-2008 USC CSSE77
University of Southern CaliforniaCenter for Software EngineeringC S E
USC
Approximate Model
Detailed Model with Cost Xpert Parameters
BRAK COTS application code breakage due to COTS volatilityBRAK application code breakage otherwiseΣ Cost Xpert scale factorEAF Effort Adjustment Factor (product of effort multipliers)
[ ]BRAK COTS100
Total Effort = (Application Effort) bull (EAF)COTS
[ ]Total Effort = (Application Effort) ( )BRAK COTS1+BRAK
1+101+ Σ
-1 bull (EAF)COTS
Volatility Submodel
(c) 2005-2008 USC CSSE78
University of Southern CaliforniaCenter for Software EngineeringC S E
USC
Total COTS Integration Cost Estimate
xTotal Integration Effort (in Person-Months) =Assessment Effort + Tailoring Effort + Glue Code Effort + Volatility Effort
whereAssessment Effort = Filtering Effort + Final Selection Effort
Total integration Cost = (Total Integration Effort) bull ($$Person-Month)
(c) 2005-2008 USC CSSE79
University of Southern CaliforniaCenter for Software EngineeringC S E
USC
Agendabull COCOMO II refresherbull Modeling methodology and model statusbull Suite overviewbull Emerging extensionsbull Model unificationbull Addendum selected model details
ndash COCOTSndash COPLIMOndash COSYSMOndash COSOSIMO
bull References and further information
(c) 2005-2008 USC CSSE80
University of Southern CaliforniaCenter for Software EngineeringC S E
USC
COPLIMO Backgroundbull Benefits vs Costs of product linebull Does product line pay off bull Traditional product line cost estimation models
mostly underestimate the ROI for product lines by focusing only on development savingsndash Apply RCWR surcharge to entire product not only to the
reused portionsndash If life cycle costs are considered high payoff comes from a
smaller code base to undergo maintenancebull COPLIMO life cycle model
ndash Addresses the shortfalls with a representative set of parameters based on experience in aircraft and spacecraft product line domains
ndash Based on COCOMO II parameters calibrated to 161 projects empirical data on nonlinear reuse effects
(c) 2005-2008 USC CSSE81
University of Southern CaliforniaCenter for Software EngineeringC S E
USC
COPLIMO Model Overviewbull Based on COCOMO II software cost model
ndash Statistically calibrated to 161 projects representing 18 diverse organizations
bull Based on standard software reuse economic termsndash RCWR Relative Cost of Writing for Reusendash RCR Relative Cost of Reuse
bull Avoids investment overestimation savings underestimationndash Avoids RCWR for non-reused componentsndash Includes savings from smaller life-cycle code base
bull Provides experience-based default parameter valuesbull Simple Excel spreadsheet model
ndash Easy to modify extend interoperate
(c) 2005-2008 USC CSSE82
University of Southern CaliforniaCenter for Software EngineeringC S E
USC
COPLIMO - RCWRbull Development for Reuse (RUSE)
ndash In COCOMO II database 11 out of 161 projects rated as VH for RUSE and 1 rated as XH
ndash Productivity Range of RUSEbull Highest rating Lowest rating = 124095 = 131
bull And two other contributing variablesndash Required Reliability (RELY) ndash Degree of Documentation (DOCU)
Rating Levels Very Low Low Nominal High Very High Extra High
RUSE Descriptors
None Across project
Across program
Across product line
Across multiple product lines
Effort Multipliers
na 095 1 107 115 124
(c) 2005-2008 USC CSSE83
University of Southern CaliforniaCenter for Software EngineeringC S E
USC
COPLIMO ndash RCWR (Cont)bull Required Reliability (RELY)
Constraints At least Nominal for Nominal and High RUSE ratings at least High for Very High and Extra High RUSE ratings
bull Degree of Documentation (DOCU)
Constraint No more than one level below the RUSE rating
Rating Levels
Very Low Low Nominal High Very High Extra High
RELY Descriptors
slight inconven-
ience
low easily recoverable
losses
moderate easily
recoverable
high financial loss
risk to human life
Effort Multipliers
082 092 1 11 126 na
Rating Levels
Very Low Low Nominal High Very High Extra High
DOCU Descriptors
Many life cycle needs uncovered
Some life cycle needs uncovered
Right-sized to life cycle needs
Excessive for life cycle
needs
Very excessive
for life cycle Effort
Multipliers081 091 1 111 123 na
(c) 2005-2008 USC CSSE84
University of Southern CaliforniaCenter for Software EngineeringC S E
USC
COPLIMO ndash RCRbull Reused or Black Box (unmodified code) RCR
model ndash Assessment and Assimilation (AA) factor
bull Adapted or White Box (modified code) RCR modelndash AA ndash Non-Linear Model
100
AAM Worst Case
AA = 0
Relative Modification of Size (AAF)
AAM Best Case
SU = 10UNFM = 0
AAF = 05
Selby data
Rel
ativ
e C
ost
10
15
00 50
05
0045
AA = 8SU = 50UNFM = 1
AAF = 05
Selby data summary
Figure 1 Nonlinear Reuse Effects
(c) 2005-2008 USC CSSE85
University of Southern CaliforniaCenter for Software EngineeringC S E
USC
Basic COPLIMO ndash Development Cost Model (1)
bull Simplifying assumptions about uniformity and stabilityndash Every product roughly the same size (PSIZE)ndash Roughly the same fractions of product-specific (PFRAC) adapted
(AFRAC) and reused (RFRAC) software
bull Inputs and outputsFor current set of similar products
As functions of products
Basic
COPLIMO
Average product size productivity
Percent product-specific adapted reused
RCR RCWR factors
Non-product line effort
Product line investment effort
Product line savings ROI
(c) 2005-2008 USC CSSE86
University of Southern CaliforniaCenter for Software EngineeringC S E
USC
Basic COPLIMO ndash Development Cost Model (2)
bull RCWR ndash RCWR = RUSE DOCU RELY
bull 1 product development effortndash Non-PL Effort for developing N
similar products bull PMNR (N) = N A (PSIZE)B Π (EM)bull Where PSIZE is the general software product
size A and B are the COCOMO II calibration coefficient and scale factor and Π (EM) is the product of the effort multipliers for the COCOMO II cost drivers
ndash PL Effort (the first product) bull PMR (1) = PMNR (1) [PFRAC +
RCWR(AFRAC+RFRAC)]bull Note RCWR not applied to non-reused
portion where many other models overestimate RCWR
Product-specific software(PFRAC)
04
Black-box plug-and-playreuse (RFRAC)
03
Reuse with modifications(AFRAC)
03
Assessment andassimilation factor (AA)
2
Software understandingincrement (SU)
10
Unfamiliarity factor(UNFM)
05
design modified (DM) 15 code modified (CM) 30
integration redone(IM)
40
bull RCR parameters
(c) 2005-2008 USC CSSE87
University of Southern CaliforniaCenter for Software EngineeringC S E
USC
Basic COPLIMO Output Summary
Summary of Inputs 7 year Product Line Effort SavingsAVPROD 300
AVSIZE 50000 (SLOC)PFRAC 40 ()AFRAC 30 ()RFRAC 30 ()
RCR-PFRAC 100 ()RCR-AFRAC 40 ()RCR-RFRAC 5 ()
RCWR 185
Table of Results of Products 0 1 2 3 4 5 6 7Unique SLOC 0 20000 40000 60000 80000 100000 120000 140000
Adapted SLOC 0 15000 30000 45000 60000 75000 90000 105000Reused SLOC 0 15000 30000 45000 60000 75000 90000 105000
Total Non-PL SLOC 0 50000 100000 150000 200000 250000 300000 350000Non-PL Effort (PM) 0 166667 333333 500 666667 833333 1000 1166667
1-Product Equiv SLOC 0 75500 26750 26750 26750 26750 26750 267501-Product Equiv Effort 0 251667 891667 891667 891667 891667 891667 8916667
Cum Equiv PL SLOC 0 75500 102250 129000 155750 182500 209250 236000Cum PL Effort 0 251667 340833 430 519167 608333 6975 7866667
PL Effort Savings 0 -85 -75 70 1475 225 3025 380PL Reuse Investment 0 85Return on Investment NA -1 -00882 082353 173529 264706 355882 4470588
Product Line Development Cost Estimation
-200-100
0100200300400500
0 1 2 3 4 5 6 7 8
of products in product line
Net
dev
elop
men
t ef
fort
sav
ings
(c) 2005-2008 USC CSSE88
University of Southern CaliforniaCenter for Software EngineeringC S E
USC
Basic COPLIMO ndash Annualized Life Cycle Cost Model
bull Annual Change Traffic (ACT) ndash Relative fraction of a productrsquos software that is modified per yearndash Simplifying assumption Constant-ACT
bull Life cycle effort without reusendash N complete products undergo maintenance
bull Life cycle effort with reusendash PFRAC maintenance for N instancesndash RFRAC maintenance for 1 instancendash AFRAC maintenance for 1 instance and N-1 variants
(c) 2005-2008 USC CSSE89
University of Southern CaliforniaCenter for Software EngineeringC S E
USC
COPLIMO Product Line Sizing InformaitonNote White cell is for input yellow area is output
Product Size (PSIZE) 100 KSLOC (Average size of each of products in the product line)
Product-specific (Portion of the software that is unique tofraction (PFRAC) 40 the particular product in the product line)Adapted-software (Portion of the product line software fraction (AFRAC) 30 that must be modified to work well)Reused-software (Portion of the product line software that canfraction (RFRAC) 30 be reused as a black box without modification)
of products inproduct line
DM 15 ( Design Modified)CM 30 ( Code Modified)IM 40 ( of Integration Required for the Adapted Software)AAF = 27 AA 2 ( Assessment and Assimilation)SU 10 ( Software Understanding)UNFM 05(Programmer Unfamiliarity with Software)AAM = 0317Adapted KSLOC 30 KSLOCEquivalent KSLOC of Adapted Portion= 951 KSLOC(PSIZE x AFRAC x (1-(AT100)) x AAM )Equivalent KSLOC of Reused Portion= 06 KSLOC(PSIZE x RFRAC x AA)New KSLOC 40 KSLOC(PSIZE x PFRAC)SIZE = 4951 KSLOC((1+ (REVL100)) x (NEW KSLOC + Equivalent KSLOC of Adaption + Equivalent KSLOC of Reuse))ACT = 20 (Annual Change Traffic)
(c) 2005-2008 USC CSSE90
University of Southern CaliforniaCenter for Software EngineeringC S E
USC
COPLIMO Estimation SummaryPart I Product Line Development Cost Estimation Summary
of Products 0 1 2 3 4 5Effort (PM)No Reuse 0 294 588 882 1176 1470
Product Line 0 444 589 735 881 1026Product Line Savings 0 -150 -1 147 295 444
ROI 0 -100 -001 098 197 296
Part II Product Line Annualized Life Cycle Cost Estimation Summary of Products 0 1 2 3 4 5
AMSIZE-P 0 81 162 242 323 404AMSIZE-R 0 61 61 61 61 61AMSIZE-A 0 61 77 93 110 126
Total Equiv KSLOC 0 202 299 396 493 591Effort (AM) (294) 0 594 880 1165 1451 1737
5-year Life Cycle PM 0 2969 4398 5826 7254 8683PM(N 5)-R (+444) 0 7409 8837 10265 11694 13122
PM(N 5)-NR 0 5909 11819 17728 23638 29547Product Line Savings (PM) 0 -1499 2982 7463 11944 16425
ROI 0 -100 199 498 797 1096Devel ROI 0 -100 -001 098 197 296
3-year Life Cycle 0 -1420 1200 4800
AMSIZE Annually Maintained Software Size
Product Line Development Cost Estimation
-200
0
200
400
600
0 1 2 3 4 5 6
of products in product line
Net
dev
elop
men
t ef
fort
sav
ings
Product Line Annualized Life Cycle Cost Estimation
-200-100
0100200300400500600700800
0 1 2 3 4 5 6
of products
Net
Pro
duct
Lin
e Ef
fort
Sav
ings
5-year Life Cycle
3-year Life Cycle
Development
(c) 2005-2008 USC CSSE91
University of Southern CaliforniaCenter for Software EngineeringC S E
USC
Discussionsbull Software product line payoffs are
significant esp across life cyclebull This does not mean any attempt at
product line reuse will generate large savings
bull Challengesndash Technical
bull Domain engineering and product line architectingndash Management and Culture
bull People unwilling to corporatebull ldquoNot invented hererdquo attitudesbull Success factor empowered product line manager
(c) 2005-2008 USC CSSE92
University of Southern CaliforniaCenter for Software EngineeringC S E
USC
Conclusionsbull Software product line payoffs are significant esp across life
cyclebull COPLIMO avoids investment overestimation amp savings
underestimationbull COPLIMO helps to determine whether and when it pays to
launch a product linebull COPLIMO enables assessment of situation-dependencies
hence lead to better product line decisionsbull Future work
bull Support for more sensitivity analysisbull Model refinement and calibrationbull Integration with other COCOMO II family models such as
COCOTS
(c) 2005-2008 USC CSSE93
University of Southern CaliforniaCenter for Software EngineeringC S E
USC
COPLIMO Backup Charts
(c) 2005-2008 USC CSSE94
University of Southern CaliforniaCenter for Software EngineeringC S E
USC
COPLIMO ndash RCR
bull Reused or Black Box (unmodified code) RCR model ndash Assessment and Assimilation (AA) factor
bull Adapted or White Box (modified code) RCR modelndash AA ndash Non-Linear Model
AA Increment Level of AA Effort0 None2 Basic module search and
documentation4 Some module Test and Evaluation
(TampE) documentation6 Considerable module TampE
documentation8 Extensive module TampE documentation
( ) ( ) ( )
⎪⎪⎩
⎪⎪⎨
⎧
gttimes++
letimestimes++
=
times+times+times=times=
50AAFfor 100
UNFM)](SUAAF[AA
50AAFfor 100
UNFM))]SU002(AAF(1[AA
AAM
IM03CM03DM04AAF AAM KSLOC AdaptedKSLOC Equivalent
ReuseParameter Description
DM of Design Modified
CM of Code Modified
IM of Integration Required
SU of Software Understanding
UNFM Programmer Unfamiliarity with Software
AAF Adaptation Adjustment Factor
AAM Adaptation Adjustment Modifier
(c) 2005-2008 USC CSSE95
University of Southern CaliforniaCenter for Software EngineeringC S E
USC
Guidelines for Quantifying Adapted Software
DM CM IM AA SU UNFM
New All original software
0 - 100+IM usually
moderate and can be gt 100
0 ndash 8
0 - 50
0 - 1
Not applicable00
Reused
0 - 100 rarely 0 but could be
very small
Unchanged existing software
0 ndash 8
Reuse Parameters
Adapted
0 - 100 normally
gt 0
0+ - 100 usually
gtDM and must begt 0
Not applicable
Changes to pre-existing software
DescriptionCode Category
(c) 2005-2008 USC CSSE96
University of Southern CaliforniaCenter for Software EngineeringC S E
USC
Basic COPLIMO ndash Development Cost Model (3)
bull Determining RCR ndash Equiv size of product- specific portion
ndash Equiv size of reused portionndash Equiv size of adapted portion
ndash Total EKSLOC
ndash Effortndash ROI = (PL Effort Savings for K products - PL Reuse Investment) PL
Reuse Investment
KSLOCKSLOC
40100 04 EKSLOC P
=times=
KSLOCKSLOC 6010210003 EKSLOC R =⎥⎦⎤
⎢⎣⎡timestimes=
KSLOCKSLOC 110100)]11()27(2[30100
)5010020(1()403030301540(2
KSLOC100 03 EKSLOCA
=times+=
⎥⎦⎤
⎢⎣⎡ timestimes+timestimes+times+times+
timestimes=
KSLOCKSLOC
EKSLOCEKSLOCEKSLOC ARP
750)1106040(
EKSLOC
=++=
++=
PMR (N) = N A (EKSIZE)B Π (EM)
(c) 2005-2008 USC CSSE97
University of Southern CaliforniaCenter for Software EngineeringC S E
USC
Basic COPLIMO ndash Annualized Life Cycle Cost Model (1)
bull Annual Change Traffic (ACT)ndash Relative fraction of a productrsquos software that is modified per year
bull Life cycle effort without reusendash Annual maintained software
ndash L times maintenance effort
bull Life cycle effort with reusendash Three categories of annual maintenance and AMSIZE
)100
1( UNFMSUACTPSIZEAMSIZE sdot+sdot=
)]()([)()( EMAMSIZEANLNPMLNPM BNRNR Πsdotsdotsdot+=
)]1(1[)100
1(
100
minus+sdotsdot+sdotsdotsdot= NAAFUNFMSUACTAFRACPSIZEAMSIZEA
R )1(
)100
1(
sdot+sdotsdotsdot=
sdot+sdotsdotsdot=
UNFMSUACTRFRACPSIZEAMSIZE
UNFMSUACTPFRACPSIZEAMSIZEP
(c) 2005-2008 USC CSSE98
University of Southern CaliforniaCenter for Software EngineeringC S E
USC
Agendabull COCOMO II refresherbull Modeling methodology and model statusbull Suite overviewbull Emerging extensionsbull Model unificationbull Addendum selected model details
ndash COCOTSndash COPLIMOndash COSYSMOndash COSOSIMO
bull References and further information
(c) 2005-2008 USC CSSE99
University of Southern CaliforniaCenter for Software EngineeringC S E
USC
COSYSMO Introductionbull Covers full system engineering lifecycle (maps to
ISOIEC 15288)
Life cycle stages being used in COSYSMO Project
bull Estimates standard Systems Engineering WBS tasks (based on EIAANSI 632)
bull Developed with USC-CSE Corporate Affiliate sponsorship and INCOSE participation
Conceptualize DevelopOper Test amp Eval
Transition to
Operation
Operate Maintain or Enhance
Replace or
Dismantle
(c) 2005-2008 USC CSSE100
University of Southern CaliforniaCenter for Software EngineeringC S E
USC
How is Systems Engineering Defined
EIAANSI 632Processes for Engineering a Systembull Acquisition and Supply
ndash Supply Processndash Acquisition Process
bull Technical Managementndash Planning Processndash Assessment Processndash Control Process
bull System Designndash Requirements Definition Processndash Solution Definition Process
bull Product Realizationndash Implementation Processndash Transition to Use Process
bull Technical Evaluationndash Systems Analysis Processndash Requirements Validation Processndash System Verification Processndash End Products Validation Process
(c) 2005-2008 USC CSSE101
University of Southern CaliforniaCenter for Software EngineeringC S E
USC
COSYSMO Operational Concept
Requirements Interfaces Scenarios Algorithms
+3 adjustment factors
SizeDrivers
COSYSMO EffortEffortMultipliers
- Application factors-8 factors
- Team factors-6 factors
Calibration
(c) 2005-2008 USC CSSE102
University of Southern CaliforniaCenter for Software EngineeringC S E
USC
Model Form
prodsum=
sdot⎟⎟⎠
⎞⎜⎜⎝
⎛Φ+Φ+Φsdot=
14
1 )(
jj
E
kkdkdknknkekeNS EMwwwAPM
Where PMNS = effort in Person Months (Nominal Schedule)A = calibration constant derived from historical project data k = REQ IF ALG SCNwx = weight for ldquoeasyrdquo ldquonominalrdquo or ldquodifficultrdquo size driver
= quantity of ldquokrdquo size driverE = represents diseconomy of scale (currently equals 1)EM = effort multiplier for the jth cost driver The geometric product results in an overall effort adjustment factor to the nominal effort
xΦ
(c) 2005-2008 USC CSSE103
University of Southern CaliforniaCenter for Software EngineeringC S E
USC
14 Cost Drivers (Effort Multipliers)
1 Requirements understanding2 Architecture understanding3 Level of service requirements4 Migration complexity 5 Technology Maturity 6 Documentation Match to Life Cycle Needs7 and Diversity of InstallationsPlatforms8 of Recursive Levels in the Design
Application Factors (8)
(c) 2005-2008 USC CSSE104
University of Southern CaliforniaCenter for Software EngineeringC S E
USC
14 Cost Drivers (continued)
1 Stakeholder team cohesion 2 Personnelteam capability 3 Personnel experiencecontinuity 4 Process maturity 5 Multisite coordination 6 Tool support
Team Factors (6)
(c) 2005-2008 USC CSSE105
University of Southern CaliforniaCenter for Software EngineeringC S E
USC
Agendabull COCOMO II refresherbull Modeling methodology and model statusbull Suite overviewbull Emerging extensionsbull Model unificationbull Addendum selected model details
ndash COCOTSndash COPLIMOndash COSYSMOndash COSOSIMO
bull References and further information
(c) 2005-2008 USC CSSE106
University of Southern CaliforniaCenter for Software EngineeringC S E
USC
How Much Effort to Integrate a System of SystemsSystem of Systems person-years (PY)
Sensing500 PY
Vehicles500 PY
Common400 PY
Infrastructure600 PY
Command amp Control1000 PY
bull Systems developed by system contractorsndash Total effort 3000 person-years
bull System of systems integration functionsndash SoS abstraction architecting source selection systems acquisition integration
test change management effortbull How much to budget for integrationbull What factors make budget higher or lowerbull How to develop and validate an estimation model
(c) 2005-2008 USC CSSE107
University of Southern CaliforniaCenter for Software EngineeringC S E
USC
Constructive System-of-System Integration Cost Model (COSOSIMO)
bull Parametric model to estimate the effort associated with the definition and integration of software-intensive ldquosystem of systemsrdquo components
bull Includes at least one size driver and 6 exponential scale factors related to effort
bull Targets input parameters that can be determined in early phases
bull Goal is to have zero overlap with COCOMO II and COSYSMO
(c) 2005-2008 USC CSSE108
University of Southern CaliforniaCenter for Software EngineeringC S E
USC
Size Drivers
SoSDefinition andIntegrationEffort
Exponential Scale Factors
Calibration
bull Interface-related eKSLOCbull Number of logical interfaces at
SoS levelbull Number of componentsbull Number of operational scenarios
bull Integration simplicitybull Integration risk resolutionbull Integration stabilitybull Component readinessbull Integration capabilitybull Integration processes
COSOSIMO Operational Concept
COSOSIMO
Each size driver weighted by bull Complexitybull Volatilitybull Degree of COTSreuse
(c) 2005-2008 USC CSSE109
University of Southern CaliforniaCenter for Software EngineeringC S E
USC
COSOSIMO Model Equations
Level 1 IPM (Si) = Ai sum Size (Sij)Bi
j=1
ni
Level 0 IPM (SoS) = A0 sum IPM (Si)B0
i=1
mi
Two level model that bull First determines integration effort for first level subsystemshellipbull Then using subsystem integration effort and SoS characteristics determines SoS integration efforthellip
SOS
SmS2S1
S11 S12 S1n S21 S22 S2n Sm1 Sm2 Smnhelliphellip helliphellip helliphellip
Level 0
Level 1 helliphellip
(c) 2005-2008 USC CSSE110
University of Southern CaliforniaCenter for Software EngineeringC S E
USC
COSOSIMO Model ParametersIPM Integration effort in Person MonthsSi The ith subsystem within the SoSA Constant derived from historical project data Size Determined by computing the weighted average of the size driver(s) ni Number of Subsystem level 2 components comprising the ith subsystemm Number of Subsystem level 1 components comprising the SoSBi Effort exponent for the ith subsystem based on the subsystemrsquos 6
exponential scale factors The sum of the scale factors results in an overall exponential effort adjustment factor to the nominal effort
B0 Effort exponent for the SoS based on the SOSrsquo 6 exponential scale factors The sum of the scale factors results in an overall exponential effort adjustment factor to the nominal effort
(c) 2005-2008 USC CSSE111
University of Southern CaliforniaCenter for Software EngineeringC S E
USC
Agendabull COCOMO II refresherbull Modeling methodology and model statusbull Suite overviewbull Emerging extensionsbull Model unificationbull Addendum selected model details
ndash COCOTSndash COPLIMOndash COSYSMOndash COSOSIMO
bull References and further information
(c) 2005-2008 USC CSSE112
University of Southern CaliforniaCenter for Software EngineeringC S E
USC
Referencesbull Abts C Extending The COCOMO II Software Cost Model To Estimate Effort
And Schedule For Software Systems Using Commercial-off-the-shelf (COTS) Software Components The COCOTS Model USC PhD dissertation May 2004
bull B Boehm C Abts W Brown S Chulani B Clark E Horowitz R Madachy D Reifer B Steece Software Cost Estimation with COCOMO II Prentice-Hall 2000
bull Chulani Bayesian Analysis of Software Cost and Quality Modelsldquo USC PhD dissertation April 1999
bull Clark B Clark B ldquoEarly COCOTSrdquo September 2004bull Lane J ldquoConstructive Cost Model for System-of-System Integrationrdquo 3rd ACM-
IEEE International Symposium on Empirical Software Engineering Redondo Beach CA August 2004
bull Valerdi R Boehm B Reifer D ldquoCOSYSMO A Constructive Systems Engineering Cost Model Coming Agerdquo Proceedings 13th Annual INCOSE Symposium Crystal City VA July 2003
bull Boehm B Valerdi R Lane J Brown W COCOMO Suite Methodology and Evolution Crosstalk 2005
bull Yang Y Boehm B Madachy R COPLIMO A Product-Line Investment Analysis Model Proceedings of the Eighteenth International Forum on COCOMO and Software Cost Modeling USC Los Angeles CA October 2003
(c) 2005-2008 USC CSSE113
University of Southern CaliforniaCenter for Software EngineeringC S E
USC
Further Informationbull Main COCOMO website at USC
httpsunsetusceduresearchCOCOMOIIbull COCOMO information at USC (213) 740-
6470bull COCOMO email
cocomo-infosunsetuscedu
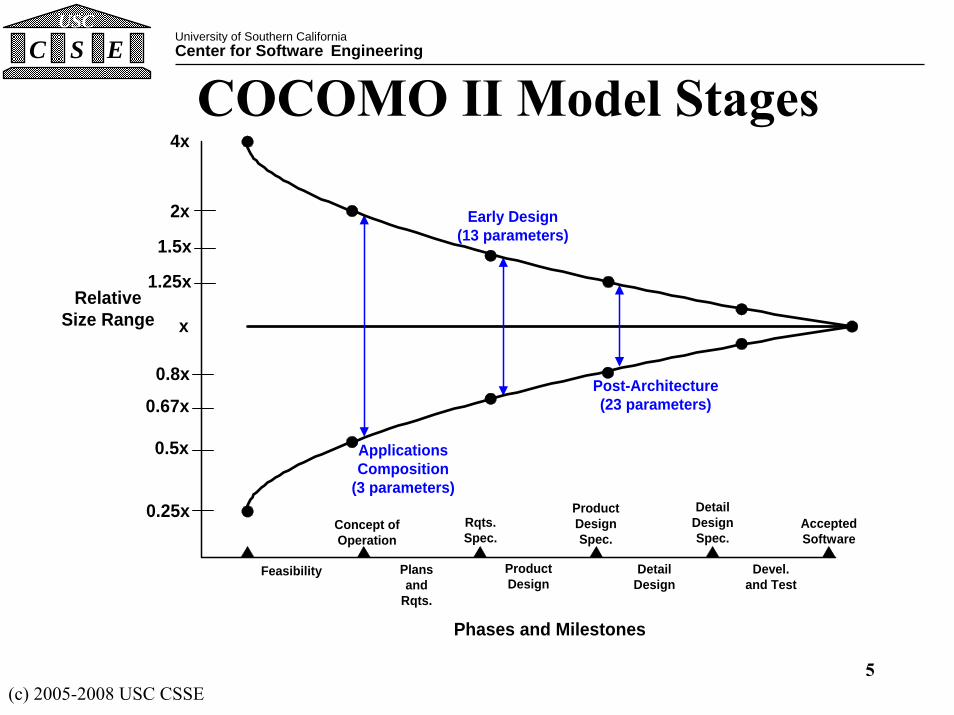
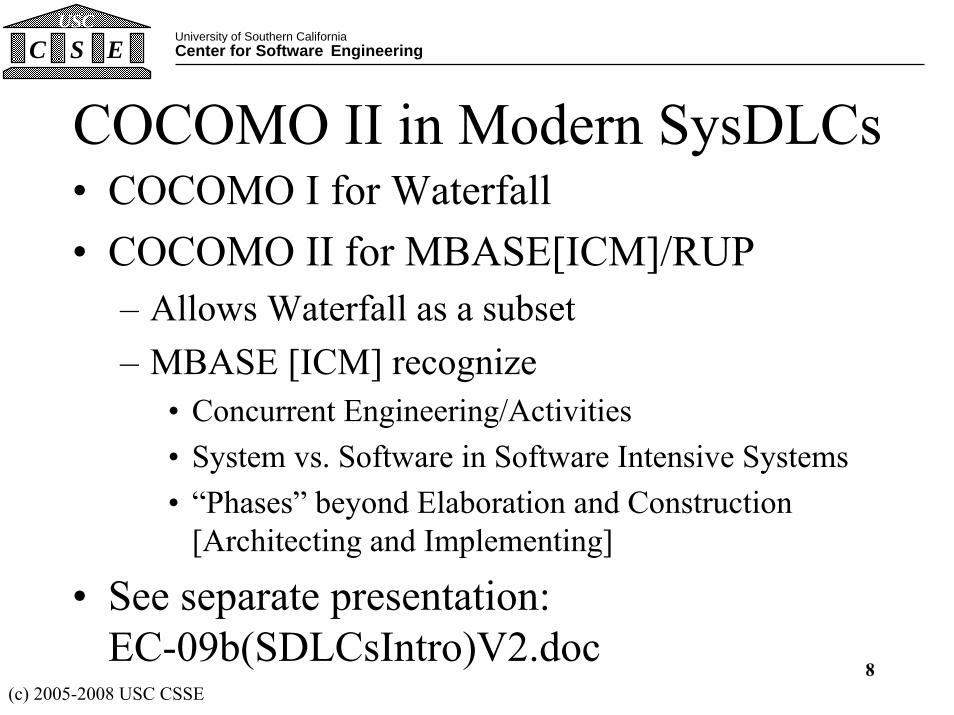
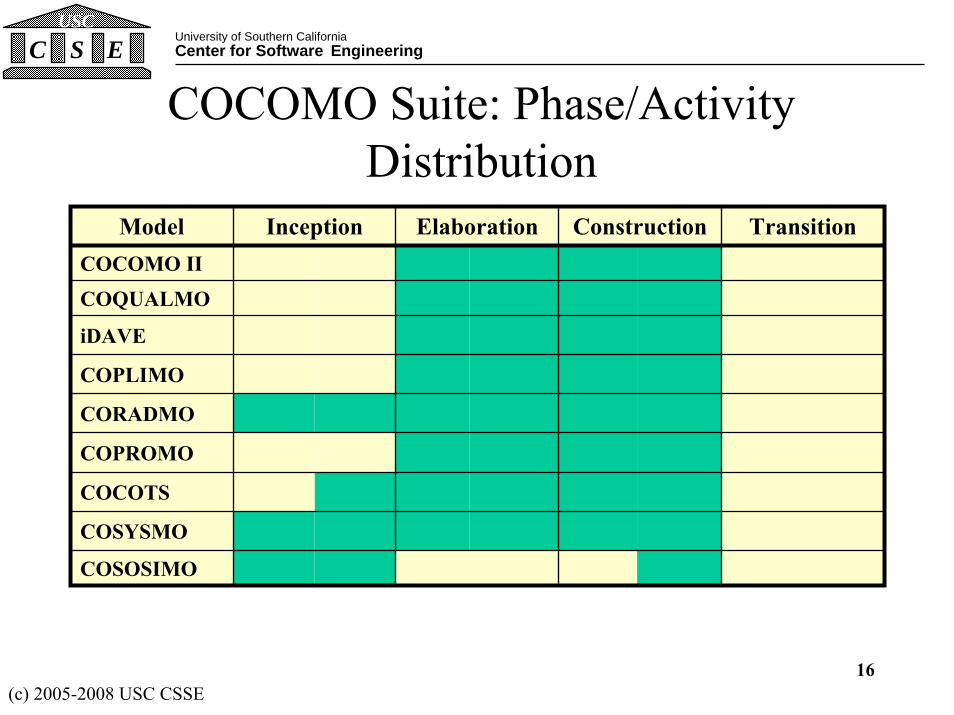
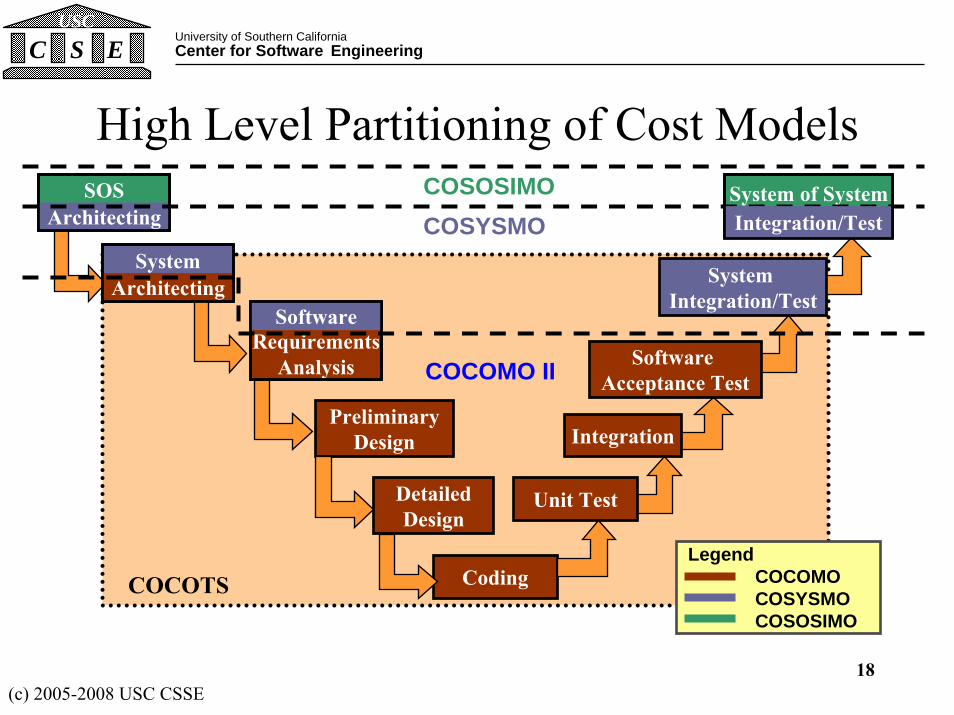
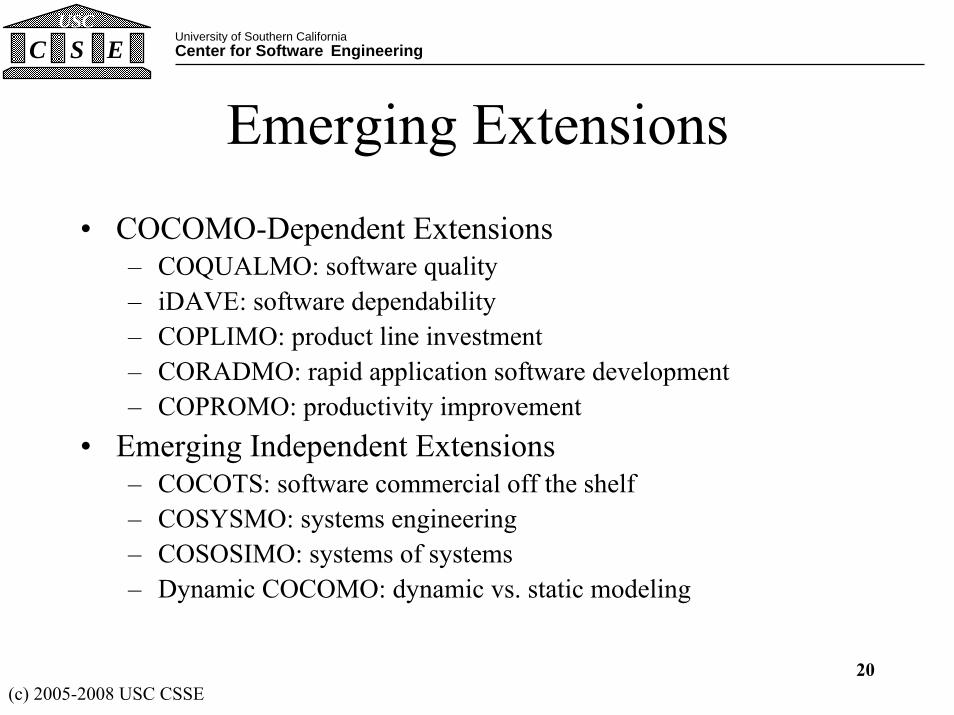
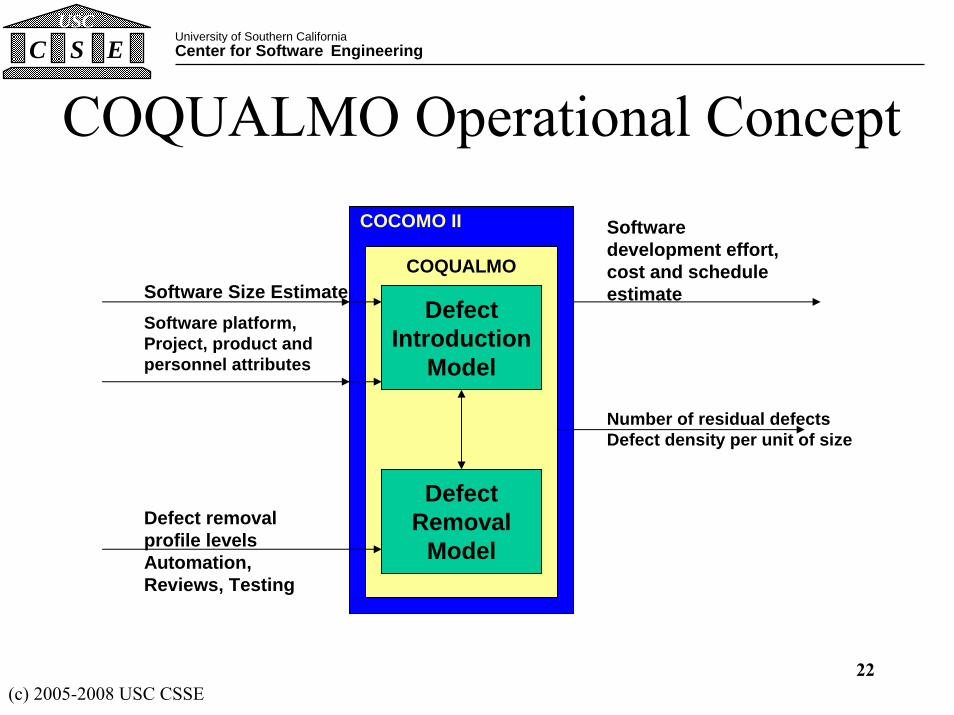
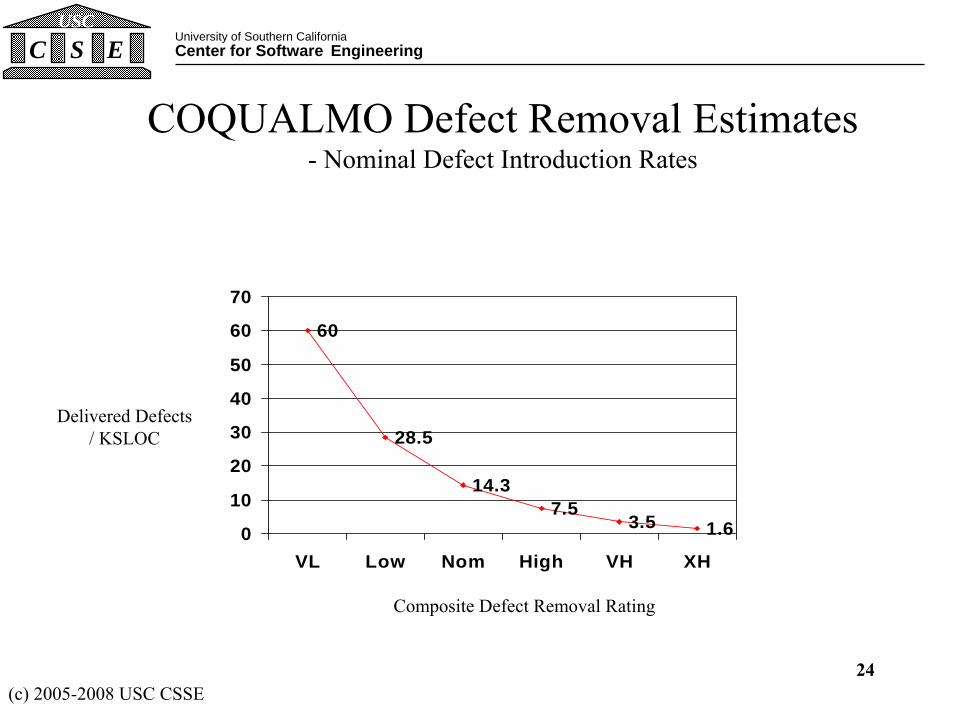
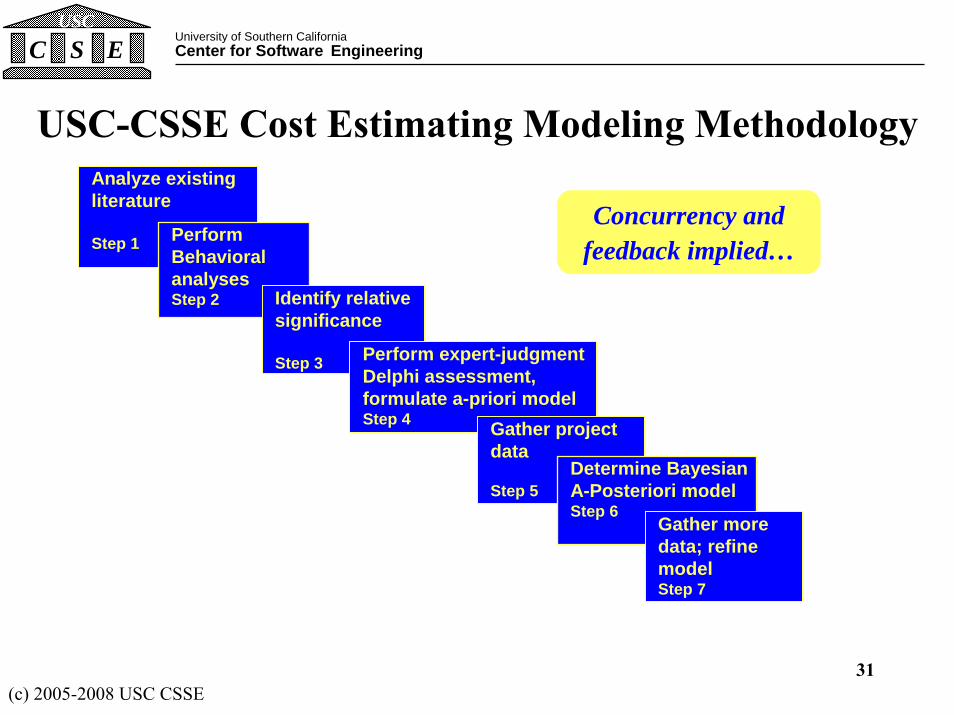
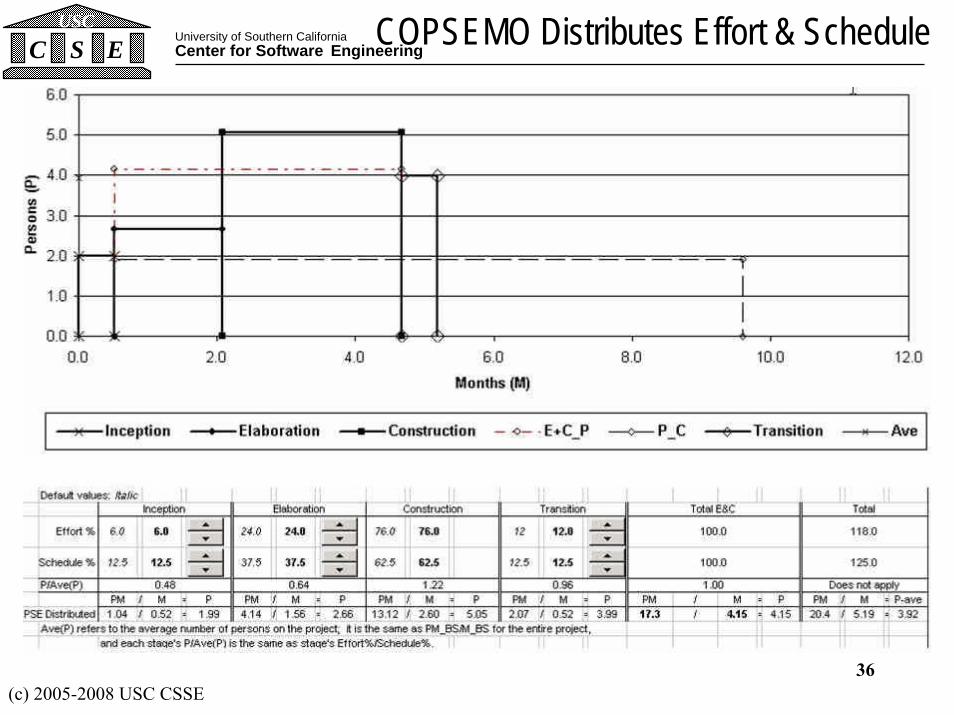
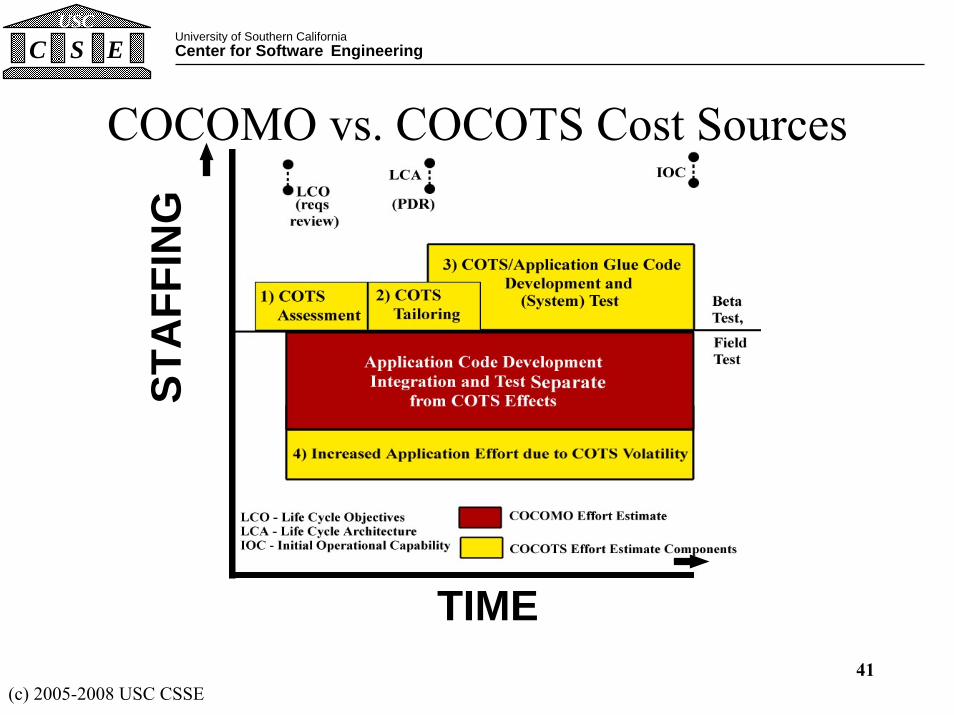
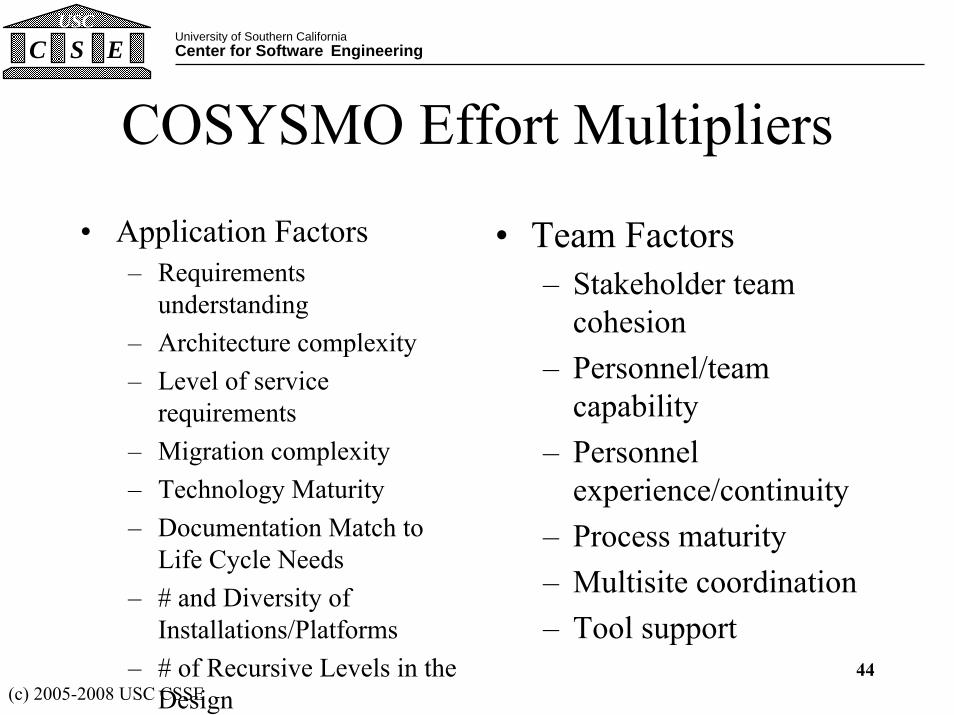
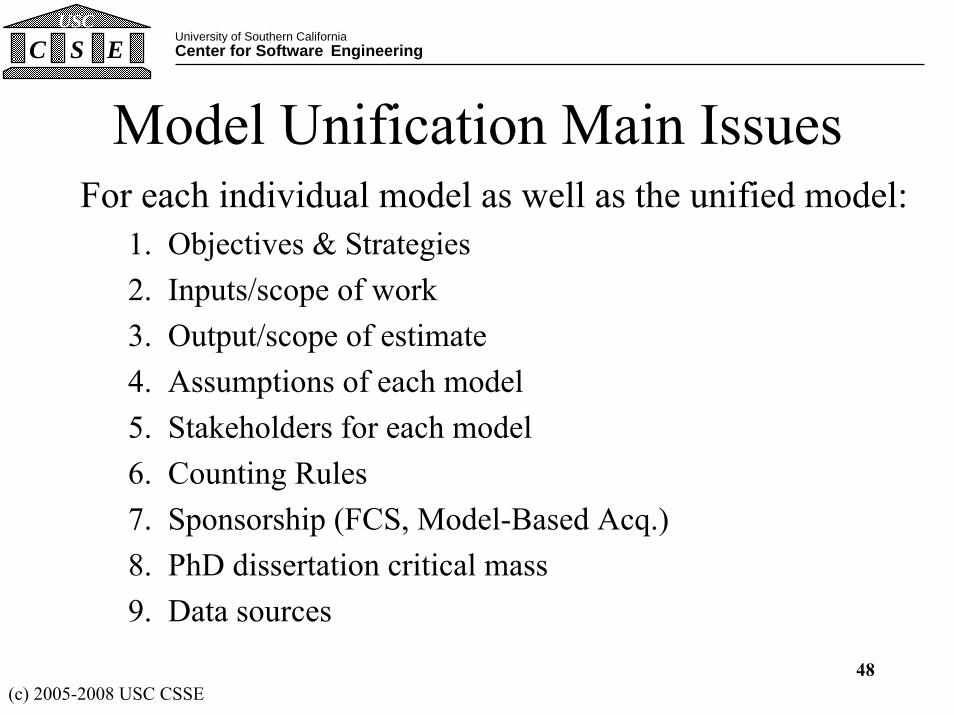
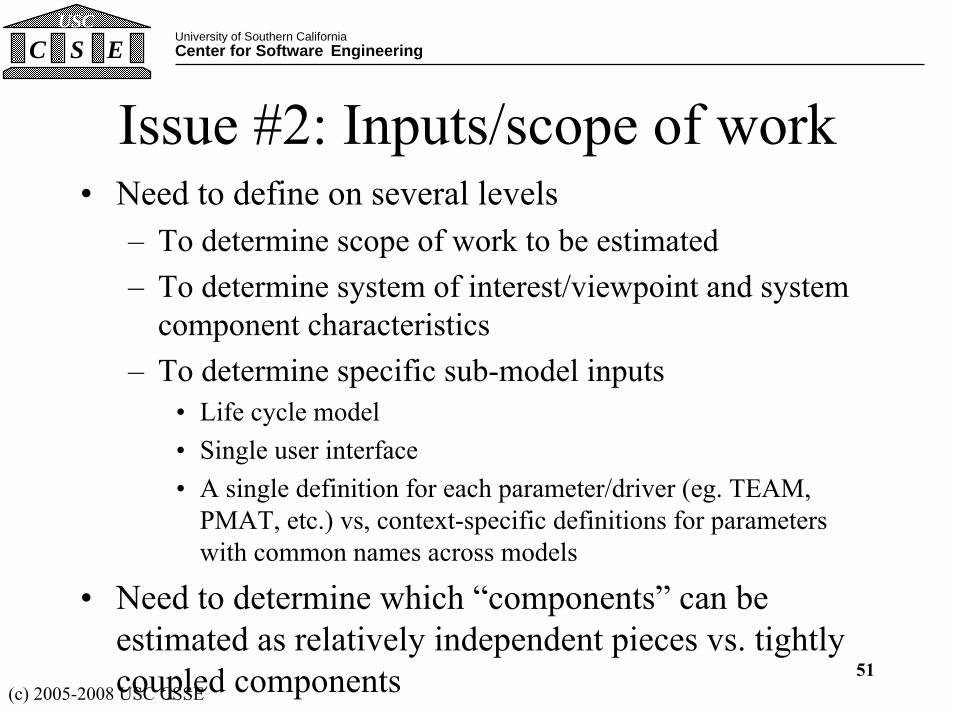
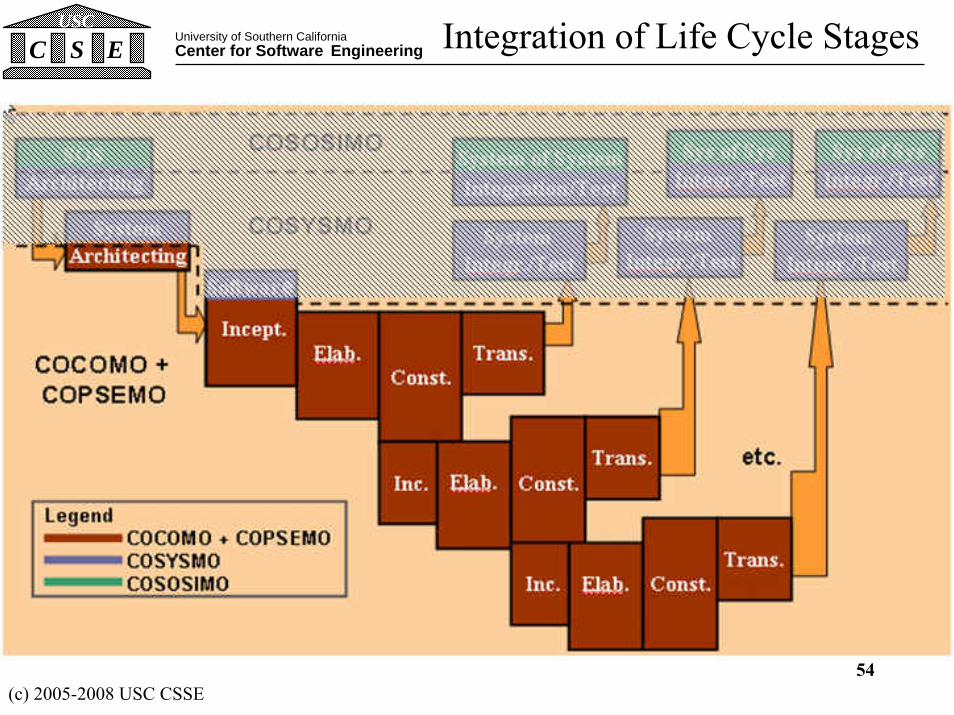
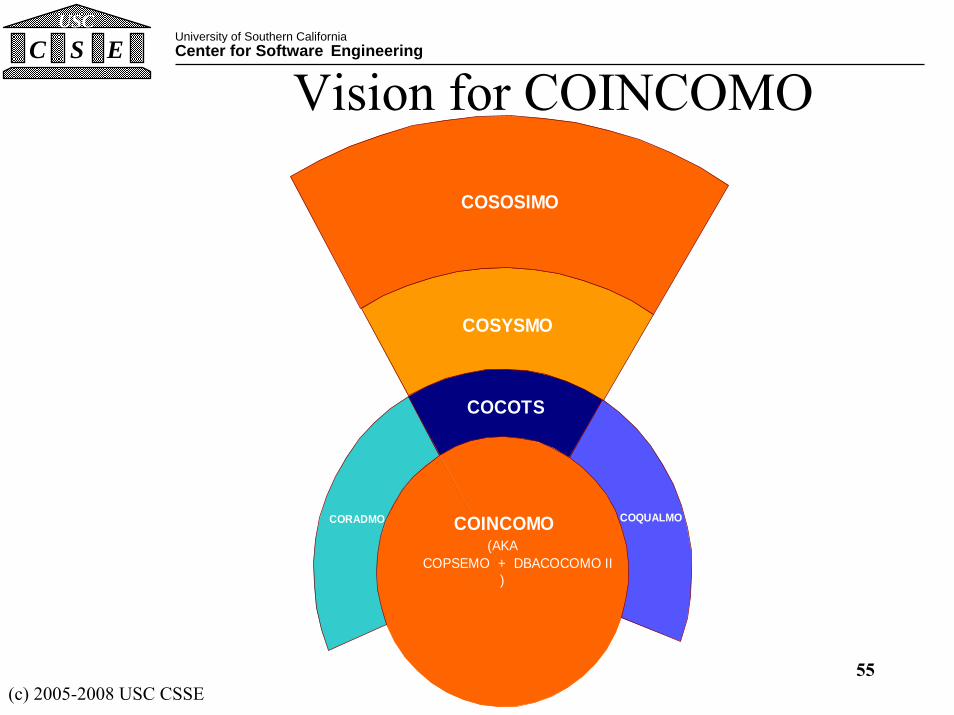
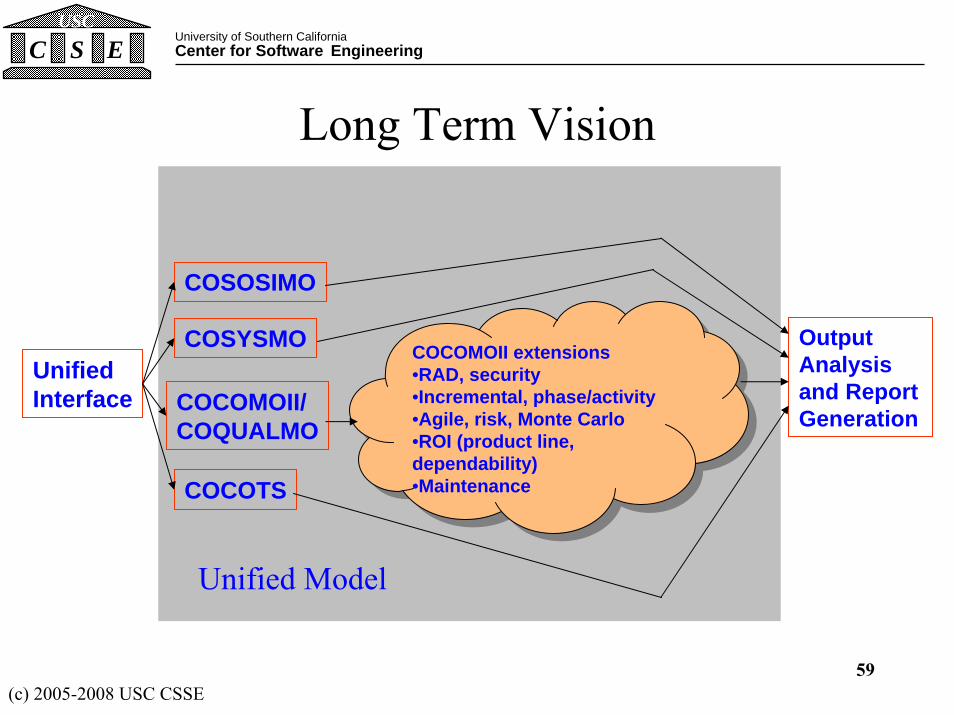
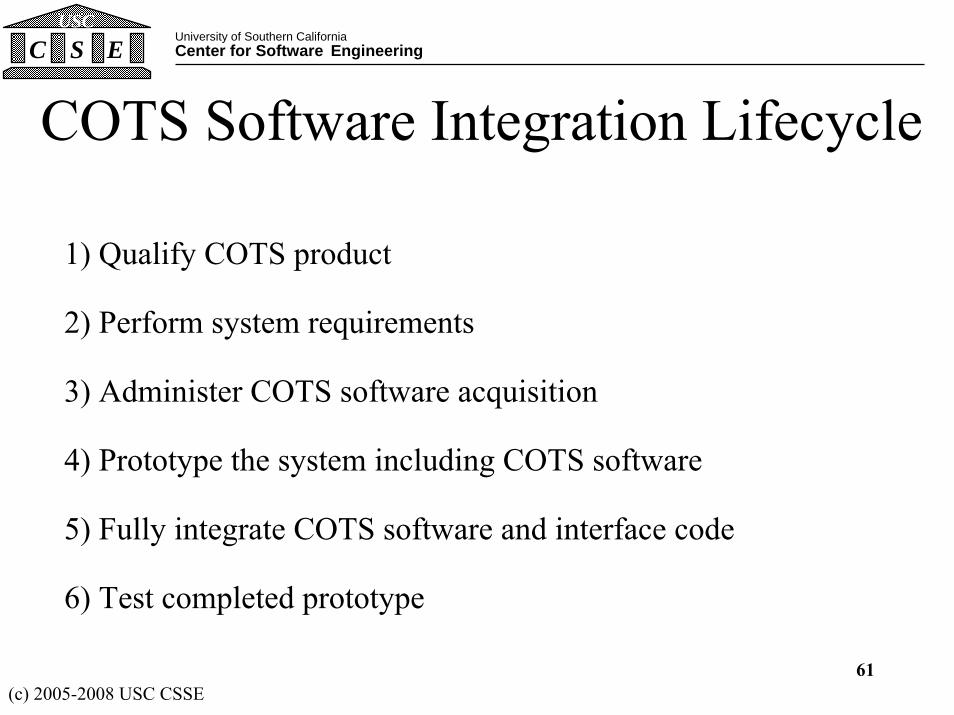
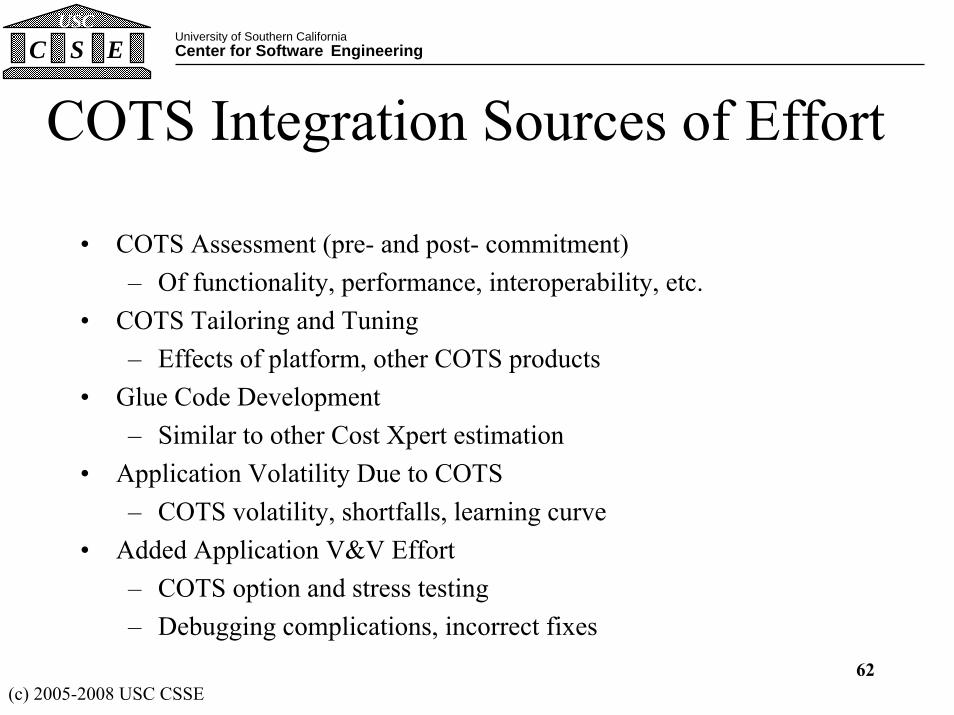
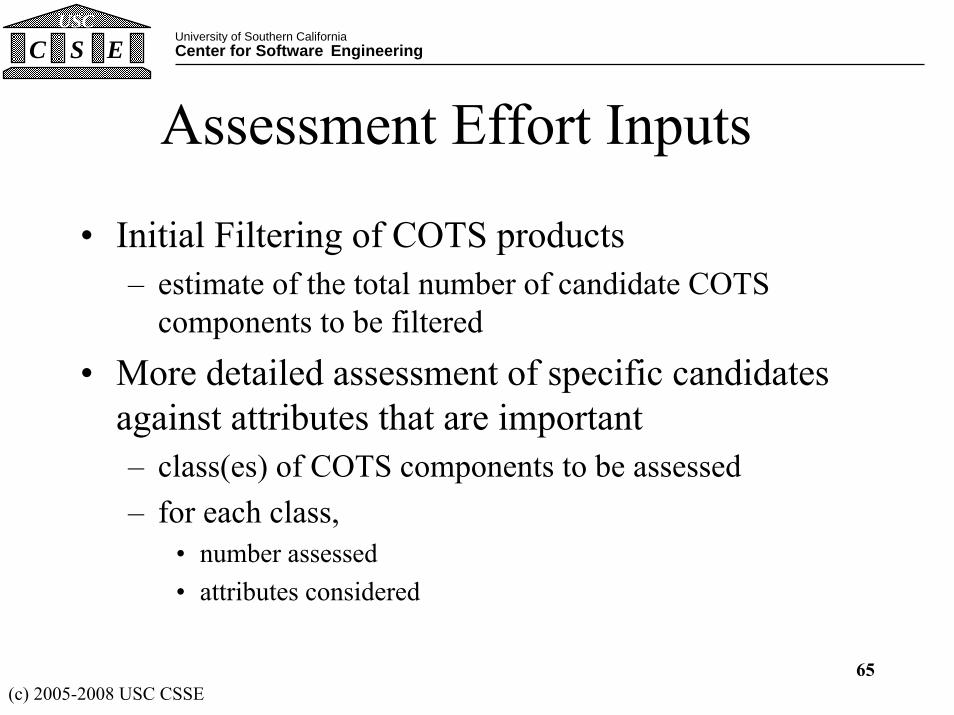
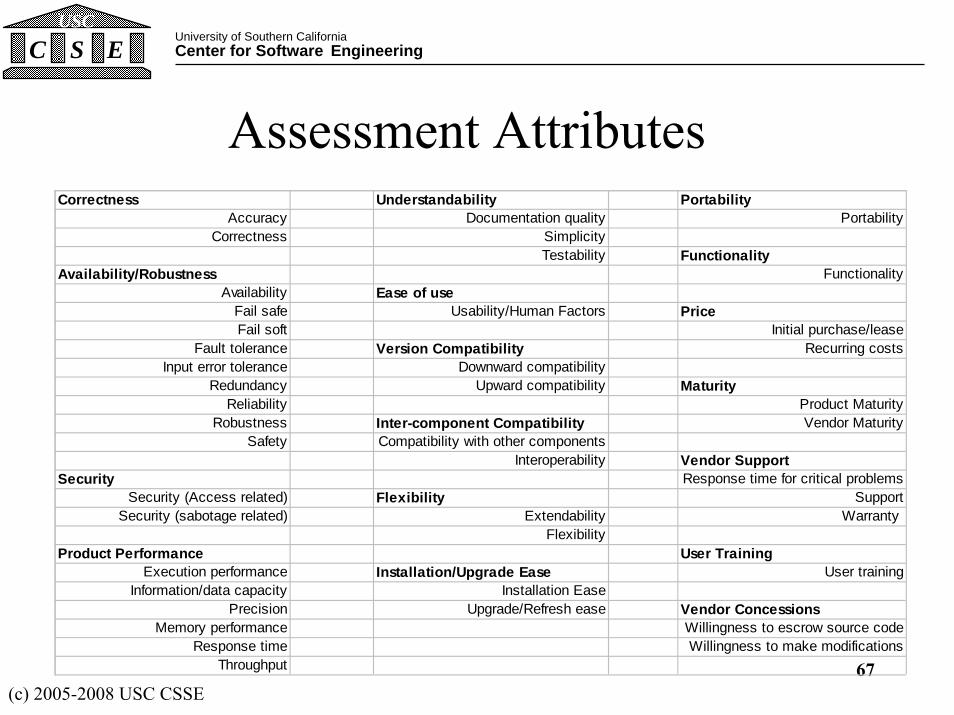
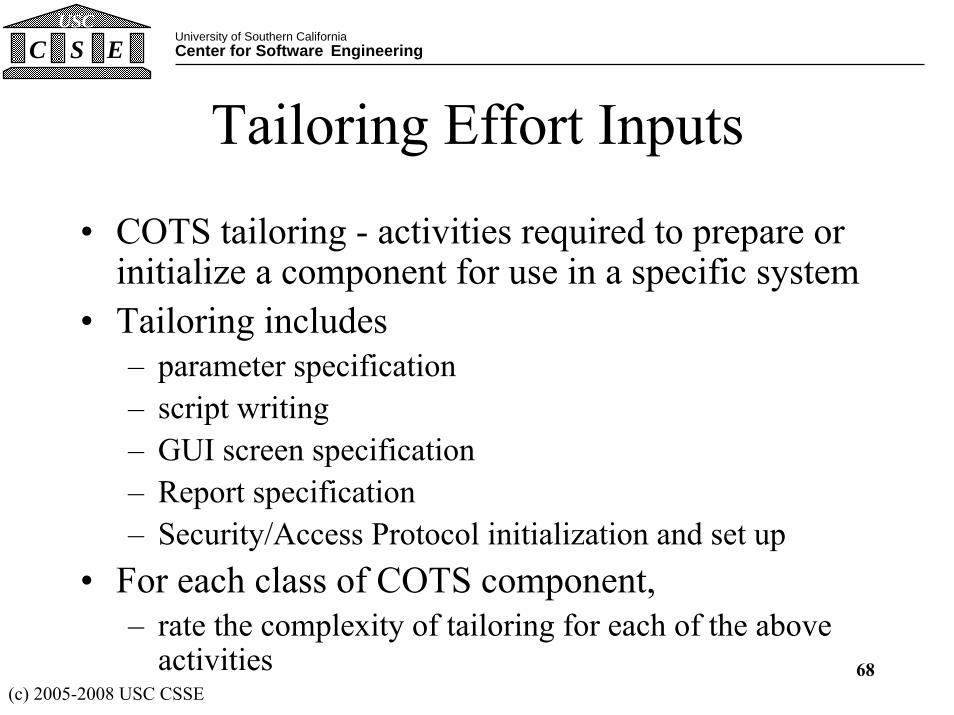
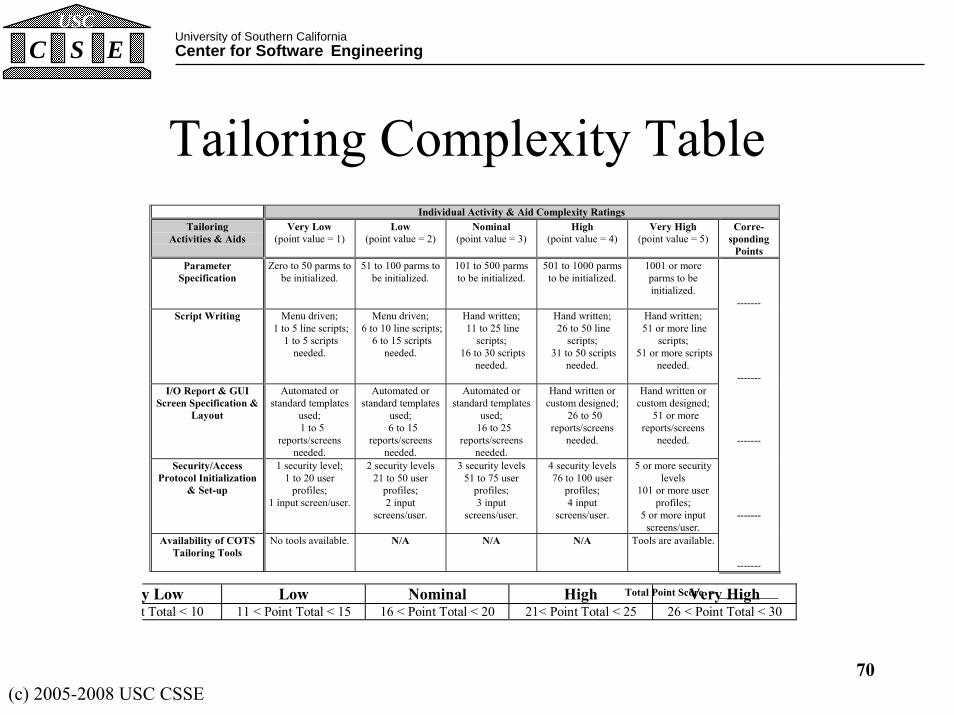
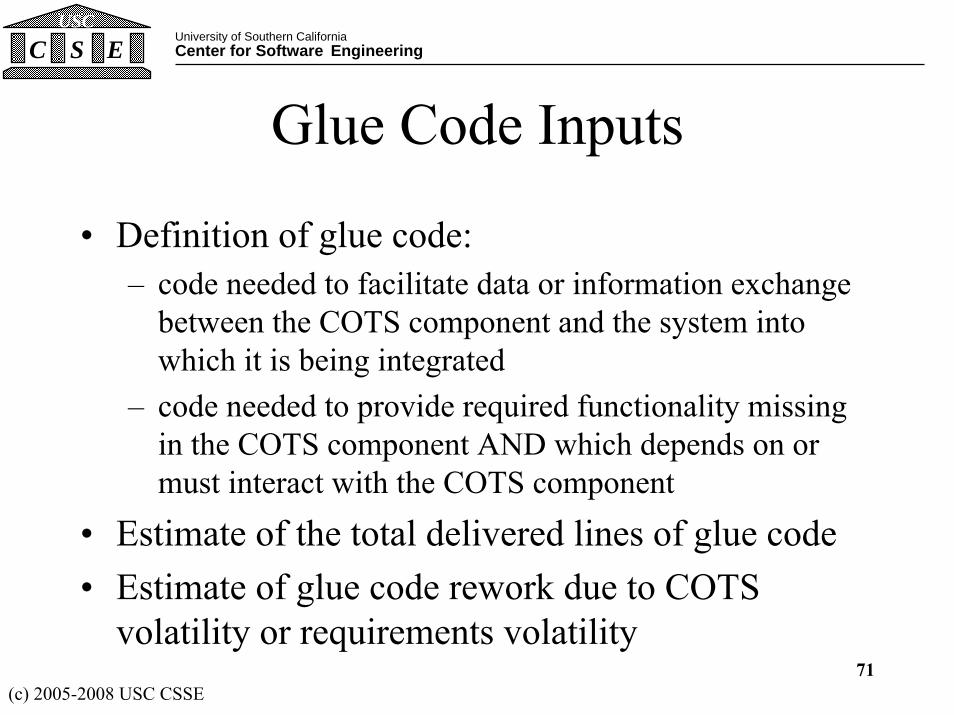
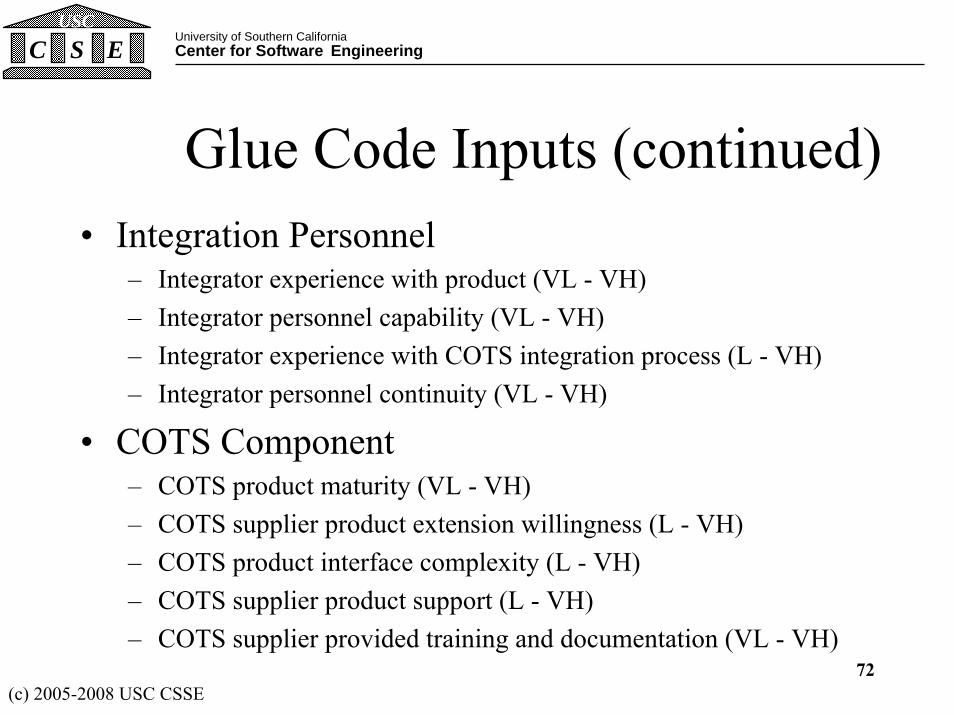
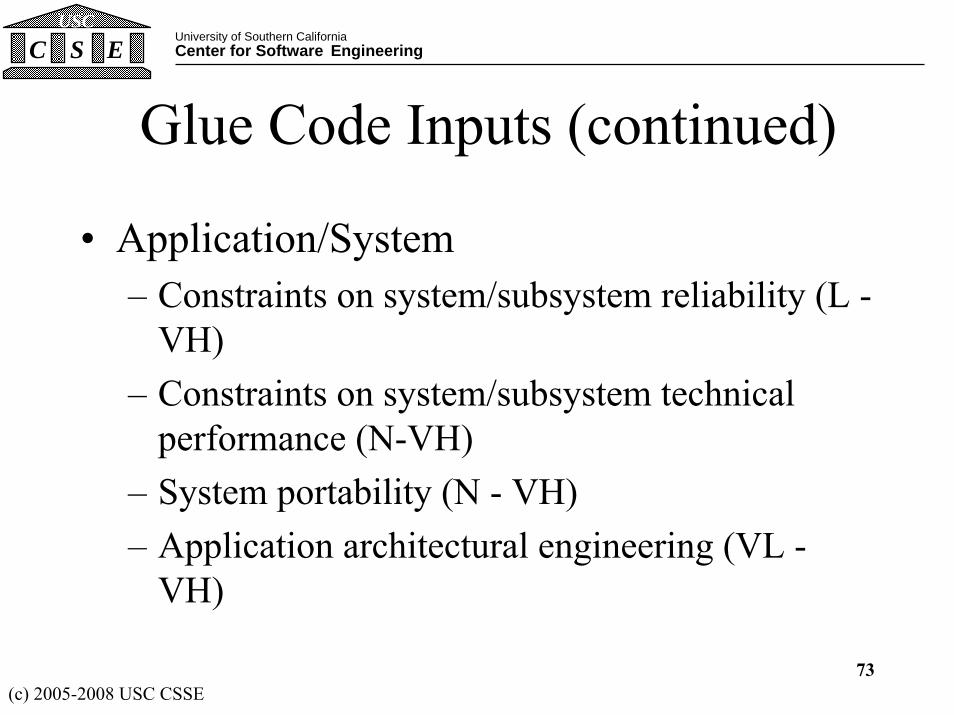
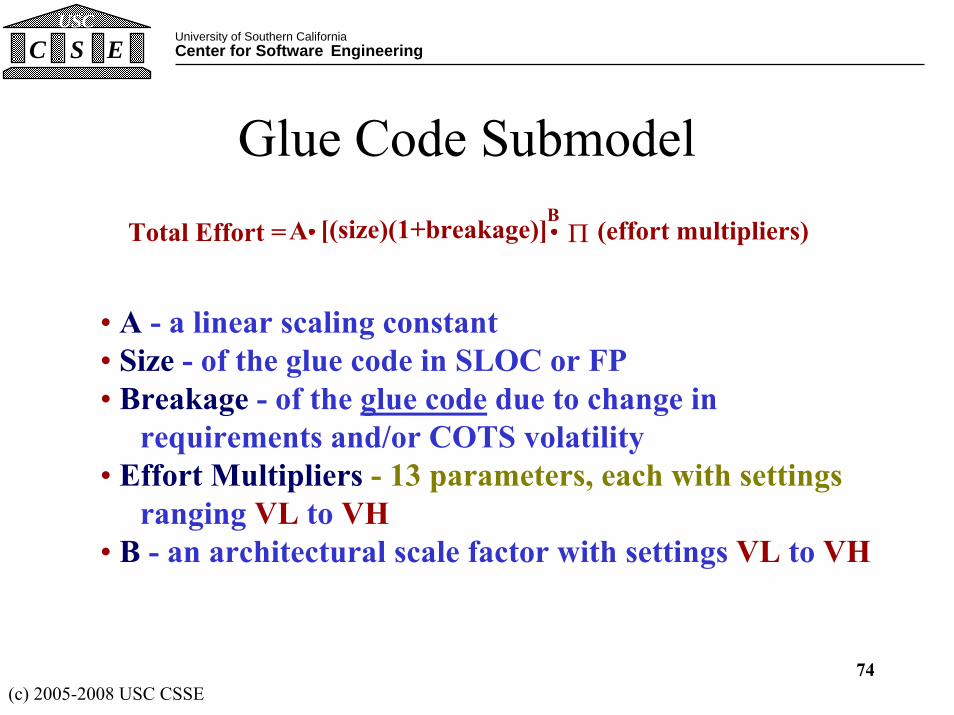
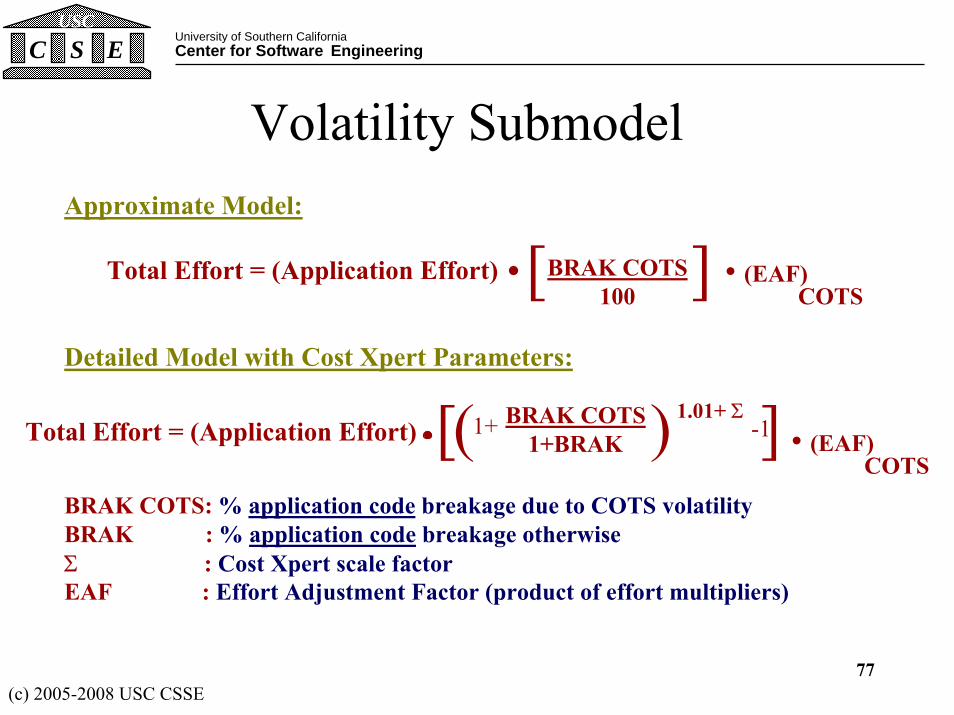
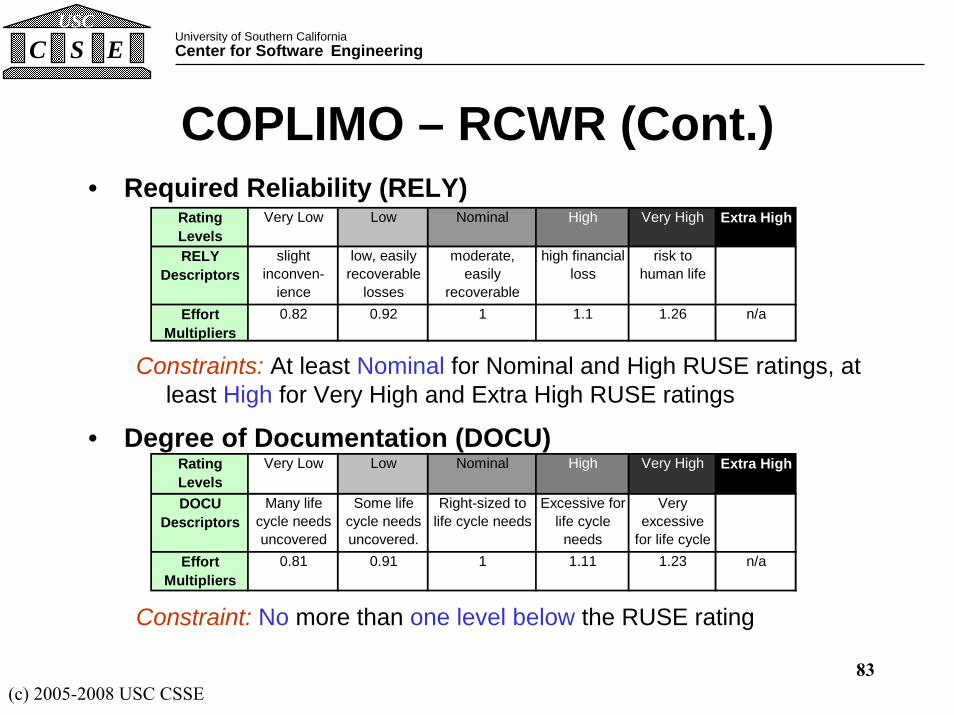
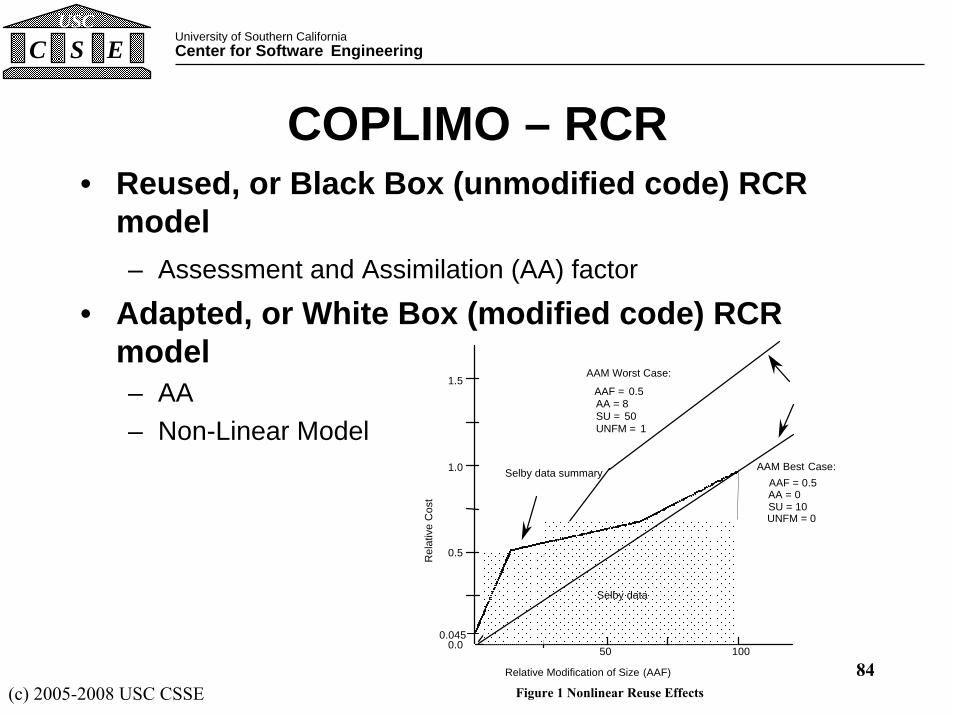
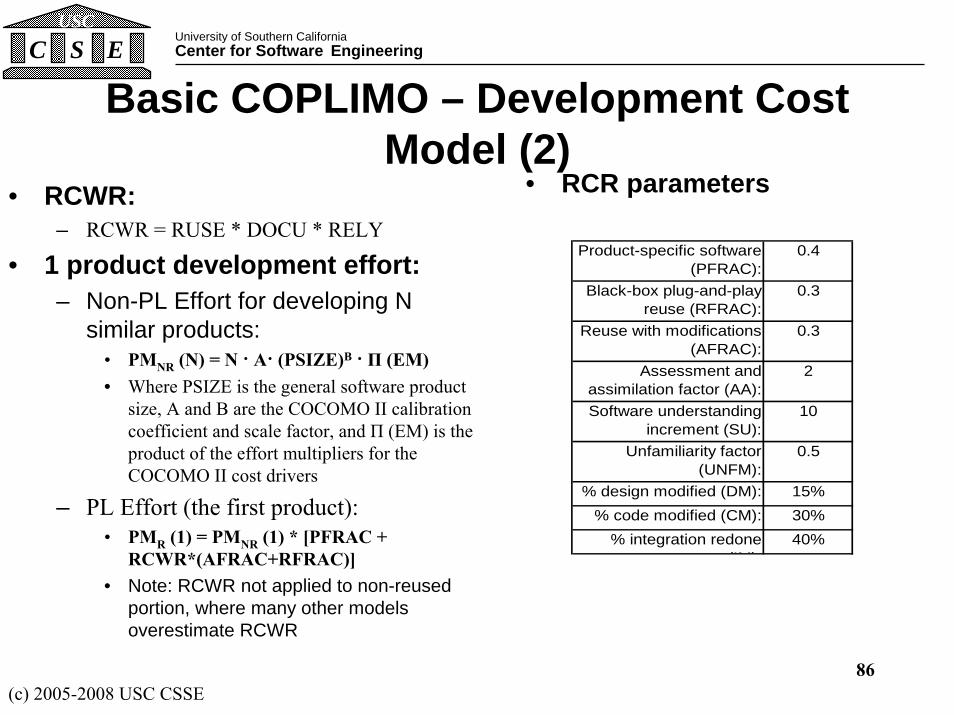
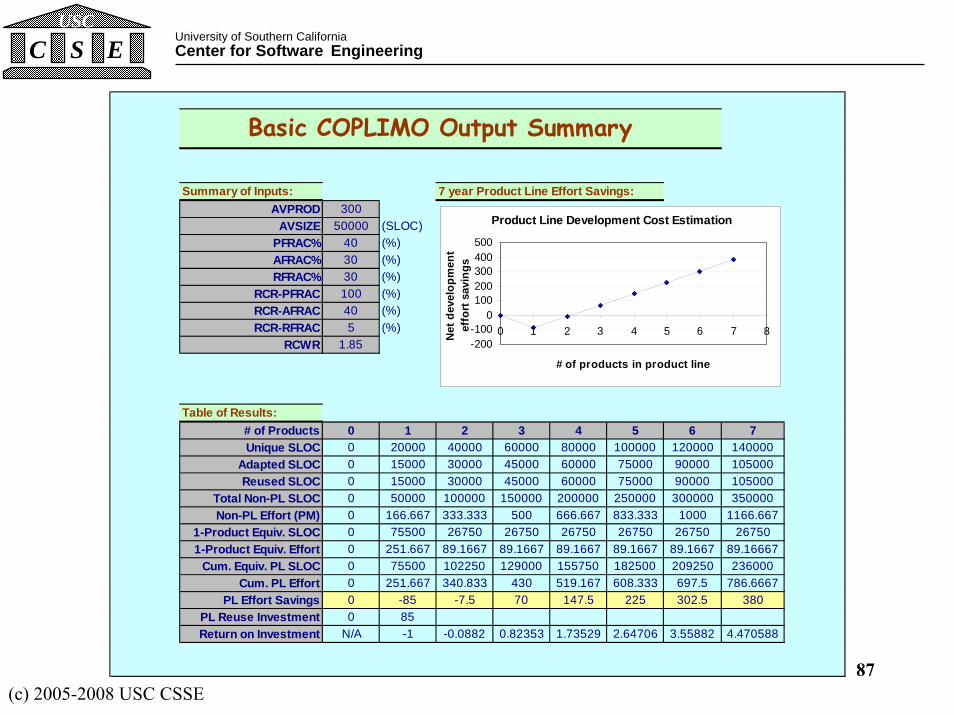
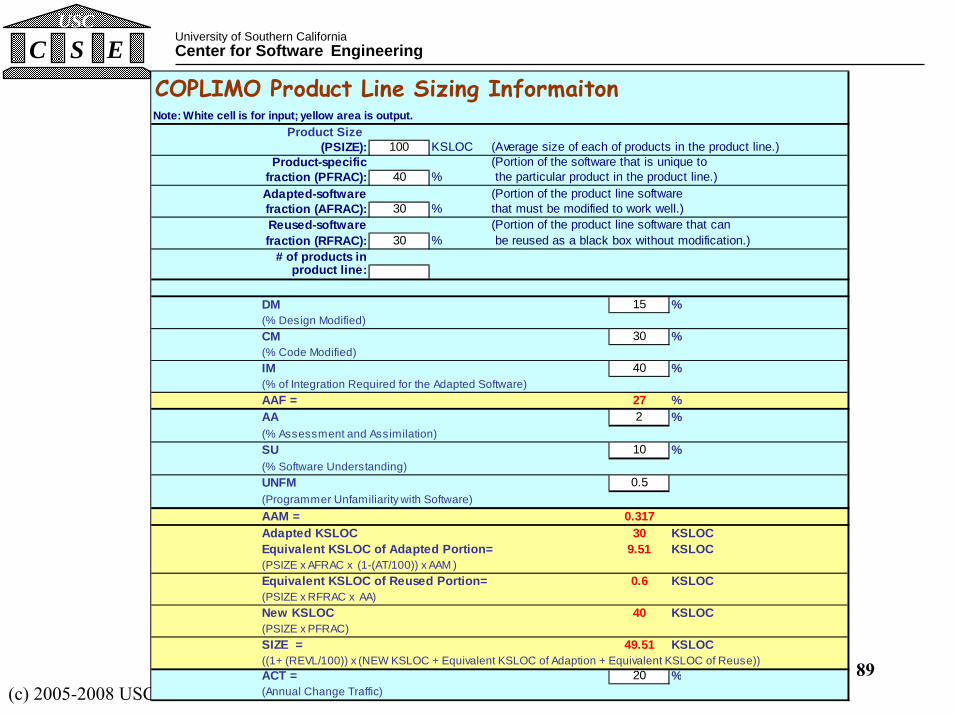
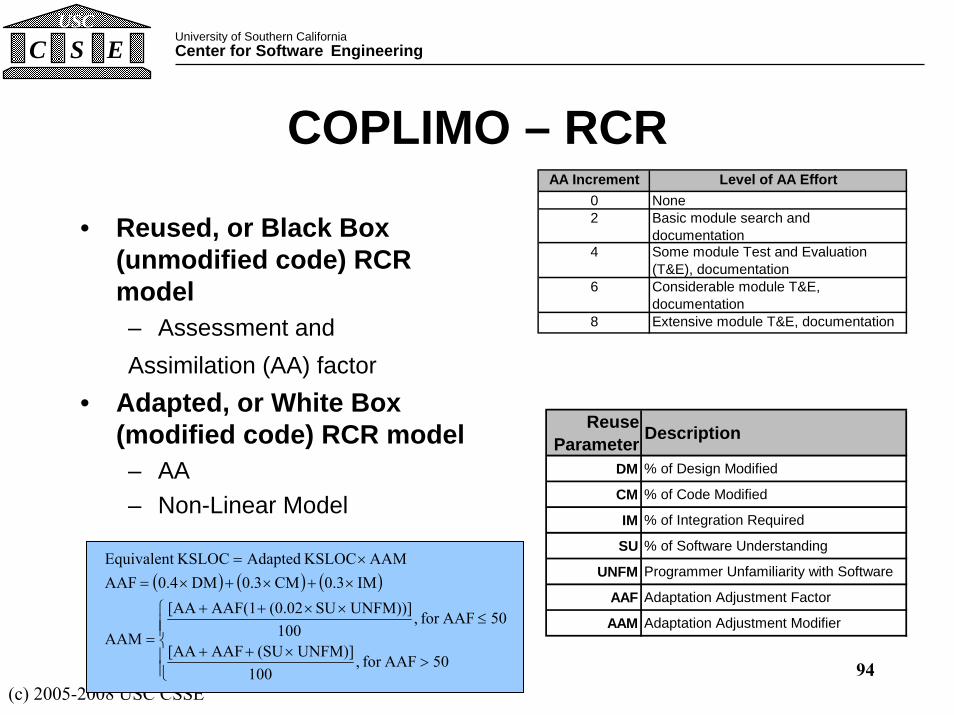
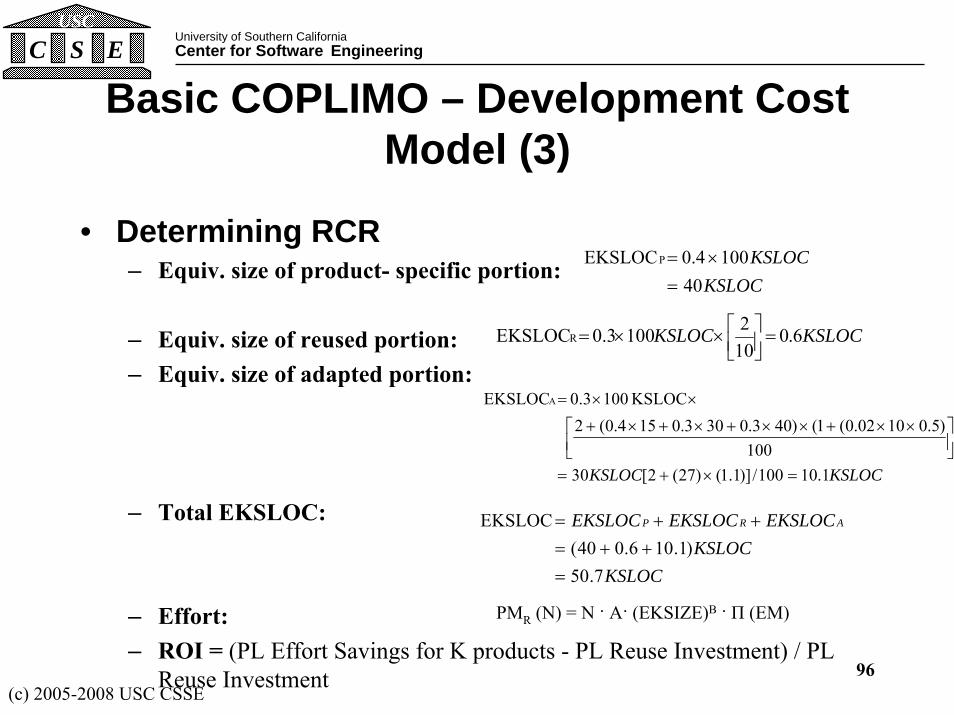
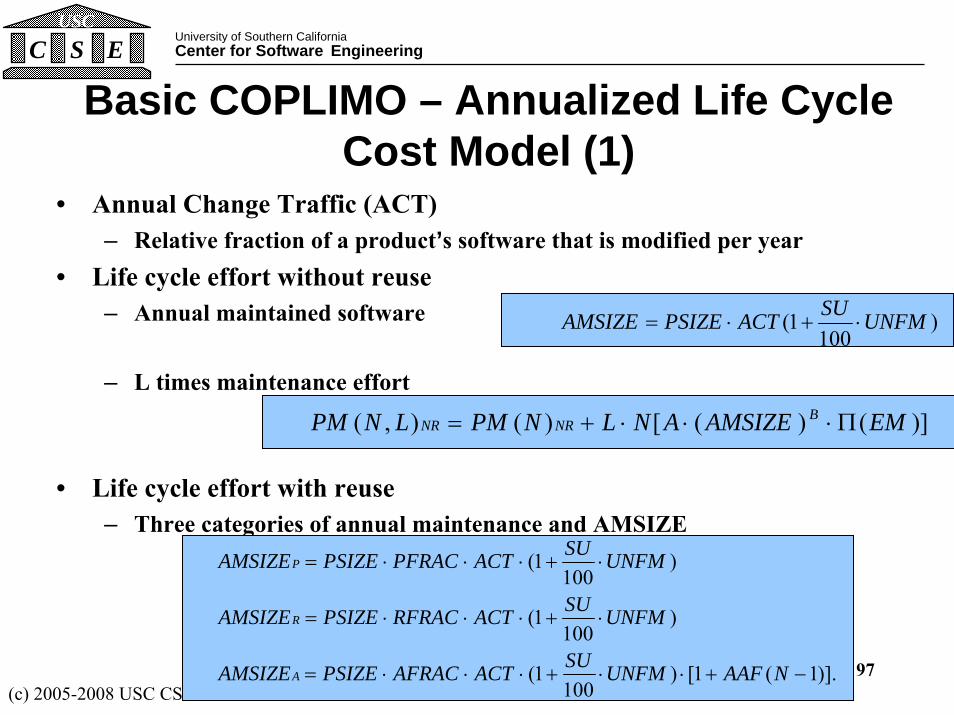
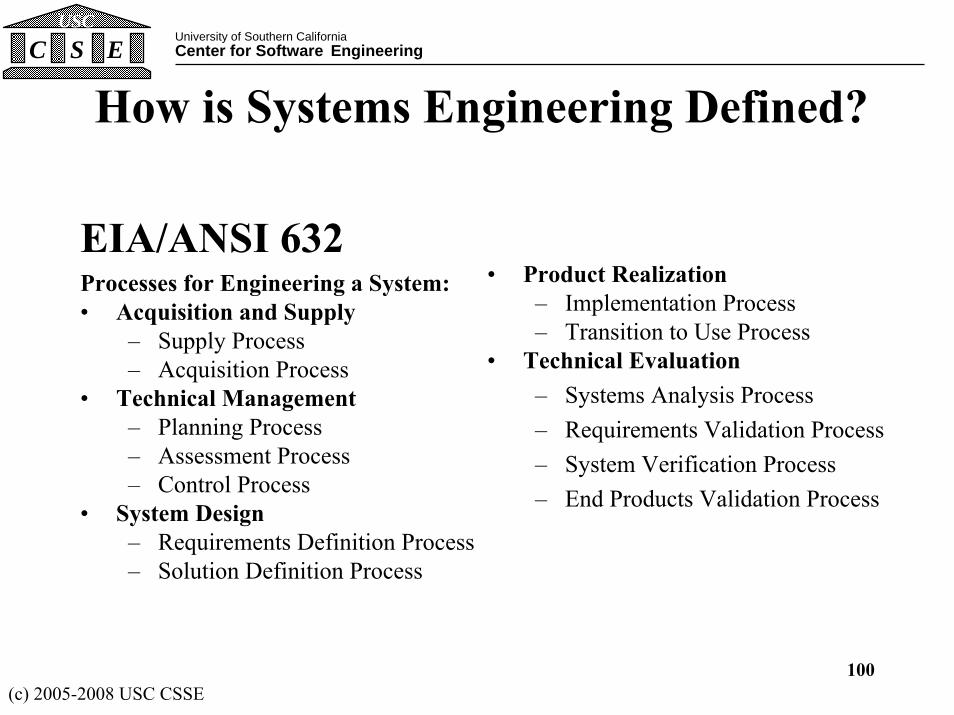
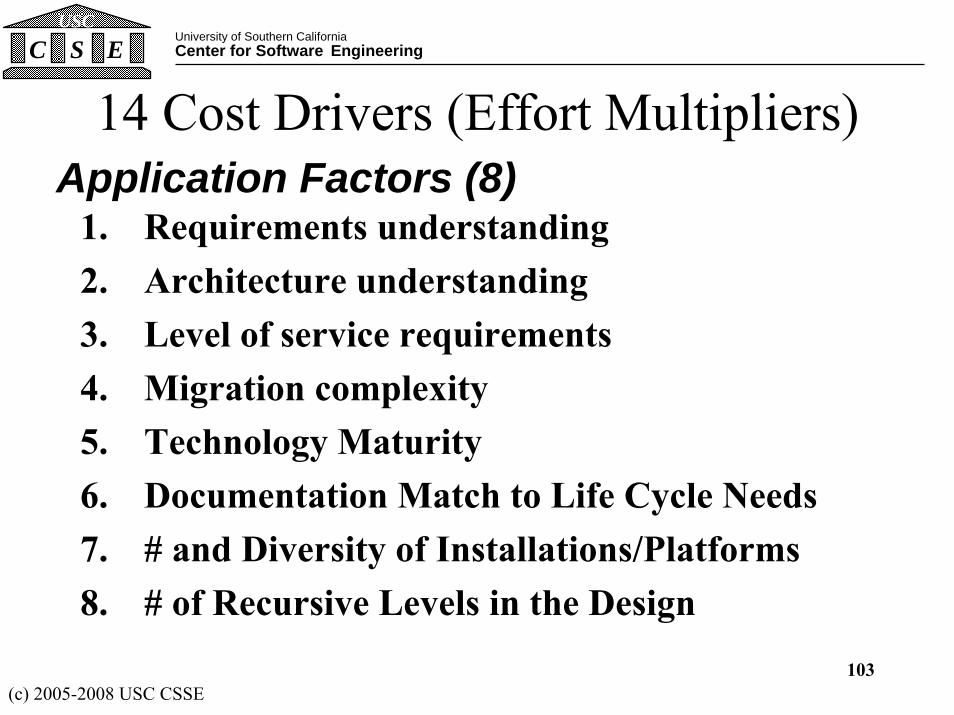
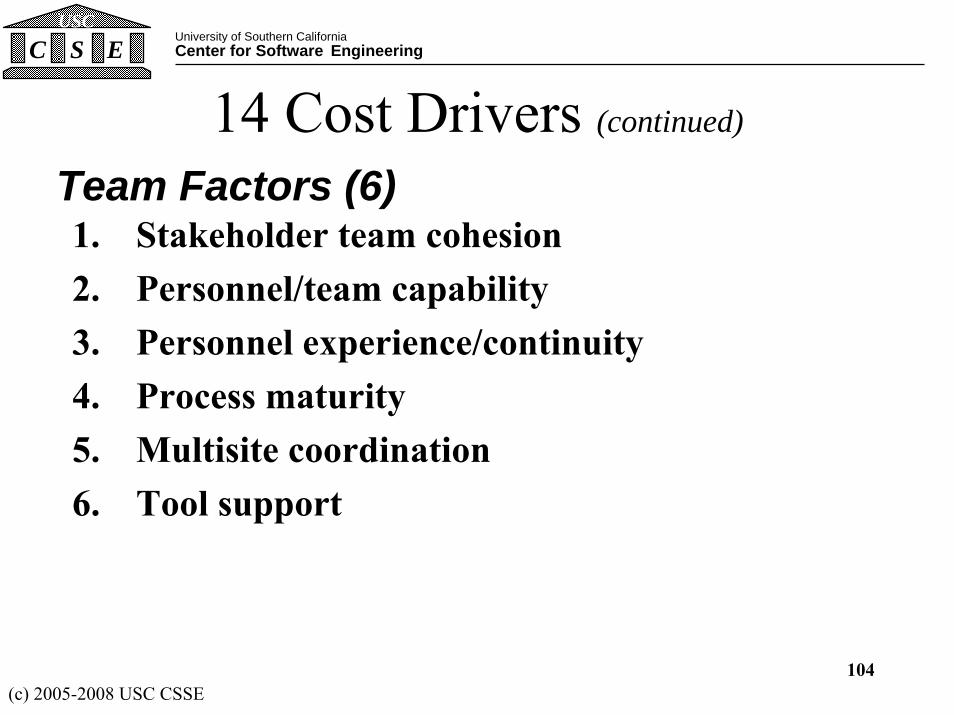
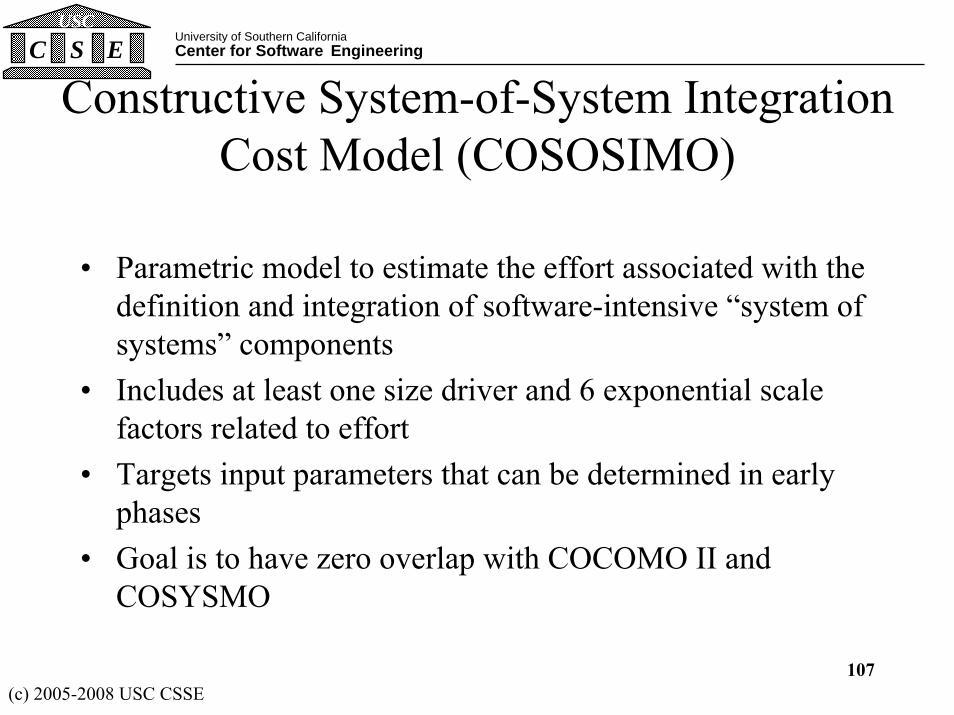
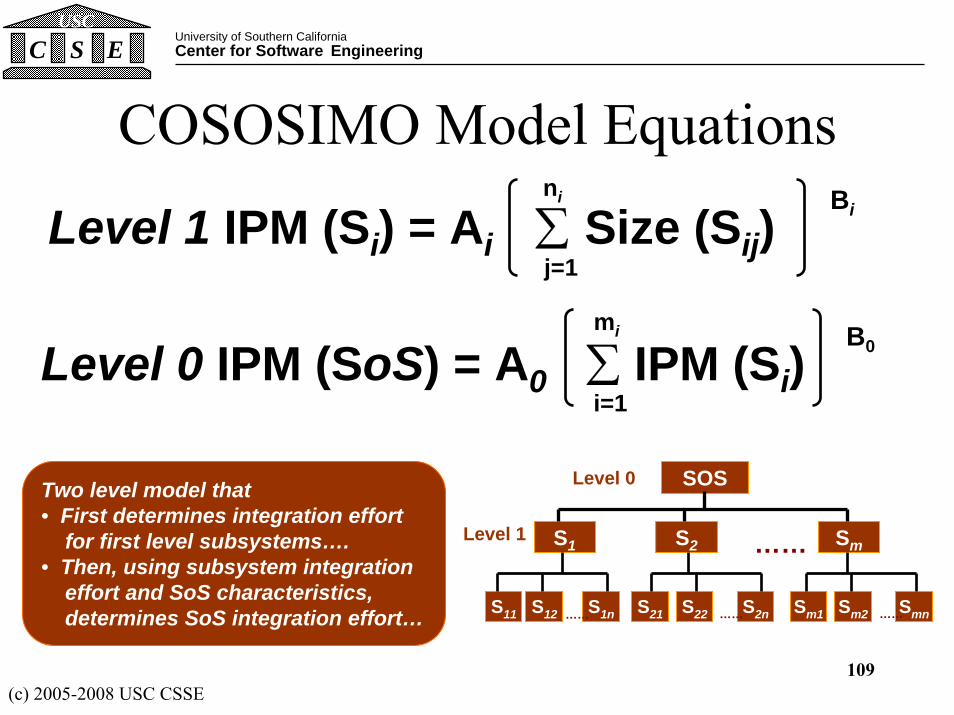
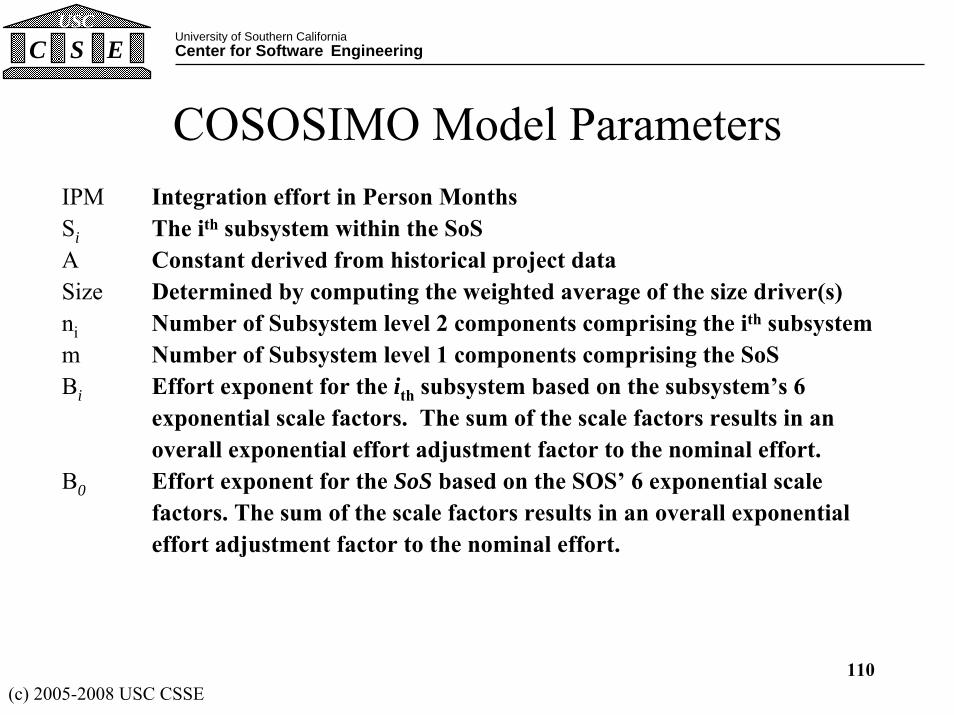
(c) 2005-2008 USC CSSE113
University of Southern CaliforniaCenter for Software EngineeringC S E
USC
Further Informationbull Main COCOMO website at USC
httpsunsetusceduresearchCOCOMOIIbull COCOMO information at USC (213) 740-
6470bull COCOMO email
cocomo-infosunsetuscedu