Embed Size (px)
Citation preview

nnovationINSIGHTi1 Florida’s Medical Technology Clusters
nnovationINSIGHTi
Florida’s Medical Technology ClustersSpring 2003
Sponsored by the Florida High Tech Corridor Council, Inc., the Tampa Bay Partnership, and the University of South Florida

nnovationINSIGHTi Florida’s Medical Technology Clusters 2 nnovation
INSIGHTi1 Florida’s Medical Technology Clusters
Table of Contents
I. Executive Summary 1
II. Background 3
III. Traditional Cluster Analysis 4Porter’s Factor “Diamond” 4
IV. Regional Targeted Cluster Comparisons 7Methodology and Sources 7Validity 7Geographic Distribution and Change 8Targeted Regional Comparisons by Establishments 10Targeted Regional Comparisons by Employment 12Targeted Regional Comparisons by Average Salary 14Targeted Regional Comparisons by Average Company Size 16Targeted Regional Comparisons by Patent Activity and Productivity 17Combined Rankings 19Florida High Tech Corridor and Combined Regions 19Combined Strategic Comparisons 22Summary Observations 24
V. Cluster Supply Chain Mapping and Opportunity Analysis 25Supply Chain Mapping 25Opportunity Analysis 27
VI. Strategic Survey Analysis 29Methodology 29Description of Companies 30Business Assistance 30Technology 31Financing and Investment 33State Incentives 34Import and Export 35Market and Product Development 36Network Capital 36Needs Assessment 38
VII. Concluding Comments and Recommendations 39
Appendix I. Medical Technology Cluster Industry Codes 41
Appendix II. Medical Technology Patent Categories 43
Appendix III. Glossary of Industry Terms 44
Appendix IV. Contact Information 45

nnovationINSIGHTi Florida’s Medical Technology Clusters 2 nnovation
INSIGHTi1 Florida’s Medical Technology Clusters
I. Executive Summary
This study was contracted by the Florida High Tech Corridor Council, Inc., the University of South Florida, and the Tampa Bay Partnership, and in partnership with the Florida Medical Manufacturing Consortium and the Gulf Coast Life Sciences Inititiative. The study was conducted between September and December, 2002 as a com-prehensive “cluster” analysis of medical technology industries in the Florida High Tech Corridor. “Medical tech-nology” describes companies in medical manufacturing, pharmaceuticals, clinical research and development, and biotech, and where appropriate bioinformatics and genomics as well. Selected findings from this report include:
• National industry trends: From 1999 to 2000, medical technology companies across the U.S. showed a slight consolidation as the number of establishments decreased approximately 10%, but overall employment stayed relatively stable. Overall, Florida medical technology clusters fared well compared to national trends.
• Florida industry activity: As a combined MSA region, the Florida High Tech Corridor ranks among the top 16 regions in the U.S. Separately, at least three Florida MSAs are competitive on a national scale: Tampa Bay, Miami, and Jacksonville. In general, these regions may be considered “Tier 1” U.S. medical technology clusters (within the top 20 regions compared against employment, salary, patents, and number of companies).Jacksonville has a suprisingly strong presence in 2001, however it is highly dependent upon two major employers; without which, its rank drops in almost every category beyond consideration as a significant cluster. Orlando and Gainesville also have high scorings in specific areas, but do not yet have a ‘critical mass’ of medical technology companies. In general, Florida medical technology clusters lag well behind the nation in terms of innovation and average salary, even after adjustment for cost-of-living and income tax. Like many of the smaller, relatively young U.S. medical technology clusters, Florida’s medical technology clusters have considerable potential for growth, especially in light of the fact that the very top clusters in the nation (southern California, the Boston region, and New Jersey) have suffered significant employment and company attrition from 1999 - 2000.
• Workforce recruitment targets: Based upon cost of living, state income tax, employment levels and relative average salaries, the best targets for specialized workforce recruitment for the Orlando and Tampa Bay regions include the New York, San Diego, Pittsburgh Pennsylvania, Tulsa Oklahoma and Riverside-San Bernardino Cali-fornia regions. Puerto Rico may also be an intriguing target due to its large workforce and severe layoffs.
• Business recruitment: The Boston region and southern California regions demonstrated significant medical technology company attrition in 1999-2000. These areas may be good candidates for recruiting entrepreneurs or vendors for relocation or expansion into Florida if presented a economic alternative to remaining in a declin-ing cluster.
• Import, export and competition: Most medical technology companies report the vast majority of their sales, vendors, and competition exist at the national (domestic U.S.) scale, with comparatively little activity at the state, local or international level. The low amount of international sales indicates a significant opportunity for export growth, and the lack of local / state competition and vendors demonstrates opportunity for local business devel-opment. Overall, these results show the medical technology cluster to be relatively strong and competitive.
• Vendor opportunities: Estimates of imports and insufficient local production capacity have identified several standard industry categories as opportunities for vendor development and recruitment. Encouraging growth and entrepreneurship in these categories should help strengthen the Florida High Tech Corridor’s medical technology cluster overall.

nnovationINSIGHTi Florida’s Medical Technology Clusters 2 nnovation
INSIGHTi3 Florida’s Medical Technology Clusters
• Network Capital: Network capital describes the ability to leverage professional networks to obtain resources. Florida High Tech Corridor medical technology companies report being fairly well connected regarding technol-ogy but poorly connected regarding financing and investment, being networked only with leaders at the local level. Access to external resources appears to depend mostly upon the networks of executive staff members, rather than board members. The implication is that while few companies felt their leaders were completely disconnected to key business resources, few businesses could tap into leadership at the Fortune 100 level or higher, and only a few company leaders had strong connections with U.S. or internationally elite business, tech-nology and finance leaders regarding medical technology. This represents a need for professional / executive networking events and activities.
• “Typical company” profile: Most medical technology companies in the Florida High Tech Corridor can be characterized as entrepreneurial, independent start-ups almost entirely self-financed (using vendor terms, boot-strapping and resources of the founder). There were few to no identified spin-outs or significant relocations. Most intellectual property is internally developed within the companies (as opposed to licensed from universities, research laboratories or other companies). Few have significant international exports. Significantly, almost all of the resources that a typical medical technology company will be able to access for much of its operation are established at startup, and are limited to the resources of the founder regarding intellectual property, financing, management, board members, and networks. Enabling and connecting entrepreneurs to resources should not only increase the survival rate of new companies, but their success and growth for several years.
• Research and technology needs: Many medical technology companies (40%) claim to have technologies available for partnership, demonstrating a need for a “clearinghouse” or other exchange forum. Universities are seen as a strong potential source of business and technology assistance in the fields of Business (marketing analysis help, business procedure development), Medical (biotech, cardiovascular), Biochemical (proteomics, microbiology and biochemistry), Engineering (mechanical and electrical, sensors, biomechanical), Materials (ba-sic materials, silicon, metallurgy – several respondents), and Information Technology. Participating companies stated the areas of most needed academic research include:
Materials characterization and development Proof of Principle verification Materials sciences
Wear resistance of medical instruments Clinical evaluations / studies Plasma physics
Algorithm and sensor technologies Applied pharmacology Materials (plastics)
Cardiovascular research Intuitive EMR Polymeric materials
Microelectromechanical systems Pharmacokinetics Animal testing
Information storage and transfer Lasers and cryogenics Proteomics
Incision closure research Interventional radiology Nanotechnology
• Needs assessment: Overall, the most critical industry issues are related to growth (marketing and sales, and research and product development) and federal regulation assistance. Tort and liability, availability of financ-ing and investment, and availability of technicians and skilled labor (versus unskilled or doctorate/specialist/professional level employees) are also important current industry needs. Assistance programs and activities in these areas will benefit medical technology companies most.

nnovationINSIGHTi Florida’s Medical Technology Clusters 2 nnovation
INSIGHTi3 Florida’s Medical Technology Clusters
II. Background
Research for this report was performed by Guy Hagen, President of Innovation Insight, Inc. under sponsorship from the Florida High Tech Corridor Council, Inc., the Tampa Bay Partnership, and the University of South Florida Office of Economic Development. The Florida High Tech Corridor Council, Inc., is an economic development partnership of the University of South Florida, the University of Central Florida, and regional economic develop-ment organizations. Work was performed from October 1st to December 14th, 2002.
Additional review, planning and oversight was contributed by Dr. Richard Streeter (USF Economic Development), Dr. Dennis Colie (USF Center for Economic Development Research), Mike Evans (Tampa Bay Partnership), Su-zanne Christman (Pinellas County Economic Development), Geary Havran (NDH Medical / Medical Manufactur-ing Consortium), Mike Poland (Gulf Coast Life Sciences Initiative), Phillis Intro and Paty Wright (Metro Orlando Economic Development Commission, Dr. Carol Steele (USF Marine Sciences / MEMS Center) and Bill Moline (Tampa Chamber of Commerce). Extensive edits and reviews were provided by Alberta Simmons of Enterprise Florida Inc., with additional participation by Michelle Bauer of the Tampa Bay Technology Forum, Trent Flood of Curley and Pynn, and staff of the Gulf Coast Life Sciences Initiative. Additional contributions were submitted by members of the Florida High Tech Corridor “core team” members. Recognition is also due Dr. Joe McCann (University of Tampa) for contributions to the survey questionnaire regarding regional competitiveness.
This report was performed in the context of three prior studies of the medical industry in central Florida:
Report on the Medical Products and Biomedical Industry (Spring, 1999). This study was the first to docu-ment the scale of medical industry in central Florida, but both the industry definition and methodology differed from this report. This report was authored and is available online from the USF Office of Economic Develop-ment.
Florida’s Medical Technology Patent Activity (Summer, 2001). This study analyzes technology transfer (as-signment and award) activity among Florida MSAs, was authored and is available online from the USF Office of Economic Development.
Medical Product Industries Cluster in Tampa Bay (Fall, 2002). The study is a cluster linkage and economic impact analysis. It has served to define the core and supporting industry categories for the medical technology cluster, and has been used as the basis for defining the industry for this research. It was authored and is avail-able from the USF Center for Economic Develeopment Research.
Unfortunately, “biotech” is becoming a buzzword that signifies different things to different people. Consequently, “Medical Technology” was selected as the description for this industry simply because it is not laden with prior and / or conflicting expectations. “Medical Technology” is used in this report as a blanket category for all primary health-science related industries, including devices, instruments, and electromedical products, biotech and bio-logical products, pharmaceutical and clinical development, and genomics and bioinformatics companies. Con-sumer services and healthcare providers are not included.

nnovationINSIGHTi Florida’s Medical Technology Clusters 4 nnovation
INSIGHTi5 Florida’s Medical Technology Clusters
III. Traditional Cluster Analysis
Although the concepts of aggregate economies and external scale benefits have existed for decades, the con-cept of industry clusters has been recently popularized by Dr. Michael Porter of Harvard University. Based upon his work (for example, “The Competitive Advantage of Nations” and “On Competition”), the cluster concept has become commonly discussed among business strategists and regional development professionals. Although his work provided few methodologies for measuring and objectively analyzing clusters, he has popularized a few heuristics which will be used in this chapter to examine the Florida High Tech Corridor medical technology cluster.
Based upon the work of Dr. Ed Feser (NC Chapel Hill), we simply define an economic cluster simply as compa-nies and organizations who are interdependent for their competitiveness.
Although geography remains a consideration, this definition de-emphasizes the role of geographic boundaries in clusters and emphasizes cluster analysis as an interactive “mode of inquiry” - a tool for enabling and guid-ing discussion, awareness, and communication between employers, producers, public sector and development professionals.
Porter’s Factor “Diamond”
The most recognized descriptive tool provided by Dr. Porter is the “Diamond” chart (below), which demonstrates the underlying and inter-related factors that effect a cluster’s competitiveness. The Diamond is used to catego-rize elements of the cluster environment that contribute to its specialization, competitiveness, and uniqueness. Essentially, the Diamond categorizes all aspects of the cluster that are external to individual companies, but that influence companies’ profitability, productivity, and growth. This tool is also useful for consideration of unique local or regional assets that are difficult replicate, and whose enhancement will benefit the cluster as a whole.
Porter’s Cluster “Diamond”
Context for FirmStrategy, Structure
and Rivalry
Factor and InputConditions
DemandConditions
Related andSupportingIndustries
nnovationINSIGHTi Florida’s Medical Technology Clusters 4 nnovation
INSIGHTi5 Florida’s Medical Technology Clusters
Context for Firm Strategy, Structure, and Rivalry: Medical technology companies in Florida (and particularly in Central Florida) have traditionally been very insular, interacting only minimally. However, over the past several years there have been many developments within this cluster that indicate a rapidly changing and growing envi-ronment. Most recently, two specialized industry associations have independently started, both based in Tampa Bay: the Florida Medical Manufacturing Consortium (MMC) and the Gulf Coast Life Sciences Initiative (GCLSI). Both organizations have missions to support the networking, competitiveness, and other needs of medical tech-nology firms, and to encourage innovation and entrepreneurism. For two years, there has been an informal “medical technology executive network” that meets throughout the year to promote social capital and networking among high-level executives, researchers, and dealmakers. Finally, several major corporate law, accounting, specialized real estate, and risk insurance firms have specialized “bio” and “medical” thrusts active in central Florida and throughout the state. While Florida’s venture capital money has traditionally come from money cen-ters in New York and Boston, more money than ever is now coming from venture funds based in Florida. There are between 15 and 20 funds based in Florida. Spurring this growth is the Florida Certified Capital Company (CAPCO) program, created in 1999. The CAPCO program’s three certified venture firms - Wilshire Partners, Advantage Capital Partners, and Stonehenge Capital - were allocated $150 million to invest solely in Florida-based companies less than two years old and are involved in developing an early-stage technology. Numerous institutional venture captial firms have offices in central Florida and a history of investing in biotech, including Lovett MIller, Advantage Capital and Stonehenge Capital. Volusia County alone documented over $150 million in medical technology capital investment expansions in 2002.
Florida has made investments in and developed the intellectual infrastructure that is critical for the biomedical technology industry’s growth. Florida has established a strong statewide advanced education network and is devoting more resources to biomedical technology and biomedical research. Florida universities and colleges produce graduates with degrees in medicine; biomedical sciences, molecular biology, biomedical engineering, materials science and engineering, biological computing, biochemical and molecular science, pharmacy, oph-thalmology, bioinformatics and medical technology, among others. Florida’s Community College System has adopted a sector consortia approach to develop new curricula in partnership with industry. In central Florida, the University of South Florida (USF), which already has a successful teaching and research medical school, College of Public Health, College of Nursing, and School of Physical Therapy has recently added new degree programs in bioengineering and bioinformatics and research centers in both biotech (neurosurgery and cell therapy) and bioengineering. USF also offers a specialized executive MBA programs for physicians. It is also home to the highly rated NCI-designated Moffitt Cancer Research center. On the East end of the Florida High Tech Corridor, the University of Central Florida (UCF) gains significant recognition for its Center for Research and Education in Optics and Lasers (CREOL),and its Institute for Simulation Technology (IST). The Florida High Tech Corridor has successful business incubators, including the award-winning University of Central Florida CFIC and the University of South Florida’s Center for Entrepreneurship and Technology, and Daytona Beach’s Medical Technologies Entrepreneurial Center complete with 2,000 square feet of “wet lab” space for biotech and pharmaceutical startups.
Several public development agencies have “biotech” or “medical tech” as a priority area, including Enterprise Florida, Pinellas County Economic Development, the Tampa Bay Partnership, the Florida High Tech Corridor Council, the Metro Orlando Economic Development Commission, the Economic Develompment Council of Col-lier County, the Business Devleopment Board of Palm Beach County, and others – not to mention the Bio Florida state industry association. Volusia County alone spends more than $400K annually marketing this sector, and reserves over $2 million in grants-in-aid to support expansions and relocations.
Demand Conditions: The principal demand consideration relates to demographics. The average age of U.S. citizens is skyrocketing as the “Baby Boomer” generation approaches retirement. This is creating a nationwide demand for senior healthcare as this sophisticated and relatively wealthy generation begins to experience senior healthcare concerns. According to a recent study by the Hudson Institute, Florida’s demographics are “ahead of the national aging curve,” wherin its average age is higher than the nation. In the Florida High Tech Corridor, this has resulted in a very extensive hospital and clinic base to support the healthcare concerns of its citizens; in

nnovationINSIGHTi Florida’s Medical Technology Clusters 6 nnovation
INSIGHTi7 Florida’s Medical Technology Clusters
Circle Diagram of Supporting Clusters
MedicalTechnology
Photonics
Aerospace /Microelectronics
InformationTechnology
Telecom-munications,Networks
Genomics,Bioinformatics,
Medical IT Services
MEMS,Sensors
Guidance andTrackingSystems
Microsensors,Instrumentation,Electromedical
Devices
Telesurgery,Virtual Anatomy
BiosensorsMedical Lasers
some rural counties, hospitals are the leading private-sector employers. This particularly demanding and large base of healthcare providers and patients encourages local development of new medical products, services, and technologies. Florida medical care is recognized internationally to the extent that it is considered an export industry (please refer to “The Economic Impact of Florida’s Hospitals” by the University of South Florida Center for Economic Development Research, 1999).
Factor and Input Conditions: Historically, Florida has had low wages and a large labor pool based upon ag-riculture and services. Since the 1950s, this has been complemented by a growing base of large aerospace manufacturers, which share many materials, education, quality control, transportation and export characteristics with medical device manufacturers. Together, this has created a strong base of precision and device manufac-turing capability within Florida and expecially the Florida High Tech Corridor region. In recent years, however, a pool of retired executives from medical sector companies throughout the U.S. has been accumulating here, and has been further augmented by highly skilled individuals entering the workforce from the University of South Florida and the University of Central Florida. In fact, St. Petersburg College has recently developed a special-ized degree program in quality manufacturing specifically designed to support medical manufacturers in the Tampa Bay region, with the financial support of the Florida High Tech Corridor Council. In addition to labor pool and manufacturing base, however, demographics again play an import part in medical technology input and cost considerations. Florida’s aging population makes an ideal test demographic for new products, devices, thera-pies and pharmaceuticals; many medical technology companies have indicated the value of research trials and corporate headquarters being located near a population that resembles the national age demographic roughly ten years from now.
Related and Supporting Industries: Central Florida, South Florida, and the Florida High Tech Corridor not only have strong manufacturing and technology industries that feed into the medical technology cluster supply chain, but there also exist several technology-based industries that complement the medical technology cluster in terms of research, technology, labor pool, innovation and entrepreneurial activity. The complementarity of these other clusters helps encourage diversification and development of “hybrid” and nontraditional applications, products and companies. The following overlapping circle diagram shows some of the most prevalent Florida clusters that complement medical technologies, partic-ularly the aerospace and microelectronics clusters (closely connected), the optics and photonics cluster, and the information technology cluster.

nnovationINSIGHTi Florida’s Medical Technology Clusters 6 nnovation
INSIGHTi7 Florida’s Medical Technology Clusters
IV. Regional Targeted Cluster Comparisons
Methodology and Sources
Regional analysis was performed using ES202 Covered Employment and Wages data for 1999 through 2001 (the most recent data available) provided by the U.S. Bureau of Labor Statistics and the Florida Bureau of Labor Statistics. Utility patent award data for 2001 were obtained by the U.S. Patent and Trademarks Office. Data from all sources was converted to standard Metropolitan Statistical Areas (MSAs) as defined by the U.S. Department of Census using the commercial ZipInfo geocode / MSA database. Although industry clusters can be smaller than, or much larger than MSA boundaries, the terms ‘cluster’ and ‘MSA’ will be used interchangably throughout this chapter. Cost-of-living data were obtained from ACCRA.
ES202 data for non-Florida regions have records withheld by the Bureau of Labor Statistics that could reveal proprietary information about individual companies. Consequently, small MSAs are more likely to have ommitted data, and as a result be under-represented in regional comparisons. Due to our aggregate definition of medical technology clusters, the combined error was expected to be sufficiently minimized for the top tiers of communi-ties for reasonable comparison.
For maximum accuracy, unomitted ES202 data were obtained for all Florida MSAs courtesy of the Florida BLS. As a result, all Florida MSA data should be fully accurate for comparison to national data and larger (particularly “Tier 1”) MSAs; however, certain MSA data must necessarily not be revealed to comply with ES202 disclosure agreements.
Standard industry codes used in this report to define “medical technology” were established by the University of South Florida’s Center for Economic Development Research (CEDR) cluster linkage and impact report, “Medical Product Industries Cluster in Tampa Bay“. These codes and their North American Industry Classification System (NAICS) statistical correlates were used to ensure consistency between studies, and are listed in Appendix I. Utility patent categories for medical technology were selected a priori based upon the definitions of the industry codes, and are listed in Appendix II.
Validity
The resources used to create this report were the best data for accomplishing the strategic and research objec-tives of the sponsoring organizations. However, there is a degree of error built into these datasets that is impor-tant to consider. First, the U.S. BLS converted from SIC-based to NAICS-based coding of their data in 2001, eliminating the possibility of historical analysis spanning that period. This study is necessarily a mix of SIC- and NAICS-based analysis. The U.S. Patent and Trademark Office switched from “Green Book” to “Red Book” en-coding of its data in 2001, which increased its utility for regional geographic analysis, but also created problems for historical comparison. The national ES202 data contains many undisclosed records, which can cause MSAs even as large as Tampa and Miami (and comparably sized MSAs across the U.S.) to be under-represented. Fi-nally, the “medical technology” industry itself was not defined based upon an empirical national analysis, but was based upon a definition of the industry as it manifested in the Tampa Bay area cluster. This has the potential to give a comparison of MSAs that may be weighted toward manufacturing as it is in the Tampa Bay area. Given these caveats, the analysis provided herein is as accurate as feasible and should be more than sufficient for purposes of strategic planning and allocation of resources to promote Florida’s medical technology clusters.
.

nnovationINSIGHTi Florida’s Medical Technology Clusters 8 nnovation
INSIGHTi9 Florida’s Medical Technology Clusters
383
0
191
2001 Florida Medical Technology Establishments by County
Geographic Distribution and Change
The following charts plot 2001 employment and wage data against a map of Florida counties. In these maps, the color (darkness) corresponds to number of establishments (from zero to 383), or number of medical technology employees (from zero to 9,200, bottom). In each map, two counties stand out: Pinellas and Miami-Dade. Duval, Hillsborough, Seminole and Palm Beach counties also are significant in the Establish-ments map.
9,200
0
4,600
2001 Florida Medical Technology Employment by County

nnovationINSIGHTi Florida’s Medical Technology Clusters 8 nnovation
INSIGHTi9 Florida’s Medical Technology Clusters
+480
-1,131
Florida Medical Technology Employment Change by County
Florida Medical Technology Establishment Change by County
+21
-21
The next two maps show employment and establishment change from 1999 to 2000. In the first map, green shades represent addition of new companies within counties (up to 21 companies), whereas red shades rep-resent attrition (up to 21 companies lost during the study period). In the second map, green shades represent the addition of up to 480 employees during the study period, and red shades represent a loss of up to 1,131 medical technology employees in one year. Consistent in both maps is a significant attrition of companies and employees from the Miami-Dade county and northwest Florida region, and a slight concentrating of companies and employees into the north Tampa Bay and Orlando Metro regions during the study period.
Overall, establishments are concentrat-ing in the urban Florida High Tech Cor-ridor counties and Broward county, and disappearing from rural Florida counties. Palm Beach county showed very strong company attrition from 1999-2000, as did Bay county.
Orange, Broward and Duval counties also show strong medical technology employment gains in from 1999-2000. Okaloosa and Miami-Dade showed the greatest employment losses.
Duval county stands out as losing com-panies and gaining employees, which represents a concentration effect dur-ing 1999-2000. Brevard county dem-onstrates the opposite, indicating an overall employment loss but probably entrepreneurial activity.
These maps show one-year change trends, which would be best considered as part of trend analysis over a longer period. As NAICS-based ES202 data become available, additional trend com-parisons are recommended beginning with the 2001 year.

nnovationINSIGHTi Florida’s Medical Technology Clusters 10 nnovation
INSIGHTi11 Florida’s Medical Technology Clusters
Targeted Regional Comparisons by Establishments
The following “bubble” chart displays U.S. medical technology clusters according to their growth / attrition (verti-cal axis), location quotient (horizontal axis), and relative number of companies (size of bubbles). The national average for 1999-2000 was an overall 10% attrition in medical technology companies. The Minneapolis region performed best over the period analyzed with over a 48% increase in number of establishments, and most of the Florida MSAs also added companies against the national trend. While it is generally considered positive to do better than the U.S. trend, if the U.S. as a whole continues to shrink in these industry sectors, individual MSAs that continue to grow may be increasing their share of a declining market.
The location quotient (LQ) simply describes how specialized a MSA is toward medical technology. A LQ of 1 signifies that MSA has exactly as the same share of medical technology companies in its economy as the nation. The LQ adjusts to the relative size of the MSA’s economy; however, the larger the economy, the less sensitive it is to individual companies for determining LQ. In this figure, Gainesville is particularly notable for having nearly six times as many medical technology companies than average, which indicates a high degree of specialization in its region’s economy. Most Florida MSAs in the figure have a positive LQ (1-1.5).
Overall, the leading Florida MSAs compare favorably against the nation regarding number of establishments. The leading MSA in terms of number of establishments is the Los Angeles - Long Beach California MSA (550
2001 Establishments
Medical Technology Clusters
Location Quotient0.5 1.0 1.5 2.0 2.5 3.0
% Change 1999-2000
-30
-20
-10
0
10
20
30
40
50
60
L.A.-Long Beach, Ca
Chicago, Il
Philadelphia, Pa-NJ
Mnpls.-St. Paul, Mn-Wi
San Jose, Ca
Dallas, Tx
Atlanta, Ga
Tampa Bay, FlMiami, Fl
St. Louis, Mo-Il
New Haven-Bridgeport, CT
Orlando, Fl
Baltimore, Md
Denver, Co
Jacksonville, Fl
Gainesville, Fl

nnovationINSIGHTi Florida’s Medical Technology Clusters 10 nnovation
INSIGHTi11 Florida’s Medical Technology Clusters
2001 Medical Technology Establishment Statistics by MSA
��� �� � ������ �������������� ����L.A.-Long Beach, Ca 0.89 -9.5 550 1Chicago, Il 1.81 16.3 487 2Philadelphia, Pa-NJ 2.81 -0.3 434 3Orange County, Ca 2.54 -8.2 397 4Boston-Brockton-Nashua, Ma-NH 1.56 -65.7 343 5Mnpls.-St. Paul, Mn-Wi 2.12 48.1 320 6San Diego, Ca 1.93 -4.2 284 7San Jose, Ca 2.77 -10.1 258 8Detroit, Mi 1.27 -6.4 177 9Cleveland-Lorain-Elyria, Oh 1.88 53.4 165 10New York-Newark, NY-NJ-Pa 0.40 32.7 155 11Nassau-Suffolk, NY 0.87 12.4 154 12Dallas, Tx 1.05 43.1 135 13Atlanta, Ga 0.68 34.5 134 14Oakland, Ca 0.93 -17.3 119 15Tampa Bay, Fl 1.33 -1.9 115.75 16Newark, NJ 1.36 3.7 109 17Bergen-Passaic, NJ 1.25 10.5 99 18Miami, Fl 0.67 -4.0 95.75 19St. Louis, Mo-Il 0.90 8.3 94 20New Haven-Bridgeport, CT 0.98 36.6 94 20Orlando, Fl 1.41 6.8 85.5 21San Juan-Bayamon, PR 1.62 0.0 83 22Houston, Tx 0.76 -49.0 80 23Baltimore, Md 1.04 16.0 77 25Kansas City, Mo-Ks 0.87 3.4 75 26Pittsburgh, Pa 0.78 -9.7 74 27Denver, Co 0.59 -26.6 66 29San Francisco, Ca 0.49 -2.0 64 30Fort Lauderdale, Fl 0.62 6.9 62.75 31Washington, DC-Md-Va-WV 0.27 751.7 55 34Cincinnati, Oh-Ky-In 0.65 21.1 45 38Jacksonville, Fl 1.06 0.0 36 42West Palm Beach-Boca Raton, Fl 0.47 -8.7 34.5 44Rochester, NY 0.83 -2.7 29 46Sarasota-Bradenton, Fl 1.02 -11.1 27.5 47Middlesex, NJ 0.60 -13.5 26 48Raleigh-Durham-Chapel Hill, NC 0.50 475.0 24 50Melbourne-Titusville-Palm Bay, Fl 1.00 13.3 18.75 53Lakeland-Winter Haven, Fl 1.07 -6.9 18 54Pensacola, Fl 1.86 -1.4 16.75 56Daytona Beach, Fl 1.43 -8.0 15.25 58Fort Pierce-Port St. Lucie, Fl 1.36 11.8 14 60Gainesville, Fl 1.52 -5.3 12.5 62Ocala, Fl 1.04 -12.5 9 65Fort Myers-Cape Coral, Fl 0.37 -8.1 8.25 66Naples, Fl 0.49 11.1 7.75 68Tallahassee, Fl 0.85 -2.0 6.75 70Huntsville, Al 0.68 30.9 6 71Fort Walton Beach, Fl 0.42 -3.2 3 72Panama City, Fl 0.43 -19.7 2.5 73Punta Gorda, Fl 0.25 -42.9 1 74
companies). Tampa Bay (Tampa-St. Petersburg - Clearwater MSA) is the leading Florida MSA with a rank of 16 (115 companies in 2001), although Miami and Orlando make very high showings. The previous table lists detailed statistics for the major medical technology MSAs, ranked by number of establishments.

nnovationINSIGHTi Florida’s Medical Technology Clusters 12 nnovation
INSIGHTi13 Florida’s Medical Technology Clusters
Targeted Regional Comparisons by Employment
In contrast with the number of establishments, clusters can also be measured by the number of employees that they support. Since this is ES202 unemployment/wage data, this includes all employees for medical technol-ogy companies regardless of job categories; it does not include medical technology employees in non-cluster companies.
Again, selected results are presented in the following bubble chart, wherein the vertical axis represents % change between 1999 and 2000, the horizontal axis represents the 2001 location quotient, and the bubble sizes represent the number of medical technology cluster employees in each MSA.
The nation as a whole lost only .2% of its medical technology employment from 1999-2000. Most notable in the following figure are the New Haven, St. Louis and Minneapolis MSAs for percentage change (St. Louis presum-ably had a few companies with significant hiring, since it only added about 10% to the number of establishments
2001 Employment
Medical Technology Clusters
Location Quotient0.0 0.5 1.0 1.5 2.0 2.5 3.0 3.5 4.0 4.5
%C
hang
e
-40
-20
0
20
40
60
80
100
120
140
160
Atlanta, GaBaltimore, Md
Chicago, IlDallas, Tx
Denver, CoGainesville, Fl
Jacksonville, FlL.A., Ca
Miami, Fl
Mnpls.-St. Paul, Mn-WiOrlando, Fl
Philadelphia, Pa-NJ
San Jose, Ca
St. Louis, Mo-Il
Tampa Bay, Fl
New Haven-Bridgeport-, Ct

nnovationINSIGHTi Florida’s Medical Technology Clusters 12 nnovation
INSIGHTi13 Florida’s Medical Technology Clusters
2001 Medical Technology Employment Statistics by MSA
��� �� � ������ ���������� ����Chicago, Il 1.94 14.0 37,179 1Philadelphia, Pa-NJ 3.65 2.7 33,562 2Mnpls.-St. Paul, Mn-Wi 2.92 41.2 27,458 3Boston-Brockton-Nashua, Ma-NH 1.93 -42.0 25,611 4San Jose, Ca 3.90 7.6 24,966 5Orange County, Ca 2.69 -0.9 24,095 6L.A.-Long Beach, Ca 0.92 2.4 23,379 7Newark, NJ 5.35 3.5 21,654 8San Juan-Bayamon, PR 5.59 -3.5 16,880 9San Diego, Ca 1.88 0.0 13,334 10Tampa Bay, Fl 1.89 1.7 9,590 11New York-Newark, NY-NJ-Pa 0.49 8.8 9,211 12Miami, Fl 1.55 -8.0 9,186 13Nassau-Suffolk, NY 1.34 13.9 9,020 14Cleveland-Lorain-Elyria, Oh 1.64 22.2 8,933 15Atlanta, Ga 0.65 3.6 7,697 16Dallas, Tx 0.80 14.9 7,133 17New Haven-Bridgeport-Stamford-Danbu 1.51 135.8 6,471 18Jacksonville, Fl 2.71 3.5 6,084 19Bergen-Passaic, NJ 1.90 10.3 5,898 20Detroit, Mi 0.61 27.3 5,342 21Oakland, Ca 0.91 -13.1 4,697 23San Francisco, Ca 0.73 34.2 3,869 26Denver, Co 0.64 -17.2 3,573 28St. Louis, Mo-Il 0.50 46.9 3,423 29Kansas City, Mo-Ks 0.65 2.2 3,306 31Houston, Tx 0.41 -46.1 3,175 33Pittsburgh, Pa 0.52 -26.8 2,803 36Orlando, Fl 0.86 25.4 2,762 37West Palm Beach-Boca Raton, Fl 0.84 3.0 2,495 39Cincinnati, Oh-Ky-In 0.52 1.2 2,418 40Baltimore, Md 0.39 8.8 1,894 45Daytona Beach, Fl 4.77 -2.7 1,830 46Rochester, NY 0.81 -12.0 1,570 51Fort Lauderdale, Fl 0.33 20.0 1,311 57Washington, DC-Md-Va-WV 0.09 812.2 1,163 60Raleigh-Durham-Chapel Hill, NC 0.46 497.5 1,128 62Sarasota-Bradenton, Fl 0.81 -9.4 1,105 64Middlesex-Hunterdon, NJ MS 0.47 -31.8 1,035 66Lakeland-Winter Haven, Fl 0.62 -15.1 559 76Melbourne-Titusville-Palm Bay, Fl M 0.62 -13.4 557 77Fort Myers-Cape Coral, Fl 0.62 0.7 549 78Pensacola, Fl 1.25 2.3 481 81Gainesville, Fl 1.06 -12.8 399 86Huntsville, Al 0.77 15.6 344 91Ocala, Fl 0.97 3.7 325 92Fort Pierce-Port St. Lucie, Fl 0.65 30.3 235 94Naples, Fl 0.35 16.1 197 95Panama City, Fl 0.69 0.8 168 96Tallahassee, Fl 0.10 18.6 32 97Fort Walton Beach, Fl 0.09 -76.5 24 98Punta Gorda, Fl 0.04 -57.1 6 99
during the same period). Denver lost significant cluster employment during this period (roughly 18%). Tampa Bay and Jacksonville MSAs remained roughly stable between 1999 and 2000, although Orlando added over 25% and Gainesville lost approximately 18%. Of the selected MSAs, Jacksonville suprisingly had the highest employment LQ (nearly three times higher than the average proportion of medical technology employment), although Tampa Bay and Miami had respectably high employment LQs as well (1.9 and 1.6 respectively). As shown on the previous table, the Chicago, Illinois MSA leads the U.S. for number of medical technology cluster employees (over 37,100), followed by the Philadelphia and Minneapolis MSAs. Tampa Bay and Miami are also significant leaders (over 9,500 and 9,100 employees in 2001, respectively). The preceding table lists detailed statistics for major medical technology clusters, ranked by medical technology employment.

nnovationINSIGHTi Florida’s Medical Technology Clusters 14 nnovation
INSIGHTi15 Florida’s Medical Technology Clusters
Targeted Regional Comparisons by Average Salary
Another indicator of technology cluster health is average salary; it represents competitiveness and demand for specialized labor, and relates at least indirectly to productivity (increasing labor costs usually precedes an increase in capitalization of production). However, average salaries can be difficult to compare without compen-sating for income taxes and relative costs of living, which are certainly factors considered by employees when considering job options. The statistics provided in the following figure compensate for both cost of living and state income taxes.
State income tax data was obtained from the Federation of Tax Administrators (web site), and based upon the av-erage raw medical technology cluster salary for all MSAs ($55,933, for 2001), and deductions for single income, one child (where deductions are allowed). Puerto Rico was not adjusted for state income tax. Rankings were based upon raw average salary adjusted only for income tax (as shown in the salary statistics table, preceding page), since consistent cost-of-living indicators were not available for all MSAs. Although the Melbourne-Titus-ville and Jacksonville MSAs (ranks #15 and #16) pay slightly more than the tax adjusted mean, Most Florida MSAs pay well below the average even compensating for the lack of state income tax and cost of living. It is worth noting that average salaries may be influenced by local labor market demand, as well as the specific skill requirements and industry specializations manifested within each region. For example, a particular MSA that has significantly more assembly and low-margin operations may exhibit lower overall average wages as well.
2001 Average Salaries Adjusted for Cost of LivingMedical Technology Clusters
2001 Adjusted Average Salary
$0 $1
0,0
00
$2
0,0
00
$3
0,0
00
$4
0,0
00
$5
0,0
00
$6
0,0
00
$7
0,0
00
MSA
L.A.-Long Beach, Ca
Dallas, Tx
Raleigh-Durham-Chapel Hill, NC
Denver, Co
Washington, DC-Md-Va-WV
Tampa Bay, Fl
Atlanta, Ga
St. Louis, Mo-Il
Orlando, Fl
Mnpls.-St. Paul, Mn-Wi
Philadelphia, Pa-NJ
Chicago, Il
Jacksonville, Fl 61,024
60,634
56,871
47,340
46,584
45,488
43,494
41,928
41,888
40,917
39,458
39,332
36,082
Blue box: Average medicaltechnology salary, entire U.S.Pink box: Average salary, entire U.S.

nnovationINSIGHTi Florida’s Medical Technology Clusters 14 nnovation
INSIGHTi15 Florida’s Medical Technology Clusters
2001 Medical Technology Salary Statistics by MSA
��������� �������������
��� ��������������
����������������
������ � ����������������� ����
Seattle-Bellevue-Everett, Wa 1.000 95,066 n/a n/a 1San Jose, Ca 0.907 83,244 n/a n/a 2Newark, NJ 0.945 82,701 n/a n/a 3San Francisco, Ca 0.907 75,681 1.992 37,992 4Philadelphia, Pa-NJ 0.972 68,757 1.209 56,871 5New York-Newark, NY-NJ-Pa 0.932 65,528 2.352 27,861 6Chicago, Il 0.970 63,423 1.046 60,634 8Boston-Brockton-Nashua, Ma-NH 0.947 62,745 n/a n/a 9Bergen-Passaic, NJ 0.945 62,621 n/a n/a 10Middlesex-Hunterdon, NJ MS 0.945 62,253 n/a n/a 11Oakland, Ca 0.907 61,227 n/a n/a 12New Haven-Bridgeport, CT 0.955 60,671 n/a n/a 13Melbourne-Titusville-Palm Bay, Fl 1.000 57,174 n/a n/a 15Jacksonville, Fl 1.000 56,936 0.933 61,024 16Huntsville, Al 0.950 56,613 0.961 58,911 17Fort Lauderdale, Fl 1.000 53,336 n/a n/a 22Mnpls.-St. Paul, Mn-Wi 0.930 53,329 1.127 47,340 23Tallahassee, Fl 1.000 50,622 1.090 46,443 24Baltimore, Md 0.952 50,352 n/a n/a 25Orange County, Ca 0.907 50,088 n/a n/a 26Miami, Fl 1.000 49,635 n/a n/a 30Detroit, Mi 0.958 47,933 n/a n/a 31San Diego, Ca 0.907 47,760 1.273 37,518 32Washington, DC-Md-Va-WV 0.905 47,291 1.129 41,888 35Orlando, Fl 1.000 46,445 0.997 46,584 38Fort Walton Beach, Fl 1.000 46,018 1.003 45,880 40Kansas City, Mo-Ks 0.940 45,744 n/a n/a 43Cincinnati, Oh-Ky-In 0.945 45,734 0.961 47,590 44Rochester, NY 0.932 45,518 n/a n/a 45L.A.-Long Beach, Ca 0.907 44,579 1.236 36,082 46West Palm Beach-Boca Raton, Fl 1.000 44,441 1.042 42,650 47St. Louis, Mo-Il 0.940 43,987 0.967 45,488 48Denver, Co 1.000 43,822 1.071 40,917 49San Juan-Bayamon, PR 1.000 43,713 n/a n/a 51Houston, Tx 1.000 43,534 0.929 46,886 53Atlanta, Ga 0.940 43,102 0.991 43,494 55Raleigh-Durham-Chapel Hill, NC 0.930 42,161 1.069 39,458 56Tampa Bay, Fl 1.000 41,697 0.995 41,928 60Daytona Beach, Fl 1.000 40,858 n/a n/a 63Naples, Fl 1.000 40,287 n/a n/a 64Dallas, Tx 1.000 40,158 1.021 39,332 65Nassau-Suffolk, NY 0.932 40,050 1.400 28,607 66Fort Pierce-Port St. Lucie, Fl 1.000 39,663 n/a n/a 70Lakeland-Winter Haven, Fl 1.000 38,623 n/a n/a 73Pittsburgh, Pa 0.972 38,032 1.030 36,924 74Gainesville, Fl 1.000 37,610 n/a n/a 75Cleveland-Lorain-Elyria, Oh 0.945 35,842 n/a n/a 82Sarasota-Bradenton, Fl 1.000 35,840 1.051 34,101 83
Further, average salary statistics only consider cash salary and not other compensation (e.g., stock and fringe beneftis).

nnovationINSIGHTi Florida’s Medical Technology Clusters 16 nnovation
INSIGHTi17 Florida’s Medical Technology Clusters
Targeted Regional Comparisons by Average Company Size
ES202 data can also provide information on average company size, which may reflect somewhat on the maturity of the cluster (more mature clusters may be expected to have larger companies, as its companies have had time to mature). The following chart and table present average company sizes, in terms of average number of employees per medical technology company. Puerto Rico ranks highest with over 200 employees per company in 2001; since it is not a large cluster (#22 in terms of companies), we can expect its cluster to be dominated by a few, probably international, companies. Jacksonville leads Florida with 169 employees per company. All Florida MSAs trail the national company size, with Miami and Tampa having 96 and 83 employees per company, respectively). The entrepreneurial nature of Gainesville’s and Orlando’s medical technology economies is well represented by their average company size statistics (32 employees per company; see table on next page). St. Louis only has 36 employees per company in 2001; most of the new hires discussed in previous sections are probably distributed among multiple companies.
Average Employees per Company0 20 40 60 80 100 120 140 160 180
MSA
Washington, DC-Md-Va-WVBaltimore, MdGainesville, Fl
Orlando, FlSt. Louis, Mo-Il
L.A.-Long Beach, CaRaleigh-Durham-Chapel Hill, NC
Dallas, TxDenver, CoAtlanta, Ga
New Haven-Bridgeport, CTChicago, Il
Philadelphia, Pa-NJTampa Bay, Fl
Mnpls.-St. Paul, Mn-WiMiami, Fl
San Jose, CaJacksonville, Fl 169.0
96.8
95.9
85.8
82.9
77.3
76.3
68.8
57.4
54.1
52.8
47.0
42.5
36.4
32.3
31.9
24.6
21.1
2001 Average Company SizeMedical Technology Clusters
Blue box: Average medical technology company size, entire U.S. (57.9 workers)

nnovationINSIGHTi Florida’s Medical Technology Clusters 16 nnovation
INSIGHTi17 Florida’s Medical Technology Clusters
2001 Medical Technology Company SizeStatistics by MSA
Targeted Regional Comparisons by Patent Activity and Productivity
Another critical indicator of an industry cluster’s strength is its use of innovation, research and development to increase its productivity and develop new products and markets, and one measure of innovation is the number of patent awards by region and specialty. Utility patent awards in medical technology categories (see Appendix II),
per million employees (all sectors), by U.S. MSA for 2001 are indicated in the following figure (next page).
Some factors should be considered when evaluating patent innovation. Specialized clusters with rela-tively small economies may stand out according to this statistic. Many patents are assigned to another company or institution which may be in another geo-graphic region as part of the award process. Further, the measure used in this report does not distinguish between private-sector and public-sector inventions (MSAs with federal laboratories or research agencies may have higher productivity rankings than MSAs with similar employment and establishment counts).
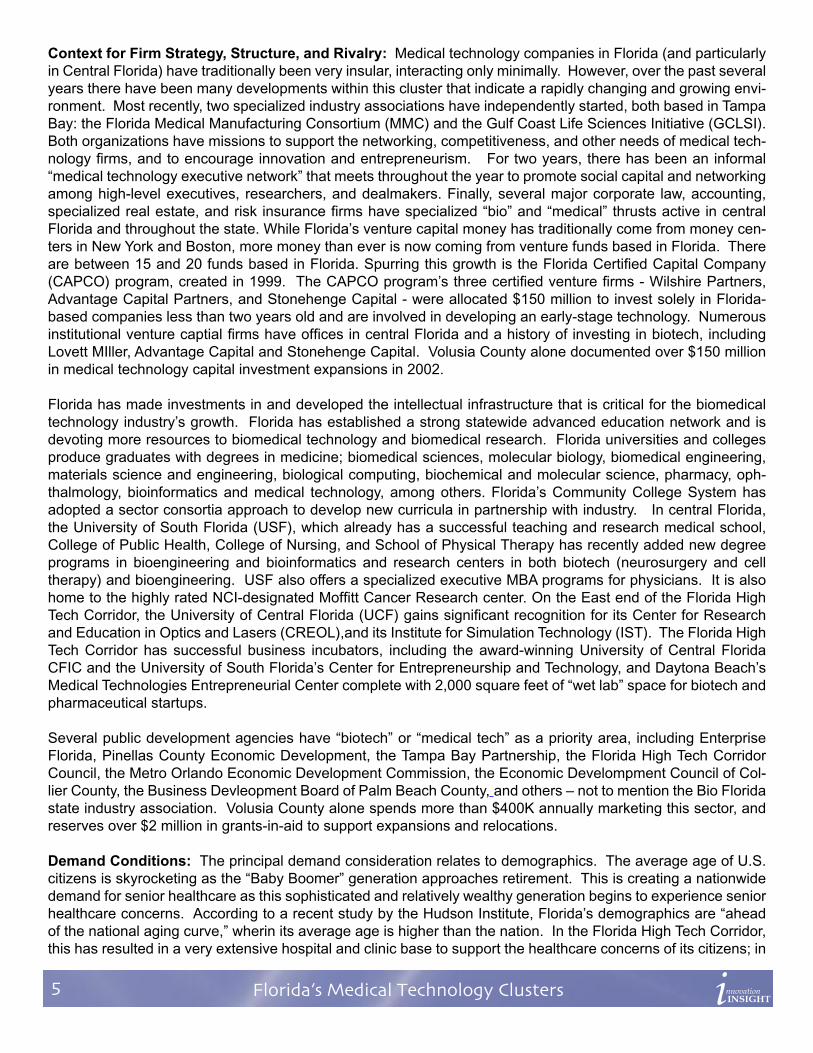
In 2001, the Philadelphia PA MSA is the leader in terms of “patent productivity”, with 38.6 medical tech-nology patents per million workers. The Gainesville, Florida MSA ranks #30 with an average of almost 91 medical technology patents per million workers (although Gainesville has fewer patents than Atlanta and has few medical technology companies, it has a disproportionately high patent production relative to its size). Baltimore, Maryland ranks #13 with over 23 patents per million workers, which is approximately four times the medical technology patent productivity of Tampa Bay (ranked #32) or Miami (ranked #33), although it ranks considerably lower in terms of overall employment (previous section). Of the Florida MSAs, only the Orlando, Jacksonville and Gainesville MSAs produce more than the national average. MSAs were ranked in this table by number of patents. The poor showing of the Boston MA and Newport CT regions regarding patent production is probably an artifact of inventor residence patterns or other geographic as-signment discrepancies.
MSA SizeSan Juan-Bayamon, PR 203.4Newark, NJ 198.7Jacksonville, Fl 169.0Daytona Beach, Fl 120.0San Jose, Ca 96.8Miami, Fl 95.9Mnpls.-St. Paul, Mn-Wi 85.8Tampa Bay, Fl 82.9Philadelphia, Pa-NJ 77.3Chicago, Il 76.3Boston-Brockton-Nashua, Ma-NH 74.7West Palm Beach-Boca Raton, Fl 72.3New Haven-Bridgeport, CT 68.8Panama City, Fl 67.2Fort Myers-Cape Coral, Fl 66.5Orange County, Ca 60.7San Francisco, Ca 60.5Bergen-Passaic, NJ 59.6New York-Newark, NY-NJ-Pa 59.4Nassau-Suffolk, NY 58.6Atlanta, Ga 57.4Huntsville, Al 57.3Cleveland-Lorain-Elyria, Oh 54.1Rochester, NY 54.1Denver, Co 54.1Cincinnati, Oh-Ky-In 53.7Dallas, Tx 52.8Raleigh-Durham-Chapel Hill, NC 47.0San Diego, Ca 47.0Kansas City, Mo-Ks 44.1L.A.-Long Beach, Ca 42.5Sarasota-Bradenton, Fl 40.2Middlesex, NJ 39.8Houston, Tx 39.7Oakland, Ca 39.5Pittsburgh, Pa 37.9St. Louis, Mo-Il 36.4Ocala, Fl 36.1Orlando, Fl 32.3Gainesville, Fl 31.9Lakeland-Winter Haven, Fl 31.1Detroit, Mi 30.2Melbourne-Titusville-Palm Bay, Fl 29.7Pensacola, Fl 28.7Naples, Fl 25.4Baltimore, Md 24.6Washington, DC-Md-Va-WV 21.1Fort Lauderdale, Fl 20.9Fort Pierce-Port St. Lucie, Fl 16.8Fort Walton Beach, Fl 8.0Punta Gorda, Fl 6.0Tallahassee, Fl 4.7
nnovationINSIGHTi Florida’s Medical Technology Clusters 18 nnovation
INSIGHTi19 Florida’s Medical Technology Clusters
2001 Utility Patents Per Million Workers (All Sectors)0 10 20 30 40 50 60 70 80 90 100
MSA
Kansas City, Mo-Ks
Atlanta, Ga
Dallas, Tx
Miami, Fl
Huntsville, Al
Tampa Bay, Fl
L.A.-Long Beach, Ca
St. Louis, Mo-Il
Mnpls.-St. Paul, Mn-Wi
Orlando, Fl
Denver, Co
Jacksonville, Fl
Chicago, Il
Baltimore, Md
Philadelphia, Pa-NJ
San Jose, Ca
Gainesville, Fl 90.88
48.94
38.63
23.01
10.04
7.98
7.45
7.00
6.67
6.51
6.20
5.30
5.03
4.28
4.27
4.06
1.77
2001 Patent Productivity
Medical Technology Clusters
Blue box: Average patent productivity per million workers (6.43)
2001 Medical Technology Patent Productivity Statistics by MSA��� ������������ ������� ����Philadelphia, Pa-NJ 38.63 476 1San Jose, Ca 48.94 420 2San Diego, Ca 41.54 395 3San Francisco, Ca 49.09 348 4Washington, DC-Md-Va-WV 16.10 270 5New York-Newark, NY-NJ-Pa 10.37 263 6Rochester, NY 99.34 259 7Chicago, Il 10.04 258 8Oakland, Ca 32.25 224 9L.A.-Long Beach, Ca 6.20 212 10Orange County, Ca 14.66 176 11Raleigh-Durham-Chapel Hill, NC 50.99 169 12Baltimore, Md 23.01 149 13Seattle-Bellevue-Everett, Wa 24.93 134 14Indianapolis, In 23.30 124 15Cincinnati, Oh-Ky-In 16.19 101 16Des Moines, Ia 85.16 100 17Houston, Tx 8.87 92 18Milwaukee-Waukesha, Wi 18.51 86 19Salt Lake City-Ogden, Ut 24.29 85 20Mnpls.-St. Paul, Mn-Wi 6.67 84 21Ann Arbor, Mi 69.41 79 22Madison, Wi 38.11 67 23Atlanta, Ga 4.06 64 24
��� ������������ ������� ����Ventura, Ca 32.16 63 25Nassau-Suffolk, NY 6.66 60 26St. Louis, Mo-Il 6.51 60 26Boulder-Longmont, Co 44.14 58 27Denver, Co 7.45 56 28Dallas, Tx 4.27 51 29Austin-San Marcos, Tx 19.68 51 29Gainesville, Fl 90.88 46 30Fort Worth-Arlington, Tx 14.01 46 30Pittsburgh, Pa 5.96 43 31Phoenix-Mesa, Az 5.38 43 31Tampa Bay, Fl 5.30 36 32Miami, Fl 4.28 34 33Detroit, Mi 2.80 33 34Albany-Schenectady-Troy, NY 14.08 32 35Portland-Vancouver, Or-Wa 6.80 32 35Orlando, Fl 7.00 30 36Nashville, Tn 7.21 28 37Columbus, Oh 5.77 28 37Tucson, Az 12.30 27 38Cleveland-Lorain-Elyria, Oh 3.57 26 39Jacksonville, Fl 7.98 24 40New Orleans, La 6.57 24 40Riverside-San Bernardino, Ca 3.54 24 40

nnovationINSIGHTi Florida’s Medical Technology Clusters 18 nnovation
INSIGHTi19 Florida’s Medical Technology Clusters
Combined Rankings
It should be apparent that some MSAs are relatively strong on some characteristics, and relatively weaker in oth-ers. As a result, an attempt was made to generate a balanced ranking of medical clusters by MSA that combines several of the characteristics reviewed in this chapter. The formula for the combined ranking follows:
This formula was primarily weighted toward size of the cluster by number of employees, but was sensitive to specialization in terms of number of companies, patent awards, and wages. The resulting combined ranking system should only be used as a rough rule-of-thumb comparison. Raw order rankings do not tend to be sensi-tive to scale (e.g., #1 may be 10 times bigger than #2, and so on). Combined rankings using other formula may result in different orderings.
The following table (next page) presents the combined ranking results. By breaking the ranks into tiers (ranks 1-20 as Tier 1, 21-40 as Tier 2, etc.), only two Florida medical technology clusters earn a Tier 1 position – Jackson-ville (rank #19) and Tampa Bay (rank #20). Philadelphia ranks first overall, with numerous southern California MSAs populating the first Tier. Chicago, Illinois ranks #5. Jacksonville’s strong ranking is worth note, however, it is highly dependent upon a small number of major employers without which its combined rank would drop well below #50.
Near the top of Tier 2, the Gainesville Florida MSA ranks #22 nationally almost entirely on the merit of its patent activity and establishment specialization in that MSA’s small economy. Orlando (rank #36) and Miami (rank #38) also are also positioned as Tier 2 clusters. No other Florida MSA lists within the top 3 tiers or the top 50 ranks.
Combined Rank=Cluster Medical Technology Employment x Cluster Establishment LQ x
Cluster Salary LQ x Cluster Patent LQ
Florida High Tech Corridor and Combined Regions
As noted previously, true industry clusters don’t always correlate to metropolitan statistical areas (MSAs) or any other arbitrary geographic boundary. As a result, it may be useful to combine (or even take apart) MSAs to provide a more intuitive comparison to other regions and the nation as a whole. This section provides tar-geted ES202 comparisons for multi-MSA regional definitions more commonly used in central Florida. These regions are defined as Greater Tampa Bay (Tampa-St. Petersburg-Clearwater MSA, Sarasota-Bradenton MSA, Lakeland-Winterhaven MSA), Metro Orlando / Space Coast / Volusia (Orlando MSA, Melbourne-Titusville MSA, Volusia-Flagler / Daytona Beach MSA), and the Florida High Tech Corridor (Greater Tampa Bay region plus the Metro Orlando / Space Coast / Volusia region). Combining MSAs does not result in a straightforward increase in ranking or statistics, as often the inclusion of less populous MSAs can reduce average salaries and other specialization statistics.

nnovationINSIGHTi Florida’s Medical Technology Clusters 20 nnovation
INSIGHTi21 Florida’s Medical Technology Clusters
Combined Rankings for Medical Technology Clusters
MSA Employment Estab LQ Salary LQ Patent LQ Combined RankPhiladelphia, Pa-NJ 33562 2.81 1.07 6.01 1San Jose, Ca 24966 2.77 0.86 7.61 2San Diego, Ca 13334 1.93 0.90 6.46 3Orange County, Ca 24095 2.54 0.89 2.28 4Chicago, Il 37179 1.81 1.00 1.56 5Boulder-Longmont, Co 2986 3.39 0.80 6.86 6Mnpls.-St. Paul, Mn-Wi 27458 2.12 0.91 1.04 7Boston-Brockton-Nashua, Ma-NH 25611 1.56 1.03 1.00 8San Juan-Bayamon, PR 16880 1.62 1.39 1.00 9Newark, NJ 21654 1.36 1.19 1.00 10State College, Pa 925 4.13 1.20 6.58 11Fort Worth-Arlington, Tx 5002 2.00 1.34 2.18 12Madison, Wi 2340 1.93 1.02 5.93 13Rochester, NY 1570 0.83 1.11 15.45 14Oakland, Ca 4697 0.93 0.99 5.01 15L.A.-Long Beach, Ca 23379 0.89 0.79 0.96 16San Francisco, Ca 3869 0.49 0.89 7.63 17Ventura, Ca 1409 1.66 0.92 5.00 18Jacksonville, Fl 6084 1.06 1.23 1.24 19Tampa Bay, Fl 9590 1.33 0.89 0.83 20Milwaukee-Waukesha, Wi 3371 1.25 0.77 2.88 21Gainesville, Fl 399 1.52 1.04 14.13 22Indianapolis, In 3689 0.63 0.95 3.62 23Bergen-Passaic, NJ 5898 1.25 1.00 1.00 24Seattle-Bellevue-Everett, Wa 2229 0.50 1.62 3.88 25Baltimore, Md 1894 1.04 0.98 3.58 26Cleveland-Lorain-Elyria, Oh 8933 1.88 0.71 0.55 27Nassau-Suffolk, NY 9020 0.87 0.74 1.04 28Austin-San Marcos, Tx 2377 0.88 0.89 3.06 29New Haven-Bridgeport-CT 6471 0.98 0.88 1.00 30Mayaguez, PR 2630 1.95 1.03 1.00 31Portland-Vancouver, Or-Wa 4174 1.59 0.74 1.06 32Providence-Warwick, RI 1948 2.60 1.01 1.00 33Santa Barbara-Santa Maria, Ca 1669 1.62 1.24 1.32 34New York-Newark, NY-NJ-Pa 9211 0.40 0.73 1.61 35Orlando, Fl 2762 1.41 1.00 1.09 36Ann Arbor, Mi 403 0.89 1.03 10.80 37Miami, Fl 9186 0.67 0.95 0.67 38Des Moines, Ia 438 0.69 0.96 13.24 39Raleigh-Durham-Chapel Hill, NC 1128 0.50 0.84 7.93 40Cincinnati, Oh-Ky-In 2418 0.65 0.92 2.52 41Akron, Oh 1499 1.70 0.82 1.57 42Dallas, Tx 7133 1.05 0.59 0.66 43Reading, Pa 1743 0.87 1.02 1.80 44Tulsa, Ok 1185 1.86 0.78 1.62 45St. Louis, Mo-Il 3423 0.90 0.88 1.01 46Atlanta, Ga 7697 0.68 0.72 0.63 47Detroit, Mi 5342 1.27 0.75 0.44 48Columbus, Oh 2967 0.75 1.08 0.90 49Houston, Tx 3175 0.76 0.61 1.38 50
TIE
R 1
TIE
R 2
TIE
R 3

nnovationINSIGHTi Florida’s Medical Technology Clusters 20 nnovation
INSIGHTi21 Florida’s Medical Technology Clusters
The following table presents wage and employment statistics for the combined central Florida regions. Most notably, the Florida High Tech Corridor (FHTC) region ranks a relative #8 in the nation for number of establish-ments, while demonstrating positive growth and a high level of medical technology specialization (a location quotient of 1.3)
The next table presents aggregated employment data for the combined MSAs. The employment data also dem-onstrate a high overall ranking for the FHTC and the greater Tampa Bay region (ranked #10 and #11 nationally in terms of medical technology employment). The FHTC and the Tampa Bay region both show specialization in medical technology employment as well (location quotients of 1.3 and 1.4 respectively).
The third table in this section (following page) presents patent and patent productivity statistics for the combined regions. Overall productivity levels (number of medical technology patents produced in 2001 per 1,000,000 workers) are relatively significant (national ranking in this category is based upon overall number of patent awards). In general, the patent statistics lag behind relative rankings in establishments and employment for the respective regions.
As with the MSA by MSA comparisons, the combined ranking formula was applied to the combined central Florida regions. Since regional medical technology employment levels are a consideration in the combined rank-ing, all three combined regions show very significant national rankings. The Florida High Tech Corridor ranks #16 in the nation overall. The greater Tampa Bay region ranks #19 in the nation, and the Orlando / Space Coast / Volusia region weighs in at #23. In light of the fact that the combined rankings are notably lower than these regions’ employment and establishment rankings, this indicates that their combined ranks have been reduced due to low relative salary and/or patent specializations. Efforts to increase productivity and innovation in central Florida may have a significant overall effect for improving the profile of these regions.
���� ��� � ������ ���� ������ ���������������������������� ��� ������ �� ����
Florida High Tech Corridor 280.75 0.49 1.27 8Greater Tampa Bay 161.25 -3.73 1.23 11Orlando / Space Coast / Volusia 119.5 5.98 1.33 15
���� ��� � ������ ���� ������ �������������������� ��� ������ �� ����
Florida High Tech Corridor 16,403 2.10 1.26 10Greater Tampa Bay 11,254 -0.48 1.39 11Orlando / Space Coast / Volusia 5,149 8.08 1.04 23
���� ���� ������ ���� ������ ��������� ������� ������������ �� ����
Florida High Tech Corridor 94 5.9 0.9 15Greater Tampa Bay 50 5.1 0.8 21Orlando / Space Coast / Volusia 44 7.3 1.2 22
�������� ����Florida High Tech Corridor 16Greater Tampa Bay 19Orlando / Space Coast / Volusia 23

nnovationINSIGHTi Florida’s Medical Technology Clusters 22 nnovation
INSIGHTi23 Florida’s Medical Technology Clusters
Strategic Workforce Recruitment Targets for Orlando
��� ��� �������� ������ ������ � ��� �������� ������ � ������ ����������Orlando, Fl 46,445 46,584 25.4 2,762Phoenix-Mesa, Az 42,103 38,241 -5.5 1,108Dayton-Springfield, Oh 42,152 44,185 -2.0 1,482Atlanta, Ga 43,102 43,494 3.6 7,697Houston, Tx 43,534 46,886 -46.1 3,175Grand Rapids-Muskegon, Mi 43,641 41,016 -41.7 4,033San Juan-Bayamon, PR 43,713 n/a -3.5 16,880Denver, Co 43,822 40,917 -17.2 3,573L.A.-Long Beach, Ca 44,579 36,082 2.4 23,379Rochester, NY 45,518 n/a -12.0 1,570Cincinnati, Oh-Ky-In 45,734 47,590 1.2 2,418Kansas City, Mo-Ks 45,744 n/a 2.2 3,306Charlotte-Gastonia-Rock Hill, NC-SC 45,957 46,351 -27.2 1,388
Combined Strategic Comparisons
The data presented in this chapter are very relevant for targeted development and outreach activities, particularly concerning the attraction of qualified and specilialized labor and the fostering of productive technology partner-ships. Regarding workforce activities, strategic analysis would ideally identify regions with a critical mass of medical technology cluster employees, but that had an adjusted average salary well below that of Florida clus-ters. Such regions are at a competitive disadvantage with Florida MSAs for the attraction of talent, particularly if those regions are also declining in overall medical technology employment (e.g., demonstrate a net loss / layoff of cluster jobs during the study period). In other words, Florida strengths should be matched against the selected weaknesses of other MSAs. Of course, workforce attraction activities should not be performed if the Florida region is itself losing medical technology jobs (such as Gainesville, Miami, Sarasota and Melbourne-Titusville-Palm Bay during this study period).
As shown in the following figure, strategic workforce targets for Orlando may include Grand Rapids Michigan area (lower average salary, large workforce, signifcant layoffs), Denver Colorado (slightly lower average sal-ary and layoffs, large workforce), Los Angeles California (lower average salary, slight growth, large workforce), Rochester New York (slightly lower average salary, slight growth, large workforce), and Houston Texas (lower average salary, significant layoffs).
Since the Tampa Bay MSA has a lower average medical technology salary than the Orlando MSA, strategic tar-gets for Tampa Bay also apply to Orlando. Reasonable workforce recruitment targets for the Tampa Bay MSA are limited to New York (significantly lower average salary, slight growth, large workforce), San Diego (Large workforce, lower adjusted average salary), Pittsburgh, PA (lower average salary, large layoffs, large workforce), Tulsa, OK and Riverside-San Bernardino, CA regions (lower average salary and very significant layoffs). Puerto Rico may also be an intriguing target due to large workforce and severe layoffs. Overall, New York / New Jersey, southern California, Ohio and Oklahoma appear to be consistently good recruitment targets for Florida clusters. Since the “raw” salaries (not adjusted for cost of living or income tax) for some of these regions are very high, however, recruitment efforts may have to overcome a large perceptual disparity despite the increased spending power of Tampa Bay and Orlando versus these regions.
Generally, it is preferable to “grow your own” local companies than to recruit companies to relocate from outside of a region. However, a few medical technology clusters demonstrated significant company attrition during the study period. These areas may be good candidates for recruiting entrepreneurs or vendors for relocation or ex-

nnovationINSIGHTi Florida’s Medical Technology Clusters 22 nnovation
INSIGHTi23 Florida’s Medical Technology Clusters
Strategic Workforce Recruitment Targets for Tampa Bay
��� �� � ������ ��� ������Boston-Brockton-Nashua, Ma-NH 1.46 -65.7 343Oakland, Ca 0.87 -17.3 119San Jose, Ca 2.59 -10.1 258L.A.-Long Beach, Ca 0.83 -9.5 550Orange County, Ca 2.38 -8.2 397San Diego, Ca 1.81 -4.2 284
Strategic Corporate Recruitment Targets
��� ��� �������� ������ ������ � ��� �������� ������ � ������ ����������Tampa Bay, Fl 41,697 41,928 1.7 9,590New York-Newark, NY-NJ-Pa 65,528 27,861 8.8 9,211San Diego, Ca 47,760 37,518 0.0 13,334Ventura, Ca 40,964 n/a 4.0 1,409Milwaukee-Waukesha, Wi 39,883 n/a -7.2 3,371Buffalo-Niagara Falls, NY 38,802 37,418 15.2 1,404Pittsburgh, Pa 38,032 36,924 -26.8 2,803Fort Wayne, In 37,584 n/a -17.2 3,189Tulsa, Ok 37,166 40,223 -67.2 1,185Nashville, Tn 36,064 39,087 15.2 1,037Akron, Oh 33,001 32,149 -3.4 1,499Provo-Orem, Ut 32,695 33,126 6.0 1,636Riverside-San Bernardino, Ca 31,533 28,417 -73.6 1,777Louisville, Ky-In 27,811 28,495 1.8 1,013Mayaguez, PR 23,981 n/a -48.4 2,630
Strategic Technology Partnership Targets for Florida Medical Technology Clusters
Targeted technology outreach activities may necessarily be based less on strategic advantages of Florida clus-ters, but should identify U.S. medical technologies with the highest innovation productivity. Of course, all Florida clusters would be best served to partner first with leading Florida MSAs such as Gainesville and/or leverage its innovation to link to other regions, as Gainesville has some of the highest per-worker medical technology patent production in the nation.
��� ������ ������������ ������� ��� ������Gainesville, Fl 90.88 46 50Raleigh-Durham-Chapel Hill, NC 50.99 169 55San Francisco, Ca 49.09 348 64Boulder-Longmont, Co 44.14 58 74Oakland, Ca 32.25 224 119Ventura, Ca 32.16 63 56Seattle-Bellevue-Everett, Wa 24.93 134 64Baltimore, Md 23.01 149 77Milwaukee-Waukesha, Wi 18.51 86 67Washington, DC-Md-Va-WV 16.10 270 55Fort Worth-Arlington, Tx 14.01 46 79New York-Newark, NY-NJ-Pa 10.37 263 155
pansion into Florida, on the premise that if presented a viable alternative to remaining in a declining cluster, they may opt to contribute to Florida’s clusters instead. The most significant medical technology company attrition in 1999-2000 occurred in the Boston region and southern California regions.

nnovationINSIGHTi Florida’s Medical Technology Clusters 24 nnovation
INSIGHTi25 Florida’s Medical Technology Clusters
Targeted Analysis Summary Observations
Nationally, the wage and employment data show a slight consolidation during the study period - a slight decrease in number of establishments, but very little change in overall employment. The ES202 data and patent analysis generates a few consistent observations about Florida’s medical technology clusters. First, at least three Florida regions are competitive on a national scale: Tampa Bay, Miami, and Jacksonville. In general, these regions may be considered borderline “Tier 1” U.S. medical technology clusters (within the top 20 regions compared against multiple factors). Orlando and Gainesville also have high scorings in particular areas that are worth note, but may not yet have a ‘critical mass’ for true cluster specialization. Jacksonville has a suprisingly strong presence in 2001, however it is highly dependent upon a small number of major employers; without which, its rank drops in almost every category beyond consideration as a significant cluster.
In general, Florida medical technology clusters lag well behind the nation in terms of innovation and average salary, even after adjustment for cost-of-living and income tax. Many of the top medical technology clusters benefit from the presence of government research institutions, very high standards of living, high salaries and specialized workforce, and proximity of multiple nationally recognized research universities specializing in the life sciences. One possible result may be that Florida medical technology companies are statistically oriented less toward research and development, and more toward assembly and other operations requiring relatively few Ph.D.s and specialized professionals per company (this would need to be validated by occupational analysis).
Like many of the smaller, adolescent U.S. medical technology clusters, Florida’s medical technology clusters have considerable potential for growth, especially in light of the fact that the very top clusters in the nation (south-ern California, the Boston region, and New Jersey) have suffered significant employment and company attrition from 1999 -2000. Proper positioning and commitment of resources can help claim much of the market repre-sented by these regions. It will be important to monitor fast growing medical technology clusters such as the Research Triangle (Raleigh-Durham-Chapel Hill, NC), the Newhaven CT MSA, and the Washington DC area.
Because southern California and a few other MSAs may be top medical technology clusters in terms of both size and innovation, Florida partnership activities might get “lost in the crowd” in these large, “Tier 1” clusters. As an alternative, the following table lists some of the most innovative “small to mid-size” MSAs in the U.S. in terms of medical technology patents and patent productivity. Technology outreach activities might be more effective as targeted against these smaller clusters, which are more comparable in size, visibility and influence to leading Florida MSAs such as the Baltimore,Boulder, and Seattle regions.

nnovationINSIGHTi Florida’s Medical Technology Clusters 24 nnovation
INSIGHTi25 Florida’s Medical Technology Clusters
V. Cluster Supply Chain Mapping and Opportunity Analysis
The previous section was essentially an inter-regional comparison. This chapter will largely focus on an intra-regional comparison of the medical technology cluster within the Florida High Tech Corridor region.
Supply Chain Mapping
Underlying data for this chapter were obtained from the Florida 2000 ES202 unedited unemployment and wage records (see previous chapter, the U.S. Bureau of Labor Services 2000 public employment and wage data by MSA, and the U.S. Department of Commerce 1997 industry input-output data.
Having defined the 4-digit SICs that make up the medical technology cluster, the supply chain map presented on the next page represents all SICs that buy from, or sell to medical technology SICs, with the following con-siderations:
• Only the top 99% of transactions were considered, to filter out relatively inconsequential vendor-client activity on the national level
• Transportation, personal and professional services, agriculture and mining, and selected other SICs that are common vendors to all industry categories were not selected. Analysis of only “residual” SICs is a common practice in cluster analysis, and emphasizes primary, core cluster activity.
• Evaluated SICs include both consumables and production capital purchases - in other words, all sales activity between SICs.
Although supply chains are often portrayed as linear, the vendor-customer relations within the medical tech-nology industry are multidirectional and complex. The supply chain map on the following page is a graphical representation of those relations on the national level, with ovals representing industry codes, and arrows repre-senting significant flow of goods between the ovals they connect. The ovals are colored roughly according to the industry subcluster to which they belong, with pink indicating device and instrument manufacturing subcluster, green presenting the pharmaceuticals subcluster, and blue representing the biotech subcluster. White ovals are multisector (e.g., serving multiple subclusters). “Structurally equivalent” SICs – that is, SICs that buy and sell to exactly the same other groups – are aggregated into single ovals. The graph has been arranged using a variant of the Kamada-Kawai force directed algorithm, which attempts to “disentangle” linkages and place ovals that are connected near one another. A listing of SIC category descriptions is available in this chapter.
Graphical supply chain maps such as this can be useful for quickly identifying what type of company is likely to buy or sell to companies within the local medical technology cluster. For example, if you know the SIC of a medi-cal technology company, you can use the map to idenity SICs of companies that would make likely vendors or clients, which could be matched against industry databases to provide business leads or vendor opportunities.

nnovationINSIGHTi Florida’s Medical Technology Clusters 26 nnovation
INSIGHTi27 Florida’s Medical Technology Clusters
Pro
du
ct “
Su
pp
ly C
hai
n”
for
the
Nat
ion
al M
edic
al T
ech
no
log
y In
du
stry

nnovationINSIGHTi Florida’s Medical Technology Clusters 26 nnovation
INSIGHTi27 Florida’s Medical Technology Clusters
Opportunity Analysis
The supply chain map also represents an abstract “ideal” structure of U.S. medical technology clusters. On the national scale, the level of sales between medical technology SICs requires certain capacity and employment in each SIC category. By comparing the relative size of each of these SIC categories at the local level, we can see if there is sufficient industrial presence to support a proportional level of sales among all medical technology categories. In other words, if a SIC category is under-represented compared to the national industry, that SIC may represent local undercapacity and lost wealth as that product is imported from elsewhere.
The table on the next page maps the total purchases from medical technology SICs at the national level, their relative representation at the local level, and the combined estimated purchases from that SIC by local medical technology companies. In this table, “local” is categorized as “West Florida High Tech Corridor MSAs” (Tampa - St. Petersburg - Clearwater, Sarasota - Bradenton, Lakeland - Winter Haven) and “East Florida High Tech Cor-ridor MSAs” (Orlando Metro, Melbourne - Titusville). The table is sorted by SIC in order of decreasing national sales to medical technology companies.
The “location quotient” measures the size of each SIC’s employment relative to the entire cluster, compared to that SIC’s proportion at the national level. In simpler words a location quotient of 1 indicates the local cluster has the same proportion of companies in that SIC as the national medical technology industry; anything less represents undercapacity relative to local medical technology production needs, and anything more represents overcapacity. Overcapacity is not necessarily bad, as “overcapacity” SICs may be supporting other industry clusters as well.
The estimated potential sales describes the amount of sales to that SIC by local medical technology compa-nies. This estimation is based upon several key assumptions: (1) sales are proportional to employment (e.g., productivity and local cost-of-business factors are not considered), and (2) the 1997 industry input-output tables continue to be accurate. All figures are adjusted for inflation to 2002 US dollars.
Highlighted SIC categories were identified as reasonable targets for vendor development through recruitment or entrepreneurship activities. They have been selected on the premise that if that category is under-represented in either the East or West halves of the Florida High Tech Corridor (e.g., has a location quotient of .6 or less), and there is a significant amount of purchases by local companies from that SIC, that there is an untapped op-portunity to increase local production capacity and sales in that SIC. “Opportunity” categories do not consider other factors for desirability (e.g., wage and salary levels or other characteristics of desirable company types). By attracting or growing companies in these categories, theoretically the capacity of the local medical technology cluster will be increased, and its production costs will be decreased.
Estimated national sales represents the estimated sales volume to that SIC by all U.S. medical technology companies, combined. Estimated potential FHTC Vendor Sales by SIC represent potential sales to local medical technology companies, not how much is currently spent locally. It is assumed that all sales in excess of capacity are imported, with an additional percentage imported due to other considerations (contracts, specific product requirements, previous business relations, etc.).
Based upon insufficient local production capacity and significant estimated and potential local purchases, the following industry categories are expected to make the most successful development targets: 2821, 2833, 3479, 3053, 3081, 3825, and 8731.
Categories marked with an asterisk (*) are expected to be relevant to the Florida Sales Tax Rebate program, if applied to medical technologies. Combined Florida High Tech Corridor medical technology sales to these SICs is estimated to be $55.2 per year.

nnovationINSIGHTi Florida’s Medical Technology Clusters 28 nnovation
INSIGHTi29 Florida’s Medical Technology Clusters
Est
imat
ed F
lori
da
Hig
h T
ech
Co
rrid
or
Med
ical
Tec
hn
olo
gy
Clu
ster
Sal
es a
nd
Ven
do
r R
epre
sen
tati
on
by
Ind
ust
ry C
ateg
ori
es
������
���
������
��������
���������
������
��������
���������
���������
�������������
����������
���������
���������
������
��������
���������������
���������
���������
������
��������
���������������
��������������
8731
0.21
0.23
18,947.6
116.9
154.3CommercialPhysicalandBiologicalResearch
2833
0.13
0.20
14,659.4
21.0
50.2MedicinalChemicalsandBotanicalProducts
3061
0.00
3.79
8,234.4
0.0
1,462.1Molded,Extruded,andLathe-CutMechanical
3081
0.32
0.55
4,946.1
28.8
151.5UnsupportedPlasticsFilm
andSheet
*3823
0.14
0.68
4,286.3
4.5
12.2IndustrialInstrumentsforMeasurement
3672
0.36
2.58
4,122.2
39.6
964.5PrintedCircuitBoards
8721
0.33
1.56
2,441.0
16.0
37.2Accounting,Auditing,andBookkeeping
2822
0.63
1.72
2,024.5
4.5
591.0SyntheticRubber
3053
0.22
0.08
2,011.3
121.6
6.6Gaskets,Packing,andSealingDevices
3674
3.79
0.05
1,594.2
137.6
8.6SemiconductorsandRelatedDevices
2821
0.02
0.54
1,453.3
0.2
111.4PlasticsMaterialandSyntheticResins
3479
0.15
0.20
1,323.0
4.0
38.2Coating,Engraving,andAlliedServices,NEC
3572
0.69
0.00
1,260.9
20.4
0.0ComputerStorageDevices
*3825
0.35
0.33
1,143.1
14.4
8.0InstrumentsforMeasuringandTesting
3211
1.27
6.36
1,035.4
47.0
568.0FlatGlass
3842
0.50
2.51
845.8
8.1
236.1Orthopedic,Prosthetic,andSurgical
3469
0.11
0.71
825.3
2.8
49.7MetalStamping,NEC
2211
0.02
0.01
770.1
0.4
1.8BroadwovenFabricMills,Cotton
3444
0.60
0.62
584.7
13.5
7.0SheetMetalWork
*3625
0.39
0.93
519.3
2.8
12.0RelaysandIndustrialControls
2899
0.05
0.25
466.1
0.2
1.3ChemicalsandChemicalPreparations,NEC
3312
0.01
0.92
391.5
0.0
32.6SteelWorks,BlastFurnaces(IncludingCoke)
3451
0.32
0.86
366.4
1.1
19.9Screw
MachineProducts
2011
0.22
2.03
325.9
0.7
7.4MeatPackingPlants
3826
0.88
0.00
295.4
74.9
0.0LaboratoryAnalyticalInstruments
3624
1.39
0.00
279.9
10.6
0.0CarbonandGraphiteProducts
3221
0.00
49.78
278.4
0.0
155.4GlassContainers
3363
0.00
0.54
240.3
0.0
5.0Aluminum
Die-Castings
3357
0.01
0.37
177.3
0.1
14.1DrawingandInsulatingofNonferrousWire
3841
0.11
1.67
166.6
0.1
26.1SurgicalandMedicalInstruments
3299
0.54
0.25
163.1
0.0
8.7NonmetallicMineralProducts,NEC
3571
0.33
0.56
161.3
0.6
3.5ElectronicComputers
*3599
0.15
0.47
159.1
0.4
1.0IndustrialandCommercialMachinery
All
76,499.0
692.8
4,745.5

nnovationINSIGHTi Florida’s Medical Technology Clusters 28 nnovation
INSIGHTi29 Florida’s Medical Technology Clusters
VI. Strategic Survey Analysis
This section reviews the process and results of a survey of strategic technology, growth, and business consider-ations among Florida High Tech Corridor medical technology companies.
Methodology
Although the survey was intended to have a few components to serve as “assessments” and validation of the other research in this report, it was primarily intended to serve the strategic development needs of economic development organizations and actual medical technology companies. The design process was constructed to allow stakeholders to identify types of information that could be quickly implemented as new programs or initia-tives, or translated into feasible organizational objectives. In short, the goal of the survey process was not to create an “information piece,” but instead a direction-setting tool The research design process had the following steps:
1. Requested input from medical technology companies regarding the types of information that they would like to survey to address. this “informal survey” was accomplished via the communication sys-tem of the Medical Technology Executive Network.
2. Identification of common survey topics from recent studies (e.g., SWOT, needs assessment, work-force analysis, etc.).
3. Stakeholder planning group to brainstorm and select survey topics. This was an informal focus group of members from academia, economic development, industry associations, and private companies. Participants were provided information from the previous steps, and creatively generated, discussed and prioritized types of infomration that could be translated into action items and be relevant to the competitiveness of the cluster.
4. Formation of the survey instrument.
The survey was distributed multimodally to over 400 contacts in medical technology companies listed in the Florida.High.Tech 2002 directory. Based upon the mission area of the study sponsors, the 21-county Florida High Tech Corridor region was surveyed with the following steps:
1. Hardcopy was mailed with a cover letter bearing the signature and letterhead of Randy Berridge, President of the Florida High Tech Corridor Council, Inc. Recipients were encouraged to respond via Internet, or by fax or mail. Recipients were given approximately one month to respond.
2. A web-enabled version of the survey was activated to collect responses electronically. The web sur-vey reflected the Florida High Tech Corridor web site design and brand.
3. Non-respondents were contacted by fax, email, and telephone and encouraged to respond.
4. Fax and mail responses were entered manually into the web database.
5. Additional participatns were solicited via the Medical Technology executive Network.
41 completed unique surveys were eventually received, constituting an estimated 12-13% of the target indus-try.
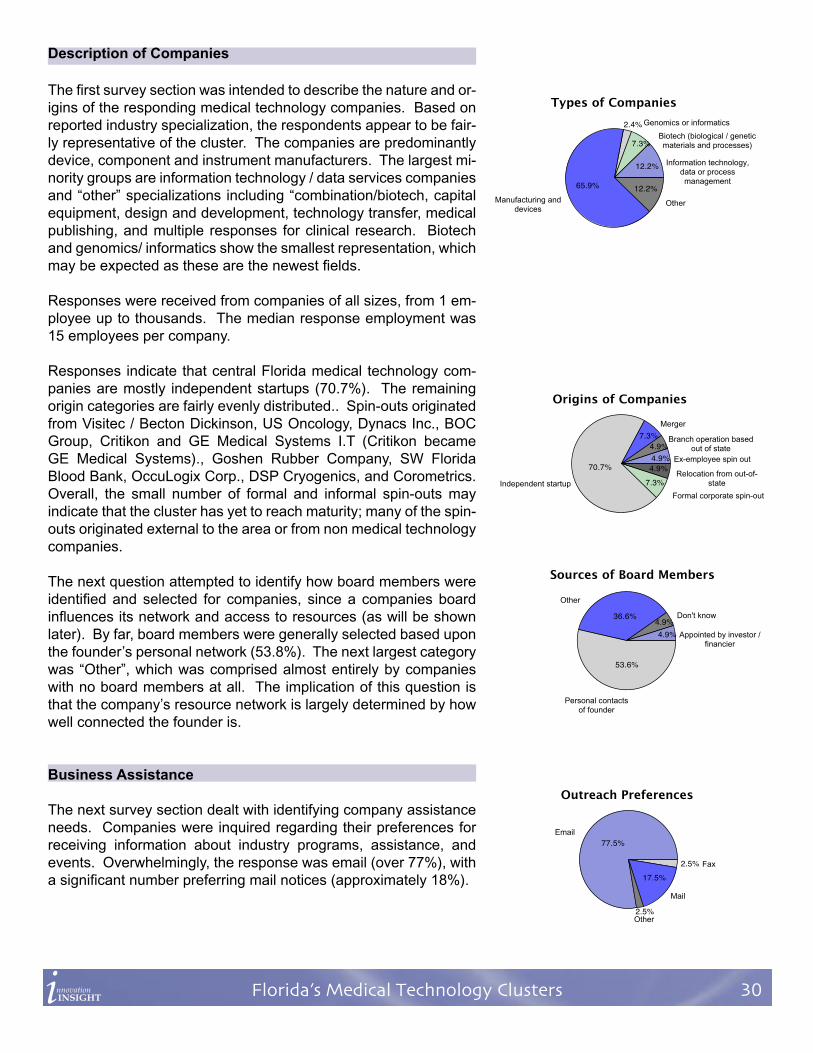
nnovationINSIGHTi Florida’s Medical Technology Clusters 30 nnovation
INSIGHTi31 Florida’s Medical Technology Clusters
Description of Companies
The first survey section was intended to describe the nature and or-igins of the responding medical technology companies. Based on reported industry specialization, the respondents appear to be fair-ly representative of the cluster. The companies are predominantly device, component and instrument manufacturers. The largest mi-nority groups are information technology / data services companies and “other” specializations including “combination/biotech, capital equipment, design and development, technology transfer, medical publishing, and multiple responses for clinical research. Biotech and genomics/ informatics show the smallest representation, which may be expected as these are the newest fields.
Responses were received from companies of all sizes, from 1 em-ployee up to thousands. The median response employment was 15 employees per company.
Responses indicate that central Florida medical technology com-panies are mostly independent startups (70.7%). The remaining origin categories are fairly evenly distributed.. Spin-outs originated from Visitec / Becton Dickinson, US Oncology, Dynacs Inc., BOC Group, Critikon and GE Medical Systems I.T (Critikon became GE Medical Systems)., Goshen Rubber Company, SW Florida Blood Bank, OccuLogix Corp., DSP Cryogenics, and Corometrics. Overall, the small number of formal and informal spin-outs may indicate that the cluster has yet to reach maturity; many of the spin-outs originated external to the area or from non medical technology companies.
The next question attempted to identify how board members were identified and selected for companies, since a companies board influences its network and access to resources (as will be shown later). By far, board members were generally selected based upon the founder’s personal network (53.8%). The next largest category was “Other”, which was comprised almost entirely by companies with no board members at all. The implication of this question is that the company’s resource network is largely determined by how well connected the founder is.
Business Assistance
The next survey section dealt with identifying company assistance needs. Companies were inquired regarding their preferences for receiving information about industry programs, assistance, and events. Overwhelmingly, the response was email (over 77%), with a significant number preferring mail notices (approximately 18%).
12.2%
7.3%
2.4%
65.9% 12.2%
Types of Companies
Information technology,data or processmanagement
OtherManufacturing anddevices
Biotech (biological / geneticmaterials and processes)
Genomics or informatics
4.9%4.9%
7.3%
70.7%
7.3%
4.9%
Origins of Companies
Branch operation basedout of state
Ex-employee spin out
Formal corporate spin-out
Independent startup
Merger
Relocation from out-of-state
4.9%4.9%
36.6%
53.6%
Sources of Board Members
Appointed by investor /financier
Don't know
Other
Personal contactsof founder
77.5%
2.5%
17.5%
2.5%
Outreach Preferences
Other
Fax

nnovationINSIGHTi Florida’s Medical Technology Clusters 30 nnovation
INSIGHTi31 Florida’s Medical Technology Clusters
Companies were then asked to indicate specific services or programs that public economic development orga-nizations should offer. Approximately 2/3 of all respondents provided suggestions. • The largest category of responses (about 38%) regarded financial assistance - outright grants, low cost
loans, tax incentives and rent reductions. • The second largest category (10%) regarded networking and interactivity - events for presentations, com-
pany networking events, industry contact lists, “best practice” and cost reduction method sharing, aware-ness seminars, partnership development assistance and other events that increase awareness among cluster companies.
• Workforce was another large category (10%), with companies asking for training programs, and employee identification / recruitment / centralized job sites.
• Other responses included assistance with compliance / FDA / ISO / CE marking, development of legitimate venture capital, vendor/distributor development, and programs geared toward small business / entrepre-neurship.
Finally, the survey measured company interest in incubator facilities specialized for medical technology. Exactly half of respondents indicated “yes”, even some rather large companies. “Depends” responses were explained by the timing/status of company when available, details / specifics of assistance offered (e.g., incentives, cost benefits, and type of specialization) and requirements of participating companies. At least one respondent indicated an incubator may be useful for customer development.
Technology
The next survey section investigated the cluster’s technology base, with the first question addressing intellectual property (IP) protection. IP protection is a critical measure of the uniqueness and strength of a company’s tech-nology; although it does not indicate a technology’s potential, it is an important indicator of how well a company can defend its market share and implies how oriented toward innovation it is. Almost 60% responded that they had patent protection of their technology; over 50% used confidentiality / disclosure agreements. Over 35% used copyright protection. However, nearly 20% of respondents had no legal protection at all. While this isn’t a particularly large percentage, it would be beneficial to help medical technology companies increase their access to proprietary technology and sources of innovation.
Intellectual property (all types) in the cluster is overwhelmingly created internally by companies - over 77%. Approximately 13% of companies have obtained their intellectual property from universities (anywhere), which demonstrates an area of opportunity. Exceptionally few companies have obtained their IP from government or other private sector sources (e.g., license / assignment from another company). “Other” opportunities were iden-tified from NASA (1), Florida Health and Human Services (1), company founders (1), suppliers (1), and multiple sources (1).
Responding companies held a median 3 patents per company, with a range from 0 to over 150 (Baxter).
27.5%22.5%
50.0%
Interest in Incubators
DependsNo
Yes
%0 10 20 30 40 50 60 70 80 90 100
Encryption
No legal protection
Copyright
Trade secret / disclosure agreements
Patents
Intellectual Property Protection
5.1%77.0%
5.1%
12.8%
Sources of Intellectual Property
Government Research
Internally Developed
Private Sector
University Research

nnovationINSIGHTi Florida’s Medical Technology Clusters 32 nnovation
INSIGHTi33 Florida’s Medical Technology Clusters
%0 10 20 30 40 50 60 70 80 90 100
Other Technologies
Instrumentation Advances
Genomics
Materials Sciences
Information technology
Manufacturing processes
Surgical and healthcare innovations
Most Important Technology Sectors
Aside from sector source, companies were queried as to the geographic origin of their technology / intellectual property. The majority of companies obtained their IP locally (roughly 60%). Nearly 1/3 of companies obtained their technology from domestic U.S. sources. Specific locations include non-local Florida (5), Minnesota (2), Cali-fornia (2), New Mexico, Texas, Tennessee, and Kentucky (1 each), and China, Japan, and Germany (1 each). 2 respondents listed multiple origins.
29.7%10.8%
59.5%
Origin of Intellectual Property
Domestic UnitedStates
International
Local
2.6%
23.1%
56.4%17.9%
Access to Intellectual Property
Academic / ProfessionalConferences
Other
Personal Networksof Executives
US Patents andTrademarks Office
As might be expected from the first survey section, most intellectual property opportunities are obtained from personal sources and networks (57%). Approximately 20% were obtained from external sources (government / academia, with two responses specifically indicating the University of South Florida). “Other” sources include internal searches / sources (5 responses), and industry sources / partners (2).
Unsuprisingly, medical technology companies are most inter-ested in new innovations regarding surgical and healthcare (over 75%). As expected from the large number of manufactur-ers participating in the survey, approximately 55% prioritized manufacturing / process improvement innovations. Information technology and materials advances are also of significant in-terest. Overall, respondents appear to be primarily interested in specialized innovations that improve healthcare delivery, or productivity enhancing innovations.
“Other” technologies were widely varied, and included Internet research, oncology, MEMS (microelectromechanical systems), photonics, sensors, biological sciences, metal tempering and pharmaceuticals development.
Participating companies were very diverse in the types of specific research they would like local universities to develop. Combined with industry matching efforts and existing funding programs, these topics represent spon-sored research opportunities:
Materials characterization and development Proof of Principle verification Materials sciences
Wear resistance of medical instruments Clinical evaluations / studies Plasma physics
Algorithm and sensor technologies Applied pharmacology Materials (plastics)
Cardiovascular research Intuitive EMR Polymeric materials
Microelectromechanical systems (2) Pharmacokinetics Animal testing
Information storage and transfer Lasers and cryogenics Proteomics
Incision closure research Interventional radiology Nanotechnology

nnovationINSIGHTi Florida’s Medical Technology Clusters 32 nnovation
INSIGHTi33 Florida’s Medical Technology Clusters
Currently, less than 23% of Florida High Tech Corirdor medical technology companies are conducting clinical trials (only 9 respondents indicated that they were). Although few provided details, ongoing trials included multiple Phase III trials, companies with multiple phases, accuracy studies, empirical studies, and clinical validation for market-ing purposes. Only two companies disclosed the trial subject matter.
Over 42% of respondents were interested in finding a partner to develop or license their technologies. The majority of companies have disseminated availability of their intellectual property through internal channels or networking. Only a few companies used external channels such as direct mail, brokerage via a corporate law firm, or direct sales channels.
Over 76% of respondents expressed interest in receiving technology assistance from local universities. The assistance areas specified included Business (marketing analysis help, business procedure development), Medical (biotech, cardiovascular, ), Biochemical (proteomics, microbiology and biochemistry), Engineering (mechanical and electrical, sensors, biomechanical), Materials (basic materials, silicon, metallurgy – several respondents), and Information Technology. There was also a need stated for a well-promoted single contact point for helping companies access applied faculty experise. Universities are obviously seen as a strong potential source of business and technology assistance.
Respondents recommended that partnership with several national research centers would improve the technology position of the cluster. These included the Cape Canav-eral Spaceport SERPL center, Pharmaceutical Research and Manufacturers of Ameri-ca (PhRMA), the Atlanta Cardiovascular Research Institute (ACRI), the Biotechnology Development Incubator at University of Florida, and Research Corporation Technolo-gies (Arizona).
Yes : 22.5%
No : 77.5%
Clinical Trials
Yes : 42.5%
No : 57.5%
Seeking IP Partners
Yes : 76.3%
No : 23.7%
Interested InTechnology Assistance
10.0%
10.0%17.5%
57.5%
5.0%
Types of Financing Used Angel Investment
Bank Loan
Other
Self-Financed(Bootstrap)
Venture /Institutional
Capital
Financing and Investment
The next brief section addressed historical access to financing and capital by medical technology. Overwhelm-ingly, companies financed their startup and early growth stages through self-financing and bootstrap methods (such as leveraging purchase orders and vendor terms). Only 10% utilized angel investment, and another 10% utilized formal bank loans. Approximately 5% received formal venture capital during their startup phase, and over 17% relied on other methods such as grants, SBA loans, equity placement with debt financing, or combina-tions of multiple finance sources. Two responding companies were 30+ years old and were unable to usefully respond to this question. Compare the results of this question with the first section, which revealed that most medical technology companies are entrepreneurial / independent startups.

nnovationINSIGHTi Florida’s Medical Technology Clusters 34 nnovation
INSIGHTi35 Florida’s Medical Technology Clusters
Startup / early stage funding sources were mostly identified via the knowledge and networks of executives, and by approaching banks (almost 28% each). Board members and venture capital offices were also significant sources of funding information. Other sources included combinations of information sources, and investment banks. Overall, external / institutional sources were listed as equal-ly important as the contacts and information channels possessed by company execs and board members. No respondents listed external sources such as accounting and law firms for financing information sources, although firms such as these have been cited as critical gatekeepers in other regions including Silicon Valley.
Only one medical technology company in ten had received federal, state, or other grants to develop their technology. All respondents that did received grants received federal Small Business Innovation Research (SBIR) grants, from the National Institutes of Health and the Department of Defense.
27.8%16.6%
11.2%
16.6%27.8%
Financing Information Sources
ApproachingBanksVenture Capital Offices
Other
Company BoardMembers
CompanyExecutives
10.3%
89.7%
Received Technology Grants
Yes
No
State Incentives
The next section was designed to determine the potential benefit and impact of proposed lobbying efforts to redefine the Florida Sales Tax Rebate program for qualified manufacturing equipment expenditures to include the medical technology industry. If so changed, this would allow cluster companies to have their sales tax ex-penditures on qualified equipment to be either reimbursed, or matched as investment in applied research and development programs at the University of South Florida or the University of Central Florida.
Responding companies indicated that they planned on spending over $22,900,000 in new equipment expendi-tures and over $10,400,000 in replacement equipment purchases within the next two years. This is an average of nearly $700,000 in new purchases and nearly $350,000 in replacement purchases per responding company (including companies that indicated $0 expenditures). These figures should be more than significant enough for lobbying purposes, even considering many of those purchases may not be qualified under the program and actual spending is likely to vary from estimates.
The next question was not intended to measure potential interest in a revised Sales Tax Program, but rather how such a program could change corporate spending behavior as an added incentive to economic growth. Nearly 4 in 10 respondents indicated that a revised Sales Tax Rebate pro-gram would affect their planning or purchasing behavior through either the purchase or more equipment, or the purchase of equipment sooner than current schedules. These survey responses have positive implications for economic benefits resulting from tax revisions.
Not a single responding company reported receiving any Florida business growth/relocation incentives in the past. Only one company reported receiving any Florida business relocation incentives, specifically, ad valorem tax assistance. Six companies suggestions regarding state incentive pro-grams (either in “wish list” form or programs currently used implemented other states) that would be more effec-tive for Florida’s medical technology companies more competitive than those currently available. Suggestions included locally developed business parks with inexpensive land for building new facilities, employee training funding, and specialized tax benefits. Respondents also indicated that North Carolina, Canada and Hawaii have desirable incentive programs, and that Georgia has outright financial grants for medical technology companies.
7.9%
7.9%13.2%
63.1%7.9%
Sales Tax Rebate Effects
Accelerate purchases12 months
Acceleratepurchases 6
months
Increased manufacturing purchases
No Effect
Other

nnovationINSIGHTi Florida’s Medical Technology Clusters 34 nnovation
INSIGHTi35 Florida’s Medical Technology Clusters
Import and Export
This section was designed to identify opportunities for cooperative trade mis-sions, vendor and customer partership opportunities, and program development to encourage export activities. First, companies were questioned whether they would be interested in receiving export assistance, to be provided free or at a nominal cost by public economic development and export organizations. Ex-actly 1/3 of responding companies indicated an interest in receiving export as-sistance; the remainder did not. Areas of desired assistance included targeted market outreach, assistance with the U.S. Department of Commerce, opportu-
33.3%
66.7%
Interest in Export AssistanceYes
No
41.0%
53.9%
5.1%
Principle Mode ofTransportation
Air
Ground
Other
Local State National International
%
0
10
20
30
40
50
60
Sources of Imports, Competition, and Exports
Florida High Tech Corridor Medical Technology Survey
LegendSource of Sales Source of Competition Source of Vendors
nity creation, documentation and credit information (on target markets / companies), assistance and guidance dealing with International Traffic in Arms Regulations (ITAR) export restrictions, and contracting assistance.
Respondents indicated several product markets that Florida should target for cooperative marketing or partner-ship activities. These included medical cutting instruments, handheld surgical devices, hospitals and consumer healthcare delivery, medical devices and capital equipment. Based on the responses, there is overlapping inter-est in the surgical instrument market and building better awareness and connections to healthcare institutions such as hospitals and clinics.
Companies were also asked to indicate geographic markets that would be most appropriate for cooperative activities. Responses were varied, including Latin America due to its proximity (spe-cifically Brazil and Argentina), Europe (specifically France and Germany), and the Far East (specifically China),
Companies indicated that their primary method for delivery products to their custom-ers was ground shipment (53.9%), followed by air (41%). “Other” responses included combinations of methods (e.g., ground and air), and UPS.
The next questions dealt specifically with the medical technology cluster “ecology” and supply chain; companies were asked to identify on what geographic scales were their vendors, customers, and sources of competition. The following chart shows that overwhelmingly Florida medical technology companies operate at the national (domestic U.S.) level, with little reliance, focus, or competition at the state, local or international level. This chart has additional significance, however. The low amount of inter-national sales indicates a significant opportunity for export growth, and the lack of local / state competition and vendors demonstrates oppor-tunity for local business development. While businesses may or may not appreciate close proximity of direct competitors, high competition at the local level implies diversity, specialization, and maturity of a mature industry cluster.
Most domestic exports were reported to Califor-nia and the Southwest, as well as to the North-east and throughout the United States. Most international exports were indicated to Canada,

nnovationINSIGHTi Florida’s Medical Technology Clusters 36 nnovation
INSIGHTi37 Florida’s Medical Technology Clusters
Europe and Asia; individual companies reported exports to central and South America as well as Sweden.
Domestic sources of competition were identified primarily from California and the Northeast. Sources of interna-tional competition were indicated from Asia (China), Europe, and Israel.
Domestic vendors were reported from all over the U.S., including Georgia, New Jersey, Illinois, and California. International vendors were reported from Germany and Asia (Japan and China).
Overall, the company responses captured in the previous chart show the Florida High Tech Corridor medical technology cluster to be strong and competitive at least at the national level. Opportunities exist for local vendor development and international export.
Finally, companies were asked to identify their most critical vendors, what they purchase from them, and the amount spent on those intermediate products annually. The 41 responding Florida High Tech Corridor compa-nies alone indicated that they spend nearly $115 million annually on their most critical components. Products that were indicated by more than one company include: resins ($3.1 million annually), silicone ($550,000), and circuit board ($1 million plus). One company reported over $100 million alone in annual purchases of sensors, pumps, software and other components. Although no consensus was obtained from survey results regarding specific shared vendor needs, the results imply good potential for cooperative purchasing opportunities among Florida High Tech Corridor medical technology companies
Market and Product Development
This brief section contained questions that were identified as important by the survey development committee, but were otherwise uncategorized. The first question in this cat-egory measured the interest of medical technology companies in learning how microelec-tromechanical systems (MEMS) can be used to enhance their products or manufacturing processes. Both the University of South Florida and the University of Central Florida have growing programs in MEMS and nanotech, and this question was designed to identify potential partners and industrial interest in the academic research programs. Roughly 2/3 of respondents (61.3%, the majority of responding manufacturers) indicated interest in learning more about micromanufacturing and this area of technology and productivity development.
The next question is most interesting when compared to other survey questions regarding the importance of Florida’a hospital and healthcare system, the demand for physicians and nurses, and the consumer healthcare market. Roughly 1/4 of responding companies reported that they have had some form of formal partnership with a Florida hospital or clinic within the last 5 years to develop a product or service. While this is a significant number, it may remain an area for additional growth and assistance.
The final question in this section measured the importance of access to physicians and nurses for product devel-opment. Ranked from one to seven, the average (mean) response was 4.6, indicating that responding compa-nies considered such access fairly important.
Network Capital
The next survey section dealt with social or “network capital.” Social capital describes the ability to mobilize net-works to leverage strategic resources for one’s company. For this section, companies were not asked to evalu-
61.3%
38.7%
Interest in MEMS
Yes
No
27.8%
72.2%
Partnerships withHospitals and Clinics
Yes
No

nnovationINSIGHTi Florida’s Medical Technology Clusters 36 nnovation
INSIGHTi37 Florida’s Medical Technology Clusters
ate the skills and qualifications of their company’s leaders, but rather to estimate the caliber of their networks. Companies rated the network of your company’s leaders from 1 to 7 based upon the following scale:
7 First-name, personal relations with internationally elite leaders and dealmakers (e.g., Fortune/Global 40 level)
6 First-name, personal relations with U.S. elite leaders and dealmakers (e.g., Fortune 100 level)
5 Personal, reliable relations with top leaders and dealmakers across U.S. (e.g., Fortune 100 level)
4 Personal or professional relations with leaders recognized at the regional or state level (e.g., Fortune 500 level)
3 Reliable personal or professional connections with leaders recognized at the local level
2 Indirect or limited connections to leaders recognized at the local level
1 Few to no significant connections
The survey results regarding network capital were very interesting. Overall, Florida High Tech Corridor medi-cal technology companies feel best connected regarding technology, with leaders at the state or national level. Companies felt least connected regarding finances, networked only with leaders at the local level. Medical technology board members were looked to for providing access to financial and investment contacts more than the executive staff; perhaps difficulty with capital resources has prevented this business area from being fully institutionalized within the companies. In all other business regards the executive staff (president, CEOs, CFOs/CTOs/COOs, VPs, etc.) were seen as better connected than board members.
Although individual companies reported being much better or poorer connected than the average response, col-lectively the responses were consistent (with a standard deviation of approximately 1.8). The implication is that while few companies felt their leaders were completely disconnected to key business resources, few businesses could tap into leadership at the Fortune 100 level or higher, and only a few company leaders had strong connec-tions with U.S. or internationally elite business, technology and finance leaders regarding medical technology.The most apparent implication of this section is that development leaders should attempt to help all medical
1 2 3 4 5 6 7
Network Capital
Florida High Tech Corridor Medical Technology Survey
LegendPresident / CEO Board
Finance: Ability to call upon “deeppockets” financiers or investors
Management: Ability to draw upon world-class, experienced management for advice or
assistance
Technology: Ability to draw upon leadingresearchers for advice or new technologies
Marketing: Interaction and recognition with topbusiness leaders in your industry

nnovationINSIGHTi Florida’s Medical Technology Clusters 38 nnovation
INSIGHTi39 Florida’s Medical Technology Clusters
technology companies become better connected. First, cluster companies with the best-networked board and staff leaders should be identified for each resource area (finance, management, etc.). Second, small and en-trepreneurial companies should be assisted to meet and network with these local/regional leaders. Finally, the best-connected local leaders should be encouraged to become aware of each others’ resources, and to identify opportunities at the national and international level for these leaders to become even better connected. Col-lectively, these business leaders may be “heavy hitters” enough to gain entry and build contacts that the medical technology cluster enough could not.
Network development should be an intentional process in which business leaders should assess where their access to specific resources are limited, and then intentionally establish relations with those who have deep per-sonal networks in that resource. A critical step in this process is identifying who has the best contacts; develop-ment leaders should cultivate an awareness of “behind the scenes” players rather than relying solely on formal institutions (such as banks or accounting firms) to mobilize resources and make deals.
Needs Assessment
The final survey section was an assessment of industry needs. As shown on the following chart, respondents ranked the importance of the following issues to their growth and profitability (1 = not important at all, 7=very important). Public developers should consider this to be a prioritization of areas of most needed assistance. Overall, the most critical industry issues are related to growth (marketing / sales, and research and product development) and federal regulation assistance. Tort and liability, availability of financing and investment, and availability of technicians and skilled labor are indicated as important industry needs. Please note that these represent needs of current employers, not necessarily what changes might be needed to attract new businesses and grow the cluster beyond its current status.
1 2 3 4 5 6 7
Education: Local degree programs in biotech / cell therapyLabor: Availability of nurses / physician employees
Labor: Availability of unskilled laborEducation: Local degree programs in bioengineering
Labor: Training and certification issuesGrowth: Import / export
Regulation: Ease of meeting state and local regulations Growth: Taxation structure
Labor: Availability of technicians / skilled laborGrowth: Availability of financing and capital investment
Liability: Tort / insurance / legal liabilityRegulation: Ease of meeting federal regulations
Growth: Research and product developmentGrowth: Marketing and sales
Ranking of Needs
Florida High Tech Corridor Medical Technology Survey

nnovationINSIGHTi Florida’s Medical Technology Clusters 38 nnovation
INSIGHTi39 Florida’s Medical Technology Clusters
VII. Concluding Comments and Recommendations
The Florida High Tech Corridor has an established and growing cluster of companies specializing in medical technology. This cluster has existed for decades, and has recently grown more rapidly than similar clusters across the nation. Although the region will likely become even more recognized in the future, it only recently has begun to gain national attention.
However, central Florida’s medical technology clusters will need considerable assistance to reach a higher level of prominence. Florida’s business infrastructure is missing support elements for this industry, which should be addressed by cooperative marketing, investing, technology and networking activities led by industry groups and public development organizations. Further, the significant central Florida resources that do support this industry, such as research and medical universities, a desirable demographic and leading research hospital and health-care organizations, are neither well aware of the medical technology industry nor much partnered with them. Co-ordinated and targeted assistance at the state, regional, and local levels will determine whether central Florida’s medical technology clusters keep pace with other fast-growing regions such as Baltimore, or lose ground and what relative competitive advantages they have.
Specific recommendations that can help reach these goals, based upon the research (in no particular order) include:
1. Economic Development Organizations (EDOs) should embrace the role as facilitators of targeted networking activities. Appropriate facilitation will require cultivating intimate knowledge of “behind the scenes” makers and shakers. Specific to this cluster, and with participation of survey respondents, EDOs should introduce and facili-tate networking between medical company board members with connections among the national and interna-tional elite. The very act of building acquaintances among such a “power group” may generate new enterprises. Similarly, if the respective companies and board members are willing, EDOs can help introduce entrepreneurs to those much better connected to finance, technology, and management.
2. EDOs should strive to target their workforce recruitment activities to regions where central Florida has a competitive advantage (e.g., target regions with a significant medical technology workforce, declining employ-ment, and lower relative wages). Similarly, corporate recruitment activities should be oriented toward regions with strategic relative disadvantes, such as significant medical technology industry but showing high attrition as identified in this report.
3. EDOs should promote entrepreneurial activities within the identified needs of the medical technology cluster. Local medical technology companies import a significant amount of intermediate products, and in many cases these imports represent notable opportunities for new local companies. This report identifies several product categories that should have strong potential, and estimates the amount of purchases by central Florida medical technology companies in each category.
4. Based upon needs identified by the industry, EDOs and public agencies should develop resources for collec-tive marketing and sales support for the medical technology cluster. These organizations should also identify resources to assist cluster companies with research and product development (particularly from local universi-ties), and to assist them with federal regulations relating to medical products. Where appropriate, supporters of the cluster should encourage revision of Florida’s tort law system.
5. As a region, central Florida should pursue the establishment of a federal research facility relating to medical technologies. Such opportunities are rare and difficult, but have a tremendous long-term impact on nearby medi-cal technology clusters. Near-term opportunities may relate to homeland security and bioterrorism defense. The top U.S. medical technology regions across the U.S. are all characterized by federal institutions or universities with international acclaim in medical research.

nnovationINSIGHTi Florida’s Medical Technology Clusters 40 nnovation
INSIGHTi41 Florida’s Medical Technology Clusters
6. The University of South Florida and the University of Central Florida should encourage applied faculty re-search in targeted disciplines and fields as identified by local industry. Further, the development of specialized graduate and Ph.D. programs in medical research fields should be pursued to foster the long-term growth of the region, even though such programs may not be immediately adopted by existing local companies.
7. Local EDOs and educators should conduct a MEMS / advanced manufacturing education and outreach series to increase the productivity of manufacturers. Since device and instrumentation manufacturers constitute the bulk of central Florida’s medical technology cluster, increased technology and miniaturization may greatly im-prove the competitiveness of the cluster. As there is indirect evidence that central Florida’s medical technology workforce may be relatively labor-intensive compared to other leading regions, MEMS and advance manufactur-ing techniques may provide an alternative that has long-term workforce implications.
8. While Florida High Tech Corridor companies have good intellectual property protection (on average) and are comfortable with their access to technology, this is an area that could benefit from assistance. Public agencies and EDOs could provide technology exchange forums and workshops to help companies identify new products opportunities and protect their core technologies.
9. Business assistance organizations, business schools, and EDOs should target first-time entrepreneurs as pivotal targets for assistance. Research presented in this report indicates that insufficient resources and connec-tions possessed by company founders may limit the growth of medical technology companies for several years, including access to technology, management, and financial resources.
10. Florida industry and economic development organizations should communicate with medical technology companies in their region, urging them to make certain that the NAICS codes that have been assigned to them actuall falls within one of the major medical categories (specifically 325410, 334510, or 339110). This will im-prove each region’s ranking in future studies of this industry – both national and local – and increase accuracy of the results. Recommended industry codes and NAICS contact instructions are included in Appendix I.
Nationally, “bio” has been identified by numerous futurists as one of the subjects of greatest social and economic impact in the forthcoming decades. It is very important to avoid a “me too” approach to adopting biotech as a regional development goal; without identifying key areas of strategic advantage and technology specialization, most regions will be “lost in the crowd.” Institutions, companies, and regions that identify a particular core area of excellence – for example, cell therapy at the University of South Florida or lasers and optics at the University of Central Florida – will have the best chance to achieve national recognition (as opposed to generalized “biotech” initiatives). To build from existing strengh, memberships of established associations in other industries – such as the Florida Photonics Cluster, the National Center for Simulation, and the Florida Aerospace Alliance – should be polled to identify their efforts in medical technology as a starting point for medical industry initiatives.
Florida has an opportunity to capture a significant share of this exciting market, but its medical technology industry’s growth will be very sensitive to the resources invested over the next several years, as well as to how the Florida High Tech Corridor’s companies, universities, and industry organizations define their efforts.

nnovationINSIGHTi Florida’s Medical Technology Clusters 40 nnovation
INSIGHTi41 Florida’s Medical Technology Clusters
Appendix I. Medical Technology Cluster Industry Codes
The following Standard Industry Classification (SIC) codes were identified by the USF Center for Eco-nomic Development Research (CEDR) for Tampa Bay, Florida’s medical technology cluster. These codes were utilized for all relevant analyses in this report as well.
SIC SIC Description Biotech Pharma-ceuticals
Device / Manuf-acturing
8731 Commercial Physical and Biological Research √
3053 Gaskets, Packing, and Sealing Devices √
3060 Rubber and miscellaneous plastics products √
3823 Industrial Instruments for Measurement, √
3824 Totalizing Fluid Meters and Counting Devices √
3826 Laboratory Analytical Instruments √
3827 Optical Instruments and Lenses √
3829 Measuring and Controlling Devices, NEC √
3841 Surgical and Medical Instruments and √
3842 Orthopedic, Prosthetic, and Surgical √
3843 Dental Equipment and Supplies √
3844 X-Ray Apparatus and Tubes and Related √
3845 Electromedical and Electrotherapeutic √
3851 Ophthalmic Goods √
2833 Medicinal Chemicals and Botanical Products √
2834 Pharmaceutical Preparations √
2835 In Vitro and In Vivo Diagnostic Substances √
2836 Biological Products, Except Diagnostic √
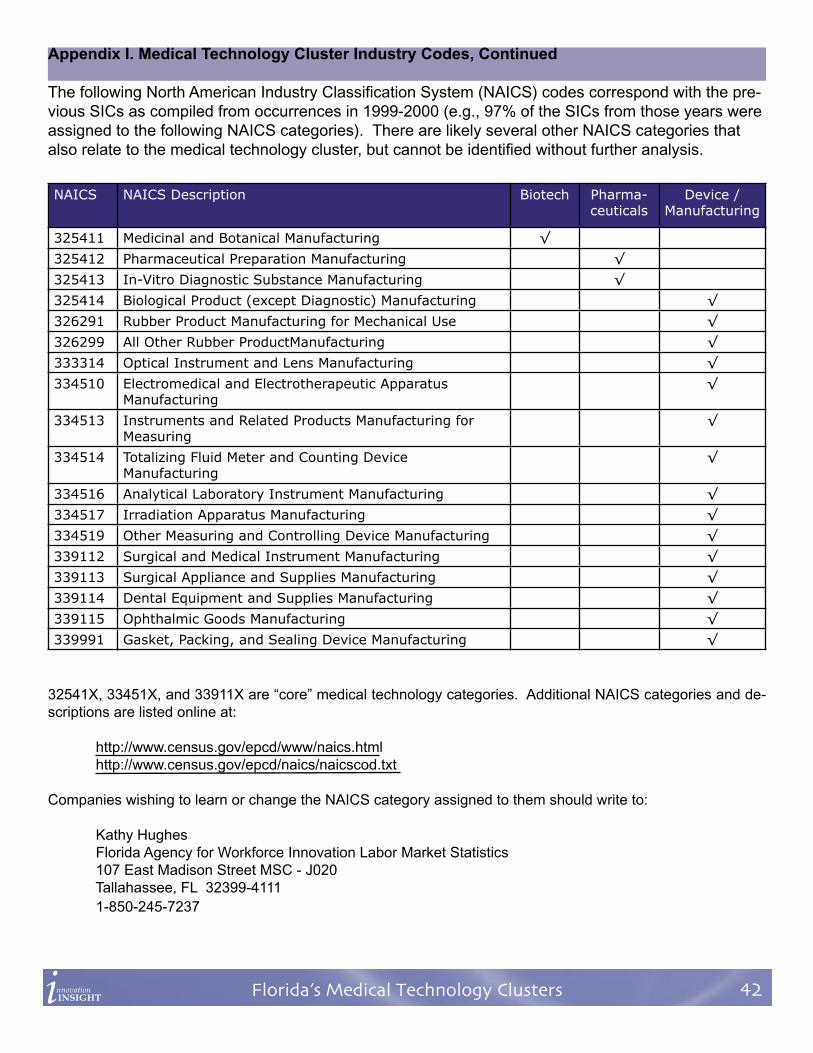
nnovationINSIGHTi Florida’s Medical Technology Clusters 42 nnovation
INSIGHTi43 Florida’s Medical Technology Clusters
Appendix I. Medical Technology Cluster Industry Codes, Continued
The following North American Industry Classification System (NAICS) codes correspond with the pre-vious SICs as compiled from occurrences in 1999-2000 (e.g., 97% of the SICs from those years were assigned to the following NAICS categories). There are likely several other NAICS categories that also relate to the medical technology cluster, but cannot be identified without further analysis.
NAICS NAICS Description Biotech Pharma-ceuticals
Device / Manufacturing
325411 Medicinal and Botanical Manufacturing √
325412 Pharmaceutical Preparation Manufacturing √
325413 In-Vitro Diagnostic Substance Manufacturing √
325414 Biological Product (except Diagnostic) Manufacturing √
326291 Rubber Product Manufacturing for Mechanical Use √
326299 All Other Rubber ProductManufacturing √
333314 Optical Instrument and Lens Manufacturing √
334510 Electromedical and Electrotherapeutic Apparatus Manufacturing
√
334513 Instruments and Related Products Manufacturing for Measuring
√
334514 Totalizing Fluid Meter and Counting Device Manufacturing
√
334516 Analytical Laboratory Instrument Manufacturing √
334517 Irradiation Apparatus Manufacturing √
334519 Other Measuring and Controlling Device Manufacturing √
339112 Surgical and Medical Instrument Manufacturing √
339113 Surgical Appliance and Supplies Manufacturing √
339114 Dental Equipment and Supplies Manufacturing √
339115 Ophthalmic Goods Manufacturing √
339991 Gasket, Packing, and Sealing Device Manufacturing √
32541X, 33451X, and 33911X are “core” medical technology categories. Additional NAICS categories and de-scriptions are listed online at:
http://www.census.gov/epcd/www/naics.html http://www.census.gov/epcd/naics/naicscod.txt
Companies wishing to learn or change the NAICS category assigned to them should write to:
Kathy Hughes Florida Agency for Workforce Innovation Labor Market Statistics 107 East Madison Street MSC - J020 Tallahassee, FL 32399-4111 1-850-245-7237

nnovationINSIGHTi Florida’s Medical Technology Clusters 42 nnovation
INSIGHTi43 Florida’s Medical Technology Clusters
Appendix II. Medical Technology Patent Categories
The following domestic utility patent categories were selected from U.S. Patent and Trademark Office.
Class Number
Class Title Biotech Pharma-ceuticals
Devices / Manufacturing
All Medical Technologies
435 Chemistry: molecular biology and microbiology
√ √
436 Chemistry: analytical and immunological testing
√ √
800 Multicellular living organisms and unmodified parts thereof and related processes
√ √
930 Peptide or protein sequence √ √423 Chemistry of inorganic compounds √ √
424 Drug, bio-affecting and body treating compositions
√ √
514 Drug, bio-affecting and body treating compositions
√ √
351 Optics: eye examining, vision testing and correcting
√ √
378 X-ray or gamma ray systems or devices √ √422 Chemical apparatus and process
disinfecting, deodorizing, preserving, or sterilizing
√ √
430 Radiation imagery chemistry: process, composition, or product thereof
√ √
623 Prosthesis (i.e., artificial body members), parts thereof, or aids and accessories therefor
√ √
D24 Medical and laboratory equipment √ √

nnovationINSIGHTi Florida’s Medical Technology Clusters 44 nnovation
INSIGHTi45 Florida’s Medical Technology Clusters
Appendix III. Glossary of Industry Terms
Bioengineering: Applications of mechanical and electrical engineering, mathematics and physics for health care purposes.
Bioinformatics: Computer, trend, and database analysis of biological, healthcare and population data.
Biotech: Generic term for industries supporting consumer healthcare, more specifically those oriented toward biological processes and materials including gene therapy, gene-modified products, cell therapies, and living tissues.
FDA: U.S. Food and Drug Administration, the regulatory agency covering sales and usage of all healthcare products and procedures.
Genomics: Mathematical and biochemical analysis of the expression of human genomes (genetics). Genomics can be used to identify populations at risk from drug side effects or ideal candidates for specific treatments.
ISO - Internationally recognized quality control manufacturing standards (ISO13000 relates to environmental and safety).
Life sciences: Generic term for biotech industries, or academic discliplines coveriing biology, biochemistry and medicine.
Medical technology: Generic term to encompass all industries and fields of science that serve healthcare de-livery.
Pharmacogenetics: The study of the way drugs interact with genetic makeup or the genetic response to a drug. (Source: biotechmedia.com)
Pharmakokinetics: The study of the processes of bodily absorption, distribution, metabolism, and excretion (ADME) of compounds and medicines. (Source: biotechmedia.com)
NCI: U.S. National Cancer Institute (NIH).
NIH: U.S. National Institutes of Health.
SBIR / STTR: U.S. Small Business Innovation Research / Small Business Technology Transfer Research grant programs.

nnovationINSIGHTi Florida’s Medical Technology Clusters 44 nnovation
INSIGHTi45 Florida’s Medical Technology Clusters
Appendix IV. Contact Information
Copies of this report will be available online from the following organizations:
http://innovationinsight.com/ Innovation Insight, Inc.27810 Sky Lake CircleWesley Chapel, FL [email protected]
http://FloridaHighTech.com/The Florida High Tech Corridor Council, Inc.801 International Parkway, 5th FloorLake Mary, Fl 32746407.562.1910
http://TampaBay.org/The Tampa Bay Partnership4300 West Cypress Street, Suite 250Tampa, Fl 33607813.878.2208
Additional information on Florida’s medical technology companies can be obtained from:
http://usf.edu/oed/University of South Florida Office of Economic Development4202 East Fowler Avenue, FAOTampa, FL 33612813.974.5458
http://www.flamedmfg.org/Florida Medical Manufacturing Consortiumc/o Pinellas County Economic Development14010 Roosevelt Blvd Suite 704Clearwater, FL 33762727.464.7332
http://robertscommunications.com/gclsi/The Gulf Cost Life Sciences Initiative100 North Tampa Street, Suite 2200Tampa, Florida 33602813.225.4876
http://cedr.coba.usf.edu/University of South Florida Center for Economic Development Research (CEDR)1101 Channelside Drive, 2nd Floor NorthTampa, FL 33602

nnovationINSIGHTi Florida’s Medical Technology Clusters 46