Embed Size (px)
Citation preview


Instructor’s Guide and SolutionsManual to Organic Structuresfrom 2D NMR Spectra


Instructor’s Guide and SolutionsManual to Organic Structuresfrom 2D NMR Spectra
L. D. Field, H. L. Li and A. M. MagillSchool of Chemistry, University of New South Wales, Australia

This edition first published 2015C ⃝ 2015 John Wiley & Sons Ltd
Registered officeJohn Wiley & Sons Ltd, The Atrium, Southern Gate, Chichester, West Sussex, PO19 8SQ, UnitedKingdom
For details of our global editorial offices, for customer services and for information about how toapply for permission to reuse the copyright material in this book please see our website atwww.wiley.com.
The right of the author to be identified as the author of this work has been asserted in accordancewith the Copyright, Designs and Patents Act 1988.
All rights reserved. No part of this publication may be reproduced, stored in a retrieval system, ortransmitted, in any form or by any means, electronic, mechanical, photocopying, recording orotherwise, except as permitted by the UK Copyright, Designs and Patents Act 1988, without theprior permission of the publisher.
Wiley also publishes its books in a variety of electronic formats. Some content that appears in printmay not be available in electronic books.
Designations used by companies to distinguish their products are often claimed as trademarks. Allbrand names and product names used in this book are trade names, service marks, trademarks orregistered trademarks of their respective owners. The publisher is not associated with any productor vendor mentioned in this book.
Limit of Liability/Disclaimer of Warranty: While the publisher and author have used their bestefforts in preparing this book, they make no representations or warranties with respect to theaccuracy or completeness of the contents of this book and specifically disclaim any impliedwarranties of merchantability or fitness for a particular purpose. It is sold on the understandingthat the publisher is not engaged in rendering professional services and neither the publisher nor theauthor shall be liable for damages arising herefrom. If professional advice or other expert assistanceis required, the services of a competent professional should be sought.
Library of Congress Cataloging-in-Publication Data applied for.
A catalogue record for this book is available from the British Library.
ISBN: 9781119027256
Set in 12/18pt Times New Roman by Aptara Inc., New Delhi, India.
1 2015

CONTENTS
Preface ix
Solutions Summary 1
Problem 1 (1-iodopropane) 7
Problem 2 (2-butanone) 11
Problem 3 (2-hexanone) 15
Problem 4 (ethyl propionate) 19
Problem 5 (ethyl 3-ethoxypropionate) 23
Problem 6 (4-acetylbutyric acid) 28
Problem 7 (3-ethoxypropionyl chloride) 32
Problem 8 (ethyl 3-chloropropionate) 36
Problem 9 (isoamyl acetate) 40
Problem 10 (trans-4-hexen-3-one) 45
Problem 11 (trans-2-octen-4-one) 50
Problem 12 (3-nitrobenzaldehyde) 55
Problem 13 (3-iodotoluene) 61
Problem 14 (8-hydroxy-5-nitroquinoline) 64
Problem 15 (2-bromo-3-picoline) 69
Problem 16 (trans-anethole) 72
Problem 17 (cis-2-pentene) 75
Problem 18 (p-tolyl benzoate) 79
Problem 19 (phenyl p-toluate) 86
Problem 20 (4-biphenylyl acetate) 93
Problem 21 (4′-phenoxyacetophenone) 99
Problem 22 (4′-tert-butylacetophenone) 106
v

Contents
Problem 23 (2,2,4′-trimethylpropiophenone) 110
Problem 24 (trans-2-methyl-3-phenyl-2-propen-1-ol) 114
Problem 25 (methyl 4-ethoxybenzoate) 119
Problem 26 (methyl 3-(p-tolyl)propionate) 123
Problem 27 (4-(4′-methoxyphenyl)-2-butanone) 127
Problem 28 (ethyl 6-bromohexanoate) 132
Problem 29 (piperonal) 135
Problem 30 (cis-3-hexenyl benzoate) 139
Problem 31 (trans-2,cis-6-nonadienal) 146
Problem 32 (allyl glycidyl ether) 155
Problem 33 (3,4-epoxy-4-methyl-2-pentanone) 159
Problem 34 (dl-methionine) 162
Problem 35 (N-acetyl-l-leucine) 165
Problem 36 (isoamyl valerate) 170
Problem 37 ((E)-4-methyl-4′-nitrostilbene) 173
Problem 38 (2-tert-butyl-6-methylphenol) 181
Problem 39 (2-allyl-6-methylphenol) 186
Problem 40 (2-hydroxy-4-methoxybenzaldehyde) 194
Problem 41 (2′-hydroxy-5′-methylacetophenone) 198
Problem 42 (3′-fluoro-4′-methoxyacetophenone) 203
Problem 43 (trans-ferulic acid) 209
Problem 44 (sec-butyl 3-hydroxycinnamate) 215
Problem 45 (1-benzosuberone) 221
Problem 46 (dimethyl (3-bromopropyl)phosphonate) 228
Problem 47 (caffeine) 233
Problem 48 (benzyloxypropionitrile) 238
Problem 49 (cineole) 242
Problem 50 (thymoquinone) 246
vi

Contents
Problem 51 (4-bromo-1-indanol) 251
Problem 52 (1-bromo-4-methylnaphthalene) 257
Problem 53 (carvacrol) 264
Problem 54 (acetoacetanilide) 272
Problem 55 (ethyl acetamidocyanoacetate) 277
Problem 56 (𝜶-humulene) 283
Problem 57 (3,4-dihydro-2H-benzopyran-3-carboxylic acid) 289
Problem 58 (quinidine) 296
Problem 59 (salbutamol) 312
Problem 60 (2-hydroxy-1-naphthaldehyde) 322
Problem 61 (6-methyl-4-chromanone) 329
Problem 62 (citronellal) 336
Problem 63 ((+)-cis-2-oxabicyclo-[3.3.0]oct-6-en-3-one) 344
Problem 64 (melatonin) 349
Problem 65 (carvone) 362
Problem 66 (haloperidol) 370
vii


PREFACE
This book is the Instructor’s Guide and Solutions Manual to the problems
contained in the text Organic Structures from 2D NMR Spectra.
The aim of this book is to teach students to solve structural problems in organic
chemistry using NMR spectroscopy and in particular 2D NMR spectroscopy. The
basic philosophy of the book is that learning to identify organic structures using
spectroscopy is best done by working through examples. This book contains a
series of about 60 graded examples ranging from very elementary problems
through to very challenging problems at the end of the collection.
We have assumed a working knowledge of basic structural organic chemistry and
common functional groups. We also assume a working knowledge of the
rudimentary spectroscopic methods which would be applied routinely in
characterising and identifying organic compounds including infrared spectroscopy
and basic 1D 13C and 1H NMR spectroscopy.
The Instructor’s Guide contains a worked solution to each of the problems
contained in Organic Structures from 2D NMR Spectra. At the outset, it should be
emphasised that there are always many paths to the correct answer – there is no
single process to arrive at the correct solution to any of the problems. We do not
recommend a mechanical attitude to problem solving – intuition, which comes
with experience, has a very important place in solving structures from spectra;
however, students often find the following approach useful:
(i) Extract as much information as possible from the basic characterisation data
which is provided:
(a) Note the molecular formula and any restrictions this places on the
functional groups that may be contained in the molecule.
(b) From the molecular formula, determine the degree of unsaturation.
The degree of unsaturation can be calculated from the molecular
formula for all compounds containing C, H, N, O, S and the
halogens using the following three basic steps:
1. Take the molecular formula and replace all halogens by
hydrogens.
ix

Preface
2. Omit all of the sulfur and/or oxygen atoms.
3. For each nitrogen, omit the nitrogen and omit one hydrogen.
After these three steps, the molecular formula is reduced to CnHm,
and the degree of unsaturation is given by:
Degree of Unsaturation = n − m∕2 + 1
The degree of unsaturation indicates the number of 𝜋 bonds and/or
rings that the compound contains. For example, if the degree of
unsaturation is 1, the molecule can only contain one double bond or
one ring. If the degree of unsaturation is 4, the molecule must
contain four rings or multiple bonds. An aromatic ring accounts for
four degrees of unsaturation (the equivalent of three double bonds
and a ring). An alkyne or a C N accounts for two degrees of
unsaturation (the equivalent of two 𝜋 bonds).
(c) Analyse the 1D 1H NMR spectrum if one is provided and note the
relative numbers of protons in different environments and any
obvious information contained in the coupling patterns. Note the
presence of aromatic protons, exchangeable protons, and/or vinylic
protons, all of which provide valuable information on the functional
groups which may be present.
(d) Analyse the 1D 13C NMR spectrum if one is provided and note the
number of carbons in different environments. Note also any
resonances that would be characteristic of specific functional groups,
e.g. the presence or absence of a ketone, aldehyde, ester or carboxylic
acid carbonyl resonance.
(e) Analyse any infrared data and note whether there are absorptions
characteristic of specific functional groups, e.g. C O or OH groups.
(ii) Extract basic information from the 2D COSY, TOCSY and/or C H
correlation spectra.
(a) The COSY will provide obvious coupling partners. If there is one
identifiable starting point in a spin system, the COSY will allow the
successive identification (i.e. the sequence) of all nuclei in the spin
system. The COSY cannot jump across breaks in the spin system
(such as where there is a heteroatom or a carbonyl group that isolates
one spin system from another).
x

Preface
(b) The TOCSY identifies all groups of protons that are in the same spin
system.
(c) The C H correlation links the carbon signals with their attached
protons and also identifies how many CH , CH2 , CH3 and
quaternary carbons are in the molecule.
(iii) Analyse the INADEQUATE spectrum if one is provided, because this can
sequentially provide the whole carbon skeleton of the molecule. Choose one
signal as a starting point and sequentially work through the
INADEQUATE spectrum to determine which carbons are connected to
which.
(iv) Analyse the HMBC spectrum. This is perhaps the most useful technique to
pull together all of the fragments of a molecule because it gives long-range
connectivity.
(v) Analyse the NOESY spectrum to assign any stereochemistry in the
structure.
(vi) Continually update the list of structural elements or fragments that have been
conclusively identified at each step and start to pull together reasonable
possible structures. Be careful not to jump to possible solutions before the
evidence is conclusive. Keep assessing and re-assessing all of the options.
(vii) When you have a final solution which you believe is correct, go back and
confirm that all of the spectroscopic data are consistent with the final
structure and that every peak in every spectrum can be properly rationalised
in terms of the structure that you have proposed.
L. D. Field
H. L. Li
A. M. Magill
January 2015
xi


1
CH2CH2I CH3
LABEL COSY HSQC HMBC INADEQUATE
1-iodopropane
C3H7I
2
C CH2 CH3CH3
O
LABEL COSY HSQC HMBC INADEQUATE
2-butanone
C4H8O
3
C CH2 CH2CH3
O
CH2 CH3
COSY HSQC HMBC
2-hexanone
C6H12O
4
CH3CH2 OCH2CH3
O
SIMULATE COSY HSQC HMBC
ethyl propionate
C5H10O2
5
O
OCH2CH3CH3CH2O
LABEL COSY HSQC HMBC
ethyl 3-ethoxypropionate
C7H14O3
6
OH
O
CH3
O
ASSIGNMENT HSQC HMBC
4-acetylbutyric acid
C6H10O3
7
CH3CH2O Cl
O
COSY HSQC HMBC ISOMER (2)
3-ethoxypropionyl chloride
C5H9ClO2
8
OCH2CH3
O
Cl
COSY HSQC HMBC ISOMER (2)
ethyl 3-chloropropionate
C5H9ClO2
9
CH3 OC
CH3
CH3
O
LABEL COSY HSQC HMBC INADEQUATE
isoamyl acetate
C7H14O2
10
CH3
CC
C
H
H
O
CH3CH2
LABEL COSY HSQC HMBC NOESY
trans-4-hexen-3-one
C6H10O
11
CH3C
CC
H
H
O
CH3
COSY HSQC HMBC NOESY
trans-2-octen-4-one
C8H14O
12
NO2
COH
LABEL COSY HSQC HMBC NOESY INADEQUATE
3-nitrobenzaldehyde
C7H5NO3
Instructor’s Guide and Solutions Manual to Organic Structures from 2D NMR Spectra. L. D. Field, H. L. Li and A. M. Magill © 2015 John Wiley & Sons, Ltd. Published 2015 by John Wiley & Sons, Ltd.

Organic Structures from 2D NMR Spectra
13
I
CH3
SIMULATE HSQC HMBC
3-iodotoluene
C7H6I
14
N
OH
NO2
LABEL COSY HSQC HMBC INADEQUATE
8-hydroxy-5-nitroquinoline
C9H6N2O3
15
N Br
CH3
HSQC HMBC
2-bromo-3-picoline
C6H6BrN
16
CH3
H
HO
CH3
SIMULATE COSY NOESY
trans-anethole
C10H12O
17
CH2 CH3
HH
CH3
COSY HSQC NOESY
cis-2-pentene
C5H10
18
OCH3 C
O
COSY HSQC HMBC ISOMER (4)
p-tolyl benzoate
C14H12O2
19
CCH3 O
O
COSY HSQC HMBC ISOMER (4)
phenyl p-toluate
C14H12O2
20
O C
O
CH3
COSY HSQC HMBC ISOMER (4)
4-biphenylyl acetate
C14H12O2
21
O
O
CH3
COSY HSQC HMBC ISOMER (4)
4'-phenoxyacetophenone
C14H12O2
22
C CH3
O
(CH3)3C
HSQC HMBC ISOMER (2)
4'-tert-butylacetophenone
C12H16O
23
C C(CH3)3
O
CH3
HSQC HMBC ISOMER (2)
2,2,4'-trimethyl-propiophenone C12H16O
24
CH2OH
CH3
H
COSY HSQC HMBC NOESY
trans-2-methyl-3-phenyl-2-propen-1-ol
C10H12O
2

Instructor’s Guide and Solutions Manual
25
C
O CH3
CH3CH2O
O
COSY HSQC HMBC
methyl 4-ethoxybenzoate
C10H12O3
26
CH3 O OCH3
COSY HSQC HMBC ISOMER (2)
methyl 3-(p-tolyl)propionate
C11H14O2
27
CH3O
O
HSQC INADEQUATE ISOMER (2)
4-(4'-methoxyphenyl)-2-butanone
C11H14O2
28
BrO
OCH2CH3
ASSIGNMENT COSY HSQC
ethyl 6-bromohexanoate
C8H15BrO2
29
O
OH
O
SIMULATE HSQC HMBC
piperonal
C8H6O3
30
C
O
O CH2 CH2
C C
CH2 CH3
HH
COSY HSQC HMBC NOESY
cis-3-hexenyl benzoate
C13H16O2
31
C C
CH2
H
CH2
H
CH3CH2C
C
H
H
C
O
H
COSY HSQC HMBC NOESY
trans-2,cis-6-nonadienal
C9H14O
32
O
O
COSY HSQC HMBC ISOMER (2)
allyl glycidyl ether
C6H10O2
33
CH3
O
O
CH3CH3
HSQC HMBC ISOMER (2)
3,4-epoxy-4-methyl-2-pentanone
C6H10O2
34
SCH3
NH2
COOH
IDENTIFY 1 HSQC HMBC
dl-methionine
C5H11NO2S
35
CH3
N
COOH
CH3
H
O
CH3
COSY HSQC HMBC
N-acetyl-l-leucine
C8H15NO3
36
O
O
TOCSY HSQC
isoamyl valerate
C10H20O2
3

Organic Structures from 2D NMR Spectra
37
NO2
CH3
ASSIGNMENT COSY HSQC HMBC
(E)-4-methyl-4'-nitrostilbene
C15H13NO2
38
OH
C(CH3)3CH3
HSQC HMBC
2-tert-butyl-6-methylphenol
C11H16O
39
OH
CH3
COSY HSQC HMBC
2-allyl-6-methylphenol
C10H12O
40
H
O
OCH3
OH
HSQC HMBC
2-hydroxy-4-methoxy-benzaldehyde C8H8O3
41
CH3
O OH
CH3
HSQC HMBC
2'-hydroxy-5'-methylacetophenone
C9H10O2
42
CH3
O
F
OCH3
HSQC NOESY HETEROATOM
3'-fluoro-4'-methoxyacetophenone
C9H9FO2
43
OCH3
COOH
HO
COSY HSQC HMBC
trans-ferulic Acid
C10H10O4
44
O
O
OH
COSY HSQC HMBC
seC–butyl 3-hydroxycinnamate
C13H16O3
45
O
ASSIGNMENT COSY HSQC HMBC
1-benzosuberone
C11H12O
46
P Br
O
CH3O
CH3O
COSY HSQC P-H HMBC HETEROATOM
dimethyl (3-bromo-propyl)phosphonate
C5H12BrO3P
47
N
N
N
N
CH3
CH3
CH3
O
O
H
ASSIGNMENT HSQC HMBC N-H HSQC HETEROATOM
caffeine
C8H10N4O2
48
O
CN
COSY HSQC HMBC
benzyloxypropionitrile
C10H11NO
4

Instructor’s Guide and Solutions Manual
49
O
CH3 CH3
CH3
HSQC INADEQUATE
cineole
C10H18O
50
O
O
CH3
IDENTIFY 1 HSQC HMBC
thymoquinone
C10H12O2
51
OH
H
Br
COSY HSQC HMBC
4-bromo-1-indanol
C9H9BrO
52
Br
CH3
ASSIGNMENT COSY HSQC HMBC
1-bromo-4-methylnaphthalene
C11H9Br
53
CH3
OH
COSY HSQC HMBC
carvacrol
C10H14O
54
N
H
CH3
O O
HSQC HMBC NOESY
acetoacetanilide
C10H11NO2
55
CH3 NOCH2CH3
O
O
H
CN
COSY HSQC HMBC N-H HSQC N-H HMBC
ethyl acetamido-cyanoacetate
C7H10N2O3
56
HSQC INADEQUATE
α-Humulene
C15H24
57
O
COOH
COSY HSQC HMBC
3,4-dihydro-2H–benzo-pyran-3-carboxylic acid
C10H10O3
58
N
OCH3
OH
N
H2C
ASSIGNMENT COSY HSQC HMBC NOESY
quinidine
C20H24N2O2
59
HO
HO
NC(CH3)3
OH H
COSY HSQC HMBC NOESY N-H HMBC HETEROATOM
salbutamol
C13H21NO3
60
C
OH
O H
COSY HSQC HMBC
2-hydroxy-1-naphthaldehyde
C11H8O2
5

Organic Structures from 2D NMR Spectra
61
O
O
CH3
HSQC HMBC INADEQUATE
6-methyl-4-chromanone
C10H10O2
62
CH3H
CH3 CH3O H
COSY HSQC HMBC
citronellal
C10H18O
63
O
O
H
H
COSY HSQC HMBC NOESY
(+)-cis-2-oxabicyclo-[3.3.0]oct-6-en-3-one
C7H8O2
64
N
CH3O N
CH3
O
H
H
COSY HSQC HMBC NOESY N-H HSQC N-H HMBC
melatonin
C13H16N2O2
HETEROATOM
65
CH3
O
COSY HSQC HMBC
carvone
C10H14O
66
F
O
N
OH
Cl
ASSIGNMENT COSY HSQC HMBC HETEROATOM
haloperidol
C21H23ClFNO2
6

Instructor’s Guide and Solutions Manual Problem 1
Question:
The 1H and 13C{1H} NMR spectra of 1-iodopropane (C3H7I) recorded in CDCl3 solution at 298 K and 400 MHz are given below.
The 1H NMR spectrum has signals at δ 0.99 (H3), 1.84 (H2) and 3.18 (H1) ppm.
The 13C{1H} NMR spectrum has signals at δ 9.6 (C1), 15.3 (C3) and 26.9 (C2) ppm.
Also given on the following pages are the 1H–1H COSY, 1H–13C me-HSQC, 1H–13C HMBC and INADEQUATE spectra. For each 2D spectrum, indicate which correlation gives rise to each cross-peak by placing an appropriate label in the box provided (e.g. H1 → H2, H1 → C1).
Solution:
1-Iodopropane
1. 1H–1H COSY spectra show which pairs of protons are coupled to each other. The COSY spectrum is always symmetrical about a diagonal. In the COSY spectrum, there are two 3JH–H correlations above the diagonal (H1 → H2 and H2 → H3). There are no long-range correlations.
1H–1H COSY spectrum of 1-iodopropane (CDCl3, 400 MHz)
7

Organic Structures from 2D NMR Spectra 2. The 1H–13C me-HSQC spectrum shows direct (one-bond) correlations between proton
and carbon nuclei, so there will be cross-peaks between H1 and C1, H2 and C2 and also between H3 and C3. As the spectrum is multiplicity edited, the cross-peaks corresponding to CH2 groups are shown in red and are of opposite phase to those for CH3 groups.
1H–13C me-HSQC spectrum of 1-iodopropane (CDCl3, 400 MHz)
8
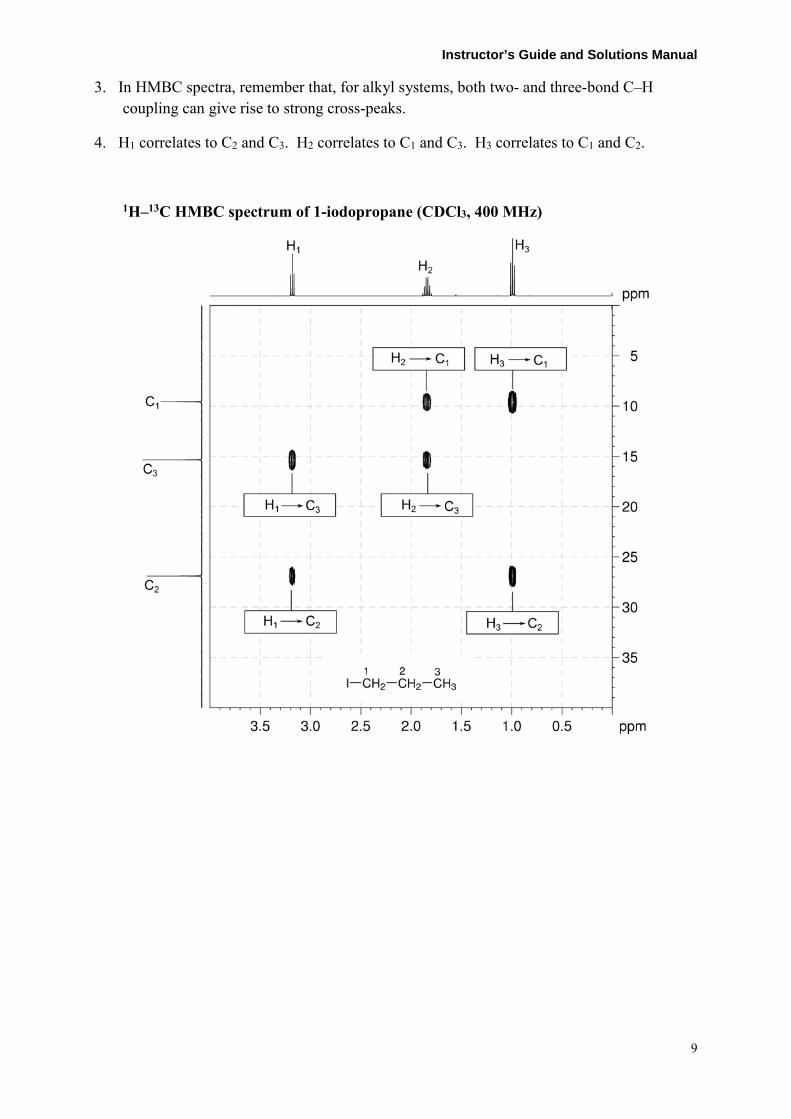
Instructor’s Guide and Solutions Manual 3. In HMBC spectra, remember that, for alkyl systems, both two- and three-bond C–H
coupling can give rise to strong cross-peaks.
4. H1 correlates to C2 and C3. H2 correlates to C1 and C3. H3 correlates to C1 and C2.
1H–13C HMBC spectrum of 1-iodopropane (CDCl3, 400 MHz)
9

Organic Structures from 2D NMR Spectra 5. The INADEQUATE spectrum shows one-bond 13C–13C connectivity. There are
correlations between C1 and C2, and C2 and C3.
INADEQUATE spectrum of 1-iodopropane (CDCl3, 150 MHz)
10

Instructor’s Guide and Solutions Manual
Problem 2
Question:
The 1H and 13C{1H} NMR spectra of 2-butanone (C4H8O) recorded in CDCl3 solution at 298 K and 400 MHz are given below.
The 1H NMR spectrum has signals at δ 1.05 (H4), 2.14 (H1) and 2.47 (H3) ppm.
The 13C{1H} NMR spectrum has signals at δ 7.2 (C4), 28.8 (C1), 36.2 (C3) and 208.8 (C2) ppm.
Also given on the following pages are the 1H–1H COSY, 1H–13C me-HSQC, 1H–13C HMBC and INADEQUATE spectra. For each 2D spectrum, indicate which correlation gives rise to each cross-peak by placing an appropriate label in the box provided (e.g. H1 → H2, H1 → C1).
Solution:
2-Butanone
1. 1H–1H COSY spectra show which pairs of protons are coupled to each other. The COSY spectrum is always symmetrical about a diagonal. In the COSY spectrum, there is only one 3JH–H correlation above the diagonal (H3 → H4). There are no long-range correlations.
1H–1H COSY spectrum of 2-butanone (CDCl3, 400 MHz)
11

Organic Structures from 2D NMR Spectra 2. The 1H–13C me-HSQC spectrum shows direct (one-bond) correlations between proton
and carbon nuclei, so there will be cross-peaks between H1 and C1, H3 and also between C3 and H4 and C4. As the spectrum is multiplicity edited, the cross-peaks corresponding to CH2 groups are shown in red and are of opposite phase to those for CH3 groups.
1H–13C me-HSQC spectrum of 2-butanone (CDCl3, 400 MHz)
12

Instructor’s Guide and Solutions Manual 3. In HMBC spectra, remember that, for alkyl systems, both two- and three-bond coupling
can give rise to strong cross-peaks. There are no one-bond C–H correlations.
4. H1 correlates to C2 and C3. H3 correlates to C1, C2 and C4. H4 correlates to C2 and C3.
1H–13C HMBC spectrum of 2-butanone (CDCl3, 400 MHz)
13

Organic Structures from 2D NMR Spectra 5. The INADEQUATE spectrum shows one-bond 13C–13C connectivity. There are
correlations between C1 and C2, C2 and C3 and C3 and C4. INADEQUATE spectrum of 2-butanone (CDCl3, 150 MHz)
14

Instructor’s Guide and Solutions Manual
Problem 3
Question:
Identify the following compound.
Molecular Formula: C6H12O
IR: 1718 cm−1
Solution:
2-Hexanone
1. The molecular formula is C6H12O. Calculate the degree of unsaturation from the molecular formula: ignore the O atom to give an effective molecular formula of C6H12 (CnHm) which gives the degree of unsaturation as (n – m/2 + 1) = 6 – 6 + 1 = 1. The compound contains one ring or one functional group containing a double bond.
2. The 13C{1H} spectrum establishes that the compound contains a ketone (13C resonance at 209.3 ppm). There can be no other double bonds or rings in the molecule because the C=O accounts for the single degree of unsaturation.
3. 1D NMR spectra establish the presence of three CH2 groups and two CH3 groups. The multiplicities of the signals can be verified using the me-HSQC spectrum.
1H NMR spectrum of 2-hexanone (CDCl3, 600 MHz)
15

Organic Structures from 2D NMR Spectra
13C{H} NMR spectrum of 2-hexanone (CDCl3, 150 MHz)
4. The COSY spectrum shows a single spin system – H3 → H4, H4 → H5 and H5 → H6 for a –CH2CH2CH2CH3 fragment.
5. H1 does not couple to any of the other protons in the molecule and therefore does not show any correlations in the COSY spectrum.
1H–1H COSY spectrum of 2-hexanone (CDCl3, 600 MHz)
16

Instructor’s Guide and Solutions Manual 5. The 1H–13C me-HSQC spectrum easily identifies the protonated carbon resonances: C6 at
13.9, C5 at 22.4, C4 at 26.0, C1 at 29.9 and C3 at 43.5 ppm.
1H–13C me-HSQC spectrum of 2-hexanone (CDCl3, 600 MHz)
17

Organic Structures from 2D NMR Spectra 6. The HMBC spectrum confirms the structure with correlations from H1 and H3 to C2
indicating that the ketone group is located between C1 and C3. All other correlations are consistent with the structure.
1H–13C HMBC spectrum of 2-hexanone (CDCl3, 600 MHz)
18

Instructor’s Guide and Solutions Manual
Problem 4
Question:
The 1H and 13C{1H} NMR spectra of ethyl propionate (C5H10O2) recorded in CDCl3 solution at 298 K and 300 MHz are given below.
The 1H NMR spectrum has signals at δ 1.14 (H1), 1.26 (H5), 2.31 (H2) and 4.12 (H4) ppm.
The 13C{1H} NMR spectrum has signals at δ 9.2 (C1), 14.3 (C5), 27.7 (C2), 60.3 (C4) and 174.5 (C3) ppm.
Use this information to produce schematic diagrams of the COSY, HSQC and HMBC spectra, showing where all of the cross-peaks and diagonal peaks would be.
Solution:
Ethyl propionate
1. The molecule contains two independent spin systems – one for each CH2CH3 fragment. Each spin system is made up of two unique spins – one CH2 and one CH3.
2. The COSY spectrum has peaks on the diagonal for each unique spin, so the spectrum will contain four diagonal peaks.
3. COSY spectra show cross-peaks (off-diagonal peaks) at positions where a proton whose resonance appears on the horizontal axis is directly coupled to another whose resonance appears on the vertical axis.
4. For ethyl propionate, the CH2 of each spin system will couple to the CH3 of the same spin system, so two cross-peaks would be expected – one between H4 and H5, and another between H1 and H2.
5. Remember that a COSY spectrum is symmetrical about the diagonal, so the two peaks above the diagonal must also be reflected below the diagonal.
19

Organic Structures from 2D NMR Spectra
Predicted 1H–1H COSY spectrum of ethyl propionate (CDCl3, 300 MHz)
20

Instructor’s Guide and Solutions Manual 6. The HSQC spectrum contains cross-peaks at positions where a proton whose resonance
appears on the horizontal axis is directly bound to a carbon atom whose resonance appears on the vertical axis. There are four cross-peaks in the HSQC spectrum.
Predicted 1H–13C HSQC spectrum of ethyl propionate (CDCl3, 300 MHz)
21

Organic Structures from 2D NMR Spectra 7. The HMBC spectrum contains cross-peaks at positions where a proton whose resonance
appears on the horizontal axis is separated by two or three bonds from a carbon atom whose resonance appears on the vertical axis.
Predicted 1H–13C HMBC spectrum of ethyl propionate (CDCl3, 300 MHz)
22

Instructor’s Guide and Solutions Manual
Problem 5
Question:
The 1H and 13C{1H} NMR spectra of ethyl 3-ethoxypropionate (C7H14O3) recorded in CDCl3 solution at 298 K and 600 MHz are given below.
The 1H NMR spectrum has signals at δ 1.18 (H1), 1.26 (H7), 2.56 (H4), 3.50 (H2), 3.70 (H3) and 4.15 (H6) ppm.
The 13C{1H} NMR spectrum has signals at δ 14.2 (C7), 15.1 (C1), 35.3 (C4), 60.4 (C6), 65.9 (C3), 66.4 (C2) and 171.7 (C5) ppm.
Also given on the following pages are the 1H–1H COSY, 1H–13C me-HSQC and 1H–13C HMBC spectra. For each 2D spectrum, indicate which correlation gives rise to each cross-peak by placing an appropriate label in the box provided (e.g. H1 → H2, H1 → C1).
Solution:
Ethyl 3-ethoxypropionate
23

Organic Structures from 2D NMR Spectra 1. 1H–1H COSY spectra show which pairs of protons are coupled to each other. The COSY
spectrum is always symmetrical about a diagonal. In the COSY spectrum, there are three 3JH–H correlations above the diagonal (H2 → H1, H3 → H4 and H6 → H7). There are no long-range correlations.
1H–1H COSY spectrum of ethyl 3-ethoxypropionate (CDCl3, 600 MHz)
24
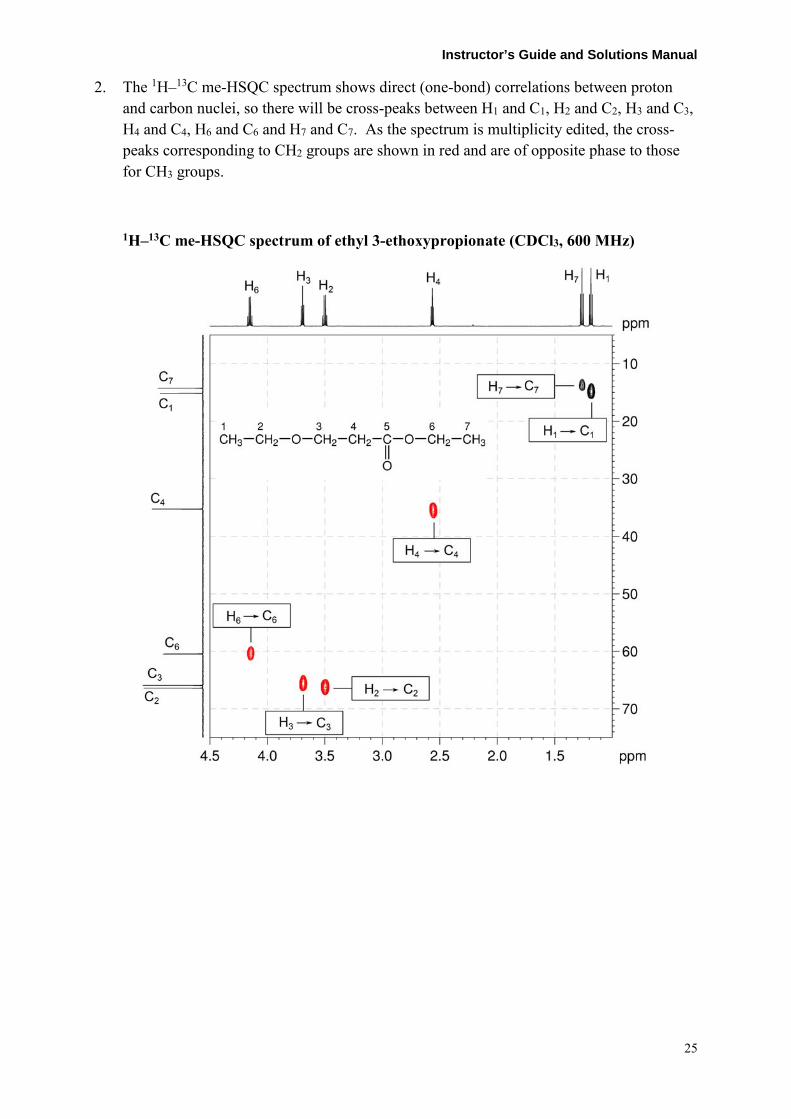
Instructor’s Guide and Solutions Manual 2. The 1H–13C me-HSQC spectrum shows direct (one-bond) correlations between proton
and carbon nuclei, so there will be cross-peaks between H1 and C1, H2 and C2, H3 and C3, H4 and C4, H6 and C6 and H7 and C7. As the spectrum is multiplicity edited, the cross-peaks corresponding to CH2 groups are shown in red and are of opposite phase to those for CH3 groups.
1H–13C me-HSQC spectrum of ethyl 3-ethoxypropionate (CDCl3, 600 MHz)
25

Organic Structures from 2D NMR Spectra 3. In HMBC spectra, remember that, for alkyl systems, both two- and three-bond couplings
can give rise to strong cross-peaks.
1H–13C HMBC spectrum of ethyl 3-ethoxypropionate (CDCl3, 600 MHz)
26

Instructor’s Guide and Solutions Manual 4. H1 correlates to C2 only. H2 correlates to C1 and C3. H3 correlates to C2, C4 and C5. H4
correlates to C3 and C5. H6 correlates to C5 and C7. H7 correlates to C6 only.
1H–13C HMBC spectrum of ethyl 3-ethoxypropionate – expansion A
27

Organic Structures from 2D NMR Spectra
Problem 6
Question:
The 1H and 13C{1H} NMR spectra of 4-acetylbutyric acid (C6H10O3) recorded in CDCl3 solution at 298 K and 600 MHz are given below.
The 1H NMR spectrum has signals at δ 1.81, 2.08, 2.31, 2.47 and 10.5 ppm.
The 13C{1H} NMR spectrum has signals at δ 18.5, 29.8, 32.9, 42.2, 178.8 and 208.6 ppm.
The 2D me-1H–13C HSQC and 1H–13C HMBC spectra are given on the following pages. Use these spectra to assign the 1H and 13C{1H} resonances for this compound.
Solution:
4-Acetylbutyric Acid
Proton Chemical Shift (ppm) Carbon Chemical Shift (ppm)
C1 178.8
H2 2.31 C2 32.9
H3 1.81 C3 18.5
H4 2.47 C4 42.2
C5 208.6
H6 2.08 C6 29.8
OH 10.5
1. The methyl group (H6, singlet at 2.08 ppm) and the –OH proton (10.5 ppm, exchangeable) may be easily identified from the 1H NMR spectrum. The triplet resonances (at 2.31 and 2.47 ppm) correspond to H2 and H4 but cannot be assigned by inspection. The more complex resonance at 1.81 ppm must correspond to H3 since the multiplet structure shows it has more than two neighbouring protons.
28

Instructor’s Guide and Solutions Manual
1H NMR spectrum of 4-acetylbutyric acid (CDCl3, 600 MHz)
2. The signals corresponding to the ketone (C5, 208.6 ppm) and the carboxylic acid (C1, 178.8 ppm) in the 13C{1H} NMR spectrum can be assigned by inspection.
13C{1H} NMR spectrum of 4-acetylbutyric acid (CDCl3, 150 MHz)
29

Organic Structures from 2D NMR Spectra 3. The 1H–13C me-HSQC spectrum easily identifies the protonated carbon resonances: C3 at
18.5, and C6 at 29.8 ppm. The proton resonance at 2.31 ppm correlates to the 13C resonance at 32.9 ppm, and the 1H resonance at 2.47 ppm correlates to the 13C resonance at 42.2 ppm.
1H–13C me-HSQC spectrum of 4-acetylbutyric acid (CDCl3, 600 MHz)
30

Instructor’s Guide and Solutions Manual 4. Remember that, in HMBC spectra, two- and three-bond correlations are generally
strongest in aliphatic systems.
5. In the 1H–13C HMBC spectrum, H6 correlates to the ketone carbon (C5, a two-bond correlation), as well as the resonance at 42.2 ppm. This correlation must be the three-bond correlation to C4, and so we can assign the resonances at 2.47 and 42.2 ppm to H4 and C4, respectively. The newly assigned H4 shows a strong correlation to C5, confirming its assignment.
6. H2 must therefore be the resonance at 2.31 ppm, and C2 the resonance at 32.9 ppm.
7. In the HMBC spectrum, H2 correlates strongly to C1, confirming its assignment.
1H–13C HMBC spectrum of 4-acetylbutyric acid (CDCl3, 600 MHz)
31

Organic Structures from 2D NMR Spectra
Problem 7
Question:
Identify the following compound.
Molecular Formula: C5H9ClO2
Solution:
3-Ethoxypropionyl chloride
1. The molecular formula is C5H9ClO2. Calculate the degree of unsaturation from the molecular formula: replace the Cl with H and ignore the O atoms to give an effective molecular formula of C5H10 (CnHm) which gives the degree of unsaturation as (n − m/2 + 1) = 5 – 5 + 1 = 1. The compound contains one ring or one functional group containing a double bond.
2. The 13C{1H} spectrum establishes that the compound contains a carbonyl group (13C resonance at 171.9 ppm). This accounts for all of the degrees of unsaturation, so the compound contains no additional rings or multiple bonds.
1H NMR spectrum of 3-ethoxypropionyl chloride (CDCl3, 500 MHz)
13C{1H} NMR spectrum of 3-ethoxypropionyl chloride (CDCl3, 125 MHz)
32
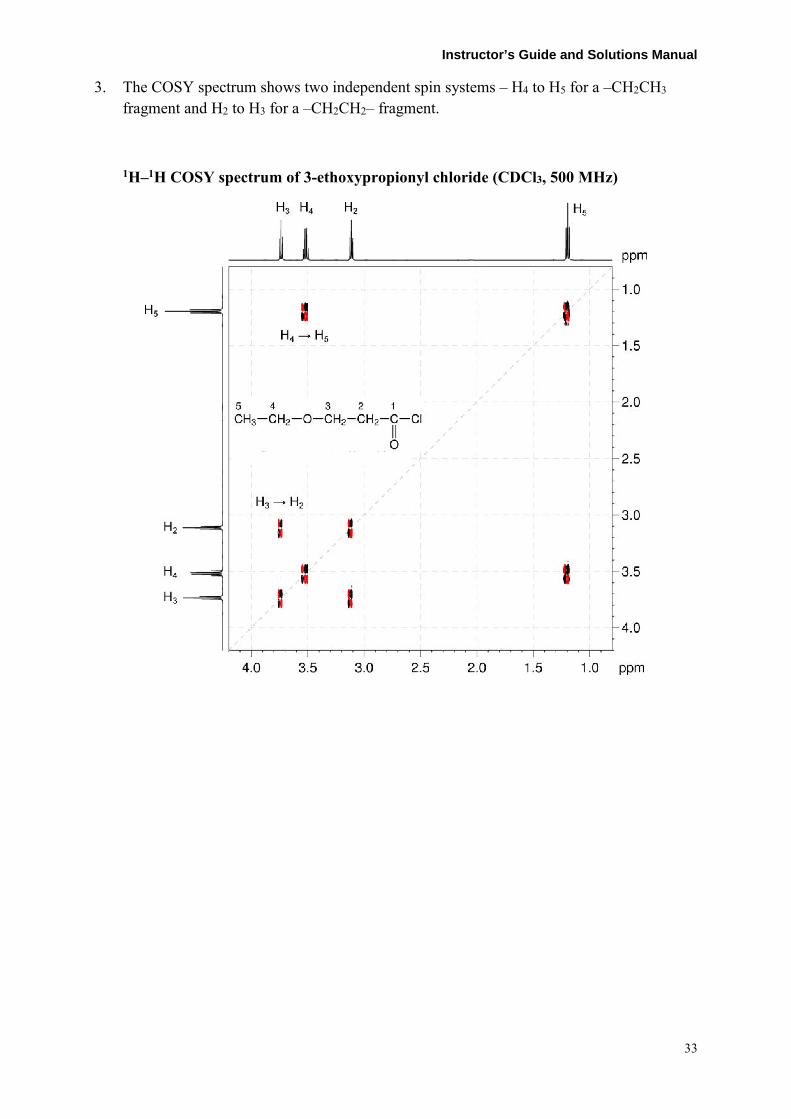
Instructor’s Guide and Solutions Manual 3. The COSY spectrum shows two independent spin systems – H4 to H5 for a –CH2CH3
fragment and H2 to H3 for a –CH2CH2– fragment.
1H–1H COSY spectrum of 3-ethoxypropionyl chloride (CDCl3, 500 MHz)
33

Organic Structures from 2D NMR Spectra 4. In the me-HSQC spectrum, the downfield 1H and 13C chemical shifts of H3/C3 and H4/C4
indicate that C3 and C4 are bound to either oxygen or chlorine.
1H–13C me-HSQC spectrum of 3-ethoxypropionyl chloride (CDCl3, 500 MHz)
5. There are two possible isomers:
34

Instructor’s Guide and Solutions Manual 6. In the HMBC spectrum, the correlations from H2 and H3 to C1 indicate that the
–CH2CH2– fragment is bound to the carbonyl group. The H3 → C4 and H4 → C3 correlations indicate an interaction between the two spin systems. These correlations would be absent in Isomer A thus Isomer B is the correct answer.
1H–13C HMBC spectrum of 3-ethoxypropionyl chloride (CDCl3, 500 MHz)
35

Organic Structures from 2D NMR Spectra
Problem 8
Question:
Identify the following compound.
Molecular Formula: C5H9ClO2
Solution:
Ethyl 3-chloropropionate
1. The molecular formula is C5H9ClO2. Calculate the degree of unsaturation from the molecular formula: replace the Cl with H and ignore the O atoms to give an effective molecular formula of C5H10 (CnHm) which gives the degree of unsaturation as (n – m/2 + 1) = 5 – 5 + 1 = 1. The compound contains one ring or one functional group containing a double bond.
2. The 13C{1H} spectrum establishes the presence of a carbonyl group (13C resonance at 170.3 ppm). This accounts for all of the degrees of unsaturation, so the compound contains no additional rings or multiple bonds.
1H NMR spectrum of ethyl 3-chloropropionate (CDCl3, 500 MHz)
13C{1H} NMR spectrum of ethyl 3-chloropropionate (CDCl3, 125 MHz)
36

Instructor’s Guide and Solutions Manual 3. The COSY spectrum shows two independent spin systems – H4 to H5 for a –CH2CH3
fragment and H2 to H3 for a –CH2CH2– fragment.
1H–1H COSY spectrum of ethyl 3-chloropropionate (CDCl3, 500 MHz)
37

Organic Structures from 2D NMR Spectra 4. In the me-HSQC spectrum, the 1H and 13C chemical shifts of H4 / C4 indicate that C4 is
bound to an oxygen atom.
1H–13C me-HSQC spectrum of ethyl 3-chloropropionate (CDCl3, 500 MHz)
38

Instructor’s Guide and Solutions Manual 5. The HMBC spectrum shows correlations from H4 to C1 indicating that the carbonyl group
must be part of an ester. Correlations from H2 and H3 to C1 indicate that the –CH2CH2– fragment is bound to the carbonyl group leaving the Cl atom to be bound to the other end of the –CH2CH2– fragment.
6. The 1H and 13C chemical shifts of H3 / C3 are consistent with those for a CH2–Cl group.
1H–13C HMBC spectrum of ethyl 3-chloropropionate (CDCl3, 500 MHz)
39

Organic Structures from 2D NMR Spectra
Problem 9
Question:
The 1H and 13C{1H} NMR spectra of isoamyl acetate (C7H14O2) recorded in CDCl3 solution at 298 K and 600 MHz are given below.
The 1H NMR spectrum has signals at δ 0.92 (H6), 1.52 (H4), 1.69 (H5), 2.04 (H1) and 4.09 (H3) ppm.
The 13C{1H} NMR spectrum has signals at δ 21.0 (C1), 22.5 (C6), 25.1 (C5), 37.4 (C4), 63.1 (C3) and 171.2 (C2) ppm.
Also given on the following pages are the 1H–1H COSY, 1H–13C me-HSQC, 1H–13C HMBC and INADEQUATE spectra. For each 2D spectrum, indicate which correlation gives rise to each cross-peak by placing an appropriate label in the box provided.
Solution:
Isoamyl acetate
40

Instructor’s Guide and Solutions Manual 1. 1H–1H COSY spectra show which pairs of protons are coupled to each other. The COSY
spectrum is always symmetrical about a diagonal. In the COSY spectrum, there are three 3JH–H correlations above the diagonal (H3 → H4; H5 → H4; and H5 → H6). There are no long-range correlations.
1H–1H COSY spectrum of isoamyl acetate (CDCl3, 600 MHz)
41

Organic Structures from 2D NMR Spectra 2. The 1H–13C me-HSQC spectrum shows direct (one-bond) correlations between proton
and carbon nuclei, so there will be cross-peaks between H1 and C1, H3 and C3, H4 and C4, H5 and C5 and also between H6 and C6. As the spectrum is multiplicity edited, the cross-peaks corresponding to CH2 groups are shown in red and are of opposite phase to those for CH and CH3 groups.
1H–13C me-HSQC spectrum of isoamyl acetate (CDCl3, 600 MHz)
42

Instructor’s Guide and Solutions Manual 3. In HMBC spectra, remember that, for alkyl systems, both two- and three-bond couplings
can give rise to strong cross-peaks.
1H–13C HMBC spectrum of isoamyl acetate (CDCl3, 600 MHz)
4. H1 correlates to C2 only. H3 correlates to C2, C4 and C5. H4 correlates to C3, C5 and C6. H5 correlates to C6 only. The expected correlations between H5 and C4 and H5 and C3 are absent from the spectrum.
5. H6 correlates to C5. The expected correlation between H6 and C4 is absent from the spectrum. There is also a correlation between H6 and C6'. While this appears to be a one-bond correlation, in gem-dimethyl groups, the apparent one-bond correlation arises from the 3JC–H interaction of the protons of one of the methyl groups with the chemically equivalent carbon which is three bonds away.
43

Organic Structures from 2D NMR Spectra 6. The INADEQUATE spectrum shows one-bond 13C–13C connectivity. There are
correlations between C1 and C2, C3 and C4, C4 and C5 and also between C5 and C6. There are no correlations between C2 and C3 because of the presence of the oxygen bridge.
INADEQUATE spectrum of isoamyl acetate (CDCl3, 150 MHz)
44

Instructor’s Guide and Solutions Manual
Problem 10
Question:
The 1H and 13C{1H} NMR spectra of trans-4-hexen-3-one (C6H10O) recorded in DMSO-d6 solution at 298 K and 400 MHz are given below.
The 1H NMR spectrum has signals at δ 0.96 (H1), 1.86 (H6), 2.56 (H2), 6.11 (H4) and 6.85 (H5) ppm.
The 13C{1H} NMR spectrum has signals at δ 8.4 (C1), 18.4 (C6), 32.6 (C2), 131.9 (C4), 142.8 (C5) and 200.4 (C3) ppm.
Also given on the following pages are the 1H–1H COSY, 1H–13C me-HSQC, 1H–13C HMBC and 1H–1H NOESY spectra. For each 2D spectrum, indicate which correlation gives rise to each cross-peak by placing an appropriate label in the box provided.
Solution:
trans-4-Hexen-3-one
45

Organic Structures from 2D NMR Spectra 1. 1H–1H COSY spectra show which pairs of protons are coupled to each other. The COSY
spectrum is always symmetrical about a diagonal. In the COSY spectrum, there are four 3JH–H correlations above the diagonal (H2 → H1; H4 → H2; H5 → H4; and H5 → H6).
1H–1H COSY spectrum of trans-4-hexen-3-one (DMSO-d6, 400 MHz)
46

Instructor’s Guide and Solutions Manual 2. The 1H–13C me-HSQC spectrum shows direct (one-bond) correlations between proton
and carbon nuclei, so there will be cross-peaks between H1 and C1, H2 and C2, H4 and C4, H5 and C5 and also between H6 and C6. As the spectrum is multiplicity edited, the cross-peaks corresponding to CH2 groups are shown in red and are of opposite phase to those for CH and CH3 groups.
1H–13C me-HSQC spectrum of trans-4-hexen-3-one (DMSO-d6, 400 MHz)
47

Organic Structures from 2D NMR Spectra 3. In HMBC spectra, remember that, for alkyl systems, both two- and three-bond couplings
can give rise to strong cross-peaks.
1H–13C HMBC spectrum of trans-4-hexen-3-one (DMSO-d6, 400 MHz)
4. H1 correlates to C2 and C3. H2 correlates to C1, C3 and C5. H4 correlates to C2, C3 and C6. H5 correlates to C3, C4 and C6. H6 correlates to C3, C4 and C5. Note that the H2 → C5 and H6 → C3 correlations are long-range four-bond couplings. The possible H2 → C4, H4 → C5 and H5 → C4 correlations are absent from the spectrum.
5. Note that the one-bond couplings between H1 and C1, H4 and C4, H5 and C5, and H6 and C6 are visible in the HMBC spectrum as large doublets.
48

Instructor’s Guide and Solutions Manual 6. 1H–1H NOESY spectra show the pairs of protons which are close together in space. The
NOESY spectrum is always symmetrical about the diagonal. In the NOESY spectrum, there are six correlations above the diagonal (H2 → H1, H4 → H2, H5 → H2, H5 → H4, H4 → H6 and H5 → H6).
7. The H4 → H2 / H6 and H5 → H2 / H6 correlations clearly indicate the trans geometry of the alkene functional group in the molecule. The H4 → H6 and H5 → H2 correlations would be absent if the alkene group was of cis geometry.
1H–1H NOESY spectrum of trans-4-hexen-3-one (DMSO-d6, 400 MHz)
49

Organic Structures from 2D NMR Spectra
Problem 11
Question:
Identify the following compound.
Molecular Formula: C8H14O
IR: 1698, 1638 cm−1
Solution:
trans-2-Octen-4-one
1. The molecular formula is C8H14O. Calculate the degree of unsaturation from the molecular formula: ignore the O atom to give an effective molecular formula of C8H14 (CnHm) which gives the degree of unsaturation as (n – m/2 + 1) = 8 – 7 + 1 = 2. The compound contains a combined total of two rings and/or π bonds.
2. 1D NMR data establish the presence of an alkene (1H resonances at 6.85 and 6.10 ppm; 13C resonances at 142.5 and 131.7 ppm) and a ketone functional group (13C resonance at 199.6 ppm). This accounts for all of the degrees of unsaturation, so the compound contains no additional rings or multiple bonds.
3. The 1H NMR and me-HSQC spectra further establish the presence of two –CH3 and three –CH2 groups.
1H NMR spectrum of trans-2-octen-4-one (DMSO-d6, 400 MHz)
50

Instructor’s Guide and Solutions Manual
13C{1H} NMR spectrum of trans-2-octen-4-one (DMSO-d6, 100 MHz)
4. The COSY spectrum shows two independent spin systems – H8 to H7 to H6 to H5 for a CH3CH2CH2CH2– fragment and H1 to H2 to H3 for a CH3CH=CH– fragment.
1H–1H COSY spectrum of trans-2-octen-4-one (DMSO-d6, 400 MHz)
51

Organic Structures from 2D NMR Spectra 5. The 1H–13C me-HSQC spectrum easily identifies the protonated carbon resonances (C1,
C2, C3, C5, C6, C7 and C8).
1H–13C me-HSQC spectrum of trans-2-octen-4-one (DMSO-d6, 400 MHz)
52

Instructor’s Guide and Solutions Manual 6. The HMBC spectrum shows strong correlations from H2, H5 and H6 to C4 indicating that
the ketone functional group must be located between the CH3CH=CH– and CH3CH2CH2CH2– fragments to afford CH3CH=CHC(O)CH2CH2CH2CH3.
7. The expected H2 → C3, H3 → C2, H3 → C5 and H5 → C3 correlations are absent from the HMBC spectrum. Note that the H1 → C4 correlation is a long-range four-bond coupling. All other correlations are consistent with the structure.
1H–13C HMBC spectrum of trans-2-octen-4-one (DMSO-d6, 400 MHz)
53

Organic Structures from 2D NMR Spectra 8. 1H–1H NOESY spectra show pairs of protons which are close together in space.
9. The NOESY spectrum shows correlations from H2 to H1 / H5 and correlations from H3 to H1 / H5 indicating that the alkene protons H2 and H3 are trans to each other across the double bond. If the alkene protons were cis to one another, the H2→H5 and H3→H1 correlations would be absent.
1H–1H NOESY spectrum of trans-2-octen-4-one (DMSO-d6, 400 MHz)
54

Instructor’s Guide and Solutions Manual
Problem 12
Question:
The 1H and 13C{1H} NMR spectra of 3-nitrobenzaldehyde (C7H5NO3) recorded in CDCl3 solution at 298 K and 500 MHz are given below.
The 1H NMR spectrum has signals at δ 7.82 (H5), 8.28 (H6), 8.51 (H4), 8.73 (H2) and 10.15 (H7) ppm.
The 13C{1H} NMR spectrum has signals at δ 124.4 (C2), 128.6 (C4), 130.5 (C5), 134.8 (C6), 137.5 (C1), 148.8 (C3) and 189.9 (C7) ppm.
Also given on the following pages are the 1H–1H COSY, 1H–13C me-HSQC, 1H–13C HMBC, 1H–1H NOESY and INADEQUATE spectra. For each 2D spectrum, indicate which correlation gives rise to each cross-peak by placing an appropriate label in the box provided.
Solution:
3-Nitrobenzaldehyde
55

Organic Structures from 2D NMR Spectra 1. 1H–1H COSY spectra show coupled sets of protons, and are symmetrical about a
diagonal. In this COSY spectrum, there are two 3JH–H correlations above the diagonal (H4 → H5; H6 → H5), and three 4JH–H correlations (H2 → H4; H2 → H6; H4 → H6).
1H–1H COSY spectrum of 3-nitrobenzaldehyde (CDCl3, 500 MHz)
56

Instructor’s Guide and Solutions Manual 2. The 1H–13C me-HSQC spectrum shows direct (one-bond) correlations between proton
and carbon nuclei, so there will be cross-peaks between H2 and C2, H4 and C4, H5 and C5, H6 and C6 and also between H7 and C7. There are no negative (red) cross-peaks in the spectrum as there are no CH2 groups.
1H–13C me-HSQC spectrum of 3-nitrobenzaldehyde (CDCl3, 500 MHz)
57

Organic Structures from 2D NMR Spectra 3. In HMBC spectra, remember that, for aromatic systems, the three-bond coupling 3JC–H is
typically the larger long-range coupling and gives rise to the strongest cross-peaks.
1H–13C HMBC spectrum of 3-nitrobenzaldehyde (CDCl3, 500 MHz)
4. H2 has correlations to C3, C4, C6 and C7. H4 correlates to C2 and C6. H5 correlates to C1 and C3. H6 correlates to C2, C4 and C7.
5. H7 correlates to C1 (the ipso carbon), C2 and C6. The correlation between H7 and C1 appears as a doublet due to the unusually large 2JC–H found for aldehydes (~25 Hz).
58

Instructor’s Guide and Solutions Manual 6. 1H–1H NOESY spectra show cross-peaks (off-diagonal peaks) at positions where a proton
whose resonance appears on the horizontal axis is close in space to another whose resonance appears on the vertical axis.
7. H7 correlates to H2 and H6, H4 correlates to H5 and H6 correlates to H5.
1H–1H NOESY spectrum of 3-nitrobenzaldehyde (DMSO-d6, 400 MHz)
59

Organic Structures from 2D NMR Spectra 8. The INADEQUATE spectrum shows direct 13C–13C connectivity. There are correlations
between C1 and C2, C2 and C3, C3 and C4, C4 and C5, C5 and C6, C1 and C6, and also between C1 and C7.
INADEQUATE spectrum of 3-nitrobenzaldehyde (CDCl3, 150 MHz)
60

Instructor’s Guide and Solutions Manual
Problem 13
Question:
The 1H and 13C{1H} NMR spectra of 3-iodotoluene (C7H6I) recorded in CDCl3 solution at 298 K and 600 MHz are given below.
The 1H NMR spectrum has signals at δ 2.28 (H7), 6.96 (H5), 7.11 (H6), 7.48 (H4) and 7.53 (H2) ppm.
The 13C{1H} NMR spectrum has signals at δ 21.0, 94.3, 128.3, 129.9, 134.4, 138.0 and 140.2 ppm.
Use the me-HSQC spectrum to assign the protonated carbon signals, and then use this information to produce a schematic HMBC spectrum, showing where all of the cross-peaks would be.
Solution:
3-Iodotoluene
1. The assignments for the 1H NMR spectrum are given.
1H NMR spectrum of 3-iodotoluene (CDCl3, 600 MHz)
61

Organic Structures from 2D NMR Spectra 2. The 1H–13C me-HSQC easily identifies the protonated carbon resonances: C2 at 138.0, C4
at 134.4, C5 at 129.9, C6 at 128.3 and C7 at 21.0 ppm.
3. The non-protonated carbon resonances are therefore those at 94.3 and 140.2 ppm. Based on the chemical shifts, C3 is the high-field resonance (94.3 ppm) and C1 the low-field resonance (140.2 ppm).
1H–13C me-HSQC spectrum of 3-iodotoluene (CDCl3, 600 MHz)
62

Instructor’s Guide and Solutions Manual 4. Remember that, in aromatic systems, the three-bond coupling 3JC–H is typically the larger
long-range coupling and gives rise to the strongest cross-peaks. Benzylic protons typically correlate to the ipso carbon (two-bond correlation) and the ortho carbons (three-bond correlations).
5. Beginning with the methyl protons (H7) we would expect correlations to the ipso carbon (C1) and the two carbon atoms ortho to the methyl substituent – C2 and C6.
6. H2 will correlate to the carbon nuclei three bonds removed (i.e. meta): C4 and C6. There is also a three-bond correlation to C7 (the benzylic carbon).
7. H4 will correlate to the meta carbon nuclei: C2 and C6.
8. H5 will correlate to the meta carbon nuclei: C1 and C3.
9. H6 will correlate to the meta carbon nuclei: C2 and C4. There is also a three-bond correlation to C7 (the benzylic carbon).
Predicted 1H–13C HMBC spectrum of 3-iodotoluene (CDCl3, 600 MHz)
63

Organic Structures from 2D NMR Spectra
Problem 14
Question:
The 1H and 13C{1H} NMR spectra of 8-hydroxy-5-nitroquinoline (C9H6N2O3) recorded in DMSO-d6 solution at 298 K and 400 MHz are given below.
The 1H NMR spectrum has signals at δ 7.14 (H7), 7.82 (H3), 8.48 (H6), 8.97 (H2) and 9.08 (H4) ppm. The hydroxyl proton is not shown.
The 13C{1H} NMR spectrum has signals at δ 110.0 (C7), 122.5 (C10), 125.2 (C3), 129.1 (C6), 132.4 (C4), 135.0 (C5), 137.2 (C9), 149.1 (C2) and 160.7 (C8) ppm.
Also given on the following pages are the 1H–1H COSY, 1H–13C me-HSQC, 1H–13C HMBC and INADEQUATE spectra. For each 2D spectrum, indicate which correlation gives rise to each cross-peak by placing an appropriate label in the box provided.
Solution:
8-Hydroxy-5-nitroquinoline
64

Instructor’s Guide and Solutions Manual 1. 1H–1H COSY spectra show coupled sets of protons, and are symmetrical about a
diagonal. In this COSY spectrum, there are three 3JH–H correlations above the diagonal (H2 → H3; H4 → H3; H6 → H7), and one 4JH–H between H2 and H4.
1H–1H COSY spectrum of 8-hydroxy-5-nitroquinoline (DMSO-d6, 400 MHz)
65

Organic Structures from 2D NMR Spectra 2. The 1H–13C me-HSQC spectrum shows direct (one-bond) correlations between proton
and carbon nuclei, so there will be cross-peaks between H2 and C2, H3 and C3, H4 and C4, H6 and C6 and also between H7 and C7.
1H–13C me-HSQC spectrum of 8-hydroxy-5-nitroquinoline (DMSO-d6, 400 MHz)
66

Instructor’s Guide and Solutions Manual 3. In HMBC spectra, remember that, for aromatic systems, the three-bond coupling 3JC–H is
typically the larger long-range coupling and gives rise to the strongest cross-peaks.
4. H2 has correlations to C3, C4 and C9. H3 correlates to C2 and C10. H4 correlates to C2, C5 and C9.
5. H6 correlates to C5, C8 and C10. H7 correlates to C5, C8 and C9.
1H–13C HMBC spectrum of 8-hydroxy-5-nitroquinoline (DMSO-d6, 400 MHz)
67

Organic Structures from 2D NMR Spectra 6. The INADEQUATE spectrum shows direct 13C–13C connectivity. There are correlations
between C2 and C3, C3 and C4, C4 and C10, C5 and C10, C5 and C6, C6 and C7, C7 and C8, C8 and C9 and also between C9 and C10.
INADEQUATE spectrum of 8-hydroxy-5-nitroquinoline (DMSO-d6, 151 MHz)
68

Instructor’s Guide and Solutions Manual
Problem 15
Question:
Identify the following compound.
Molecular Formula: C6H6BrN
Solution:
2-Bromo-3-methylpyridine
(2-Bromo-3-picoline)
1. The molecular formula is C6H6BrN. Calculate the degree of unsaturation from the molecular formula: replace Br with H, ignore the N atom and remove one H to give an effective molecular formula of C6H6 (CnHm) which gives the degree of unsaturation as (n – m/2 + 1) = 6 – 3 + 1 = 4. The compound contains a combined total of four rings and/or π bonds.
2. The 1H NMR spectrum shows a methyl group (at 2.38 ppm), and three aromatic signals. This accounts for all the hydrogen atoms in the molecular formula and also means that the aromatic ring must contain the N. The chemical shift of one of the aromatic signals (8.19 ppm, H6) places it adjacent to a nitrogen atom in a pyridine ring.
3. The large coupling constants for each aromatic signal (7.5 and 4.9 Hz) indicate that the three protons are immediately adjacent to one another. The signal at 7.17 ppm is a doublet of doublets indicating it belongs to the aromatic proton located between the other two protons (H5). The remaining signal at 7.52 ppm must be due to H4.
1H NMR spectrum of 2-bromo-3-picoline (CDCl3, 600 MHz)
1H NMR spectrum of 2-bromo-3-picoline – expansion
69

Organic Structures from 2D NMR Spectra 13C{1H} NMR spectrum of 2-bromo-3-picoline (CDCl3, 150 MHz)
4. The protonated carbon resonances can be identified using the me-HSQC spectrum: C6 at 147.4 ppm, C5 at 122.8 ppm, C4 at 138.7 ppm and the methyl carbon (C7) at 22.0 ppm.
1H–13C me-HSQC spectrum of 2-bromo-3-picoline (CDCl3, 600 MHz)
70

Instructor’s Guide and Solutions Manual 5. There are two possible candidates:
6. The HMBC spectrum can be used to differentiate between the two isomers: there is a strong correlation between H4 and the methyl group carbon (C7). In Isomer A, this would be a four-bond correlation, while in Isomer B this would be a three-bond correlation. Remember that in aromatic systems, it is the three-bond coupling that is the largest, both around the ring and to benzylic carbon atoms. Isomer A is therefore eliminated as a possibility, and Isomer B is identified as the correct structure.
1H–13C HMBC spectrum of 2-bromo-3-picoline (CDCl3, 600 MHz)
7. The non-protonated carbon atoms can also be identified: C3 at 135.2 ppm (H5 → C3) and C2 at 144.7 ppm (H4 → C2).
71

Organic Structures from 2D NMR Spectra
Problem 16
Question:
The 1H NMR spectrum of trans-anethole (C10H12O) recorded in CDCl3 solution at 298 K and 400 MHz is given below.
The 1H NMR spectrum has signals at δ 1.82 (dd, J = 6.6, 1.7 Hz, 3H, H1), 3.71 (s, 3H, H8), 6.04 (dq, J = 15.8, 6.6 Hz, 1H, H2), 6.30 (dq, J = 15.8, 1.7 Hz, 1H, H3), 6.78 (m, 2H, H6) and 7.21 (m, 2H, H5) ppm.
Use this information to produce schematic diagrams of the COSY and NOESY spectra, showing where all of the cross-peaks and diagonal peaks would be.
Solution:
trans-Anethole
1. The assignments for the 1H NMR spectrum are given.
1H NMR spectrum of trans-anethole (CDCl3, 400 MHz)
72

Instructor’s Guide and Solutions Manual 2. The COSY spectrum has peaks on the diagonal for each unique spin, so the spectrum will
contain six diagonal peaks – one at the chemical shift of each resonance in the spectrum.
3. COSY spectra show cross-peaks (off-diagonal peaks) at positions where a proton whose resonance appears on the horizontal axis is directly coupled to another whose resonance appears on the vertical axis.
4. For trans-anethole, H5 and H6 are coupled to each other and cross-peaks are expected between them.
5. H2 and H3 are also coupled to each other and cross-peaks are expected between them.
6. H1 is coupled to both H2 and H3 thus cross-peaks are also expected for H1–H2 and H1–H3. The H1–H3 coupling constant is small and the cross-peaks may appear weaker in intensity.
7. Remember that a COSY spectrum is symmetrical about the diagonal, so the cross-peaks on one side of the diagonal must be reflected on the other side of the diagonal.
Predicted 1H–1H COSY spectrum of trans-anethole (CDCl3, 400 MHz)
73
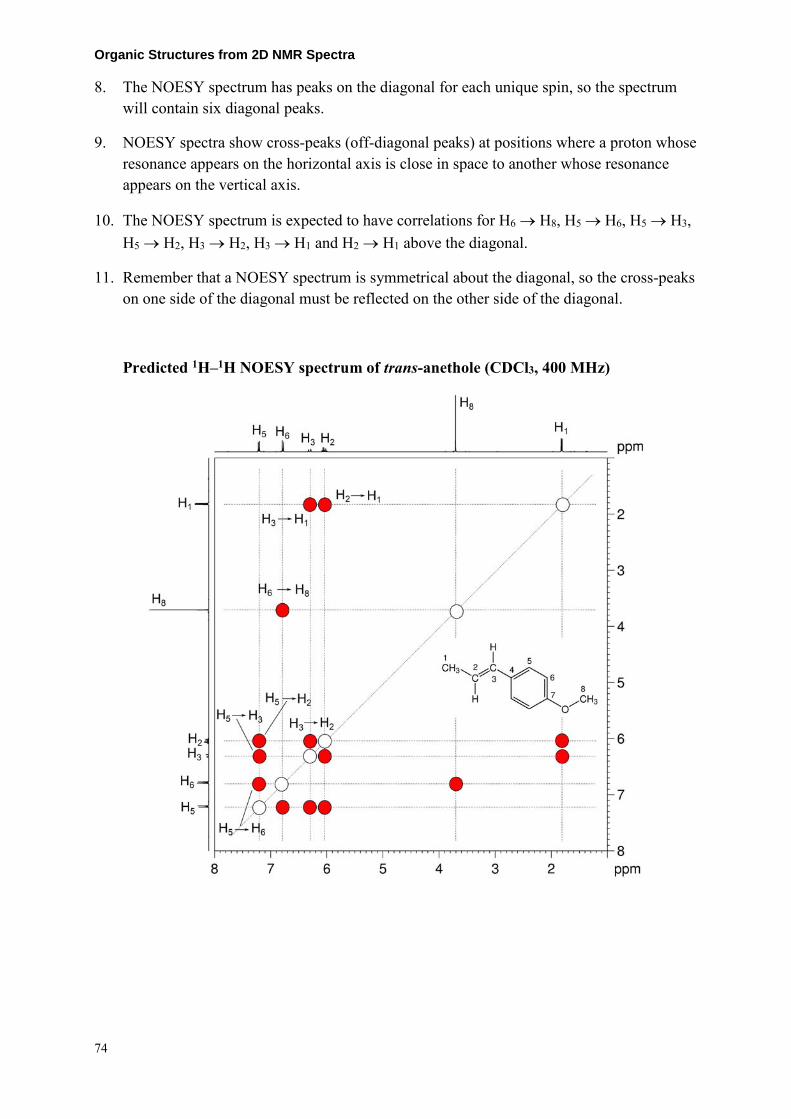
Organic Structures from 2D NMR Spectra 8. The NOESY spectrum has peaks on the diagonal for each unique spin, so the spectrum
will contain six diagonal peaks.
9. NOESY spectra show cross-peaks (off-diagonal peaks) at positions where a proton whose resonance appears on the horizontal axis is close in space to another whose resonance appears on the vertical axis.
10. The NOESY spectrum is expected to have correlations for H6 → H8, H5 → H6, H5 → H3, H5 → H2, H3 → H2, H3 → H1 and H2 → H1 above the diagonal.
11. Remember that a NOESY spectrum is symmetrical about the diagonal, so the cross-peaks on one side of the diagonal must be reflected on the other side of the diagonal.
Predicted 1H–1H NOESY spectrum of trans-anethole (CDCl3, 400 MHz)
74

Instructor’s Guide and Solutions Manual
Problem 17
Question:
Identify the following compound.
Molecular Formula: C5H10
Solution:
cis-2-Pentene
1. The molecular formula is C5H10. Calculate the degree of unsaturation: the effective molecular formula is C5H10 (CnHm) which gives the degree of unsaturation as (n – m/2 + 1) = 5 – 5 + 1 = 1. The compound contains one ring or one functional group containing a double bond.
2. The 1H NMR and me-HSQC spectra establish the presence of two CH3 groups, one CH2 group and two alkene =CH groups. The alkene group accounts for all of the degrees of unsaturation, so the compound contains no additional rings or multiple bonds.
1H NMR spectrum of cis-2-pentene (CDCl3, 400 MHz)
13C{1H} NMR spectrum of cis-2-pentene (CDCl3, 100 MHz)
75

Organic Structures from 2D NMR Spectra 3. In the COSY spectrum, the H4–H5 and H3–H4 correlations afford the =CHCH2CH3
fragment. The H1–H2 correlation affords the CH3–CH= fragment. Combining the two fragments affords CH3–CH=CH–CH2CH3.
1H–1H COSY spectrum of cis-2-pentene (CDCl3, 400 MHz)
76

Instructor’s Guide and Solutions Manual 4. The resonances for C1, C4 and C5 can be assigned using the me-HSQC spectrum. Note
that although C2 and C3 cannot be assigned based on the information provided, the structure of the molecule can still be solved.
1H–13C me-HSQC spectrum of cis-2-pentene (CDCl3, 400 MHz)
77

Organic Structures from 2D NMR Spectra 5. The geometry of the double bond can be deduced from the NOESY spectrum. In
particular the H4–H1 correlation places the CH2 (H4) and CH3 (H1) groups on the same side of the double bond and thus gives a cis geometry for the molecule.
1H–1H NOESY spectrum of cis-2-pentene (DMSO-d6, 400 MHz)
78

Instructor’s Guide and Solutions Manual
Problem 18
Question:
Identify the following compound.
Molecular Formula: C14H12O2
IR: 1720 cm−1
Solution:
p-Tolyl benzoate
1. The molecular formula is C14H12O2. Calculate the degree of unsaturation from the molecular formula: ignore the O atoms to give an effective molecular formula of C14H12 (CnHm) which gives the degree of unsaturation as (n – m/2 + 1) = 14 – 6 + 1 = 9. The compound contains a combined total of nine rings and/or π bonds.
2. The 1H NMR spectrum indicates that the compound has nine aromatic protons and three aliphatic protons.
3. The presence of nine aromatic protons suggests two aromatic rings.
4. The three aliphatic protons are equivalent and have no visible splitting so these must be an isolated methyl group.
5. IR and 1D NMR spectra establish that the compound is an ester (quaternary 13C resonance at 165.3 ppm).
6. The presence of two aromatic rings and an ester carbonyl satisfies the degree of unsaturation, so there are no more functional groups with double bonds or rings.
7. The methyl resonance in the 1H and 13C spectra (at 2.36 and 20.9 ppm, respectively) eliminates the possibility of a methyl ester, since for a methoxy group both the 1H and 13C signals would appear significantly further downfield.
8. The 1H NMR spectrum shows five unique signals in the aromatic region.
79

Organic Structures from 2D NMR Spectra
1H NMR spectrum of p-tolyl benzoate (CDCl3, 500 MHz)
13C{1H} NMR spectrum of p-tolyl benzoate (CDCl3, 125 MHz)
13C{1H} NMR spectrum of p-tolyl benzoate – expansion
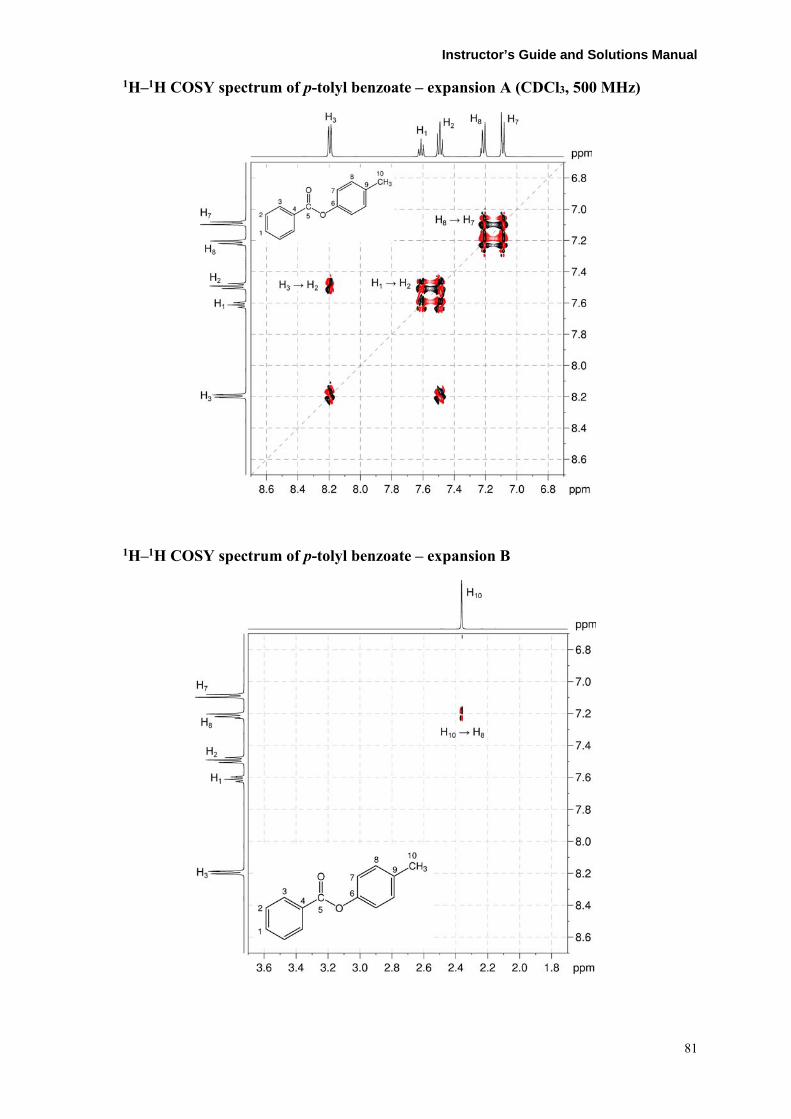
9. The 1H–1H COSY spectrum shows that the resonances at 7.21 and 7.09 ppm are coupled. The coupling pattern of these two signals is consistent with a para-disubstituted benzene. The five protons in the three remaining signals (at 8.20, 7.61 and 7.49 ppm for H3, H1 and H2, respectively) constitute a separate, single spin system. The coupling pattern of these three signals is consistent with a mono-substituted benzene ring.
80
Instructor’s Guide and Solutions Manual
1H–1H COSY spectrum of p-tolyl benzoate – expansion A (CDCl3, 500 MHz)
1H–1H COSY spectrum of p-tolyl benzoate – expansion B
81
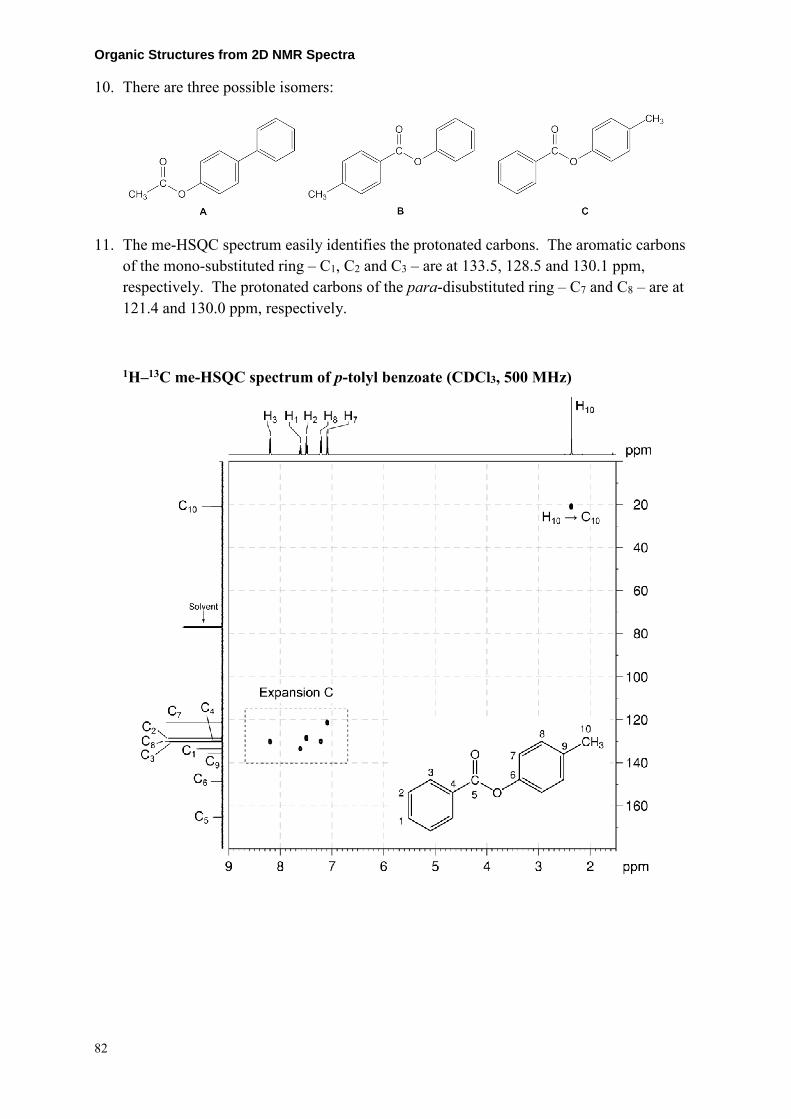
Organic Structures from 2D NMR Spectra 10. There are three possible isomers:
11. The me-HSQC spectrum easily identifies the protonated carbons. The aromatic carbons of the mono-substituted ring – C1, C2 and C3 – are at 133.5, 128.5 and 130.1 ppm, respectively. The protonated carbons of the para-disubstituted ring – C7 and C8 – are at 121.4 and 130.0 ppm, respectively.
1H–13C me-HSQC spectrum of p-tolyl benzoate (CDCl3, 500 MHz)
82

Instructor’s Guide and Solutions Manual
1H–13C me-HSQC spectrum of p-tolyl benzoate – expansion C
12. In the 1H–1H COSY spectrum there is a correlation between the methyl protons (H10) and the aromatic H8 protons, identifying the methyl group as one of the substituents on the para-disubstituted benzene ring. Isomer A may therefore be eliminated.
13. In the HMBC spectrum, there is a correlation between H3 and the ester carbonyl carbon (at 165.3 ppm).
14. H3 must be the two protons ortho to the substituent of the mono-substituted aromatic ring. In isomer B, these protons are four-bonds removed from the carbonyl-carbon, while in isomer C, H3 is three-bonds removed.
15. Remember, that in aromatic systems, the three-bond coupling 3JC–H is typically the larger long-range coupling and gives rise to the stronger cross-peaks. Isomer B may therefore be eliminated, leaving Isomer C as the correct answer.
83

Organic Structures from 2D NMR Spectra
1H–13C HMBC spectrum of p-tolyl benzoate (CDCl3, 500 MHz)
1H–13C HMBC spectrum of p-tolyl benzoate – expansion D
84
Instructor’s Guide and Solutions Manual
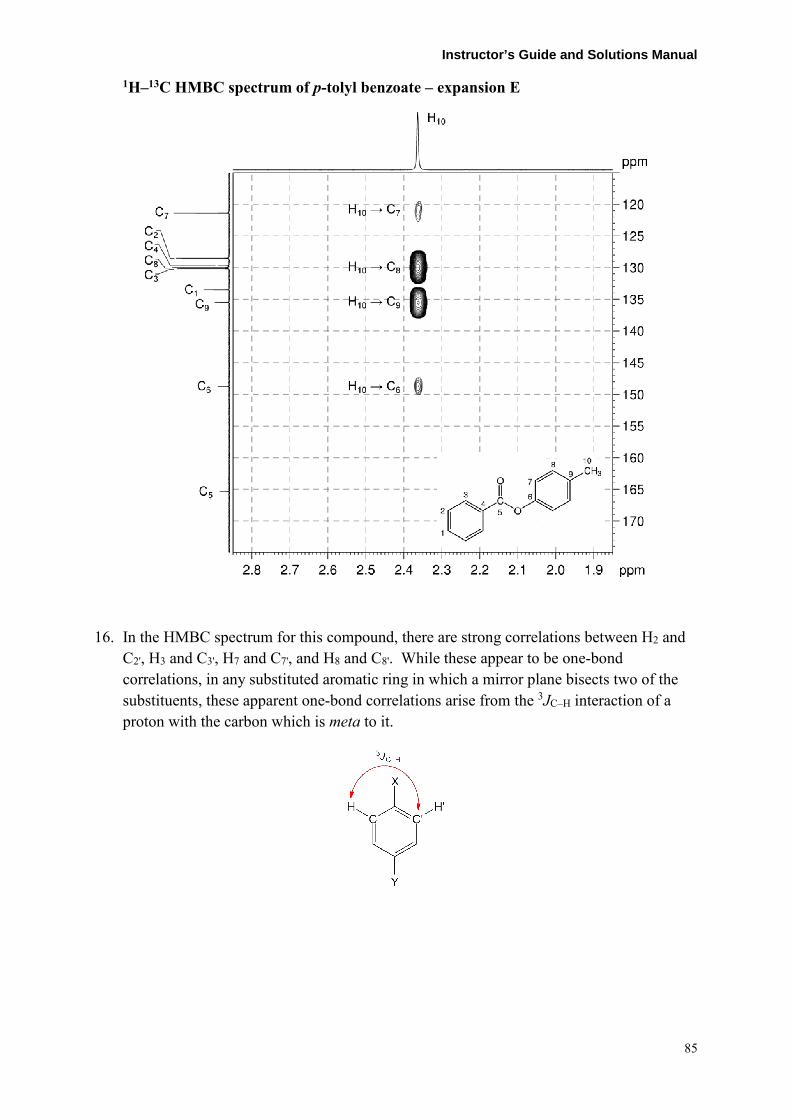
1H–13C HMBC spectrum of p-tolyl benzoate – expansion E
16. In the HMBC spectrum for this compound, there are strong correlations between H2 and C2', H3 and C3', H7 and C7', and H8 and C8'. While these appear to be one-bond correlations, in any substituted aromatic ring in which a mirror plane bisects two of the substituents, these apparent one-bond correlations arise from the 3JC–H interaction of a proton with the carbon which is meta to it.
85

Organic Structures from 2D NMR Spectra
Problem 19
Question:
Identify the following compound.
Molecular Formula: C14H12O2
IR: 1720 cm−1
Solution:
Phenyl p-toluate
1. The molecular formula is C14H12O2. Calculate the degree of unsaturation from the molecular formula: ignore the O atoms to give an effective molecular formula of C14H12 (CnHm) which gives the degree of unsaturation as (n – m/2 + 1) = 14 – 6 + 1 = 9. The compound contains a combined total of nine rings and/or π bonds.
2. The 1H NMR spectrum indicates that the compound has nine aromatic protons and three aliphatic protons.
3. The presence of nine aromatic protons suggests two aromatic rings.
4. The three aliphatic protons are equivalent and have no visible splitting so these must be an isolated methyl group.
5. IR and 1D NMR spectra establish that the compound is an ester (quaternary 13C resonance at 165.2 ppm).
6. The presence of two aromatic rings and an ester carbonyl satisfies the degree of unsaturation, so there are no more functional groups with double bonds or rings.
7. The methyl resonance in the 1H and 13C spectra (2.44 and 21.7 ppm, respectively) eliminates the possibility of a methyl ester, since for a methoxy group both the 1H and 13C signals would appear significantly further downfield.
8. The 1H NMR spectrum shows five unique signals in the aromatic region.
86

Instructor’s Guide and Solutions Manual 1H NMR spectrum of phenyl p-toluate (CDCl3, 500 MHz)
13C{1H} NMR spectrum of phenyl p-toluate (CDCl3, 125 MHz)
13C{1H} NMR spectrum of phenyl p-toluate – expansion
9. The 1H–1H COSY spectrum shows that the resonances at 8.09 and 7.29 ppm are coupled. The coupling pattern of these two signals is consistent with a para-disubstituted benzene ring. The three remaining signals (at 7.41, 7.25 and 7.20 ppm for H9, H10 and H8, respectively) constitute a separate, single spin system. The coupling patterns of these three signals are consistent with a mono-substituted benzene ring.
10. In the 1H–1H COSY spectrum, there is a correlation between the methyl protons H1 and the aromatic protons H3, identifying the methyl group as one of the substituents on the para-disubstituted benzene ring i.e. a p-tolyl group.
87

Organic Structures from 2D NMR Spectra
1H–1H COSY spectrum of phenyl p-toluate – expansion A (CDCl3, 500 MHz)
1H–1H COSY spectrum of phenyl p-toluate – expansion B
88

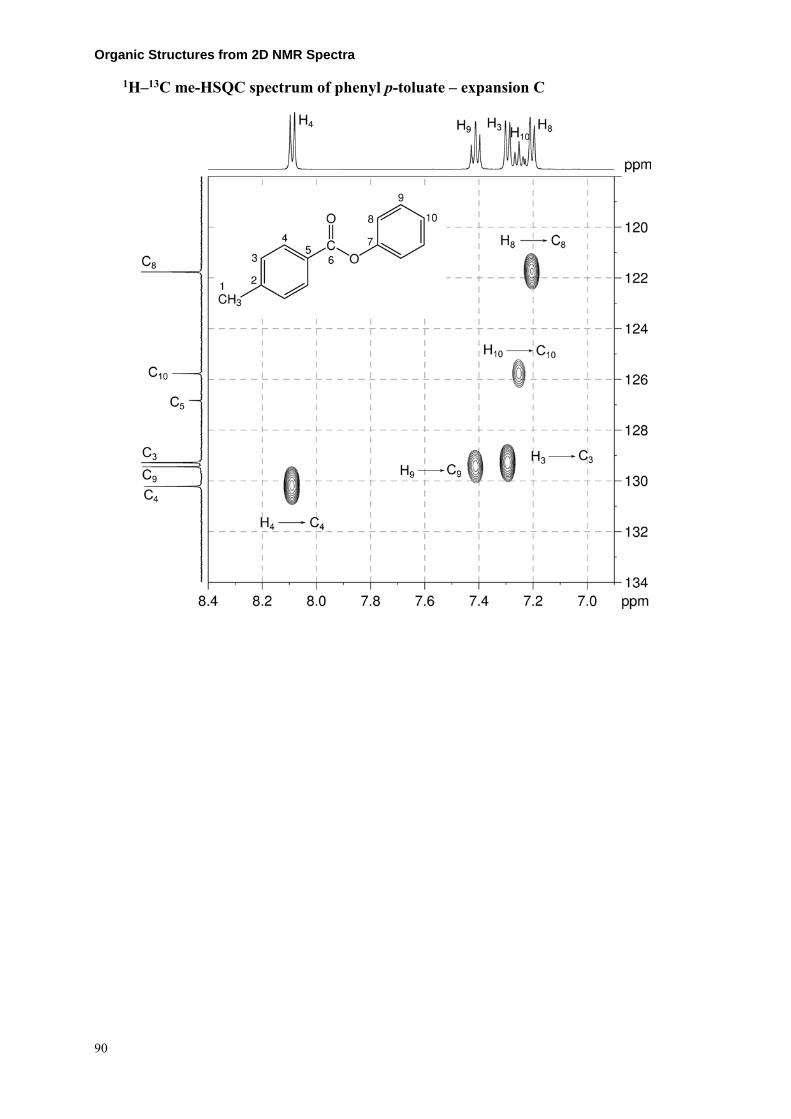
Instructor’s Guide and Solutions Manual 11. The me-HSQC spectrum easily identifies the protonated carbons. The aromatic carbons
of the para-substituted ring – C3 and C4 – are at 129.3 and 130.2 ppm, respectively. The aromatic carbons of the mono-substituted ring – C8, C9 and C10 – are 121.8, 129.5 and 125.8 ppm, respectively.
1H–13C me-HSQC spectrum of phenyl p-toluate (CDCl3, 500 MHz)
89
Organic Structures from 2D NMR Spectra
1H–13C me-HSQC spectrum of phenyl p-toluate – expansion C
90

Instructor’s Guide and Solutions Manual
12. In the HMBC spectrum, there is a correlation between H4 and the ester carbonyl carbon C6. H4 belongs to the p-tolyl group and this indicates the tolyl group is bound directly to the carbonyl carbon leaving the mono-substituted benzene ring to be attached to the oxygen atom of the ester group.
1H–13C HMBC spectrum of phenyl p-toluate – expansion D (CDCl3, 500 MHz)
91

Organic Structures from 2D NMR Spectra
1H–13C HMBC spectrum of phenyl p-toluate – expansion E
13. In the HMBC spectrum for this compound, there are strong correlations between H3 and C3', H4 and C4', H8 and C8' and also between H9 and C9'. While these appear to be one-bond correlations, in any substituted aromatic ring in which a mirror plane bisects two of the substituents, these apparent one-bond correlations arise from the 3JC–H interaction of a proton with the carbon which is meta to it.
92

Instructor’s Guide and Solutions Manual
Problem 20
Question:
Identify the following compound.
Molecular Formula: C14H12O2
IR: 1751 cm−1
Solution:
4-Biphenylyl acetate
1. The molecular formula is C14H12O2. Calculate the degree of unsaturation from the molecular formula: ignore the O atoms to give an effective molecular formula of C14H12 (CnHm) which gives the degree of unsaturation as (n – m/2 + 1) = 14 – 6 + 1 = 9. The compound contains a combined total of nine rings and/or π bonds.
2. The 1H NMR spectrum indicates that the compound has nine aromatic protons and three aliphatic protons.
3. The presence of nine aromatic protons suggests two aromatic rings.
4. The three aliphatic protons are equivalent and have no visible splitting so these must be an isolated methyl group.
5. IR and 1D NMR spectra establish that the compound is an ester (quaternary 13C resonance at 168.9 ppm).
6. The presence of two aromatic rings and an ester carbonyl satisfies the degree of unsaturation, so there are no more functional groups with double bonds or rings.
7. The methyl resonance in the 1H and 13C spectra (at 2.30 and 20.2 ppm, respectively) eliminates the possibility of a methyl ester, since for a methoxy group both the 1H and 13C signals would appear significantly further downfield.
8. The 1H NMR spectrum shows three unique signals and two overlapping signals in the aromatic region.
93

Organic Structures from 2D NMR Spectra
1H NMR spectrum of 4-biphenylyl acetate (CDCl3, 500 MHz)
13C{1H} NMR spectrum of 4-biphenylyl acetate (CDCl3, 100 MHz)
13C{1H} NMR spectrum of 4-biphenylyl acetate – expansion
94

Instructor’s Guide and Solutions Manual 9. The 1H–1H COSY spectrum shows that the resonances at 7.57 and 7.15 ppm are coupled.
The coupling pattern of these two signals is consistent with a para-disubstituted benzene ring. The three remaining signals (at 7.55, 7.42 and 7.33 ppm for H8, H9 and H10, respectively) constitute a separate, single spin system. The integrations and coupling patterns of these three signals are consistent with a mono-substituted benzene ring.
1H–1H COSY spectrum of 4-biphenylyl acetate – expansion A (CDCl3, 400 MHz)
95
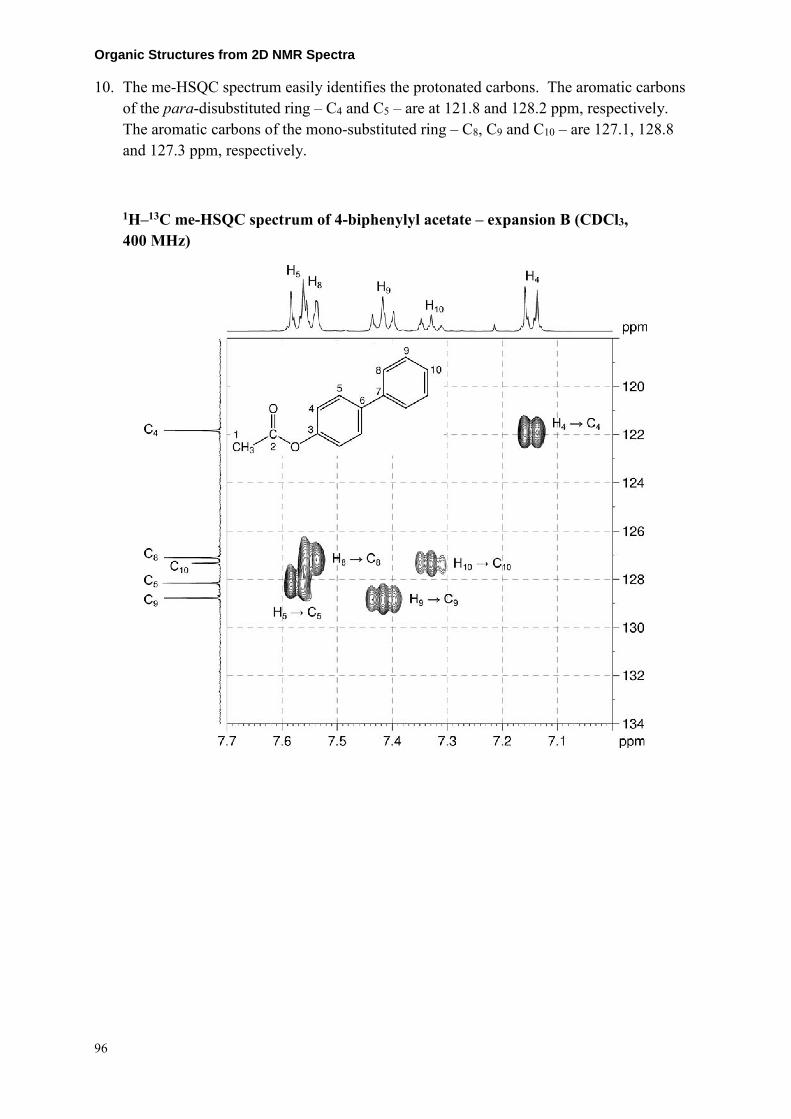
Organic Structures from 2D NMR Spectra 10. The me-HSQC spectrum easily identifies the protonated carbons. The aromatic carbons
of the para-disubstituted ring – C4 and C5 – are at 121.8 and 128.2 ppm, respectively. The aromatic carbons of the mono-substituted ring – C8, C9 and C10 – are 127.1, 128.8 and 127.3 ppm, respectively.
1H–13C me-HSQC spectrum of 4-biphenylyl acetate – expansion B (CDCl3, 400 MHz)
96

Instructor’s Guide and Solutions Manual 11. In the HMBC spectrum, there is a correlation between the methyl protons H1 and the
ester carbonyl carbon C2. The methyl group is bound directly to the carbonyl carbon.
12. Note that the one-bond coupling between H1 and C1 is visible in the HMBC spectrum as a large doublet.
13. Remember, that in aromatic systems, the three-bond coupling 3JC–H is typically the larger long-range coupling and gives rise to the stronger cross-peaks. The non-protonated carbons can thus be assigned (C3 at 150.1, C6 at 139.0 and C7 at 140.4 ppm).
14. Note that there is a strong two-bond correlation between H4 and C3 typical for O-bound carbon atoms.
15. The inter-ring correlations H5 to C7 and H8 to C6 indicate the presence of the biphenyl group.
1H–13C HMBC spectrum of 4-biphenylyl acetate (CDCl3, 400 MHz)
97

Organic Structures from 2D NMR Spectra 1H–13C HMBC spectrum of 4-biphenylyl acetate – expansion C
16. In the HMBC spectrum for this compound, there are strong correlations between H4 and C4', H5 and C5', H8 and C8' and also between H9 and C9'. While these appear to be one-bond correlations, in any substituted aromatic ring in which a mirror plane bisects two of the substituents, these apparent one-bond correlations arise from the 3JC–H interaction of a proton with the carbon which is meta to it.
98

Instructor’s Guide and Solutions Manual
Problem 21
Question:
Identify the following compound.
Molecular Formula: C14H12O2
IR: 1678 cm−1
Solution:
4'-Phenoxyacetophenone
1. The molecular formula is C14H12O2. Calculate the degree of unsaturation from the molecular formula: ignore the O atoms to give an effective molecular formula of C14H12 (CnHm) which gives the degree of unsaturation as (n – m/2 + 1) = 14 – 6 + 1 = 9. The compound contains a combined total of nine rings and/or π bonds.
2. The 1H NMR spectrum indicates that the compound has nine aromatic protons and three aliphatic protons.
3. The presence of nine aromatic protons suggests two aromatic rings.
4. The three aliphatic protons are equivalent and have no visible splitting so these must be an isolated methyl group.
5. IR and 1D NMR spectra establish the presence of a ketone (13C resonance at 196.7 ppm).
6. The presence of two aromatic rings and a ketone satisfies the degree of unsaturation, so there are no more functional groups with double bonds or rings.
7. The methyl resonance in the 1H and 13C spectra (at 2.56 and 26.4 ppm, respectively) eliminates the possibility of a methoxy group, since for a methoxy group both the 1H and 13C signals would appear significantly further downfield.
8. The 1H NMR spectrum shows five unique signals in the aromatic region.
99

Organic Structures from 2D NMR Spectra
1H NMR spectrum of 4'-phenoxyacetophenone (CDCl3, 400 MHz)
13C{1H} NMR spectrum of 4'-phenoxyacetophenone (CDCl3, 100 MHz)
100

Instructor’s Guide and Solutions Manual 9. The 1H–1H COSY spectrum shows that the resonances at 7.93 and 6.99 ppm are coupled.
The coupling pattern of these two signals is consistent with a para-disubstituted benzene ring.
10. The three remaining signals (at 7.39, 7.19 and 7.06 ppm for H2, H1 and H3, respectively) constitute a separate, single spin system. The coupling patterns of these three signals are consistent with a mono-substituted benzene ring.
1H–1H COSY spectrum of 4'-phenoxyacetophenone – expansion A (CDCl3, 400 MHz)
11. The me-HSQC spectrum easily identifies the protonated carbons. The aromatic carbons of the para-substituted ring are at 117.3 and 130.6 ppm.
12. The aromatic carbons of the mono-substituted ring – C1, C2 and C3 – are 124.6, 130.0 and 120.1 ppm, respectively.
101

Organic Structures from 2D NMR Spectra
1H–13C me-HSQC spectrum of 4'-phenoxyacetophenone (CDCl3, 400 MHz)
1H–13C me-HSQC spectrum of 4'-phenoxyacetophenone – expansion B
102

Instructor’s Guide and Solutions Manual 13. In the HMBC spectrum, there is a correlation between the methyl protons H10 and the
ketone carbonyl carbon C9. The methyl group must be bound directly to the carbonyl carbon.
14. In the HMBC spectrum, there is also a correlation between one of the proton signals of the para-disubstituted benzene ring with the carbonyl carbon (H7–C9). The para-disubstituted ring must be bound directly to the carbonyl carbon and the 1H signal at 7.93 ppm is due to the aromatic proton closest to the carbonyl group (H7).
15. Thus the 1H signal at 6.99 ppm must be due to H6. We can now assign C6 and C7 to the 13C signals at 117.3 and 130.6 ppm, respectively using the me-HSQC spectrum.
16. In the HMBC spectrum, the correlations from aromatic protons H2 and H3 to the 13C resonance at 155.5 ppm identify this signal as that due the quaternary aromatic carbon of the mono-substituted ring (C4).
1H–13C HMBC spectrum of 4'-phenoxyacetophenone (CDCl3, 400 MHz)
103

Organic Structures from 2D NMR Spectra
1H–13C HMBC spectrum of 4'-phenoxyacetophenone – expansion C
104
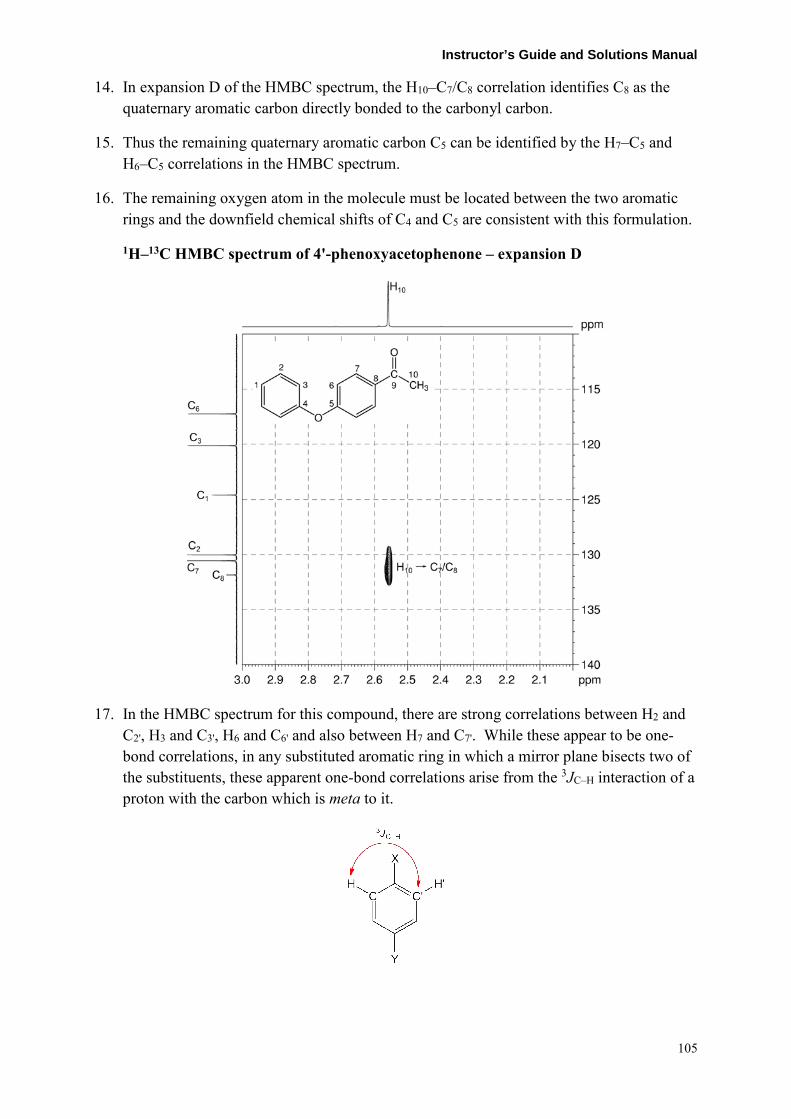
Instructor’s Guide and Solutions Manual 14. In expansion D of the HMBC spectrum, the H10–C7/C8 correlation identifies C8 as the
quaternary aromatic carbon directly bonded to the carbonyl carbon.
15. Thus the remaining quaternary aromatic carbon C5 can be identified by the H7–C5 and H6–C5 correlations in the HMBC spectrum.
16. The remaining oxygen atom in the molecule must be located between the two aromatic rings and the downfield chemical shifts of C4 and C5 are consistent with this formulation.
1H–13C HMBC spectrum of 4'-phenoxyacetophenone – expansion D
17. In the HMBC spectrum for this compound, there are strong correlations between H2 and C2', H3 and C3', H6 and C6' and also between H7 and C7'. While these appear to be one-bond correlations, in any substituted aromatic ring in which a mirror plane bisects two of the substituents, these apparent one-bond correlations arise from the 3JC–H interaction of a proton with the carbon which is meta to it.
105

Organic Structures from 2D NMR Spectra
Problem 22
Question:
Identify the following compound.
Molecular Formula: C12H16O
IR Spectrum: 1686 cm−1
Solution:
4'-tert-Butylacetophenone
1. The molecular formula is C12H16O. Calculate the degree of unsaturation from the molecular formula: ignore the O atom to give an effective molecular formula of C12H16 (CnHm) which gives the degree of unsaturation as (n – m/2 + 1) = 12 – 8 + 1 = 5. The compound contains a combined total of five rings and/or π bonds.
2. The IR and 1D NMR data establish that the compound is aromatic and contains a ketone functional group (quaternary 13C resonance at 197.8 ppm). The aromatic ring and the carbonyl group account for all of the degrees of unsaturation, so the compound contains no additional rings or multiple bonds.
3. There are two aromatic proton resonances in the 1H NMR spectrum. On the basis of the coupling pattern, the ring is para-disubstituted, but one cannot readily distinguish which resonance belongs to H2 and which to H3.
4. The 1H NMR spectrum has one three-proton resonance at 2.58 ppm (H6), and a nine-proton resonance at 1.34 ppm (H8). The chemical shift of the resonance at 2.58 ppm is consistent with a methyl group either bound directly to the aromatic ring or to the ketone, while the resonance at 1.34 ppm is due to a tert-butyl group.
1H NMR spectrum of 4'-tert-butylacetophenone (CDCl3, 300 MHz)
106

Instructor’s Guide and Solutions Manual 13C{1H} NMR spectrum of 4'-tert-butylacetophenone (CDCl3, 75 MHz)
5. There are two possible isomers:
6. The 1H–13C me-HSQC spectrum easily identifies the protonated carbon resonances: C6 at 26.5 ppm, C8 at 31.0 ppm and the protonated aromatic carbons at 125.5 and 128.3 ppm.
1H–13C me-HSQC spectrum of 4'-tert-butylacetophenone (CDCl3, 300 MHz)
107

Organic Structures from 2D NMR Spectra 7. The 1H–13C HMBC spectrum has a correlation between H6 and the carbonyl carbon C5 so
the methyl group is close to the carbonyl group. This identifies Isomer A as the correct structure.
8. The HMBC spectrum can be used to identify and assign the remaining carbon and proton resonances. Remember that, in aromatic systems, the three-bond coupling 3JC–H is typically the larger long-range coupling and gives rise to the strongest cross-peaks.
9. The tert-butyl protons (H8) correlate to three resonances in the HMBC spectrum – the first is a strong correlation between H8 and C8'. While this appears to be a one-bond correlation, in tert-butyl groups, isopropyl groups or compounds with a gem-dimethyl group, the apparent one-bond correlation arises from the 3JC–H interaction of the protons of one of the methyl groups with the chemically equivalent carbon which is three bonds away.
10. The tert-butyl protons (H8) also correlate to the quaternary carbon C7 at 35.1 ppm, and the quaternary aromatic carbon at 156.8 ppm. The resonance at 156.8 ppm is therefore assigned to C4.
11. The proton resonance at 7.90 ppm also correlates to C4. This proton resonance and its associated carbon resonance at 128.3 ppm are therefore identified as H2 and C2. H3 must be the proton resonance at 7.48 ppm and C3 the carbon resonance at 125.5 ppm.
12. The remaining 13C resonance at 134.6 ppm is assigned to C1.
108

Instructor’s Guide and Solutions Manual
1H–13C HMBC spectrum of 4'-tert-butylacetophenone (CDCl3, 300 MHz)
13. In the HMBC spectrum for this compound, there are strong correlations between H2 and C2' and also between H3 and C3'. While these appear to be one-bond correlations, in para-disubstituted benzenes (and indeed in any substituted aromatic ring in which a mirror plane bisects two of the substituents), these apparent one-bond correlations arise from the 3JC–H interaction of a proton with the carbon which is meta to it.
109

Organic Structures from 2D NMR Spectra
Problem 23
Question:
Identify the following compound.
Molecular Formula: C12H16O
IR Spectrum: 1685 cm−1
Solution:
2,2,4'-Trimethylpropiophenone
1. The molecular formula is C12H16O. Calculate the degree of unsaturation from the molecular formula: ignore the O atom to give an effective molecular formula of C12H16 (CnHm) which gives the degree of unsaturation as (n – m/2 + 1) = 12 – 8 + 1 = 5. The compound contains a combined total of five rings and/or π bonds.
2. The IR and 1D NMR spectra establish that the compound is aromatic and contains a ketone functional group (quaternary 13C resonance at 208.3 ppm). This accounts for all of the degrees of unsaturation, so the compound contains no additional rings or multiple bonds.
3. There are two aromatic proton resonances at 7.66 and 7.19 ppm in the 1H NMR spectrum. On the basis of the coupling pattern, the ring is para-disubstituted, but one cannot readily distinguish which resonance belongs to H2 and which to H3.
4. The 1H NMR spectrum has one three-proton resonance at 2.38 ppm (H8), and a nine-proton resonance at 1.35 ppm (H7). The chemical shift of the resonance at 2.38 ppm is consistent with a methyl group either bound directly to the aromatic ring or to the ketone, while the resonance at 1.35 ppm is due to a tert-butyl group.
1H NMR spectrum of 2,2,4'-trimethylpropiophenone (CDCl3, 500 MHz)
110

Instructor’s Guide and Solutions Manual
13C{1H} NMR spectrum of 2,2,4'-trimethylpropiophenone (CDCl3, 125 MHz)
5. There are two possible isomers:
6. The 1H–13C me-HSQC identifies the protonated carbon resonances: C7 at 28.2 ppm, C8 at 21.4 ppm and the protonated aromatic carbons at 128.3 and 128.7 ppm.
1H–13C me-HSQC spectrum of 2,2,4'-trimethylpropiophenone (CDCl3, 500 MHz)
111

Organic Structures from 2D NMR Spectra 7. The 1H–13C HMBC spectrum has a correlation between H7 (the tert-butyl group) and the
carbonyl carbon C5. This identifies Isomer B as the correct structure.
8. The HMBC spectrum can be used to identify and assign the remaining carbon and proton resonances. Remember that, in aromatic systems, the three-bond coupling 3JC–H is typically the larger long-range coupling and gives rise to the strongest cross-peaks.
9. Note that the tert-butyl protons (H7) correlate to the tert-butyl methyl carbon resonance at 28.2 ppm (C7') in the HMBC spectrum. While this appears to be a one-bond correlation, in tert-butyl groups, isopropyl groups or compounds with a gem-dimethyl group, the apparent one-bond correlation arises from the 3JC–H interaction of the protons of one of the methyl groups with the chemically equivalent carbon which is three bonds away.
10. The tert-butyl protons (H7) also correlate to the aliphatic quaternary carbon C6 at 44.0 ppm in the HMBC spectrum.
11. In the HMBC spectrum, the aromatic proton resonance at 7.19 ppm correlates to the methyl carbon resonance at 21.4 ppm (C8). The resonance at 7.19 ppm can thus be assigned to the aromatic proton adjacent to the methyl group (H3).
12. The remaining aromatic proton signal at 7.66 ppm must be due to H2. Both C2 and C3 can be assigned to the signals at 128.3 and 128.7 ppm, respectively using the me-HSQC spectrum.
13. In the HMBC spectrum, H3 also correlates to the quaternary aromatic carbon signal at 135.4 ppm and this signal can be assigned to C1 as it is three bonds away from H3.
14. In the HMBC spectrum, H2 correlates to the quaternary aromatic carbon signal at 141.5 ppm which can now be assigned to C4. H2 also correlates to the carbonyl carbon C5 confirming that Isomer B is the correct structure.
112

Instructor’s Guide and Solutions Manual
1H–13C HMBC spectrum of 2,2,4'-trimethylpropiophenone (CDCl3, 500 MHz)
15. In the HMBC spectrum for this compound, there are strong correlations between H2 and C2' and also between H3 and C3'. While these appear to be one-bond correlations, in para-disubstituted benzenes (and in any substituted aromatic ring in which a mirror plane bisects two of the substituents), these apparent one-bond correlations arise from the 3JC–H interaction of a proton with the carbon which is meta to it.
113

Organic Structures from 2D NMR Spectra
Problem 24
Question:
Identify the following compound.
Molecular Formula: C10H12O
IR: 3320 (br), 1600 (w), 1492 (m), 1445 (m) cm−1
Solution:
trans-2-Methyl-3-phenyl-2-
propen-1-ol
1. The molecular formula is C10H12O. Calculate the degree of unsaturation from the molecular formula: ignore the O atom to give an effective molecular formula of C10H12 (CnHm) which gives the degree of unsaturation as (n – m/2 + 1) = 10 – 6 + 1 = 5. The compound contains a combined total of five rings and/or π bonds.
2. In the 1H NMR spectrum, the signal at 5.04 ppm exchanges with D2O so this must be due to an –OH group. The IR stretch at 3320 cm−1 and the fact that this signal has no correlation to a carbon signal in the me-HSQC spectrum verifies the presence of an OH group.
3. In the 1H NMR spectrum, the integration and coupling pattern of the aromatic protons indicate the presence of a mono-substituted benzene ring. The signal at 6.52 ppm is in the alkene region, whilst the signals at 4.02 and 1.82 ppm indicate –OCH2– and –CH3 fragments, respectively.
4. The aromatic ring and alkene functional group accounts for all of the degrees of unsaturation, so the compound contains no additional rings or multiple bonds.
1H NMR spectrum of trans-2-methyl-3-phenyl-2-propen-1-ol (DMSO-d6, 500 MHz)
114

Instructor’s Guide and Solutions Manual
13C{1H} NMR spectrum of trans-2-methyl-3-phenyl-2-propen-1-ol (DMSO-d6, 125 MHz)
5. The COSY spectrum shows that the signals for the OH and CH2 groups are coupled thus they must be directly bound.
1H–1H COSY spectrum of trans-2-methyl-3-phenyl-2-propen-1-ol (DMSO-d6, 500 MHz)
115

Organic Structures from 2D NMR Spectra 6. The HSQC spectrum easily identifies the protonated carbons (aromatic carbons C5, C6
and C7 at 128.6, 128.2 and 126.1, respectively; alkene carbon C3 at 122.8, OCH2 at 66.7 and CH3 at 15.2 ppm).
1H–13C me-HSQC spectrum of trans-2-methyl-3-phenyl-2-propen-1-ol (DMSO-d6, 500 MHz)
116

Instructor’s Guide and Solutions Manual 7. In the HMBC spectrum, there are correlations from the =CH, OH, CH2 and CH3 groups
to a quaternary carbon C2 which has a chemical shift in the aromatic / alkene region (138.9 ppm). Joining C2 to the =CH group affords a HO–CH2–C(CH3)=CH fragment.
8. The HMBC spectrum can be used to assign the ipso carbon C4 at 137.7 ppm (H6–C4 correlation).
9. Correlations from alkene proton H3 to ipso carbon C4 and aromatic carbon C5 indicate that the phenyl group is attached to the =CH group.
1H–13C HMBC spectrum of trans-2-methyl-3-phenyl-2-propen-1-ol (DMSO-d6, 500 MHz)
10. In the HMBC spectrum for this compound, there are strong correlations between H5 and C5' and also between H6 and C6'. While these appear to be one-bond correlations, in any substituted aromatic ring in which a mirror plane bisects two of the substituents, these apparent one-bond correlations arise from the 3JC–H interaction of a proton with the carbon which is meta to it.
117

Organic Structures from 2D NMR Spectra 11. The configuration about the double bond can be deduced from the 1H–1H NOESY
spectrum. The H3–H1 and H3–OH correlations indicate that the alkene proton is on the same side of the double bond as the CH2OH group. Similarly the H8–H5 correlation indicates that the methyl and phenyl groups are on the same side of the double bond. The absence of correlations between the methyl group (H8) and the alkene proton (H3) confirms that these groups are trans to each other across the double bond.
1H–1H NOESY spectrum trans-2-methyl-3-phenyl-2-propen-1-ol (DMSO-d6, 500 MHz)
118
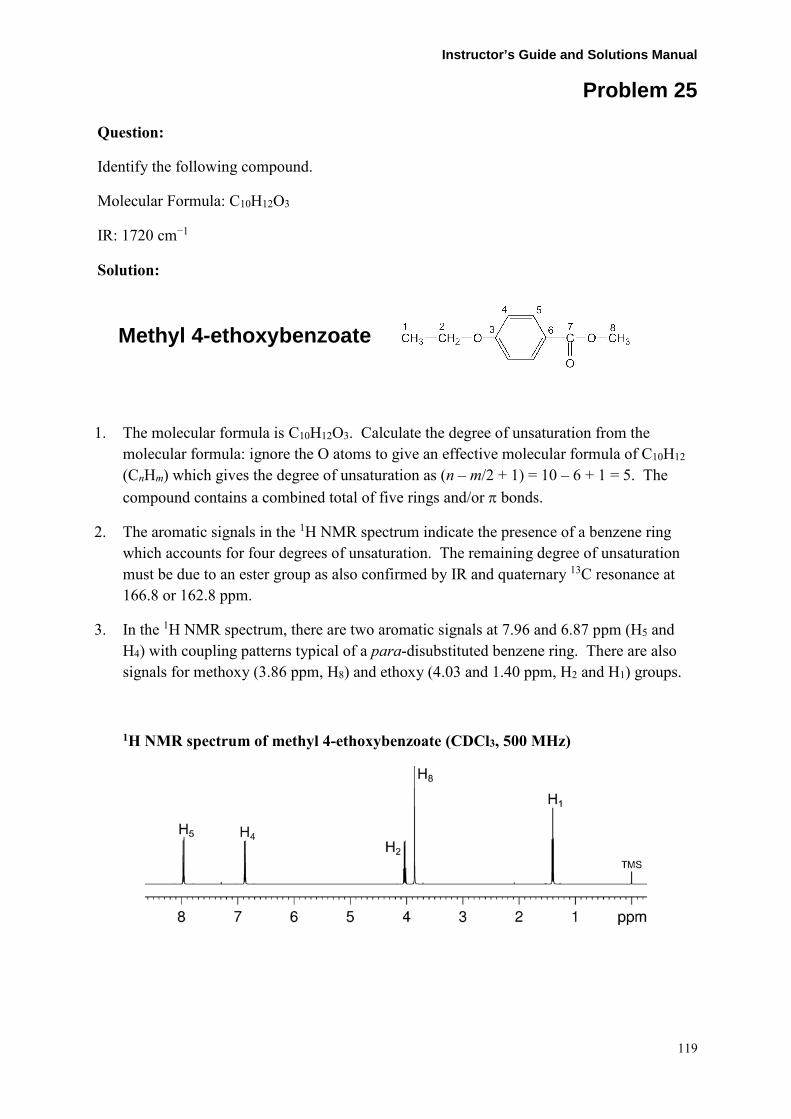
Instructor’s Guide and Solutions Manual
Problem 25
Question:
Identify the following compound.
Molecular Formula: C10H12O3
IR: 1720 cm−1
Solution:
Methyl 4-ethoxybenzoate
1. The molecular formula is C10H12O3. Calculate the degree of unsaturation from the molecular formula: ignore the O atoms to give an effective molecular formula of C10H12 (CnHm) which gives the degree of unsaturation as (n – m/2 + 1) = 10 – 6 + 1 = 5. The compound contains a combined total of five rings and/or π bonds.
2. The aromatic signals in the 1H NMR spectrum indicate the presence of a benzene ring which accounts for four degrees of unsaturation. The remaining degree of unsaturation must be due to an ester group as also confirmed by IR and quaternary 13C resonance at 166.8 or 162.8 ppm.
3. In the 1H NMR spectrum, there are two aromatic signals at 7.96 and 6.87 ppm (H5 and H4) with coupling patterns typical of a para-disubstituted benzene ring. There are also signals for methoxy (3.86 ppm, H8) and ethoxy (4.03 and 1.40 ppm, H2 and H1) groups.
1H NMR spectrum of methyl 4-ethoxybenzoate (CDCl3, 500 MHz)
119

Organic Structures from 2D NMR Spectra
13C{1H} NMR spectrum of methyl 4-ethoxybenzoate (CDCl3, 125 MHz)
4. The COSY spectrum shows the expected correlations between the two aromatic signals H5 and H4 as well as the correlations between the OCH2 (H2) and CH3 (H1) resonances.
1H–1H COSY spectrum of methyl 4-ethoxybenzoate (CDCl3, 500 MHz)
120

Instructor’s Guide and Solutions Manual 5. The me-HSQC spectrum easily identifies the protonated carbons. The protonated
aromatic carbons are at 131.6 and 114.1 ppm. The OCH2 carbon is at 63.7 ppm, the OCH3 carbon is at 51.8 ppm and the CH3 carbon is at 14.9 ppm.
1H–13C me-HSQC spectrum of methyl 4-ethoxybenzoate (CDCl3, 500 MHz)
6. There are two possible isomers – one with the ethoxy group as a substituent on the benzene ring and the methoxy group as part of the ester (isomer A) and the other with the methoxy group as the substituent on the benzene ring and the ethoxy group as part of the ester (isomer B).
121

Organic Structures from 2D NMR Spectra 7. In the HMBC spectrum, the correlations between aromatic protons H4 and H5 with the
13C resonance at 162.8 ppm indicate that this 13C resonance is due to the quaternary aromatic carbon C3 which is shifted downfield because it is bonded to an oxygen atom. Thus, the carbonyl carbon C7 must be the signal at 166.8 ppm.
8. In the HMBC spectrum, the strong correlation between the methoxy protons H8 and the carbonyl carbon C7 identifies the correct structure as Isomer A. The correlation between ethoxy proton H2 with quaternary aromatic carbon C3 confirms that the ethoxy group is bound directly to the benzene ring.
1H–13C HMBC spectrum of methyl 4-ethoxybenzoate – expansion A (CDCl3, 500 MHz)
9. In the HMBC spectrum for this compound, there are strong correlations between H4 and C4' and also between H5 and C5'. While these appear to be one-bond correlations, in para-disubstituted benzenes (and in any substituted aromatic ring in which a mirror plane bisects two of the substituents), these apparent one-bond correlations arise from the 3JC–H interaction of a proton with the carbon which is meta to it.
122

Instructor’s Guide and Solutions Manual
Problem 26
Question:
Identify the following compound.
Molecular Formula: C11H14O2
IR: 1739 cm−1
Solution:
Methyl 3-(p-tolyl)propionate
1. The molecular formula is C11H14O2. Calculate the degree of unsaturation from the molecular formula: ignore the O atoms to give an effective molecular formula of C11H14 (CnHm) which gives the degree of unsaturation as (n – m/2 + 1) = 11 – 7 + 1 = 5. The compound contains a combined total of five rings and/or π bonds.
2. IR and 1D NMR spectra establish that the compound is aromatic and contains an ester functional group (quaternary 13C resonance at 173.3 ppm). This accounts for all of the degrees of unsaturation, so the compound contains no additional rings or multiple bonds.
3. In the 1H NMR spectrum, the aromatic signal at 7.06 ppm integrates for four protons (H5 + H6) and the lack of any obvious coupling pattern indicates that all the aromatic protons are in a similar environment – probably a para-disubstituted benzene ring where the shift of all protons is similar. There are also signals for methoxy –OCH3 (3.63 ppm, H9), –CH2CH2– (2.89 and 2.58 ppm, H3 and H2) and methyl –CH3 (2.29 ppm, H8) groups.
1H NMR spectrum of methyl 3-(p-tolyl)propionate (CDCl3, 500 MHz)
123

Organic Structures from 2D NMR Spectra
13C{1H} NMR spectrum of methyl 3-(p-tolyl)propionate (CDCl3, 125 MHz)
4. The COSY spectrum shows the expected correlations between the two –CH2– signals H3 and H2.
1H–1H COSY spectrum of methyl 3-(p-tolyl)propionate (CDCl3, 500 MHz)
124

Instructor’s Guide and Solutions Manual 5. The me-HSQC spectrum easily identifies the protonated carbons. Note that the 1H signal
for H5 + H6 correlates to two C signals at 129.2 and 128.2 ppm for C6 and C5. The OCH3 carbon is at 51.5 ppm, the two CH2 carbons are at 35.9 and 30.6 ppm, and the CH3 carbon is at 21.0 ppm.
1H–13C me-HSQC spectrum of methyl 3-(p-tolyl)propionate (CDCl3, 500 MHz)
125

Organic Structures from 2D NMR Spectra 6. In the HMBC spectrum, the correlation between methoxy protons H9 and carbonyl carbon
C1 indicates the presence of a methoxy ester. Correlations between methylene protons H2 and H3 with carbonyl carbon C1 indicate that the –CH2CH2– group is also bound to the carbonyl group.
7. In the HMBC spectrum, the correlation from methylene proton signal at 2.89 ppm to protonated aromatic carbon at 128.2 ppm signals indicate that the –CH2CH2– group is bound to the benzene ring. The correlation also identifies the 1H signal at 2.89 ppm as due to the methylene group adjacent to the benzene ring (H3) and the 13C signal at 128.2 ppm as to the protonated aromatic carbon ortho to the methylene substituent (C5).
8. In the HMBC spectrum, H3 also correlates to quaternary aromatic carbon signal at 137.5 ppm which can be assigned to C4.
9. The methyl group must be bound to the benzene ring as shown by correlations from the methyl proton signals at 2.29 ppm to protonated aromatic carbon signal at 129.2 ppm (which can be assigned to C6) and quaternary aromatic carbon signal at 135.7 ppm (which can be assigned to C7).
1H–13C HMBC spectrum of methyl 3-(p-tolyl)propionate (CDCl3, 500 MHz)
126

Instructor’s Guide and Solutions Manual
Problem 27
Question:
Identify the following compound.
Molecular Formula: C11H14O2
IR: 1715 cm−1
Draw a labeled structure, and use the me-HSQC and INADEQUATE spectra to assign each 1H and 13C resonance to the corresponding nucleus in the structure.
Solution:
4-(4'-Methoxyphenyl)-2-butanone
Proton Chemical Shift (ppm) Carbon Chemical Shift (ppm) H1 2.09 C1 30.0
C2 208.0 H3 2.69 C3 45.9 H4 2.81 C4 28.9
C5 133.0 H6 7.08 C6 129.2 H7 6.80 C7 113.9
C8 158.0 H9 3.74 C9 55.2
1. The molecular formula is C11H14O2. Calculate the degree of unsaturation from the molecular formula: ignore the O atoms to give an effective molecular formula of C11H14 (CnHm) which gives the degree of unsaturation as (n – m/2 + 1) = 11 – 7 + 1 = 5. The compound contains a combined total of five rings and/or π bonds.
2. IR and 1D NMR spectra establish that the compound is aromatic and contains a ketone functional group (quaternary 13C resonance at 208.0 ppm). This accounts for all of the degrees of unsaturation and there are no additional rings or multiple bonds.
3. In the 1H NMR spectrum, there are two aromatic signals at 7.08 and 6.80 ppm (H6 and H7) with coupling patterns typical of a para-disubstituted benzene ring. There
127

Organic Structures from 2D NMR Spectra
are also signals for methoxy (3.74 ppm, H9), –CH2CH2– (2.81 and 2.69 ppm, H4 and H3) and methyl (2.09 ppm, H1) groups.
1H NMR spectrum of 4-(4'-methoxyphenyl)-2-butanone (CDCl3, 600 MHz)
13C{1H} NMR spectrum of 4-(4'-methoxyphenyl)-2-butanone (CDCl3, 150 MHz)
128

Instructor’s Guide and Solutions Manual 4. The me-HSQC spectrum easily identifies the signals for the protonated carbons – the
protonated aromatic carbons are at 129.2 and 113.9 ppm (C6 and C7), the methoxy carbon is at 55.2 ppm (C9), the two methylene carbons are at 45.4 and 28.9 ppm (C3 and C4), and the methyl carbon is at 30.1 ppm (C4). The signals at 158.0 and 133.0 ppm belong to quaternary aromatic carbons (C5 and C8) as these signals have no correlations in the me-HSQC spectrum.
1H–13C me-HSQC spectrum of 4-(4'-methoxyphenyl)-2-butanone (CDCl3, 600 MHz)
129

Organic Structures from 2D NMR Spectra 5. The INADEQUATE spectrum shows direct 13C–13C connectivity.
6. Beginning, for example, with the ketone carbon resonance at 208.0 ppm (C2), correlations to the methyl carbon signal at 30.0 ppm (C1) and methylene carbon signal at 45.9 ppm (C3) affords the following fragment:
7. The methylene carbon signal at 45.9 ppm (C3) has a correlation with the methylene carbon signal at 28.9 ppm (C4) which extends the fragment to:
8. The methylene carbon signal at 28.9 ppm (C4) has a correlation with the quaternary aromatic carbon signal at 133.0 ppm (C5). The signal at 133.0 ppm (C5) has a correlation with the protonated aromatic carbon signal at 129.2 ppm (C6). The signal at 129.2 ppm (C6) has a correlation with the protonated aromatic carbon signal at 113.9 ppm (C7) which in turn has a correlation with the quaternary aromatic carbon signal at 158.0 ppm (C8). We now have the following fragment:
9. The remaining methoxy group must be bound to the benzene ring at the position para to the other substituent. There are no correlations between the methoxy carbon signal at 55.2 ppm (C9) and the quaternary aromatic signal at 158.0 ppm (C8) due to the presence of an oxygen atom between then.
130

Instructor’s Guide and Solutions Manual INADEQUATE spectrum of 4-(4'-methoxyphenyl)-2-butanone (CDCl3, 150 MHz)
131

Organic Structures from 2D NMR Spectra
Problem 28
Question:
The 1H and 13C{1H} NMR spectra of ethyl 6-bromohexanoate (C8H15BrO2) recorded in CDCl3 solution at 298 K and 500 MHz are given below. The 1H NMR spectrum has signals at δ 1.25, 1.48, 1.65, 1.87, 2.31, 3.41 and 4.12 ppm. The 13C{1H} NMR spectrum has signals at δ 14.3, 24.0, 27.6, 32.4, 33.5, 34.0, 60.2 and 173.3 ppm. The 2D 1H–1H COSY and the multiplicity-edited 1H–13C HSQC spectra are given on the facing page. From the COSY spectrum, assign the proton spectrum, then use this information to assign the 13C{1H} spectrum.
Solution:
Ethyl 6-bromohexanoate
Proton Chemical Shift (ppm) Carbon Chemical Shift (ppm) H1 3.41 C1 33.5 H2 1.87 C2 32.4 H3 1.48 C3 27.6 H4 1.65 C4 24.0 H5 2.31 C5 34.0
C6 173.3 H7 4.12 C7 60.2 H8 1.25 C8 14.3
1H NMR spectrum of ethyl 6-bromohexanoate (CDCl3, 500 MHz)
132
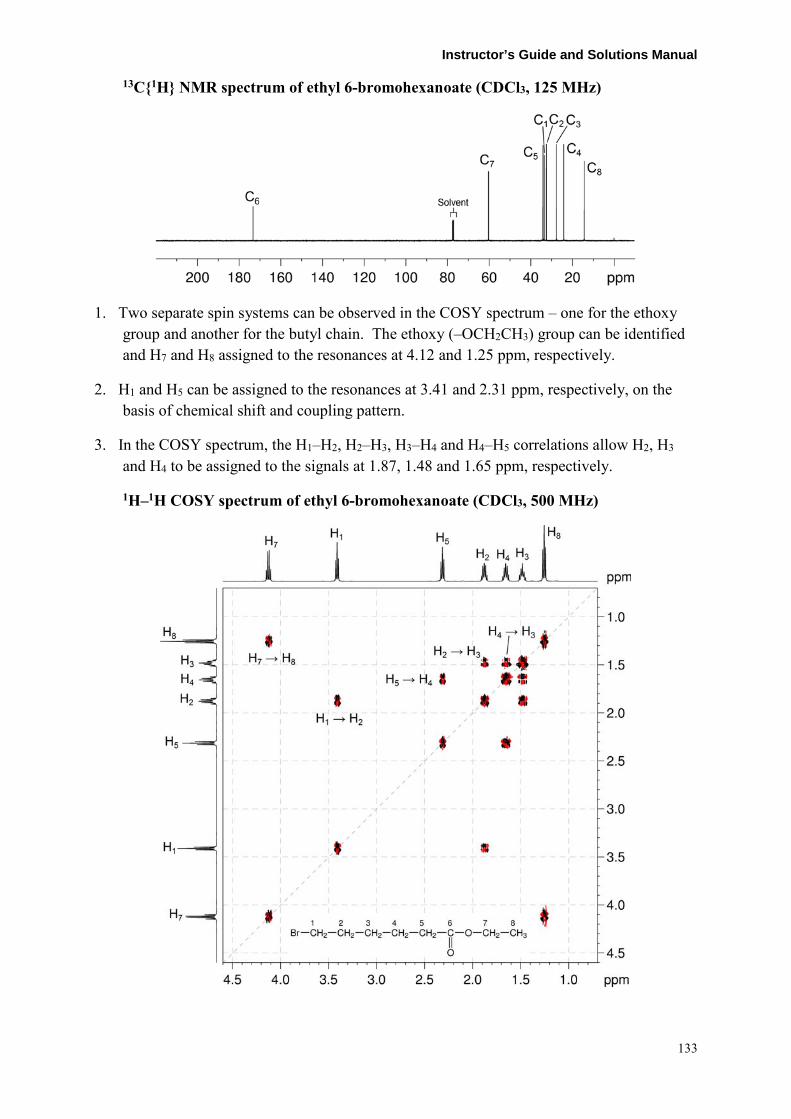
Instructor’s Guide and Solutions Manual
13C{1H} NMR spectrum of ethyl 6-bromohexanoate (CDCl3, 125 MHz)
1. Two separate spin systems can be observed in the COSY spectrum – one for the ethoxy group and another for the butyl chain. The ethoxy (–OCH2CH3) group can be identified and H7 and H8 assigned to the resonances at 4.12 and 1.25 ppm, respectively.
2. H1 and H5 can be assigned to the resonances at 3.41 and 2.31 ppm, respectively, on the basis of chemical shift and coupling pattern.
3. In the COSY spectrum, the H1–H2, H2–H3, H3–H4 and H4–H5 correlations allow H2, H3 and H4 to be assigned to the signals at 1.87, 1.48 and 1.65 ppm, respectively.
1H–1H COSY spectrum of ethyl 6-bromohexanoate (CDCl3, 500 MHz)
133

Organic Structures from 2D NMR Spectra 4. The carbonyl carbon C6 can be assigned easily to the 13C resonance at 173.3 ppm on the
basis of chemical shift.
5. The remaining C resonances can be easily assigned by the me-HSQC spectrum.
1H–13C me-HSQC spectrum of ethyl 6-bromohexanoate (CDCl3, 500 MHz)
134

Instructor’s Guide and Solutions Manual
Problem 29
Question:
The 1H and 13C{1H} NMR spectra of piperonal (C8H6O3) recorded in CDCl3 solution at 298 K and 600 MHz are given below.
The 1H NMR spectrum has signals at δ 6.07 (s, 2H, H7), 6.92 (d, 3JH–H = 7.9 Hz, 1H, H1), 7.31 (d, 4JH–H = 1.5 Hz, 1H, H4), 7.40 (dd, 3JH–H = 7.9 Hz, 4JH–H = 1.5 Hz, 1H, H6) and 9.80 (s, 1H, H8) ppm.
The 13C{1H} NMR spectrum has signals at δ 102.1 (C7), 106.9 (C4), 108.3 (C1), 128.6 (C6), 131.9 (C5), 148.7 (C3), 153.1 (C2) and 190.2 (C8) ppm.
Use this information to produce schematic diagrams of the HSQC and HMBC spectra, showing where all of the cross-peaks and diagonal peaks would be.
Solution:
Piperonal
1. The assignments for the 1H and 13C{1H} NMR spectra are given.
1H NMR spectrum of piperonal (CDCl3, 600 MHz)
13C{1H} NMR spectrum of piperonal (CDCl3, 150 MHz)
135

Organic Structures from 2D NMR Spectra 2. The 1H–13C me-HSQC spectrum shows direct (one-bond) correlations between proton
and carbon nuclei, so there will be cross-peaks between H1 and C1, H4 and C4, H6 and C6, H7 and C7 (shown here in red, as there are two protons directly connected to C7) and between H8 and C8.
Predicted 1H–13C me-HSQC spectrum of piperonal (CDCl3, 600 MHz)
136

Instructor’s Guide and Solutions Manual 3. In HMBC spectra, remember that, for aromatic systems, the three-bond coupling 3JC–H is
typically the larger long-range coupling and gives rise to the strongest cross-peaks. Benzylic protons correlate to the ipso carbon (two-bond correlation) and the ortho carbons (three-bond correlations).
Predicted 1H–13C HMBC spectrum of piperonal (CDCl3, 600 MHz)
4. H1 will correlate to the carbon nuclei three bonds removed (i.e. meta): C3 and C5. Oxygen substituents on aromatic rings increase the magnitude of two-bond C–H coupling to the oxygen-substituted carbon atom from ≤ 1 Hz to ≥ 2.5 Hz. It is therefore often possible to observe two-bond correlations to the phenolic ipso carbon, and indeed H1 does show such a correlation (shown in light grey).
5. H4 will correlate to the meta carbon nuclei: C2 and C6. There will also be a three-bond correlation to the aldehydic carbon atom (C8). In addition, for the reasons outlined above, there is a two-bond correlation to C3 (shown in light grey).
137

Organic Structures from 2D NMR Spectra 6. H6 will correlate to the meta carbon nuclei: C2 and C4. There will also be a three-bond
correlation to the aldehydic carbon atom (C8).
7. H7 will, in principle, show both two- and three-bond correlations; however there are no carbon nuclei which are two bonds removed from H7, so we expect only three-bond correlations to C2 and C3.
8. H8 will also show both two- and three-bond correlations. There will be a two-bond correlation to C5, and three-bond correlations to both C4 and C6.
138

Instructor’s Guide and Solutions Manual
Problem 30
Question:
Identify the following compound.
Molecular Formula: C13H16O2
IR: 1720 cm−1
Solution:
cis-3-Hexenyl benzoate
1. The molecular formula is C13H16O2. Calculate the degree of unsaturation from the molecular formula: ignore the O atoms to give an effective molecular formula of C13H16 (CnHm) which gives the degree of unsaturation as (n – m/2 + 1) = 13 – 8 + 1 = 6. The compound contains a combined total of six rings and/or π bonds.
2. 1D NMR spectra establish the presence of a mono-substituted benzene ring (1H signals at 8.04, 7.53 and 7.41 ppm for H3, H1 and H2, respectively), two alkene protons (1H signals at 5.53 and 5.40 ppm for H9 and H8, respectively) and an ester group (13C signal at 166.6 ppm for C5).
3. The aromatic, alkene and ester functional groups account for all of the degrees of unsaturation, so the compound contains no additional rings or multiple bonds.
4. In the 1H NMR spectrum, there are also signals for one methoxy group at 4.31 ppm (H6), two methylene groups at 2.51 and 2.09 ppm (H7 and H10) and a methyl group at 0.97 ppm (H11).
1H NMR spectrum of cis-3-hexenyl benzoate (CDCl3, 400 MHz)
139

Organic Structures from 2D NMR Spectra
13C{1H} NMR spectrum of cis-3-hexenyl benzoate (CDCl3, 100 MHz)
5. In the COSY spectrum, there are two spin systems – one of which corresponds to the aromatic ring (H2–H3 and H1–H2). The other spin system, starting with the methyl group (H11) which correlates to a –CH2– group (H10) which in turn correlates to a –CH= group (H9). The correlations continue with –CH= group (H8) then –CH2– group (H7) and –OCH2 group (H6). These correlations afford the CH3CH2CH=CHCH2CH2O– fragment.
1H–1H COSY spectrum of cis-3-hexenyl benzoate (CDCl3, 400 MHz)
140

Instructor’s Guide and Solutions Manual 6. The protonated carbons C6, C7, C10 and C11 are easily identified by the me-HSQC
spectrum as signals at 64.5, 26.9, 20.7 and 14.3 ppm, respectively.
1H–13C me-HSQC spectrum of cis-3-hexenyl benzoate (CDCl3, 400 MHz)
141

Organic Structures from 2D NMR Spectra 7. The protonated carbons C1, C2, C3, C8 and C9 are easily identified by the me-HSQC
spectrum (expansion A) as signals at 132.9, 128.3, 129.6, 123.8 and 134.6 ppm, respectively.
8. The remaining 13C signal at 130.5 ppm does not have a correlation in the me-HSQC spectrum and must be due to the quaternary aromatic carbon C4.
1H–13C me-HSQC spectrum of cis-3-hexenyl benzoate – expansion A
142

Instructor’s Guide and Solutions Manual 9. In the HMBC spectrum, the aromatic proton to carbonyl correlations (H3–C5 and H2–C5)
and the –OCH2– proton to carbonyl correlation (H6–C5) place the carbonyl group between the phenyl ring and the –OCH2– group to afford the compound as PhC(=O)OCH2CH2CH=CHCH2CH3.
10. Note that the weak correlation between H2 and C5 is a long-range four-bond coupling.
1H–13C HMBC spectrum of cis-3-hexenyl benzoate (CDCl3, 400 MHz)
143

Organic Structures from 2D NMR Spectra 11. In the HMBC spectrum, the correlation from the aromatic proton signal at 7.41 ppm (H2)
to the quaternary aromatic carbon signal at 130.5 ppm confirms the assignment of the signal at 130.5 ppm as due to the ipso carbon C4.
12. All other correlations in the HMBC spectrum are consistent with the structure.
1H–13C HMBC spectrum of cis-3-hexenyl benzoate – expansion B
13. In the HMBC spectrum, the H3–C3' and H2–C2' correlations, while appearing to be one-bond correlations, actually arise from the 3JC–H interaction of a proton with the carbon meta to it.
144

Instructor’s Guide and Solutions Manual 14. The geometry about the double bond can be deduced from the NOESY spectrum. In
particular the H7–H10 correlation places the two –CH2– groups on the same side of the double bond and thus a cis geometry can be deduced.
1H–1H NOESY spectrum of cis-3-hexenyl benzoate (CDCl3, 400 MHz)
145

Organic Structures from 2D NMR Spectra
Problem 31
Question:
Identify the following compound.
Molecular Formula: C9H14O
IR: 1693 cm−1
Solution:
trans-2,cis-6-Nonadienal
1. The molecular formula is C9H14O. Calculate the degree of unsaturation from the molecular formula: ignore the O atom to give an effective molecular formula of C9H14 (CnHm) which gives the degree of unsaturation as (n – m/2 + 1) = 9 – 7 + 1 = 3. The compound contains a combined total of three rings and/or π bonds.
1H NMR spectrum of trans-2,cis-6-nonadienal (DMSO-d6, 400 MHz)
13C{1H} NMR spectrum of trans-2,cis-6-nonadienal (DMSO-d6, 100 MHz)
146

Instructor’s Guide and Solutions Manual 2. In the HSQC spectrum, the 1H 9.49 ppm / 13C 194.3 ppm correlation (H1–C1) confirms
the presence of an aldehyde group.
3. In the HSQC spectrum, the 1H 7.01 ppm / 13C 158.8 ppm (H3–C3), 1H 6.10 ppm / 13C 132.8 ppm (H2–C2), 1H 5.40 ppm / 13C 132.4 ppm (H7–C7) and 1H 5.32 ppm / 13C 127.4 ppm (H6–C6) correlations indicate the presence of two alkene groups.
4. In the HSQC spectrum, the 1H 2.38 ppm / 13C 32.2 ppm (H4–C4), 1H 2.22 ppm / 13C 25.0 ppm (H5–C5) and 1H 2.02 ppm / 13C 20.1 ppm (H8–C8) correlations indicate the presence of three –CH2– groups whilst the 1H 0.92 ppm / 13C 14.1 ppm (H9–C9) correlation indicates the presence of a methyl group.
5. The aldehyde and two alkene functional groups account for all of the degrees of unsaturation, so the compound contains no additional rings or multiple bonds.
1H–13C me-HSQC spectrum of trans-2,cis-6-nonadienal (DMSO-d6, 400 MHz)
147

Organic Structures from 2D NMR Spectra
1H–13C me-HSQC spectrum of trans-2,cis-6-nonadienal – expansion B
148

Instructor’s Guide and Solutions Manual 6. In the COSY spectrum, the H1–H2, H2–H3, H3–H4 and H5–H6 correlations afford the
HC(O)–CH=CH–CH2–CH2–CH= fragment. The H8–H9 and H7–H8 correlations afford the CH3–CH2–CH= fragment.
1H–1H COSY spectrum of trans-2,cis-6-nonadienal (DMSO-d6, 400 MHz)
7. All of the nuclei in the molecular formula have been accounted for. The two fragments can be linked together in only one way to afford HC(O)CH=CHCH2CH2CH=CHCH2CH3.
149

Organic Structures from 2D NMR Spectra 8. The HMBC spectrum can be used to confirm the linkage of the two fragments. This is
shown by the H6 → C8 and H7 → C5 correlations in expansion C and the H5 → C7 and H8 → C6 correlations in expansion E.
9. Note that the one-bond coupling between H1 and C1 is visible in the HMBC spectrum as a large doublet.
10. There is also a long-range four-bond correlation between H4 and C1.
11. All other correlations in the HMBC spectrum are consistent with the structure.
1H–13C HMBC spectrum of trans-2,cis-6-nonadienal (DMSO-d6, 400 MHz)
150

Instructor’s Guide and Solutions Manual
1H–13C HMBC spectrum of trans-2,cis-6-nonadienal – expansion C
1H–13C HMBC spectrum of trans-2,cis-6-nonadienal – expansion D
151

Organic Structures from 2D NMR Spectra 1H–13C HMBC spectrum of trans-2,cis-6-nonadienal – expansion E
152

Instructor’s Guide and Solutions Manual 12. The stereochemistry about the double bonds can be determined from the NOESY
spectrum.
13. In the NOESY spectrum, the H1–H3, H2–H4 and H3–H4 correlations indicate a trans geometry about the double bond adjacent to the aldehyde group.
14. The geometry about the second alkene group is determined particularly by the H5–H8 correlation which places the two –CH2– groups on the same side of the double bond, i.e. a cis geometry.
1H–1H NOESY spectrum of trans-2,cis-6-nonadienal (CDCl3, 400 MHz)
153

Organic Structures from 2D NMR Spectra
1H–1H NOESY spectrum of trans-2,cis-6-nonadienal – expansion F
1H–1H NOESY spectrum of trans-2,cis-6-nonadienal – expansion G
154
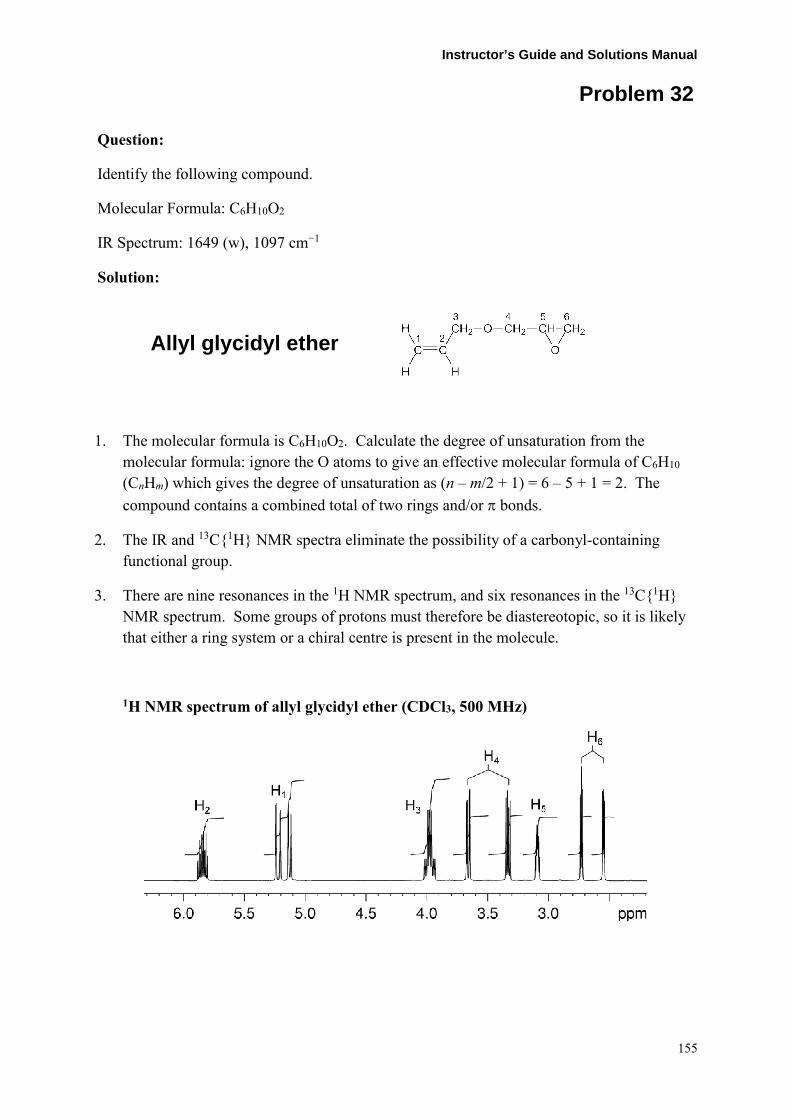
Instructor’s Guide and Solutions Manual
Problem 32
Question:
Identify the following compound.
Molecular Formula: C6H10O2
IR Spectrum: 1649 (w), 1097 cm−1
Solution:
Allyl glycidyl ether
1. The molecular formula is C6H10O2. Calculate the degree of unsaturation from the molecular formula: ignore the O atoms to give an effective molecular formula of C6H10 (CnHm) which gives the degree of unsaturation as (n – m/2 + 1) = 6 – 5 + 1 = 2. The compound contains a combined total of two rings and/or π bonds.
2. The IR and 13C{1H} NMR spectra eliminate the possibility of a carbonyl-containing functional group.
3. There are nine resonances in the 1H NMR spectrum, and six resonances in the 13C{1H} NMR spectrum. Some groups of protons must therefore be diastereotopic, so it is likely that either a ring system or a chiral centre is present in the molecule.
1H NMR spectrum of allyl glycidyl ether (CDCl3, 500 MHz)
155

Organic Structures from 2D NMR Spectra
13C{1H} NMR spectrum of allyl glycidyl ether (CDCl3, 125 MHz)
4. The me-HSQC spectrum easily identifies the protons (including diastereotopic pairs) and their associated carbon resonances: 5.84 ppm with 134.4 ppm (CH), 5.22 and 5.12 ppm with 117.2 ppm (CH2), 3.98 ppm with 72.3 ppm (CH2), 3.66 and 3.33 ppm with 70.8 ppm (CH2), 3.09 ppm with 50.7 ppm (CH), and 2.73 and 2.55 ppm with 44.3 ppm (CH2).
5. The chemical shifts of the carbon resonances at 134.4 and 117.2 ppm indicate the presence of a double bond, while the three protons associated with these signals show that the double bond is mono-substituted (CH2=CHX).
1H–13C me-HSQC spectrum of allyl glycidyl ether (CDCl3, 500 MHz)
156

Instructor’s Guide and Solutions Manual 6. The 1H–1H COSY spectrum identifies two isolated spin systems in the molecule. The
first involves the alkene signals (at 5.84 ppm, and 5.22/5.12 ppm) and the methylene signal at 3.98 ppm. The alkene-based spin system may be expanded to CH2=CHCH2X.
7. The second spin system identified by the COSY spectrum involves the remaining resonances in the 1H NMR spectrum. The methylene resonances at 3.66 and 3.33 ppm correlate to the CH resonance at 3.09 ppm, which further correlates to the methylene signals at 2.73 and 2.55 ppm. This spin system therefore consists of a –CH2CHCH2– fragment.
1H–1H COSY spectrum of allyl glycidyl ether (CDCl3, 500 MHz)
8. We have accounted for all the 1H and 13C nuclei in the formula; however two oxygen atoms remain unaccounted for. The two unique spin systems must be linked by one oxygen atom, so we have an ether: CH2=CHCH2OCH2CHCH2.
157

Organic Structures from 2D NMR Spectra 9. The second oxygen atom must “cap” the terminal CH and CH2 groups, so each carbon
atom forms the expected four bonds. The compound is therefore:
10. The HMBC spectrum shows expected two- and three-bond CH correlations (with the exception of H5 → C6), including those that occur across the bridging oxygen (i.e. H3 → C4 and H4 → C3).
1H–13C HMBC spectrum of allyl glycidyl ether (CDCl3, 500 MHz)
158
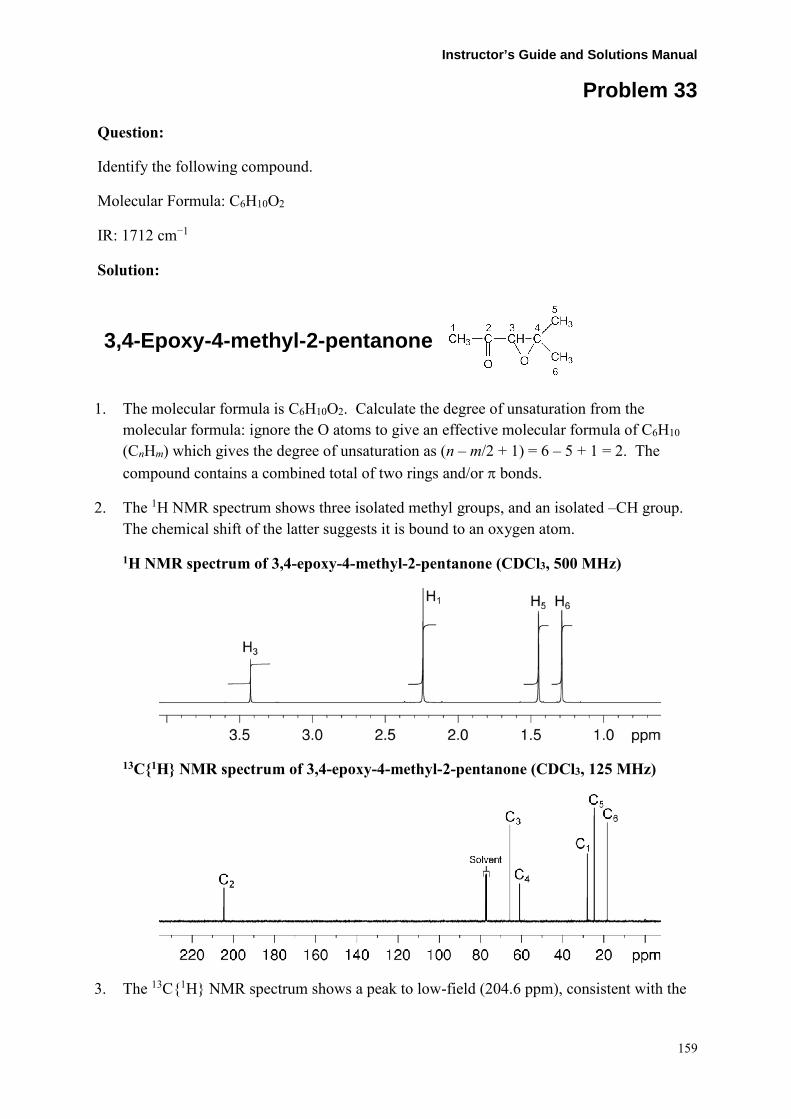
Instructor’s Guide and Solutions Manual
Problem 33
Question:
Identify the following compound.
Molecular Formula: C6H10O2
IR: 1712 cm−1
Solution:
3,4-Epoxy-4-methyl-2-pentanone
1. The molecular formula is C6H10O2. Calculate the degree of unsaturation from the molecular formula: ignore the O atoms to give an effective molecular formula of C6H10 (CnHm) which gives the degree of unsaturation as (n – m/2 + 1) = 6 – 5 + 1 = 2. The compound contains a combined total of two rings and/or π bonds.
2. The 1H NMR spectrum shows three isolated methyl groups, and an isolated –CH group. The chemical shift of the latter suggests it is bound to an oxygen atom.
1H NMR spectrum of 3,4-epoxy-4-methyl-2-pentanone (CDCl3, 500 MHz)
13C{1H} NMR spectrum of 3,4-epoxy-4-methyl-2-pentanone (CDCl3, 125 MHz)
3. The 13C{1H} NMR spectrum shows a peak to low-field (204.6 ppm), consistent with the
159

Organic Structures from 2D NMR Spectra
presence of a ketone functional group.
4. The me-HSQC spectrum identifies the protonated carbon atoms at 65.7 for the OCH carbon, and 28.1, 24.7 and 18.4 ppm for the three methyl carbons. The chemical shift of the quaternary carbon signal at 61.0 ppm suggests it is bound directly to an oxygen atom.
1H–13C me-HSQC spectrum of 3,4-epoxy-4-methyl-2-pentanone (CDCl3, 500 MHz)
5. The structural elements identified so far are:
a. A ketone (–C(=O)–).
b. Three isolated methyl groups (3 × –CH3).
c. An isolated –CH– group bound to oxygen.
d. A quaternary carbon atom bound to oxygen.
e. The latter oxygen must be common to (c) and (d), suggesting either an ether or an epoxide.
160

Instructor’s Guide and Solutions Manual 6. Using the 1H–13C HMBC spectrum, the elements can be pieced together.
7. Starting with the ketone resonance at 204 ppm (C2, which is arguably the most easily identified carbon resonance), there are correlations to the CH group (H3) and one methyl group (H1), giving us CH3–C(=O)–CH–. H1 also correlates to C3. In this case, H3 does not show a strong correlation to C1 due to a Karplus-type bond-angle effect.
8. In addition to C2, the CH proton H3 also correlates to the quaternary signal at 60 ppm (C4) and a second methyl group (C5). The methyl group cannot be directly bound to the CH fragment (otherwise the protons would couple), so we now have CH3–C(=O)–CH–C–CH3. The possibility of an ether linkage between the CH (C3) and CH3 (C5) groups can be ruled out based on the chemical shift of C5.
9. The correlation from the protons of the remaining methyl group H6 to quaternary carbon C4 as well as the correlations of the two methyl groups to each other (H6 → C5 and H5 → C6) affords CH3–C(=O)–CH–C–(CH3)2. The downfield chemical shifts of C4 and C3 indicate that they are bound to oxygen and there is only one oxygen atom left in the molecular formula so the compound must be an epoxide.
1H–13C HMBC spectrum of 3,4-epoxy-4-methyl-2-pentanone (CDCl3, 500 MHz)
161

Organic Structures from 2D NMR Spectra
Problem 34
Question:
Given below are six compounds which are isomers of C5H11NO2S. The 1H and 13C{1H} NMR spectra of one of the isomers are given below. The 1H–13C me-HSQC and 1H–13C HMBC spectra are given on the following page. To which of these compounds do the spectra belong?
Solution:
dl-Methionine
(Isomer A)
1H NMR spectrum of dl-methionine (D2O, 600 MHz)
162

Instructor’s Guide and Solutions Manual
13C{1H} NMR spectrum of dl-methionine (D2O, 150 MHz)
1. From the me-HSQC spectrum, the 1H and 13C chemical shifts of the methyl group H1 and C1 show that it is not bound to an oxygen atom. This excludes isomers D, E and F which are methyl esters.
2. From the coupling patterns of the two –CH2– and –CH groups, both –CH2– groups are adjacent to each other i.e. –CH2CH2CH– which excludes isomer B.
3. Note that the H3 protons are diastereotopic as they are parts of a –CH2– group adjacent to a chiral carbon C4.
1H–13C me-HSQC spectrum of dl-methionine (D2O, 600 MHz)
163

Organic Structures from 2D NMR Spectra 4. In the HMBC spectrum, the CH to carbonyl correlation (H4–C5) identifies the correct
isomer as isomer A. In isomer C, this would be an unlikely four-bond correlation.
1H–13C HMBC spectrum of dl-methionine (D2O, 600 MHz)
5. While this compound does contain a chiral centre, NMR cannot establish the absolute stereochemistry of the chiral centre.
164

Instructor’s Guide and Solutions Manual
Problem 35
Question:
Identify the following compound.
Molecular Formula: C8H15NO3
IR: 3333, 1702, 1626 cm−1
Solution:
N-Acetyl-l-leucine
1. The molecular formula is C8H15NO3. Calculate the degree of unsaturation from the molecular formula: ignore the O atoms, ignore the N atom and remove one H to give an effective molecular formula of C8H14 (CnHm) which gives the degree of unsaturation as (n – m/2 + 1) = 8 – 7 + 1 = 2. The compound contains a combined total of two rings and/or π bonds.
2. IR and 1D spectra establish that there are two carbonyl groups (13C resonances at 174.7 and 169.7 ppm). This accounts for all of the degrees of unsaturation, so the compound contains no additional rings or multiple bonds.
3. The 1H resonance at 8.09 ppm (H8) exchanges with D2O on warming and indicates the presence of an amide group (O=C–NH). The 1H resonance at 12.47 ppm (H9) exchanges with D2O and must be due to a carboxylic acid.
4. Further inspection of the 1H NMR spectrum shows the presence of two –CH groups at 4.22 and 1.64 ppm (H2 and H4), one –CH2– group at 1.50 ppm (H3) and three –CH3 groups at 1.85, 0.91 and 0.86 ppm (H7, H5a and H5b). The multiplicities of these signals are confirmed by the correlations in the me-HSQC spectrum.
1H NMR spectrum of N-acetyl-l-leucine (DMSO-d6, 600 MHz)
165

Organic Structures from 2D NMR Spectra
13C{1H} NMR spectrum of N-acetyl-l-leucine (DMSO-d6, 150 MHz)
5. In the COSY spectrum, the amide resonance H8 correlates with the CH resonance H2. Further correlations between H2–H3, H3–H4 and H4–H5a/H5b extend the skeleton to O=C–NH–CH–CH2–CH(CH3)2.
6. Note that the H3 protons are diastereotopic as they are part of a –CH2– group adjacent to chiral centre C2.
1H–1H COSY spectrum of N-acetyl leucine (DMSO-d6, 600 MHz)
166

Instructor’s Guide and Solutions Manual
1H–1H COSY spectrum of N-acetyl leucine – expansion A
167

Organic Structures from 2D NMR Spectra 7. The me-HSQC spectrum easily identifies the 13C resonances of the protonated carbons:
the two CH carbons are at 50.7 and 24.8 ppm (C2 and C4), the CH2 carbon is at 40.5 ppm (C3), and the three methyl carbons are at 23.3, 21.8 and 22.8 ppm (C5a, C5b and C7).
1H–13C me-HSQC spectrum of N-acetyl leucine (DMSO-d6, 600 MHz)
8. In the HMBC spectrum, the H8–C6 correlation identifies C6 as the amide carbonyl.
9. The H2–C1 and H3–C1 correlations in the HMBC spectrum indicate that the carboxylic acid group C1 is bound to C2.
10. The remaining methyl group is located next to the amide by the H7–C6 correlation in the HMBC spectrum.
11. While this compound does contain a chiral centre, NMR cannot establish the absolute stereochemistry of the chiral centre.
168

Instructor’s Guide and Solutions Manual
1H–13C HMBC spectrum of N-acetyl leucine (DMSO-d6, 600 MHz)
1H–13C HMBC spectrum of N-acetyl leucine – expansion B
169

Organic Structures from 2D NMR Spectra
Problem 36
Question:
Identify the following compound.
Molecular Formula: C10H20O2
IR: 1739 cm−1
Solution:
Isoamyl valerate
1. The molecular formula is C10H20O2. Calculate the degree of unsaturation from the molecular formula: ignore the O atoms to give an effective molecular formula of C10H20 (CnHm) which gives the degree of unsaturation as (n – m/2 + 1) = 10 – 10 + 1 = 1. The compound contains one ring or one functional group containing a double bond.
2. IR and 1D spectra establish that the compound contains an ester functional group (13C resonance at 174.0 ppm). This accounts for all of the degrees of unsaturation, so the compound contains no additional rings or multiple bonds.
3. Inspection of the 1H NMR spectrum identifies five –CH2– groups at 4.10, 2.29, 1.61, 1.52 and 1.35 ppm, one –CH group at 1.69 ppm and three overlapping –CH3 groups at 0.92 ppm. The multiplicities of these signals are confirmed using the me-HSQC spectrum.
4. The 1H signal at 4.10 ppm (H6) must be bound to an oxygen atom based on chemical shift.
1H NMR spectrum of isoamyl valerate (CDCl3, 500 MHz)
170

Instructor’s Guide and Solutions Manual
13C{1H} NMR spectrum of isoamyl valerate (CDCl3, 125 MHz)
5. The TOCSY spectrum identifies all the correlated spins in a spin system. There are two spin systems – one containing three –CH2– and one –CH3 groups (H1–H2–H3–H4) and the other containing two –CH2–, one –CH and two –CH3 groups (H6–H7–H8–H9).
1H–1H TOCSY spectrum of isoamyl valerate (CDCl3, 500 MHz)
171

Organic Structures from 2D NMR Spectra 6. There is only one way to assemble the first spin system – CH2CH2CH2CH3.
7. There are two possible arrangements for the second spin system:
8. Note that there are two different CH3 environments at 22.5 (2 × C9) and 13.7 (C1) ppm in the me-HSQC spectrum. One must belong to the first spin system (C1) while the remaining two methyl groups must be equivalent (C9) i.e. the OCH2CH2CH(CH3)2 fragment is correct.
1H–13C me-HSQC spectrum of isoamyl valerate (CDCl3, 500 MHz)
9. The molecule can be assembled in only one way.
172

Instructor’s Guide and Solutions Manual
Problem 37
Question:
The 1H and 13C{1H} NMR spectra of (E)-4-methyl-4'-nitrostilbene (C15H13NO2) recorded in acetone-d6 solution at 298 K and 500 MHz are given below.
The 1H NMR spectrum has signals at δ 2.34, 7.23, 7.33, 7.48, 7.56, 7.83 and 8.22 ppm.
The 13C{1H} NMR spectrum has signals at δ 21.3, 124.8, 126.2, 127.9, 128.0, 130.3, 134.1, 134.8, 139.5, 145.3 and 147.5 ppm.
The 2D 1H–1H COSY, multiplicity-edited 1H–13C HSQC and 1H–13C HMBC spectra are given on the following pages. Use these spectra to assign the 1H and 13C{1H} resonances for this compound.
Solution:
(E)-4-Methyl-4'-nitrostilbene
Proton Chemical Shift (ppm) Carbon Chemical Shift (ppm) H1 2.34 C1 21.3
C2 139.5 H3 7.23 C3 130.3 H4 7.56 C4 128.0
C5 134.8 H6 7.48 C6 134.1 H7 7.33 C7 126.2
C8 145.3 H9 7.83 C9 127.9 H10 8.22 C10 124.8
C11 147.5
1. The methyl group, H1 and C1, is easily identified in the 1H and 13C{1H} NMR spectra, on the basis of its chemical shifts (2.34 and 21.3 ppm, respectively). The correlation between these two peaks in the me-HSQC confirms this assignment.
173

Organic Structures from 2D NMR Spectra
1H NMR spectrum of (E)-4-methyl-4'-nitrostilbene (acetone-d6, 500 MHz)
13C{1H} NMR spectrum of (E)-4-methyl-4'-nitrostilbene (acetone-d6, 125 MHz)
174

Instructor’s Guide and Solutions Manual 2. In expansion D of the HMBC spectrum, the methyl group (H1) correlates to two signals at
130.3 and 139.5 ppm.
3. Remember that, in aromatic systems, the three-bond coupling 3JC–H is typically the larger long-range coupling and gives rise to the strongest cross-peaks.
1H–13C HMBC spectrum of (E)-4-methyl-4'-nitrostilbene – expansion D (acetone-d6, 500 MHz)
175

Organic Structures from 2D NMR Spectra 4. In the me-HSQC spectrum, the resonance at 130.3 ppm correlates to the 1H signal at
7.23 ppm. This correlation identifies these signals as belonging to C3 and H3, respectively.
5. Further confirmation of the identity of H3 can be seen in expansion B of the HMBC spectrum where there is a correlation from the 1H signal at 7.23 ppm (H3) to the methyl carbon (C1).
6. In the me-HSQC spectrum, the resonance at 139.5 ppm does not correlate to any signals in the 1H NMR spectrum. It is therefore a quaternary carbon (either C2 or C5). C5 is too far removed from H1 to experience coupling, so the signal at 139.5 ppm must arise from C2.
1H–13C me-HSQC spectrum of (E)-4-methyl-4'-nitrostilbene – expansion A (acetone-d6, 500 MHz)
176

Instructor’s Guide and Solutions Manual
1H–13C HMBC spectrum of (E)-4-methyl-4'-nitrostilbene – expansion B
177

Organic Structures from 2D NMR Spectra 7. In expansion C of the HMBC spectrum, H3 correlates to the 13C signal at 134.8 ppm.
Inspection of the me-HSQC shows that this signal arises from a quaternary carbon. H3 is three bonds from C5, which is quaternary. C5 is therefore assigned.
1H–13C HMBC spectrum of (E)-4-methyl-4'-nitrostilbene – expansion C
178

Instructor’s Guide and Solutions Manual 8. The aryl proton H3 (at 7.23 ppm) correlates to the signal at 7.56 ppm in the COSY
spectrum, identifying H4.
1H–1H COSY spectrum of (E)-4-methyl-4'-nitrostilbene (acetone-d6, 500 MHz)
9. In the me-HSQC spectrum, H4 (at 7.56 ppm) correlates to the 13C signal at 128.0 ppm, identifying C4.
179

Organic Structures from 2D NMR Spectra 10. In expansion C of the HMBC spectrum, H4 correlates to three 13C resonances. The first,
to the signal at 128.0 ppm appears to be a one-bond correlation, however this signal arises from the 3JC–H interaction between the H4 proton and the chemically equivalent C4' carbon which is three bonds away. The second correlation is to the signal at 134.1 ppm, while the third is the expected three-bond correlation to C2 (139.5 ppm).
11. In the me-HSQC spectrum, the 13C resonance at 134.1 ppm correlates to the 1H signal at 7.48 ppm. These resonances are identified as belonging to C6 and H6 on the basis of the three bond separation between H4 and C6 (which gives rise to the correlation noted in the point above). In the 1H NMR spectrum, the large splitting of this peak (16 Hz) confirms that the signal arises from one of the two vinyl protons.
12. In expansion C of the HMBC spectrum, H6 correlates to three 13C signals: the signal at 126.2 ppm, one of the two signals at ~128 ppm, and the signal at 145.3 ppm. H6 is three bonds removed from C4 (128.0 ppm) and C8. The me-HSQC spectrum shows that the 13C signal at 126.2 ppm correlates to the 1H signal at 7.33, while the 13C signal at 145.3 ppm is quaternary. C8 (which is quaternary) is therefore assigned to the signal at 145.3 ppm. The signal at 126.2 ppm is not yet assigned.
13. In the COSY spectrum, H6 correlates to the signal at 7.33 ppm, which identifies this signal as belonging to H7. The me-HSQC spectrum then identifies C7 (126.2 ppm). This identifies the unassigned correlation observed in the previous step.
14. In expansion C of the HMBC spectrum, H7 correlates to three 13C signals: one of the two signals at ~128 ppm, the signal at 134.1 ppm (C6) and the signal at 134.8 (C5). H7 is three bonds removed from C9, which is therefore identified as the signal at 127.9 ppm (as the signal at 128.0 ppm has been previously assigned to C4). The me-HSQC spectrum identifies H9 as the 1H resonance at 7.83 ppm.
15. In expansion C of the HMBC spectrum, H9 correlates strongly to two 13C signals: at 126.2 (C7) and 147.5 ppm. The me-HSQC spectrum shows that the resonance at 147.5 ppm belongs to a quaternary carbon. As H9 is three bonds removed from C11, this signal is assigned to C11.
16. In the COSY spectrum, H9 correlates to the signal at 8.22 ppm, which identifies this signal as belonging to H10. The me-HSQC spectrum then identifies C10 (124.8 ppm).
180

Instructor’s Guide and Solutions Manual
Problem 38
Question:
Identify the following compound.
Molecular Formula: C11H16O
IR: 3450 (br) cm−1
Solution:
2-tert-Butyl-6-methylphenol
1. The molecular formula is C11H16O. Calculate the degree of unsaturation from the molecular formula: ignore the O atom to give an effective molecular formula of C11H16 (CnHm) which gives the degree of unsaturation as (n – m/2 + 1) = 11 – 8 + 1 = 4. The compound contains a combined total of four rings and/or π bonds.
2. 1D spectra establish that the compound is a trisubstituted benzene. The aromatic ring accounts for all of the degrees of unsaturation, so the compound contains no additional rings or multiple bonds.
3. The coupling pattern in the expansion of the aromatic region of the 1H NMR spectrum shows that the three protons on the aromatic ring must occupy adjacent positions. The proton at 6.78 ppm is the proton at the middle of the spin system since it has two large splittings (i.e. it has two ortho-protons) whereas the other two aromatic protons each have only one large splitting.
4. The three substituents on the aromatic ring must therefore be in adjacent positions i.e. this compound is a “1,2,3-trisubstituted benzene”.
5. 1D spectra establish that the substituents are an –OH group (1H resonance at 4.73 ppm, exchangeable), a –CH3 group (three proton resonance at 2.22 ppm) and a tert-butyl group (nine proton resonance at 1.41 ppm) but, at this stage, it is not possible to establish which substituents are where.
181

Organic Structures from 2D NMR Spectra
1H NMR spectrum of 2-tert-butyl-6-methylphenol (CDCl3, 600 MHz)
13C{1H} NMR spectrum of 2-tert-butyl-6-methylphenol (CDCl3, 150 MHz)
6. For a “1,2,3-trisubstituted benzene”, there are three possible isomers:
182

Instructor’s Guide and Solutions Manual 7. The 1H–13C me-HSQC spectrum easily identifies the protonated carbons. The three
methyl groups of the tert-butyl group appear at 29.8 ppm and the aromatic methyl group is at 15.9 ppm.
8. The protonated aromatic carbons are at 120.0, 125.0 and 128.6 ppm and specifically the central proton at 6.78 ppm correlates to the carbon at 120.0 ppm. The remaining two aromatic protons at 7.14 and 6.98 ppm correlate to the carbons at 125.0 and 128.6 ppm, respectively.
9. The three aromatic carbons which bear the substituents appear at 152.7, 135.6 and 123.0 ppm. The low-field carbon resonance (152.7 ppm) must be the carbon bearing the –OH substituent based on its chemical shift.
1H–13C me-HSQC spectrum of 2-tert-butyl-6-methylphenol (CDCl3, 600 MHz)
183

Organic Structures from 2D NMR Spectra 10. In the 1H–13C HMBC spectrum, the aromatic protons at the ends of the three-spin system
(at 7.14 and 6.98 ppm) both correlate to the 13C resonance at 152.7 ppm.
11. Remember that, in aromatic systems, the three-bond coupling 3JC–H is typically the larger long-range coupling and gives rise to the strongest cross-peaks. Therefore, the low-field carbon resonance (bearing the –OH substituent) must be meta to the protons at 7.14 and 6.98 ppm which identifies Isomer C as the correct answer.
1H–13C HMBC spectrum of 2-tert-butyl-6-methylphenol (CDCl3, 600 MHz)
12. In the HMBC spectrum, the methyl protons (H9) should correlate to C1 and C5 (three-bond correlations) as well as to the ipso carbon (C6, a two-bond correlation). There is a correlation from H9 to C1 (at 153 ppm), as well as to the resonances at 128.6 (protonated) and 123.0 ppm (non-protonated). This identifies C5 as the resonance at 128.6 ppm (and, from the HSQC spectrum, H5 as the 1H NMR resonance at 6.98 ppm), and C6 as the resonance at 123.0 ppm. H3 is therefore the resonance at 7.14 ppm, and C3 the resonance at 125.0 ppm.
184

Instructor’s Guide and Solutions Manual 13. Similarly, the tert-butyl protons (H8) should correlate to the ipso carbon (C2, a three-bond
correlation), and there is indeed a correlation between H8 and the non-protonated carbon resonance at 135.6 ppm.
14. We would expect correlations to C7 from H3 (3JC–H) and H8 (2JC–H), and these are present in the spectrum.
15. In the HMBC spectrum, the –OH proton also correlates to the ipso carbon C1 (a two-bond correlation), and C2 and C6, which are three-bonds away. Note that correlations from exchangeable protons are not always observed.
16. Note also that in the HMBC spectrum for this compound, there is a strong correlation between H8 and C8'. While this appears to be a one-bond correlation, in tert-butyl groups, the apparent one-bond correlation arises from the 3JC–H interaction of the protons of one of the methyl groups with the chemically equivalent carbon which is three bonds away.
185

Organic Structures from 2D NMR Spectra
Problem 39
Question:
Identify the following compound.
Molecular Formula: C10H12O
IR: 3600 (br), 1638, 1594, 1469 (s) cm−1
Solution:
2-Allyl-6-methylphenol
1. The molecular formula is C10H12O. Calculate the degree of unsaturation from the molecular formula: ignore the O atom to give an effective molecular formula of C10H12 (CnHm) which gives the degree of unsaturation as (n – m/2 + 1) = 10 – 6 + 1 = 5. The compound contains a combined total of five rings and/or π bonds.
2. 1D spectra establish that the compound is a trisubstituted benzene. The aromatic ring accounts for four degrees of unsaturation and the remaining degree of unsaturation is accounted for by a double bond (alkene 1H resonances at 5.99 and 5.15 ppm).
3. The coupling pattern in the aromatic region of the 1H NMR spectrum shows that the three protons on the aromatic ring must occupy adjacent positions. The proton at 6.77 ppm is the proton at the middle of the spin system since it has two large splittings (i.e. it has two ortho-protons) whereas the other two aromatic protons each have only one large splitting.
4. The three substituents on the aromatic ring must therefore be in adjacent positions i.e. this compound is a “1,2,3-trisubstituted benzene”.
5. 1D spectra establish that two of the substituents are an –OH substituent (1H resonance at 4.99 ppm, exchangeable) and a –CH3 group (three proton resonance at 2.21 ppm).
186

Instructor’s Guide and Solutions Manual
1H NMR spectrum of 2-allyl-6-methylphenol (CDCl3, 500 MHz)
13C{1H} NMR spectrum of 2-allyl-6-methylphenol (CDCl3, 125 MHz)
187

Organic Structures from 2D NMR Spectra 6. The 1H–1H COSY spectrum shows coupling from the resonance at 3.38 ppm (integration
two protons) to the two resonances at 5.1 (CH2) and 5.99 (CH) ppm. The chemical shift of the latter two resonances is consistent with alkene protons, so we can identify an allyl group (CH2=CHCH2–) as the third substituent on the aromatic ring. At this stage, it is not possible to establish which substituents are where.
1H–1H COSY spectrum of 2-allyl-6-methylphenol (CDCl3, 500 MHz)
7. For a “1,2,3-trisubstituted benzene”, there are three possible isomers:
188

Instructor’s Guide and Solutions Manual 8. The 1H–13C me-HSQC spectrum easily identifies the protonated carbons. The methyl
group is at 15.8 ppm. The aliphatic CH2 group is at 35.5 ppm while the alkene CH and CH2 groups are at 136.7 and 116.6 ppm, respectively.
9. The protonated aromatic carbons are at 120.5, 128.1 and 129.4 ppm and specifically the central proton at 6.77 ppm correlates to the carbon at 120.5 ppm. The remaining two aromatic protons at 6.99 and 6.93 ppm correlate to the carbons at 129.4 and 128.0 ppm, respectively.
10. The three aromatic carbons which bear the substituents appear at 152.5, 124.7 and 124.2 ppm. The low-field carbon resonance (152.5 ppm) must be the carbon bearing the –OH substituent based on its chemical shift.
1H–13C me-HSQC spectrum of 2-allyl-6-methylphenol (CDCl3, 500 MHz)
189

Organic Structures from 2D NMR Spectra
1H–13C me-HSQC spectrum of 2-allyl-6-methylphenol – expansion A
190

Instructor’s Guide and Solutions Manual 11. In the 1H–13C HMBC spectrum (expansion B), the aromatic protons at the ends of the
three-spin system (at 6.99 and 6.93 ppm) both correlate to the 13C resonance at 152.5 ppm.
12. Remember that, in aromatic systems, the three-bond coupling 3JC–H is typically the larger long-range coupling and gives rise to the strongest cross-peaks. Therefore, the low-field carbon resonance (bearing the –OH substituent) must be meta to the protons at 6.99 and 6.93 ppm which identifies Isomer B as the correct answer.
1H–13C HMBC spectrum of 2-allyl-6-methylphenol (CDCl3, 500 MHz)
191

Organic Structures from 2D NMR Spectra 1H–13C HMBC spectrum of 2-allyl-6-methylphenol – expansion B
192

Instructor’s Guide and Solutions Manual 13. In the HMBC spectrum (expansion C), the methyl protons (H10) should correlate to C1
and C5 (three-bond correlations) as well as to the ipso carbon (C6, a two-bond correlation). There is a correlation from methyl proton H10 to C1 (at 152.5 ppm), as well as to the resonances at 129.3 (protonated) and 124.2 ppm (non-protonated). This identifies C5 as the resonance at 129.3 ppm (and, from the HSQC spectrum, H5 as the 1H NMR resonance at 6.99 ppm), and C6 as the resonance at 124.2 ppm. H3 is therefore the resonance at 6.93 ppm and C3 the resonance at 128.0 ppm.
14. Similarly, the allyl protons alpha to the aromatic ring (H7) should correlate to the ipso carbon (C2, a two-bond correlation), and there is indeed a correlation between H7 and the non-protonated carbon resonance at 124.7 ppm. We would also expect three-bond correlations to C1 and C3, as well as correlations to the rest of the allyl group, and these are all observed.
1H–13C HMBC spectrum of 2-allyl-6-methylphenol – expansion C
15. In the HMBC spectrum (expansion B), the –OH proton correlates to C2 and C6, which are three bonds away. The two-bond correlation to C1 is not observed. Note that correlations from exchangeable protons are not always observed.
193

Organic Structures from 2D NMR Spectra
Problem 40
Question:
Identify the following compound.
Molecular Formula: C8H8O3
IR: 3022 (br w), 1675, 1636 cm−1
Solution:
2-Hydroxy-4-methoxybenzaldehyde
1. The molecular formula is C8H8O3. Calculate the degree of unsaturation from the molecular formula: ignore the O atoms to give an effective molecular formula of C8H8 (CnHm) which gives the degree of unsaturation as (n – m/2 + 1) = 8 – 4 + 1 = 5. The compound contains a combined total of five rings and/or π bonds.
2. 1D NMR data establish that the compound is a trisubstituted benzene and contains an aldehyde functional group (δH 9.70 ppm, δC 194.4 ppm). This accounts for all of the degrees of unsaturation, so the compound contains no additional rings or multiple bonds.
3. The coupling pattern in the aromatic region of the 1H NMR spectrum establishes that the substituents are in positions 1, 2 and 4 on the aromatic ring. The proton at 6.42 ppm clearly has no ortho couplings and must be the isolated proton in the spin system sandwiched between two substituents (H3). The two protons at 6.53 and 7.42 ppm each have a large ortho coupling so they must be adjacent to each other. The proton at 6.53 ppm has an additional meta coupling so it must be H5. The remaining proton at 7.42 ppm must be H6.
4. From the 1D spectra, the substituents on the aromatic ring are an aldehyde, a methoxy group (–OCH3, δH 3.85 ppm, δC 55.7 ppm) and a hydroxyl group (–OH, δH 11.5 ppm, exchangeable). It is not yet possible to establish which substituents are where.
194

Instructor’s Guide and Solutions Manual
1H NMR spectrum of 2-hydroxy-4-methoxybenzaldehyde (CDCl3, 600 MHz)
13C{1H} NMR spectrum of 2-hydroxy-4-methoxybenzaldehyde (CDCl3, 150 MHz)
5. For a 1,2,4-trisubstituted aromatic ring, there are six possible isomers:
195

Organic Structures from 2D NMR Spectra 6. The 1H–13C me-HSQC spectrum easily identifies the protonated carbons: C3 at 100.7, C5
at 108.4, C6 at 135.3, C7 at 194.3 and C8 at 55.7 ppm.
1H–13C me-HSQC spectrum of 2-hydroxy-4-methoxybenzaldehyde (CDCl3, 600 MHz)
196

Instructor’s Guide and Solutions Manual 7. In the 1H–13C HMBC spectrum, the aromatic proton resonance H6 correlates to the
aldehyde carbon resonance C7, thus placing the aldehyde group in position 1 of the ring.
8. The OH proton resonance correlates to aromatic carbon resonance C3 in the HMBC spectrum thus the OH group is located adjacent to C3 in position 2 of the benzene ring.
9. By elimination, the methoxy group is in position 4 of the benzene ring (Isomer B).
1H–13C HMBC spectrum of 2-hydroxy-4-methoxybenzaldehyde (CDCl3, 600 MHz)
197

Organic Structures from 2D NMR Spectra
Problem 41
Question:
Identify the following compound.
Molecular Formula: C9H10O2
IR: 1644, 1618 cm−1
Solution:
2'-Hydroxy-5'-methylacetophenone
1. The molecular formula is C9H10O2. Calculate the degree of unsaturation from the molecular formula: ignore the O atoms to give an effective molecular formula of C9H10 (CnHm) which gives the degree of unsaturation as (n – m/2 + 1) = 9 – 5 + 1 = 5. The compound contains a combined total of five rings and/or π bonds.
2. IR and 1D NMR data establish the compound is a trisubstituted benzene and contains a ketone functional group (13C resonance at 204.4 ppm). This accounts for all of the degrees of unsaturation, so the compound contains no additional rings or multiple bonds.
3. The coupling pattern in the expansion of the aromatic region of the 1H NMR spectrum shows that the compound must be a “1,2,4-trisubstituted benzene”. The proton at 7.48 ppm clearly has no ortho couplings and must be the isolated proton in the spin system sandwiched between two substituents. The two protons at 7.26 and 6.85 ppm each have a large ortho coupling so they must be adjacent to each other. The proton at 7.26 ppm has an additional meta coupling so it must be the proton meta to the proton at 7.48 ppm. The remaining proton at 6.85 ppm must be the proton para to the proton at 7.48 ppm.
4. There are signals for two methyl groups at 2.59 and 2.30 ppm, one of which must be part of a methyl ketone (O=CCH3). The remaining substituent on the aromatic ring is a hydroxy group (–OH, δH 12.08 ppm, exchangeable). It is not yet possible to establish which substituents are where.
198

Instructor’s Guide and Solutions Manual
1H NMR spectrum of 2'-hydroxy-5'-methylacetophenone (CDCl3, 600 MHz)
13C{1H} NMR spectrum of 2'-hydroxy-5'-methylacetophenone (CDCl3, 150 MHz)
199

Organic Structures from 2D NMR Spectra 5. The 1H–13C me-HSQC spectrum easily identifies the protonated
carbons. The isolated aromatic proton at 7.48 ppm correlates to the carbon at 130.6 ppm. The aromatic protons at 7.26 and 6.85 ppm correlate to the carbons at 137.5 and 118.1 ppm, respectively. The methyl protons at 2.59 and 2.30 ppm correlate to the carbons at 26.6 and 20.5 ppm, respectively.
6. The three aromatic carbons which bear the substituents appear at 160.3, 128.1 and 119.4 ppm. The low-field carbon resonance (160.3 ppm) must be the carbon bearing the –OH substituent based on its chemical shift.
1H–13C me-HSQC spectrum of 2'-hydroxy-5'-methylacetophenone (CDCl3, 600 MHz)
200
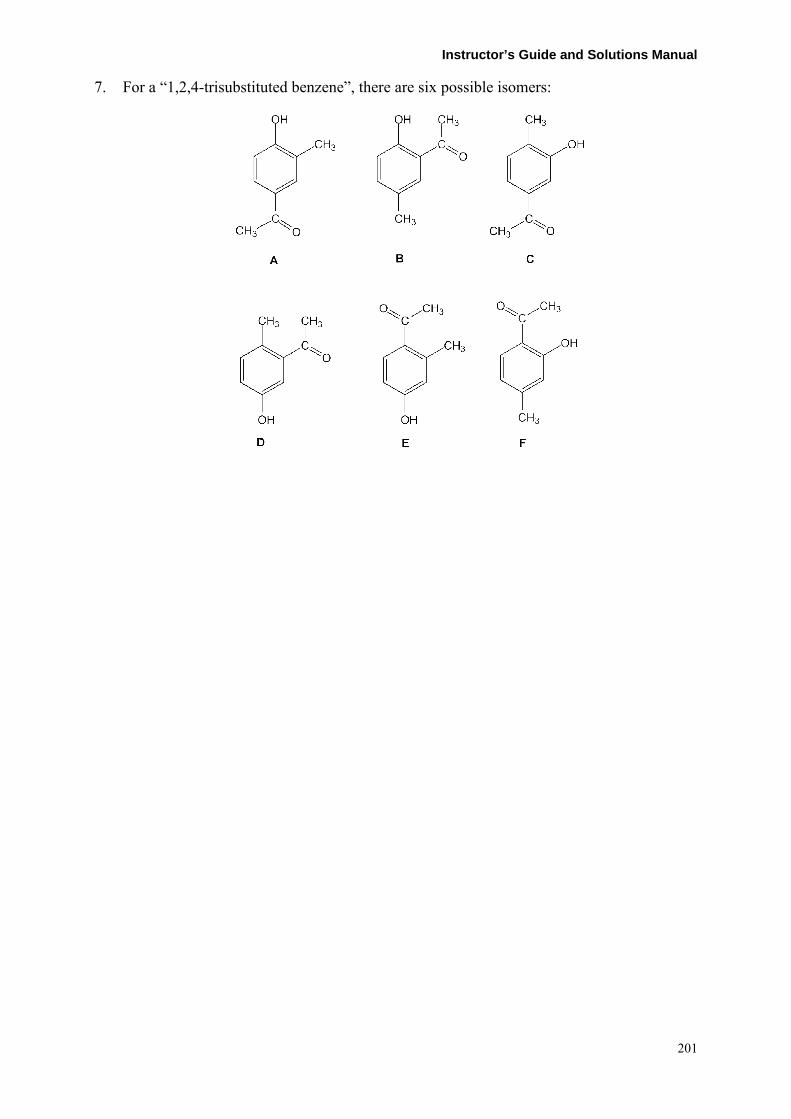
Instructor’s Guide and Solutions Manual 7. For a “1,2,4-trisubstituted benzene”, there are six possible isomers:
201

Organic Structures from 2D NMR Spectra 8. In the HMBC spectrum, the methyl proton resonance at 2.59 ppm correlates with the
ketone resonance at 204.4 ppm identifying the methyl group attached to the ketone.
9. In the HMBC spectrum, the 1H resonance for the other methyl group at 2.30 ppm correlates to protonated aromatic carbons at 130.6 and 137.5 ppm placing the methyl group between these two aromatic carbons. The reciprocal correlations from the aromatic protons at 7.48 and 7.26 ppm to methyl carbon at 20.5 ppm confirm the position of the methyl group. This eliminates Isomers A, C, D and E.
10. In the HMBC spectrum, the aromatic proton resonance at 7.48 ppm correlates to the ketone carbon at 204.4 ppm thus placing the methyl ketone group ortho to the proton at 7.48 ppm on the aromatic ring. This identifies Isomer B as the correct isomer.
1H–13C HMBC spectrum of 2'-hydroxy-5'-methylacetophenone (CDCl3, 600 MHz)
202

Instructor’s Guide and Solutions Manual
Problem 42
Question:
Identify the following compound.
Molecular Formula: C9H9FO2
IR: 1681 cm−1
Solution:
3'-Fluoro-4'-methoxyacetophenone
1. The molecular formula is C9H9FO2. Calculate the degree of unsaturation from the molecular formula: replace the F by H and ignore the O atoms to give an effective molecular formula of C9H10 (CnHm) which gives the degree of unsaturation as (n – m/2 + 1) = 9 – 5 + 1 = 5. The compound contains a combined total of five rings and/or π bonds.
2. The IR and 13C{1H} NMR spectra establish that the compound is aromatic and contains a ketone functional group (quaternary 13C resonance at 195.9 ppm – although not visible in the spectra given, the ketone resonance is fluorine-coupled with 4JC–F = 1.8 Hz). This accounts for all of the degrees of unsaturation, so the compound contains no additional rings or multiple bonds.
3. There are three aromatic proton resonances in the 1H NMR spectrum. On the basis of the coupling pattern in the 1H{19F}NMR spectrum, the compound must be a “1,2,4-trisubstituted benzene”. The proton at 7.68 ppm clearly has no ortho couplings and must be the isolated proton in the spin system sandwiched between two substituents. The two protons at 7.75 and 7.20 ppm each have a large ortho coupling so they must be adjacent to each other. The proton at 7.75 ppm has an additional meta coupling so it must be the proton meta to the proton at 7.68 ppm. The remaining proton at 7.20 ppm must be the proton para to the proton at 7.68 ppm.
4. The strong fluorine coupling experienced by the aromatic protons suggests that the fluorine is bound directly to the aromatic ring.
203

Organic Structures from 2D NMR Spectra
5. The 1H NMR spectrum has two three-proton resonances: the first at 3.90 ppm, and the second at 2.50 ppm. The chemical shift of the former is consistent with a methoxy group, –OCH3, while the second is consistent with an acyl group (–C(=O)CH3).
1H NMR spectrum of 3'-fluoro-4'-methoxyacetophenone (DMSO-d6, 400 MHz)
1H and 1H{19F} NMR spectra of 3'-fluoro-4'-methoxyacetophenone – expansions
13C{1H} NMR spectrum of 3'-fluoro-4'-methoxyacetophenone (DMSO-d6, 100 MHz)
204

Instructor’s Guide and Solutions Manual
6. The 1H–13C me-HSQC spectrum easily identifies the protonated carbons. The isolated aromatic proton at 7.68 ppm correlates to the carbon at 115.5 ppm. The aromatic protons at 7.75 and 7.20 ppm correlate to the carbons at 126.4 and 113.4 ppm, respectively. The methyl protons at 3.90 and 2.50 ppm correlate to the carbons at 56.5 and 26.6 ppm, respectively.
1H–13C me-HSQC spectrum of 3'-fluoro-4'-methoxyacetophenone (DMSO-d6, 400 MHz)
205

Organic Structures from 2D NMR Spectra 7. For a “1,2,4-trisubstituted benzene”, there are six possible isomers:
206

Instructor’s Guide and Solutions Manual 8. The 1H–1H NOESY spectrum identifies the relative substitution
pattern. Remember that NOESY spectra are symmetrical about a diagonal, so we need only be concerned with cross-peaks either above or below the diagonal.
9. The acyl protons at 2.50 ppm are close in space to the aromatic protons at 7.75 and 7.68 ppm, placing the acyl group between these two protons on the aromatic ring. This eliminates isomers C, D, E and F.
10. In the 1H–1H NOESY spectrum, the aromatic proton at 7.20 ppm correlates to the methoxy group at 3.90 ppm thus placing the methoxy group ortho to the proton at 7.20 ppm on the aromatic ring. Isomer A (3'-fluoro-4'-methoxyacetophenone) is therefore the correct answer.
1H–1H NOESY spectrum of 3'-fluoro-4'-methoxyacetophenone (DMSO-d6, 400 MHz)
207

Organic Structures from 2D NMR Spectra 11. There are three quaternary aromatic carbon signals at 151.7, 151.5 and 130.3 ppm and
these can be assigned by comparison of the 13C{1H} and 13C{1H,19F} NMR spectra.
12. The 13C signal at 151.5 ppm has the largest coupling to fluorine (1JC–F = 245 Hz) and must be due to the aromatic carbon directly bound to the fluorine atom (C3).
13. The 13C signal at 151.7 ppm has a larger coupling to fluorine (2JC–F = 10 Hz) than the signal at 130.3 ppm (3JC–F = 5 Hz) and can be assigned to C4. The signal at 130.3 ppm can thus be assigned to C1.
13C{1H} NMR spectrum of 3'-fluoro-4'-methoxyacetophenone – expansions
13C{1H,19F} NMR spectrum of 3'-fluoro-4'-methoxyacetophenone – expansions
208

Instructor’s Guide and Solutions Manual
Problem 43
Question:
Identify the following compound.
Molecular Formula: C10H10O4
Solution:
trans-Ferulic acid
1. The molecular formula is C10H10O4. Calculate the degree of unsaturation from the molecular formula: ignore the O atoms to give an effective molecular formula of C10H10 (CnHm) which gives the degree of unsaturation as (n – m/2 + 1) = 10 – 5 + 1 = 6. The compound contains a combined total of six rings and/or π bonds.
2. 1D NMR data establish that the compound is aromatic and contains an alkene (1H signals at 7.65, 6.42 ppm, both doublets with 3JH–H = 16 Hz thus alkene protons are trans to each other) and a carbonyl functional group (13C signal at 167.7 ppm). This accounts for all of the degrees of unsaturation, so the compound contains no additional rings or multiple bonds.
3. 1D NMR data also establish the presence of two hydroxyl groups (1H signals at 10.5 and 8.15 ppm, exchangeable) and a methoxy group (1H signal at 3.95 ppm, 13C signal at 55.5 ppm).
4. The coupling pattern in the expansion of the aromatic region of the 1H NMR spectrum shows that the compound must be a “1,2,4-trisubstituted benzene”. The proton at 7.36 ppm clearly has no ortho couplings and must be the isolated proton sandwiched between two substituents. The two protons at 7.17 and 6.91 ppm each have a large ortho coupling so they must be adjacent to each other. The proton at 7.17 ppm has an additional meta coupling so it must be the proton meta to the proton at 7.36 ppm. The remaining proton at 6.91 ppm must be the proton para to the proton at 7.36 ppm.
209

Organic Structures from 2D NMR Spectra
1H NMR spectrum of trans-ferulic acid (acetone-d6, 600 MHz)
1H NMR spectrum of trans-ferulic acid – expansion
13C{1H} NMR spectrum of trans-ferulic acid (acetone-d6, 150 MHz)
210

Instructor’s Guide and Solutions Manual 5. The COSY spectrum shows the expected correlations between the alkene protons at 7.65
and 6.42 ppm. It also shows the expected correlations between the aromatic protons.
1H–1H COSY spectrum of trans-ferulic acid (acetone-d6, 600 MHz)
211
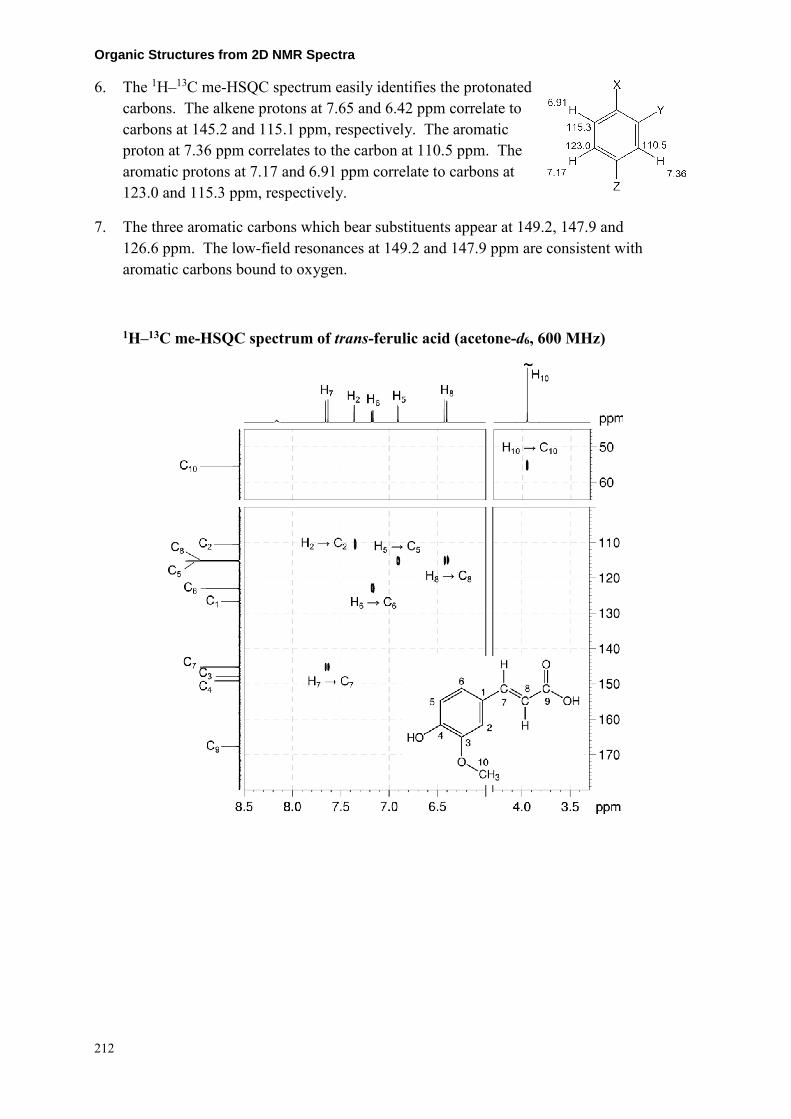
Organic Structures from 2D NMR Spectra 6. The 1H–13C me-HSQC spectrum easily identifies the protonated
carbons. The alkene protons at 7.65 and 6.42 ppm correlate to carbons at 145.2 and 115.1 ppm, respectively. The aromatic proton at 7.36 ppm correlates to the carbon at 110.5 ppm. The aromatic protons at 7.17 and 6.91 ppm correlate to carbons at 123.0 and 115.3 ppm, respectively.
7. The three aromatic carbons which bear substituents appear at 149.2, 147.9 and 126.6 ppm. The low-field resonances at 149.2 and 147.9 ppm are consistent with aromatic carbons bound to oxygen.
1H–13C me-HSQC spectrum of trans-ferulic acid (acetone-d6, 600 MHz)
212

Instructor’s Guide and Solutions Manual 8. In the HMBC spectrum, the alkene proton at 7.65 ppm correlates
to the protonated aromatic carbons at 110.5 and 123.0 ppm, thus placing the alkene group between these two aromatic carbons (i.e. at position Z on the ring). The reciprocal correlations from the aromatic protons at 7.36 and 7.17 ppm to the alkene carbon at 145.2 ppm confirm the position of the alkene group.
9. Remember that, in aromatic systems, the three-bond coupling 3JC–H is typically the larger long-range coupling and gives rise to the strongest cross-peaks.
10. In the HMBC spectrum, the correlations from the aromatic protons at 7.36 and 7.17 ppm to the quaternary aromatic carbon signal at 149.2 ppm identify the carbon meta to both these protons (i.e. the carbon bearing substituent X). The correlations from the aromatic proton at 6.91 and the alkene proton at 6.42 ppm to the quaternary aromatic carbon signal at 126.6 ppm identify the carbon three-bonds away from both these protons (i.e. the carbon bearing substituent Z). The correlation from the aromatic proton at 6.91 ppm to the quaternary aromatic carbon signal at 147.9 ppm identifies the carbon meta to this proton (i.e. the carbon bearing substituent Y).
11. In the HMBC spectrum, the correlation of the methoxy group at 3.95 ppm to the carbon at 147.9 ppm places the methoxy group in position Y of the ring.
12. The correlation from the alkene proton at 7.65 ppm to the carbonyl carbon at 167.7 ppm places the carbonyl group next to the alkene functionality.
13. By elimination, one hydroxyl group must be in position X of the ring and the other bound to the carbonyl group to give a carboxylic acid.
213
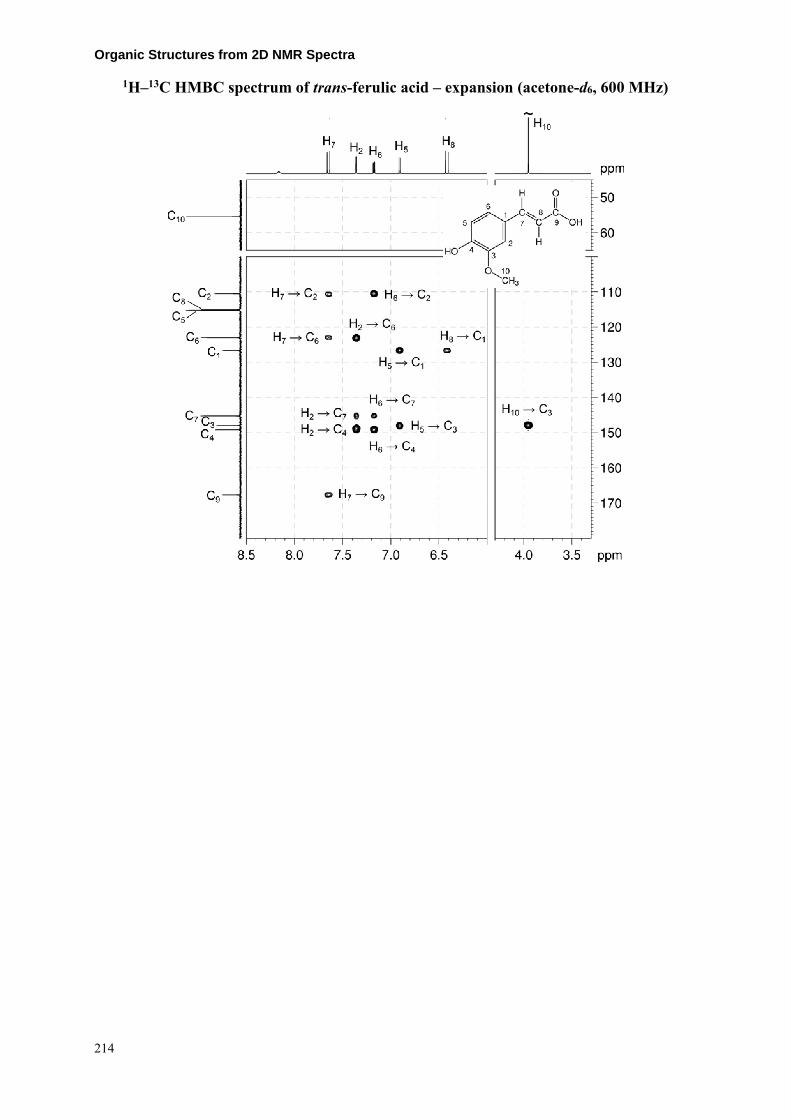
Organic Structures from 2D NMR Spectra
1H–13C HMBC spectrum of trans-ferulic acid – expansion (acetone-d6, 600 MHz)
214

Instructor’s Guide and Solutions Manual
Problem 44
Question:
Identify the following compound.
Molecular Formula: C13H16O3
IR: 3385 (br), 2973, 1685, 1636, 1583 cm−1
Solution:
sec-Butyl 3-hydroxycinnamate
1. The molecular formula is C13H16O3. Calculate the degree of unsaturation from the molecular formula: ignore the O atoms to give an effective molecular formula of C13H16 (CnHm) which gives the degree of unsaturation as (n – m/2 + 1) = 13 – 8 + 1 = 6. The compound contains a combined total of six rings and/or π bonds.
2. IR and 1D NMR data establish the presence of an alkene (1H resonances at 7.61 and 6.46 ppm, both doublets with 3JH–H = 16 Hz thus alkene protons are trans to each other, H7 and H8, respectively), a disubstituted benzene ring (1H resonances at 7.26, 7.14, 7.12 and 6.92 ppm) and an ester group (13C resonance at 165.9 ppm). This accounts for all of the degrees of unsaturation, so the compound contains no additional rings or multiple bonds.
3. 1D NMR data also establish the presence of a hydroxyl (1H resonance at 8.58 ppm, exchangeable), an OCH group (1H resonance at 4.93 ppm, H10), a CH2 group (1H resonance at 1.63 ppm, H11) and two methyl groups (1H resonances at 1.25 and 0.93 ppm, H13 and H12, respectively). The multiplicities of the signals are confirmed by the 1H–13C me-HSQC spectrum.
4. The coupling pattern in the aromatic region of the 1H NMR spectrum establishes that the benzene ring is 1,3-disubstituted with the signal at 7.12 ppm due to the proton between the two substituents (H2) and the signal at 7.26 ppm due to the proton between two aromatic protons (H5).
215
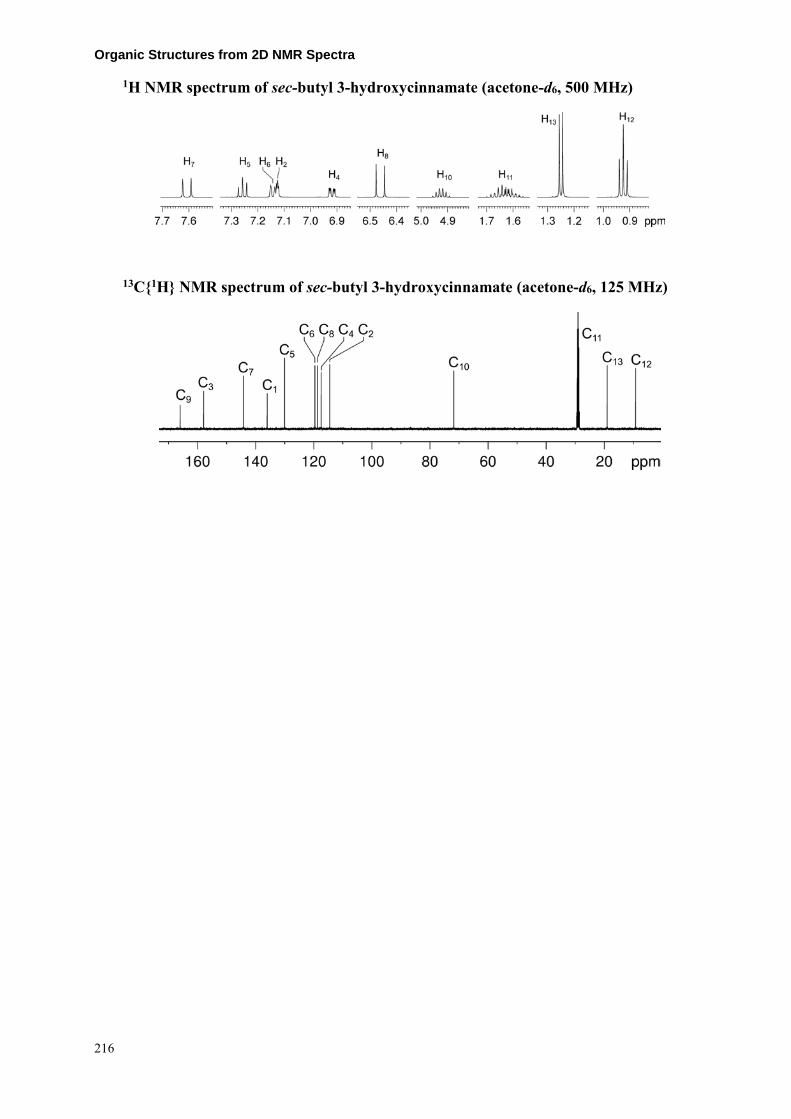
Organic Structures from 2D NMR Spectra
1H NMR spectrum of sec-butyl 3-hydroxycinnamate (acetone-d6, 500 MHz)
13C{1H} NMR spectrum of sec-butyl 3-hydroxycinnamate (acetone-d6, 125 MHz)
216

Instructor’s Guide and Solutions Manual 5. The COSY spectrum shows the expected correlations between the two alkene protons
(H7–H8) and aromatic protons.
6. The COSY spectrum also shows correlations from methyl protons H12 to methylene protons H11, then from methylene protons H11 to protons of OCH group H10, and lastly from OCH protons H10 to methyl protons H13 which afford the OCH(CH3)CH2CH3 fragment.
1H–1H COSY spectrum of sec-butyl 3-hydroxycinnamate (acetone-d6, 500 MHz)
7. The protonated carbons are easily identified by the me-HSQC spectrum: C10, C11, C13 and C12 at 71.8, 28.7, 19.0 and 9.2 ppm, respectively. From expansion A: C7, C5, C6, C8, C4 and C2 at 144.2, 130.0, 119.6, 118.7, 117.5 and 114.5 ppm, respectively.
217

Organic Structures from 2D NMR Spectra
1H–13C me-HSQC spectrum of sec-butyl 3-hydroxycinnamate (acetone-d6, 500 MHz)
1H–13C me-HSQC spectrum of sec-butyl 3-hydroxycinnamate – expansion A
218

Instructor’s Guide and Solutions Manual 8. In expansion B of the HMBC spectrum, all correlations are consistent with the
OCH(CH3)CH2CH3 fragment deduced earlier using the COSY spectrum.
9. Note that the one bond couplings between H12 and C12 and between H13 and C13 are visible as large doublets.
1H–13C HMBC spectrum of sec-butyl 3-hydroxycinnamate – expansion B (acetone-d6, 500 MHz)
219

Organic Structures from 2D NMR Spectra 10. In expansion C of the HMBC spectrum, the alkene to carbonyl correlations (H7–C9,
H8–C9) and the OCH to carbonyl correlation (H10–C9) places the carbonyl group between the alkene and OCH groups.
11. In the HMBC spectrum, the alkene proton H7 to protonated aromatic carbon C2 / C6 correlations as well as the aromatic proton H2 / H6 to alkene carbon C7 correlations place the alkene group in position 1 of the ring.
14. By elimination, the hydroxyl group must be located at position 3 on the benzene ring. The downfield chemical shift of C3 is consistent with a quaternary aromatic carbon bound to oxygen.
1H–13C HMBC spectrum of sec-butyl 3-hydroxycinnamate – expansion C
15. The H7, H5 and H8 correlations to the quaternary aromatic carbon signal at 136.0 ppm identifies the resonance as due to C1.
16. The H5, H2 and H4 correlations to the quaternary aromatic carbon signal at 157.9 ppm identifies the resonance as due to C3.
220

Instructor’s Guide and Solutions Manual
Problem 45
Question:
Identify the following compound. Draw a labeled structure, and use the 1H–1H COSY, 1H–13C me-HSQC, and 1H–13C HMBC spectra to assign each of the 1H and 13C resonances to the appropriate carbons and hydrogens in the structure.
Molecular Formula: C11H12O
IR: 1676 cm−1
Solution:
1-Benzosuberone
Proton Chemical Shift (ppm) Carbon Chemical Shift (ppm)
C1 207.0
H2 2.70 C2 40.8
H3 1.77 C3 20.9
H4 1.85 C4 25.2
H5 2.89 C5 32.4
H6 7.17 C6 129.7
H7 7.38 C7 132.1
H8 7.26 C8 126.5
H9 7.70 C9 128.5
C10 141.3
C11 138.8
1. The molecular formula is C11H12O. Calculate the degree of unsaturation from the molecular formula: ignore the O atom to give an effective molecular formula of C11H12 (CnHm) which gives the degree of unsaturation as (n – m/2 + 1) = 11 – 6 + 1 = 6. The compound contains a combined total of six rings and/or π bonds.
221

Organic Structures from 2D NMR Spectra 2. The coupling pattern in the aromatic region of the 1H NMR spectrum identifies an ortho-
disubstituted aromatic ring. From the integration of the alkyl region of the spectrum, it is clear that there are four CH2 groups, all of which show complicated coupling patterns.
3. The 13C{1H} NMR spectrum shows a signal to low-field (207.0 ppm), consistent with the presence of a ketone functional group.
4. The aromatic ring and ketone functional group accounts for five degrees of unsaturation and the remaining degree of unsaturation may be due to a ring.
1H NMR spectrum of 1-benzosuberone (CDCl3, 500 MHz)
13C{1H} NMR spectrum of 1-benzosuberone (CDCl3, 125 MHz)
222

Instructor’s Guide and Solutions Manual 5. The 1H–1H COSY spectrum (expansion A) indicates that all the CH2 groups are
sequentially linked – affording a CH2CH2CH2CH2 chain. Expansion B confirms that the aromatic ring is 1,2-disubstituted.
1H–1H COSY spectrum of 1-benzosuberone – expansion A (CDCl3, 500 MHz)
223

Organic Structures from 2D NMR Spectra
1H–1H COSY spectrum of 1-benzosuberone – expansion B
6. The molecular formula is now accounted for, and the known fragments are:
7. There is only one way to assemble these fragments, so the compound must be 1-benzosuberone:
224

Instructor’s Guide and Solutions Manual 8. We can now begin to assign each resonance to its corresponding nucleus. The carbonyl
carbon (C1) is the most readily identified, so we will build out from there, initially using the HMBC spectrum.
1H–13C HMBC spectrum of 1-benzosuberone (CDCl3, 500 MHz)
9. There is one correlation from an aromatic proton to the carbonyl carbon. Remember that, in aromatic systems, the three-bond coupling 3JC–H is typically the larger long-range coupling and gives rise to the strongest cross-peaks. Three-bond couplings to benzylic carbon atoms are also large. Using this information, it is possible to assign the low-field aromatic resonance at 7.70 ppm to H9 – as this proton is three bonds removed from the carbonyl carbon atom.
225

Organic Structures from 2D NMR Spectra 10. Using the 1H–13C me-HSQC spectrum, we can identify C9 as the resonance at 128.5 ppm.
1H–13C me-HSQC spectrum of 1-benzosuberone (CDCl3, 500 MHz)
11. In the HMBC spectrum, H9 should also correlate to the two aromatic ring carbon atoms meta to it, i.e. C7 and C10. Indeed, H9 correlates to the carbon resonances at 132.1 and 141.3 ppm.
12. Using the 1H–13C me-HSQC spectrum, we can demonstrate that the resonance at 132.1 ppm corresponds to a protonated carbon nucleus, and therefore must be C7. H7 is identified as the signal at 7.38 ppm. C10 is the resonance at 141.3 ppm.
13. As the signal at 138.8 ppm is also a quaternary carbon atom, this must correspond to C11.
14. Using the COSY spectrum (or the coupling patterns in the 1D proton spectrum) we can identify H8 as the signal at 7.26 ppm, and H6 as the signal at 7.17 ppm. From the me-HSQC spectrum, C8 and C6 are assigned to the signals at 126.5 and 129.7 ppm, respectively.
226

Instructor’s Guide and Solutions Manual 15. In the HMBC spectrum, the alkyl signals at 2.70 and 1.77 ppm both correlate to the
carbonyl carbon, but from the 1H–1H COSY spectrum, we know that the signal at 2.70 ppm is due to a terminal CH2, and must therefore be H2. The 1H resonance at 1.77 ppm is assigned to H3.
16. Using the 1H–13C me-HSQC spectrum, C2 is identified as the resonance at 40.8 ppm and C3 as the resonance at 20.9 ppm.
17. From the 1H–1H COSY spectrum, we can identify H4 (which couples to H3) as the resonance at 1.85 ppm and H5 (which couples to H4) as the resonance at 2.89 ppm.
18. Using the 1H–13C me-HSQC spectrum, C4 is identified as the resonance at 25.2 ppm and C5 as the resonance at 32.4 ppm.
227

Organic Structures from 2D NMR Spectra
Problem 46
Question:
Identify the following compound. Draw a labeled structure, and use the 1H–13C me-HSQC, 1H–1H COSY and 1H–31P HMBC spectra to assign each of the 1H and 13C resonances to the appropriate carbons and hydrogens in the structure.
Molecular Formula: C5H12BrO3P
IR: 3464, 2955, 1232, 1031 cm−1
Solution:
Dimethyl (3-bromopropyl)phosphonate
Proton Chemical Shift (ppm) Carbon Chemical Shift (ppm)
H1 3.69 C1 52.5
H2 1.87 C2 23.3
H3 2.09 C3 25.8
H4 3.42 C4 33.5
1. The molecular formula is C5H12BrO3P. The method for calculating the degree of unsaturation does not work for this compound as it contains a P atom.
2. ID spectra establish that there are two methoxy (OCH3) groups (1H resonance at 3.69 ppm, 13C resonance at 52.5 ppm) and three CH2 groups (1H resonances at 3.42, 2.09 and 1.87 ppm). This accounts for all the C and H atoms as well as two of the three O atoms in the molecule.
228

Instructor’s Guide and Solutions Manual
1H NMR spectrum of dimethyl (3-bromopropyl)phosphonate (CDCl3, 400 MHz)
1H{31P} NMR spectrum of dimethyl (3-bromopropyl)phosphonate (CDCl3, 400 MHz)
13C{1H} NMR spectrum of dimethyl (3-bromopropyl)phosphonate (CDCl3, 100 MHz)
229

Organic Structures from 2D NMR Spectra 3. In the COSY spectrum, the H2–H3 and H3–H4 correlations indicate that the CH2 protons
are sequentially linked affording a –CH2CH2CH2– fragment.
1H–1H COSY spectrum of dimethyl (3-bromopropyl)phosphonate (CDCl3, 400 MHz)
230

Instructor’s Guide and Solutions Manual 4. In the me-HSQC spectrum, the 1H signal at 3.42 ppm correlates with the 13C signal at
33.5 ppm. The 13C chemical shift is consistent with those for a CH2–Br group rather than a CH2O group (13C shifts for CH2O groups are in the 50–75 ppm range). This affords a –CH2CH2CH2Br fragment.
5. Note that the C2 resonance on the vertical axis is split into a large doublet by a coupling to 31P and that the H2–C2 correlation is similarly split.
1H–13C me-HSQC spectrum of dimethyl (3-bromopropyl)phosphonate (CDCl3, 400 MHz)
231

Organic Structures from 2D NMR Spectra 6. The 1H–31P HMBC spectrum shows two- and three-bond correlations between proton and
phosphorus nuclei. In the 1H–31P HMBC spectrum, there are correlations from methoxy protons H1 to the phosphorus signal, as well as from methylene protons H2 and H3 to the phosphorus signal. The methoxy groups must be bound to phosphorus to afford the (CH3O)2P fragment.
7. The bromopropyl group must also be bound to phosphorus as there are correlations from H2 and H3 to phosphorus in the 1H–31P HMBC spectrum.
1H–31P HMBC spectrum of dimethyl (3-bromopropyl)phosphonate (CDCl3, 400 MHz)
8. The remaining oxygen atom must be bound to P with a double bond to satisfy the valency of the P atom.
9. The 13C resonances can now be assigned using the 1H–13C me-HSQC spectrum.
10. Note that there is a large 1JC–P coupling of 143 Hz for C2.
232

Instructor’s Guide and Solutions Manual
Problem 47
Question:
The 1H and 13C{1H} NMR spectra of caffeine (C8H10N4O2) recorded in DMSO-d6 solution at 298 K and 500 MHz are given below.
The 1H NMR spectrum has signals at δ 3.16, 3.35, 3.84 and 7.96 ppm.
The 13C{1H} NMR spectrum has signals at δ 27.4, 29.3, 33.1, 106.5, 142.7, 148.0, 150.9 and 154.4 ppm.
The 15N NMR spectrum has signals at δ 112.9, 149.6, 156.1 and 231.2 ppm.
The multiplicity-edited 1H–13C HSQC, 1H–13C HMBC and 1H–15N HMBC spectra are given on the following pages. Use these spectra to assign each 1H, 13C and 15N resonance to its corresponding nucleus.
Solution:
Caffeine
Proton Chemical Shift (ppm) Nucleus Chemical Shift (ppm)
N1 149.6
C2 150.9
N3 112.9
C4 148.0
C5 106.5
C6 154.4
N7 156.1
H8 7.96 C8 142.7
N9 231.2
H10 3.16 C10 27.4
H11 3.35 C11 29.3
H12 3.84 C12 33.1
233

Organic Structures from 2D NMR Spectra
1H NMR spectrum of caffeine (DMSO-d6, 500 MHz)
13C{1H} NMR spectrum of caffeine (DMSO-d6, 500 MHz)
234

Instructor’s Guide and Solutions Manual 1. The most readily identifiable signal is that corresponding to H8, at 7.96 ppm. From the
1H–13C me-HSQC spectrum we can identify C8 as the signal at 142.7 ppm.
1H–13C me-HSQC spectrum of caffeine (DMSO-d6, 500 MHz)
2. In the 1H–13C HMBC spectrum, there is a correlation between the proton resonance at 3.84 ppm and C8. H10 and H11 are too far removed from C8 to correlate, so this signal must be due to H12.
3. Using the HSQC spectrum, we can then identify C12 as the signal at 33.1 ppm.
235

Organic Structures from 2D NMR Spectra
1H–13C HMBC spectrum of caffeine (DMSO-d6, 500 MHz)
4. In the 1H–13C HMBC spectrum, there is also a correlation between the resonance H12 (3.84 ppm) and the 13C resonance at 106.5 ppm. This signal must be assigned to C5, as H12 is three bonds removed from this carbon nucleus.
5. In the 1H–13C HMBC spectrum, H8 shows three correlations – a very weak correlation to C12, a correlation to C5, and a correlation to the signal at 148.0 ppm. This signal must be due to C4.
6. The methyl signal at 3.35 ppm also correlates to C4. As H10 is too far removed to correlate to this position, this resonance must be due to H11.
7. C11 is identified from the me-HSQC spectrum as the resonance at 29.3 ppm.
8. In the 1H–13C HMBC spectrum, H11 also correlates to the resonance at 150.9 ppm. The resonance at 150.9 ppm is therefore assigned to C2.
9. By elimination, the remaining signal in the 1H NMR spectrum (at 3.16 ppm) is due
236

Instructor’s Guide and Solutions Manual
to H10. This resonance correlates to the signal at 27.4 ppm in the me-HSQC spectrum (C10) and to the signals at 150.9 (C2) and 154.4 ppm in the 1H–13C HMBC spectrum. The latter signal is therefore identified as C6.
10. There is an unsuppressed one-bond correlation in the 1H–13C HMBC spectrum (between H8 and C8).
11. The 1H–15N HMBC spectrum shows two- and three-bond correlations between proton and nitrogen nuclei. The chemical shifts of the nitrogen nuclei can be determined using the 1H–15N HMBC spectrum:
a. H10 correlates to the signal at 149.6 ppm, which must be N1.
b. H11 correlates to the signal at 112.9 ppm, which must be N3.
c. H12 correlates to the signal at 156.1 ppm, which must be N7.
d. H8 correlates to the signals at 156.1 ppm (N7) and 231.2 ppm. The latter signal must correspond to N9.
1H–15N HMBC spectrum of caffeine (DMSO-d6, 500 MHz)
237

Organic Structures from 2D NMR Spectra
Problem 48
Question:
Identify the following compound.
Molecular Formula: C10H11NO
IR: 2252 cm−1
Solution:
Benzyloxypropionitrile
1. The molecular formula is C10H11NO. Calculate the degree of unsaturation from the molecular formula: ignore the O atom and ignore the N and remove one H to give an effective molecular formula of C10H10 (CnHm) which gives the degree of unsaturation as (n – m/2 + 1) = 10 – 5 + 1 = 6. The compound contains a combined total of six rings and/or π bonds.
2. 1D NMR data establish that the compound is aromatic which accounts for four degrees of unsaturation. There are two remaining degrees of unsaturation.
3. IR (2252 cm−1) and 13C NMR (resonance at 117.9 ppm) spectra indicate the possibility of a nitrile group.
4. In the 1H NMR spectrum, there are overlapping signals for a phenyl ring at 7.40–7.25 ppm (total integration 5H, H1/H2/H3), two OCH2 groups at 4.56 and 3.65 ppm (H5 and H6, respectively) and one CH2 group at 2.58 ppm (H7). The multiplicities of the signals can be verified by the me-HSQC spectrum.
1H NMR spectrum of benzyloxypropionitrile (CDCl3, 500 MHz)
238

Instructor’s Guide and Solutions Manual
13C{1H} NMR spectrum of benzyloxypropionitrile (CDCl3, 125 MHz)
5. Both 1H NMR and COSY spectra show that the H6 and H7 protons are coupled to afford a OCH2CH2 fragment.
1H–1H COSY spectrum of benzyloxypropionitrile (CDCl3, 500 MHz)
239

Organic Structures from 2D NMR Spectra
6. The protonated carbons C5, C6 and C7 are easily assigned by the me-HSQC spectrum to resonances at 73.3, 64.4 and 18.9 ppm, respectively.
7. Although the aromatic H–C correlations in the me-HSQC spectrum are not resolved, the structure can still be determined.
1H–13C me-HSQC spectrum of benzyloxypropionitrile (CDCl3, 500 MHz)
240

Instructor’s Guide and Solutions Manual 8. In the HMBC spectrum, the correlations from the aryl protons to the quaternary carbon
signal at 137.3 ppm identifies the signal as the ipso carbon C4.
9. The HAr–C5, H5–CAr and H5–C4 correlations in the HMBC spectrum place the C5 CH2 group next to the benzene ring.
10. There is no correlation between H5 and H6 in the COSY spectrum indicating that they are not adjacent to each other. However, the H6–C5 and H5–C6 correlations in the HMBC spectrum indicate that they are connected by a single atom, most likely oxygen as this would be consistent with the chemical shifts of H5, H6, C5 and C6.
11. We are left with one carbon atom (13C resonance at 117.9 ppm, C8), one nitrogen atom and two remaining degrees of unsaturation which, together with the IR data, are indicative of a nitrile group. The H6–C8 and H7–C8 correlations in the HMBC spectrum place the nitrile carbon next to methylene group C7.
12. Note that in the HMBC spectrum there are unsuppressed one-bond correlations (H5–C5 and H6–C6) which appear as doublets.
1H–13C HMBC spectrum of benzyloxypropionitrile (CDCl3, 500 MHz)
241

Organic Structures from 2D NMR Spectra
Problem 49
Question:
Identify the following compound.
Molecular Formula: C10H18O
Solution:
Cineole
1. The molecular formula is C10H18O. Calculate the degree of unsaturation from the molecular formula: ignore the O atom to give an effective molecular formula of C10H18 (CnHm) which gives the degree of unsaturation as (n – m/2 + 1) = 10 – 9 + 1 = 2. The compound contains a combined total of two rings and/or π bonds.
2. Using a combination of the integration in the 1H NMR spectrum and the me-HSQC spectrum, there are the following groups in the molecule:
- three CH3 groups at 1H 1.05 / 13C 27.6 ppm (H1/C1) and 1H 1.24 / 13C 28.9 ppm (H7/C7) – two of which are equivalent (H7/C7)
- one CH group at 1H 1.41 / 13C 33.0 ppm (H5/C5)
- two CH2 groups with diastereotopic protons at 1H 1.66, 1.50 / 13C 31.6 ppm (H3a,H3b/C3) and 1H 2.02, 1.50 / 13C 22.9 ppm (H4a,H4b/C4) – based on integration, there are two sets of each CH2 group.
3. From the 13C NMR spectrum, there are also two quaternary carbons at 73.6 and 69.8 ppm (C6 and C2). These signals are shifted downfield and are likely bound to oxygen.
1H NMR spectrum of cineole (CDCl3, 600 MHz)
242

Instructor’s Guide and Solutions Manual
13C{1H} NMR spectrum of cineole (CDCl3, 150 MHz)
1H–13C me-HSQC spectrum of cineole (CDCl3, 600 MHz)
243

Organic Structures from 2D NMR Spectra 4. The INADEQUATE spectrum shows direct 13C–13C connectivity.
5. Beginning with the methyl carbon resonance at 27.6 ppm (C1), the correlation to the quaternary carbon signal at 69.8 ppm (C2) affords a CH3–C fragment.
6. C2 has a correlation to the methylene carbon signal at 31.6 ppm (C3). There are two equivalent methylene groups for C3 so we now have the following fragment:
7. C3 has a correlation to the methylene carbon signal at 22.9 ppm (C4). There are two equivalent methylene groups for C4 so we now have the following fragment:
8. C4 has a correlation to the methine carbon signal at 33.0 ppm (C5) which extends the fragment to:
9. C5 has a correlation to the quaternary carbon signal at 73.6 ppm (C6) which affords:
10. C6 has a correlation to the methyl carbon signal at 28.9 ppm (C7). There are two equivalent methyl groups for C7 which affords:
11. There remains a single oxygen atom in the molecular formula and it must be located between quaternary carbons C2 and C6 based on the chemical shifts of these carbons. There are no correlations in the INADEQUATE spectrum between C2 and C6 because of the oxygen atom between them.
244

Instructor’s Guide and Solutions Manual 12. Redrawing the structure affords:
INADEQUATE spectrum of cineole (CDCl3, 150 MHz)
245

Organic Structures from 2D NMR Spectra
Problem 50
Question:
Given below are nine benzoquinones which are isomers of C10H12O2. The 1H and 13C{1H} NMR spectra of one of the isomers are given below. The 1H–13C me-HSQC and 1H–13C HMBC spectra are given on the following page. To which of these compounds do the spectra belong?
HINT: In benzoquinones, three-bond C–H correlations in the HMBC spectrum (3JC–H) are significantly larger than two-bond C–H correlations (2JC–H) (which are negligible).
Solution:
Thymoquinone
(Isomer C)
1. The 1H NMR spectrum shows that the alkene protons show only small couplings. The low-field signal at 6.60 ppm is a quartet (long-range coupling to a –CH3 group), and the high-field signal at 6.53 ppm is a doublet (long-range coupling to a –CH group). There is no evidence that the two alkene protons are mutually coupled, so isomers A, F, H and I may be eliminated as possibilities.
246

Instructor’s Guide and Solutions Manual
1H NMR spectrum of thymoquinone (CDCl3, 500 MHz)
13C{1H} NMR spectrum of thymoquinone (CDCl3, 150 MHz)
247

Organic Structures from 2D NMR Spectra 2. The 1H–13C me-HSQC spectrum shows direct (one-bond) correlations between proton
and carbon nuclei. The protonated carbons are easily identified as signals at 133.9, 130.4, 26.6, 21.4 and 15.4 ppm.
1H–13C me-HSQC spectrum of thymoquinone (CDCl3, 600 MHz)
248
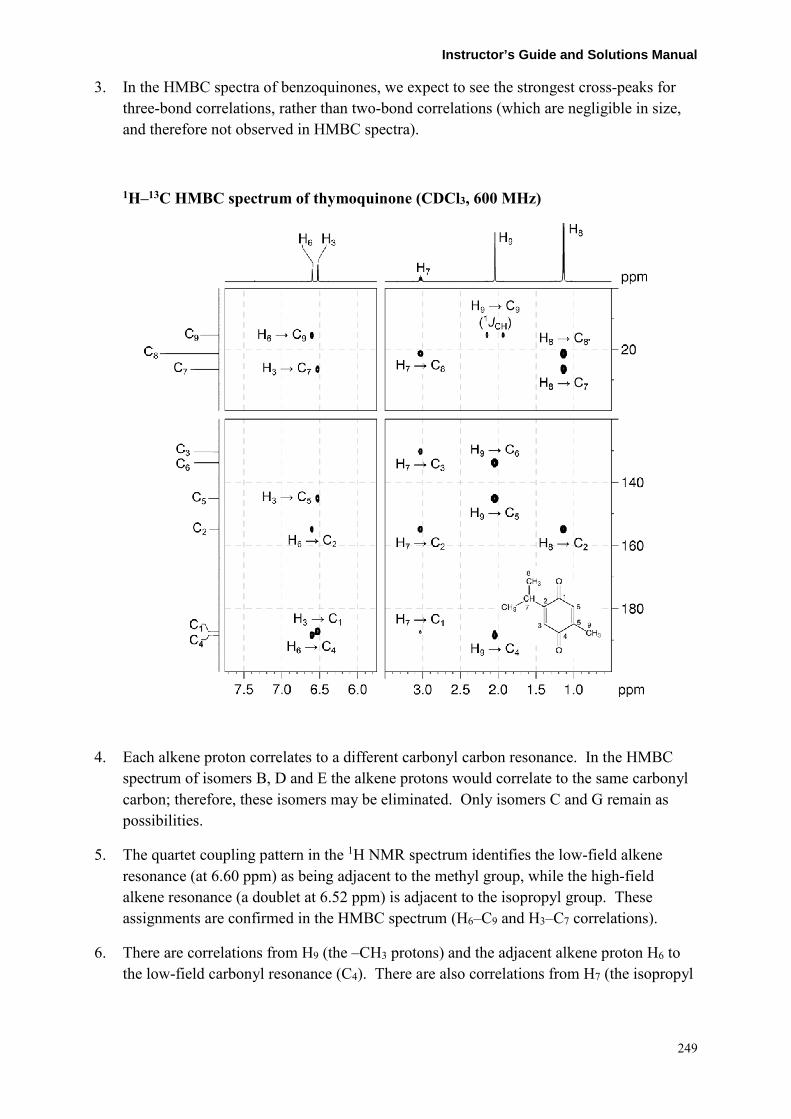
Instructor’s Guide and Solutions Manual 3. In the HMBC spectra of benzoquinones, we expect to see the strongest cross-peaks for
three-bond correlations, rather than two-bond correlations (which are negligible in size, and therefore not observed in HMBC spectra).
1H–13C HMBC spectrum of thymoquinone (CDCl3, 600 MHz)
4. Each alkene proton correlates to a different carbonyl carbon resonance. In the HMBC spectrum of isomers B, D and E the alkene protons would correlate to the same carbonyl carbon; therefore, these isomers may be eliminated. Only isomers C and G remain as possibilities.
5. The quartet coupling pattern in the 1H NMR spectrum identifies the low-field alkene resonance (at 6.60 ppm) as being adjacent to the methyl group, while the high-field alkene resonance (a doublet at 6.52 ppm) is adjacent to the isopropyl group. These assignments are confirmed in the HMBC spectrum (H6–C9 and H3–C7 correlations).
6. There are correlations from H9 (the –CH3 protons) and the adjacent alkene proton H6 to the low-field carbonyl resonance (C4). There are also correlations from H7 (the isopropyl
249

Organic Structures from 2D NMR Spectra
–CH proton) and the adjacent alkene proton H3 to the high-field carbonyl resonance (C1). In isomer C, the H9–C4 and H7–C1 correlations would both arise from three-bond couplings, while in isomer G, these correlations must arise from five-bond coupling (as the ring-substituent and its “adjacent” alkene proton are correlated to the same carbonyl carbon resonance). Five-bond couplings are very rare, so isomer G may be eliminated, and isomer C is the correct answer.
7. There is also a correlation between H8 and C8'. While this appears to be a one-bond correlation, in gem-dimethyl groups, the apparent one-bond correlation arises from the 3JC–H interaction of the protons of one of the methyl groups with the chemically equivalent carbon which is three bonds away.
250

Instructor’s Guide and Solutions Manual
Problem 51
Question:
Identify the following compound.
Molecular Formula: C9H9BrO
IR: 3164 (br), 2953 cm−1.
Solution:
4-Bromo-1-indanol
1. The molecular formula is C9H9BrO. Calculate the degree of unsaturation from the
molecular formula: replace the Br by H and ignore the O atom to give an effective molecular formula of C9H10 (CnHm) which gives the degree of unsaturation as (n – m/2 + 1) = 9 – 5 + 1 = 5. The compound contains a combined total of five rings and/or π bonds.
2. 1D spectra establish that the compound is a trisubstituted benzene which accounts for four degrees of unsaturation. There remains one additional degree of unsaturation so there must be one additional ring or double bond.
3. The coupling pattern in the aromatic region of the 1H NMR spectrum shows that the three protons on the aromatic ring must occupy adjacent positions. The proton at 7.10 ppm is the proton at the middle of the spin system since it has two large splittings (i.e. it has two ortho-protons) whereas the other two aromatic protons have only one large splitting.
4. In the alkyl region of the 1H NMR spectrum, there is one exchangeable proton at 2.12 ppm (which must be bound to the oxygen to form an alcohol) and there are five signals each of integration one.
5. There are three signals in the alkyl region of the 13C{1H} NMR spectrum (including one that is obscured by the solvent signal), so some of the alkyl protons must be diastereotopic. This indicates that a chiral centre is likely to be present in the molecule.
251

Organic Structures from 2D NMR Spectra
1H NMR spectrum of 4-bromo-1-indanol (CDCl3, 500 MHz)
13C{1H} NMR spectrum of 4-bromo-1-indanol (CDCl3, 125 MHz)
252

Instructor’s Guide and Solutions Manual 6. The 1H–13C me-HSQC spectrum can be used to identify pairs of diastereotopic protons,
as they will correlate to the same 13C signal. The signals at 3.05 and 2.81 ppm constitute one diastereotopic methylene group (H3a and H3b), with the associated carbon (C3) at 31.2 ppm; a second methylene group resonates at 2.48 and 1.93 ppm (H2a and H2b), with the associated carbon (C2) at 34.9 ppm. The signal at 5.26 ppm corresponds to a methine (CH) group (H1), and C1 resonates at 77.1 ppm.
1H–13C me-HSQC spectrum of 4-bromo-1-indanol (CDCl3, 500 MHz)
7. Listing the currently known fragments gives:
253

Organic Structures from 2D NMR Spectra 8. The 1H–1H COSY spectrum identifies the coupling relationship between the alkyl groups
– H1 couples to H2a and H2b, and H2a and H2b both couple to H3a and H3b. H1 also couples to the alcohol. We therefore have:
1H–1H COSY spectrum of 4-bromo-1-indanol (CDCl3, 500 MHz)
254

Instructor’s Guide and Solutions Manual 9. There are two possible compounds that can be constructed from the available fragments:
10. In the 1H–13C HMBC spectrum, there is a correlation between one of the “outer” aryl protons (at 7.31 ppm) and the methine carbon at 77.1 ppm (C1). Remember that in aromatic systems, it is the three-bond coupling that is the largest, both around the ring and to benzylic carbon atoms, so this correlation suggests that there is an aromatic proton three bonds removed from C1. This eliminates Isomer A as a possibility, and identifies Compound B as the correct isomer (4-bromo-1-indanol). It also identifies the aromatic resonance at 7.31 ppm as the proton closest to the methine group.
11. We can then assign all the aromatic resonances in the 1H and 13C spectra using the 1H–13C me-HSQC and HMBC spectra and confirm all spectra are consistent with the structure.
1H–13C HMBC spectrum of 4-bromo-1-indanol (CDCl3, 500 MHz)
255

Organic Structures from 2D NMR Spectra
1H–13C HMBC spectrum of 4-bromo-1-indanol – expansion A
256

Instructor’s Guide and Solutions Manual
Problem 52
Question:
The 1H and 13C{1H} NMR spectra of 1-bromo-4-methylnaphthalene (C11H9Br) recorded in CDCl3 solution at 298 K and 500 MHz are given below.
The 1H NMR spectrum has signals at δ 2.58, 7.08, 7.50, 7.54, 7.61, 7.91 and 8.23 ppm.
The 13C{1H} NMR spectrum has signals at δ 19.2, 120.6, 124.5, 126.4, 126.85, 126.91, 127.6, 129.4, 131.7, 133.7 and 134.3 ppm.
The 2D 1H–1H COSY, multiplicity-edited 1H–13C HSQC and 1H–13C HMBC spectra are given on the following pages. Use these spectra to assign the 1H and 13C{1H} resonances for this compound.
Solution:
1-Bromo-4-methylnaphthalene
Proton Chemical Shift (ppm) Carbon Chemical Shift (ppm)
C1 120.6
H2 7.61 C2 129.5
H3 7.08 C3 126.91
C4 134.3
C5 133.7
H6 7.91 C6 124.5
H7 7.50 C7 126.4
H8 7.54 C8 126.85
H9 8.23 C9 127.6
C10 131.7
H11 2.58 C11 19.2
1. H11 and C11 are easily identified on the basis of chemical shift.
257

Organic Structures from 2D NMR Spectra
1H NMR spectrum of 1-bromo-4-methylnaphthalene (CDCl3, 500 MHz)
13C{1H} NMR spectrum of 1-bromo-4-methylnaphthalene – expansion (CDCl3, 125 MHz)
258

Instructor’s Guide and Solutions Manual 2. In the COSY spectrum, there is a correlation between H11 and the aromatic proton at
7.08 ppm. This is a four-bond correlation between H11 and H3. Careful analysis of the me-HSQC spectrum (expansion B) identifies C3 as the resonance at 126.91 ppm.
1H–1H COSY spectrum of 1-bromo-4-methylnaphthalene (CDCl3, 500 MHz)
259
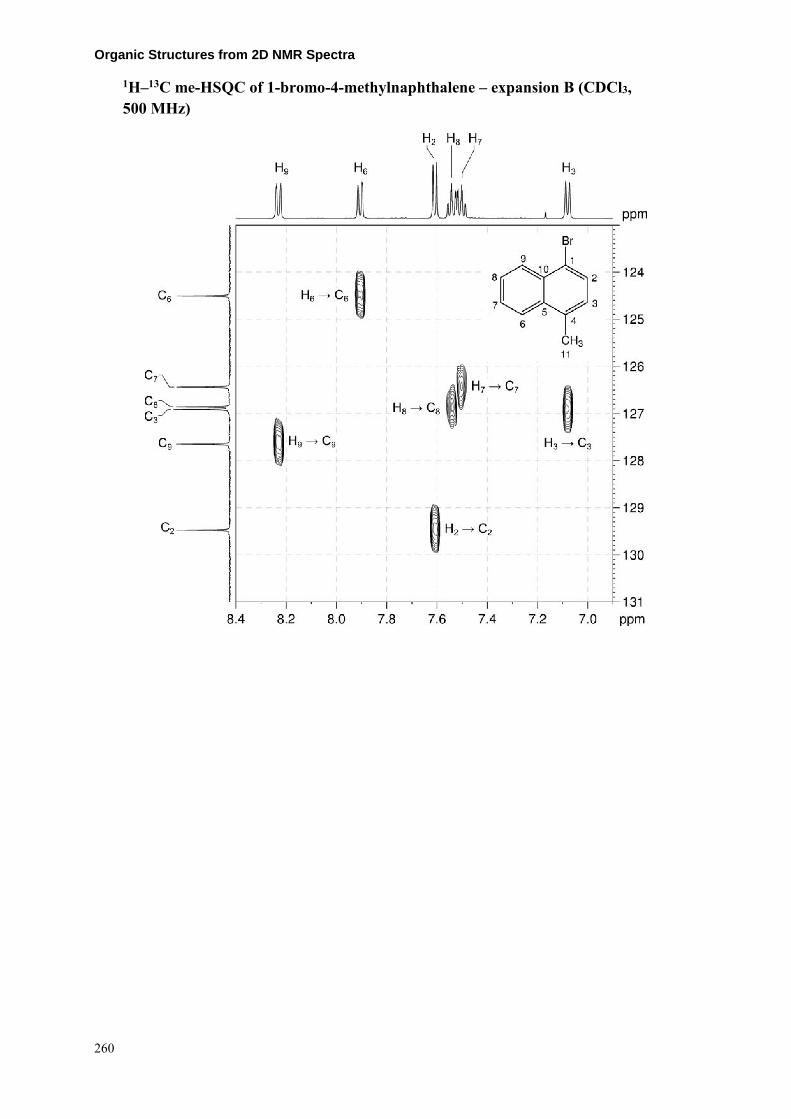
Organic Structures from 2D NMR Spectra
1H–13C me-HSQC of 1-bromo-4-methylnaphthalene – expansion B (CDCl3, 500 MHz)
260

Instructor’s Guide and Solutions Manual 3. In the COSY spectrum (expansion A), H3 correlates to the resonance at 7.61 ppm, and
this resonance must be due to H2. The me-HSQC spectrum then identifies C2 as the resonance at 129.5 ppm.
1H–1H COSY spectrum of 1-bromo-4-methylnaphthalene – expansion A
4. Based on the coupling pattern, the 1H signals at 8.23 and 7.91 ppm are due to either H6 or H9 while the signals at 7.54 and 7.50 ppm are due to either H7 or H8.
261

Organic Structures from 2D NMR Spectra 5. Remember that, in aromatic systems, the three-bond coupling 3JC–H is typically the larger
long-range coupling and gives rise to the strongest cross-peaks in HMBC spectra.
6. In expansion C of the HMBC spectrum, the low-field 13C signal at 134.3 ppm has correlations from the 1H signals at 7.61 ppm (previously assigned to H2) and 7.91 ppm. The 13C signal at 134.3 ppm is due to either C4 or C10 which are both three bonds away from H2. If the signal was due to C10 we would expect a correlation from H8, and as such a correlation is absent, the signal must be due to C4.
7. Therefore the 1H resonance at 7.91 ppm must be due to H6 which is three bonds away from C4. The me-HSQC spectrum can now be used to assign C6 to the 13C signal at 124.5 ppm.
1H–13C HMBC of 1-bromo-4-methylnaphthalene – expansion C (CDCl3, 500 MHz)
8. As H6 has been assigned to the 1H signal at 7.91 ppm, the signal at 8.23 ppm must be due to H9. C9 can be assigned to the 13C signal at 127.6 ppm using the me-HSQC spectrum.
9. From the COSY spectrum, H6 correlates to the signal at 7.50 ppm which can be assigned to H7. C7 can be assigned to the 13C signal at 126.4 ppm using the me-HSQC spectrum.
262

Instructor’s Guide and Solutions Manual 10. In expansion C of the HMBC spectrum, the 13C signal at 133.7 ppm has correlations from
1H signals at 8.23 (H9), 7.50 (H7) and 7.08 (H3) ppm and must be due to C5.
11. As H7 has been assigned to the 1H signal at 7.50 ppm, H8 can be assigned to the signal at 7.54 ppm. C8 can be assigned to the 13C signal at 126.85 ppm using the me-HSQC spectrum.
12. In the HMBC spectrum (expansion C), the correlations from H6, H2 and H8 to the 13C signal at 131.7 ppm identifies the resonance as due to C10.
13. In the HMBC spectrum (expansion C), the H9, H2 and H3 correlations to the 13C signal at 120.6 ppm identifies the resonance as due to C1.
14. Note that there is an unusually long-range (five-bond) coupling from H11 to C1 in expansion D of the HMBC spectrum.
1H–13C HMBC of 1-bromo-4-methylnaphthalene – expansion D
263

Organic Structures from 2D NMR Spectra
Problem 53
Question:
Identify the following compound.
Molecular Formula: C10H14O
IR: 3377 (br) cm−1
Solution:
Carvacrol
1. The molecular formula is C10H14O. Calculate the degree of unsaturation from the molecular formula: ignore the O atom to give an effective molecular formula of C10H14 (CnHm) which gives the degree of unsaturation as (n – m/2 + 1) = 10 – 7 + 1 = 4. The compound contains a combined total of four rings and/or π bonds.
2. 1D NMR data establish that the compound is a trisubstituted benzene with an –OH substituent (1H resonance at 4.86 ppm, exchangeable), a –CH3 substituent (1H resonance at 2.21 ppm) and an isopropyl substituent (septet at 2.80 ppm and doublet at 1.20 ppm in 1H NMR spectrum). The benzene ring accounts for all of the degrees of unsaturation, so the compound contains no additional rings or multiple bonds.
3. The coupling pattern in the aromatic region of the 1H NMR spectrum shows that the compound must be a “1,2,4-trisubstituted benzene”. The proton at 6.63 ppm clearly has no ortho couplings and must be the isolated proton in the spin system sandwiched between two substituents. The two protons at 6.72 and 7.03 ppm each have a large ortho coupling so they must be adjacent to each other. The proton at 6.72 ppm has an additional meta coupling so it must be the proton meta to the proton at 6.63 ppm. The remaining proton at 7.03 ppm must be the proton para to the proton at 6.63 ppm.
264

Instructor’s Guide and Solutions Manual
1H NMR spectrum of carvacrol (CDCl3, 400 MHz)
13C{1H} NMR spectrum of carvacrol (CDCl3, 400 MHz)
265

Organic Structures from 2D NMR Spectra 4. In the COSY spectrum (expansion A), there are correlations from the aromatic protons at
7.03 and 6.63 ppm to the methyl protons at 2.21 ppm. However we are not able to deduce the position of the methyl group on the aromatic ring based on these correlations.
1H–1H COSY spectrum of carvacrol – expansion A (CDCl3, 400 MHz)
266

Instructor’s Guide and Solutions Manual 5. Expansion B of the COSY spectrum shows the expected correlations between the
aromatic protons.
1H–1H COSY spectrum of carvacrol – expansion B
6. For a “1,2,4-trisubstituted benzene”, there are six possible isomers:
267

Organic Structures from 2D NMR Spectra 7. The 1H–13C me-HSQC spectrum easily identifies the protonated
carbons. The isolated methyl carbon is at 15.3 ppm while the methine and methyl carbons of the isopropyl group are at 33.7 and 24.0 ppm, respectively. The isolated aromatic proton at 6.63 ppm correlates to the carbon at 113.0 ppm. The aromatic protons at 6.72 and 7.03 ppm correlate to the carbons at 118.8 and 130.8 ppm, respectively
8. The three aromatic carbons which bear substituents appear at 153.5, 148.4 and 120.9 ppm. The low-field carbon resonance (153.3 ppm) must be the carbon bearing the –OH substituent based on its chemical shift.
1H–13C me-HSQC spectrum of carvacrol (CDCl3, 400 MHz)
268
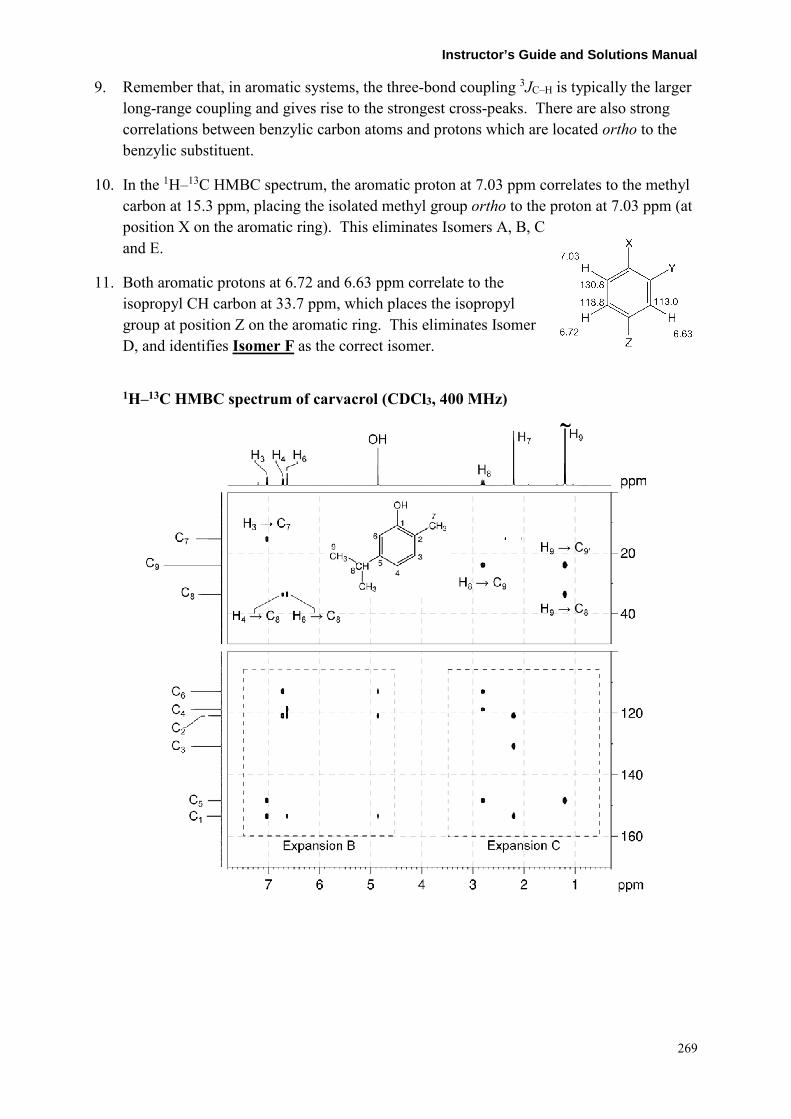
Instructor’s Guide and Solutions Manual 9. Remember that, in aromatic systems, the three-bond coupling 3JC–H is typically the larger
long-range coupling and gives rise to the strongest cross-peaks. There are also strong correlations between benzylic carbon atoms and protons which are located ortho to the benzylic substituent.
10. In the 1H–13C HMBC spectrum, the aromatic proton at 7.03 ppm correlates to the methyl carbon at 15.3 ppm, placing the isolated methyl group ortho to the proton at 7.03 ppm (at position X on the aromatic ring). This eliminates Isomers A, B, C and E.
11. Both aromatic protons at 6.72 and 6.63 ppm correlate to the isopropyl CH carbon at 33.7 ppm, which places the isopropyl group at position Z on the aromatic ring. This eliminates Isomer D, and identifies Isomer F as the correct isomer.
1H–13C HMBC spectrum of carvacrol (CDCl3, 400 MHz)
269

Organic Structures from 2D NMR Spectra
1H–13C HMBC spectrum of carvacrol – expansion B
1H–13C HMBC spectrum of carvacrol – expansion C
270

Instructor’s Guide and Solutions Manual 12. Verify that all spectroscopic data are consistent with the structure.
13. In the HMBC spectrum, the methyl protons (H7) correlate to C1 and C3 (three-bond correlations) as well as to the ipso carbon (C2, a two-bond correlation, identified as the signal at 120.9 ppm).
14. Similarly, the isopropyl methine proton (H8) correlates to C4 and C6 (three-bond correlations) as well as the ipso carbon (C5, a two-bond correlation, identified as the signal at 148.4 ppm).
15. In expansion C of the HMBC spectrum, the isopropyl methyl protons (H9) correlate only to the aromatic ipso carbon (C5, a three-bond correlation).
16. In the HMBC spectrum, the –OH proton also correlates to the ipso carbon C1 (a two-bond correlation), and C2 and C6, which are three bonds away. Note that correlations to exchangeable protons are not always observed.
17. Note also that in the HMBC spectrum for this compound, there is a strong correlation between H9 and C9'. While this appears to be a one-bond correlation, in isopropyl groups, the apparent one-bond correlation arises from the 3JC–H interaction of the protons of one of the methyl groups with the chemically equivalent carbon which is three bonds away.
271
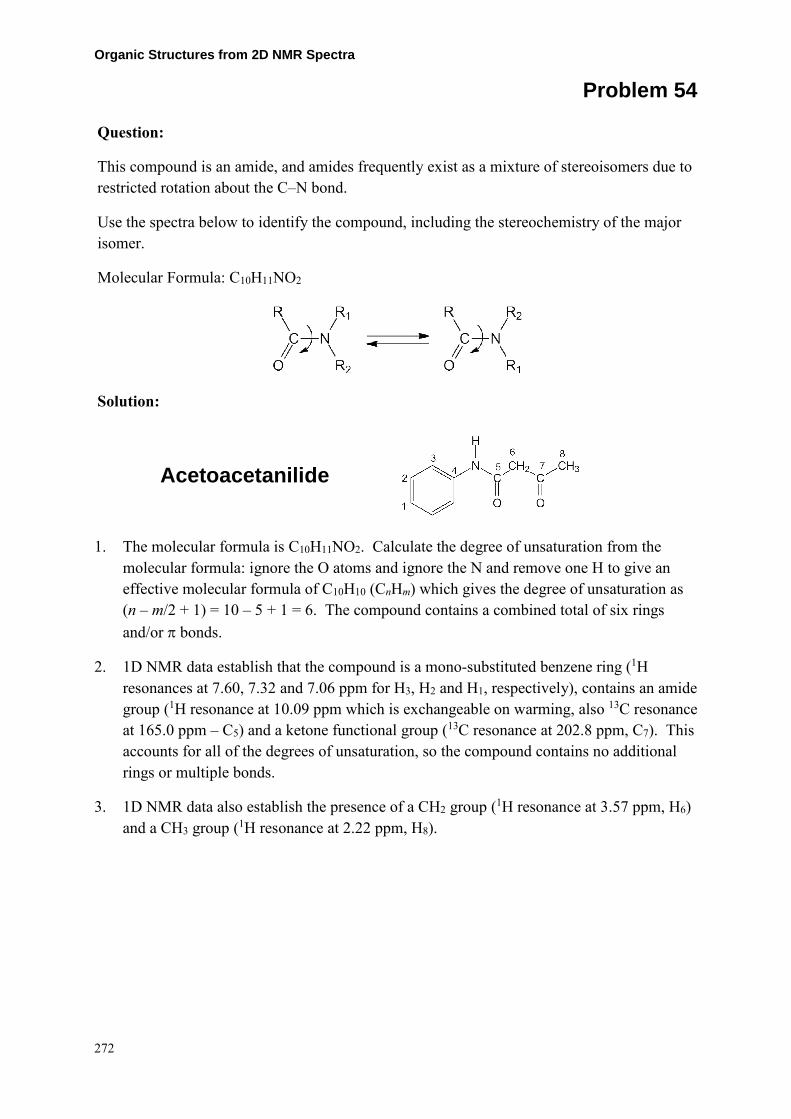
Organic Structures from 2D NMR Spectra
Problem 54
Question:
This compound is an amide, and amides frequently exist as a mixture of stereoisomers due to restricted rotation about the C–N bond.
Use the spectra below to identify the compound, including the stereochemistry of the major isomer.
Molecular Formula: C10H11NO2
Solution:
Acetoacetanilide
1. The molecular formula is C10H11NO2. Calculate the degree of unsaturation from the molecular formula: ignore the O atoms and ignore the N and remove one H to give an effective molecular formula of C10H10 (CnHm) which gives the degree of unsaturation as (n – m/2 + 1) = 10 – 5 + 1 = 6. The compound contains a combined total of six rings and/or π bonds.
2. 1D NMR data establish that the compound is a mono-substituted benzene ring (1H resonances at 7.60, 7.32 and 7.06 ppm for H3, H2 and H1, respectively), contains an amide group (1H resonance at 10.09 ppm which is exchangeable on warming, also 13C resonance at 165.0 ppm – C5) and a ketone functional group (13C resonance at 202.8 ppm, C7). This accounts for all of the degrees of unsaturation, so the compound contains no additional rings or multiple bonds.
3. 1D NMR data also establish the presence of a CH2 group (1H resonance at 3.57 ppm, H6) and a CH3 group (1H resonance at 2.22 ppm, H8).
272

Instructor’s Guide and Solutions Manual
1H NMR spectrum of acetoacetanilide (DMSO-d6, 300 MHz)
13C{1H} NMR spectrum of acetoacetanilide (DMSO-d6, 75 MHz)
273

Organic Structures from 2D NMR Spectra 4. The protonated carbons C2, C1, C3, C6 and C8 are easily identified by the me-HSQC
spectrum as 13C signals at 128.7, 123.4, 119.1, 52.3 and 30.2 ppm, respectively.
1H–13C me-HSQC spectrum of acetoacetanilide (DMSO-d6, 300 MHz)
274

Instructor’s Guide and Solutions Manual 5. In the HMBC spectrum, the H6–C7 and H8–C7 correlations indicate that the CH2 and CH3
groups are bound to the ketone.
6. In the HMBC spectrum, the H6–C5 correlation indicates the CH2 group is also bound to the amide group. As there is no coupling between the NH and CH2 groups, the CH2 group must be bound to the amide carbon.
7. The NH–C3 correlation in the HMBC spectrum indicates the NH is bound directly to the aromatic ring.
1H–13C HMBC spectrum of acetoacetanilide (DMSO-d6, 300 MHz)
8. The two possible stereoisomers are:
275
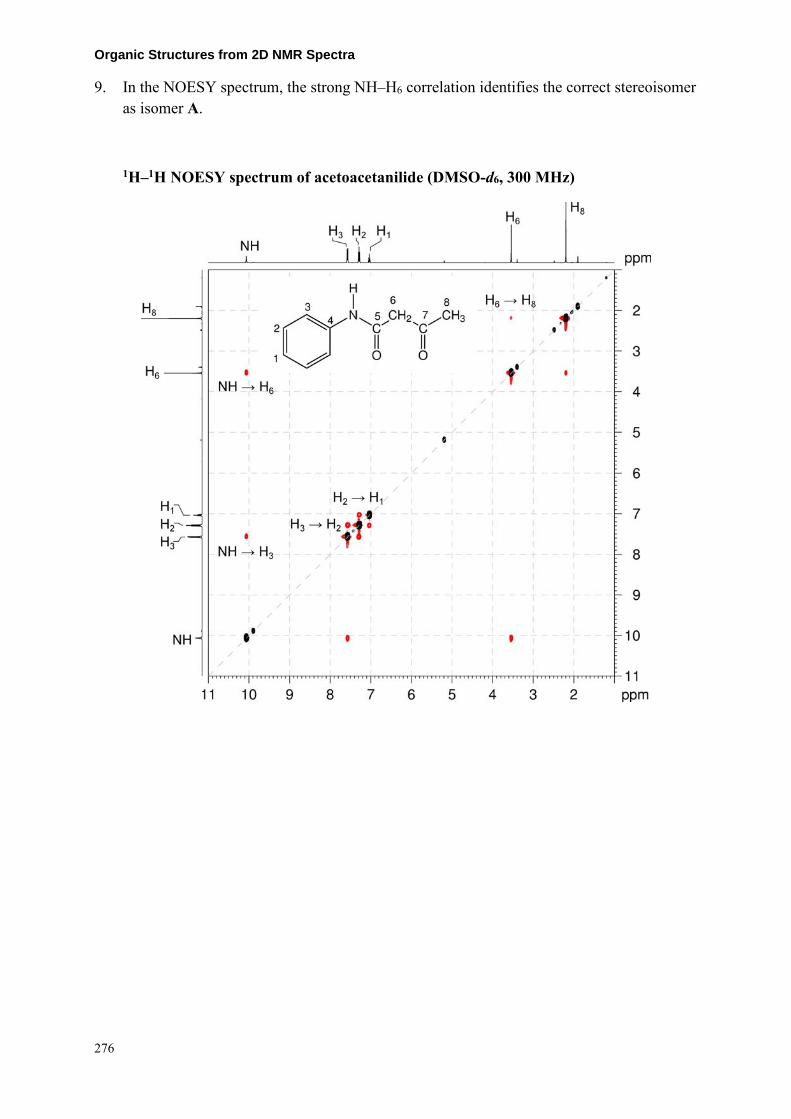
Organic Structures from 2D NMR Spectra 9. In the NOESY spectrum, the strong NH–H6 correlation identifies the correct stereoisomer
as isomer A.
1H–1H NOESY spectrum of acetoacetanilide (DMSO-d6, 300 MHz)
276

Instructor’s Guide and Solutions Manual
Problem 55
Question:
Identify the following compound.
Molecular Formula: C7H10N2O3
IR: 2930, 2258, 1740, 1698, 1643 cm−1
Solution:
Ethyl acetamidocyanoacetate
1. The molecular formula is C7H10N2O3. Calculate the degree of unsaturation from the molecular formula: ignore the O atoms, ignore the N atoms and remove two H atoms to give an effective molecular formula of C7H8 (CnHm) which gives the degree of unsaturation as (n – m/2 + 1) = 7 – 4 + 1 = 4. The compound contains a combined total of four rings and/or π bonds.
2. 1D NMR data establish the presence of an amide group (1H resonance at 8.90 ppm which is exchangeable on warming) and two carbonyl groups (13C resonances at 170.3 and 163.8 ppm for C2 and C4, respectively) – one belonging to the amide group and the other possibly an ester group based on chemical shift. The two carbonyl functional groups account for two degrees of unsaturation, so the compound contains an additional two rings or multiple bonds. The remaining quaternary carbon signal at 114.8 ppm (C7) may be due to a CN group based on chemical shift and IR signal at 2258 cm−1.
3. 1D NMR and me-HSQC spectra also establish the presence of a CH group (1H 5.48 ppm / 13C 43.4 ppm, H3/C3), a CH2 group (1H 4.30 ppm / 13C 63.3 ppm, H5/C5) and two CH3 groups (1H 2.04 ppm / 13C 22.1 ppm, H1/C1; 1H 1.33 ppm / 13C 13.9 ppm, H6/C6). The CH2 group must be bound to oxygen on the basis of its chemical shift.
1H NMR spectrum of ethyl acetamidocyanoacetate (CDCl3/DMSO-d6, 500 MHz)
277

Organic Structures from 2D NMR Spectra
13C{1H} NMR spectrum of ethyl acetamidocyanoacetate (CDCl3/DMSO-d6, 125 MHz)
1H–13C me-HSQC spectrum of ethyl acetamidocyanoacetate (CDCl3/DMSO-d6, 500 MHz)
278

Instructor’s Guide and Solutions Manual 4. In the COSY spectrum, there are two separate spin systems – one for an ethyl group
(H5–H6 correlation) and the other for the NH–CH group (NH–H3 correlation).
1H–1H COSY spectrum of ethyl acetamidocyanoacetate (CDCl3/DMSO-d6, 500 MHz)
279
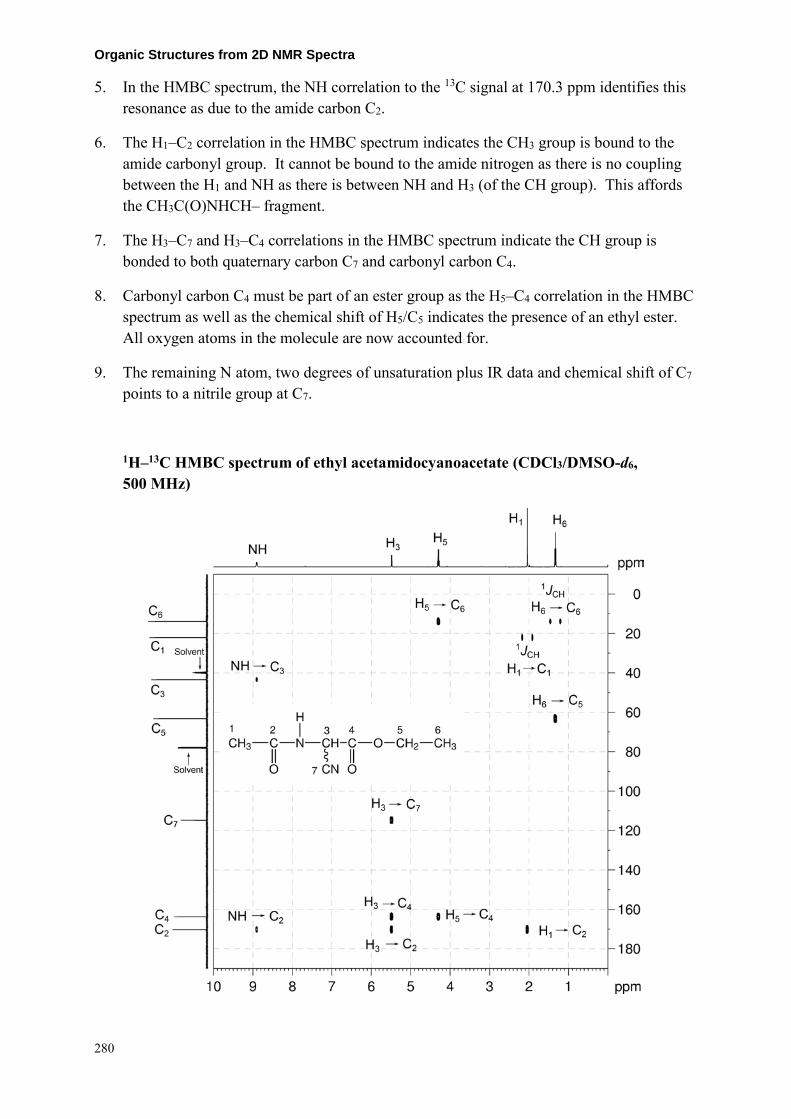
Organic Structures from 2D NMR Spectra 5. In the HMBC spectrum, the NH correlation to the 13C signal at 170.3 ppm identifies this
resonance as due to the amide carbon C2.
6. The H1–C2 correlation in the HMBC spectrum indicates the CH3 group is bound to the amide carbonyl group. It cannot be bound to the amide nitrogen as there is no coupling between the H1 and NH as there is between NH and H3 (of the CH group). This affords the CH3C(O)NHCH– fragment.
7. The H3–C7 and H3–C4 correlations in the HMBC spectrum indicate the CH group is bonded to both quaternary carbon C7 and carbonyl carbon C4.
8. Carbonyl carbon C4 must be part of an ester group as the H5–C4 correlation in the HMBC spectrum as well as the chemical shift of H5/C5 indicates the presence of an ethyl ester. All oxygen atoms in the molecule are now accounted for.
9. The remaining N atom, two degrees of unsaturation plus IR data and chemical shift of C7 points to a nitrile group at C7.
1H–13C HMBC spectrum of ethyl acetamidocyanoacetate (CDCl3/DMSO-d6, 500 MHz)
280

Instructor’s Guide and Solutions Manual 10. The 1H–15N HSQC spectrum shows one-bond correlations between proton and nitrogen
nuclei. In the 1H–15N HSQC spectrum, the NH proton signal at 9.0 ppm correlates to the NH nitrogen signal at 111 ppm.
11. Note that the nitrile nitrogen does not appear in the 1H–15N HSQC spectrum since there are no protons attached to N.
1H–15N HSQC spectrum of ethyl acetamidocyanoacetate (CDCl3/DMSO-d6, 600 MHz)
281
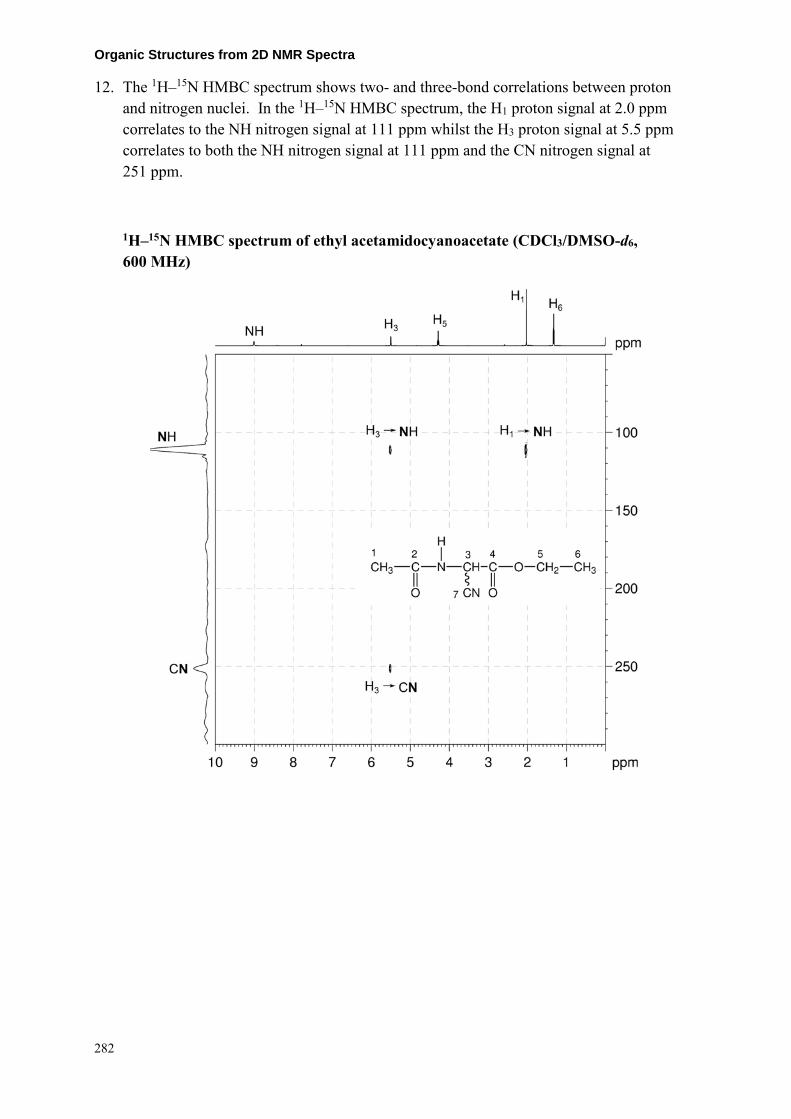
Organic Structures from 2D NMR Spectra 12. The 1H–15N HMBC spectrum shows two- and three-bond correlations between proton
and nitrogen nuclei. In the 1H–15N HMBC spectrum, the H1 proton signal at 2.0 ppm correlates to the NH nitrogen signal at 111 ppm whilst the H3 proton signal at 5.5 ppm correlates to both the NH nitrogen signal at 111 ppm and the CN nitrogen signal at 251 ppm.
1H–15N HMBC spectrum of ethyl acetamidocyanoacetate (CDCl3/DMSO-d6, 600 MHz)
282

Instructor’s Guide and Solutions Manual
Problem 56
Question:
The following spectra belong to a macrocyclic sesquiterpene which contains three trans-substituted double bonds. Identify the compound.
Molecular Formula: C15H24
Solution:
α-Humulene
1. The molecular formula is C15H24. Calculate the degree of unsaturation from the molecular formula: the effective molecular formula is C15H24 (CnHm) which gives the degree of unsaturation as (n – m/2 + 1) = 15 – 12 + 1 = 4. The compound contains a combined total of four rings and/or π bonds.
2. From the question, we are told that the compound is a macrocycle (i.e. a ring compound) and contains three double bonds. The compound must contain only one ring to account for all of the degrees of unsaturation.
1H NMR spectrum of α-humulene (CDCl3, 600 MHz, 298 K)
283

Organic Structures from 2D NMR Spectra
13C{1H} NMR spectrum of α-humulene (C2D2Cl4, 150 MHz, 338 K)
3. It is easiest to begin by determining the multiplicity of each 13C resonance using integrations from the 1H NMR spectrum and the me-1H–13C HSQC spectrum. We will give each carbon nucleus a temporary designation to identify it in the table below.
Signal Temporary
Designation Multiplicity Neighbours
140.9 CA CH CD, CJ
138.8 CB C CE, CH, CM
132.9 CC C CF, CI, CN
127.8 CD CH CA, CH
126.3 CE CH CB, CL
125.2 CF CH CC, CG
42.4 CG CH2 CF, CJ, CK
40.6 CH CH2 CB, CD
39.9 CI CH2 CC, CL
37.3 CJ C CA, CG, CK
27.3 CK 2 × CH3 CJ
23.6 CL CH2 CE, CI
18.0 CM CH3 CB
15.1 CN CH3 CC
284

Instructor’s Guide and Solutions Manual
1H–13C me-HSQC spectrum of α-humulene (C2D2Cl4, 600 MHz, 298 K)
4. From the chemical shifts, we will assume that the low-field resonances in the 1H and 13C NMR spectra correspond to alkene groups.
5. We can now use the INADEQUATE spectrum to piece together the skeleton of the molecule.
6. Pick a starting point – in this case, we will start with CA, the lowest-field resonance, which is a methine group (CH). There are two correlations for CA – one to the signal at 37.3 ppm (CJ) and the other to the signal at 127.8 ppm (CD). We know, then, that CA is directly bond to CJ (a quaternary carbon centre) and CD (a methine group (CH)):
285
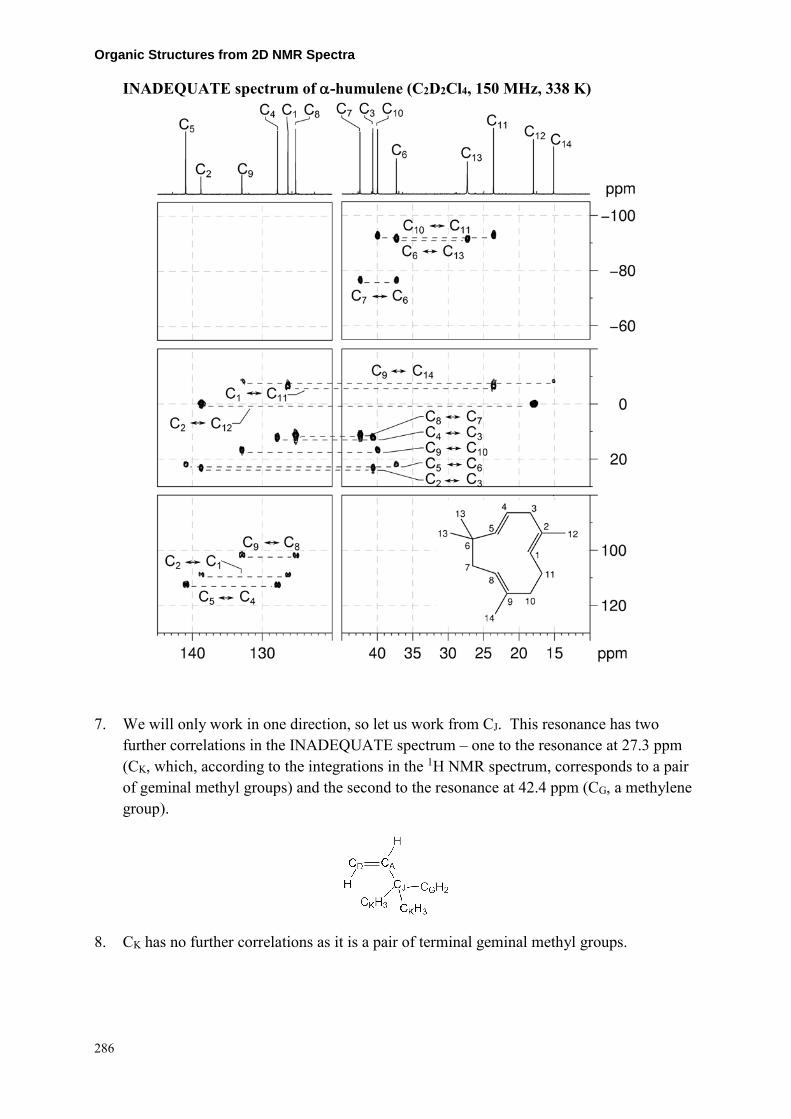
Organic Structures from 2D NMR Spectra
INADEQUATE spectrum of α-humulene (C2D2Cl4, 150 MHz, 338 K)
7. We will only work in one direction, so let us work from CJ. This resonance has two further correlations in the INADEQUATE spectrum – one to the resonance at 27.3 ppm (CK, which, according to the integrations in the 1H NMR spectrum, corresponds to a pair of geminal methyl groups) and the second to the resonance at 42.4 ppm (CG, a methylene group).
8. CK has no further correlations as it is a pair of terminal geminal methyl groups.
286

Instructor’s Guide and Solutions Manual 9. CG correlates to the signal at 125.2 ppm (CF), a methine (CH) group.
10. CF also correlates to the resonance at 132.9 ppm (CC, a quaternary carbon atom).
11. CC has two further correlations – the first to the resonance at 39.9 ppm (CI, a methylene group) and the second to the resonance at 15.1 ppm (CN, a methyl group).
12. CN has no further correlations as it is a terminal methyl group.
13. CI also correlates to the signal at 23.6 (CL, a methylene group).
14. CL further corresponds to the resonance at 126.3 ppm (CE, a methine carbon).
15. CE also correlates to the signal at 138.8 (CB, a quaternary alkene carbon).
287

Organic Structures from 2D NMR Spectra 16. CB correlates to two additional resonances, the first is the signal at 40.6 ppm (CH, a
methylene group) and the second is the signal at 18.0 ppm (CM, a methyl group).
17. CM has no further correlations as it is a terminal methyl group.
18. CH also correlates to the signal at 127.8 ppm (CD), so we have closed the ring, and assigned all the correlations in the spectrum.
19. We can redraw the structure to give a more easily understood picture of the compound (showing all the double bonds as trans), and renumber to give the final answer:
288

Instructor’s Guide and Solutions Manual
Problem 57
Question:
Identify the following compound.
Molecular Formula: C10H10O3
IR: 3300–2400 (br), 1685 cm−1
Solution:
3,4-Dihydro-2H–benzopyran-3-carboxylic acid
1. The molecular formula is C10H10O3. Calculate the degree of unsaturation from the molecular formula: ignore the O atoms to give an effective molecular formula of C10H10 (CnHm) which gives the degree of unsaturation as (n – m/2 + 1) = 10 – 5 + 1 = 6. The compound contains a combined total of six rings and/or π bonds.
2. IR and ID NMR spectra establish the presence of an OH group (exchangeable proton at 11.95 ppm) and carbonyl group (13C resonance at 179.0 ppm).
3. In the 1H NMR spectrum, there are signals for four aromatic protons and the coupling pattern indicates an ortho-disubstituted aromatic ring where the signals at 6.91 and 6.82 ppm are due to the protons adjacent to the substituents (H5 or H8) whilst the signals at 6.94 and 6.75 ppm are due to the remaining aromatic protons (H6 or H7).
4. The aromatic ring and carbonyl group account for five degrees of unsaturation and the remaining degree of unsaturation is likely due to another ring in the molecule as there are no other signals for groups containing double bonds.
5. There are also five signals integrating for one proton each in the aliphatic region of the 1H NMR spectrum.
1H NMR spectrum of 3,4-dihydro-2H–benzopyran-3-carboxylic acid (C6D6, 600 MHz)
289

Organic Structures from 2D NMR Spectra
13C{1H} NMR spectrum of 3,4-dihydro-2H–benzopyran-3-carboxylic acid (C6D6, 150 MHz)
6. In the me-HSQC spectrum, there are two CH2 groups with diastereotopic protons (1H 4.02, 3.89 ppm / 13C 65.7, H2a,H2b/C2 and 1H 2.75, 2.54 ppm / 13C 26.8, H4a,H4b/C4) and one CH group (1H 2.46 ppm / 13C 38.1, H3/C3).
7. C2 is bound to oxygen on the basis of chemical shift.
1H–13C me-HSQC spectrum of 3,4-dihydro-2H–benzopyran-3-carboxylic acid (C6D6, 600 MHz)
290

Instructor’s Guide and Solutions Manual 8. The protonated aromatic carbons C5, C7, C6 and C8 can be identified using the me-HSQC
spectrum (expansion A) as 13C signals at 129.7, 127.6, 120.8 and 116.9 ppm.
9. The 13C signals for the quaternary aromatic signals are thus at 154.3 and 120.0 ppm.
1H–13C me-HSQC spectrum of 3,4-dihydro-2H–benzopyran-3-carboxylic acid – expansion A
291

Organic Structures from 2D NMR Spectra 10. In the COSY spectrum, there are the expected aromatic proton correlations and also
correlations from both sets of CH2 protons to the CH proton. Based on the coupling pattern in the aliphatic region of the 1H NMR spectrum, we can deduce the –OCH2CHCH2– fragment. The H2–C3/C4, H3–C2/C4 and H4–C2/C3 correlations in the HMBC spectrum are consistent with this fragment.
1H–1H COSY spectrum of 3,4-dihydro-2H–benzopyran-3-carboxylic acid (C6D6, 600 MHz)
292
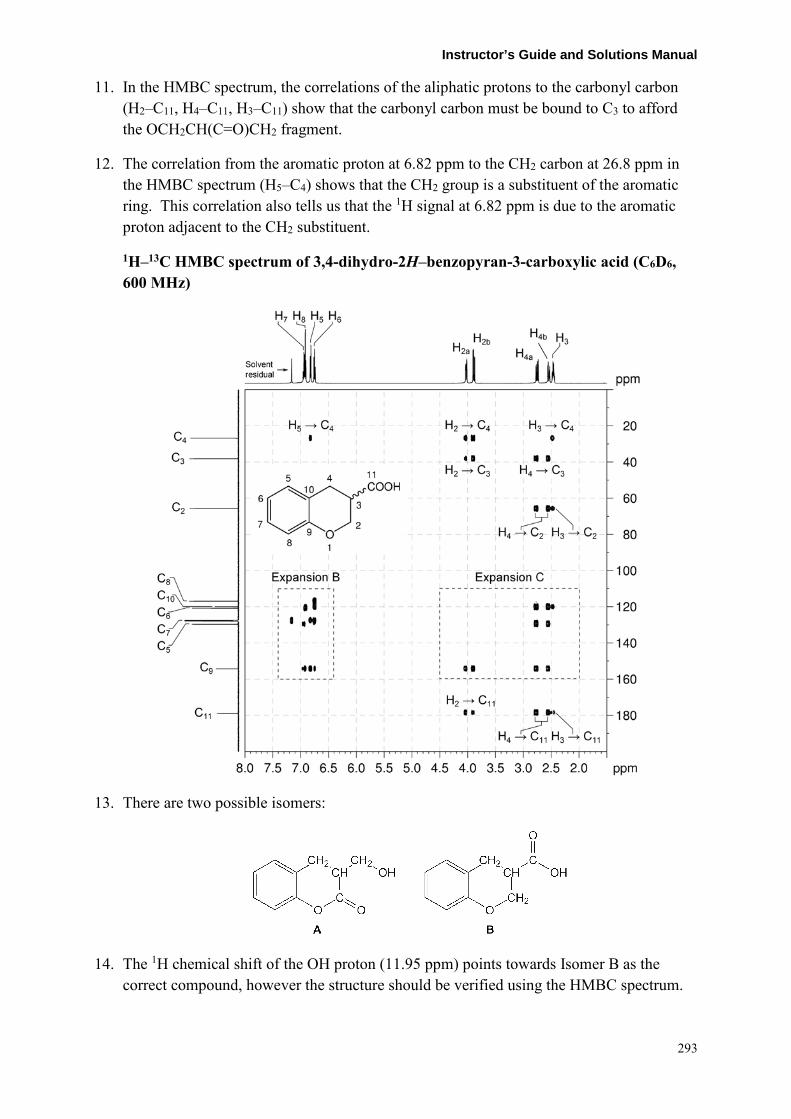
Instructor’s Guide and Solutions Manual 11. In the HMBC spectrum, the correlations of the aliphatic protons to the carbonyl carbon
(H2–C11, H4–C11, H3–C11) show that the carbonyl carbon must be bound to C3 to afford the OCH2CH(C=O)CH2 fragment.
12. The correlation from the aromatic proton at 6.82 ppm to the CH2 carbon at 26.8 ppm in the HMBC spectrum (H5–C4) shows that the CH2 group is a substituent of the aromatic ring. This correlation also tells us that the 1H signal at 6.82 ppm is due to the aromatic proton adjacent to the CH2 substituent.
1H–13C HMBC spectrum of 3,4-dihydro-2H–benzopyran-3-carboxylic acid (C6D6, 600 MHz)
13. There are two possible isomers:
14. The 1H chemical shift of the OH proton (11.95 ppm) points towards Isomer B as the correct compound, however the structure should be verified using the HMBC spectrum.
293

Organic Structures from 2D NMR Spectra 15. In the HMBC spectrum (expansion B), the H5 proton correlates to 13C signals at 127.6
and 154.3 ppm. The signal at 127.6 ppm is due to a protonated aromatic carbon and can be assigned to C7. The signal at 154.3 ppm is due to a quaternary aromatic carbon and can be assigned to C9.
16. Using the me-HSQC spectrum, H7 can be assigned to the 1H signal at 6.94 ppm.
17. Based on the coupling pattern, the 1H signal at 6.91 ppm must be due to H8 and the remaining 1H signal at 6.75 ppm due to H6. C8 and C6 can be assigned to 13C signals at 116.9 and 120.8 ppm, respectively, using the me-HSQC spectrum.
18. In the HMBC spectrum (expansion B), the H7 → C5 / C9 as well as the H8 → C6 / C9 correlations are consistent with the structure. H6 correlates to C7, C8, C9 and the remaining quaternary 13C signal at 120.0 ppm which must be due to C10.
1H–13C HMBC spectrum of 3,4-dihydro-2H–benzopyran-3-carboxylic acid – expansion B
294

Instructor’s Guide and Solutions Manual 19. In expansion C of the HMBC spectrum, the H2 → C9, H3 → C10 and H4 → C5/C9/C10
correlations identify the correct structure as that of isomer B. In particular note that the H2 → C9 correlation would be an unlikely five-bond coupling in isomer A.
1H–13C HMBC spectrum of 3,4-dihydro-2H–benzopyran-3-carboxylic acid – expansion C
295

Organic Structures from 2D NMR Spectra
Problem 58
Question:
The 1H and 13C{1H} NMR spectra of quinidine (C20H24N2O2) recorded in DMSO-d6 solution at 298 K and 600 MHz are given below.
The 1H NMR spectrum has signals at δ 1.38 (m, 1H), 1.43 (m, 2H), 1.68 (m, 1H), 1.94 (m, 1H), 2.17 (m, 1H), 2.53 (m, 1H), 2.63 (m, 1H), 2.70 (m, 1H), 3.00 (m, 1H), 3.06 (m, 1H), 3.90 (s, 3H), 5.05 (m, 1H), 5.08 (m, 1H), 5.32 (dd, J = 4.7, 6.2 Hz, 1H), 5.73 (d, J = 4.7 Hz, 1H), 6.10 (ddd, J = 7.5, 10.2, 17.5 Hz, 1H), 7.39 (dd, J = 2.8, 9.3 Hz, 1H), 7.48 (d, J = 2.8 Hz, 1H), 7.53 (d, J = 4.4 Hz, 1H), 7.94 (d, J = 9.3 Hz, 1H) and 8.69 (d, J = 4.4 Hz, 1H) ppm.
The 13C{1H} NMR spectrum has signals at δ 23.1, 26.2, 27.8, 39.8, 48.4, 49.1, 55.3, 60.5, 70.7, 102.3, 114.2, 118.9, 120.9, 126.9, 131.0, 141.2, 143.8, 147.4, 149.4 and 156.7 ppm.
The 2D 1H–1H COSY, multiplicity-edited 1H–13C HSQC, 1H–13C HMBC and 1H–1H NOESY spectra are given on the following pages. Use these spectra to assign the 1H and 13C{1H} resonances for this compound.
Solution:
Quinidine
296

Instructor’s Guide and Solutions Manual
Proton Chemical Shift (ppm) Carbon Chemical Shift (ppm) H1 8.69 C1 147.4 H2 7.53 C2 118.9
C3 149.4
C4 126.9
H5 7.48 C5 102.3
C6 156.7
H7 7.39 C7 120.9 H8 7.94 C8 131.0
C9 143.8
H10 5.32 C10 70.7 H11 3.00 C11 60.5 H12a 1.94
C12 23.1 H12b 1.38 H13 1.68 C13 27.8 H14a 1.43
C14 26.2 H14b 1.43 H15a 2.53
C15 49.1 H15b 2.63 H16a 2.70
C16 48.4 H16b 3.06 H17 2.17 C17 39.8 H18 6.10 C18 141.2 H19a H19b
5.08 5.05
C19 114.2
H20 3.90 C20 55.3 OH 5.73
1. The aromatic protons can be assigned from the coupling patterns and constants in the 1H NMR spectrum. Based on the coupling constant of 2.8 Hz, the signal at 7.48 ppm is assigned to H5, which has no neighbouring protons in ortho positions.
2. The signal at 7.39 ppm (dd, J = 2.8 and 9.3 Hz) is assigned to H7 (coupling to H5 (J = 2.8 Hz) and its ortho neighbour H8 (J = 9.3 Hz).
3. The signal at 7.94 ppm is a doublet with a splitting of 9.3 Hz, so this is assigned to H8.
297

Organic Structures from 2D NMR Spectra
1H NMR spectrum of quinidine – expansion (DMSO-d6, 600 MHz)
4. The remaining two signals, which are mutually-coupled doublets with J = 4.4 Hz, are assigned to H1 and H2. Based on the chemical shift, the signal at 8.69 ppm is assigned as H1 (as it is adjacent to the nitrogen atom) and the signal at 7.53 ppm is assigned to H2.
5. On the basis of integration, the signal at 3.90 ppm is assigned to H20.
298

Instructor’s Guide and Solutions Manual 6. The me-HSQC spectrum (expansion F) is used to assign the protonated carbon atoms of
the aromatic ring: C1 at 147.4, C2 at 118.9, C5 at 102.3, C7 at 120.9 and C8 at 131.0 ppm.
7. This spectrum also allows identification of the protonated alkene carbon atoms: C19 – the methylene carbon is at 114.3 ppm. H19a and H19b are identified as the signals at 5.08 and 5.05 ppm in the 1H NMR spectrum. C18 is the remaining protonated carbon resonance at 141.2 ppm, and H18 is the 1H NMR resonance at 6.10 ppm.
1H–13C me-HSQC spectrum of quinidine – expansion F (DMSO-d6, 600 MHz)
299

Organic Structures from 2D NMR Spectra
1H–13C me-HSQC spectrum of quinidine – expansion E
8. C20 is assigned as the signal at 55.3 ppm.
9. Expansion E of the me-HSQC spectrum can be used to identify which resonances in the alkyl region of the spectrum correspond to methine (CH) resonances, and which correspond to diastereotopic methylene (CH2) groups. There are resonances for four CH groups at 1H 5.32 / 13C 70.7 ppm (H10 / C10), 1H 3.00 / 13C 60.5 ppm (H11 / C11), 1H 2.17 / 13C 39.8 ppm (H17 / C17) and 1H 1.68 / 13C 27.8 ppm (H13 / C13). There are four CH2 groups, all with diastereotopic protons, at 1H 3.06, 2.70 / 13C 48.4 ppm (H16a, H16b / C16), 1H 2.63, 2.53 / 13C 49.1 ppm (H15a, H15b / C15), 1H 1.94,1.38 / 13C 23.1 ppm (H12a, H12b / C12) and 1H 1.43,1.43 / 13C 26.2 ppm (H14a, H14b / C14).
10. Close inspection of the HSQC spectrum shows that the 1H resonance at 5.73 ppm does not correlate to a carbon resonance. This resonance must therefore correspond to the hydroxyl proton.
300

Instructor’s Guide and Solutions Manual 11. The 1H–1H COSY spectrum can now be used to identify the resonances in the
quinuclidine portion of the molecule.
1H–1H COSY spectrum of quinidine – expansion A (DMSO-d6, 600 MHz)
12. Expansion A shows a correlation between H18 and the signal at 2.17 ppm. This is assigned as H17.
301

Organic Structures from 2D NMR Spectra
1H–1H COSY spectrum of quinidine – expansion C
13. Expansion C shows the expected correlation between H18 and H19a and H19b, and a second correlation between the hydroxyl proton and the signal at 5.32 ppm. This resonance is assigned as H10 (this resonance could also have been assigned on the basis of chemical shift).
14. In expansion A, H10 correlates to the signal at 3.00 ppm, which is assigned as H11.
302

Instructor’s Guide and Solutions Manual 15. In expansion B, H11 correlates to the diastereotopic methylene pair at 1.94 and 1.38 ppm.
These signals are assigned as H12a and H12b, but we cannot yet tell which is which.
1H–1H COSY spectrum of quinidine – expansion B
16. There is also a correlation between H12a and H12b in expansion B. These resonances, which should correlate to H13, show no additional cross-peaks. The bond angle between H13 and the neighbouring diastereotopic H12 protons must render the coupling vanishingly small (see Karplus relationship). Nevertheless, H13 can be identified as the only remaining unassigned CH signal – at 1.68 ppm.
303
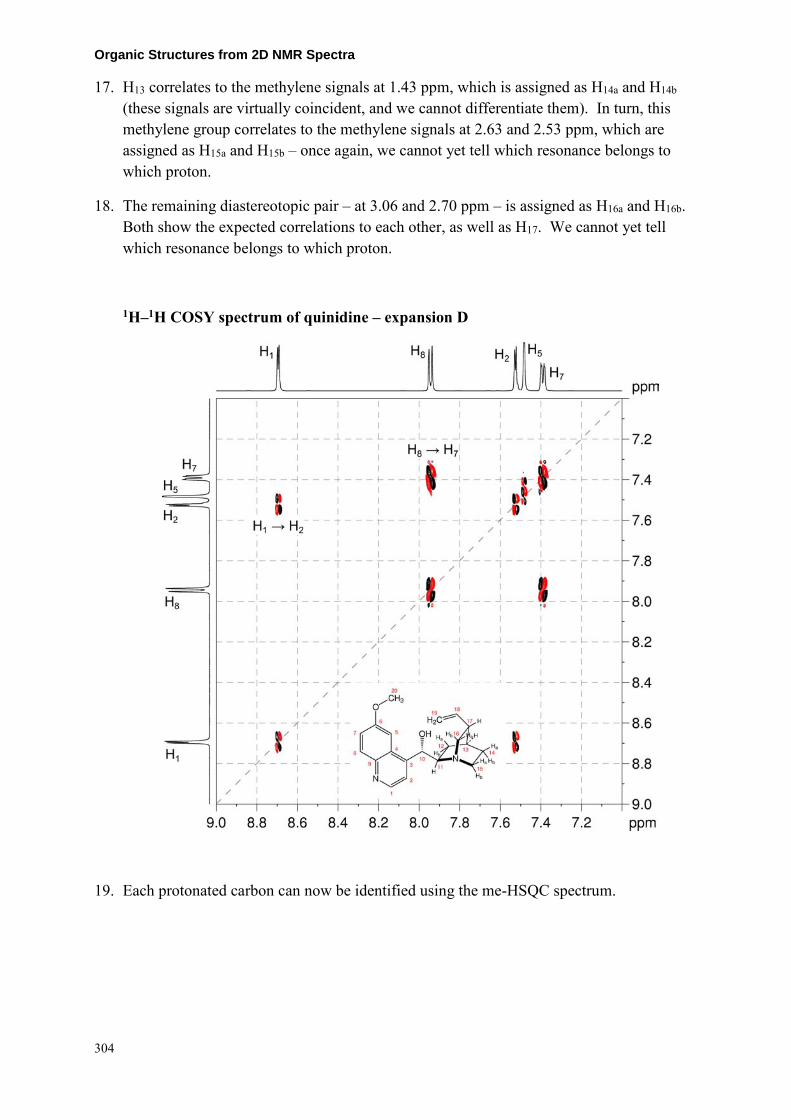
Organic Structures from 2D NMR Spectra 17. H13 correlates to the methylene signals at 1.43 ppm, which is assigned as H14a and H14b
(these signals are virtually coincident, and we cannot differentiate them). In turn, this methylene group correlates to the methylene signals at 2.63 and 2.53 ppm, which are assigned as H15a and H15b – once again, we cannot yet tell which resonance belongs to which proton.
18. The remaining diastereotopic pair – at 3.06 and 2.70 ppm – is assigned as H16a and H16b. Both show the expected correlations to each other, as well as H17. We cannot yet tell which resonance belongs to which proton.
1H–1H COSY spectrum of quinidine – expansion D
19. Each protonated carbon can now be identified using the me-HSQC spectrum.
304

Instructor’s Guide and Solutions Manual 20. The HMBC spectrum is used to identify the non-protonated carbon atoms. Remember
that: a) in aromatic systems, the three-bond coupling 3JC–H is typically the larger long-range coupling and gives rise to the strongest cross-peaks; b) the presence of electronegative substituents, such as oxygen or nitrogen, may increase the size of 2JC–H; c) benzylic protons correlate to the ipso carbon (two-bond correlation) and the ortho carbons (three-bond correlations).
1H–13C HMBC spectrum of quinidine – expansion G (DMSO-d6, 600 MHz)
305
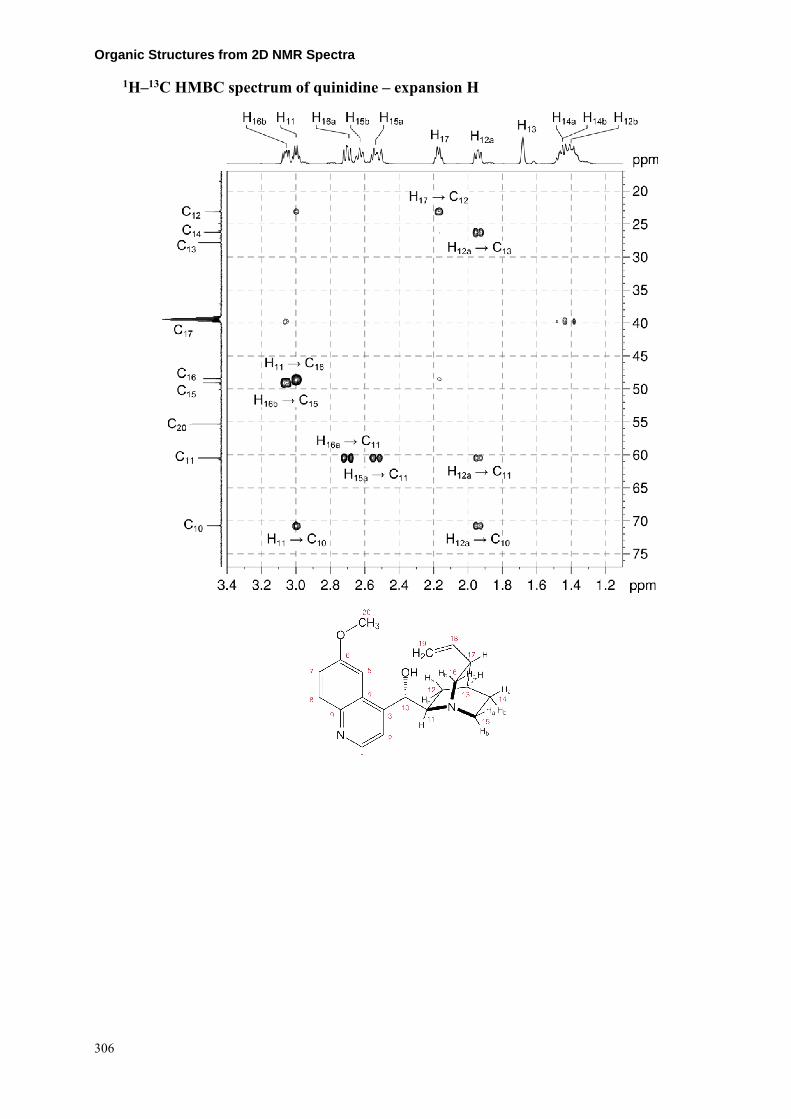
Organic Structures from 2D NMR Spectra
1H–13C HMBC spectrum of quinidine – expansion H
306

Instructor’s Guide and Solutions Manual 21. H20 correlates to the signal at 156.7 ppm (expansion J). This resonance is assigned as C6.
1H–13C HMBC spectrum of quinidine – expansion J
307

Organic Structures from 2D NMR Spectra 22. H7 correlates to the resonances at 102.3 ppm (C5) and 143.8 ppm (expansion I). This
latter resonance is assigned to C9.
23. H8 correlates to the resonances at 126.9 ppm and 156.7 ppm (C6) (expansion I). The former resonance is assigned to C4.
24. H1 correlates to the resonances at 118.9 ppm (C2), 143.8 ppm (C9) and 149.4 ppm. The latter resonance is assigned to C3.
1H–13C HMBC spectrum of quinidine – expansion I
25. All the 13C resonances have now been assigned.
13C{1H} NMR spectrum of quinidine (DMSO-d6, 150 MHz)
308

Instructor’s Guide and Solutions Manual 26. The NOESY spectrum can be used to identify which diastereotopic protons occur on
which face of the quinuclidine ring system.
27. H11 shows a NOE correlation to the signal at 1.38 ppm (expansion K), previously identified as either H12a or H12b. As H11 is on the bottom face of the quinuclidine ring, we can now assign the signal at 1.38 ppm as H12b. The resonance at 1.94 ppm is therefore assigned as H12a. This assignment is confirmed by the correlation between the signal at 1.94 ppm and H18 (expansion L).
1H–1H NOESY spectrum of quinidine – expansion K (DMSO-d6, 600 MHz)
309

Organic Structures from 2D NMR Spectra
1H–1H NOESY spectrum of quinidine – expansion L
28. H11 also correlates to the signal at 2.63 ppm, previously identified as either H15a or H15b (expansion K). As H11 is on the bottom face of the quinuclidine ring, we can now assign the signal at 2.63 ppm as H15b. The resonance at 2.53 ppm is therefore assigned as H15a.
29. H17 correlates to the signal at 2.70 ppm (expansion K), previously identified as either H16a or H16b. We can now assign this signal as H16a. The resonance at 3.06 ppm is therefore assigned as H16b. This assignment is confirmed by the correlation between the signal at 3.06 ppm and H18 (expansion L).
310

Instructor’s Guide and Solutions Manual 30. The alkene protons H19a and H19b may be assigned based on coupling constants. The 1H
signal at 5.08 ppm has a coupling constant of 17 Hz and can be assigned to the proton trans to H18 (H19a). The signal at 5.05 ppm has a coupling constant of 10 Hz and can be assigned to the proton cis to H18 (H19b).
1H NMR spectrum of quinidine – expansions (DMSO-d6, 600 MHz)
311

Organic Structures from 2D NMR Spectra
Problem 59
Question:
Identify the following compound.
Molecular Formula: C13H21NO3
HINT: This compound contains a secondary amine.
Solution:
Salbutamol
1. The molecular formula is C13H21NO3. Calculate the degree of unsaturation from the molecular formula: ignore the O atoms and ignore the N and remove one H to give an effective molecular formula of C13H20 (CnHm) which gives the degree of unsaturation as (n – m/2 + 1) = 13 – 10 + 1 = 4. The compound contains a combined total of four rings and/or π bonds.
2. There are four exchangeable protons – hint given that the compound contains a secondary amine i.e. there is an NH group present, thus the remaining three exchangeable protons must be OH groups. The three hydroxy groups account for all the oxygen atoms in the molecule.
3. From the 1H NMR spectrum, there are three aromatic protons and the coupling pattern indicates the aromatic ring is a “1,2,4-trisubstituted benzene”. The proton at 7.26 ppm clearly has no ortho couplings and must be the isolated proton in the spin system sandwiched between two substituents. The two protons at 6.99 and 6.69 ppm each have a large ortho coupling so they must be adjacent to each other. The proton at 6.99 ppm has an additional meta coupling so it must be the proton meta to the proton at 7.26 ppm. The remaining proton at 6.69 ppm must be the proton para to the proton at 7.26 ppm.
4. An aromatic ring would account for all degrees of unsaturation and there are no additional double bonds or rings in the structure.
5. Also from the 1H NMR spectrum, there are signals for an isolated OCH2 group at 4.46 ppm, an OCH group at 4.39 ppm, a CH2 group at 2.53 ppm and three equivalent CH3 groups at 1.01 ppm. The multiplicities of the signals can be confirmed using the 1H–13C me-HSQC spectrum.
312

Instructor’s Guide and Solutions Manual
1H NMR spectrum of salbutamol (DMSO-d6, 500 MHz)
1H NMR spectrum of salbutamol – expansions
13C{1H} NMR spectrum of salbutamol (DMSO-d6, 125 MHz)
313

Organic Structures from 2D NMR Spectra 6. In the COSY spectrum, there are correlations between the OCH
group at 4.39 ppm and the CH2 group at 2.53 ppm indicating an OCH–CH2 fragment.
7. In the COSY spectrum, there is also a weak correlation between the OCH2 group at 4.46 ppm and the aromatic proton at 7.26 ppm indicating that the OCH2 group is a substituent of the aromatic ring, most likely in a position ortho to the aromatic proton at 7.26 ppm (i.e. either at position Y or Z in the aromatic ring).
8. There are also the expected aromatic proton correlations in the COSY spectrum.
1H–1H COSY spectrum of salbutamol (DMSO-d6, 500 MHz)
9. The 1H–13C me-HSQC spectrum easily identifies the protonated
carbons. The isolated aromatic proton at 7.26 ppm correlates to
314

Instructor’s Guide and Solutions Manual
the carbon at 125.3 ppm. The aromatic protons at 6.99 and 6.69 ppm correlate to the carbons at 124.9 and 114.0 ppm, respectively.
10. The OCH proton at 4.39 ppm correlates to the carbon at 72.5 ppm. The OCH2 protons at 4.46 ppm correlate to the carbon at 58.4 ppm. The CH2 protons at 2.53 ppm correlate to the carbon at 50.9 ppm and the CH3 protons correlate to the carbon at 29.0 ppm.
11. The three aromatic carbons which bear substituents appear at 153.1, 134.7 and 127.9 ppm. The low-field carbon resonance (153.1 ppm) must be a carbon bound to an oxygen atom.
1H–13C me-HSQC spectrum of salbutamol (DMSO-d6, 500 MHz)
12. In the 1H–13C HMBC spectrum, the correlations from the
aromatic protons at 7.26 and 6.99 ppm to the OCH carbon at 72.5 ppm place the OCH group as a substituent of the aromatic
315
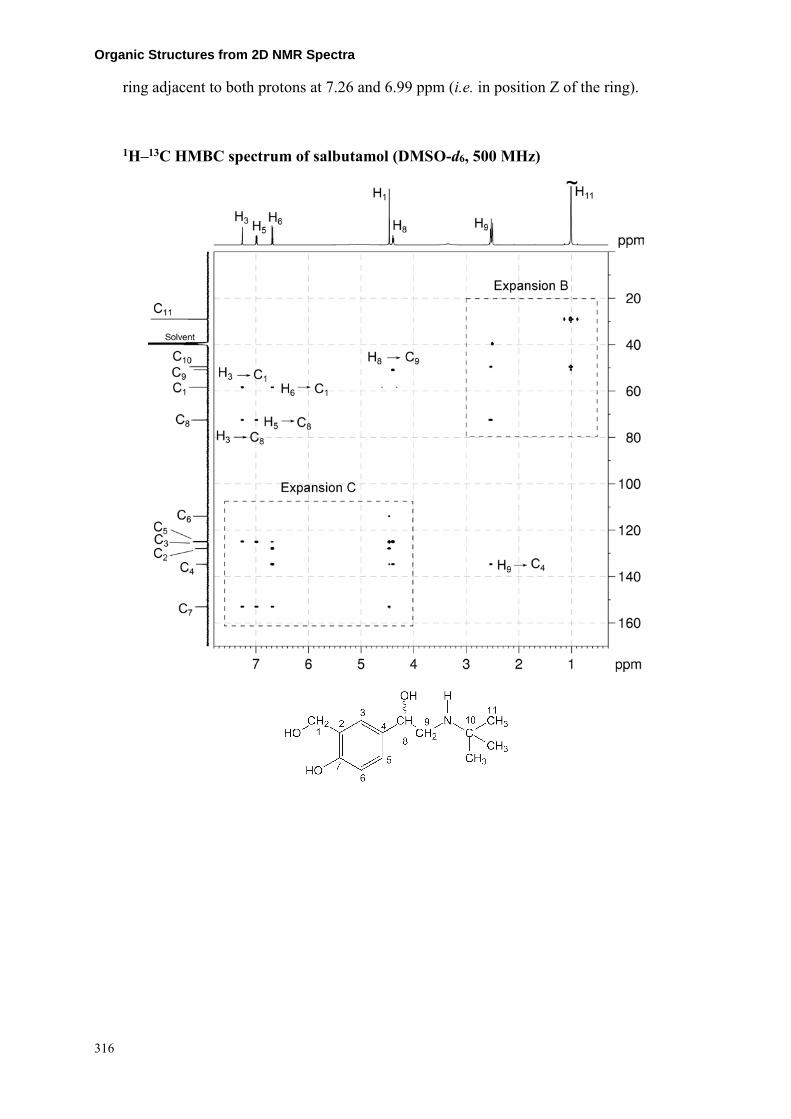
Organic Structures from 2D NMR Spectra
ring adjacent to both protons at 7.26 and 6.99 ppm (i.e. in position Z of the ring).
1H–13C HMBC spectrum of salbutamol (DMSO-d6, 500 MHz)
316
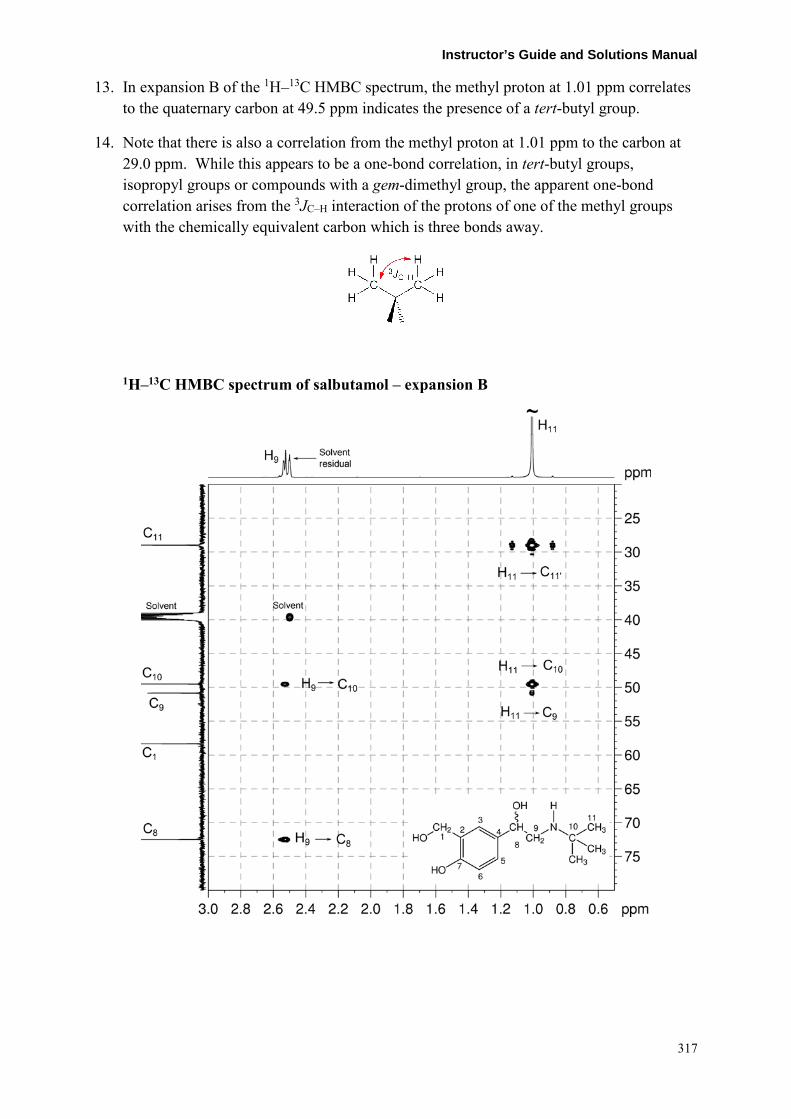
Instructor’s Guide and Solutions Manual 13. In expansion B of the 1H–13C HMBC spectrum, the methyl proton at 1.01 ppm correlates
to the quaternary carbon at 49.5 ppm indicates the presence of a tert-butyl group.
14. Note that there is also a correlation from the methyl proton at 1.01 ppm to the carbon at 29.0 ppm. While this appears to be a one-bond correlation, in tert-butyl groups, isopropyl groups or compounds with a gem-dimethyl group, the apparent one-bond correlation arises from the 3JC–H interaction of the protons of one of the methyl groups with the chemically equivalent carbon which is three bonds away.
1H–13C HMBC spectrum of salbutamol – expansion B
317
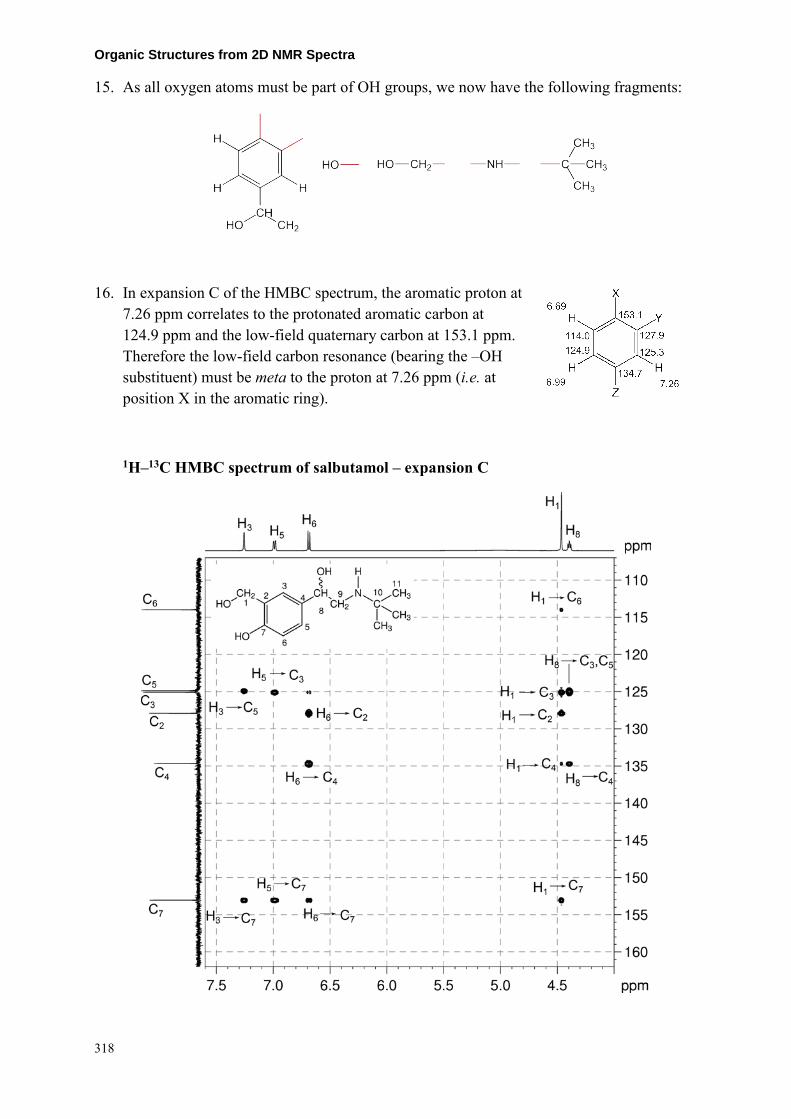
Organic Structures from 2D NMR Spectra 15. As all oxygen atoms must be part of OH groups, we now have the following fragments:
16. In expansion C of the HMBC spectrum, the aromatic proton at 7.26 ppm correlates to the protonated aromatic carbon at 124.9 ppm and the low-field quaternary carbon at 153.1 ppm. Therefore the low-field carbon resonance (bearing the –OH substituent) must be meta to the proton at 7.26 ppm (i.e. at position X in the aromatic ring).
1H–13C HMBC spectrum of salbutamol – expansion C
318
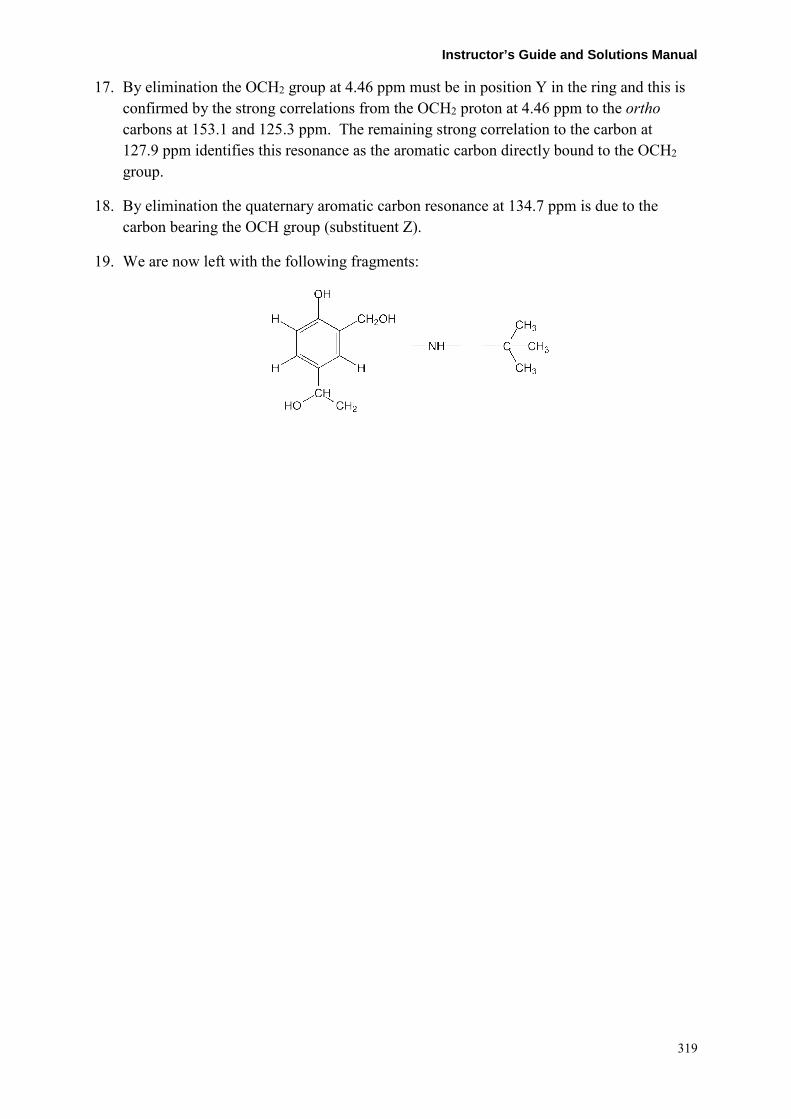
Instructor’s Guide and Solutions Manual 17. By elimination the OCH2 group at 4.46 ppm must be in position Y in the ring and this is
confirmed by the strong correlations from the OCH2 proton at 4.46 ppm to the ortho carbons at 153.1 and 125.3 ppm. The remaining strong correlation to the carbon at 127.9 ppm identifies this resonance as the aromatic carbon directly bound to the OCH2 group.
18. By elimination the quaternary aromatic carbon resonance at 134.7 ppm is due to the carbon bearing the OCH group (substituent Z).
19. We are now left with the following fragments:
319

Organic Structures from 2D NMR Spectra 20. The correlations in the NOESY spectrum are consistent with the
structure. In particular, the correlations from the aromatic protons at 7.26 and 6.99 ppm to the OCH and CH2 protons at 4.39 and 2.53 ppm confirm the placement of the OCHCH2 fragment between these two aromatic protons in the ring (i.e. position Z).
21. Similarly the correlation from the aromatic proton at 7.26 ppm to the OCH2 proton at 4.46 ppm places the OCH2 fragment in the position adjacent to the proton at 7.26 ppm (i.e. position Y).
1H–1H NOESY spectrum of salbutamol (DMSO-d6, 500 MHz)
320
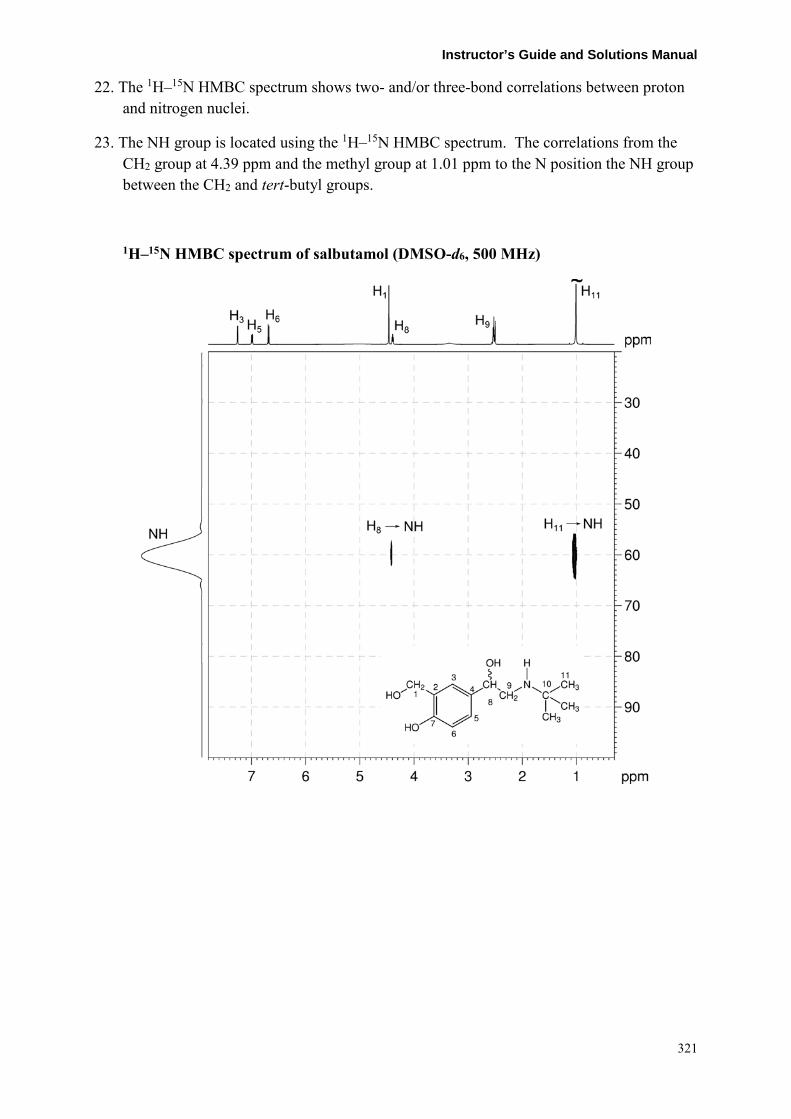
Instructor’s Guide and Solutions Manual 22. The 1H–15N HMBC spectrum shows two- and/or three-bond correlations between proton
and nitrogen nuclei.
23. The NH group is located using the 1H–15N HMBC spectrum. The correlations from the CH2 group at 4.39 ppm and the methyl group at 1.01 ppm to the N position the NH group between the CH2 and tert-butyl groups.
1H–15N HMBC spectrum of salbutamol (DMSO-d6, 500 MHz)
321

Organic Structures from 2D NMR Spectra
Problem 60
Question:
Identify the following compound.
Molecular Formula: C11H8O2
IR: 2957, 2925, 2855, 1645, 1631, 1621 cm−1.
Solution:
2-Hydroxy-1-naphthaldehyde
1. The molecular formula is C11H8O2. Calculate the degree of unsaturation from the molecular formula: ignore the O atoms to give an effective molecular formula of C11H8 (CnHm) which gives the degree of unsaturation as (n – m/2 + 1) = 11 – 4 + 1 = 8. The compound contains a combined total of eight rings and/or π bonds.
2. From the 1H NMR spectrum, there are two signals to low-field. The signal at 13.1 ppm is exchangeable and must be due to an –OH group.
3. There are also six aromatic signals which imply the presence of two aromatic rings.
4. The fact that there are only eleven carbons in the molecule indicates that the aromatic rings must be fused and share some common carbons.
1H NMR spectrum of 2-hydroxy-1-naphthaldehyde (CDCl3, 600 MHz)
322

Instructor’s Guide and Solutions Manual
13C{1H} NMR spectrum of 2-hydroxy-1-naphthaldehyde (CDCl3, 150 MHz)
5. The 1H–1H COSY spectrum shows that there are two unique aromatic spin systems – one is a four spin system, the other a two spin system. From the magnitude of the coupling constants, we can conclude that the compound is either a 1,2- or 1,4-disubstituted naphthalene.
1H–1H COSY spectrum of 2-hydroxy-1-naphthaldehyde (CDCl3, 600 MHz)
323

Organic Structures from 2D NMR Spectra 6. The 1H–13C me-HSQC spectrum shows that the 1H signal at 10.7 ppm correlates to the
13C signal at 193.4 ppm. This is consistent with the presence of an aldehyde.
7. All oxygen atoms in the molecular formula are now accounted for.
1H–13C me-HSQC spectrum of 2-hydroxy-1-naphthaldehyde (CDCl3, 600 MHz)
324

Instructor’s Guide and Solutions Manual 8. The 1H–13C me-HSQC spectrum can also be used to identify the protonated aromatic
carbon atoms (at 139.1, 129.4, 129.1, 124.4, 119.1 and 118.5 ppm).
1H–13C me-HSQC spectrum of 2-hydroxy-1-naphthaldehyde – expansion A
9. Based on the information available so far, there are three possible candidates:
325

Organic Structures from 2D NMR Spectra 10. The HMBC spectrum can be used to identify the correct isomer. Remember that: a) in
aromatic systems, the three-bond coupling 3JC–H is typically the larger long-range coupling and gives rise to the strongest cross-peaks; b) the presence of electronegative substituents, such as oxygen or nitrogen, may increase the size of 2JC–H; c) benzylic protons correlate to the ipso carbon (two-bond correlation) and the ortho carbons (three-bond correlations).
1H–13C HMBC spectrum of 2-hydroxy-1-naphthaldehyde (CDCl3, 600 MHz)
11. On the basis of chemical shift, the carbon atom ipso to the phenol group can be identified as the resonance at 164.9 ppm.
326

Instructor’s Guide and Solutions Manual 12. In expansion B, both the phenolic proton and the aldehydic proton correlate to the
protonated carbon signal at 119.1 ppm, and the quaternary carbon signal at 111.2 ppm. The quaternary signal is assigned to the carbon atom ipso to the aldehyde (this can be confirmed via the observation that the H11 → C1 signal is split in expansion B, consistent with the large 2JC–H observed for aldehydes).
1H–13C HMBC spectrum of 2-hydroxy-1-naphthaldehyde – expansion B
13. Isomer C can be ruled out, as the phenolic proton in this compound would not correlate to the carbon atom bearing the aldehyde (this would be a five-bond correlation).
14. From the 1H–1H COSY spectrum, we know that the four-spin aromatic ring has signals at 8.25, 7.74, 7.57 and 7.40 ppm. The first two signals represent the two protons on either end of the spin system, the second two signals the middle two protons.
327

Organic Structures from 2D NMR Spectra 15. In the 1H–13C HMBC (expansion C), there is a correlation between the signal at 8.25 ppm
and the ipso carbon of the aldehyde (at 111.2 ppm). On this basis, we can eliminate Isomer B – as this would represent a four-bond correlation, while in Isomer A this is a three-bond correlation.
1H–13C HMBC spectrum of 2-hydroxy-1-naphthaldehyde – expansion C
16. Isomer A (2-hydroxy-1-naphthaldehyde) is therefore the correct structure.
17. Note that the expected three-bond correlation between H11 and C10 is absent, and there is a four-bond correlation between H11 and C3. A careful analysis of all the HMBC correlations supports the formulation of Isomer A over Isomer B.
328

Instructor’s Guide and Solutions Manual
Problem 61
Question:
Identify the following compound.
Molecular Formula: C10H10O2
IR: 1689 cm−1
Solution:
6-Methyl-4-chromanone
1. The molecular formula is C10H10O2. Calculate the degree of unsaturation from the molecular formula: ignore the O atoms to give an effective molecular formula of C10H10 (CnHm) which gives the degree of unsaturation as (n – m/2 + 1) = 10 – 5 + 1 = 6. The compound contains a combined total of six rings and/or π bonds.
2. IR and 13C NMR spectra establish the presence of a ketone (13C resonance at 191.9 ppm).
3. The coupling pattern in the aromatic region of the 1H NMR spectrum shows that the compound must be a “1,2,4-trisubstituted benzene”. The proton at 7.65 ppm (H5) clearly has no ortho couplings and must be the isolated proton in the spin system sandwiched between two substituents. The two protons at 7.25 and 6.85 ppm each have a large ortho coupling so they must be adjacent to each other. The proton at 7.25 ppm (H7) has an additional meta coupling so it must be the proton meta to the proton at 7.65 ppm. The remaining proton at 6.85 ppm (H8) must be the proton para to the proton at 7.65 ppm.
4. There are also signals in the 1H NMR spectrum for an OCH2 group at 4.48 ppm (H2), a CH2 group at 2.76 ppm (H3) and a CH3 group at 2.28 ppm (H11). The CH2 groups are spin-coupled affording the OCH2CH2 fragment.
329

Organic Structures from 2D NMR Spectra
1H NMR spectrum of 6-methyl-4-chromanone (CDCl3, 500 MHz)
13C{1H} NMR spectrum of 6-methyl-4-chromanone (CDCl3, 125 MHz)
330

Instructor’s Guide and Solutions Manual 5. The me-HSQC spectrum easily identifies the protonated carbons.
The isolated aromatic proton at 7.65 ppm correlates to the carbon at 126.7 ppm (C5). The aromatic proton at 7.25 ppm correlates to the carbon at 137.0 ppm (C7). The aromatic proton at 6.85 correlates to the carbon at 117.6 ppm (C8).
6. In the me-HSQC spectrum, the OCH2 carbon is at 67.0 ppm (C2), the CH2 carbon is at 37.8 ppm (C3) and the CH3 carbon is at 20.4 ppm (C11).
7. The three aromatic carbons which bear the substituents appear at 159.9, 130.7 and 120.9 ppm. The low-field carbon resonance (159.9 ppm) must be the carbon bearing an oxygen atom based on its chemical shift.
8. The aromatic ring and ketone functionality accounts for five degrees of unsaturation. There are no signals for an additional double bond thus there must be an additional ring in the molecule.
1H–13C me-HSQC spectrum of 6-methyl-4-chromanone (CDCl3, 500 MHz)
331

Organic Structures from 2D NMR Spectra 9. In the HMBC spectrum, the correlations from the aromatic
protons at 7.65 and 7.25 ppm to the methyl carbon at 20. 4 ppm (H5–C11 and H7–C11) place the CH3 group as a substituent between these aromatic protons on the aromatic ring (i.e. position Z).
10. The methylene to ketone correlations in the HMBC spectrum (H2–C4 and H3–C4) afford the OCH2CH2C=O fragment.
11. The H2–C10 correlation in the HMBC spectrum indicates that the OCH2 group is also a substituent of the aromatic ring.
12. Note that the H3–C3 and H11–C11 correlations are visible in the HMBC spectrum as large doublets.
1H–13C HMBC spectrum of 6-methyl-4-chromanone (CDCl3, 500 MHz)
332
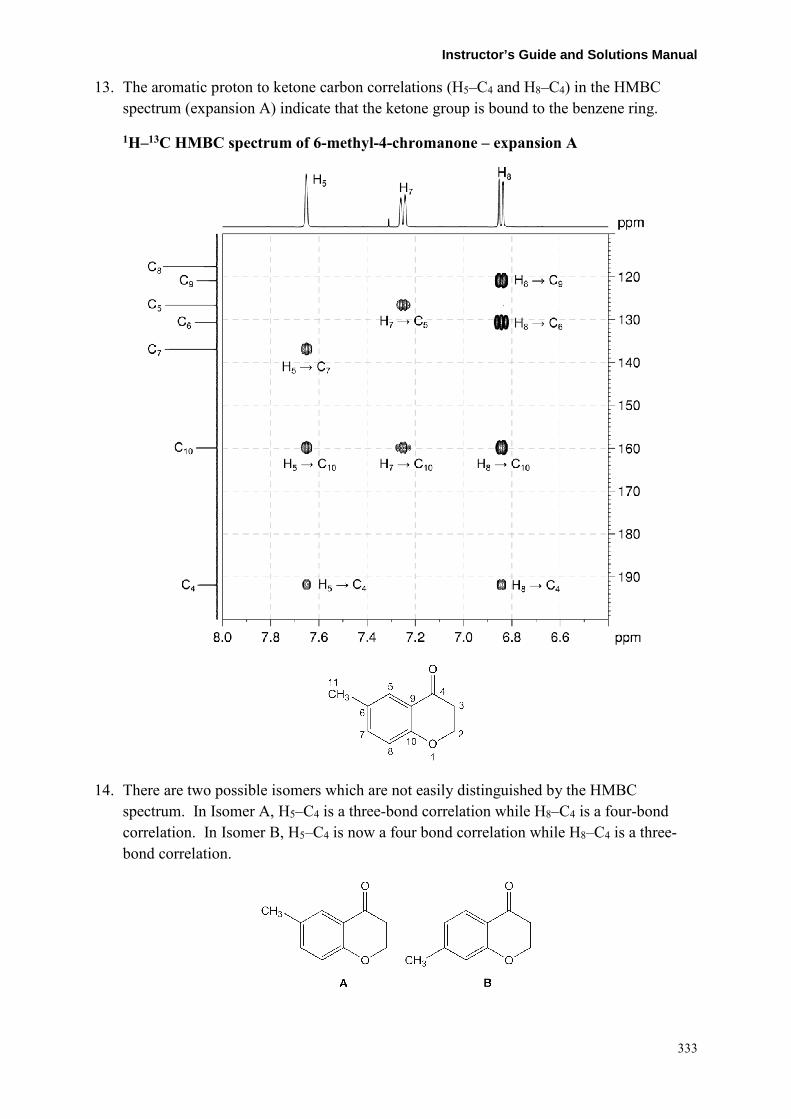
Instructor’s Guide and Solutions Manual 13. The aromatic proton to ketone carbon correlations (H5–C4 and H8–C4) in the HMBC
spectrum (expansion A) indicate that the ketone group is bound to the benzene ring.
1H–13C HMBC spectrum of 6-methyl-4-chromanone – expansion A
14. There are two possible isomers which are not easily distinguished by the HMBC spectrum. In Isomer A, H5–C4 is a three-bond correlation while H8–C4 is a four-bond correlation. In Isomer B, H5–C4 is now a four bond correlation while H8–C4 is a three-bond correlation.
333

Organic Structures from 2D NMR Spectra 15. In the HMBC spectrum (expansion A), H5 correlates to the protonated aromatic carbon
signal at 137.0 ppm (C7) and the quaternary aromatic carbon signal at 159.9 ppm. H7 correlates to the protonated aromatic carbon signal at 126.7 ppm (C5) and the quaternary aromatic carbon signal at 159.9 ppm. As both H5 and H7 correlate to the signal at 159.9 ppm, this signal may be assigned to the carbon meta to H5 and H7 (C10). The downfield shift of C10 is consistent with the fact that C10 is bound to an O atom, pointing towards Isomer A as the correct structure.
16. In expansion B of the HMBC spectrum, the methyl protons (H11) correlate to protonated aromatic carbon signals at 126.7 and 137.0 (C5 and C7, respectively) and to quaternary aromatic carbon signal at 130.7 ppm which can be assigned to C6. The H11 correlation to the signal at 159.9 ppm (previously assigned to C10) is a five-bond coupling and again makes it difficult to distinguish between Isomers A and B.
1H–13C HMBC spectrum of 6-methyl-4-chromanone – expansion B
334

Instructor’s Guide and Solutions Manual 18. The correct structure of the compound can be determined using the INADEQUATE
spectrum which shows direct 13C–13C connectivity.
19. The methyl carbon C11 has a correlation to quaternary aromatic carbon C6.
20. C6 has correlations to protonated aromatic carbons C5 and C7.
21. C5 has a correlation to quaternary aromatic carbon C9 which in turn has correlations to quaternary carbon C10 and ketone carbon C4. These correlations afford the fragment below which confirms Isomer A as the correct compound.
INADEQUATE spectrum of 6-methyl-4-chromanone (CDCl3, 150 MHz)
335

Organic Structures from 2D NMR Spectra
Problem 62
Question:
Identify the following compound.
Molecular Formula: C10H18O
IR: 1727 (s) cm−1
Solution:
Citronellal
1. The molecular formula is C10H18O. Calculate the degree of unsaturation from the molecular formula: ignore the O atoms to give an effective molecular formula of C10H18 (CnHm) which gives the degree of unsaturation as (n – m/2 + 1) = 10 – 9 + 1 = 2. The compound contains a combined total of two rings and/or π bonds.
2. The 13C{1H} NMR spectrum has a signal at 203.0 ppm consistent with a carbonyl group. The low-field 1H NMR signal at 9.75 ppm correlates to the low-field carbon at 203.0 ppm in the HSQC spectrum indicating the presence of an aldehyde group. This accounts for one of the degrees of unsaturation and the oxygen in the molecular formula.
3. The 1H NMR signal at 5.08 ppm, and the 13C{1H} NMR signals at 131.8 and 124.0 ppm are consistent with the presence of a trisubstituted alkene. This accounts for the second degree of unsaturation. The compound contains no additional rings or multiple bonds.
1H NMR spectrum of citronellal (CDCl3, 400 MHz)
336

Instructor’s Guide and Solutions Manual
13C{1H} NMR spectrum of citronellal (CDCl3, 100 MHz)
4. The 1H–13C me-HSQC spectrum shows one quaternary alkene carbon, 3 × CH groups (including aldehyde and alkene protons), 3 × CH2 groups and 3 × CH3 groups. All three CH2 groups are diastereotopic, i.e. two chemically non-equivalent protons attached to the same carbon. The molecule must contain a chiral centre.
1H–13C me-HSQC spectrum of citronellal (CDCl3, 400 MHz)
337
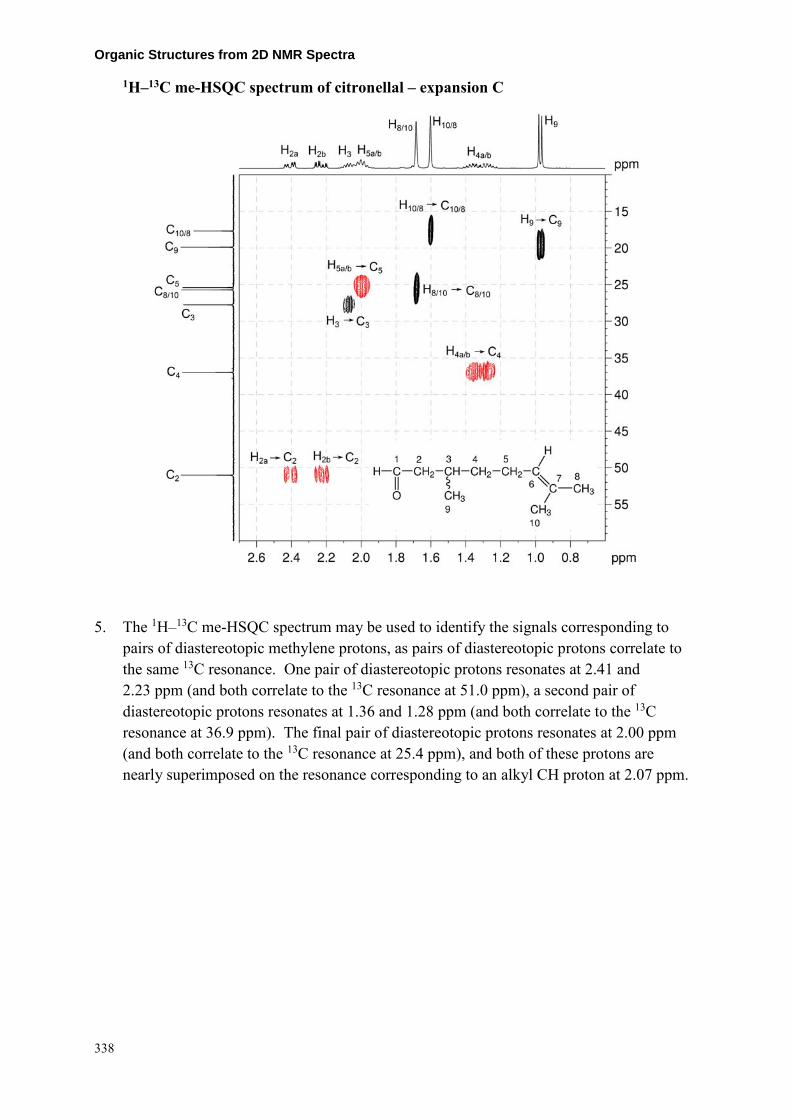
Organic Structures from 2D NMR Spectra
1H–13C me-HSQC spectrum of citronellal – expansion C
5. The 1H–13C me-HSQC spectrum may be used to identify the signals corresponding to pairs of diastereotopic methylene protons, as pairs of diastereotopic protons correlate to the same 13C resonance. One pair of diastereotopic protons resonates at 2.41 and 2.23 ppm (and both correlate to the 13C resonance at 51.0 ppm), a second pair of diastereotopic protons resonates at 1.36 and 1.28 ppm (and both correlate to the 13C resonance at 36.9 ppm). The final pair of diastereotopic protons resonates at 2.00 ppm (and both correlate to the 13C resonance at 25.4 ppm), and both of these protons are nearly superimposed on the resonance corresponding to an alkyl CH proton at 2.07 ppm.
338

Instructor’s Guide and Solutions Manual 6. In the 1H–1H COSY spectrum (expansion B), the aldehyde proton (H1, 9.75 ppm) couples
to the diastereotopic methylene protons at 2.41 and 2.23 ppm. These protons are identified as H2a and H2b, and show that a HC(=O)–CH2– fragment is present in the molecule.
1H–1H COSY spectrum of citronellal – expansion B (CDCl3, 400 MHz)
339
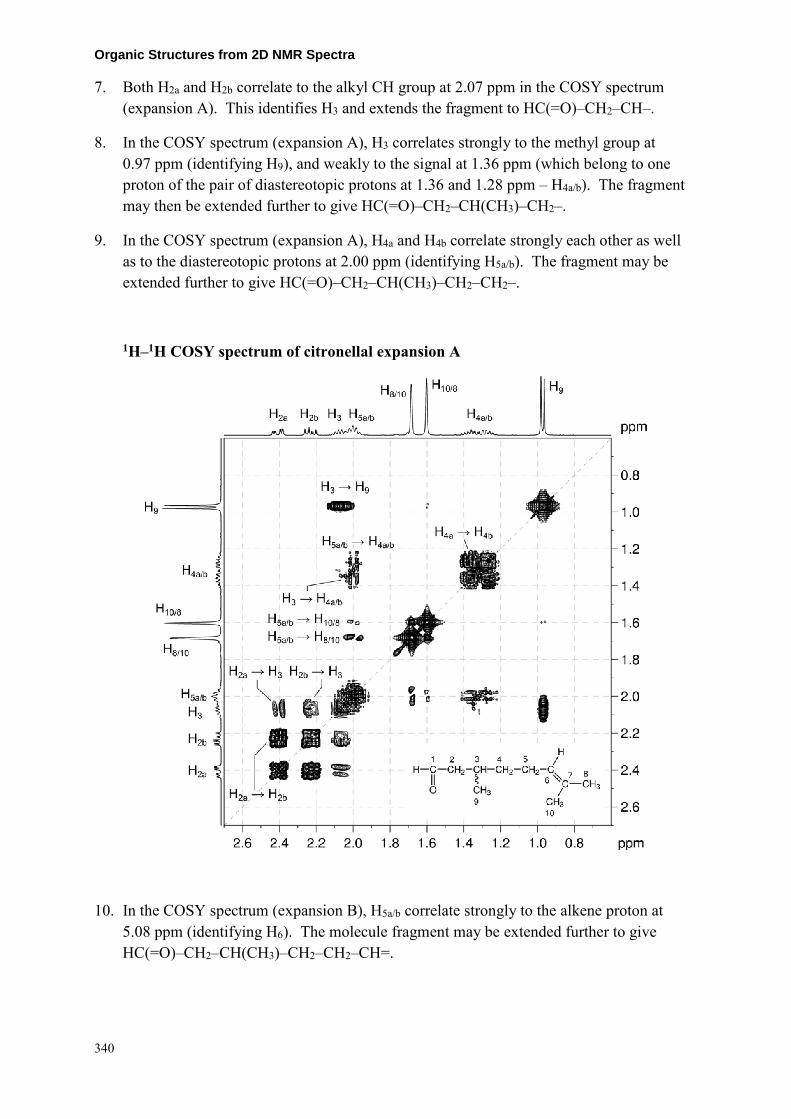
Organic Structures from 2D NMR Spectra 7. Both H2a and H2b correlate to the alkyl CH group at 2.07 ppm in the COSY spectrum
(expansion A). This identifies H3 and extends the fragment to HC(=O)–CH2–CH–.
8. In the COSY spectrum (expansion A), H3 correlates strongly to the methyl group at 0.97 ppm (identifying H9), and weakly to the signal at 1.36 ppm (which belong to one proton of the pair of diastereotopic protons at 1.36 and 1.28 ppm – H4a/b). The fragment may then be extended further to give HC(=O)–CH2–CH(CH3)–CH2–.
9. In the COSY spectrum (expansion A), H4a and H4b correlate strongly each other as well as to the diastereotopic protons at 2.00 ppm (identifying H5a/b). The fragment may be extended further to give HC(=O)–CH2–CH(CH3)–CH2–CH2–.
1H–1H COSY spectrum of citronellal expansion A
10. In the COSY spectrum (expansion B), H5a/b correlate strongly to the alkene proton at 5.08 ppm (identifying H6). The molecule fragment may be extended further to give HC(=O)–CH2–CH(CH3)–CH2–CH2–CH=.
340

Instructor’s Guide and Solutions Manual 11. From the me-HSQC spectrum we know that there is one quaternary and one protonated
alkene carbon, so we can extend the molecule fragment to HC(=O)–CH2–CH(CH3)–CH2–CH2–CH=C<.
12. In the COSY spectrum (expansion B), H6 correlates to both remaining CH3 groups (at 1.68 and 1.60 ppm). The structure of the molecule must therefore be HC(=O)–CH2–CH(CH3)–CH2–CH2–CH=C(CH3)2 – citronellal. It is not possible to conclusively identify which methyl group corresponds to H8 and which is H10.
13. Expansion A of the COSY spectrum contains two long-range 5JH–H correlations between H5a/5b and each of the geminal methyl groups.
14. A check on the correlations in the HMBC spectrum shows that all of the observed correlations are reasonable two- and three-bond correlations.
1H–13C HMBC spectrum of citronellal – expansion D (CDCl3, 400 MHz)
341
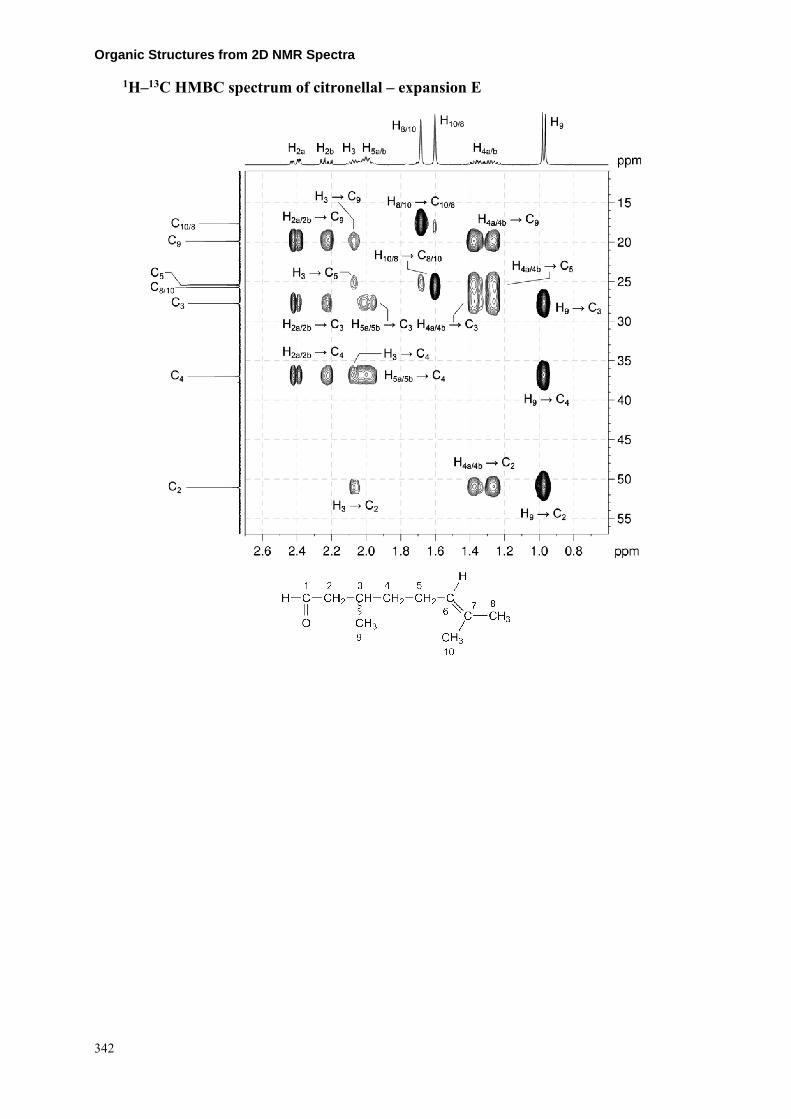
Organic Structures from 2D NMR Spectra
1H–13C HMBC spectrum of citronellal – expansion E
342

Instructor’s Guide and Solutions Manual
1H–13C HMBC spectrum of citronellal – expansion F
343

Organic Structures from 2D NMR Spectra
Problem 63
Question:
Identify the following compound, including any relative stereochemistry.
Molecular Formula: C7H8O2
IR: 1765 cm−1
Solution:
Oxabicyclo[3.3.0]oct-6-en-3-one
1. The molecular formula is C7H8O2. Calculate the degree of unsaturation from the molecular formula: ignore the O atoms to give an effective molecular formula of C7H8 (CnHm) which gives the degree of unsaturation as (n – m/2 + 1) = 7 – 4 + 1 = 4. The compound contains a combined total of four rings and/or π bonds.
2. IR and 1D NMR spectra establish the presence of an ester (13C resonance at 177.0 ppm). The ester group accounts for all oxygen atoms in the molecular formula.
3. In the 1H NMR spectrum, there are eight separate signals for the eight protons in the molecule.
1H NMR spectrum of oxabicyclo[3.3.0]oct-6-en-3-one (DMSO-d6, 400 MHz)
13C{1H} NMR spectrum of oxabicyclo[3.3.0]oct-6-en-3-one (DMSO-d6, 100 MHz)
344

Instructor’s Guide and Solutions Manual 4. In the me-HSQC spectrum, there are two resonances in the alkene region at 1H 5.77 / 13C
129.5.ppm (H6 / C6) and 1H 5.63 / 13C 132.5.ppm (H7 / C7).
5. In the me-HSQC spectrum, there are resonances for two CH groups at 1H 5.11 / 13C 83.1.ppm (H1 / C1) and 1H 3.46 / 13C 45.9.ppm (H5 / C5). On the basis of chemical shift, C1 is likely bound to an oxygen atom.
6. In the me-HSQC spectrum, there are also two CH2 groups, both with diastereotopic protons at 1H 2.83, 2.36 / 13C 33.2 ppm (H4a, H4b / C4) and 1H 2.68, 2.50 / 13C 39.5 ppm (H8a, H8b / C8). The diastereotopic protons indicate there is either a ring or chiral carbon in the molecule.
7. The ester and alkene functional groups account for two degrees of unsaturation. There are two additional degrees on unsaturation and these are likely due to the presence of rings in the molecule.
1H–13C me-HSQC spectrum of oxabicyclo[3.3.0]oct-6-en-3-one (DMSO-d6, 400 MHz)
345

Organic Structures from 2D NMR Spectra 8. In the COSY spectrum, H6 and H7 are coupled affording a CH=CH fragment.
9. In the COSY spectrum, H5 couples to H6 and H1 affording a CH=CH–CH–CH fragment.
10. In the COSY spectrum, H1 further couples to H8a affording the CH=CH–CH–CH–CH2 fragment
11. The H6–H8a, H7–H8a, H6–H8b and H7–H8b correlations in the COSY spectrum affords the ring structure below:
1H–1H COSY spectrum of oxabicyclo[3.3.0]oct-6-en-3-one (DMSO-d6, 400 MHz)
346

Instructor’s Guide and Solutions Manual 12. In the COSY spectrum, the H5–H4a correlation indicates there is a CH2 group bound to
C5.
13. We have now accounted for three degrees of unsaturation (ester group, alkene, ring) and all the atoms of the molecule. The remaining degree of unsaturation must be due to a second ring linked up by the ester group.
14. On the basis of chemical shift, C1 rather than C4 is bound to the oxygen atom of the ester group.
15. All correlations in the HMBC spectrum are consistent with the structure thus obtained.
1H–13C HMBC spectrum of oxabicyclo[3.3.0]oct-6-en-3-one (DMSO-d6, 400 MHz)
347

Organic Structures from 2D NMR Spectra 16. The relative stereochemistry of the molecule can be determined from the NOESY
spectrum. In particular, the H1–H5 correlation in the NOESY spectrum indicates that both H1 and H5 are on the same side of the molecule.
17. Also from the NOESY spectrum, the H1–H8a and H5–H4a correlations indicate that the H8a and H4a protons are also on the same side of the molecule as H1 and H5.
1H–1H NOESY spectrum of oxabicyclo[3.3.0]oct-6-en-3-one (DMSO-d6, 400 MHz)
348

Instructor’s Guide and Solutions Manual
Problem 64
Question:
Identify the following compound.
Molecular Formula: C13H16N2O2
IR: 3305, 1629, 1620, 1566 cm−1
Solution:
Melatonin
1. The molecular formula is C13H16N2O2. Calculate the degree of unsaturation from the molecular formula: ignore the O atoms, ignore the N atoms and remove one H atom for each N to give an effective molecular formula of C13H14 (CnHm) which gives the degree of unsaturation as (n – m/2 + 1) = 13 – 7 + 1 = 7. The compound contains a combined total of seven rings and/or π bonds.
2. From the 1H NMR spectrum, there are two exchangeable protons of integration one – one which readily exchanges, and another which requires more forcing conditions. The latter is likely due to a secondary amide group, while the former could be either a secondary amine or an alcohol group.
3. There are four protons in the aromatic region of the 1H NMR spectrum, but the coupling pattern does not match that of a disubstituted aromatic ring. This suggests that there may be one aromatic ring which is trisubstituted, and a second unsaturated system somewhere in the molecule which pushes the chemical shift of the proton into the aromatic region.
4. There is a singlet of integration three at 3.78 ppm in the 1H NMR spectrum. This chemical shift and integration is consistent with the presence of a methoxy (–OCH3) group.
5. With the presence of an amide group and a methoxy group, we have now accounted for all the oxygen atoms in the molecular formula, so the remaining exchangeable proton must be due to a secondary amine group.
349

Organic Structures from 2D NMR Spectra 6. There are two multiplets of integration two at 3.32 and 2.79 ppm in the 1H NMR
spectrum. These are likely due to two methylene groups. The last remaining signal is a singlet of integration three at 1.82 ppm – this must be due to an isolated methyl group.
1H NMR spectrum of melatonin – expansion 1 (DMSO-d6, 500 MHz)
1H NMR spectrum of melatonin – expansion 2
350

Instructor’s Guide and Solutions Manual 7. From the 1H–1H COSY spectrum, we can see a correlation between the amide proton at
7.95 ppm and the methylene group at 3.32 ppm. This methylene group also correlates to the second methylene group at 2.79 ppm. So we can identify a –CH2CH2NHC(=O)– fragment.
1H–1H COSY spectrum of melatonin (DMSO-d6, 500 MHz)
8. There is also a correlation between the amine proton at 10.6 ppm and the “aromatic” signal at 7.11 ppm. We can therefore identify an –NHCH= fragment.
351
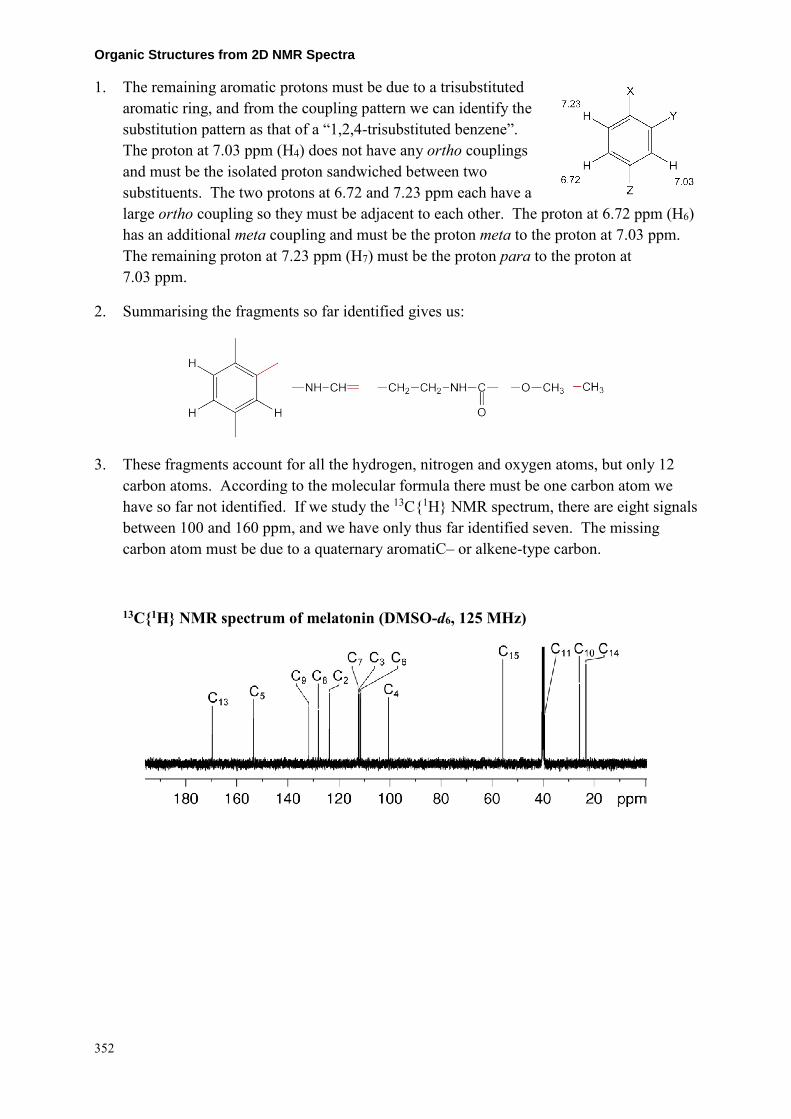
Organic Structures from 2D NMR Spectra 1. The remaining aromatic protons must be due to a trisubstituted
aromatic ring, and from the coupling pattern we can identify the substitution pattern as that of a “1,2,4-trisubstituted benzene”. The proton at 7.03 ppm (H4) does not have any ortho couplings and must be the isolated proton sandwiched between two substituents. The two protons at 6.72 and 7.23 ppm each have a large ortho coupling so they must be adjacent to each other. The proton at 6.72 ppm (H6) has an additional meta coupling and must be the proton meta to the proton at 7.03 ppm. The remaining proton at 7.23 ppm (H7) must be the proton para to the proton at 7.03 ppm.
2. Summarising the fragments so far identified gives us:
3. These fragments account for all the hydrogen, nitrogen and oxygen atoms, but only 12 carbon atoms. According to the molecular formula there must be one carbon atom we have so far not identified. If we study the 13C{1H} NMR spectrum, there are eight signals between 100 and 160 ppm, and we have only thus far identified seven. The missing carbon atom must be due to a quaternary aromatiC– or alkene-type carbon.
13C{1H} NMR spectrum of melatonin (DMSO-d6, 125 MHz)
352

Instructor’s Guide and Solutions Manual 4. The 1H–13C me-HSQC spectrum identifies each protonated
carbon atom: the isolated methyl group at 23.1 ppm, the two methylene groups at 27.7 and 39.9 ppm (the second signal is hidden in the DMSO-d6 solvent signal), and the methoxy group at 55.8 ppm. In the aromatic region, the protonated carbons for the trisubstituted ring occur at 100.6, 111.5 and 112.4. The protonated carbon for the amine-bound carbon atom resonates at 123.7 ppm.
1H–13C me-HSQC spectrum of melatonin (DMSO-d6, 500 MHz)
353

Organic Structures from 2D NMR Spectra 5. The 1H–15N HSQC spectrum shows one-bond correlations between proton and nitrogen
nuclei. The 1H–15N HSQC spectrum identifies the chemical shifts of the two nitrogen nuclei – the amine nitrogen at 128.9 ppm and the amide nitrogen at 120.0 ppm.
1H–15N HSQC spectrum of melatonin (DMSO-d6, 500 MHz)
354

Instructor’s Guide and Solutions Manual 6. The 1H–15N HMBC spectrum identifies protons that are two or three bonds removed from
the nitrogen nucleus. The amide nitrogen correlates to one methylene group, and also to the isolated methyl group, so we can combine these two fragments to give a substituted acetamide: –CH2CH2NHC(=O)CH3.
1H–15N HMBC spectrum of melatonin (DMSO-d6, 500 MHz)
7. The amine nitrogen correlates to the previously identified neighbouring proton at 7.11 ppm (H2), but it also correlates to the aromatic ring signal at 7.23 ppm (H7), meaning the nitrogen must be directly bound to the aromatic ring adjacent to the aromatic proton at 7.23 ppm. Redrawing the known fragments gives:
355

Organic Structures from 2D NMR Spectra 8. The two alkene carbons must be bound, giving:
9. The alkene must be bound to the aromatic ring to give a fused heterocycle (binding the methoxy group and the amide group to the alkene carbon leaves two unsubstituted aromatic positions that cannot be filled). There are therefore two possible compounds that fit the spectra considered so far:
10. It is possible to differentiate these using either the NOESY spectrum, or the 1H–13C HMBC spectrum.
356

Instructor’s Guide and Solutions Manual 11. In the NOESY spectrum (expansion C), there are correlations between the methoxy group
(H15) and aromatic protons H4 and H6, which places the methoxy group between these two protons on the six-membered aromatic ring, rather than on the five-membered heterocyclic ring. Isomer A (melatonin) is therefore the correct structure.
1H–1H NOESY spectrum of melatonin – expansion C (DMSO-d6, 500 MHz)
357

Organic Structures from 2D NMR Spectra
1H–1H NOESY spectrum of melatonin – expansion D
358

Instructor’s Guide and Solutions Manual 12. In the 1H–13C HMBC spectrum (expansion J), there is a correlation between the methoxy
group and the quaternary aromatic carbon (at 153.4 ppm). The three protons of the six-membered aromatic ring also correlate to this signal (expansion I), again placing the methoxy group on the six-membered ring, rather than the five-membered heterocycle. Once again, Isomer A (melatonin) is identified as the correct structure.
1H–13C HMBC spectrum of melatonin – expansion F (DMSO-d6, 500 MHz)
359

Organic Structures from 2D NMR Spectra
1H–13C HMBC spectrum of melatonin – expansion G
1H–13C HMBC spectrum of melatonin – expansion H
360

Instructor’s Guide and Solutions Manual
1H–13C HMBC spectrum of melatonin - expansion I
1H–13C HMBC spectrum of melatonin - expansion J
361

Organic Structures from 2D NMR Spectra
Problem 65
Question:
Identify the following compound.
Molecular Formula: C10H14O
IR: 1675 (s), 898 (s) cm−1
Solution:
Carvone
1. The molecular formula is C10H14O. Calculate the degree of unsaturation from the molecular formula: ignore the O atom to give an effective molecular formula of C10H14 (CnHm) which gives the degree of unsaturation as (n – m/2 + 1) = 10 – 7 + 1 = 4. The compound contains a combined total of four rings and/or π bonds.
2. IR and 13C{1H} spectra establish the presence of a ketone (13C resonance at 197.7 ppm). The ketone group accounts for the single O atom in the molecular formula as well as one degree of unsaturation.
3. In the 1H NMR spectrum, there are signals for three alkene protons at 6.09, 4.66 and 4.57 ppm (H3, H8b and H8a, respectively).
1H NMR spectrum of carvone (C6D6, 500 MHz)
362

Instructor’s Guide and Solutions Manual
13C{1H} NMR spectrum of carvone (C6D6, 125 MHz)
4. In the me-HSQC spectrum, the signals for H8a and H8b correlate to a single carbon signal at 110.4 ppm (C8) indicating they are both bound to the same carbon atom. H3 correlates to the carbon signal at 143.2 ppm (C3).
1H–13C me-HSQC spectrum of carvone (C6D6, 500 MHz)
363

Organic Structures from 2D NMR Spectra 5. In the me-HSQC spectrum (expansion B), there are also signals for two CH2 groups with
diastereotopic protons at 1H 2.46, 2.04 ppm / 13C 43.3 ppm (H6a,H6b/C6) and 1H 1.85, 1.73 ppm / 13C 31.2 ppm (H4a,H4b/C4), one CH group at 1H 2.26 ppm / 13C 42.6 ppm (H5/C5) and two methyl groups at 1H 1.78 ppm / 13C 16.0 ppm (H10/C10) and 1H 1.42 ppm / 13C 20.3 ppm (H9/C9).
1H–13C me-HSQC spectrum of carvone – expansion B
6. In the COSY spectrum, the H3–H4a/H4b, H4a/H4b–H5 and H5–H6a/H6b correlations afford the =CH–CH2–CH–CH2 fragment.
364
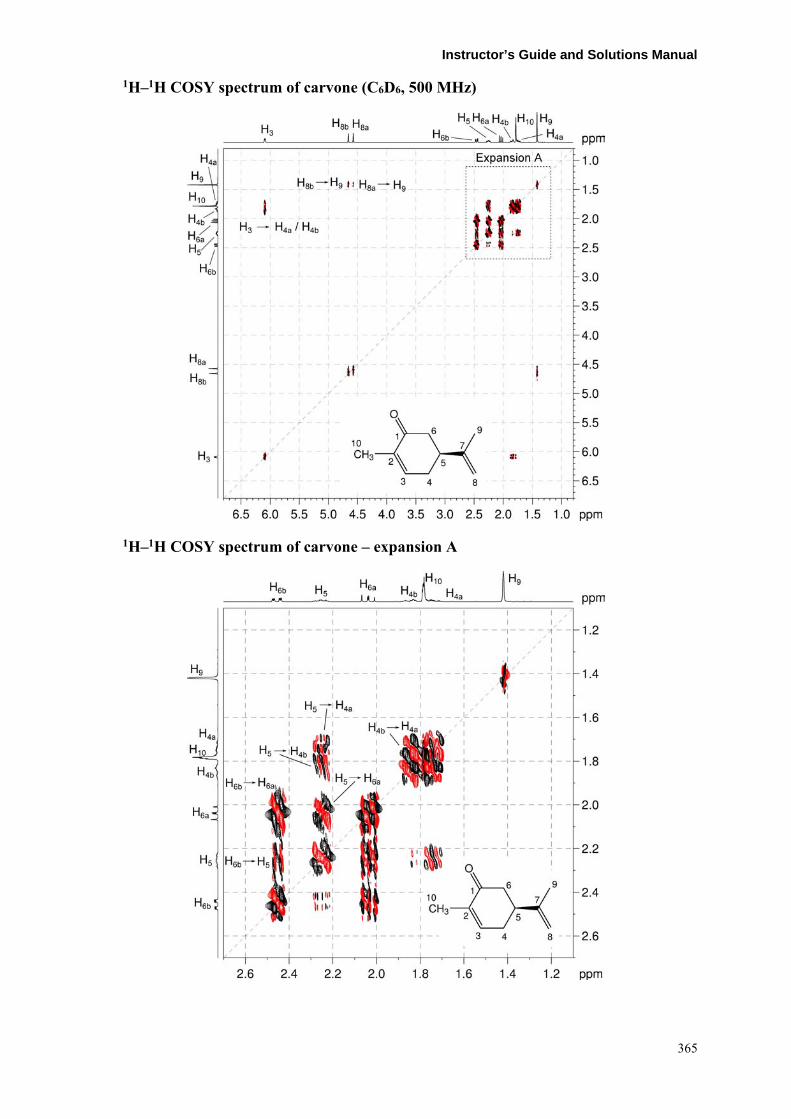
Instructor’s Guide and Solutions Manual
1H–1H COSY spectrum of carvone (C6D6, 500 MHz)
1H–1H COSY spectrum of carvone – expansion A
365

Organic Structures from 2D NMR Spectra 7. In the HMBC spectrum, there are correlations from alkene proton H3, methylene protons
H6a/H6b, methine proton H5 and methyl protons H10 to the ketone carbon at 197.7 ppm (C1). There are no correlations from methylene protons H4a/H4b to the ketone group. There must be a ring which contains the ketone group to account for these correlations.
1H–13C HMBC spectrum of carvone (C6D6, 500 MHz)
366

Instructor’s Guide and Solutions Manual 8. In the HMBC spectrum (expansion D), the correlations from H6b, H4b, H10 and H4a to the
quaternary carbon signal at 135.5 ppm identifies the carbon atom completing the ring (C2). The correlation from methyl protons H10 to alkene carbon C3 and the reciprocal correlation from H3 to C10 indicates the methyl group is part of the ring.
9. There are two possible ways of assembling the ring structure – one to form a five-membered ring and the other to form a six-membered ring.
1H–13C HMBC spectrum of carvone – expansion D
367

Organic Structures from 2D NMR Spectra 10. In expansions C and D of the HMBC spectrum, the alkene proton signals at 4.66 and
4.57 ppm (H8a and H8b) correlate to the methyl carbon signal at 20.3 ppm (C9) and quaternary carbon signal at 147.1 ppm (C7) to afford the CH3–C=CH2 fragment.
1H–13C HMBC spectrum of carvone – expansion C
11. The CH3–C=CH2 fragment can be attached to either of the two possible rings to give two possible structures:
368
Instructor’s Guide and Solutions Manual 12. The H8a–C5, H8b–C5, H5–C9 and H9–C5 correlations would be four-bond correlations in
the structure with the five-membered ring and quite unlikely. These correlations would be three-bond correlations in the structure with the six-membered ring. Thus the correct structure for the molecule is the one with the six-membered ring.
13. While the compound does contain a chiral centre, NMR cannot establish the absolute stereochemistry of the chiral centre.
369

Organic Structures from 2D NMR Spectra
Problem 66
Question:
The 1H and 13C{1H} NMR spectra of haloperidol (C21H23ClFNO2) recorded in Acetone-d6 solution at 298 K and 500 MHz are given below.
The 1H NMR spectrum has signals at δ 1.57, 1.81, 1.95, 2.43, 2.44, 2.67, 3.03, 3.86, 7.29, 7.31, 7.43 and 8.14 ppm.
The 13C{1H} NMR spectrum has signals at δ 22.3, 35.6, 38.4, 49.2, 57.6, 70.2, 115.3, 126.6, 127.8, 130.8, 131.4, 134.5, 149.1, 165.4 and 197.8 ppm.
Use the spectra below to assign each proton and carbon resonance.
Solution:
Haloperidol
Proton Chemical Shift (ppm) Carbon Chemical Shift (ppm)
C1 165.4
H2 7.29 C2 115.3
H3 8.14 C3 130.8
C4 134.5
C5 197.8
H6 3.03 C6 35.6
H7 1.95 C7 22.3
H8 2.44 C8 57.6
H9 2.43/2.67 C9 49.2
H10 1.57/1.81 C10 38.4
C11 70.2
C12 149.1
H13 7.43 C13 126.6
H14 7.31 C14 127.8
C15 131.4
OH 3.86
370

Instructor’s Guide and Solutions Manual 1. The OH chemical shift can be easily be determined by the exchangeable resonance in the
1H NMR spectrum.
2. The chemical shift of the ketone carbon C5 can also be determined on the basis of chemical shift.
3. Close inspection of the 1H and 1H{19F} NMR spectra show that the aromatic proton signal at 8.14 ppm couples to fluorine and must be either H2 or H3. The signal at 7.43 ppm does not couple to fluorine and must be either H13 or H14.
4. The chemical shift for H7 can also be assigned to the signal at 1.95 ppm in the 1H NMR spectrum on the basis of coupling pattern (the signal is a quintet and must be coupled to four neighbouring protons).
1H NMR spectrum of haloperidol (acetone-d6, 500 MHz)
1H{19F} NMR spectrum of haloperidol – expansion (Acetone-d6, 300 MHz)
371
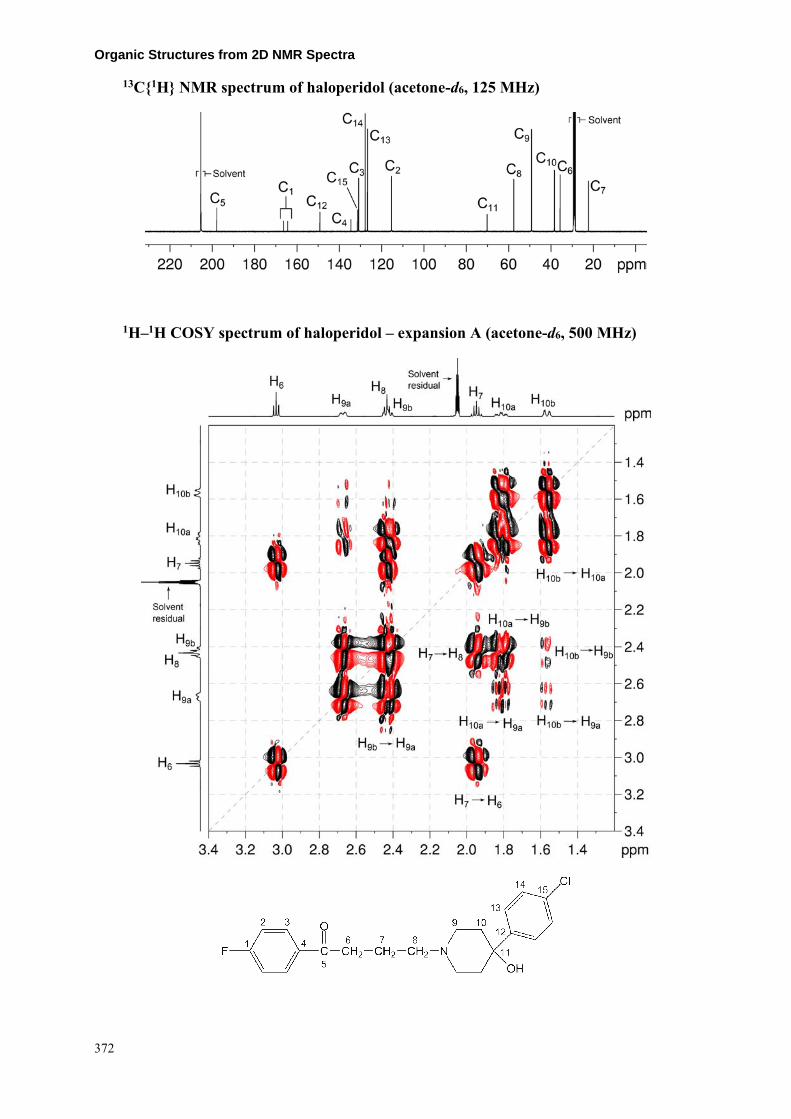
Organic Structures from 2D NMR Spectra
13C{1H} NMR spectrum of haloperidol (acetone-d6, 125 MHz)
1H–1H COSY spectrum of haloperidol – expansion A (acetone-d6, 500 MHz)
372

Instructor’s Guide and Solutions Manual 5. In expansion B of the COSY spectrum, the signal at 8.14 ppm couples to the signal at
7.29 ppm (H2 or H3) whilst the signal at 7.43 ppm couples to the signal at 7.31 ppm (H13 or H14).
1H–1H COSY spectrum of haloperidol – expansion B
373

Organic Structures from 2D NMR Spectra 6. The chemical shift for C7 can be assigned to the signal at 22.3 ppm based on the H7–C7
correlation in the me-HSQC spectrum.
7. In expansion C of the me-HSQC spectrum, the diastereotopic CH2 protons H9a/H9b and H10a/H10b are identified as belonging to the piperidinol ring.
1H–13C me-HSQC spectrum of haloperidol – expansion C (acetone-d6, 500 MHz)
374

Instructor’s Guide and Solutions Manual 8. In expansion D of the me-HSQC spectrum, the protonated carbons C2 and C3 can be
assigned to the signals at 115.3 and 130.8 ppm, respectively, as C2 has a larger coupling to fluorine (2JC–F = 22 Hz) than C3 (3JC–F = 9 Hz). Thus the proton signals at 7.29 and 8.14 ppm can be assigned to H2 and H3, respectively.
1H–13C me-HSQC spectrum of haloperidol – expansion D
9. C11 is the only aliphatic quaternary carbon and can be assigned to the signal at 70.2 ppm which does not have a correlation in the me-HSQC spectrum.
375

Organic Structures from 2D NMR Spectra 10. In the HMBC spectrum, the H13–C11 correlation identifies the proton signal at 7.43 ppm
as that belonging to H13. The signal at 126.6 ppm can now be identified as belonging to C13 from the me-HSQC spectrum.
11. The H3–C5 (ketone) correlation in the HMBC spectrum confirms the signal at 8.14 ppm belongs to H3.
12. The H6–C5 (ketone) correlation in the HMBC spectrum identifies the proton signal at 3.03 ppm as that belonging to H6. C6 can now be assigned to the signal at 35.6 ppm using the me-HSQC spectrum.
1H–13C HMBC spectrum of haloperidol (acetone-d6, 500 MHz)
376

Instructor’s Guide and Solutions Manual 13. The 1H signal at 2.44 ppm belongs to H8 from the H8–C7 and H8–C6 correlations in the
HMBC spectrum. C8 can now be assigned to the signal at 57.6 ppm from the me-HSQC spectrum. The H6–C8 and H7–C8 correlations in the HMBC spectrum confirm the assignment for C8.
14. The H8–C9 correlation in the HMBC spectrum identifies that the signal at 49.2 ppm belongs to C9. Thus H9 can be assigned to the signals at 2.43 and 2.67 ppm using the me-HSQC spectrum.
15. The remaining diastereotopic proton signals at 1.57 and 1.81 ppm must be due to H10. Thus the signal at 38.4 ppm is assigned to C10 using the me-HSQC spectrum. These assignments can be confirmed by the OH–C10 and H10a–C9 correlations in the HMBC spectrum.
1H–13C HMBC spectrum of haloperidol – expansion E
377

Organic Structures from 2D NMR Spectra 16. Aromatic quaternary carbon C1 can be assigned to the signal at 165.4 ppm based on the
H3–C1 and H2–C1 correlations in the HMBC spectrum. Note that the signal is a doublet with a large 1JC–F coupling of 251 Hz.
17. C4 can be assigned to the signal at 134.5 ppm based on the H2–C4 correlation in the HMBC spectrum. This signal has a small 4JC–F coupling of 3 Hz just visible in the expansion of the 13C{1H} spectrum.
18. C15 is assigned to the signal at 131.4 ppm based on the H13–C15 and H14–C15 correlations in the HMBC spectrum.
19. Finally, C12 is assigned to the signal at 149.1 ppm based on the H14–C12 correlation in the HMBC spectrum.
1H–13C HMBC spectrum of haloperidol – expansion F
378

Instructor’s Guide and Solutions Manual 20. Note that there are H2–C2', H3–C3', H13–C13' and H14–C14' correlations in the HMBC
spectrum which appear to be one-bond correlations but actually arise from the 3JC–H interaction of the proton with the carbon which is meta to it.
379


WILEY END USER LICENSE AGREEMENTGo to www.wiley.com/go/eula to access Wiley’s ebook EULA.