Embed Size (px)
Citation preview

National Leprosy Eradication Programme
NLEP ANNUAL REPORT
2016 - 2017
Central Leprosy Division Directorate General of Health Services Ministry of Health and Family Welfare
Government of India Nirman Bhawan, New Delhi – 110011.

NLEP – Annual Report for the year 2016-17
I. EPIDEMIOLOGICAL STATUS
Status in the Country
The year 2016-17 started with 0.86 lakh leprosy cases on record as on 1st
April 2016, with PR
0.66/10,000. Till then 34 States/ UTs had attained the level of leprosy elimination. 554 districts
(81.23%) out of total 682 districts also achieved elimination by March 2017.
Three pronged strategy was introduced in the program during 2016-17. The components of the strategy
are:
i. Leprosy Case Detection Campaign
ii. Focused Leprosy Campaign
iii. Special Plan for Hard to Reach Area
During 2016-17, LCDC was carried out in 163 districts of 20 states, wherein 34,672 cases were
detected and were put on treatment. The above activity aimed at early case detection and timely
treatment. The success of the Campaign can be estimated by the fact that a drastic decline in the trend
of the G2D cases was achieved. Moreover, prevention of deformity in new cases due to timely
detection and treatment could be made possible.
With a remarkable achievement, the Program Division took a decision to further continue and expand
the Campaign. Hence during 2017-18, a total of 305 districts in 23 states were identified for LCDC
phase I.
In the year 2016-17, Focused Leprosy Campaign was carried out by house to house survey in the
village/ urban area( covering 300 households) wherein even one case of Grade 2 disability due to
leprosy was detected. As per the reports received from 21 states, 1171 cases have been detected, so
far, indicating 0.74 per 10,000 population covered.
The purpose of the Special plan for hard to reach area is to find the cases in uncovered population like
difficult terrains, naxalite affected areas and other geographically difficult locations. The identification of
hard to reach areas is a continuous process and many areas in different States/UTs have been
identified and many more are being identified.
Another innovation introduced during the year was Sparsh Leposy Awareness Campaign
through Gram Sabhas, carried out with the help of Panchayat and Village Health and Sanitation
Community. The expected outcome of the above activity was to generate awareness, reduce stigma
and improve self-reporting by the cases. The activity was carried out in 60% of the total villages across
India.
Based on the reports received from all the States and UTs for the year 2016 -17(Annexure –I), current epidemiological situation under leprosy, in the country is as below:
1. A total of 1,35,485 new cases were detected during the year 2016-17, which gives Annual New
Case Detection Rate (ANCDR) of 10.17 per 100,000 population, as against 1,27,334 cases in
2015-16.
2. A total of 88166 leprosy cases are on record as on 1st April 2017, giving a Prevalence Rate (PR)
of 0.66 per 10,000 population, as against 86028 cases in 1st
April 2016.
3. Detailed information on new leprosy cases detected during 2016-17 indicates the proportion of
MB (49.57%), Female (39.17%), Child (8.7%), Grade II Deformity (3.87%), ST cases (18.80%)
and SC cases (18.78%).
4. A total of 5245 Gr. II disability detected amongst the New Leprosy Cases during 2016-17,
indicating the Gr. II Disability Rate of 3.94 / million population (Annexure-II).
5. A total of 11792 child cases were recorded, indicating the Child Case rate of 8.7% (Annexure-
III).
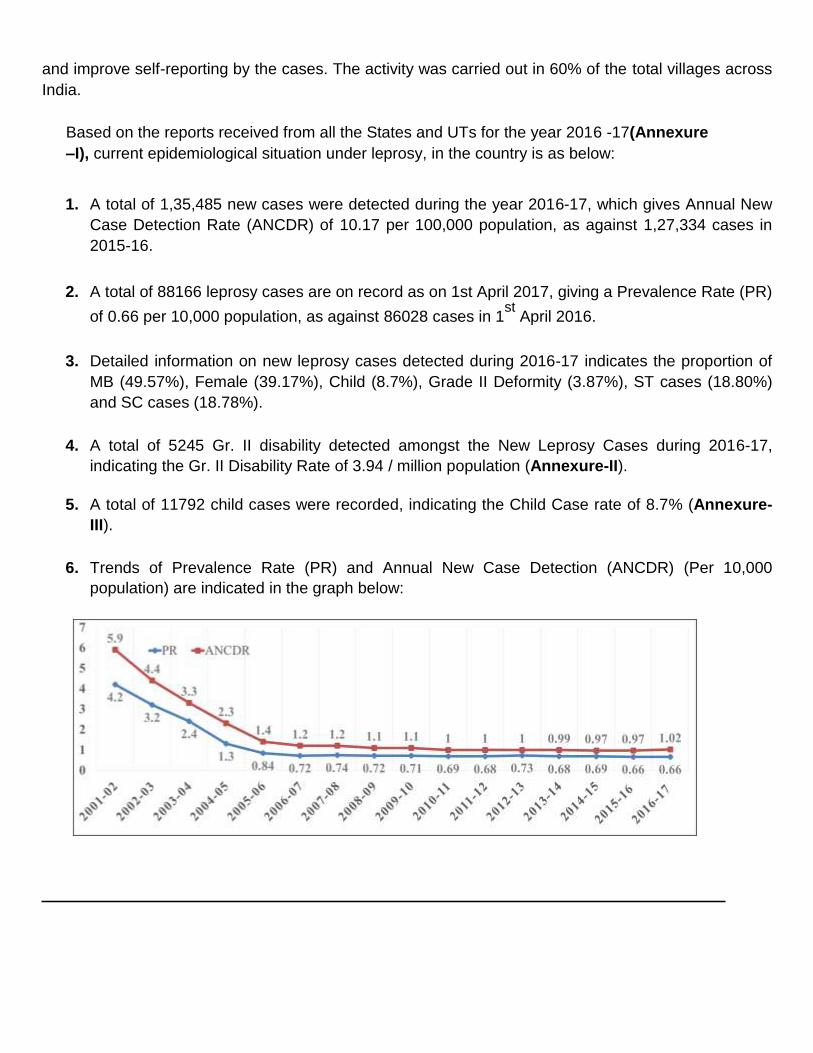
6. Trends of Prevalence Rate (PR) and Annual New Case Detection (ANCDR) (Per 10,000
population) are indicated in the graph below:
Note: The increase in new cases and prevalence during 2012-13 was attributable to the NLEP
strategy to carry out extensive house to house survey for new case detection. Further increase
in ANCDR during 2016-17 is attributable to Leprosy case detection campaign.
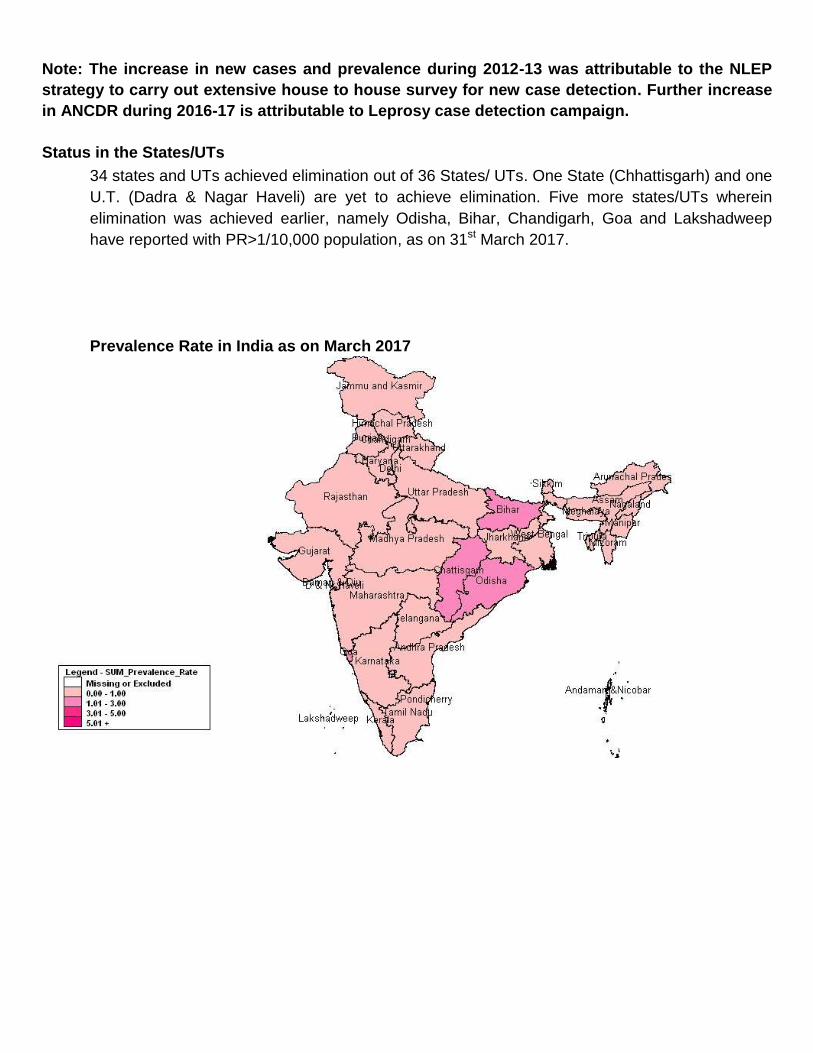
Status in the States/UTs
34 states and UTs achieved elimination out of 36 States/ UTs. One State (Chhattisgarh) and one
U.T. (Dadra & Nagar Haveli) are yet to achieve elimination. Five more states/UTs wherein
elimination was achieved earlier, namely Odisha, Bihar, Chandigarh, Goa and Lakshadweep
have reported with PR>1/10,000 population, as on 31st March 2017.
Prevalence Rate in India as on March 2017

Grade-II Disability Rate (out of new cases detected) (%) in India for 2016- 17
Proportion of Child cases was more than 10% of new case detected in 10 States/UTs namely (i) Arunachal Pradesh 10.71% , (ii) Bihar 13.70%, (iii) Jharkhand 10.59% , (iv) Maharashtra
10.18 %, (v) Nagaland 11.76% , (vi) Punjab 17.25%, (vii) Tamil Nadu 17.64%, (viii) D&N Haveli
19.79% , (ix) Daman & Diu 14.29% ,and (x) Lakshadweep11.11%
Status in the Districts
1. District wise situation on the basis of ANCDR for the year 2016- 17 is given as below: 495 (72.58%) districts out of total 682, have ANCDR < 10 per 100,000 population and 101 districts
had ANCDR > 20/100,000. 23 districts with ANCDR> 50/100,000 population were reported from
Bihar (1), Chhattisgarh (7), Gujarat (3), Jharkhand (1), Madhya Pradesh (2), Maharashtra (1),
Odisha (5), West Bengal (1), Lakshadweep (1) and Dadra & Nagar Haveli (1). Three districts
reported with ANCDR greater than 90/100,000 population, i.e, Raigarh (108.15) & Mahasumund
(91.83) in Chhattisgarh and Dangs (91.69) in Gujarat.
18 Districts from 6 states namely, Bihar(4), Chhattisgarh(3), Gujarat(1), Maharashtra(3), UP(2) and
West Bengal(5) reported with more than 1000 new cases during the year 2016-17.
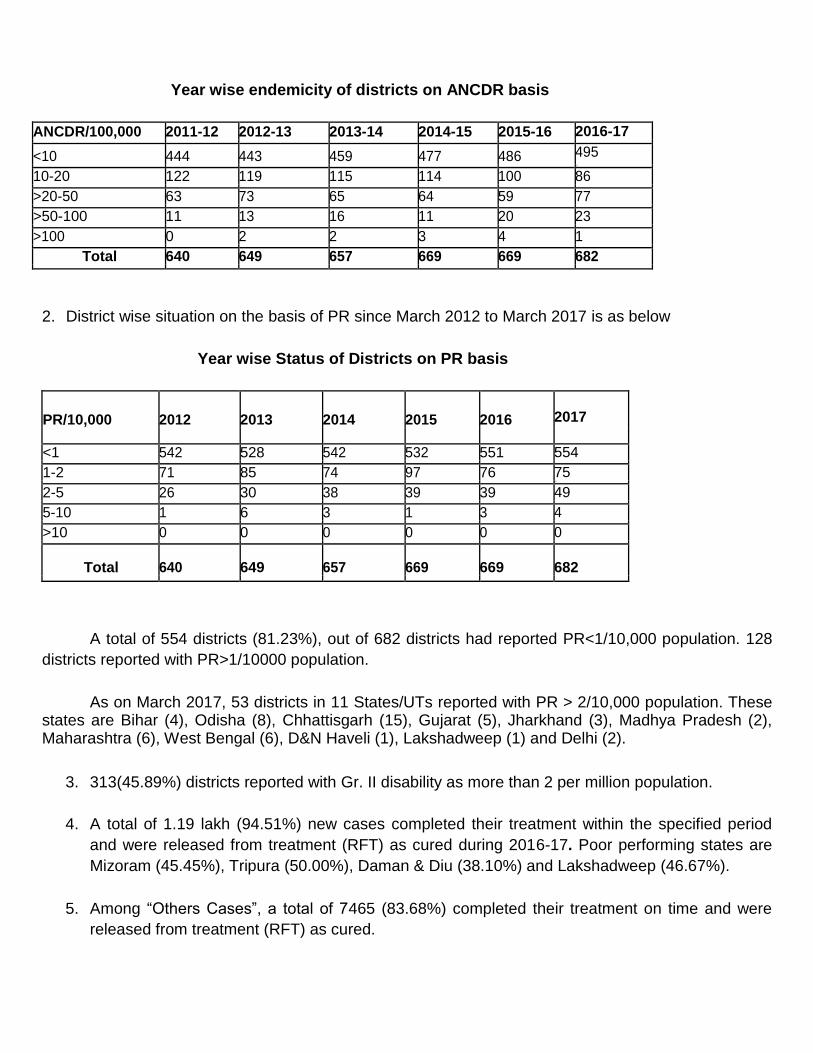
Year wise endemicity of districts on ANCDR basis
ANCDR/100,000 2011-12 2012-13 2013-14 2014-15 2015-16 2016-17
<10 444 443 459 477 486 495 10
10-20 122 119 115 114 100 86
>20-50 63 73 65 64 59 77
>50-100 11 13 16 11 20 23
>100 0 2 2 3 4 1
Total 640 649 657 669 669 682
2. District wise situation on the basis of PR since March 2012 to March 2017 is as below
Year wise Status of Districts on PR basis
PR/10,000 2012 2013 2014 2015 2016
2017
<1 542 528 542 532 551 554
1-2 71 85 74 97 76 75 33
2-5 26 30 38 39 39 49
5-10 1 6 3 1 3 4
>10 0 0 0 0 0 0
Total 640 649 657 669 669 682
A total of 554 districts (81.23%), out of 682 districts had reported PR<1/10,000 population. 128
districts reported with PR>1/10000 population.
As on March 2017, 53 districts in 11 States/UTs reported with PR > 2/10,000 population. These states are Bihar (4), Odisha (8), Chhattisgarh (15), Gujarat (5), Jharkhand (3), Madhya Pradesh (2), Maharashtra (6), West Bengal (6), D&N Haveli (1), Lakshadweep (1) and Delhi (2).
3. 313(45.89%) districts reported with Gr. II disability as more than 2 per million population.
4. A total of 1.19 lakh (94.51%) new cases completed their treatment within the specified period
and were released from treatment (RFT) as cured during 2016-17. Poor performing states are
Mizoram (45.45%), Tripura (50.00%), Daman & Diu (38.10%) and Lakshadweep (46.67%).
5. Among “Others Cases”, a total of 7465 (83.68%) completed their treatment on time and were
released from treatment (RFT) as cured.

6. Total number of cases released as cured during 2015-16, comes to 1,25,302 (94.33%). This
brings the total number of persons affected by Leprosy, cured of the disease, with MDT in the
country, from the beginning till date to 130.59 lakh (13.05 million).
Other Programme aspects
A. DPMR Services
Information pertaining to the Disability Prevention and Medical Rehabilitation (DPMR) as
received from the States/UTs is given as below:
1. Total 115 (Govt.- 61 and NGO- 54) Institutions have been recognized for conducting Reconstructive Surgery to correct the disability in Leprosy Affected Persons.
2. During the year 2016-17 a total of 2591 RCS (Govt. – 736 and NGO – 1855) were conducted.
3. A total of 536 Relapse cases were confirmed and treated at District Hospitals.
4. MCR foot-wears were provided to 75739 Leprosy Affected Persons in the year 2016-17.
B. ASHA Involvement
ASHAs under the NRHM were involved in Leprosy programme for last 8 years. However
during 2016-17, their participation has substantially improved. Out of the total 135485 new cases
detected, cases brought by ASHA were 48186 (35.57%). ASHAs also helped in completion of
treatment in 32490 cases. Incentives were paid during the year to 20095 ASHAs.
C. Child cases with Grade II disability
To give focus on the policy of No. child cases with disability, information on the cases of Gr. II
disability in children was collected and compiled at the central level. Out of the total 11792
new child cases detected during 2016-17, the number of child cases with Gr. II disability was 156.
D. Training
(i) There are number of trainings on Leprosy held across India for enhancing efficiency of
manpower. Manpower trained during 2016-17 includes Medical officer- 10476, Health
supervisor- 14102, Staff Nurses-3557, Pharmacists- 763 and ASHA-133695.
(ii) Training was also conducted by the Central Govt. Leprosy institutes in the year 2016-17.
Central Leprosy Training & Research Institute, Chengalpattu, Tamilnadu conducted 07

courses for 278 participants and one day orientation programme for 227 participants.
Regional Leprosy Training & Research Institute, Gouripur, West Bengal has conducted 1
course for 28 participants and one day orientation programme for 196 participants, Regional
Leprosy Training & Research institute, Raipur, Chhattisgarh has conducted 07 courses for 37
participants and one day orientation programme for 338 participants.
E. IEC /BCC
The various mode of communication for conducting IEC activities to spread awareness about
leprosy at mass level has been undertaken at center & state level in the year 2016-17.
(i) State level
As per the reports submitted by the states on IEC activities undertaken in the year 2016-17,
Newspapers advertisement, posters, Handbills, stickers, Pamphlets, leaflets, press conference/
Briefing/ Press Release, TV spots, Radio jingles, cinema slides , Talk on TV/Radio , Rath,
Rallies Mela, Haat, Nukkad Natak/ Road show, Magic show, puppet show , folk dance/songs,
Banners/Hoardings, Wall Painting, Exhibition’s , and inter personal communication (Meeting,
conferences, talks, door to door survey , quiz) have been actively undertaken.
Sparsh Leprosy Awareness Campaign was carried out through Gram Sabhas, by taking an oath
for not to discriminate with the person effected by Leprosy on 30th January 2017. In continuation
to this, Anti Leprosy Fortnight was also carried out throughout the country from 30th
January
2017 to 13th
February 2017.
(ii) Central level
The IEC activities undertaken in the 2016-17 at central level were printing of Half page Advertisement in newspapers in Hindi, English and Regional languages which were
released through DAVP on 30th
January 2017. Broadcast of Radio Spots through All India
Radio, Telecast of Video Spots & Documentary through Doordarshn & Lok Sabha TV was also
done.
National Leprosy Programme participated in India International Tread fare from 14th to 27th
November 2016. An exhibition was setup for the advocacy of the programme.
Central Leprosy Division is publishing E-Newsletter as a platform to share guidelines,
feedback/best practices, experiences and activities undertaken in the programme in coordination
with partner/ States/NGOs/Institutes/Medical Colleges & Associations etc. It is a quarterly
publication from the house of CLD. It is serving as one of the important tools for communication
and sharing of information, update the knowledge and educate our stakeholders as well as
target groups. --x—

Annexure–I
NATIONAL LEPROSY ERADICATION PROGRAMME
REPORT FOR THE YEAR 2016-17 [Page-I]
S. No.
State/UT
Census Population
as on 03/17
Cases on record as
on March 2016
Cases on record as on March
2017
Prevalence Rate per
10000 ppln. as on
March 2017
No. of new cases detected during the year 2016-17
ANCDR per 100,000 ppln. for the year 2016-17 PB MB Total
1 Andhra Pradesh 52603677 2777 2705 0.51 2236 1992 4228 8.04
2 Arunachal Pradesh 1587515 26 25 0.16 3 25 28 1.76
3 Assam 34243323 791 977 0.29 259 760 1019 2.98
4 Bihar 118700209 9142 13031 1.10 13450 8368 21818 18.38
5 Chhattisgarh 28858758 6738 7266 2.52 6498 6111 12609 43.69
6 Goa 1528198 136 157 1.03 16 114 130 8.51
7 Gujarat 67086919 6447 3844 0.57 4013 3253 7266 10.83
8 Haryana 28267357 565 459 0.16 84 407 491 1.74
9 Himachal Pradesh 7369594 148 138 0.19 16 130 146 1.98
10 Jharkhand 37212778 2533 3414 0.92 3434 2819 6253 16.80
11 Jammu & Kashmir 14321661 232 186 0.13 24 119 143 1.00
12 Karnataka 66724504 2649 2500 0.37 810 2087 2897 4.34
13 Kerala 34360855 637 584 0.17 139 357 496 1.44
14 Madhya Pradesh 79644092 5602 6067 0.76 2728 4424 7152 8.98
15 Maharashtra 122800852 10103 9887 0.81 6847 8165 15012 12.22
16 Manipur 3015000 16 18 0.06 1 19 20 0.66
17 Meghalaya 3435328 19 24 0.07 7 26 33 0.96
18 Mizoram 1233726 21 23 0.19 2 4 6 0.49
19 Nagaland 1978621 77 45 0.23 8 26 34 1.72
20 Odisha 45381171 6044 5383 1.19 5203 4842 10045 22.13
21 Punjab 29936626 509 570 0.19 128 498 626 2.09
22 Rajasthan 76437571 1196 1114 0.15 69 973 1042 1.36
23 Sikkim 651615 14 17 0.26 4 19 23 3.53
24 Tamil Nadu 78693528 3144 3207 0.41 2974 1963 4937 6.27
25 Telangana 37591317 2025 1883 0.50 862 1796 2658 7.07
26 Tripura 3988035 77 57 0.14 12 22 34 0.85
27 Uttar Pradesh 222785249 14282 13456 0.60 13044 9257 22301 10.01
28 Uttarakhand 11239830 260 282 0.25 136 239 375 3.34
29 West Bengal 98766959 7211 8578 0.87 4565 6671 11236 11.38
30 A & N Islands 395004 26 18 0.46 4 14 18 4.56
31 Chandigarh 1159392 126 126 1.09 41 87 128 11.04
32 D & N Haveli 398660 263 267 6.70 283 101 384 96.32
33 Daman & Diu 300977 12 11 0.37 3 4 7 2.33
34 Delhi 18424503 2149 1780 0.97 370 1442 1812 9.83
35 Lakshadweep 66823 7 45 6.73 34 11 45 67.34
36 Puducherry 1441508 24 22 0.15 18 15 33 2.29
Total 1332631737 86028 88166 0.66 68325 67160 135485 10.17

[Page-II]
S. No.
State/UT Number & Percentage of New Cases Detected during the year 2016-17
MB Female Child Schedule Tribe
Schedule Caste
MB PB Total
No. % No. % No % No % Total % No. % No. %
1 Andhra Pradesh 1992 47.11 1787 42.27 83 1.96 338 7.99 421 9.96 384 9.08 1008 23.84
2 Arunachal Pradesh 25 89.29 5 17.86 2 7.14 1 3.57 3 10.71 17 60.71 1 3.57
3 Assam 760 74.58 297 29.15 42 4.12 23 2.26 65 6.38 31 3.04 12 1.18
4 Bihar 8368 38.35 9071 41.58 766 3.51 2223 10.19 2989 13.70 377 1.73 5447 24.97
5 Chhattisgarh 6111 48.47 5281 41.88 180 1.43 613 4.86 793 6.29 3174 25.17 2016 15.99
6 Goa 114 87.69 23 17.69 3 2.31 1 0.77 4 3.08 0 0.00 0 0.00
7 Gujarat 3253 44.77 3261 44.88 110 1.51 388 5.34 498 6.85 4713 64.86 170 2.34
8 Haryana 407 82.89 128 26.07 9 1.83 7 1.43 16 3.26 2 0.41 87 17.72
9 Himachal Pradesh 130 89.04 36 24.66 1 0.68 0 0.00 1 0.68 3 2.05 24 16.44
10 Jharkhand 2819 45.08 2545 40.70 222 3.55 440 7.04 662 10.59 2245 35.90 837 13.39
11 Jammu & Kashmir 119 83.22 21 14.69 2 1.40 0 0.00 2 1.40 7 4.90 5 3.50
12 Karnataka 2087 72.04 1006 34.73 60 2.07 106 3.66 166 5.73 278 9.60 671 23.16
13 Kerala 357 71.98 147 29.64 6 1.21 30 6.05 36 7.26 32 6.45 28 5.65
14 Madhya Pradesh 4424 61.86 2618 36.61 194 2.71 177 2.47 371 5.19 2817 39.39 990 13.84
15 Maharashtra 8165 54.39 6772 45.11 408 2.72 1120 7.46 1528 10.18 5056 33.68 2030 13.52
16 Manipur 19 95.00 1 5.00 0 0.00 0 0.00 0 0.00 7 35.00 0 0.00
17 Meghalaya 26 78.79 8 24.24 0 0.00 1 3.03 1 3.03 11 33.33 1 3.03
18 Mizoram 4 66.67 0 0.00 0 0.00 0 0.00 0 0.00 0 0.00 0 0.00
19 Nagaland 26 76.47 7 20.59 4 11.76 0 0.00 4 11.76 6 17.65 34 100.00
20 Odisha 4842 48.20 3981 39.63 234 2.33 557 5.55 791 7.87 2879 28.66 1826 18.18
21 Punjab 498 79.55 161 25.72 90 14.38 18 2.88 108 17.25 0 0.00 0 0.00
22 Rajasthan 973 93.38 297 28.50 13 1.25 5 0.48 18 1.73 127 12.19 169 16.22
23 Sikkim 19 82.61 5 21.74 1 4.35 0 0.00 0 0.00 4 17.39 3 13.04
24 Tamil Nadu 1963 39.76 2113 42.80 70 1.42 801 16.22 871 17.64 128 2.59 1135 22.99
25 Telangana 1796 67.57 964 36.27 68 2.56 116 4.36 184 6.92 382 14.37 644 24.23
26 Tripura 22 64.71 11 32.35 0 0.00 0 0.00 0 0.00 22 64.71 3 8.82
27 Uttar Pradesh 9257 41.51 7505 33.65 402 1.80 832 3.73 1234 5.53 106 0.48 5464 24.50
28 Uttrakhand 239 63.73 124 33.07 13 3.47 9 2.40 22 5.87 7 1.87 79 21.07
29 West Bengal 6671 59.37 4157 37.00 288 2.56 552 4.91 840 7.48 2279 20.28 2764 24.60
30 A & N Islands 14 77.78 3 16.67 1 5.56 0 0.00 1 5.56 2 11.11 0 0.00
31 Chandigarh 87 67.97 39 30.47 7 5.47 1 0.78 8 6.25 0 0.00 0 0.00
32 D & N Haveli 101 26.30 198 51.56 7 1.82 69 17.97 76 19.79 377 98.18 0 0.00
33 Daman & Diu 4 57.14 2 28.57 0 0.00 1 14.29 1 14.29 1 14.29 0 0.00
34 Delhi 1442 79.58 478 26.38 41 2.26 31 1.71 72 3.97 0 0.00 0 0.00
35 Lakshadweep 11 24.44 0 0.00 0 0.00 5 11.11 5 11.11 0 0.00 0 0.00
36 Puducherry 15 45.45 20 60.61 0 0.00 0 0.00 0 0.00 0 0.00 1 3.03
Total 67160 49.57 53072 39.17 3327 2.46 8465 6.25 11792 8.70 25474 18.80 25449 18.78

[Page-III]
S. No.
State/UT
Deformity among new cases during the year 2016-17
Reconstructive Surgery during the year 2016-17
Cases deleted during the year 2016-17
Recognised RCS Instt. RCS performed
RFT
Other-wise deleti
on Total
Grade - I Grade-II
Govt NGO Govt NGO Total No. % No. %
1 Andhra Pradesh 126 2.98 226 5.35 2 6 11 271 282 4209 94 4303
2 Arunachal Pradesh 4 14.29 6 21.43 0 0 0 0 0 27 3 30
3 Assam 54 5.30 94 9.22 0 0 1 24 25 756 77 833
4 Bihar 296 1.36 639 2.93 2 2 11 111 122 16791 1138 17929
5 Chhattisgarh 518 4.11 727 5.77 0 0 94 23 117 11618 463 12081
6 Goa 1 0.77 0 0.00 0 0 1 0 1 87 0 87
7 Gujarat 267 3.67 154 2.12 3 0 115 0 115 9760 109 9869
8 Haryana 61 12.42 26 5.30 0 0 0 7 7 554 43 597
9 Himachal Pradesh 51 34.93 23 15.75 0 0
0 119 32 151
10 Jharkhand 122 1.95 139 2.22 2 4 0 104 104 5124 248 5372
11 Jammu & Kashmir 2 1.40 16 11.19 4 0 0 0 0 153 0 153
12 Karnataka 195 6.73 168 5.80 4 7 8 67 75 2712 124 2836
13 Kerala 55 11.09 65 13.10 0 1 0 23 23 445 103 548
14 Madhya Pradesh 793 11.09 319 4.46 0 0 48 0 48 6246 375 6621
15 Maharashtra 746 4.97 452 3.01 9 8 18 240 258 14654 453 15107
16 Manipur 2 10.00 2 10.00 1 0 0 0 0 12 2 14
17 Meghalaya 5 15.15 10 30.30 0 0 0 0 0 20 8 28
18 Mizoram 0 0.00 0 0.00 0 0 0 0 0 0 0 0
19 Nagaland 4 11.76 9 26.47 0 0 0 0 0 63 9 72
20 Odisha 509 5.07 527 5.25 12 1 276 29 305 10425 281 10706
21 Punjab 0 0.00 0 0.00 0 0 0 0 0 552 75 627
22 Rajasthan 78 7.49 54 5.18 1 0 1 0 1 794 330 1124
23 Sikkim 0 0.00 0 0.00 1 0 0 0 0 20 1 21
24 Tamil Nadu 283 5.73 199 4.03 2 8 9 102 111 4559 321 4880
25 Telangana 98 3.69 191 7.19 1 1 0 51 51 2779 21 2800
26 Tripura 3 8.82 5 14.71 0 0 0 0 0 47 3 50
27 Uttar Pradesh 592 2.65 615 2.76 3 3 31 575 606 21359 1657 23016
28 Uttrakhand 6 1.60 3 0.80 1 0 10 0 10 321 32 353
29 West Bengal 490 4.36 302 2.69 9 2 100 117 217 8723 1128 9851
30 A & N Islands 0 0.00 0 0.00 0 0 0 0 0 30 5 35
31 Chandigarh 3 2.34 6 4.69 1 1 1 0 1 136 0 136
32 D & N Haveli 4 1.04 8 2.08 1 0 0 0 0 359 21 380
33 Daman & Diu 0 0.00 1 14.29 0 0 0 0 0 8 4 12
34 Delhi 205 11.31 255 14.07 1 2 0 111 111 1814 367 2181
35 Lakshadweep 0 0.00 0 0.00 0 0 0 0 0 0 0 0
36 Puduchery 0 0.00 4 12.12 2 0 1 0 1 32 4 36
Total 5573 4.11 5245 3.87 62 46 736 1855 2591 125308 7531 132839

[Page-IV]
S. No.
State/UT "Others" cases recorded during the year 2016-17
Deletion of others cases during the year 2016-17
Relapse Reentered
for trt. Referred Reclassified Total
New Cases from other states RFT
Otherwise deleted Total
1 Andhra Pradesh 23 50 42 3 118
112 7 119
2 Arunachal Pradesh 2 0 0 0 2 10 1 1 2
3 Assam 4 69 97 2 172 3 66 104 170
4 Bihar 25 795 832 29 1681 13 1162 130 1292
5 Chhattisgarh 54 270 78 23 425 15 276 109 385
6 Goa 4 9 0 1 14 61 52 16 68
7 Gujarat 0 49 9 0 58 59 60 8 68
8 Haryana 8 11 4 1 24 335 19 9 28
9 Himachal Pradesh 6 5 4 3 18 73 3 0 3
10 Jharkhand 0 204 140 0 344 0 263 40 303
11 Jammu & Kashmir 0 0 0 0 19 41 0 0 0
12 Karnataka 64 71 24 4 163 45 134 12 146
13 Kerala 24 38 11 6 79 73 54 16 70
14 Madhya Pradesh 3 74 62 1 140 5 81 4 85
15 Maharashtra 19 745 153 47 964 201 897 51 948
16 Manipur 0 1 0 0 1 2 0 2 2
17 Meghalaya 0 2 1 1 4 5 2 2 4
18 Mizoram 0 0 0 0 0 0 0 0 0
19 Nagaland 4 10 0 0 14 33 9 15 24
20 Odisha 19 275 51 22 367 0 373 15 388
21 Punjab 0 0 0 0 0 0 0 0 0
22 Rajasthan 34 36 7 1 78 45 43 15 58
23 Sikkim 0 2 0 0 2 3 2 0 2
24 Tamil Nadu 89 269 16 19 393 97 279 26 305
25 Telangana 11 11 16 0 38 5 39 2 41
26 Tripura 3 2 4 0 9 0 9 1 10
27 Uttar Pradesh 72 1148 825 30 2075 0 1689 505 2194
28 Uttrakhand 0 16 179 3 198 46 106 100 206
29 West Bengal 45 1327 62 69 1503 14 1129 170 1299
30 A & N Islands 1 0 1 0 2 0 3 0 3
31 Chandigarh 1 89 0 0 90 121 143 4 147
32 D & N Haveli 11 22 14 1 48 74 81 31 112
33 Daman & Diu 0 0 0 0 0 3 0 0 0
34 Delhi 8 292 7 6 313 977 375 61 436
35 Lakshadweep 0 0 0 0 0 0 0 0 0
36 Puducherry 2 1 0 0 3 1 3 0 3
Total 536 5893 2639 272 9359 2360 7465 1456 8921
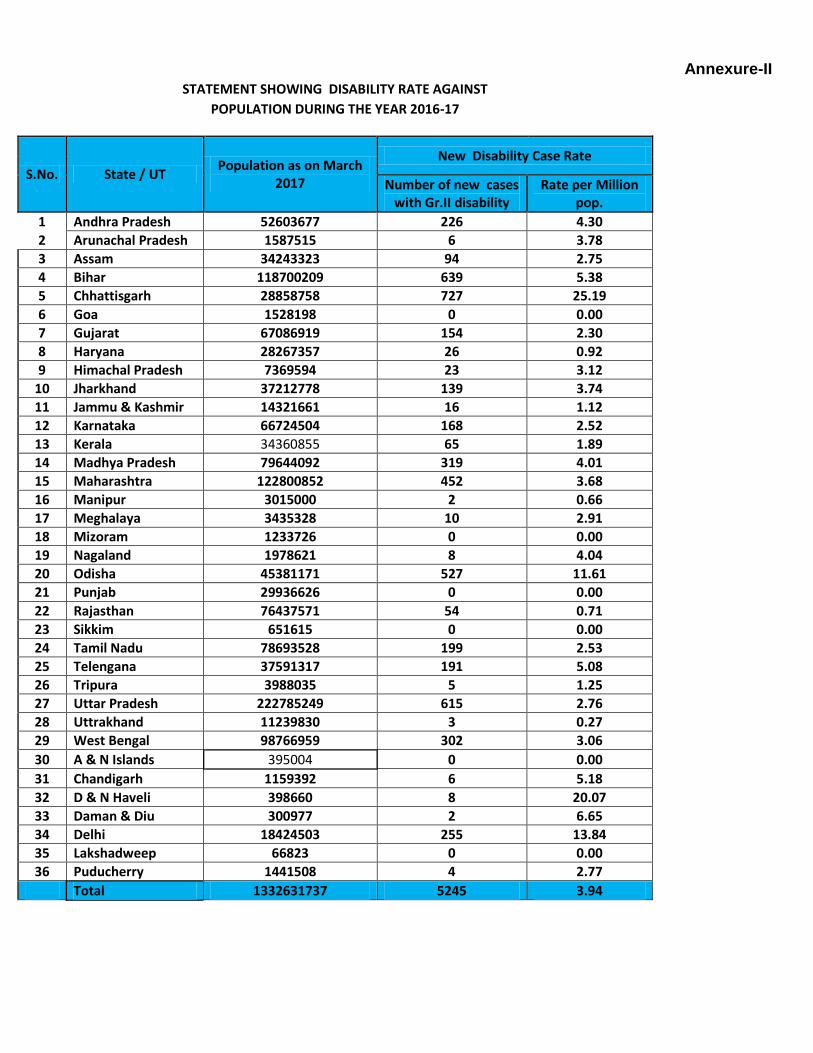
Annexure-II
STATEMENT SHOWING DISABILITY RATE AGAINST
POPULATION DURING THE YEAR 2016-17
S.No. State / UT Population as on March
2017
New Disability Case Rate
Number of new cases with Gr.II disability
Rate per Million pop.
1 Andhra Pradesh 52603677 226 4.30
2 Arunachal Pradesh 1587515 6 3.78
3 Assam 34243323 94 2.75
4 Bihar 118700209 639 5.38
5 Chhattisgarh 28858758 727 25.19
6 Goa 1528198 0 0.00
7 Gujarat 67086919 154 2.30
8 Haryana 28267357 26 0.92
9 Himachal Pradesh 7369594 23 3.12
10 Jharkhand 37212778 139 3.74
11 Jammu & Kashmir 14321661 16 1.12
12 Karnataka 66724504 168 2.52
13 Kerala 34360855 65 1.89
14 Madhya Pradesh 79644092 319 4.01
15 Maharashtra 122800852 452 3.68
16 Manipur 3015000 2 0.66
17 Meghalaya 3435328 10 2.91
18 Mizoram 1233726 0 0.00
19 Nagaland 1978621 8 4.04
20 Odisha 45381171 527 11.61
21 Punjab 29936626 0 0.00
22 Rajasthan 76437571 54 0.71
23 Sikkim 651615 0 0.00
24 Tamil Nadu 78693528 199 2.53
25 Telengana 37591317 191 5.08
26 Tripura 3988035 5 1.25
27 Uttar Pradesh 222785249 615 2.76
28 Uttrakhand 11239830 3 0.27
29 West Bengal 98766959 302 3.06
30 A & N Islands 395004 0 0.00
31 Chandigarh 1159392 6 5.18
32 D & N Haveli 398660 8 20.07
33 Daman & Diu 300977 2 6.65
34 Delhi 18424503 255 13.84
35 Lakshadweep 66823 0 0.00
36 Puducherry 1441508 4 2.77
Total 1332631737 5245 3.94

Annexure-III
STATEMENT SHOWING CHILD CASE RATE AND CHILD DISABILITY RATE AGAINST
POPULATION DURING THE YEAR 2016-17
S.No. State / UT Population as on
March 2017
Child Case Rate Disability Rate among Child
Cases
Number of new Child cases
Child case Rate per 100,000
pop.
Number of new child cases with
Gr.I disability
Number of new child cases with
Gr.II disability
1 Andhra Pradesh 52603677 421 0.80 2 5 2 Arunachal Pradesh 1587515 3 0.19 0 0 3 Assam 34243323 65 0.19 1 2 4 Bihar 118700209 2989 2.52 22 65 5 Chhattisgarh 28858758 793 2.75 4 8 6 Goa 1528198 4 0.26 0 0 7 Gujarat 67086919 498 0.74 3 1 8 Haryana 28267357 16 0.06 0 1 9 Himachal Pradesh 7369594 1 0.01 0 0 10 Jharkhand 37212778 662 1.78 6 20 11 Jammu & Kashmir 14321661 2 0.01 0 0 12 Karnataka 66724504 166 0.25 2 2 13 Kerala 34360855 36 0.10 0 0 14 Madhya Pradesh 79644092 371 0.47 13 3 15 Maharashtra 122800852 1528 1.24 4 17 16 Manipur 3015000 0 0.00 0 0 17 Meghalaya 3435328 1 0.03 0 0 18 Mizoram 1233726 0 0.00 0 0 19 Nagaland 1978621 4 0.20 0 0 20 Odisha 45381171 791 1.74 4 12 21 Punjab 29936626 108 0.36 5 0 22 Rajasthan 76437571 18 0.02 0 0 23 Sikkim 651615 0 0.00 0 0 24 Tamil Nadu 78693528 871 1.11 0 0 25 Telangana 37591317 184 0.49 0 1 26 Tripura 3988035 0 0.00 0 0 27 Uttar Pradesh 222785249 1234 0.55 3 12 28 Uttrakhand 11239830 22 0.20 0 1 29 West Bengal 98766959 840 0.85 0 2 30 A & N Islands 395004 1 0.25 0 0 31 Chandigarh 1159392 8 0.69 0 0 32 D & N Haveli 398660 76 19.06 0 33 Daman & Diu 300977 2 0.66 0 0 34 Delhi 18424503 72 0.39 2 4 35 Lakshadweep 66823 5 7.48 0 0 36 Puducherry 1441508 0 0.00 0 0 Total 1332631737 11792 0.88 71 156

Statement showing Elimination Status in States/UTs (As on March 2017)
I. 7 States/UTs with PR > 1/10,000
S. No.
State Population as on March
2017
% of country’s
population
No. of cases on record
% of country’s case load
PR/ 10,000 *
No. of new cases
detected
% of country’s new case
ANCDR/ 100,000
1 D&N Haveli 398660 0.03 267 0.30 6.70 384 0.28 96.32
2 Chhattisgarh 28858758 2.17 7266 8.24 2.52 12609 9.31 43.69
3 Bihar 118700209 8.91 13031 14.78 1.10 21818 16.10 18.38
4 Goa 1528198 0.11 157 0.18 1.03 130 0.10 8.51
5 Odisha 45381171 3.41 5383 6.11 1.19 10045 7.41 22.13
6 Chandigarh 1159392 0.09 126 0.14 1.09 128 0.09 11.04
7 Lakshadweep 66823 0.01 45 0.05 6.73 45 0.03 67.34
Total of I 196093211 - 26275 - 1.34 45159 - 23.03
Percentage - 14.71 - 29.80 - - 33.33 -
II. 29 States/ UTs that achieved elimination earlier
S. No.
State Population as on March
2014
% of country’s
population
No. of cases on record
% of country’s case load
PR/ 10,000 *
No. of new cases
detected
% of country’s new case
ANCDR/ 100,000
1 Andhra Pradesh 52603677 3.95 2705 3.07 0.51 4228 3.12 8.04
2 Arunachal Pradesh
1587515 0.12 25 0.03 0.16 28 0.02 1.76
3 Assam 34243323.49 2.57 977 1.11 0.29 1019 0.75 2.98
4 Gujarat 67086919 5.03 3844 4.36 0.57 7266 5.36 10.83
5 Haryana 28267357 2.12 459 0.52 0.16 491 0.36 1.74
6 Himachal Pradesh 7369594 0.55 138 0.16 0.19 146 0.11 1.98
7 Jharkhand 37212778 2.79 3414 3.87 0.92 6253 4.62 16.80
8 Jammu & Kashmir 14321661 1.07 186 0.21 0.13 143 0.11 1.00
9 Karnataka 66724504 5.01 2500 2.84 0.37 2897 2.14 4.34
10 Kerala 34360855 2.58 584 0.66 0.17 496 0.37 1.44
11 Madhya Pradesh 79644092 5.98 6067 6.88 0.76 7152 5.28 8.98
12 Maharashtra 122800852 9.21 9887 11.21 0.81 15012 11.08 12.22
13 Manipur 3015000 0.23 18 0.02 0.06 20 0.01 0.66
14 Meghalaya 3435328 0.26 24 0.03 0.07 33 0.02 0.96
15 Mizoram 1233726 0.09 23 0.03 0.19 6 0.00 0.49
16 Nagaland 1978621 0.15 45 0.05 0.23 34 0.03 1.72
17 Punjab 29936626 2.25 570 0.65 0.19 626 0.46 2.09
18 Rajasthan 76437571 5.74 1114 1.26 0.15 1042 0.77 1.36
19 Sikkim 651615 0.05 17 0.02 0.26 23 0.02 3.53
20 Tamil Nadu 78693528 5.91 3207 3.64 0.41 4937 3.64 6.27
21 Telangana 37591317 2.82 1883 2.14 0.50 2658 1.96 7.07
22 Tripura 3988035 0.30 57 0.06 0.14 34 0.03 0.85
23 Uttar Pradesh 222785249 16.72 13456 15.26 0.60 22301 16.46 10.01
24 Uttrakhand 11239830 0.84 282 0.32 0.25 375 0.28 3.34

25 West Bengal 98766959 7.41 8578 9.73 0.87 11236 8.29 11.38
26 A & N Islands 395004 0.03 18 0.02 0.46 18 0.01 4.56
27 Daman & Diu 300977 0.02 11 0.01 0.37 7 0.01 2.33
28 Delhi 18424503 1.38 1780 2.02 0.97 1812 1.34 9.83
29 Puducherry 1441508 0.11 22 0.02 0.15 33 0.02 2.29
Total of II 1136538526 - 61891 - 0.54 90326 - 7.95
Percentage - 85.29 - 70.20 - - 66.67 -
Grand Total (I+II) 1332631737 100.00 88166 100.00 0.66 135485 100.00 10.17
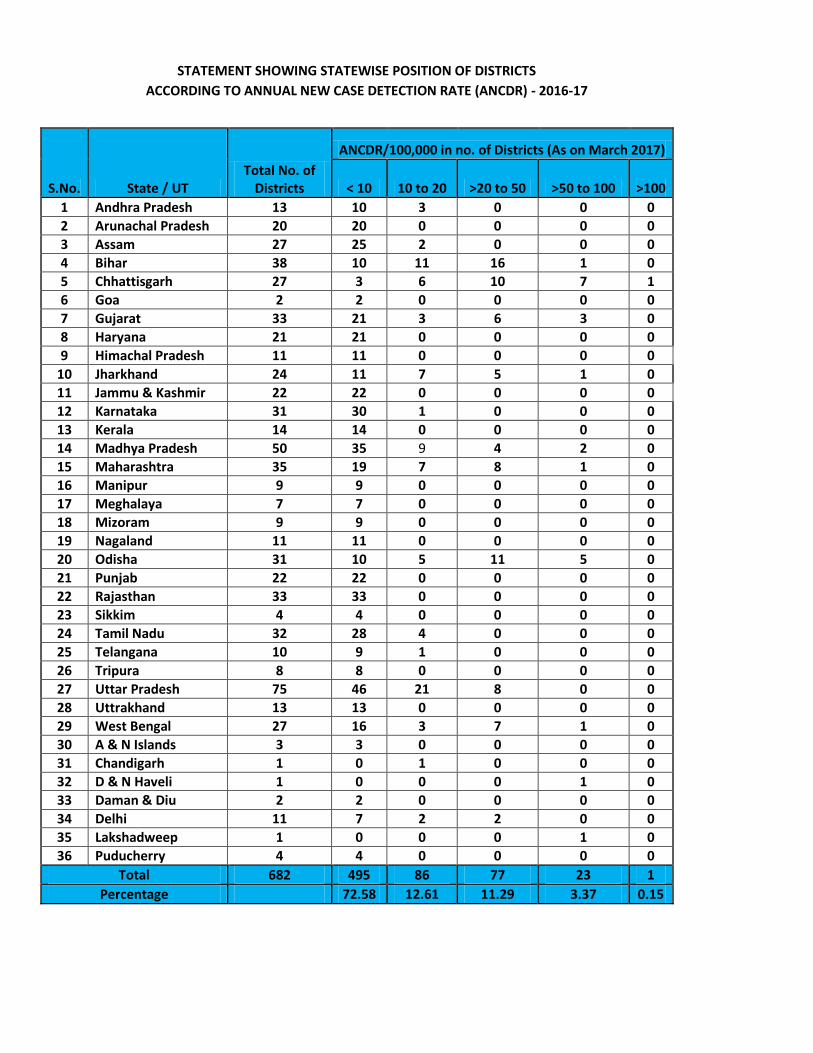
STATEMENT SHOWING STATEWISE POSITION OF DISTRICTS
ACCORDING TO ANNUAL NEW CASE DETECTION RATE (ANCDR) - 2016-17
S.No. State / UT Total No. of
Districts
ANCDR/100,000 in no. of Districts (As on March 2017)
< 10 10 to 20 >20 to 50 >50 to 100 >100
1 Andhra Pradesh 13 10 3 0 0 0
2 Arunachal Pradesh 20 20 0 0 0 0
3 Assam 27 25 2 0 0 0
4 Bihar 38 10 11 16 1 0
5 Chhattisgarh 27 3 6 10 7 1
6 Goa 2 2 0 0 0 0
7 Gujarat 33 21 3 6 3 0
8 Haryana 21 21 0 0 0 0
9 Himachal Pradesh 11 11 0 0 0 0
10 Jharkhand 24 11 7 5 1 0
11 Jammu & Kashmir 22 22 0 0 0 0
12 Karnataka 31 30 1 0 0 0
13 Kerala 14 14 0 0 0 0
14 Madhya Pradesh 50 35 9 4 2 0
15 Maharashtra 35 19 7 8 1 0
16 Manipur 9 9 0 0 0 0
17 Meghalaya 7 7 0 0 0 0
18 Mizoram 9 9 0 0 0 0
19 Nagaland 11 11 0 0 0 0
20 Odisha 31 10 5 11 5 0
21 Punjab 22 22 0 0 0 0
22 Rajasthan 33 33 0 0 0 0
23 Sikkim 4 4 0 0 0 0
24 Tamil Nadu 32 28 4 0 0 0
25 Telangana 10 9 1 0 0 0
26 Tripura 8 8 0 0 0 0
27 Uttar Pradesh 75 46 21 8 0 0
28 Uttrakhand 13 13 0 0 0 0
29 West Bengal 27 16 3 7 1 0
30 A & N Islands 3 3 0 0 0 0
31 Chandigarh 1 0 1 0 0 0
32 D & N Haveli 1 0 0 0 1 0
33 Daman & Diu 2 2 0 0 0 0
34 Delhi 11 7 2 2 0 0
35 Lakshadweep 1 0 0 0 1 0
36 Puducherry 4 4 0 0 0 0
Total 682 495 86 77 23 1
Percentage 72.58 12.61 11.29 3.37 0.15

STATEMENT SHOWING STATEWISE POSITION OF DISTRICTS
ACCORDING TO PREVALENCE RATE
S.No. State / UT Total No.
of Districts
PR/10,000 in no. of Districts (As on March 2017)
< 1 1 to 2 >2 to 5 >5 to 10 >10 to 20 >20
1 Andhra Pradesh 13 13 0 0 0 0 0
2 Arunachal Pradesh 20 20 0 0 0 0 0
3 Assam 27 25 2 0 0 0 0
4 Bihar 38 17 17 4 0 0 0
5 Chhattisgarh 27 7 5 13 2 0 0
6 Goa 2 1 1 0 0 0 0
7 Gujarat 33 24 4 5 0 0 0
8 Haryana 21 21 0 0 0 0 0
9 Himachal Pradesh 11 11 0 0 0 0 0
10 Jharkhand 24 16 5 3 0 0 0
11 Jammu & Kashmir 22 22 0 0 0 0 0
12 Karnataka 31 30 1 0 0 0 0
13 Kerala 14 14 0 0 0 0 0
14 Madhya Pradesh 50 39 9 2 0 0 0
15 Maharashtra 35 24 5 6 0 0 0
16 Manipur 9 9 0 0 0 0 0
17 Meghalaya 7 7 0 0 0 0 0
18 Mizoram 9 8 1 0 0 0 0
19 Nagaland 11 11 0 0 0 0 0
20 Odisha 31 15 8 8 0 0 0
21 Punjab 22 22 0 0 0 0 0
22 Rajasthan 33 33 0 0 0 0 0
23 Sikkim 4 4 0 0 0 0 0
24 Tamil Nadu 32 32 0 0 0 0 0
25 Telangana 10 9 1 0 0 0 0
26 Tripura 8 8 0 0 0 0 0
27 Uttar Pradesh 75 67 8 0 0 0 0
28 Uttrakhand 13 13 0 0 0 0 0
29 West Bengal 27 16 5 6 0 0 0
30 A & N Islands 3 3 0 0 0 0 0
31 Chandigarh 1 0 1 0 0 0 0
32 D & N Haveli 1 0 0 0 1 0 0
33 Daman & Diu 2 2 0 0 0 0 0
34 Delhi 11 7 2 2 0 0 0
35 Lakshadweep 1 0 0 0 1 0 0
36 Puducherry 4 4 0 0 0 0 0
Total 682 554 75 49 4 0 0
Percentage 81.23 11.00 7.18 0.59 0.00 0.00

STATEMENT SHOWING STATEWISE POSITION OF DISTRICTS According to Gr.II Disability - 2016-17
S.No. State / UT Total No.
of Districts
Gr II disability rate per million population in number of districts ( March-2017 )
Gr.-II disability rate
per million for the
state/UT < 1 1 to 2 > 2
1 Andhra Pradesh 13 1 2 10 4.30
2 Arunachal Pradesh 20 16 0 4 3.78
3 Assam 27 13 4 10 2.75
4 Bihar 38 6 0 32 5.38
5 Chhattisgarh 27 3 0 24 26.26
6 Goa 2 2 0 0 0.00
7 Gujarat 33 14 6 13 2.30
8 Haryana 21 16 2 3 0.92
9 Himachal Pradesh 11 1 0 10 3.17
10 Jharkhand 24 10 0 14 3.74
11 Jammu & Kashmir 22 20 1 1 1.12
12 Karnataka 31 18 7 6 1.42
13 Kerala 14 7 3 4 1.89
14 Madhya Pradesh 50 9 7 34 4.90
15 Maharashtra 35 7 4 24 3.74
16 Manipur 9 8 0 1 0.66
17 Meghalaya 7 3 1 3 2.91
18 Mizoram 9 9 0 0 0.00
19 Nagaland 11 9 0 2 4.03
20 Odisha 31 4 1 26 11.61
21 Punjab 22 15 5 2 0.79
22 Rajasthan 33 26 5 2 0.71
23 Sikkim 4 4 0 0 0.00
24 Tamil Nadu 32 9 4 19 2.52
25 Telangana 10 0 2 8 5.08
26 Tripura 8 4 0 4 1.31
27 Uttar Pradesh 75 21 16 38 2.76
28 Uttrakhand 13 13 0 0 0.27
29 West Bengal 27 11 7 9 3.06
30 A & N Islands 3 3 0 0 0.00
31 Chandigarh 1 0 0 1 5.18
32 D & N Haveli 1 0 0 1 20.07
33 Daman & Diu 2 1 1 0 6.37
34 Delhi 11 1 3 7 13.58
35 Lakshadweep 1 1 0 0 0.00
36 Puducherry 4 3 0 1 2.77
Total 682 288 81 313
Percentage 42.23 11.88 45.89

Statement showing new cases Released from Treatment (RFT) as cured
Period - April '16 to March '17
S.No. State/ UT Cases Deleted Percentage of case
released as cured RFT Otherwise Total
1 Andhra Pradesh 4209 94 4303 97.82
2 Arunachal Pradesh 27 3 30 90.00
3 Assam 756 77 833 90.76
4 Bihar 16791 1138 17929 93.65
5 Chhattisgarh 11618 463 12081 96.17
6 Goa 87 0 87 100.00
7 Gujarat 9760 109 9869 98.90
8 Haryana 554 43 597 92.80
9 Himachal Pradesh 119 32 151 78.81
10 Jharkhand 5124 248 5372 95.38
11 Jammu & Kashmir 153 0 153 100.00
12 Karnataka 2712 124 2836 95.63
13 Kerala 445 103 548 81.20
14 Madhya Pradesh 6246 375 6621 94.34
15 Maharashtra 14654 453 15107 97.00
16 Manipur 12 2 14 85.71
17 Meghalaya 20 8 28 71.43
18 Mizoram 0 0 0 0.00
19 Nagaland 63 9 72 87.50
20 Odisha 10425 281 10706 97.38
21 Punjab 552 75 627 88.04
22 Rajasthan 794 330 1124 70.64
23 Sikkim 20 1 21 95.24
24 Tamil Nadu 4559 321 4880 93.42
25 Telangana 2779 21 2800 99.25
26 Tripura 47 3 50 94.00
27 Uttar Pradesh 21359 1657 23016 92.80
28 Uttrakhand 321 32 353 90.93
29 West Bengal 8723 1128 9851 88.55
30 A & N Islands 30 5 35 85.71
31 Chandigarh 136 0 136 100.00
32 D & N Haveli 359 21 380 94.47
33 Daman & Diu 8 4 12 66.67
34 Delhi 1814 367 2181 83.17
35 Lakshadweep 0 0 0 0.00
36 Puducherry 32 4 36 88.89
Total 125302 7531 132833 94.33
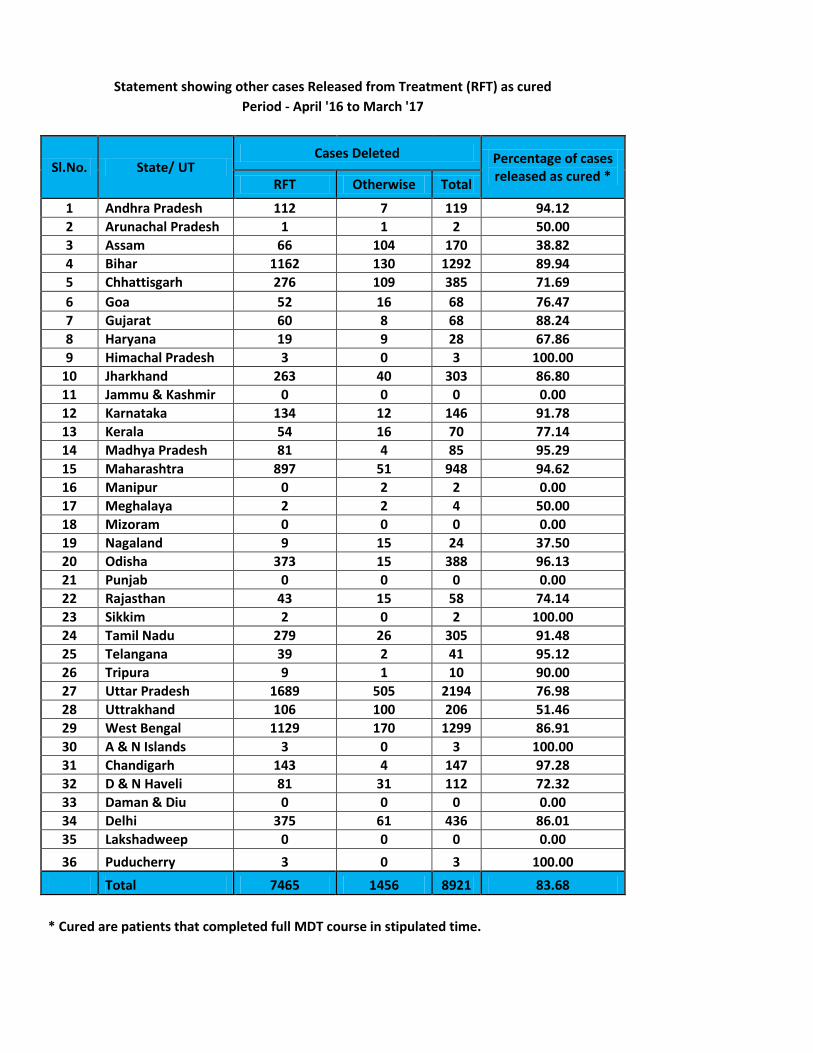
Statement showing other cases Released from Treatment (RFT) as cured
Period - April '16 to March '17
Sl.No. State/ UT Cases Deleted Percentage of cases
released as cured * RFT Otherwise Total
1 Andhra Pradesh 112 7 119 94.12
2 Arunachal Pradesh 1 1 2 50.00
3 Assam 66 104 170 38.82
4 Bihar 1162 130 1292 89.94
5 Chhattisgarh 276 109 385 71.69
6 Goa 52 16 68 76.47
7 Gujarat 60 8 68 88.24
8 Haryana 19 9 28 67.86
9 Himachal Pradesh 3 0 3 100.00
10 Jharkhand 263 40 303 86.80
11 Jammu & Kashmir 0 0 0 0.00
12 Karnataka 134 12 146 91.78
13 Kerala 54 16 70 77.14
14 Madhya Pradesh 81 4 85 95.29
15 Maharashtra 897 51 948 94.62
16 Manipur 0 2 2 0.00
17 Meghalaya 2 2 4 50.00
18 Mizoram 0 0 0 0.00
19 Nagaland 9 15 24 37.50
20 Odisha 373 15 388 96.13
21 Punjab 0 0 0 0.00
22 Rajasthan 43 15 58 74.14
23 Sikkim 2 0 2 100.00
24 Tamil Nadu 279 26 305 91.48
25 Telangana 39 2 41 95.12
26 Tripura 9 1 10 90.00
27 Uttar Pradesh 1689 505 2194 76.98
28 Uttrakhand 106 100 206 51.46
29 West Bengal 1129 170 1299 86.91
30 A & N Islands 3 0 3 100.00
31 Chandigarh 143 4 147 97.28
32 D & N Haveli 81 31 112 72.32
33 Daman & Diu 0 0 0 0.00
34 Delhi 375 61 436 86.01
35 Lakshadweep 0 0 0 0.00
36 Puducherry 3 0 3 100.00
Total 7465 1456 8921 83.68
* Cured are patients that completed full MDT course in stipulated time.

STATEMENT SHOWING STATEWISE POSITION OF DPMR SERVICES
during the year 2016-17
S. No. State / UT
Institutions Recognized
for RCS RCS Performed Cases of
Reaction/ Neuritis
recorded
No. of Relapse
cases
Cases provided with
Govt. NGO Govt. NGO Footwear Self
care kit
1 Andhra Pradesh 2 6 11 271 281 23 8277 11863
2 Arunachal Pradesh 0 0 0 0 7 2 120 62
3 Assam 0 0 1 24 44 4 44 187
4 Bihar 2 2 11 111 777 25 5322 1728
5 Chhattisgarh 0 0 94 23 1545 54 0 379
6 Goa 0 0 1 0 9 4 48 0
7 Gujarat 3 0 115 0 508 0 11951 2034
8 Haryana 0 0 0 7 37 8 813 455
9 Himachal Pradesh 0 0 0 0 2 6 0 0
10 Jharkhand 2 4 0 104 475 0 1551 454
11 Jammu & Kashmir 4 0 0 0 0 0 131 2
12 Karnataka 4 7 8 67 370 64 4633 2428
13 Kerala 0 1 0 23 36 24 392 247
14 Madhya Pradesh 0 0 48 0 447 3 1839 930
15 Maharashtra 9 8 18 240 1066 19 6337 1888
16 Manipur 1 0 0 0 10 0 0 25
17 Meghalaya 0 0 0 0 3 0 67 9
18 Mizoram 0 0 0 0 0 0 0 0
19 Nagaland 0 0 0 0 0 4 20 16
20 Odisha 10 5 276 29 1788 19 5539 7207
21 Punjab 0 0 0 0 0 0 2850 488
22 Rajasthan 1 0 1 0 62 34 635 1015
23 Sikkim 1 0 0 0 0 0 0 0
24 Tamil Nadu 2 8 9 102 402 89 10425 13911
25 Telangana 1 1 0 51 161 11 1092 404
26 Tripura 0 0 0 0 3 3 0 0
27 Uttar Pradesh 3 3 31 575 1606 72 6064 3113
28 Uttrakhand 1 0 10 0 50 0 712 2558
29 West Bengal 9 2 100 117 1954 45 6098 18150
30 A & N Islands 0 0 0 0 4 1 0 47
31 Chandigarh 1 1 1 0 32 1 36 24
32 D & N Haveli 1 0 0 0 38 11 97 19
33 Daman & Diu 0 0 0 0 0 0 26 0
34 Delhi 1 2 0 111 246 8 484 33
35 Lakshadweep 0 0 0 0 0 0 16 0
36 Puducherry 2 0 1 0 2 2 80 0
Total 60 50 736 1855 11965 536 75699 69676
Total of Govt.+NGO 110 2591

State-wise Status of ASHA involved for Leprosy Programme activities during 2016-17
S.No State/UT No. in
position
No. trained in NLEP till
date
No. of leprosy cases
diagnosed out of
refferal by ASHA
No. of cases completed treatment with ASHA supervision
ASHA Paid Incentive
1 Andhra Pradesh 38671 15702 1545 1647 797 2 Arunachal Pradesh 3800 132 0 0 0 3 Assam 30603 386 308 88 19 4 Bihar 86182 43567 12224 7030 1682 5 Chhattisgarh 59646 3735 1961 402 6 Goa 1262 523 0 0 0 7 Gujarat 35934 11509 4383 2596 3261 8 Haryana 16774 1417 17 14 16 9 Himachal Pradesh 7557 858 0 0 0 10 Jharkhand 40964 7179 3576 1852 1405 11 Jammu & Kashmir 5464 147 0 0 0 12 Karnataka 5725 956 597 387 402 13 Kerala 29961 7880 14 7 16 14 Madhya Pradesh 30000 3504 15 Maharashtra 52000 7500 4333 1717 744 16 Manipur 57993 3292 0 0 0 17 Meghalaya 4009 0 2 5 18 Mizoram 6388 487 0 0 0 19 Nagaland 1091 90 0 0 0 20 Odisha 1887 36 5904 7063 5093 21 Punjab 45707 0 22 Rajasthan 14293 2904 63 58 58 23 Sikkim 48202 11660 0 0 0 24 Tamil Nadu 664 0 226 85 148 25 Telangana 2608 1439 806 939 16 26 Tripura 28600 0 2 3 0 27 Uttar Pradesh 7367 3549 5268 3648 2448 28 Uttrakhand 136094 0 79 59 132
29 West Bengal 11086 5078 2983 3104 30 A & N Islands 48410 7233 2 2 1 31 Chandigarh 0 0 0 32 D & N Haveli 40 0 15 329 325 33 Daman & Diu 295 255 0 8 5 34 Delhi 58 11 12 16 35 Lakshadweep 5099 1380 36 Pondicherry 110 110 0 0 0
Total 864544 133695 48186 32490 20095