Embed Size (px)
Citation preview

NLC INDIA LIMITED(Formerly Neyveli Lignite Corporation Limited)A “Navratna” – Government of India Enterprise
CORPORATE PRESENTATION

DisclaimerThis presentation report is for distribution only under such circumstances as may be permitted by applicable law. It is published solely for information purposes, it does notconstitute an advertisement and is not to be construed as a solicitation or an offer to buy or sell any securities or related financial instruments in any jurisdiction. Norepresentation or warranty, either express or implied, is provided in relation to the accuracy, completeness or reliability of the information contained herein, except withrespect to information concerning NLCIL’s past performance, its subsidiaries and affiliates, nor is it intended to be a complete statement or summary of the future proposals ,strategies and projections referred to in the report. NLCIL does not undertake that investors will obtain profits, nor will it share with investors any investment profits noraccept any liability for any investment losses. Investments involve risks and investors should exercise prudence in making their investment decisions.
The report should not be regarded by recipients as a substitute for the exercise of their own judgment. Past performance is not necessarily a guide to future performance. Thevalue of any investment or income may go down as well as up and you may not get back the full amount invested. Any opinions expressed in this report are subject tochange without notice and may differ or be contrary to opinions expressed by other business groups of NLCIL as a result of using different assumptions and criteria. Thispresentation report may contain certain “forward-looking statements”. These forward-looking statements generally can be identified by words or phrases such as “aim”,“anticipate”, “believe”, “expect”, “estimate”, “intend”, “objective”, “plan”, “project”, “shall”, “will”, “will continue”, “will pursue” or other words or phrases of similarimport. Similarly, statements that describe our strategies, objectives, plans or goals are also forward-looking statements.
All forward-looking statements are subject to risks, uncertainties and assumptions about us that could cause actual results to differ materially from those contemplated bythe relevant statement. These forward looking statements are based on our current plans and expectations. Actual results may differ materially from those suggested by theforward-looking statements due to risks or uncertainties associated with our expectations with respect to, but not limited to, regulatory changes pertaining to the industriesin which we have our businesses and our ability to respond to them, our ability to successfully implement our strategy, our growth and expansion, technological changes,our exposure to market risks, general economic and political conditions which have an impact on our business activities or investments, the monetary and fiscal policies ofIndia, inflation, deflation, unanticipated turbulence in interest rates, foreign exchange rates, equity prices or other rates or prices, the performance of the financial markets inIndia and globally, changes in Indian laws, regulations and taxes and changes in competition in our industry etc.
NLCIL reserves the right to alter, modify or otherwise change the presentation without notifying any person of such changes or revision. Neither the author or NLCIL shallbe liable for any direct or indirect damages that may arise due to any act or omission on the part of the user due to any reliance placed or guidance taken from thispresentation report. Further, NLCIL is under no obligation to update or keep current the information contained herein. The disclosures contained in this presentation reportproduced by NLCIL shall be governed by and construed in accordance with laws of India. NLCIL specifically prohibits the redistribution of this material in whole or in partwithout the written permission of NLCIL and NLCIL accepts no liability whatsoever for the actions of third parties in this respect. Images may depict objects or elementswhich are protected by third party copyright, trademarks and other intellectual property rights. All rights reserved.
Mar-2017 NLC INDIA LIMITED 2

Mar-2017 NLC INDIA LIMITED 3
Contents
Company Overview & Performance Highlights
Financial Performance
Industry Opportunities
Future Growth
Sustainability Measures
Awards & Recognition
Glossary

NLC India Ltd| Introduction
Mar-2017 NLC INDIA LIMITED 4
A ‘Navratna’ Company
Rich Heritage with Over 6 Decades of Glorious Existence
Core Business – Mining & Power Generation with Expertise in operation & maintenance ofopen-cast mining, power generation
Robust Financial Performance – FY 15-16 Total Income - Rs. 7,194 crore;PAT – Rs. 1,204 crore; Market Capitalization * - Rs. 18,403.98 crore
Conferred with AAA rating – Highest domestic credit rating
Strong Parentage with Government of India – equity holding 89.32%
Present Board of Directors comprise of 12 Directors– 6 Functional Directors, a Government Nominee and 5 Independent Directors including 2 Women Directors
* Based on closing share price in BSE as on 23.03.2017 – BSE Rs. 120.40 Post buyback equity shares
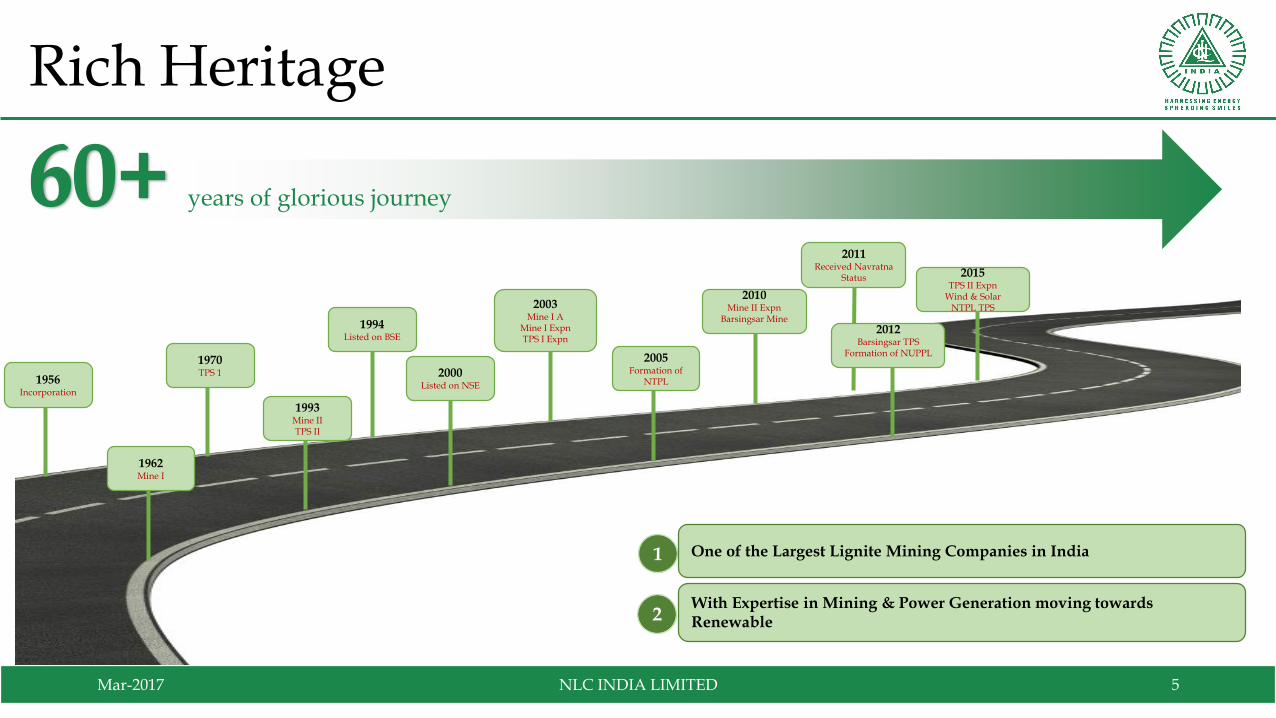
Rich Heritage
Mar-2017 NLC INDIA LIMITED 5
years of glorious journey
1956Incorporation
1962Mine I
1970TPS 1
2003Mine I A
Mine I ExpnTPS I Expn
2005Formation of
NTPL
2010Mine II Expn
Barsingsar Mine
2015TPS II Expn
Wind & SolarNTPL TPS
1994Listed on BSE
1993Mine IITPS II
2000Listed on NSE
1 One of the Largest Lignite Mining Companies in India
2With Expertise in Mining & Power Generation moving towards Renewable
2011Received Navratna
Status
2012Barsingsar TPS
Formation of NUPPL
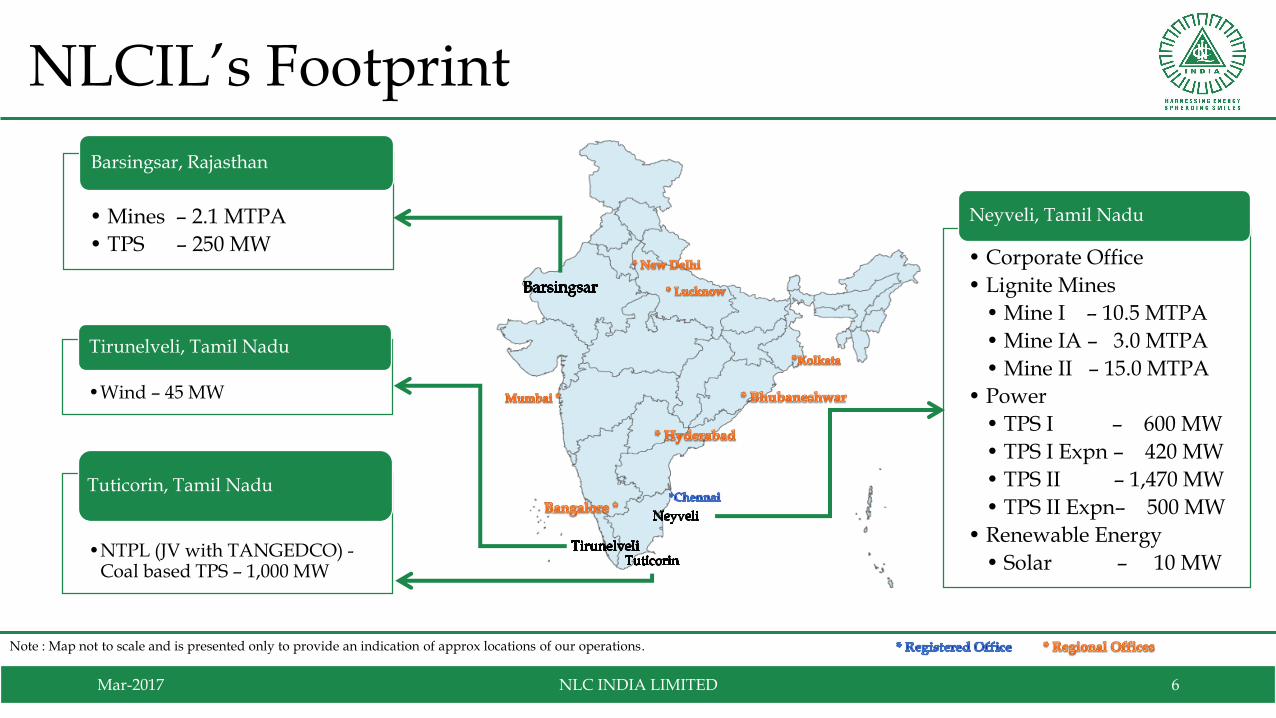
NLCIL’s Footprint
Mar-2017 NLC INDIA LIMITED 6
• Corporate Office
• Lignite Mines
• Mine I – 10.5 MTPA
• Mine IA – 3.0 MTPA
• Mine II – 15.0 MTPA
• Power
• TPS I – 600 MW
• TPS I Expn – 420 MW
• TPS II – 1,470 MW
• TPS II Expn– 500 MW
• Renewable Energy
• Solar – 10 MW
Neyveli, Tamil Nadu• Mines – 2.1 MTPA
• TPS – 250 MW
Barsingsar, Rajasthan
Note : Map not to scale and is presented only to provide an indication of approx locations of our operations.
•Wind – 45 MW
Tirunelveli, Tamil Nadu
•NTPL (JV with TANGEDCO) -Coal based TPS – 1,000 MW
Tuticorin, Tamil Nadu

NLCIL’s Core Business
Mar-2017 NLC INDIA LIMITED 7
Power Generation
Mining
Mining Power Generation
✓ Lignite Mining – 30.60 MTPA ✓ Lignite based TPSs – 3,240 MW*✓ Renewable Energy
✓ Solar – 10 MW✓ Win d – 45 MW• Physical Performance
• Physical Performance
18,789
19,902 19,989 19,72919,182
2011-12 2012-13 2013-14 2014-15 2015-16
Power Generation - MU
83% 83% 83% 81%76%73% 70%
66% 65% 62%
2011-12 2012-13 2013-14 2014-15 2015-16
Plant Load Factor %
NLC All India
246
262266 265
255
2011-12 2012-13 2013-14 2014-15 2015-16
Lignite Production - LT
Note : Source from NLCIL Annual Reports and figures representing NLCIL StandaloneLT – Lakh Tons MW – Mega Watt MTPA – Million Tone Per Annum Source : Central Electricity Authority & NLCIL Annual Reports* as on 28.02.2017

Performance – FY 2016-17
Mar-2017 NLC INDIA LIMITED 8
13,977
10,338
15,334
10,322
9 Months 6 Months
FY 15-16 FY 16-17
Power Generation (MU)
156
111
180
110
9 Months 6 Months
FY 15-16 FY 16-17
Lignite Production (LT)
Note : Source from NLCIL and figures representing NLCIL Standalone

Strong In-House Capabilities
Mar-2017 NLC INDIA LIMITED 9
Expertise in Open Cast Mining &
Power Generation
Lignite Resources for Captive
Consumption
Nodal Agency for Lignite Data Base
Strong Financials
• Long experience and expertisein operation, maintenance andproject management in open-cast mining & powergeneration
• Asset bank of specialisedmining equipments for opencast mining:− German excavation
technology− Bucket wheel excavators,
conveyors and spreaders
• Captive fuel source withpower plants located at the pitheads of Lignite mines
• Greater flexibility in terms ofadjusting the ligniteproduction to adjust forvariations in power demandsand power generation atthermal power plants
• Nodal Agency for Lignitedatabase appointed byMinistry of Coal
• Competitive advantage inidentifying and exploitingnew lignite deposits in India
• Consistent growth in turnover
• Highest domestic creditratings
• Competitive tariff ratescomparing other sources ofpower generation
• Internal Financial ControlFramework is in place in linewith international practices

Strength & Opportunities
Mar-2017 NLC INDIA LIMITED 10
• Availability of lignite andwater for power generation.
• Expertise in operation &maintenance of open-castmining, power generation.
• Potential area fordiversification – Coal blocks,Renewable energy & Powertrading
• Harmonious Industrialrelations.
• Pioneering positions in open-cast lignite mining with SMEtechnology and lignite firedpower station.
• GOI’s commitment to improvethe quality of life of its citizenthrough higher electricityconsumption.
• GOI aims to provide eachhousehold access to electricity,round the clock and improve thequality of life of people through24x7 power supply.
• Rise in the per capitaconsumption of power.
• Huge potential for RenewableEnergy
• Launch of 100 smart citiesmission by GOI.
Strength Opportunities

Mar-2017 NLC INDIA LIMITED 11
Contents
Company Overview & Performance Highlights
Financial Performance
Industry Opportunities
Future Growth
Sustainability Measures
Awards & Recognition
Glossary
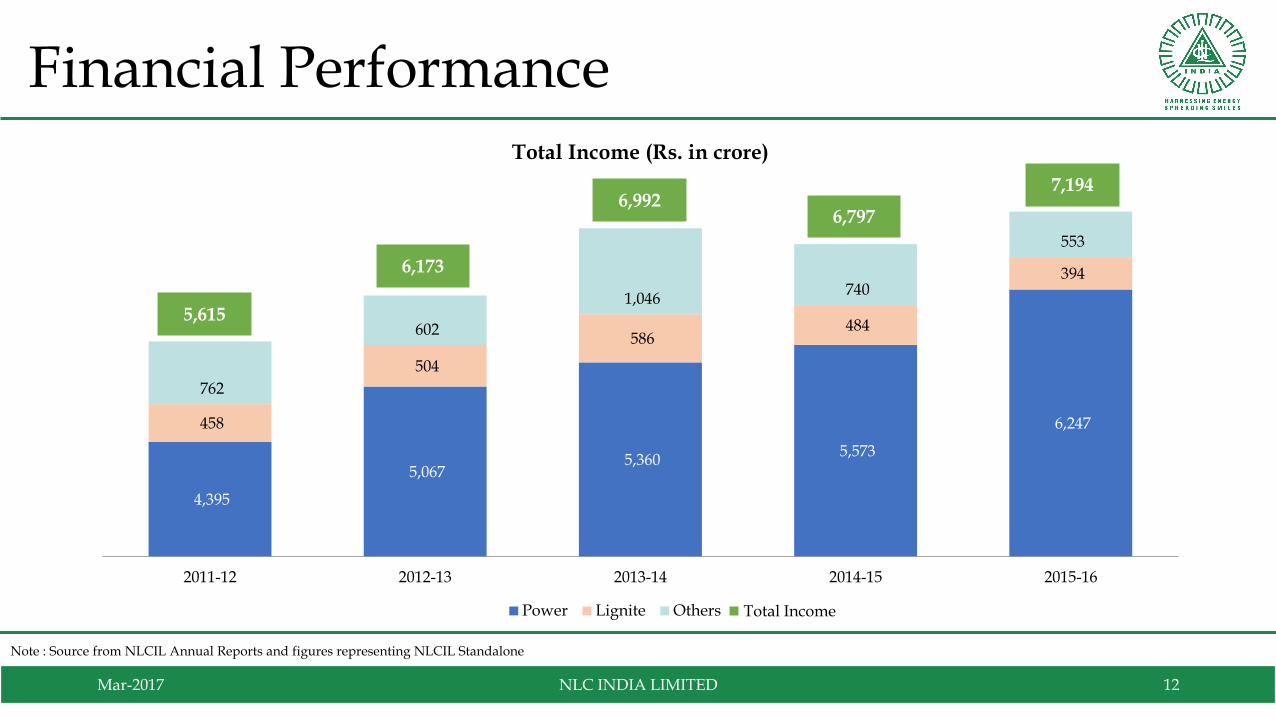
Financial Performance
Mar-2017 NLC INDIA LIMITED 12
4,395
5,067 5,360
5,573
6,247 458
504
586 484
394
762
602
1,046 740
553
2011-12 2012-13 2013-14 2014-15 2015-16
Total Income (Rs. in crore)
Power Lignite Others
5,615
6,173
6,9926,797
7,194
Total Income
Note : Source from NLCIL Annual Reports and figures representing NLCIL Standalone

Financial Performance
Mar-2017 NLC INDIA LIMITED 13
2,485 2,592
2,9812,634 2,742
2,055 2,080
2,4642,194 2,143
2011-12 2012-13 2013-14 2014-15 2015-16
EBITDA & EBIT (Rs. in crore)
EBITDA EBIT
1,984 2,0482,209
2,383
1,926
1,411 1,460 1,502 1,580
1,204
2011-12 2012-13 2013-14 2014-15 2015-16
PBT & PAT (Rs. in crore)
PBT PAT
470 470 470 470 503 1,122
28.0% 28.0% 28.0% 28.0% 30.0%
73.4%*
0.0%
20.0%
40.0%
60.0%
80.0%
200
600
1,000
1,400
2011-12 2012-13 2013-14 2014-15 2015-16 2016-17
Dividend Trend
Dividend Dividend %
2011-12 2012-13 2013-14 2014-15 2015-16
OPM (%) 35.69 35.94 32.78 31.62 33.24
ROCE (%) 10.22 11.5 12.11 12.81 7.50
RONW (%) 11.77 11.29 10.82 10.69 7.89
Current Ratio 3.17 3.78 3.44 3.55 3.19
Quick Ratio 2.97 3.46 3.16 3.16 2.75
Key Financial Ratios
Note : Source from NLCIL Annual Reports and figures representing NLCIL Standalone* Interim Dividend declared for 2016-17 – 73.40%

Financial Performance
Mar-2017 NLC INDIA LIMITED 14
(Rs . in crore)
Contribution to Exchequer (Rs. in crore)
Agency Rating
CRISIL AAA/Stable
ICRA AAA/Stable
CARE AAA/Stable
Brickwork AAA/Stable
2011-12 2012-13 2013-14 2014-15 2015-16
Central Government 1,172.89 1,566.77 1,362.60 1,816.44 1,605.00
State Government
Tamilnadu 196.17 227.92 270.75 274.22 269.29
Rajasthan 8.60 9.25 9.61 7.26 6.61
Total - State 204.77 237.17 280.36 281.48 275.90
Total 1,377.66 1,803.94 1,642.96 2,097.92 1,880.90
Credit Ratings
11,99012,925
13,88114,772 15,271
3,8193,524
3,150
3,1643,540
2011-12 2012-13 2013-14 2014-15 2015-16
Net Worth Loans Outstanding
Note : Source from NLCIL Annual Reports and figures representing NLCIL Standalone

Financial Performance – FY 2016-17
Mar-2017 NLC INDIA LIMITED 15
Total Income from OperationsEarnings Before Interest, Tax, Depreciation
and AmortizationProfit After Tax
4,821
3,564
5,831
3,939
9 Months 6 Months
FY 15-16 FY 16-17
1,848
1,503
1,970
1,282
9 Months 6 Months
FY 15-16 FY 16-17
758
710
852
530
9 Months 6 Months
FY 15-16 FY 16-17
(Rs. in crore)
Note : Source from NLCIL Annual Reports and figures representing NLCIL Standalone

Mar-2017 NLC INDIA LIMITED 16
Contents
Company Overview & Performance Highlights
Financial Performance
Industry Opportunities
Future Growth
Sustainability Measures
Awards & Recognition
Glossary

Lignite Reserves in India
Mar-2017 NLC INDIA LIMITED 17
Depth wise resources In MT as on 31.03.2016
STATE <150 m Depths 150-300 m Depths>300 m Depths
Total %
Tamil Nadu 6,176.98 8,752.81 20,750.14 35,679.93 80.02
Puducherry 416.61 0.00 0.00 416.61 0.93
Rajasthan 1,941.68 3,016.88 777.40 5,735.97 12.86
Gujarat 707.72 2,014.33 0.00 2,722.05 6.10
J&K 27.55 0.00 0.00 27.55 0.06
Kerala 9.65 0.00 0.00 9.65 0.02
West Bengal 1.15 1.62 0.00 2.77 0.01
Total 9,281.34 13,785.64 21,527.54 44,594.53 100.00
% 20.81 30.91 48.28 100.00
Source : Geological survey of India
Tamil Nadu -35,679.93
Puducherry-416.61
Rajasthan-5,735.97
Gujarat - 2,722.05 Others - 39.97

Power Sector in India
Coal, - 188,968
Gas & Diesel -26,201
Nuclear -5,780
Hydro - 43,139
Wind - 28,083
Solar - 8,513
Other Resources -
9,321
Installed Capacity - 3,10,005 MW
Mar-2017 NLC INDIA LIMITED 18
6264
5958 58
64
67
61 62
68
6261
5452
5860 61 60
April May June July August September October November December
All India Plant Load Factor %
2015-16 2016-17
Source -Central Electricity Authority – Executive Summary Dec -16 Report
631672
717 734779
819
884914
9571,010
1,075
2005-06 2006-07 2007-08 2008-09 2009-10 2010-11 2011-12 2012-13 2013-14 2014-15 2015-16
Per Capita Consumption (kWhr)
776,388 770,994
Requirement Availability
Power Position (MU)

Mar-2017 NLC INDIA LIMITED 19
Contents
Company Overview & Performance Highlights
Financial Performance
Industry Opportunities
Future Growth
Sustainability Measures
Awards & Recognition
Glossary

Sl. No
ProjectExisting
Capacity1
Addition Proposed
Total2
1 Lignite (MTPA) 30.60 31.55 62.15
2 Coal (MTPA) 0 31.00 31.00
3 Power - Lignite Based (MW) 3,240 3,540 6,780
4 Power - Coal Based (MW) 1,000 5,940 6,940
5 Power - Renewable (MW) 55 4,196 4,251
6 Acquisition of Power Assets (MW) 0 3,000 3,000
TOTAL POWER (MW) 4,295 16,676 20,971
TOTAL CAPEX : Rs.1.28 lakh crore with a debt-equity ratio of 70:30.
NLCIL – Growth Plan over 10 Years – Vision 2025
Mar-2017 NLC INDIA LIMITED 20
1 Note: Existing Capacity as on 28.02.20172 Note: Total Expected Capacity by 2025 – based on the Corporate Plan 2025 which is available in the Company Website

On going / Upcoming Projects
Mar-2017 NLC INDIA LIMITED 21
Lignite Projects MT
Expansion of Mine-IA from 3MTPA to 7 MTPA
4.00
Bithnok Lignite Mine, Rajasthan 2.25
Hadla Lignite Mines, Rajasthan 1.90
Barsingsar Expansion, Rajasthan 0.40
Total 8.55
Coal Projects MT
Talabira II & III Coal Blocks 20.00
South Pachwara Coal Block 11.00
Total 31.00
Mining Projects Power Projects
Lignite based TPS MW
NNTPP 1,000*
Bithnok TPS 250
Barsingsar TPS Expn 250
Total 900*
Coal based TPS MW
NUPPL UP 1,980
Renewable MW
Solar – TN 630
Wind Power – TN 6
Total 636
Lignite Projects MT
Palayamkottai & Vellar 11.5
MineIII Neyveli 11.5
Total 23.00
On Going Projects Upcoming Projects
Lignite based TPS MW
TPS-II 2nd Expn 2,640
Coal based TPS MW
Odisha / NTPL Expn. 3960**
Renewable MW
Solar – in various States 3,360
Wind Power - TN 200
Total 3,560
On Going Projects Upcoming Projects
*Note: NNTPS to replace existing TPS I of 600 MW accordingly 400 MW has been considered for arriving the total.** Note : likely to be upgraded as 4000 MW (5x800 MW) instead of 3960 MW (6x660 MW)
Power Assets Acquisition MW
Raghunathpur – JV with DVC
1,200
Power Assets Acquisition 1,800
Total 3,000

Mar-2017 NLC INDIA LIMITED 22
Contents
Company Overview & Performance Highlights
Financial Performance
Industry Opportunities
Future Growth
Sustainability Measures
Awards & Recognition
Glossary

Amount Spent on CSR activities
2012-13 : Rs. 14.26 crore
2013-14 : Rs. 26.30 crore
2014-15 : Rs. 47.49 crore
2015-16 : Rs. 81.93 crore
More than 1400 Toilets constructed
(with an expenditure of Rs. 39 crore)
under Swachh Vidyalaya Mission of
Government of India in Schools of
Two States of INDIA.
Mar-2017 NLC INDIA LIMITED 23
Corporate Social Responsibility

Green belt development
Mar-2017 NLC INDIA LIMITED 24

Mar-2017 NLC INDIA LIMITED 25
New Initiatives – Sustainable Development
• Formed 14 industrial service units for adoption of energy conservation measures
• To utilise alternate source of energy wherever permissible
Energy Conservation
• Studies on synthesis of Zeolites from Lignite Fly Ash and its efficiency incooling water treatment taken up based on the outcome production of Zeolitetablet for water treatment.
• Development of organic coating paints for use in specialized Miningequipment/De-watering pipes to enhance its life.
• Reclamation of Slag Dump areas in Mine-II suitable for development of GreenCover
Technology Absorption

Mar-2017 NLC INDIA LIMITED 26
Contents
Company Overview & Performance Highlights
Financial Performance
Industry Opportunities
Future Growth
Sustainability Measures
Awards & Recognition
Glossary
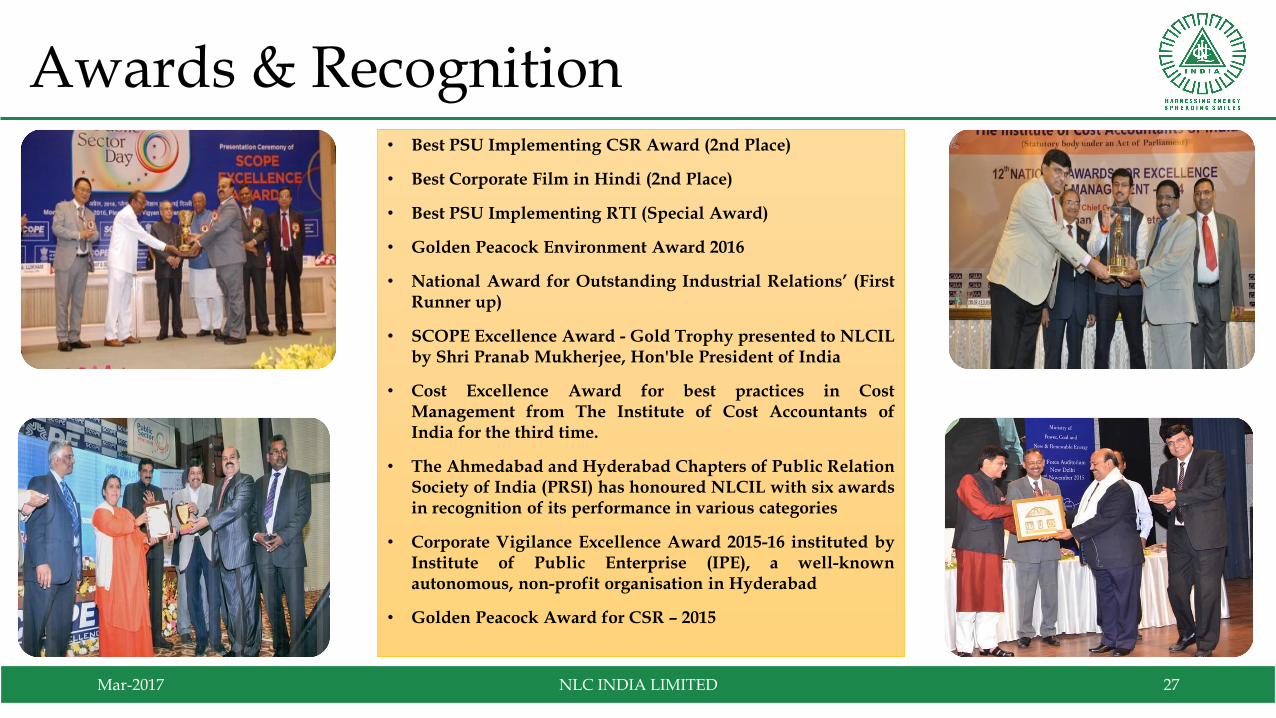
Awards & Recognition• Best PSU Implementing CSR Award (2nd Place)
• Best Corporate Film in Hindi (2nd Place)
• Best PSU Implementing RTI (Special Award)
• Golden Peacock Environment Award 2016
• National Award for Outstanding Industrial Relations’ (FirstRunner up)
• SCOPE Excellence Award - Gold Trophy presented to NLCILby Shri Pranab Mukherjee, Hon'ble President of India
• Cost Excellence Award for best practices in CostManagement from The Institute of Cost Accountants ofIndia for the third time.
• The Ahmedabad and Hyderabad Chapters of Public RelationSociety of India (PRSI) has honoured NLCIL with six awardsin recognition of its performance in various categories
• Corporate Vigilance Excellence Award 2015-16 instituted byInstitute of Public Enterprise (IPE), a well-knownautonomous, non-profit organisation in Hyderabad
• Golden Peacock Award for CSR – 2015
Mar-2017 NLC INDIA LIMITED 27

Mar-2017 NLC INDIA LIMITED 28
Contents
Company Overview & Performance Highlights
Financial Performance
Industry Opportunities
Future Growth
Sustainability Measures
Awards & Recognition
Glossary

Glossary
Mar-2017 NLC INDIA LIMITED 29
Term Description
NLCIL NLC India Limited
NNTPP New Neyveli Thermal Power Project
NSE National Stock Exchange
NTPL NLC Tamilnadu Power Limited
NUPPL Neyveli Uttar Pradesh Power Limited
OPM Operating Profit Margin
PAT Profit after Tax
PBT Profit before Tax
PSU Public Sector Undertakings
ROCE Return on Capital Employed
RONW Return on Net Worth
RTI Right to Information
SCOPE Standing Conference of Public Enterprises
SME Specialised Mining Equipments
TANGEDCO Tamil Nadu Generation and Distribution Corporation Limited
TN Tamil Nadu
TPS Thermal Power Station
UP Uttar Pradesh
Term Description
BSE Bombay Stock Exchange
CAPEX Capital Expenditure
CSR Corporate Social Responsibility
DVC Damodar Valley Corporation
EBIT Earnings before Interest & Tax
EBITDA Earnings before Interest, Tax & Depreciation and Amortisation
Expn. Expansion
FY Financial Year
GOI Government of India
JV Joint Venture
kWhr Kilowatt-hour
LT Lakh Ton
MT Million Ton
MTPA Million Ton per Annum
MU Million Units
MW Mega Watt

For more information, please visit www.nlcindia.com
For any queries / further information on the presentation / about thecompany, please mail us at [email protected]