Embed Size (px)
Citation preview
NJCAT TECHNOLOGY VERIFICATION
Up-Flo® Filter (with Filter Ribbon Media)
Hydro International
December, 2016
i
TABLE OF CONTENTS
List of Figures ii
List of Tables iii
1. Description of Technology 1
2. Laboratory Testing 3
2.1 Test Setup 3
2.2 Test Sediment 5
2.3 Sediment Removal Efficiency Testing 6
2.4 Sediment Mass Loading Capacity 8
2.5 Scour Testing 8
2.6 Quality Objectives and Criteria 9
3. Performance Claims 9
4. Supporting Documentation 11
4.1 Removal Efficiency Testing 11
4.2 Sediment Mass Loading Capacity 18
4.3 Filter Operating Head 20
5. Design Limitations 21
6. Maintenance 23
7. Statements 25
8. References 31
Verification Appendix 32
ii
List of Figures
Page
Figure 1 Up-Flo® Filter Configured with Filter Ribbons……. ........................................1
Figure 2 Up-Flo® Filter Module with Filter Ribbons .......................................................2
Figure 3 Up-Flo® Filter in Typical Manhole and Vaulted Configurations ......................2
Figure 4 Laboratory Testing Arrangement .......................................................................4
Figure 5 Elevation View of Test Manhole .......................................................................5
Figure 6 View of Interior of Test Manhole ......................................................................5
Figure 7 Average PSD of Test Sediment Compared to Protocol Specification ...............6
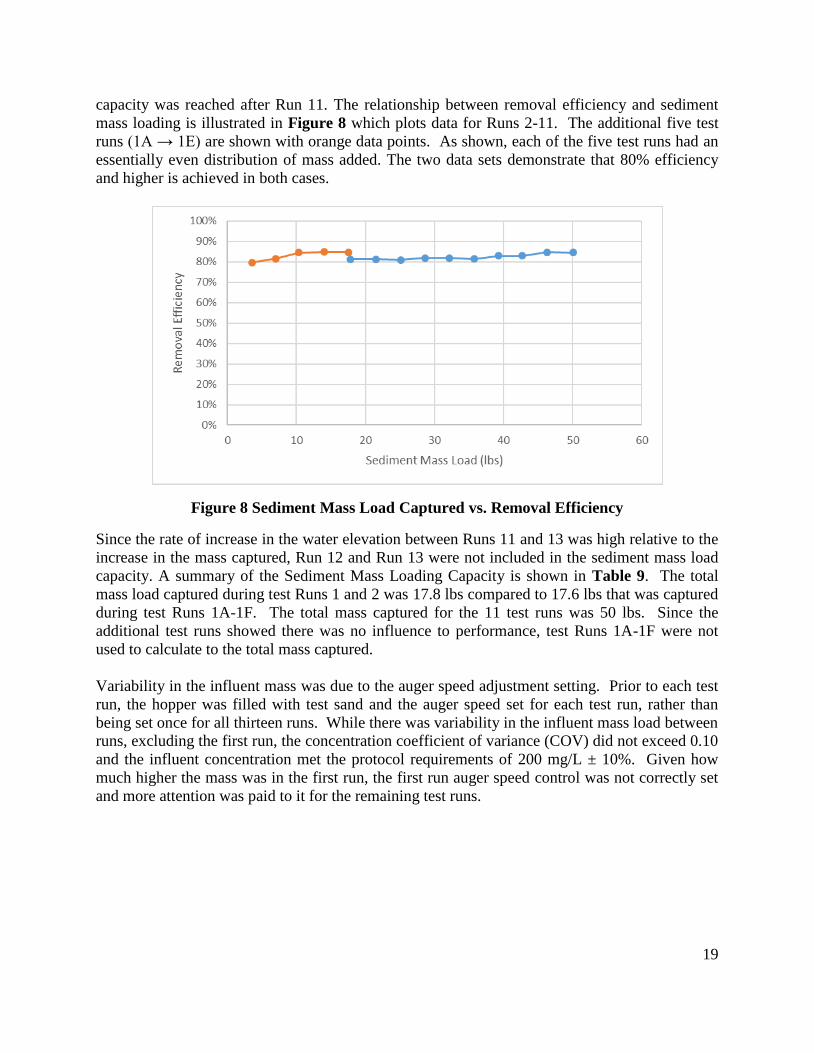
Figure 8 Sediment Mass Load Captured vs. Removal Efficiency .................................19
Figure 9 Sediment Mass Load Captured vs. Operating Head ....................................... 21
iii
List of Tables
Page
Table 1 Particle Size Distribution Results of Test Sediment Samples ...........................6
Table 2 Example Sampling Time for TSS Removal Efficiency Test .............................8
Table 3 Flow Rates ...................................................................................................... 12
Table 4 Temperatures................................................................................................... 13
Table 5 Influent Sediment Concentrations................................................................... 14
Table 6 Background Sediment Concentrations ............................................................ 15
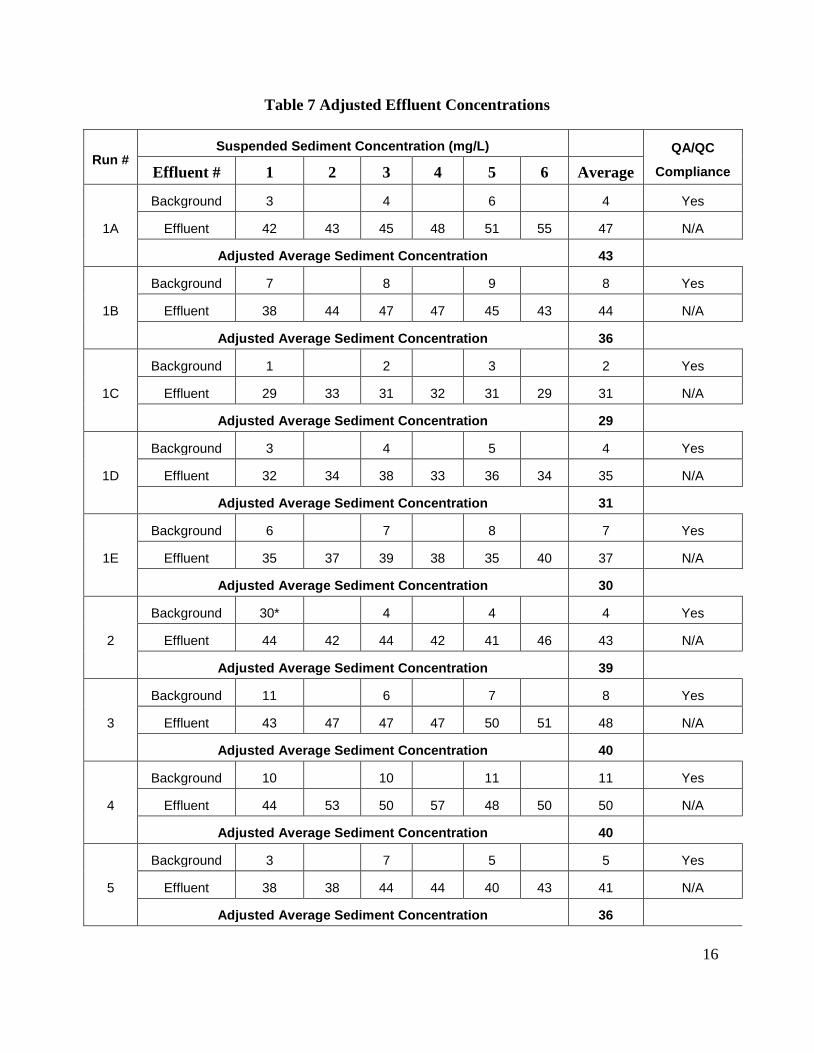
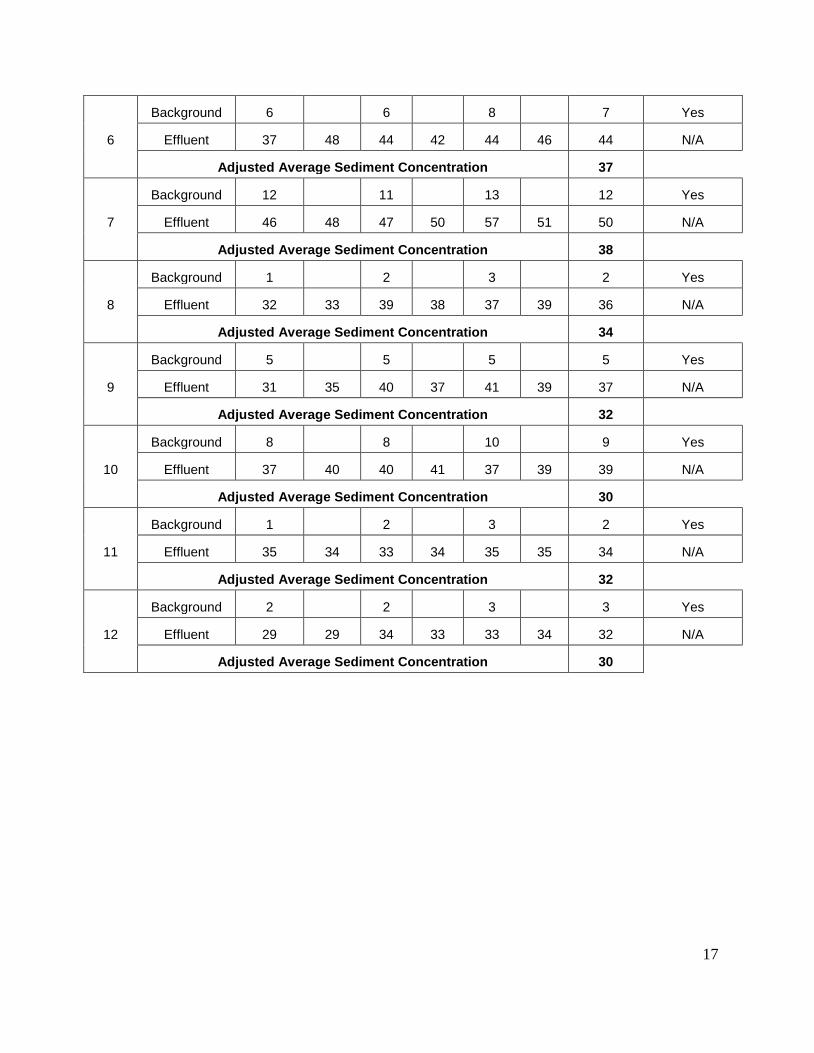
Table 7 Adjusted Effluent Concentrations ....................................................................16
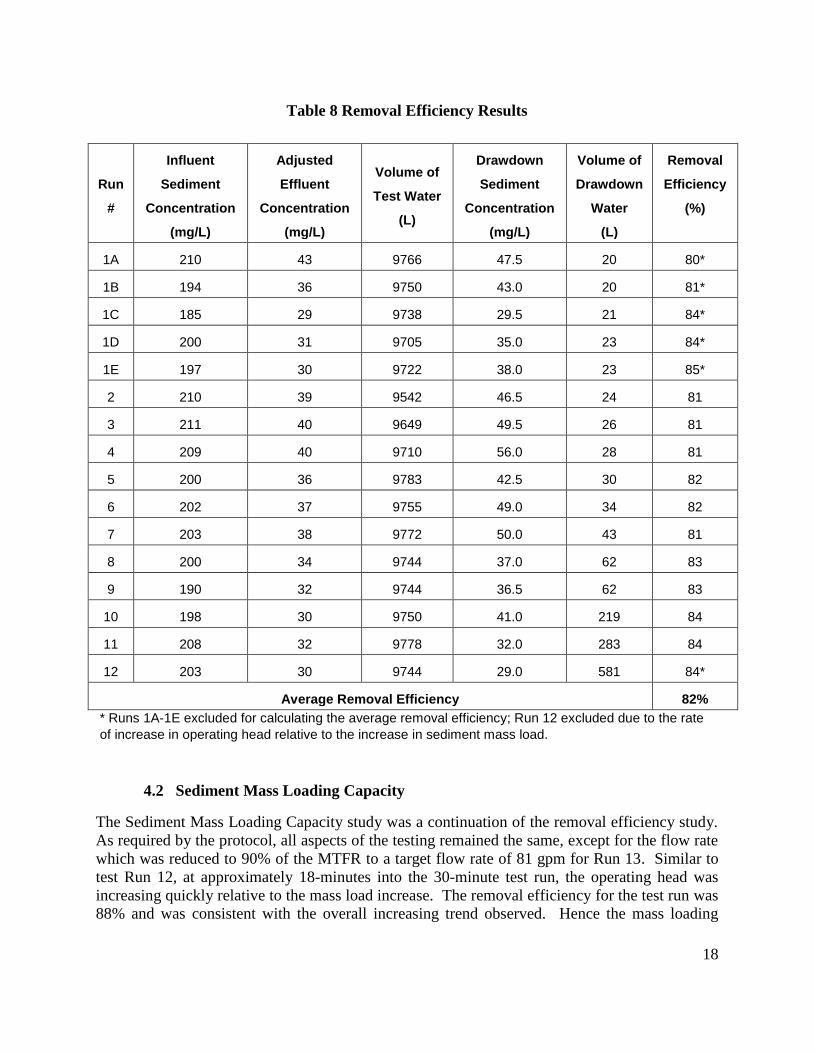
Table 8 Removal Efficiency Results ............................................................................ 18
Table 9 Sediment Mass Loading Capacity Summary ...................................................20
Table A-1 Up-Flo® Filter Design Specifications ............................................................. 34
Table A-2 Up-Flo® Filter Configurations and NJDEP Sizing Table ............................... 34
1
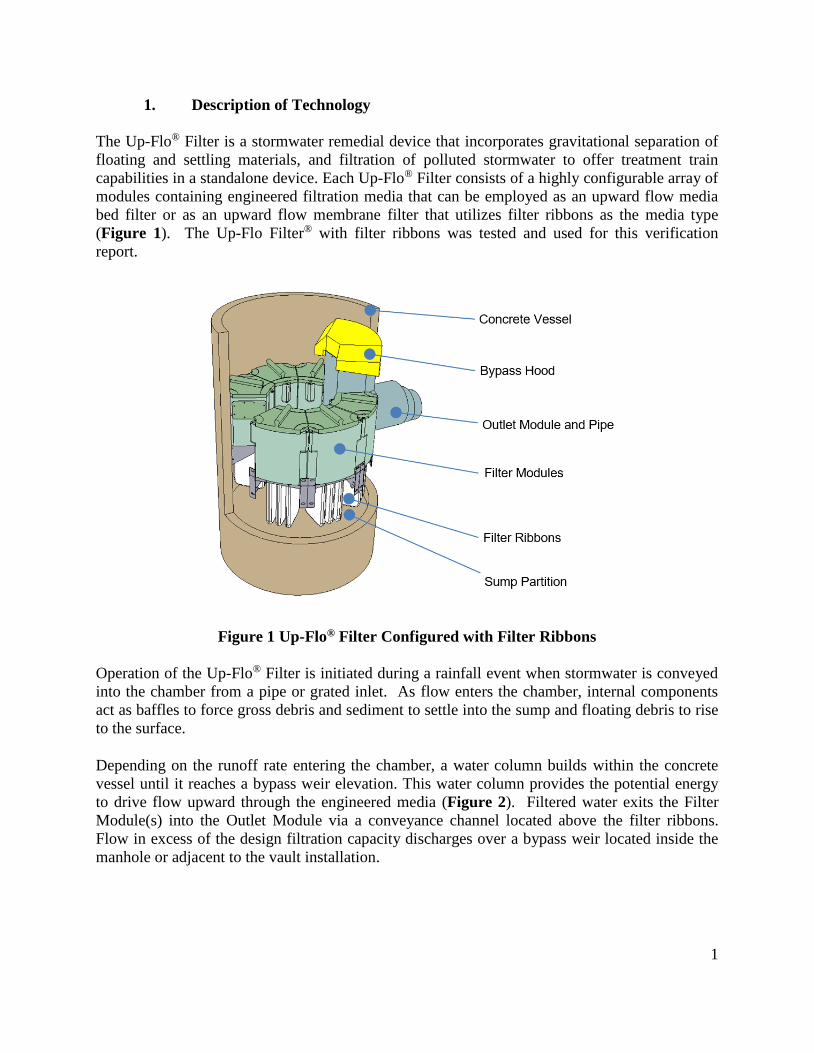
1. Description of Technology
The Up-Flo® Filter is a stormwater remedial device that incorporates gravitational separation of
floating and settling materials, and filtration of polluted stormwater to offer treatment train
capabilities in a standalone device. Each Up-Flo® Filter consists of a highly configurable array of
modules containing engineered filtration media that can be employed as an upward flow media
bed filter or as an upward flow membrane filter that utilizes filter ribbons as the media type
(Figure 1). The Up-Flo Filter® with filter ribbons was tested and used for this verification
report.
Figure 1 Up-Flo® Filter Configured with Filter Ribbons
Operation of the Up-Flo® Filter is initiated during a rainfall event when stormwater is conveyed
into the chamber from a pipe or grated inlet. As flow enters the chamber, internal components
act as baffles to force gross debris and sediment to settle into the sump and floating debris to rise
to the surface.
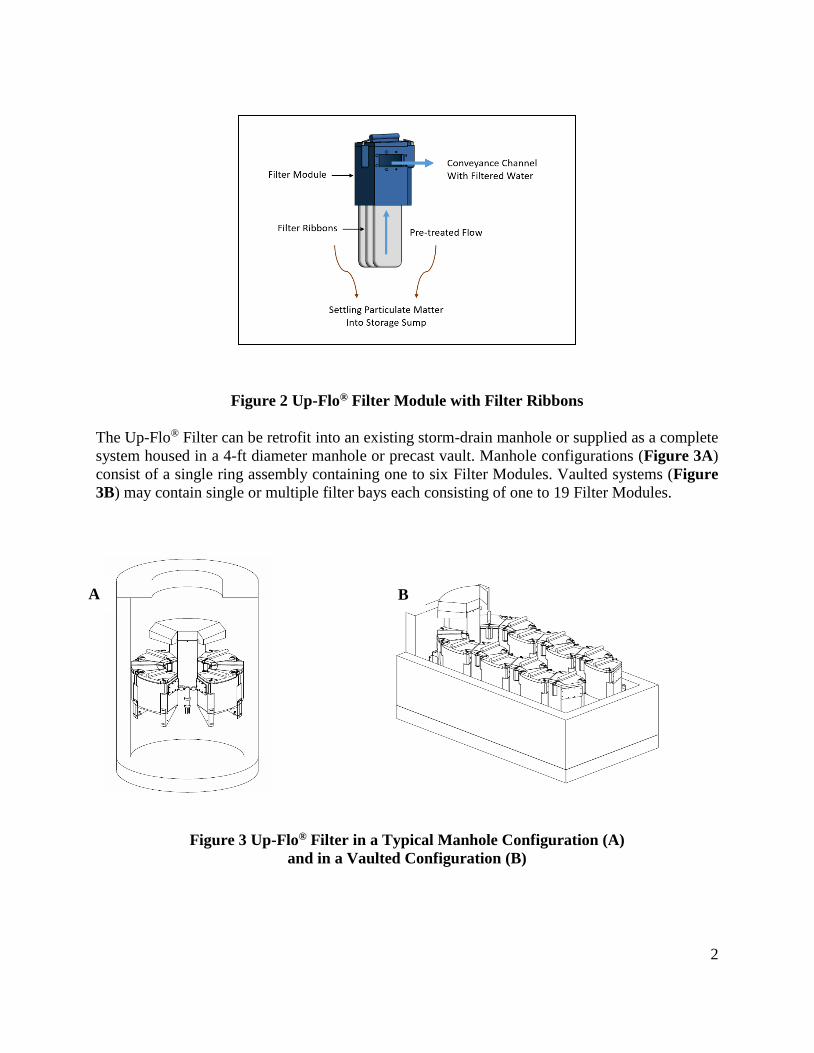
Depending on the runoff rate entering the chamber, a water column builds within the concrete
vessel until it reaches a bypass weir elevation. This water column provides the potential energy
to drive flow upward through the engineered media (Figure 2). Filtered water exits the Filter
Module(s) into the Outlet Module via a conveyance channel located above the filter ribbons.
Flow in excess of the design filtration capacity discharges over a bypass weir located inside the
manhole or adjacent to the vault installation.
2
Figure 2 Up-Flo® Filter Module with Filter Ribbons
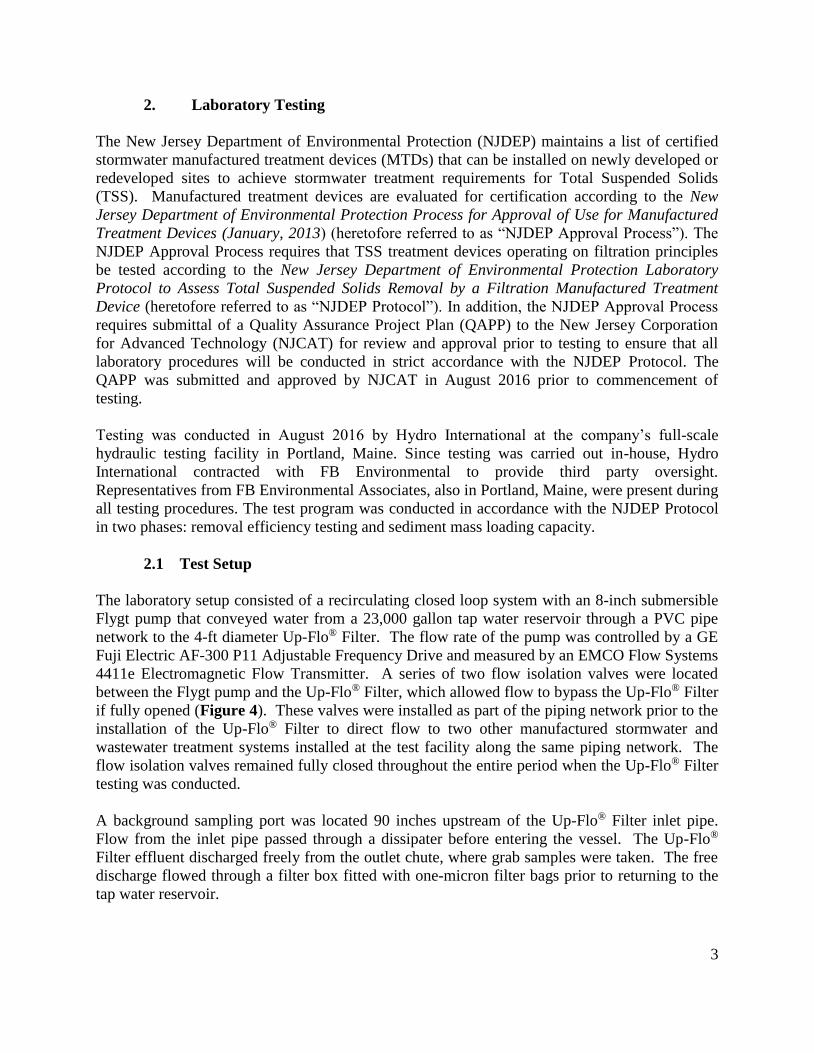
The Up-Flo® Filter can be retrofit into an existing storm-drain manhole or supplied as a complete
system housed in a 4-ft diameter manhole or precast vault. Manhole configurations (Figure 3A)
consist of a single ring assembly containing one to six Filter Modules. Vaulted systems (Figure
3B) may contain single or multiple filter bays each consisting of one to 19 Filter Modules.
Figure 3 Up-Flo® Filter in a Typical Manhole Configuration (A)
and in a Vaulted Configuration (B)
A B
3
2. Laboratory Testing
The New Jersey Department of Environmental Protection (NJDEP) maintains a list of certified
stormwater manufactured treatment devices (MTDs) that can be installed on newly developed or
redeveloped sites to achieve stormwater treatment requirements for Total Suspended Solids
(TSS). Manufactured treatment devices are evaluated for certification according to the New
Jersey Department of Environmental Protection Process for Approval of Use for Manufactured
Treatment Devices (January, 2013) (heretofore referred to as “NJDEP Approval Process”). The
NJDEP Approval Process requires that TSS treatment devices operating on filtration principles
be tested according to the New Jersey Department of Environmental Protection Laboratory
Protocol to Assess Total Suspended Solids Removal by a Filtration Manufactured Treatment
Device (heretofore referred to as “NJDEP Protocol”). In addition, the NJDEP Approval Process
requires submittal of a Quality Assurance Project Plan (QAPP) to the New Jersey Corporation
for Advanced Technology (NJCAT) for review and approval prior to testing to ensure that all
laboratory procedures will be conducted in strict accordance with the NJDEP Protocol. The
QAPP was submitted and approved by NJCAT in August 2016 prior to commencement of
testing.
Testing was conducted in August 2016 by Hydro International at the company’s full-scale
hydraulic testing facility in Portland, Maine. Since testing was carried out in-house, Hydro
International contracted with FB Environmental to provide third party oversight.
Representatives from FB Environmental Associates, also in Portland, Maine, were present during
all testing procedures. The test program was conducted in accordance with the NJDEP Protocol
in two phases: removal efficiency testing and sediment mass loading capacity.
2.1 Test Setup
The laboratory setup consisted of a recirculating closed loop system with an 8-inch submersible
Flygt pump that conveyed water from a 23,000 gallon tap water reservoir through a PVC pipe
network to the 4-ft diameter Up-Flo® Filter. The flow rate of the pump was controlled by a GE
Fuji Electric AF-300 P11 Adjustable Frequency Drive and measured by an EMCO Flow Systems
4411e Electromagnetic Flow Transmitter. A series of two flow isolation valves were located
between the Flygt pump and the Up-Flo® Filter, which allowed flow to bypass the Up-Flo® Filter
if fully opened (Figure 4). These valves were installed as part of the piping network prior to the
installation of the Up-Flo® Filter to direct flow to two other manufactured stormwater and
wastewater treatment systems installed at the test facility along the same piping network. The
flow isolation valves remained fully closed throughout the entire period when the Up-Flo® Filter
testing was conducted.
A background sampling port was located 90 inches upstream of the Up-Flo® Filter inlet pipe.
Flow from the inlet pipe passed through a dissipater before entering the vessel. The Up-Flo®
Filter effluent discharged freely from the outlet chute, where grab samples were taken. The free
discharge flowed through a filter box fitted with one-micron filter bags prior to returning to the
tap water reservoir.
4
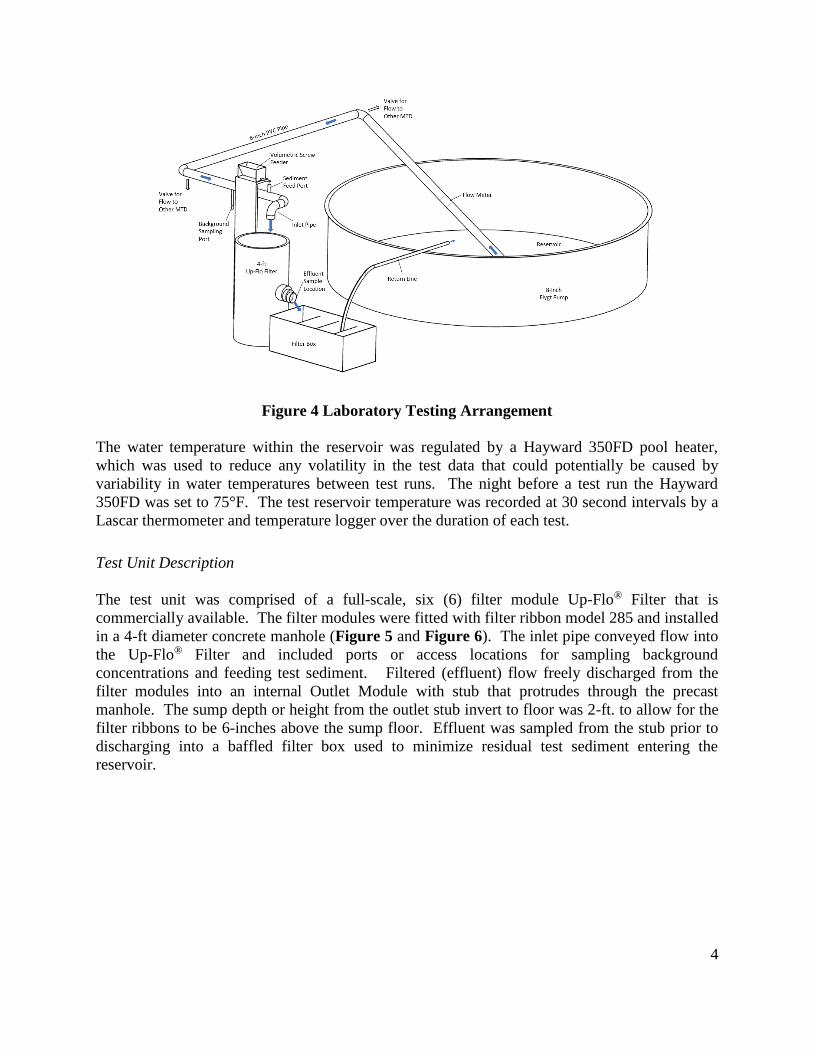
Figure 4 Laboratory Testing Arrangement
The water temperature within the reservoir was regulated by a Hayward 350FD pool heater,
which was used to reduce any volatility in the test data that could potentially be caused by
variability in water temperatures between test runs. The night before a test run the Hayward
350FD was set to 75°F. The test reservoir temperature was recorded at 30 second intervals by a
Lascar thermometer and temperature logger over the duration of each test.
Test Unit Description
The test unit was comprised of a full-scale, six (6) filter module Up-Flo® Filter that is
commercially available. The filter modules were fitted with filter ribbon model 285 and installed
in a 4-ft diameter concrete manhole (Figure 5 and Figure 6). The inlet pipe conveyed flow into
the Up-Flo® Filter and included ports or access locations for sampling background
concentrations and feeding test sediment. Filtered (effluent) flow freely discharged from the
filter modules into an internal Outlet Module with stub that protrudes through the precast
manhole. The sump depth or height from the outlet stub invert to floor was 2-ft. to allow for the
filter ribbons to be 6-inches above the sump floor. Effluent was sampled from the stub prior to
discharging into a baffled filter box used to minimize residual test sediment entering the
reservoir.
5
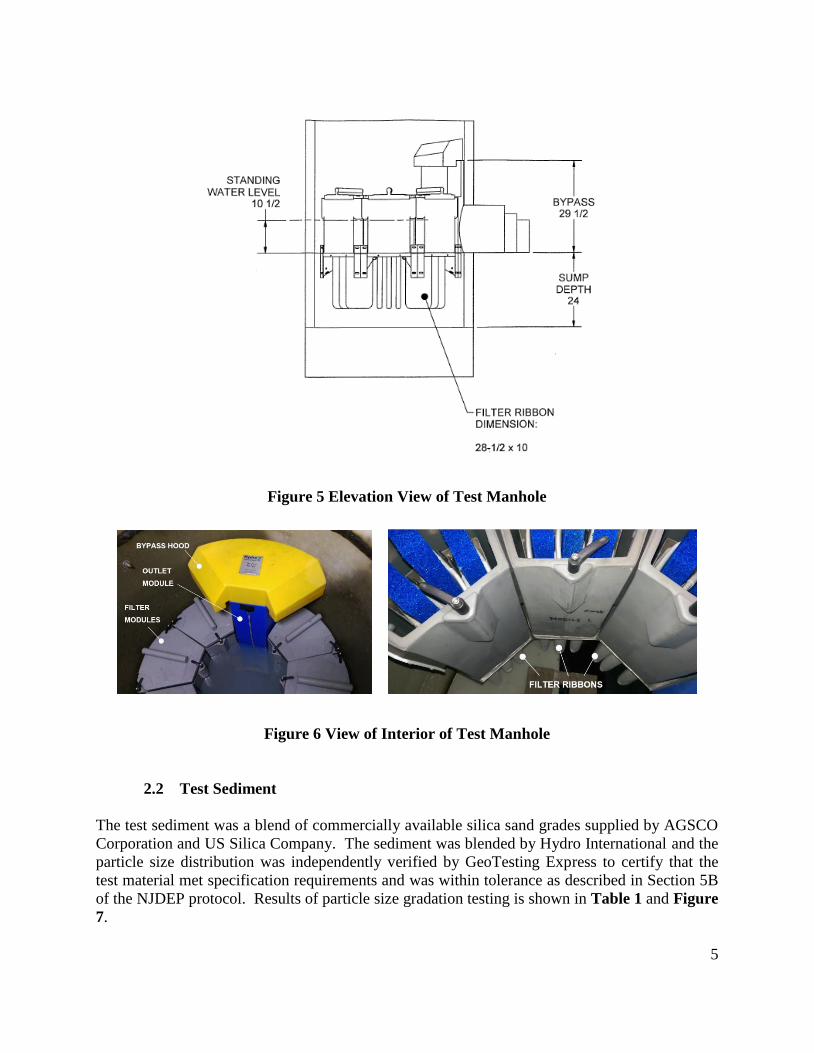
Figure 5 Elevation View of Test Manhole
Figure 6 View of Interior of Test Manhole
2.2 Test Sediment
The test sediment was a blend of commercially available silica sand grades supplied by AGSCO
Corporation and US Silica Company. The sediment was blended by Hydro International and the
particle size distribution was independently verified by GeoTesting Express to certify that the
test material met specification requirements and was within tolerance as described in Section 5B
of the NJDEP protocol. Results of particle size gradation testing is shown in Table 1 and Figure
7.
6
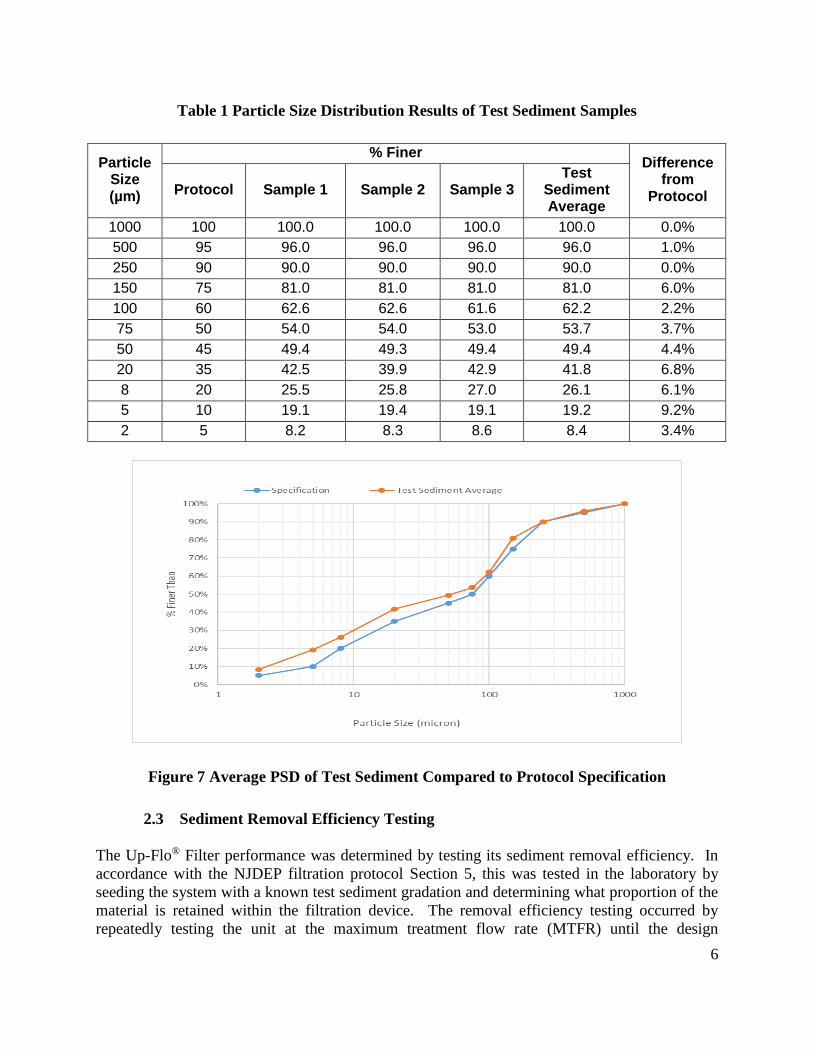
Table 1 Particle Size Distribution Results of Test Sediment Samples
Particle Size (µm)
% Finer Difference
from Protocol Protocol Sample 1 Sample 2 Sample 3
Test Sediment Average
1000 100 100.0 100.0 100.0 100.0 0.0%
500 95 96.0 96.0 96.0 96.0 1.0%
250 90 90.0 90.0 90.0 90.0 0.0%
150 75 81.0 81.0 81.0 81.0 6.0%
100 60 62.6 62.6 61.6 62.2 2.2%
75 50 54.0 54.0 53.0 53.7 3.7%
50 45 49.4 49.3 49.4 49.4 4.4%
20 35 42.5 39.9 42.9 41.8 6.8%
8 20 25.5 25.8 27.0 26.1 6.1%
5 10 19.1 19.4 19.1 19.2 9.2%
2 5 8.2 8.3 8.6 8.4 3.4%
Figure 7 Average PSD of Test Sediment Compared to Protocol Specification
2.3 Sediment Removal Efficiency Testing
The Up-Flo® Filter performance was determined by testing its sediment removal efficiency. In
accordance with the NJDEP filtration protocol Section 5, this was tested in the laboratory by
seeding the system with a known test sediment gradation and determining what proportion of the
material is retained within the filtration device. The removal efficiency testing occurred by
repeatedly testing the unit at the maximum treatment flow rate (MTFR) until the design
7
operating head was reached, which was determined from the sediment mass load tests.
Background samples were taken at the background sample port located upstream of the Up-Flo®
Filter test setup. Influent background samples were taken in correspondence with the odd
numbered effluent samples (first, third, and fifth). The time each background and effluent
sample was collected was recorded. The background data was used to adjust the effluent
samples for background concentration.
The test sediment feed rate and total mass of test sediment introduced during each test run was a
known quantity and was introduced at a rate within 10% of the targeted value of 200 mg/L
influent concentration. Test sediment was injected using an Auger Feeder Model VF-2
volumetric screw feeder providing a consistent, calibrated concentration of solids. The sediment
injection port was located at the crown of the 8-inch influent pipe, 40 inches from the test vessel.
Three calibration samples were taken from the injection point at the start, middle and just prior to
the conclusion of dosing during each test. Each sample was collected in a clean one-liter
container over an interval timed to the nearest second. Each sample was a minimum of 0.1 liters
or the collection interval did not exceed one minute, whichever came first. Samples were
weighed to the nearest milligram and the concentration coefficient of variance (COV) did not
exceed 0.10.
A flow meter was located upstream of the MTD. The flow meter data logger recorded flows at a
minimum of once per minute and the average flow rate was reported. Water levels were read
from a pressure tap installed below the outlet invert. Head readings were taken at five minute
intervals to the nearest 1/8 inch with a measuring rule.
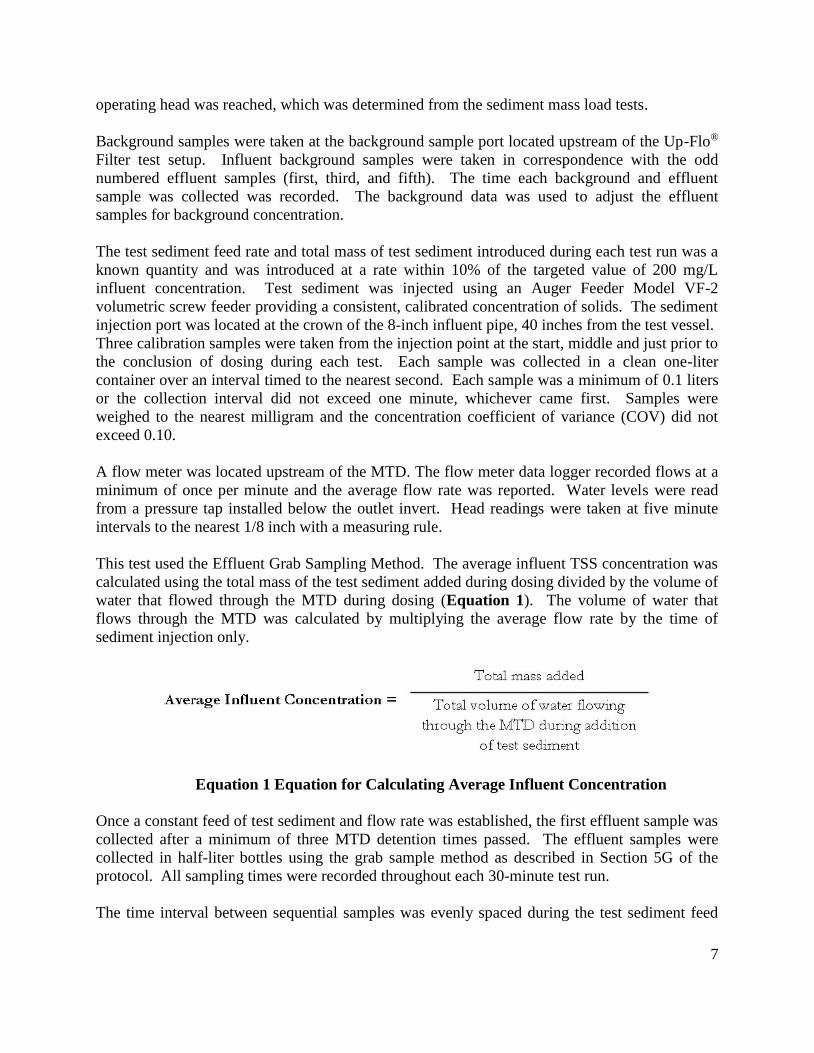
This test used the Effluent Grab Sampling Method. The average influent TSS concentration was
calculated using the total mass of the test sediment added during dosing divided by the volume of
water that flowed through the MTD during dosing (Equation 1). The volume of water that
flows through the MTD was calculated by multiplying the average flow rate by the time of
sediment injection only.
Equation 1 Equation for Calculating Average Influent Concentration
Once a constant feed of test sediment and flow rate was established, the first effluent sample was
collected after a minimum of three MTD detention times passed. The effluent samples were
collected in half-liter bottles using the grab sample method as described in Section 5G of the
protocol. All sampling times were recorded throughout each 30-minute test run.
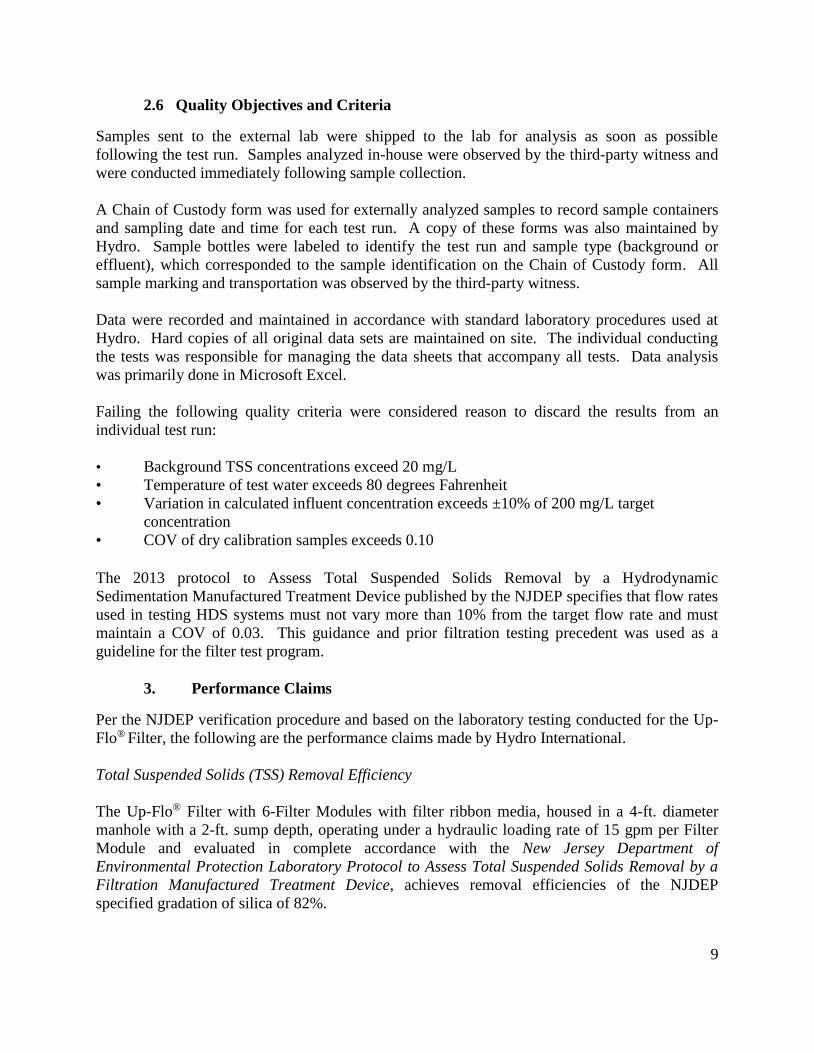
The time interval between sequential samples was evenly spaced during the test sediment feed
8
period to achieve six samples. However, if the test sediment feed was interrupted for
measurement, the next effluent sample was collected following a minimum of three MTD
detention times. An example time table is given in Table 2. The six effluent samples were taken
from the free discharge point of the Up-Flo® Filter outlet. The time interval between effluent
samples did not exceed 15 minutes. The drawdown volume was sampled at two equally spaced
volumes (Table 2 – “1/3 and 2/3 empty”) as the head fell from the final operating head to the
system’s static water level.
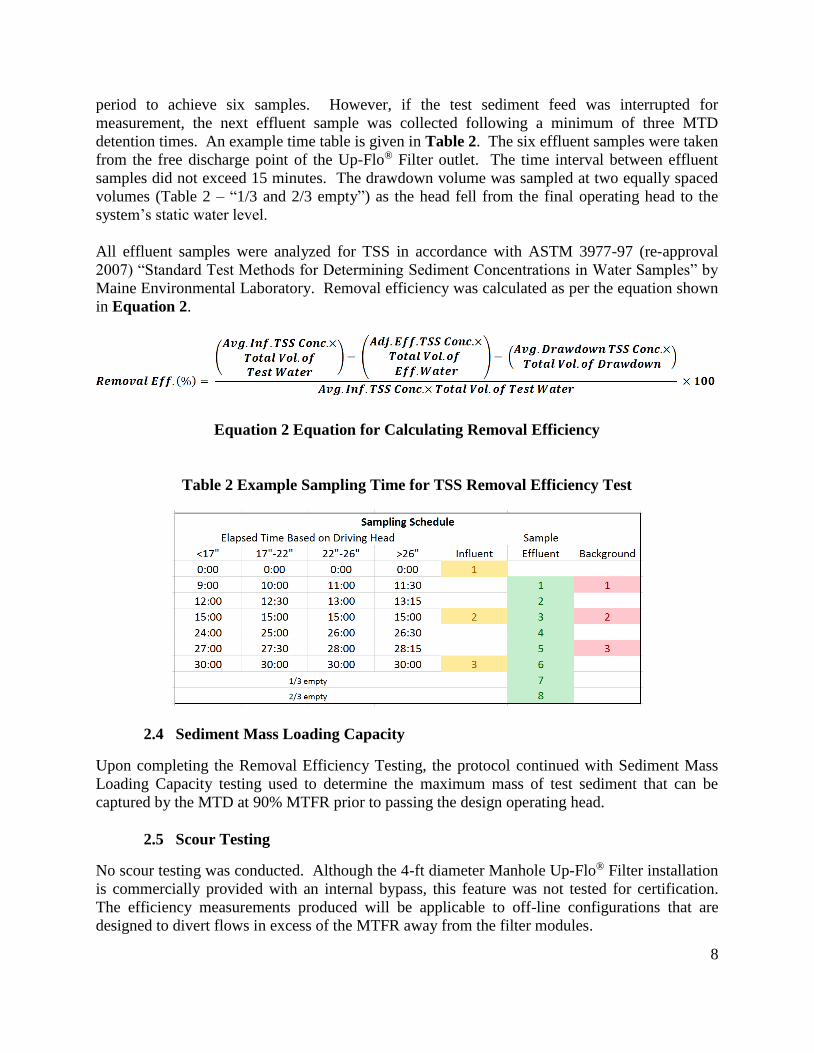
All effluent samples were analyzed for TSS in accordance with ASTM 3977-97 (re-approval
2007) “Standard Test Methods for Determining Sediment Concentrations in Water Samples” by
Maine Environmental Laboratory. Removal efficiency was calculated as per the equation shown
in Equation 2.
Equation 2 Equation for Calculating Removal Efficiency
Table 2 Example Sampling Time for TSS Removal Efficiency Test
2.4 Sediment Mass Loading Capacity
Upon completing the Removal Efficiency Testing, the protocol continued with Sediment Mass
Loading Capacity testing used to determine the maximum mass of test sediment that can be
captured by the MTD at 90% MTFR prior to passing the design operating head.
2.5 Scour Testing
No scour testing was conducted. Although the 4-ft diameter Manhole Up-Flo® Filter installation
is commercially provided with an internal bypass, this feature was not tested for certification.
The efficiency measurements produced will be applicable to off-line configurations that are
designed to divert flows in excess of the MTFR away from the filter modules.
9
2.6 Quality Objectives and Criteria
Samples sent to the external lab were shipped to the lab for analysis as soon as possible
following the test run. Samples analyzed in-house were observed by the third-party witness and
were conducted immediately following sample collection.
A Chain of Custody form was used for externally analyzed samples to record sample containers
and sampling date and time for each test run. A copy of these forms was also maintained by
Hydro. Sample bottles were labeled to identify the test run and sample type (background or
effluent), which corresponded to the sample identification on the Chain of Custody form. All
sample marking and transportation was observed by the third-party witness.
Data were recorded and maintained in accordance with standard laboratory procedures used at
Hydro. Hard copies of all original data sets are maintained on site. The individual conducting
the tests was responsible for managing the data sheets that accompany all tests. Data analysis
was primarily done in Microsoft Excel.
Failing the following quality criteria were considered reason to discard the results from an
individual test run:
• Background TSS concentrations exceed 20 mg/L
• Temperature of test water exceeds 80 degrees Fahrenheit
• Variation in calculated influent concentration exceeds ±10% of 200 mg/L target
concentration
• COV of dry calibration samples exceeds 0.10
The 2013 protocol to Assess Total Suspended Solids Removal by a Hydrodynamic
Sedimentation Manufactured Treatment Device published by the NJDEP specifies that flow rates
used in testing HDS systems must not vary more than 10% from the target flow rate and must
maintain a COV of 0.03. This guidance and prior filtration testing precedent was used as a
guideline for the filter test program.
3. Performance Claims
Per the NJDEP verification procedure and based on the laboratory testing conducted for the Up-
Flo® Filter, the following are the performance claims made by Hydro International.
Total Suspended Solids (TSS) Removal Efficiency
The Up-Flo® Filter with 6-Filter Modules with filter ribbon media, housed in a 4-ft. diameter
manhole with a 2-ft. sump depth, operating under a hydraulic loading rate of 15 gpm per Filter
Module and evaluated in complete accordance with the New Jersey Department of
Environmental Protection Laboratory Protocol to Assess Total Suspended Solids Removal by a
Filtration Manufactured Treatment Device, achieves removal efficiencies of the NJDEP
specified gradation of silica of 82%.
10
Maximum Treatment Flow Rate (MTFR)
The 4-ft. diameter, 6 Filter Module Up-Flo® Filter system tested with ribbon model 285R has an
MTFR of 90 gpm or 15 gpm per module. Table A-1 includes the design specifications for the
tested filter ribbon model.
Maximum Sediment Storage Depth and Volume
The maximum sediment storage depth for the Up-Flo® Filter is 6 in. This corresponds to a
volume of 6.3 cu. ft. for the 4-ft. diameter Up-Flo® Filter configuration tested.
Wet Volume and Detention Time
The Wet Volume is defined as the sump and wet influent piping of a filtration MTD. The
resulting Wet Volume of the tested Up-Flo® Filter is 234 gallons (31.3 cu. ft.). This corresponds
to 5.17 cu. ft. of wet volume per module and a detention time of 156 seconds at the MTFR.
Effective Sedimentation Area
The effective sedimentation area is the surface area of a 4-ft manhole and equates to 12.57 sq. ft.
Effective Filtration Area
Each filter ribbon model 285R installed in a Filter Module is 28.5-inches long and 10-inches
wide and can accept flow from both sides. There are three filter ribbons per module. This
equates to 11.87 sq.-ft per Filter Module and 71.22 sq.-ft for the eighteen ribbons installed in the
test set up.
Minimum Sedimentation Area
As tested, the minimum sedimentation area for filter ribbon model 285R is 12.57 sq.-ft of
sedimentation area per 71.22 sq.-ft of filter ribbon or 0.176 sq.-ft sedimentation area per filter
ribbon area.
Sediment Mass Load Capacity
Considering the change in operating head relative to the sediment mass captured, the 6 Filter
Module Up-Flo® Filter with filter ribbon 285R has a mass loading capacity of 50 lbs.
Maximum Allowable Inflow Drainage Area
To ensure the drainage area and expected annual sediment load does not cause higher than
intended bypass flows, the sediment mass capture capacity of 50 pounds of sediment (8.33
pounds per module) is used to limit the treatable drainage area per module. Given the protocol
11
requirements for “Maximum Allowable Inflow Drainage Area”, the Up-Flo® Filter with filter
ribbon 285R can effectively treat 0.014 acres per module at 600 lbs per acre of drainage area
annually.
4. Supporting Documentation
The NJDEP Procedure (NJDEP, 2013a) for obtaining verification of a stormwater manufactured
treatment device (MTD) from the New Jersey Corporation for Advanced Technology (NJCAT)
requires that “copies of the laboratory test reports, including all collected and measured data; all
data from performance evaluation test runs; spreadsheets containing original data from all
performance test runs; all pertinent calculations; etc.” be included in this section. This was
discussed with NJDEP and it was agreed that as long as such documentation could be made
available by NJCAT upon request that it would not be prudent or necessary to include all this
information in this verification report. This information was provided to NJCAT and is available
upon request.
4.1 Removal Efficiency Testing
During initial testing, twelve (12) removal efficiency testing runs were completed in accordance
with the NJDEP filter protocol. The target flow rate and influent sediment concentration were 90
gpm (with a COV< 0.03) and 200 mg/L ± 10% (with a COV< 0.10) respectively.
Run 1 could not be used since its influent concentration exceeded the target sediment
concentration and the flow rate COV was 0.04. Since the first test run was not in compliance and
raised questions about its effect on subsequent removal efficiency and mass loading capacity test
results, another five test runs (1A, 1B, 1C, 1D, and 1E) were completed after the initial twelve.
The results from runs 2-11 were used to calculate the average removal efficiency of the 6 Filter
Module Up-Flo® Filter. The second set of five test runs was used to assess if the large mass
added in the first test run materially influenced the results.
Run 12 was excluded from the average efficiency removal calculation since the increase rate in
head was high relative to the increase rate in mass load within 19-minutes into the test or with
about 10 minutes remaining in the test. The test was not stopped and continued at 100% MTFR.
The actual peak water elevation for Run 12 was 36-inches.
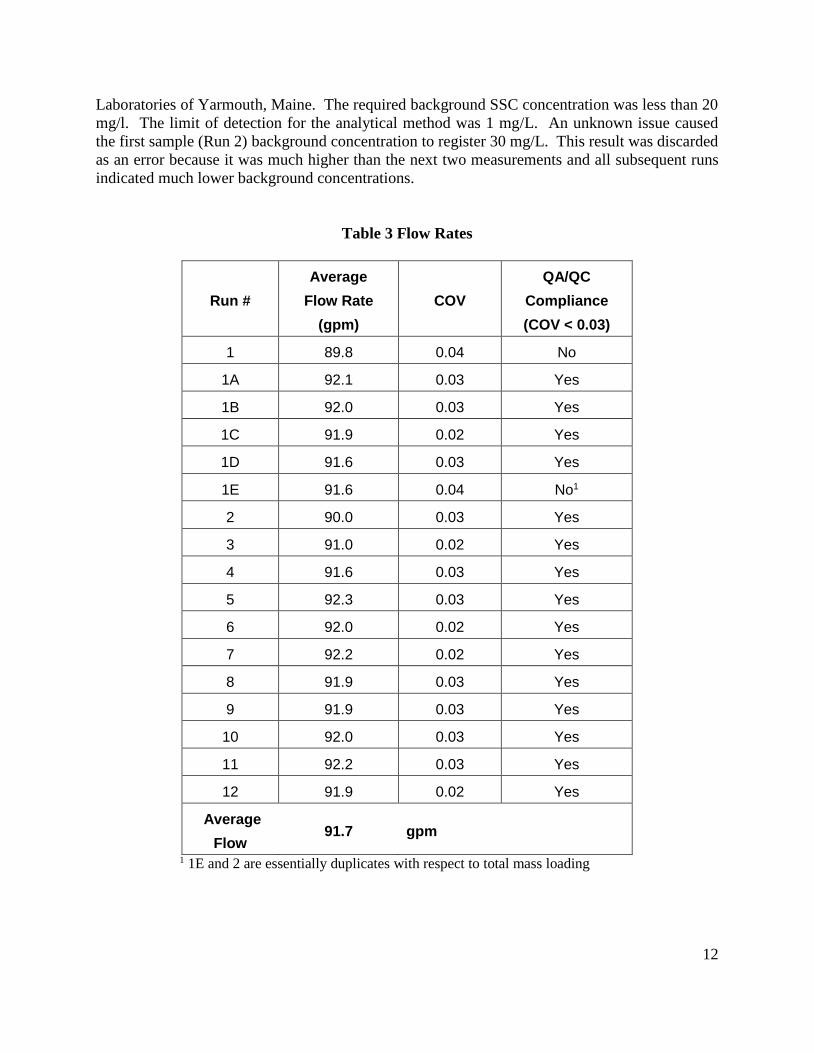
The electromagnetic flow meter and data logger took a reading every thirty seconds. The flow
rate data has been summarized in Table 3 including the compliance to the QA/QC acceptance
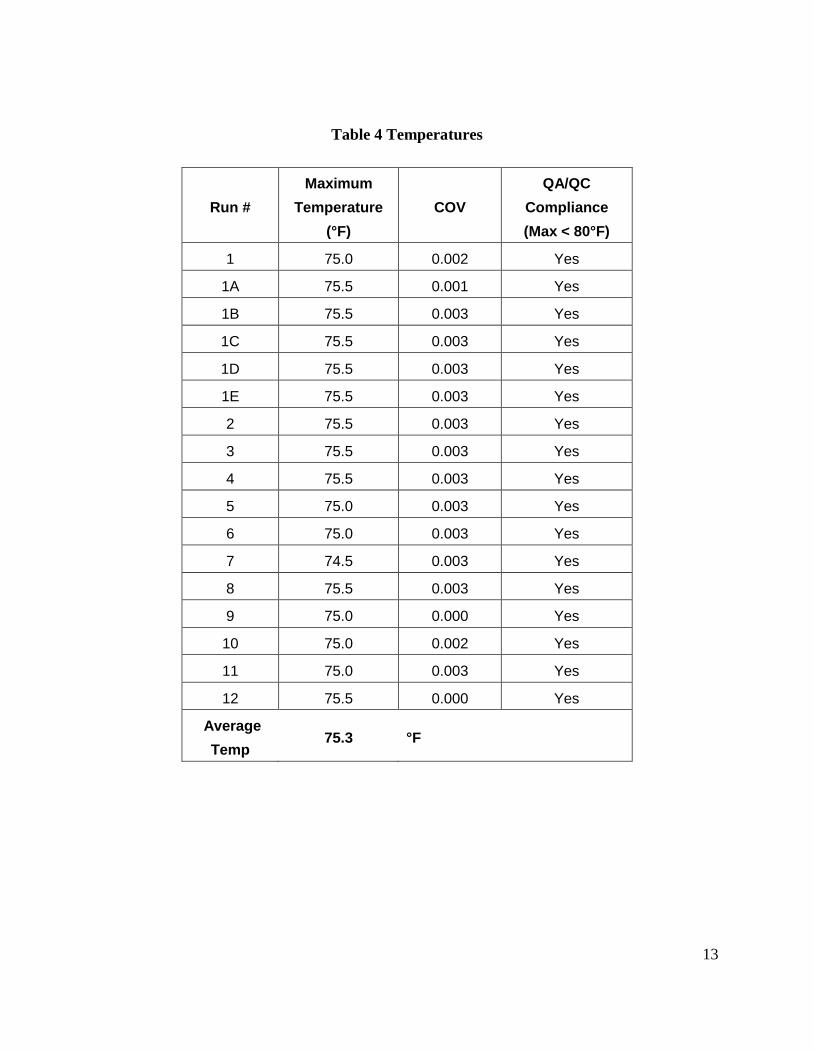
criteria. The average flow rate for all removal efficiency runs was 91.6 gpm. The temperature
data are summarized in Table 4.
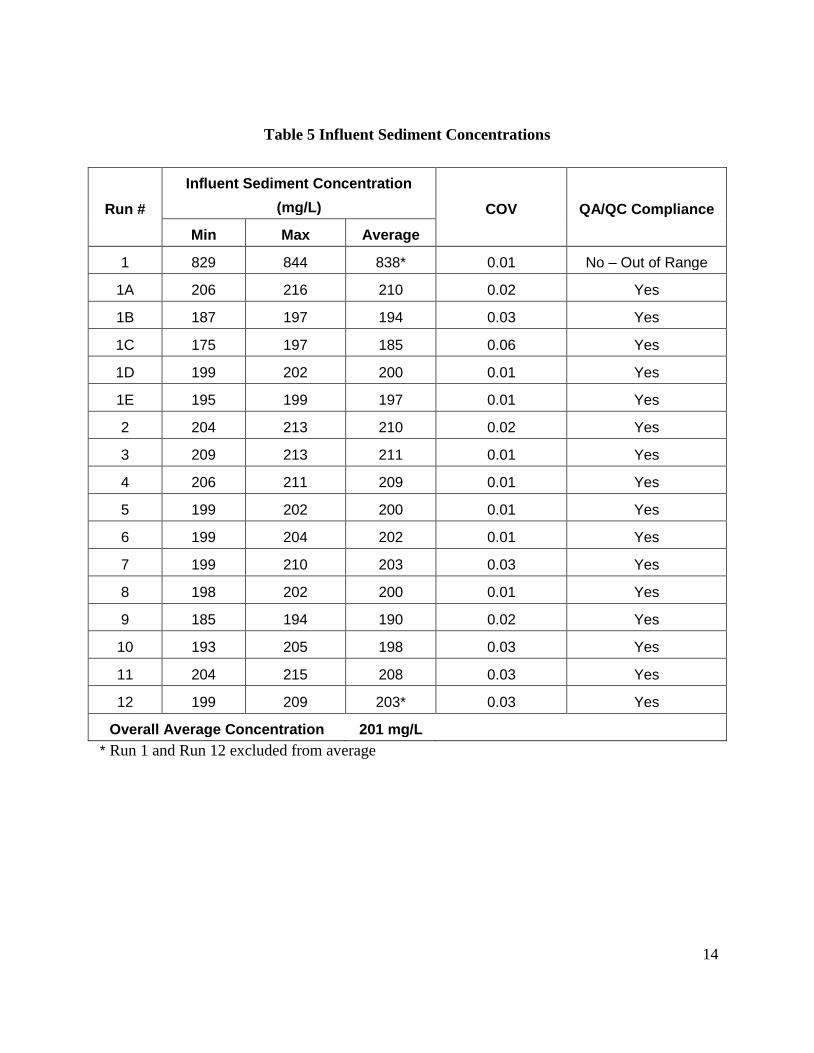
Influent Sediment Concentrations are summarized in Table 5, Background Sediment
Concentrations are summarized in Table 6, and Adjusted Effluent Concentrations are
summarized in Table 7, along with compliance to NJDEP protocol QA/QC criteria.
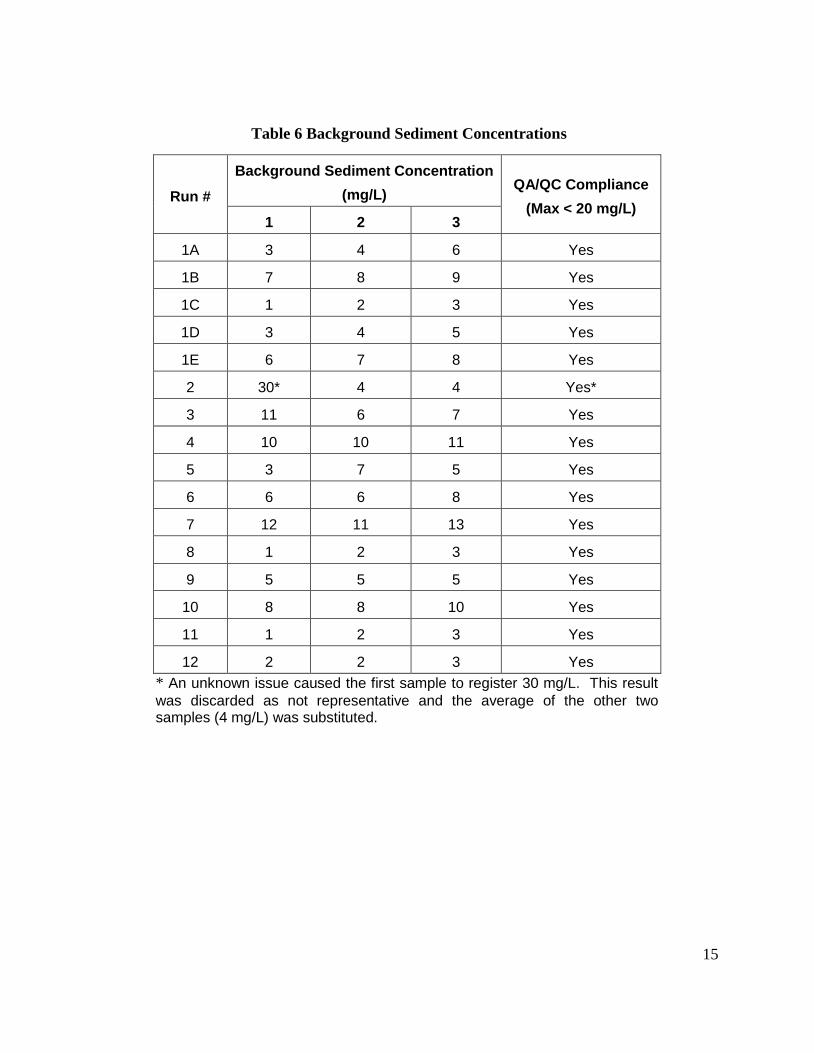
All the effluent and background samples for SSC were analyzed by Maine Environmental
12
Laboratories of Yarmouth, Maine. The required background SSC concentration was less than 20
mg/l. The limit of detection for the analytical method was 1 mg/L. An unknown issue caused
the first sample (Run 2) background concentration to register 30 mg/L. This result was discarded
as an error because it was much higher than the next two measurements and all subsequent runs
indicated much lower background concentrations.
Table 3 Flow Rates
Run #
Average
Flow Rate
(gpm)
COV
QA/QC
Compliance
(COV < 0.03)
1 89.8 0.04 No
1A 92.1 0.03 Yes
1B 92.0 0.03 Yes
1C 91.9 0.02 Yes
1D 91.6 0.03 Yes
1E 91.6 0.04 No1
2 90.0 0.03 Yes
3 91.0 0.02 Yes
4 91.6 0.03 Yes
5 92.3 0.03 Yes
6 92.0 0.02 Yes
7 92.2 0.02 Yes
8 91.9 0.03 Yes
9 91.9 0.03 Yes
10 92.0 0.03 Yes
11 92.2 0.03 Yes
12 91.9 0.02 Yes
Average
Flow 91.7 gpm
1 1E and 2 are essentially duplicates with respect to total mass loading
13
Table 4 Temperatures
Run #
Maximum
Temperature
(°F)
COV
QA/QC
Compliance
(Max < 80°F)
1 75.0 0.002 Yes
1A 75.5 0.001 Yes
1B 75.5 0.003 Yes
1C 75.5 0.003 Yes
1D 75.5 0.003 Yes
1E 75.5 0.003 Yes
2 75.5 0.003 Yes
3 75.5 0.003 Yes
4 75.5 0.003 Yes
5 75.0 0.003 Yes
6 75.0 0.003 Yes
7 74.5 0.003 Yes
8 75.5 0.003 Yes
9 75.0 0.000 Yes
10 75.0 0.002 Yes
11 75.0 0.003 Yes
12 75.5 0.000 Yes
Average
Temp 75.3 °F
14
Table 5 Influent Sediment Concentrations
Run #
Influent Sediment Concentration
(mg/L) COV QA/QC Compliance
Min Max Average
1 829 844 838* 0.01 No – Out of Range
1A 206 216 210 0.02 Yes
1B 187 197 194 0.03 Yes
1C 175 197 185 0.06 Yes
1D 199 202 200 0.01 Yes
1E 195 199 197 0.01 Yes
2 204 213 210 0.02 Yes
3 209 213 211 0.01 Yes
4 206 211 209 0.01 Yes
5 199 202 200 0.01 Yes
6 199 204 202 0.01 Yes
7 199 210 203 0.03 Yes
8 198 202 200 0.01 Yes
9 185 194 190 0.02 Yes
10 193 205 198 0.03 Yes
11 204 215 208 0.03 Yes
12 199 209 203* 0.03 Yes
Overall Average Concentration 201 mg/L
* Run 1 and Run 12 excluded from average
15
Table 6 Background Sediment Concentrations
Run #
Background Sediment Concentration
(mg/L) QA/QC Compliance
(Max < 20 mg/L) 1 2 3
1A 3 4 6 Yes
1B 7 8 9 Yes
1C 1 2 3 Yes
1D 3 4 5 Yes
1E 6 7 8 Yes
2 30* 4 4 Yes*
3 11 6 7 Yes
4 10 10 11 Yes
5 3 7 5 Yes
6 6 6 8 Yes
7 12 11 13 Yes
8 1 2 3 Yes
9 5 5 5 Yes
10 8 8 10 Yes
11 1 2 3 Yes
12 2 2 3 Yes
* An unknown issue caused the first sample to register 30 mg/L. This result
was discarded as not representative and the average of the other two samples (4 mg/L) was substituted.
16
Table 7 Adjusted Effluent Concentrations
Run # Suspended Sediment Concentration (mg/L) QA/QC
Compliance Effluent # 1 2 3 4 5 6 Average
1A
Background 3 4 6 4 Yes
Effluent 42 43 45 48 51 55 47 N/A
Adjusted Average Sediment Concentration 43
1B
Background 7 8 9 8 Yes
Effluent 38 44 47 47 45 43 44 N/A
Adjusted Average Sediment Concentration 36
1C
Background 1 2 3 2 Yes
Effluent 29 33 31 32 31 29 31 N/A
Adjusted Average Sediment Concentration 29
1D
Background 3 4 5 4 Yes
Effluent 32 34 38 33 36 34 35 N/A
Adjusted Average Sediment Concentration 31
1E
Background 6 7 8 7 Yes
Effluent 35 37 39 38 35 40 37 N/A
Adjusted Average Sediment Concentration 30
2
Background 30* 4 4 4 Yes
Effluent 44 42 44 42 41 46 43 N/A
Adjusted Average Sediment Concentration 39
3
Background 11 6 7 8 Yes
Effluent 43 47 47 47 50 51 48 N/A
Adjusted Average Sediment Concentration 40
4
Background 10 10 11 11 Yes
Effluent 44 53 50 57 48 50 50 N/A
Adjusted Average Sediment Concentration 40
5
Background 3 7 5 5 Yes
Effluent 38 38 44 44 40 43 41 N/A
Adjusted Average Sediment Concentration 36
17
6
Background 6 6 8 7 Yes
Effluent 37 48 44 42 44 46 44 N/A
Adjusted Average Sediment Concentration 37
7
Background 12 11 13 12 Yes
Effluent 46 48 47 50 57 51 50 N/A
Adjusted Average Sediment Concentration 38
8
Background 1 2 3 2 Yes
Effluent 32 33 39 38 37 39 36 N/A
Adjusted Average Sediment Concentration 34
9
Background 5 5 5 5 Yes
Effluent 31 35 40 37 41 39 37 N/A
Adjusted Average Sediment Concentration 32
10
Background 8 8 10 9 Yes
Effluent 37 40 40 41 37 39 39 N/A
Adjusted Average Sediment Concentration 30
11
Background 1 2 3 2 Yes
Effluent 35 34 33 34 35 35 34 N/A
Adjusted Average Sediment Concentration 32
12
Background 2 2 3 3 Yes
Effluent 29 29 34 33 33 34 32 N/A
Adjusted Average Sediment Concentration 30
18
Table 8 Removal Efficiency Results
Run
#
Influent
Sediment
Concentration
(mg/L)
Adjusted
Effluent
Concentration
(mg/L)
Volume of
Test Water
(L)
Drawdown
Sediment
Concentration
(mg/L)
Volume of
Drawdown
Water
(L)
Removal
Efficiency
(%)
1A 210 43 9766 47.5 20 80*
1B 194 36 9750 43.0 20 81*
1C 185 29 9738 29.5 21 84*
1D 200 31 9705 35.0 23 84*
1E 197 30 9722 38.0 23 85*
2 210 39 9542 46.5 24 81
3 211 40 9649 49.5 26 81
4 209 40 9710 56.0 28 81
5 200 36 9783 42.5 30 82
6 202 37 9755 49.0 34 82
7 203 38 9772 50.0 43 81
8 200 34 9744 37.0 62 83
9 190 32 9744 36.5 62 83
10 198 30 9750 41.0 219 84
11 208 32 9778 32.0 283 84
12 203 30 9744 29.0 581 84*
Average Removal Efficiency 82%
* Runs 1A-1E excluded for calculating the average removal efficiency; Run 12 excluded due to the rate
of increase in operating head relative to the increase in sediment mass load.
4.2 Sediment Mass Loading Capacity
The Sediment Mass Loading Capacity study was a continuation of the removal efficiency study.
As required by the protocol, all aspects of the testing remained the same, except for the flow rate
which was reduced to 90% of the MTFR to a target flow rate of 81 gpm for Run 13. Similar to
test Run 12, at approximately 18-minutes into the 30-minute test run, the operating head was
increasing quickly relative to the mass load increase. The removal efficiency for the test run was
88% and was consistent with the overall increasing trend observed. Hence the mass loading
19
capacity was reached after Run 11. The relationship between removal efficiency and sediment
mass loading is illustrated in Figure 8 which plots data for Runs 2-11. The additional five test
runs (1A → 1E) are shown with orange data points. As shown, each of the five test runs had an
essentially even distribution of mass added. The two data sets demonstrate that 80% efficiency
and higher is achieved in both cases.
Figure 8 Sediment Mass Load Captured vs. Removal Efficiency
Since the rate of increase in the water elevation between Runs 11 and 13 was high relative to the
increase in the mass captured, Run 12 and Run 13 were not included in the sediment mass load
capacity. A summary of the Sediment Mass Loading Capacity is shown in Table 9. The total
mass load captured during test Runs 1 and 2 was 17.8 lbs compared to 17.6 lbs that was captured
during test Runs 1A-1F. The total mass captured for the 11 test runs was 50 lbs. Since the
additional test runs showed there was no influence to performance, test Runs 1A-1F were not
used to calculate to the total mass captured.
Variability in the influent mass was due to the auger speed adjustment setting. Prior to each test
run, the hopper was filled with test sand and the auger speed set for each test run, rather than
being set once for all thirteen runs. While there was variability in the influent mass load between
runs, excluding the first run, the concentration coefficient of variance (COV) did not exceed 0.10
and the influent concentration met the protocol requirements of 200 mg/L ± 10%. Given how
much higher the mass was in the first run, the first run auger speed control was not correctly set
and more attention was paid to it for the remaining test runs.
20
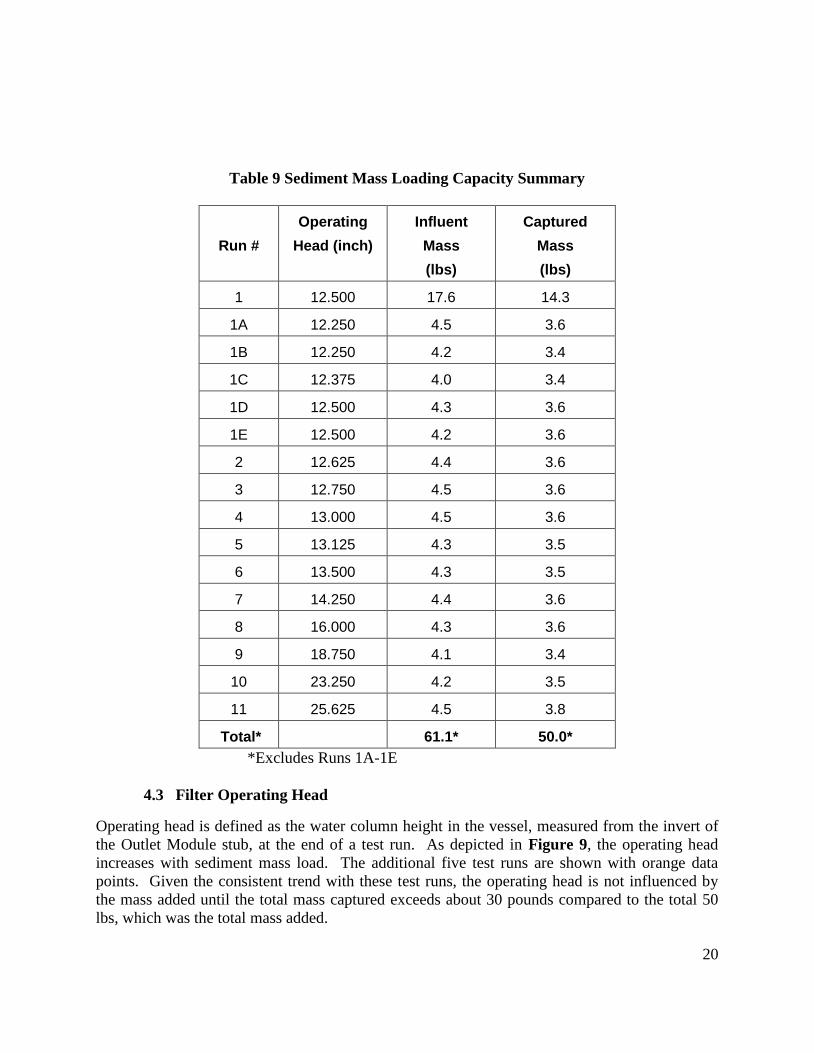
Table 9 Sediment Mass Loading Capacity Summary
Run #
Operating
Head (inch)
Influent
Mass
(lbs)
Captured
Mass
(lbs)
1 12.500 17.6 14.3
1A 12.250 4.5 3.6
1B 12.250 4.2 3.4
1C 12.375 4.0 3.4
1D 12.500 4.3 3.6
1E 12.500 4.2 3.6
2 12.625 4.4 3.6
3 12.750 4.5 3.6
4 13.000 4.5 3.6
5 13.125 4.3 3.5
6 13.500 4.3 3.5
7 14.250 4.4 3.6
8 16.000 4.3 3.6
9 18.750 4.1 3.4
10 23.250 4.2 3.5
11 25.625 4.5 3.8
Total* 61.1* 50.0*
*Excludes Runs 1A-1E
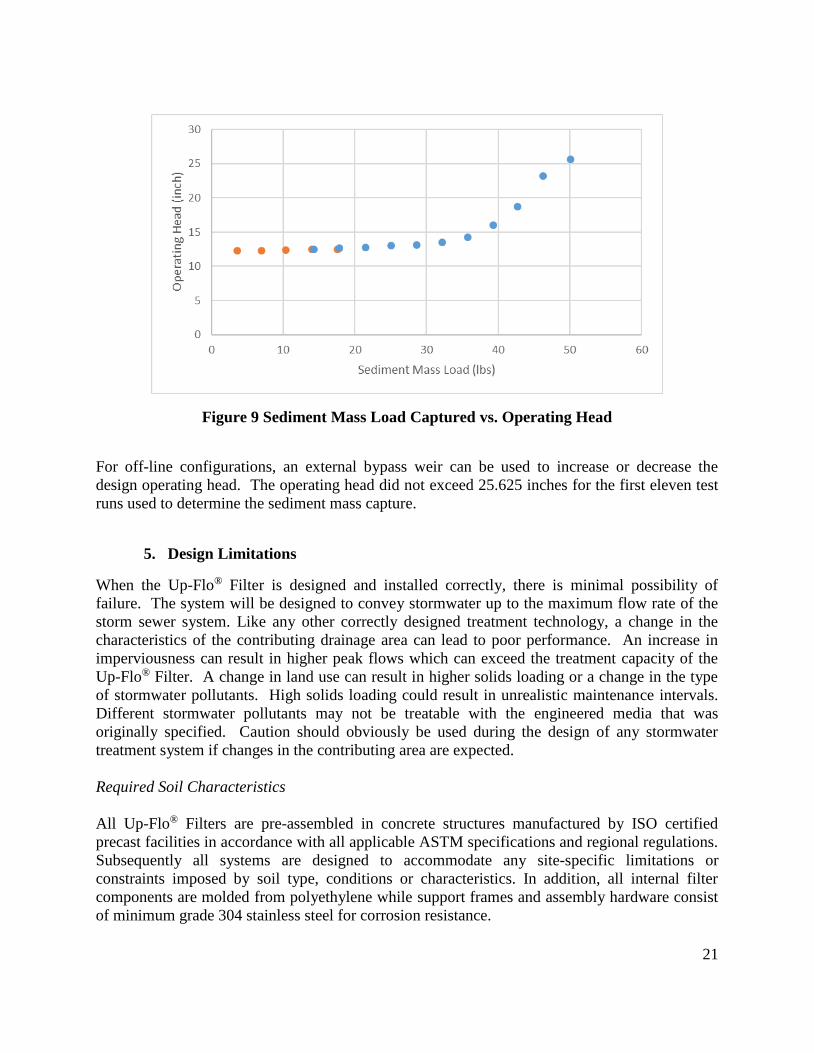
4.3 Filter Operating Head
Operating head is defined as the water column height in the vessel, measured from the invert of
the Outlet Module stub, at the end of a test run. As depicted in Figure 9, the operating head
increases with sediment mass load. The additional five test runs are shown with orange data
points. Given the consistent trend with these test runs, the operating head is not influenced by
the mass added until the total mass captured exceeds about 30 pounds compared to the total 50
lbs, which was the total mass added.
21
Figure 9 Sediment Mass Load Captured vs. Operating Head
For off-line configurations, an external bypass weir can be used to increase or decrease the
design operating head. The operating head did not exceed 25.625 inches for the first eleven test
runs used to determine the sediment mass capture.
5. Design Limitations
When the Up-Flo® Filter is designed and installed correctly, there is minimal possibility of
failure. The system will be designed to convey stormwater up to the maximum flow rate of the
storm sewer system. Like any other correctly designed treatment technology, a change in the
characteristics of the contributing drainage area can lead to poor performance. An increase in
imperviousness can result in higher peak flows which can exceed the treatment capacity of the
Up-Flo® Filter. A change in land use can result in higher solids loading or a change in the type
of stormwater pollutants. High solids loading could result in unrealistic maintenance intervals.
Different stormwater pollutants may not be treatable with the engineered media that was
originally specified. Caution should obviously be used during the design of any stormwater
treatment system if changes in the contributing area are expected.
Required Soil Characteristics
All Up-Flo® Filters are pre-assembled in concrete structures manufactured by ISO certified
precast facilities in accordance with all applicable ASTM specifications and regional regulations.
Subsequently all systems are designed to accommodate any site-specific limitations or
constraints imposed by soil type, conditions or characteristics. In addition, all internal filter
components are molded from polyethylene while support frames and assembly hardware consist
of minimum grade 304 stainless steel for corrosion resistance.
22
Slope
The Up-Flo® Filter outlet module permanently mounts in a fixed horizontal position running
through the precast wall either directly outside of the vault or into an outlet chamber. In
configurations where the outlet module pipe stub connects directly to the outlet pipe, slope is
restricted to that permitted by the connecting coupling.
Maximum Filtration Rate
The maximum filtration rate of each Up-Flo® Filter system is contingent on the area of the filter,
but more specifically the number of Filter Modules and total filter ribbon surface area. Given the
test results, the Up-Flo® Filter with filter ribbon model 285R will be sized to ensure the
maximum filtration rate per module will be 1.264 gpm per ft2 of filtration area or 0.176 sq.-ft of
sedimentation area per square foot of filter ribbon area.
Maintenance Requirements
Up-Flo® Filter maintenance requirements vary according to site characteristics such as runoff
area, types of surfaces (e.g., paved and/or landscaped), site activities (e.g., short-term or long-
term parking), and site maintenance (e.g., sanding and sweeping). At a minimum, Hydro
International recommends that inspection and maintenance should be conducted at intervals of
no more than six months during the first year of operation. Observations made during these
initial service events may be used to derive a lasting site-specific inspection and maintenance
program
Operating Head
The maximum operating head for the Up-Flo® Filter with filter ribbon model 285R is 25.625
inches above the outlet pipe invert. This is the maximum head required to maintain the MTFR
and annual sediment load. Since the flow is not controlled within the Filter Module, higher
treated flows will occur at lower operating heads until the ribbons reach the anticipated annual
mass load. To ensure the MTFR is not exceeded, flow control prior to the Up-Flo filter is
required.
Installation Limitations
Hydro International provides installation instructions as well as product specific manufacturer
specifications with each project submittal. Prior to scheduling delivery Hydro notifies the
contractor with pick weights and specific handling instructions of/for the structure. Hydro
International provides remote technical assistance for contractors as well as offering onsite
engineering to facilitate/oversee proper installation.
23
Configurations
The Up-Flo® Filter has modular components to allow for differences in precast manufacture and
preferences for source control design. In general, there are two configurations including 4-ft
diameter precast manholes or vaults that have 1-4 filter bays and internal conveyance channels to
manage peak bypass flows. The tested configuration submitted for verification corresponds with
offline use of filter modules equipped with filter ribbons.
Structural Load Limitations
All Up-Flo® Filters are pre-assembled in concrete structures manufactured by ISO certified
precast facilities in accordance with all applicable ASTM specifications and/or site-specific
loading requirements. All precast structures will have a minimum wall thickness sufficient to
sustain HS20-44 loading requirements.
Pre-treatment Requirements
The Up-Flo® Filter is designed as a stand-alone device and requires no additional upstream
treatment. However, for source control applications having high pollutant loads, inclusion of
pretreatment can extend filter media longevity and reduce annual service requirements.
Limitations in Tailwater
Tailwater conditions are carefully evaluated for each application. Ideally, the tailwater will be
lower than 11-inches from the Outlet Invert. When the tailwater is higher than this, additional
head will be required.
Depth to Seasonal High Water Table
The Up-Flo® Filter is designed to be connected as part of a self-contained storm sewer network.
The precast structure housing each Up-Flo® Filter is sealed according to regional specifications
and designed to account for buoyancy forces.
6. Maintenance
Maintenance activities can be categorized by those that can be performed from outside the Up-
Flo® Filter vessel and those that are performed inside the vessel. Maintenance performed from
outside the vessel includes removal of floatables and oils that have accumulated on the water
surface and removal of sediment from the sump. Maintenance performed inside the vessel
includes removal and replacement of the filter ribbons. A vactor truck is required for removal of
oils, water, sediment, and to enter the vessel for performing inside maintenance.
Inspection
The frequency of inspection and maintenance can be determined in the field after installation.
24
Based on site characteristics such as contributing area, types of surfaces (e.g., paved and/or
landscaped), site activities (e.g., short-term or long-term parking), and site maintenance (e.g.,
sanding and sweeping), inspection and maintenance should be conducted at intervals of no more
than six months during the first year of operation. Typically, maintenance is recommended once
per year thereafter.
By removing the manhole cover during a storm and monitoring the water level in the manhole or
vault, site personnel can determine whether the filter is in bypass. A properly-sized filter (on-
line or off-line) that is in bypass during a storm that is producing runoff at, or below, the filter’s
design filtration rate needs maintenance. Otherwise, scheduled inspections will determine when
one or more of the following maintenance thresholds have been reached:
Sediment depth at sump storage capacity
A sediment depth of 6-in. indicates the sump has reached its maximum capacity for Up-
Flo® Filter installations configured with filter ribbons. A sediment probe, such as the
Sludge-Judge®, can be used to determine the depth of the solids in the sump.
Blinding of Filter Ribbons
Observing water elevations and inspecting the filter ribbons is required to determine
when they require replacement. If the water elevation is higher than the top of the
module, the filter should be drained down, inspected and replaced if there is heavy
loading or slime coating the filter ribbons.
Oil forming a measurable thickness on the surface of the water
The Up-Flo® Filter will prevent free oils from passing through the Filter Modules.
However, storing volatile hydrocarbons is not recommended. Any free oils on the water
surface in excess of 1 inch should be removed.
The site-specific solids loading rate in the sump and for the filter ribbons will be determined
during the first year of Up-Flo® Filter operation. Starting with a clean sump, the solids loading
rate in the sump can be calculated by measuring the sediment depth in the sump and dividing the
depth by the correlating interval of time since it was cleaned. Note: The filter ribbons may be
occluded before the sump capacity is reached but cannot be known unless the ribbons are
inspected when the sediment accumulation in the sump is measured.
After completion of the first year of operation, the inspection and maintenance intervals for
cleaning the sump and replacing filter ribbons will be established. Removal of oils and
floatables will occur at the same frequency unless the first year of operation indicates otherwise.
Keeping to the established maintenance intervals is critical for long term performance of any
filtration system.
Maintenance Procedures
The access port located at the top of the manhole or vault provides access to the Up-Flo® Filter
vessel for maintenance personnel to enter the vessel and comfortably remove and replace the
25
filter ribbons. The same access would be used for maintenance personnel working from the
surface to net or skim debris and floatables or to vactor out sediment, oil, and water. Unless the
Up-Flo® Filter has been installed in a very shallow unit, it is necessary to have personnel with
OSHA-confined space entry performing the maintenance that occurs inside the vessel.
Maintenance activities include inspection, floatables removal, oil removal, sediment removal,
and replacement of the ribbon assemblies. Maintenance intervals are determined from
monitoring the Up-Flo® Filter during its first year of operation. Depending on the site, some
maintenance activities are required with greater frequency than others. In the case of floatables
removal, a vactor truck is not required. Otherwise, a vactor truck is normally required for oil
removal, removal of sediment from the sump, and to dewater the vessel for replacing filter
ribbons. All inspection and maintenance activities should be recorded in an inspection and
maintenance log.
In general, good housekeeping practices upstream of any treatment practice will extend its
longevity. For example, sweeping paved surfaces, collecting leaves and grass trimmings, and
protecting bare ground from the elements will reduce loading to the system. Filter ribbons
should not be installed in the Filter Modules until construction activities are complete and site
stabilization is effective.
Solids Disposal
Sediment, floatables, gross debris, and spent filter ribbons can generally be disposed of at the
local landfill in accordance with local regulations. The toxicity of the residues produced will
depend on the activities in the contributing drainage area. Testing of the residues may be
required if they are considered potentially hazardous.
Sump water can generally be disposed of at a licensed water treatment facility. But the local
sewer authority should be contacted for permission prior to discharging the liquid. Significant
accumulations of oils removed separately from sump water should be transported to a licensed
hazardous waste treatment facility for proper treatment or disposal.
In all cases, local regulators should be contacted about disposal requirements.
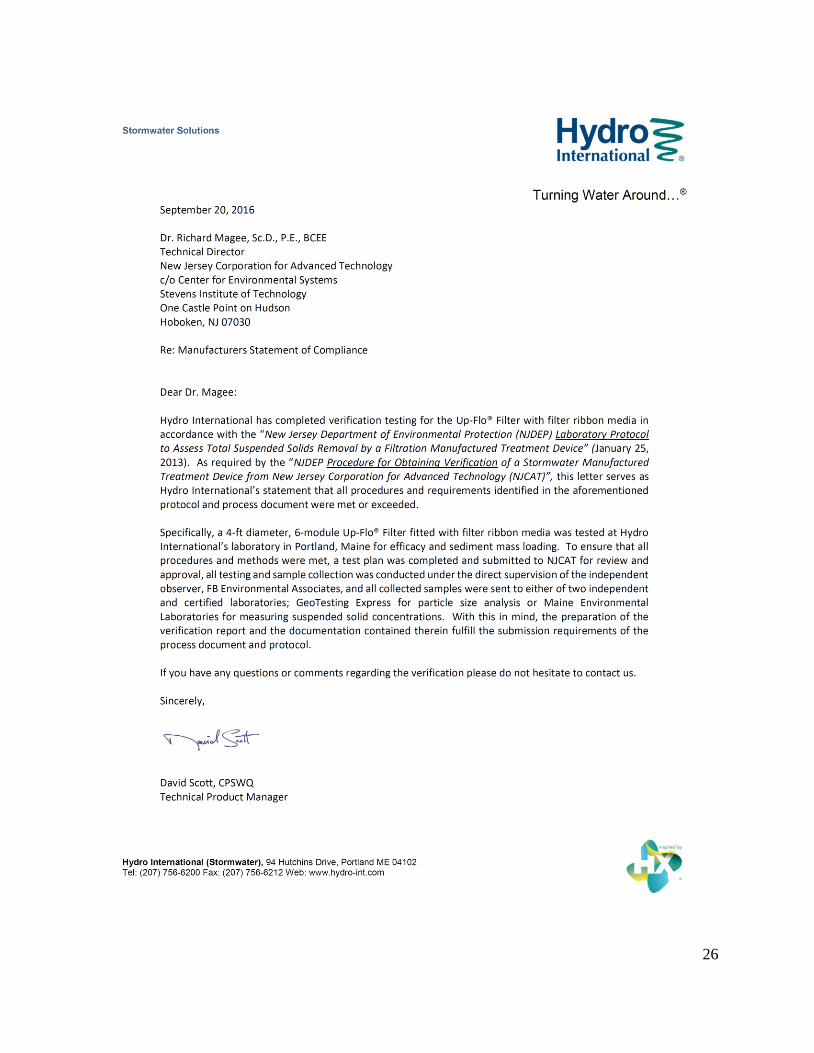
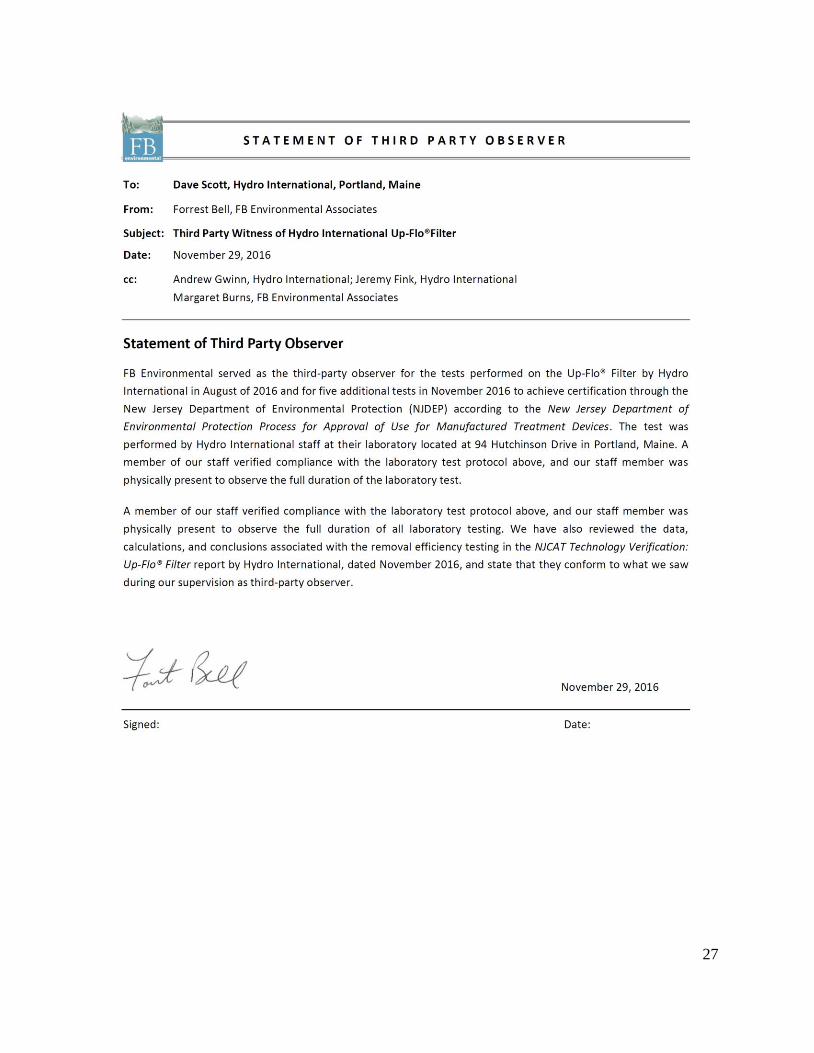
7. Statements
The following signed statements from the manufacturer (Hydro International), third-party
observer (FB Environmental) and NJCAT are required to complete the NJCAT verification
process.
In addition, it should be noted that this report has been subjected to public review (e.g.
stormwater industry) and all comments and concerns have been satisfactorily addressed.
26
27
28
29
Center for Environmental Systems
Stevens Institute of Technology
One Castle Point
Hoboken, NJ 07030-0000
November 28, 2016
Titus Magnanao
NJDEP
Division of Water Quality
Bureau of Non-Point Pollution Control
401-02B
PO Box 420
Trenton, NJ 08625-0420
Dear Mr. Magnanao,
Based on my review, evaluation and assessment of the testing conducted on a full-scale,
commercially available Hydro International 4-ft Up-Flo® Filter with six filter modules with filter
ribbon media, installed in a 4-ft concrete manhole at Hydro’s full-scale hydraulic testing facility
in Portland, Maine, with FB Environmental Consultants providing independent third-part
oversight, the test protocol requirements contained in the “New Jersey Department of
Environmental Protection Laboratory Protocol to Assess Total Suspended Solids Removal by a
Filtration Manufactured Treatment Device” (NJDEP Filter Protocol, January 2013) were met
with two exceptions as noted below. Specifically:
Sample Size
The protocol requires that the minimum sample size (effluent, background, drawdown) collected
is 500 milliliters or 0.5 liters. Based on the recommendation of the outside analytical laboratory
half-liter bottles were used for sample collection. This resulted in 30 of the 80 samples collected
having volumes less than 500 ml. An in-depth analysis of these 30 samples was conducted by
Hydro International and NJCAT and it was determined that the smaller sample size did not
impact the performance claims from the testing. The two public commenters accepted NJCAT's
assessment to go forward with the verification report despite this deviation from the protocol
requirements.
30
Test Sediment Feed
The test sediment was a blend of commercially available silica sand grades supplied by AGSCO
Corporation and US Silica Company. The sediment was blended by Hydro International. The
particle size distribution was independently verified by GeoTesting Express certifying that the
supplied silica meets the specification within tolerance as described in Section 5B of the NJDEP
protocol and was acceptable for use.
Removal Efficiency Testing
Ten (10) removal efficiency testing runs were completed in accordance with the NJDEP test
protocol. The target flow rate and influent sediment concentration were 90 gpm and 200 mg/L
respectively. All ten runs met the protocol requirements for flow rate COV and influent sediment
concentration COV. Maximum temperature and background sediment concentrations met
protocol requirements as well. The average sediment removal efficiency for the ten runs was
82%.
Sediment Mass Loading Capacity
The Sediment Mass Loading Capacity study was a continuation of the removal efficiency study.
All aspects of the testing remained the same, except for the flow rate which was reduced to 90%
of the 90 gpm MTFR for a target flow rate of 81 gpm for Run 13 as required by the protocol. For
the tested Up-Flo® Filter with filter ribbon media model, the maximum water elevation required
is 25.625 inches. During Run 12 this head was exceeded, necessitating the reduction in MTFR.
Around 18-minutes, during Run 13, the operating head again exceeded 25.625-inches. Hence, to
be conservative, the sediment mass loading capacity was determined from Runs 1-11 only. Run 1
had a sediment concentration loading that exceeded protocol requirements. Subsequent
additional testing demonstrated that this higher concentration did not impact the mass capacity
loading or operating head performance so the initial test results were accepted.
Scour Testing
No scour testing was conducted. Consequently, the Up-Flo® Filter is only being offered for off-
line installation.
Sincerely,
Richard S. Magee, Sc.D., P.E., BCEE
31
8. References
ASTM D422-63. Standard Test Method for Particle-Size Analysis of Soils.
ASTM D3977-97. Standard Test Methods for Determining Concentrations in Water Samples.
Hydro International Limited 2016. NJCAT Technology Verification: Up-Flo Filter. Prepared by
Hydro International. September, 2016.
Hydro International Limited 2016. Quality Assurance Project Plan for NJDEP Testing: Up-Flo
Filter. Prepared by Hydro International. August, 2016.
NJDEP 2013a. New Jersey Department of Environmental Protection Procedure for Obtaining
Verification of a Stormwater Manufactured Treatment Device from New Jersey Corporation for
Advanced Technology. Trenton, NJ. January 25, 2013.
NJDEP 2013b. New Jersey Department of Environmental Protection Laboratory Protocol to
Assess Total Suspended Solids Removal by a Filtration Manufactured Treatment Device.
Trenton, NJ. January 25, 2013.
NJDEP 2013c. New Jersey Department of Environmental Protection Laboratory Protocol to
Assess Total Suspended Solids Removal by a Hydrodynamic Sedimentation Manufactured
Treatment Device.
Trenton, NJ. January 25, 2013.
NJDEP 2013d. NJCAT Technology Verification: Up-Flo Filter. Trenton, NJ. November, 2008.
NJDEP 2013e. NJCAT Technology Verification: Up-Flo Filter. Trenton, NJ. January, 2015.
32
VERIFICATION APPENDIX
33
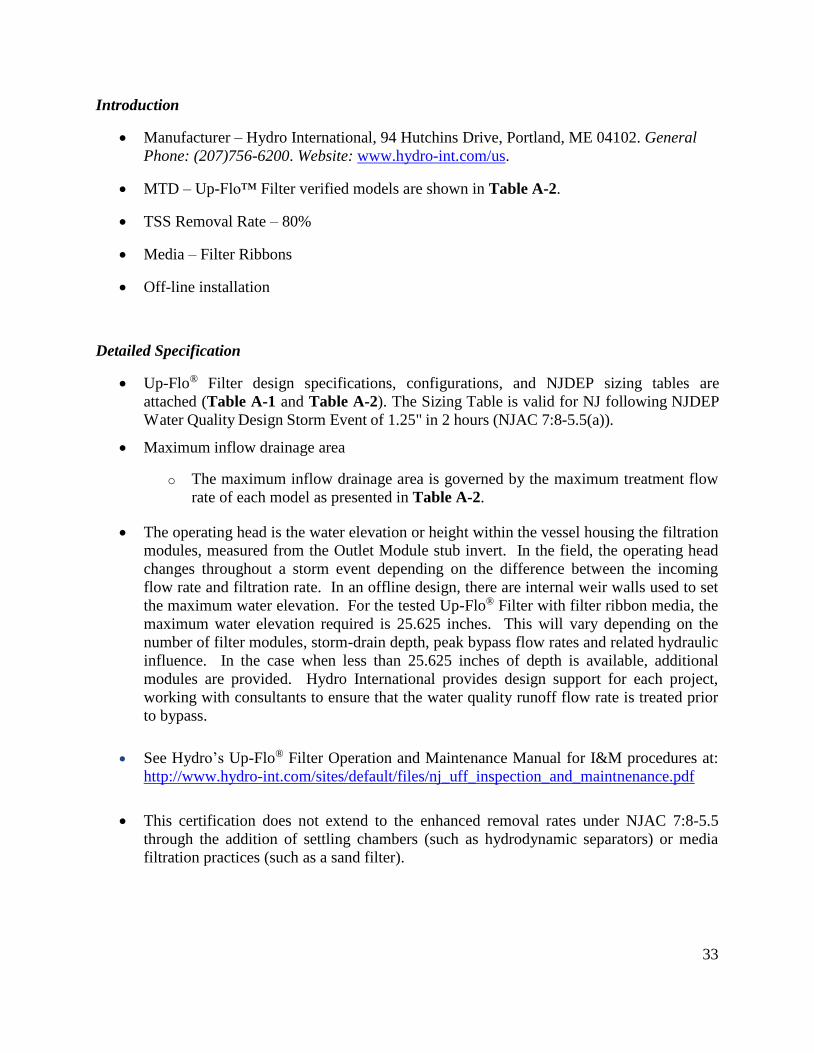
Introduction
Manufacturer – Hydro International, 94 Hutchins Drive, Portland, ME 04102. General
Phone: (207)756-6200. Website: www.hydro-int.com/us.
MTD – Up-Flo™ Filter verified models are shown in Table A-2.
TSS Removal Rate – 80%
Media – Filter Ribbons
Off-line installation
Detailed Specification
Up-Flo® Filter design specifications, configurations, and NJDEP sizing tables are
attached (Table A-1 and Table A-2). The Sizing Table is valid for NJ following NJDEP
Water Quality Design Storm Event of 1.25" in 2 hours (NJAC 7:8-5.5(a)).
Maximum inflow drainage area
o The maximum inflow drainage area is governed by the maximum treatment flow
rate of each model as presented in Table A-2.
The operating head is the water elevation or height within the vessel housing the filtration
modules, measured from the Outlet Module stub invert. In the field, the operating head
changes throughout a storm event depending on the difference between the incoming
flow rate and filtration rate. In an offline design, there are internal weir walls used to set
the maximum water elevation. For the tested Up-Flo® Filter with filter ribbon media, the
maximum water elevation required is 25.625 inches. This will vary depending on the
number of filter modules, storm-drain depth, peak bypass flow rates and related hydraulic
influence. In the case when less than 25.625 inches of depth is available, additional
modules are provided. Hydro International provides design support for each project,
working with consultants to ensure that the water quality runoff flow rate is treated prior
to bypass.
See Hydro’s Up-Flo® Filter Operation and Maintenance Manual for I&M procedures at:
http://www.hydro-int.com/sites/default/files/nj_uff_inspection_and_maintnenance.pdf
This certification does not extend to the enhanced removal rates under NJAC 7:8-5.5
through the addition of settling chambers (such as hydrodynamic separators) or media
filtration practices (such as a sand filter).
34
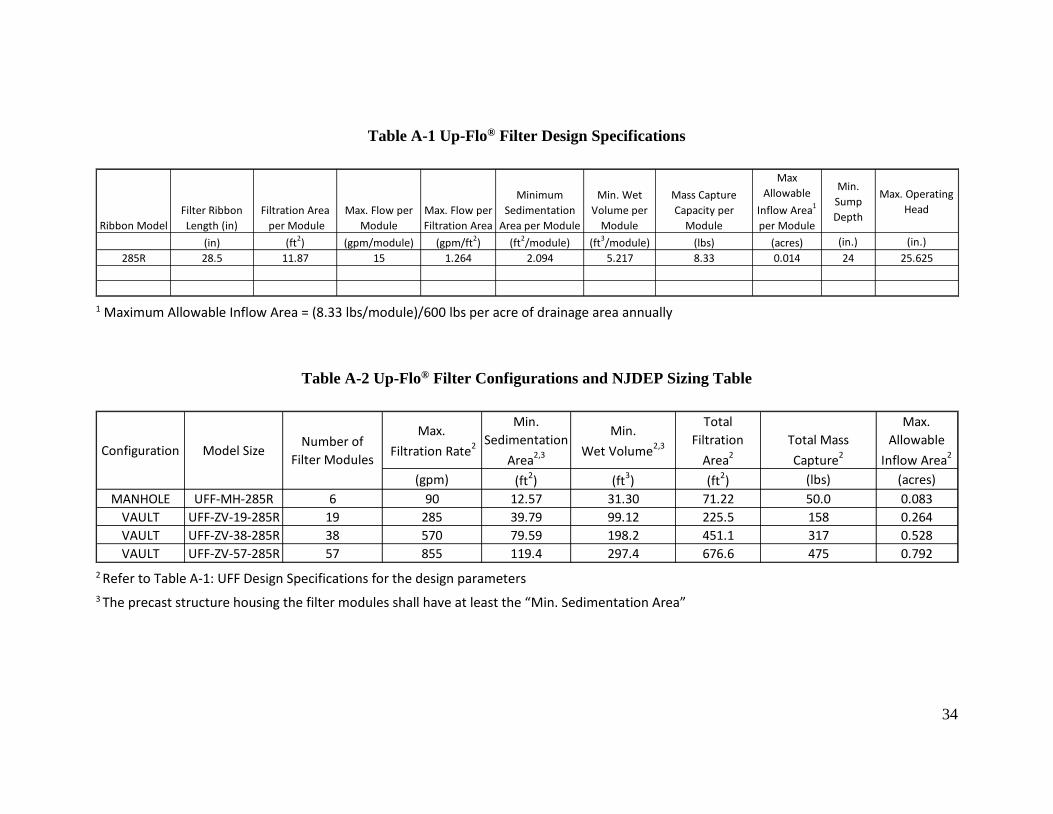
Table A-1 Up-Flo® Filter Design Specifications
Ribbon Model
Filter Ribbon
Length (in)
Filtration Area
per Module
Max. Flow per
Module
Max. Flow per
Filtration Area
Minimum
Sedimentation
Area per Module
Min. Wet
Volume per
Module
Mass Capture
Capacity per
Module
Max
Allowable
Inflow Area1
per Module
Min.
Sump
Depth
Max. Operating
Head
(in) (ft2) (gpm/module) (gpm/ft2) (ft2/module) (ft3/module) (lbs) (acres) (in.) (in.)
285R 28.5 11.87 15 1.264 2.094 5.217 8.33 0.014 24 25.625
1 Maximum Allowable Inflow Area = (8.33 lbs/module)/600 lbs per acre of drainage area annually
Table A-2 Up-Flo® Filter Configurations and NJDEP Sizing Table
Max.
Filtration Rate2
Min.
Sedimentation
Area2,3
Min.
Wet Volume2,3
Total
Filtration
Area2
Total Mass
Capture2
Max.
Allowable
Inflow Area2
(gpm) (ft2) (ft3) (ft2) (lbs) (acres)
MANHOLE UFF-MH-285R 6 90 12.57 31.30 71.22 50.0 0.083
VAULT UFF-ZV-19-285R 19 285 39.79 99.12 225.5 158 0.264
VAULT UFF-ZV-38-285R 38 570 79.59 198.2 451.1 317 0.528
VAULT UFF-ZV-57-285R 57 855 119.4 297.4 676.6 475 0.792
Configuration Model SizeNumber of
Filter Modules
2 Refer to Table A-1: UFF Design Specifications for the design parameters
3 The precast structure housing the filter modules shall have at least the “Min. Sedimentation Area”