Embed Size (px)
Citation preview
JOURNAL OF GEOPHYSICAL RESEARCH, VOL. 94, NO. D13, PAGES 16,351-16,363, NOVEMBER 20, 1989
Nitrogen Oxides From High-Altitude Aircraft' An Update of Potential Effects on Ozone
HAROLD S. JOHNSTON 1
Department of Chemistry, University of California, Berkeley
DOUGLAS E. KINNISON AND DONALD J. WUEBBLES
Atmospheric and Geophysical Science Division, Lawrence Livermore National Laboratory, Livermore, California
A sensitivity study is carried out using the Lawrence Livermore National Laboratory one- dimensional and two-dimensional chemical-radiative-transport models of the global atmosphere to examine possible effects of future aircraft NOx emissions to stratospheric ozone. A broad range in magnitude, altitude, and latitude of the assumed NOx emissions is examined. Major findings of this initial study are as follows: (1) Nitrogen oxides from the exhaust gases of stratospheric aircraft can reduce stratospheric ozone on a global basis. These calculated ozone reductions depend strongly on NOx injection altitude and magnitude. (2) The altitude at which NOx emissions cause the largest reduction in the ozone column is about 25 km according to one-dimensional model calculations and about 28 km according to the two-dimensional model. (3) For a given altitude and magnitude of NOx emissions, the two-dimensional model finds that the reduction of global ozone depends on latitude of the injections, with maximum ozone reduction for tropical injection. For a given injection, the largest ozone column reductions occur in the polar regions. (4) For very large Clx mixing ratios, NOx emissions can increase the ozone column, partially counteracting the ozone reduction caused by Clx. This effect is found only in a highly Clx perturbed stratosphere where ozone is already greatly depleted. (5) Water vapor (without nitric oxide) in the exhaust gives a small ozone reduction; water vapor and nitric oxide together give an ozone reduction less than that calculated for NO alone by factors between 0.85 and 0.97. (6) Calculated global reductions of ozone due to NOx emissions are smaller in the two-dimensional model than in the one-dimensional model, by factors that range from 0.66 to 0.86 for injection altitudes between 20 to 34 km. (7) On the basis of an uncertain estimate of fuel consumption by future stratospheric aircraft, calculations for a fleet of 500 aircraft operating at 22 km with NOx emission properties of 1988 subsonic commercial aircraft engines give global ozone reductions of about 20%. There is reason to believe that such nitric oxide emissions may be lowered, perhaps by a factor of 10, by advanced emission reduction technology.
INTRODUCTION
In the early to mid 1970s there was concern about the potential effects of emissions of odd nitrogen (NOx) from commercial fleets of proposed supersonic transport (SST) aircraft. The concern was that these aircraft, if flying in large numbers in the stratosphere, would produce exhaust emis- sions of NOx sufficient to cause large reduction of strato- spheric ozone [Johnston, 1971; Climatic Impact Assessment Program (CIAP), 1975a, b; National Academy of Sciences (NAS), 1975]. There recently has been renewed interest in the development of faster aircraft for intercontinental pas- senger flight (for example, First International Conference on Hypersonic Flight in the 21st Century, University of North Dakota, Grand Forks, September 1988). Such aircraft would probably spend a large fraction of their flight time in the stratosphere, perhaps at altitudes as high as 35 km. As a natural progression from studies that were done in the 1970s [Johnston, 1971; CIAP, 1975a, b; Wuebbles and Chang, 1975; Cunnold et al., 1977; Widhopf et al., 1977; Widhopf and Glatt, 1979; Luther et al., 1979] and as an extension of
•Also at Materials and Chemical Sciences Division, Lawrence Berkeley Laboratory, Berkeley, California.
Copyright 1989 by the American Geophysical Union.
Paper number 89JD01319. 0148-0227/89/89JD-01319505.00
recent sensitivity studies made by Kinnison et al. [1988], this study investigates the sensitivity of stratospheric ozone to NOx emissions in conjunction with current understanding of atmospheric chemical and physical processes.
Most prior analyses of the potential effects of aircraft emissions on ozone have depended on results from one- dimensional models of atmospheric processes, such as the one-dimensional model of the troposphere and stratosphere used at Lawrence Livermore National Laboratory (LLNL) [Wuebbles, 1983]. These models, which determine the ver- tical distributions of important trace constituents, have the advantage of being computationally efficient while including detailed representations of atmospheric chemical and radia- tive processes. However, the treatment of atmospheric dynamical processes in these models through an empirically based eddy diffusion representation has well-recognized limitations [World Meteorological Organization (WMO), 1985, chapter 12]. Nevertheless, the one-dimensional model remains a useful tool, particularly for sensitivity studies.
Conceptually, the two-dimensional model has a number of advantages over the one-dimensional model, namely the inclusion of important effects from meridional motions in the stratosphere and the determination of latitudinal and sea- sonal variations in trace constituent distributions, as well as variations with altitude. A stronger theoretical basis for the treatment of dynamical processes in two-dimensional mod- els have been developed in recent years through the residual
16,351

16,352 JOHNSTON ET AL.' NITROGEN OXIDES FROM HIGH-ALTITUDE AIRCRAFT
mean or diabatic formulation of stratospheric transport [WMO, 1985, chapter 12].
Many improvements in the model treatment of atmo- spheric chemical processes have been made over the last decade. Many chemical reaction rates and photodissociation parameters have been changed on the basis of more recent data from laboratory measurements, and several chemical and photochemical reactions not recognized at the time of prior aircraft assessment studies have been included in current models [WMO, 1985, chapter 2; DeMore et al., 1985, 1987].
Both the LLNL one-dimensional and two-dimensional
chemical-radiative-transport models of the troposphere and stratosphere are used in this study. The one-dimensional model is used to examine the sensitivity of stratospheric ozone to varying amounts of NOx injections and flight altitudes for differing amounts of assumed stratospheric chlorine levels. This work is a continuation of a study [Kinnison et al., 1988] that examined the sensitivity of ozone to assumed large changes in stratospheric nitrogen oxide concentrations (as produced by varying tropospheric nitrous oxide, N20) and to assumed large variations in stratospheric chlorine content. While in most cases the added NOx reduced ozone, there were some situations, with large chlo- rine levels and small NOx, where the added NOx increased the total ozone column. In this study we examine what conditions would be necessary for stratospheric aircraft emissions to lead to a decrease of ozone, and what condi- tions would lead to an increase of ozone. Background chlorine is varied from 1.1 to 21.4 parts per billion by volume (ppbv), assumed aircraft injections consider an eightfold range in magnitude, and the altitude of NOx injections is varied from 12 to 37.5 km.
The two-dimensional model calculations are made for only one value of stratospheric Clx, 2.8 ppbv, about that of 1988; injection altitudes are varied from 16.5 to 34.5 km; and injection rates are varied by a factor of 8. Most injections are done for a narrow latitude band in the northern hemisphere (37ø-49ø), but also considered are a narrow latitude band in the tropics, uniform spread over the northern hemisphere, and uniform spread over the globe.
RELATION TO A FLEET OF STRATOSPHERIC
AIRCRAFT
One might want to connect the calculations given in this article with the number of high-speed aircraft. Such a connection cannot reliably be made at the present, because there are no actual aircraft engines of the sort that might be used, and fleet sizes, schedules, and flight patterns are unknown. These calculations are sensitivity studies for the currently expected effects of injecting nitrogen oxides, as if from aircraft, into the stratosphere, but an effort is made to span a reasonable range of injected nitric oxide. So far as model calculations are concerned, the major variables are (1) annual in-flight fuel consumption, (2) nitric oxide emission index (EI) (grams of nitric oxide produced per kilogram of fuel consumed), (3) flight altitude, and (4) flight latitude. (The emission index, EI, is variously given as grams of NO, grams of NO2, or grams of NO plus NO2 per kilogram of fuel consumed. The first two differ by a factor of 46/30, and either may be used if clearly defined. The last form is chemically
ambiguous and unsatisfactory, since the number of mole- cules is what counts, not the mass). The product of annual fuel consumption, nitric oxide emission index, and stoichio- metric factor between NO2 and NO, 46/30, gives the annual mass (megaton, MT, 109 kg) of injected NOx calculated as if NO2, which is a quantity conventionally used for the two- dimensional model calculations. The global average nitric oxide emission rate in molecules per cubic centimeter per second over a 1-km band is the standard unit used in
one-dimensional model calculations. A global injection of 1.8 MT per year corresponds to 1500 molecules cm -3 s -• over a 1-km band.
Considering the large cost of developing and building a new kind of commercial aircraft [Ott, 1988], it is unlikely that airframe builders would go ahead with a decision to con- struct unless prospects were good for several hundred (300 to 800, perhaps) copies eventually to be bought and used. The number 500 has been cited as a reasonable target figure [Study of Critical Environmental Problems (SCEP), 1970]. The CIAP Report of Findings [CLAP, 1974, pp. xvi, 7, 9, 23] projected a larger number of stratospheric aircraft and fuel usage of 1.5 x 10 • kg yr -• for the year 2005. This paper uses a lower estimate of 7.7 x 10 •ø kg fuel per year [SCEP, 1970; Johnston, 1971], but even this figure may be too high for future high-performance engines.
The nitric oxide emission index is the most widely variable quantity in this discussion and the one most amenable to being changed. For stratospheric aircraft, SCEP [1970] gave a value of 42, and Johnston [ 1971] used an emission index of 15. Ferri [1972] stated that the nitrogen oxides emission index varied from 15 to 70 in existing aircraft and gave theoretical arguments to the effect that the nitric oxide emission index could be reduced by a factor of 100. ClAP [ 1974] stated that commercial aircraft jet engines had a nitric oxide emission index of about 12. As these engines were redesigned over the last 10 or 15 years to increase perfor- mance, the emission index has increased to a value between 40 and 60 [NASA, 1988]. The value of 15 was used in many CIAP studies, [e.g., Cunnold et al., 1977; Alyea et al., 1975, and the Concorde is reported to have a value of 12 [CLAP, 1975a, b]. NASA engineers at Langley Air Force Base [NASA, 1988] are confident that the current nitric oxide emission index (40-60) can be reduced by a factor of 8 or 10 by "advanced emission reduction technology," and they have set a planning goal for an emission index of 5 g of nitric oxide per kilogram of fuel by the year 1997. From these considerations and for proper perspective on this problem, it is recommended that ozone calculations be considered for at
least three nitric oxide emission indices' 40, 15, and 5, which are, respectively, the minimum value that would probably exist if no attention is given toward reducing NOx from engine exhaust, a standard value used during CIAP and surely achievable since it once existed, and the goal of theoretical models concerning future "advanced emission reduction technology." The effect of all three values of emission index, 40, 15, and 5, should be evaluated and kept in mind until actual values from real engines are demon- strated. This paper (Tables 1-4, with one exception on the low side) covers exactly this range of emission index and uses the SCEP [1970] model for global annual fuel consump- tion by stratospheric aircraft.

JOHNSTON ET AL..' NITROGEN OXIDES FROM HIGH-ALTITUDE AIRCRAFT 16,353
TABLE 1. Percent Change of Vertical Ozone Column as a Result of Various Injection Rates of Nitric Oxide From Stratospheric Aircraft at Various Altitudes and for Various Assumed Constant Background Mixing Ratios of Clx at 50 km
NO Injection Altitude, km
Injection 20 Clx, ppbv Rate 12 17 20 23 27 30 34 37.5 (2 x CH4)
1.1 0 +0.0 +0.0 +0.0 +0.0 +0.0 +0.0 +0.0 +0.0 + 1.9 1.1 500 +0.1 +0.1 -3.0 -5.1 -2.1 1.1 1000 +0.2 -2.2 -6.3 -9.4 -4.6 1.1 2000 +0.2 -4.9 -13.1 -16.6 -10.4 1.1 4000 +0.1 -10.8 -24.7 -26.5 -21.4
3.1 0 - 1.4 - 1.4 - 1.4 - 1.4 - 1.4 - 1.4 - 1.4 - 1.4
3.1 500 - 1.3 -2.1 -3.8 -5.4 -5.9 -5.6 -5.0 -3.6 3.1 1000 -1.2 -3.1 -6.8 -9.8 -10.9 -9.7 -8.4 -7.3 3.1 1500 -1.1 -4.3 -10.0 -14.1 -14.6 -13.2 -11.2 -9.6 3.1 2000 -1.1 -5.5 -13.2 -18.3 -18.3 -16.6 -14.0 -11.8 3.1 4000 -1.1 -11.0 -23.5 -30.3 -29.6 -25.7 -21.2 -18.5
7.9 0 -5.1 -5.1 -5.1 -5.1 -5.1 7.9 500 -4.9 -5.3 -6.3 -7.4 -7.7 7.9 1000 -4.8 -5.8 -8.5 -10.8 -11.4 7.9 1500 -4.7 -6.7 - 11.2 - 15.0 - 15.0 7.9 2000 -4.6 -7.5 - 13.9 - 18.5 - 18.5 7.9 4000 -4.4 -12.1 -24.7 -30.6 -29.5
14.7 0 -12.2 -12.2 -12.2 14.7 500 -11.9 -11.3 -11.1 14.7 1000 -11.7 -10.9 -11.7 14.7 2000 -11.3 -11.3 -15.5 14.7 4000 - 10.7 - 14.3 -25.2
21.6 0 -23.6 -23.6 -23.6 21.6 500 -23.1 -20.5 -17.8 21.6 1000 -22.7 -18.5 -16.2 21.6 2000 -21.8 -16.7 -17.5 21.6 4000 -20.4 - 17.2 -25.7
3.1 1500 +0.3 7.9 1500 +0.4
-5.1 -5.1 -5.1 -4.5
-7.5 -7.1 -6.8 -5.1
-10.8 -9.8 -9.0 -6.7 -13.9 -12.4 -11.1 -17.0 -15.0 -13.1 -11.2 -26.7 -23.0 -19.6 -21.2
-12.2 -12.2 -12.2 -10.4 -11.2 -9.3 -13.0 -9.7 -18.4 -12.7 -27.7 -21.6
-23.6 -23.6 -23.6 -18.2 -16.2 -14.6
-15.7 -13.4 -19.6 -14.6 -28.5 -22.1
-12.2 -12.2
-23.6 -23.6
Percent Ozone Change Above Chlorine Background -2.9 -8.6 -12.7 -13.2 -11.8 -9.8 -8.2 -1.6 -6.1 -9.9 -9.9 -8.8 -7.3 -6.0
Injection rates are in units of molecules cm -3 s -l one-dimensional model.
over a 1-km band width centered at the stated altitude. Values are from LLNL
RESULTS FROM ONE-DIMENSIONAL MODEL
This study used the LLNL one-dimensional chemical- radiative-transport model of the troposphere and strato- sphere, which has been developed and used over the last 15 years; references and boundary values are given by Kinnison et al. [1988]. Photochemical rate coefficients are from De- More et al. [1985], except for recent, special calculations that use DeMote et al. [1987]. Briefly, the one-dimensional model considers 37 species and 119 chemical and 46 photo- chemical reactions. The one-dimensional model atmosphere is divided up into 44 vertical layers, which extend from the surface up to 56 km. Transport of trace species is controlled by an empirically based eddy diffusion function (K z) [Wueb- bles, 1983]. The boundary values of the reference atmo- sphere were selected to reproduce the composition of about 1960, including 1.1 ppbv of Cl x at 55 km and 300 ppbv of N20 in the troposphere to give 19.4 ppbv of NO x at 37.5 km. This paper uses the notation of Kinnison et al. [1988]: NOx includes the active radical species and their temporary reservoir (N + NO + NO2 + NO3 + 2N205)and includes the interaction species (HNO3 + HNO4 + ClNO3 + ClNO2). Similarly, Clx includes the active species (Cl + ClO), and reservoir and interaction species (HCl + HOCl +
CINO 3 + C1NO2). Heterogeneous chemistry associated with the Antarctic ozone hole is not included.
Most of the one-dimensional model results of this study are presented in Table 1, which gives the percentage change of the ozone vertical column for different assumed condi-
tions. These one-dimensional calculations consider NOx injection rates 500, 1000, 1500, 2000, and 4000 molecules cm -3 s -• over a 1-km band, which span nitric oxide emis- sion index values from 5 to 40. Five values of stratospheric chlorine, 1.1, 3.1, 7.9, 14.7, and 21.4 ppbv, are included. The reference value of 1.1 ppbv corresponds to the stratosphere in about 1960, 3.1 ppbv is approximately that of 1988, 7.9 ppbv is the calculated future steady state Clx value if chlorofluorocarbons (CFCs) are produced and released in- definitely at the 1985 rate, 14.7 ppbv is the calculated steady state value if global use and release of CFCs should double, and 21.4 ppbv (tripling current production of CFCs) is an unrealistically large value for stratospheric Clx used to see if the system changes strongly just outside the realistically expected range. These calculations are given in Table 1 for eight altitudes. In terms of aircraft these altitudes roughly correspond to current commercial aircraft (12 km), to the French-British Concorde (17 km), to the 1971 American-
16,354 JOHNSTON ET AL.: NITROGEN OXIDES FROM HiGH=ALTITUDE AIRCRAFT
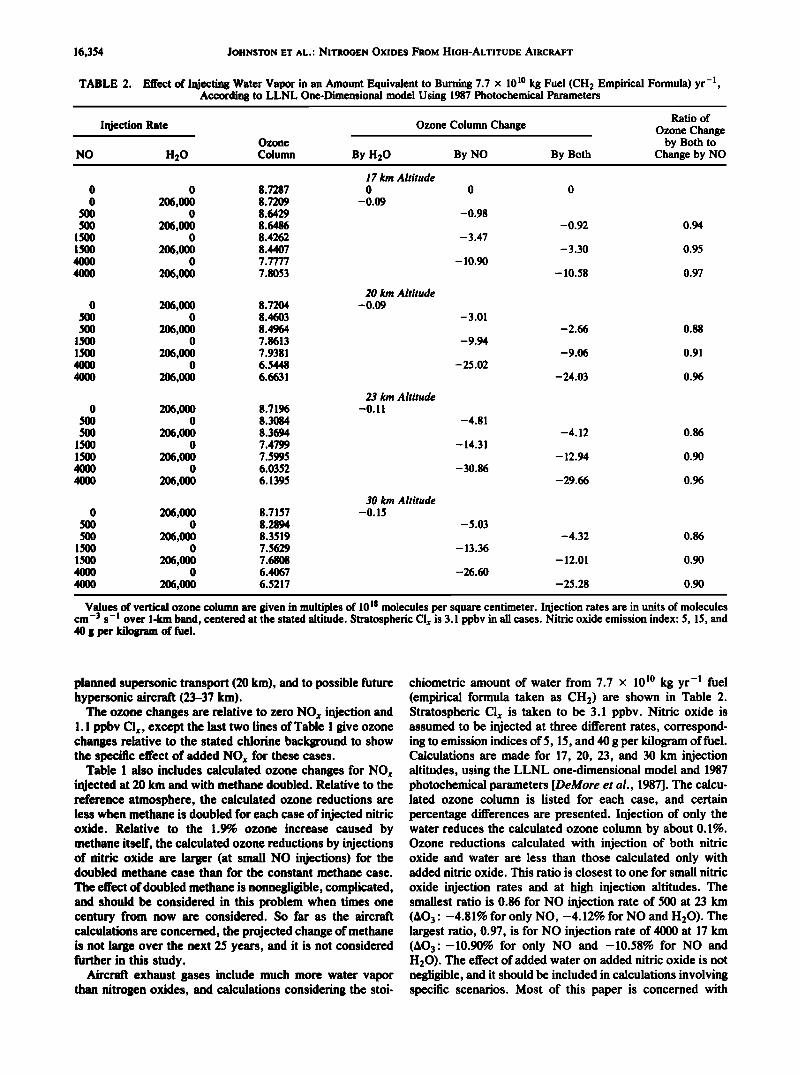
TABLE 2. Effect of Injecting Water Vapor in an Amount Equivalent to Burning 7.7 x 10 lø kg Fuel (CH2 Empirical Formula) yr -l, According to LLNL One-Dimensional model Using 1987 Photochemical Parameters
Injection Rate Ozone Column Change
Ozone
NO H20 Column By H20 By NO By Both
Ratio of
Ozone Change by Both to
Change by NO
0 0 8.7287
0 206,000 8.7209 500 0 8.6429
500 206,000 8.6486 1500 0 8.4262
1500 2O6,000 8.4407 4000 0 7.7777
4000 2O6,000 7.8053
0 206,000 8.7204 500 0 8.4603
500 206,OOO 8.4964 1500 0 7.8613
1500 206,000 7.9381 4000 0 6.5448
4O0O 206,00O 6.6631
0 206,000 8.7196 500 0 8.3084
500 206,000 8.3694 1500 0 7.4799 1500 206,000 7.5995 4000 o 6.0352 4000 2O6,000 6.1395
0 206,000 8.7157 50O 0 8.2894
500 206,000 8.3519 1500 0 7.5629
1500 2O6,OOO 7.68O8 4000 0 6.4067
4000 2O6,000 6.5217
17 km Altitude o
-0.09
20 km Altitude -0.09
23 km Altitude -0.11
30 km Altitude -0.15
0 0
-0.98
-3.47
-10.90
-3.01
-25.02
-4.81
-14.31
-3O.86
-5.03
-13.36
-26.60
-0.92 0.94
-3.30 0.95
-10.58 0.97
-2.66 0.88
-9.06 0.91
-24.03 0.96
-4.12 0.86
- 12.94 0.90
-29.66 0.96
-4.32 0.86
-12.01 0.90
-25.28 0.90
Values of vertical ozone column are given in multiples of 101• molecules per square centimeter. Injection rates are in units of molecules cm -3 s -I over l-kin band, centered at the stated altitude. Stratospheric CI x is 3.1 ppbv in all cases. Nitric oxide emission index: 5, 15, and 40 g per kilogram of fuel.
planned supersonic transport (20 km), and to possible future hypersonic aircraft (23-37 km).
The ozone changes are relative to zero NO x injection and 1.1 ppbv Clx, except the last two lines of Table 1 give ozone changes relative to the stated chlorine background to show the specific effect of added NOx for these cases.
Table I also includes calculated ozone changes for NOx injected at 20 km and with methane doubled. Relative to the reference atmosphere, the calculated ozone reductions are less when methane is doubled for each case of injected nitric oxide. Relative to the 1.9% ozone increase caused by methane itself, the calculated ozone reductions by injections of nitric oxide are larger (at small NO injections) for the doubled methane case than for the constant methane case.
The effect of doubled methane is nonnegligible, complicated, and should be considered in this problem when times one century from now are considered. So far as the aircraft calculations are concerned, the projected change of methane is not large over the next 25 years, and it is not considered further in this study.
Aircraft exhaust gases include much more water vapor than nitrogen oxides, and calculations considering the stoi-
chiometric amount of water from 7.7 x 10 l0 kg yr-l fuel (empirical formula taken as CH2) are shown in Table 2. Stratospheric Clx is taken to be 3.1 ppbv. Nitric oxide is assumed to be injected at three different rates, correspond- ing to emission indices of 5, 15, and 40 g per kilogram of fuel. Calculations are made for 17, 20, 23, and 30 km injection altitudes, using the LLNL one-dimensional model and 1987 photochemical parameters [DeMore et al., 1987]. The calcu- lated ozone column is listed for each case, and certain percentage differences are presented. Injection of only the water reduces the calculated ozone column by about 0.1%. Ozone reductions calculated with injection of both nitric oxide and water are less than those calculated only with added nitric oxide. This ratio is closest to one for small nitric
oxide injection rates and at high injection altitudes. The smallest ratio is 0.86 for NO injection rate of 500 at 23 km (AO3: -4.81% for only NO, -4.12% for NO and H20). The largest ratio, 0.97, is for NO injection rate of 4000 at 17 km (AO3:-10.90% for only NO and -10.58% for NO and H20). The effect of added water on added nitric oxide is not negligible, and it should be included in calculations involving specific scenarios. Most of this paper is concerned with
JOHNSTON ET AL.' NITROGEN OXIDES FROM HIGH-ALTITUDE AIRCRAFT 16,355
sensitivity calculations of one variable at a time, and Table 2 includes all the cases where water is included as an exhaust
gas.
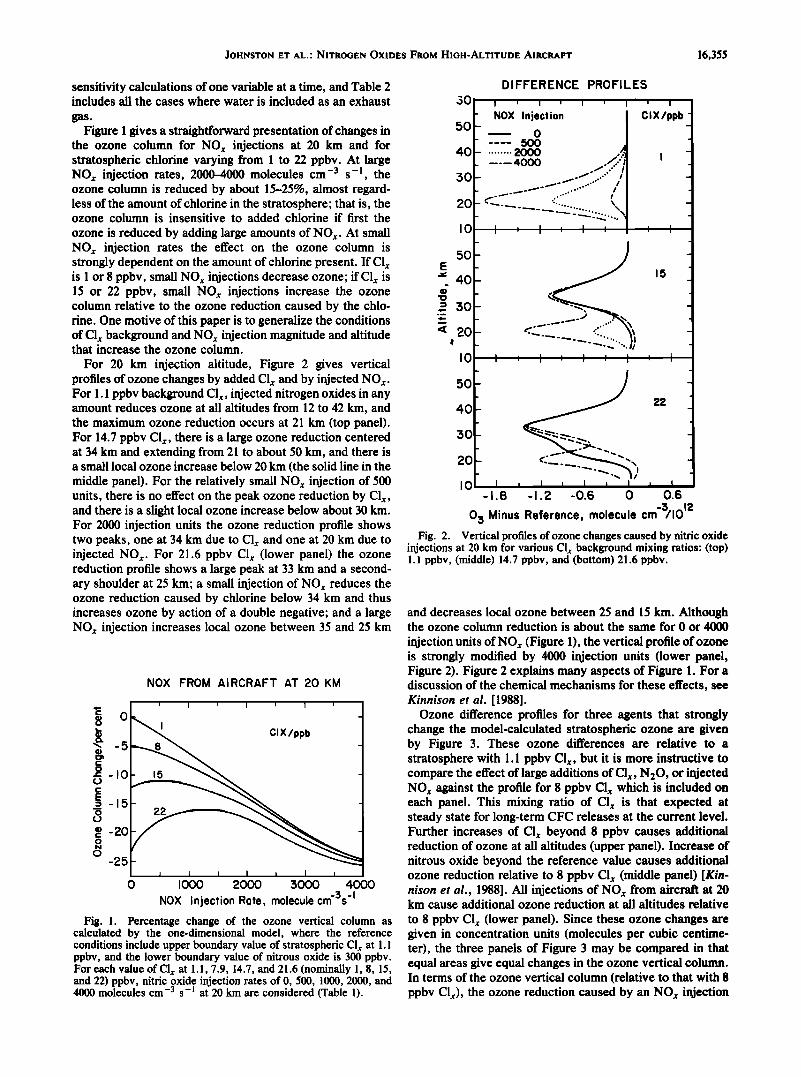
Figure 1 gives a straightforward presentation of changes in the ozone column for NO x injections at 20 km and for stratospheric chlorine varying from 1 to 22 ppbv. At large NOx injection rates, 2000-4000 molecules cm -3 s -! the ozone column is reduced by about 15-25%, almost regard- less of the amount of chlorine in the stratosphere; that is, the ozone column is insensitive to added chlorine if first the
ozone is reduced by adding large amounts of NOx. At small NO x injection rates the effect on the ozone column is strongly dependent on the amount of chlorine present. If Clx is 1 or 8 ppbv, small NOx injections decrease ozone; if Clx is 15 or 22 ppbv, small NOx injections increase the ozone column relative to the ozone reduction caused by the chlo- rine. One motive of this paper is to generalize the conditions of CI• background and NO• injection magnitude and altitude that increase the ozone column.
For 20 km injection altitude, Figure 2 gives vertical profiles of ozone changes by added Clx and by injected NOx. For 1.1 ppbv background CId, injected nitrogen oxides in any amount reduces ozone at all altitudes from 12 to 42 km, and the maximum ozone reduction occurs at 21 km (top panel). For 14.7 ppbv Clx, there is a large ozone reduction centered at 34 km and extending from 21 to about 50 km, and there is a small local ozone increase below 20 km (the solid line in the middle panel). For the relatively small NOx injection of 500 units, there is no effect on the peak ozone reduction by Clx, and there is a slight local ozone increase below about 30 km. For 2000 injection units the ozone reduction profile shows two peaks, one at 34 km due to Clx and one at 20 km due to injected NO•. For 21.6 ppbv Clx (lower panel) the ozone reduction profile shows a large peak at 33 km and a second- ary shoulder at 25 km; a small injection of NO x reduces the ozone reduction caused by chlorine below 34 km and thus increases ozone by action of a double negative; and a large NO• injection increases local ozone between 35 and 25 km
NOX FROM AIRCRAFT AT 20 KM
-20
-25
_
• CIX/ppb 8 -
- 15 -
• I • I i I , i,
0 1000 2000 3000 4000
NOX Injection Rote, molecule crn -3s -• Fig. 1. Percentage change of the ozone vertical column as
calculated by the one-dimensional model, where the reference conditions include upper boundary value of stratospheric Clx at 1.1 ppbv, and the lower boundary value of nitrous oxide is 300 ppbv. For each value of Clx at 1.1, 7.9, 14.7, and 21.6 (nominally 1, 8, 15, and 22) ppbv, nitric oxide injection rates of 0, 500, 1000, 2000, and 4000 molecules cm -3 s -] at 20 km are considered (Table 1).
DIFFERENCE PROFILES
3O I ] I [ I ' I ' I
- NOX Injection ClX/ppb- _ --
o - 500 - ......... 2000 ,• - .... 4000 /•.."• I .
e• -o• -- "•........... •. _ ...•" ............ \\ - - '•- •L'• .... x
I , I , I : : 'I --
_
_ 15 _
- ,o •. o.....• .....ø _ •'..•. .:.. • -
J . I ' I ' ! ' I '
.
I , I I I I I i
5O
40
3O
20
I0
5O E
40
= 30 ._
< 20
I0
5o
40
30
20
I0 -I.8 -I.2 -0.6 0 0.6
0 3 Minus Reference, molecule cm'$/1012 Fig. 2. Vertical profiles of ozone changes caused by nitric oxide
injections at 20 km for various Clx background mixing ratios: (top) 1.1 ppbv, (middle) 14.7 ppbv, and (bottom) 21.6 ppbv.
and decreases local ozone between 25 and 15 km. Although the ozone column reduction is about the same for 0 or 4000
injection units of NOx (Figure 1), the vertical profile of ozone is strongly modified by 4000 injection units (lower panel, Figure 2). Figure 2 explains many aspects of Figure 1. For a discussion of the chemical mechanisms for these effects, see Kinnison et al. [1988].
Ozone difference profiles for three agents that strongly change the model-calculated stratospheric ozone are given by Figure 3. These ozone differences are relative to a stratosphere with 1.1 ppbv Clx, but it is more instructive to compare the effect of large additions of Clx, N20, or injected NOx against the profile for 8 ppbv Clx which is included on each panel. This mixing ratio of Clx is that expected at steady state for long-term CFC releases at the current level. Further increases of Clx beyond 8 ppbv causes additional reduction of ozone at all altitudes (upper panel). Increase of nitrous oxide beyond the reference value causes additional ozone reduction relative to 8 ppbv Clx (middle panel) [Kin- nison et al., 1988]. All injections of NOx from aircraft at 20 km cause additional ozone reduction at all altitudes relative
to 8 ppbv Clx (lower panel). Since these ozone changes are given in concentration units (molecules per cubic centime- ter), the three panels of Figure 3 may be compared in that equal areas give equal changes in the ozone vertical column. In terms of the ozone vertical column (relative to that with 8 ppbv Clx), the ozone reduction caused by an NOx injection
16,356 JOHNSTON ET AL.' NITROGEN OXIDES FROM HIGH-ALTITUDE AIRCRAFT
6O
5O
4O
3O
2O
l0
E 50 • 40
= 30
• 2O
DIFFERENCE PROFILES
' I [ I ] I
[
NEO/Reference
_ I _ I
- NOX Injection 50-
40- I
.400 •500 20 to I0 I • I • I • I • I
-I.8 -I.2 -0.6 0 0.6
0:5 Minus Reference, molecule cm-:5/1012 Fig. 3. Vertical profiles of ozone changes caused by (top) large
increases in stratospheric C1 x, (middle) large multiple increases of the boundary value of nitrous oxide with Clx fixed at 7.9 ppbv, and (bottom) large injections of nitric oxide at 20 km as if by strato- spheHc aircraft with CI• fixed at 7.9 ppbv.
C l X/ppb -
_
_
_
_
• I ClX=8 -
-
_
_
_
, I ClX=8 -
-
_
_
_
of 2000 molecules cm -3 s -I over a 1-km band is comparable to doubling the global rate of CFC usage over the 1985 level or to doubling the value of tropospheric nitrous oxide.
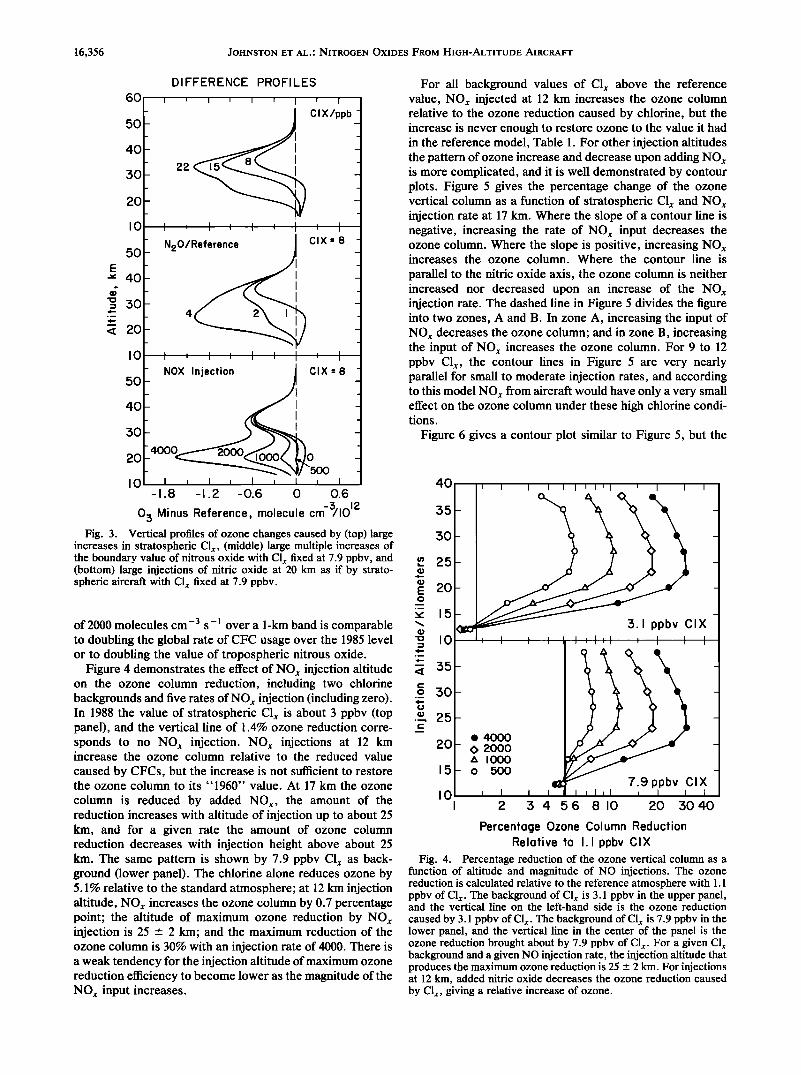
Figure 4 demonstrates the effect of NO• injection altitude on the ozone column reduction, including two chlorine backgrounds and five rates of NO• injection (including zero). In 1988 the value of stratospheric CI• is about 3 ppbv (top panel), and the vertical line of 1.4% ozone reduction corre- sponds to no NO• injection. NOx injections at 12 km increase the ozone column relative to the reduced value
caused by CFCs, but the increase is not sufficient to restore the ozone column to its "1960" value. At 17 km the ozone
column is reduced by added NO•, the amount of the reduction increases with altitude of injection up to about 25 km, and for a given rate the amount of ozone column reduction decreases with injection height above about 25 km. The same pattern is shown by 7.9 ppbv CI• as back- ground (lower panel). The chlorine alone reduces ozone by 5.1% relative to the standard atmosphere; at 12 km injection altitude, NO• increases the ozone column by 0.7 percentage point; the altitude of maximum ozone reduction by NO• injection is 25 _+ 2 km; and the maximum reduction of the ozone column is 30% with an injection rate of 4000. There is a weak tendency for the injection altitude of maximum ozone reduction efficiency to become lower as the magnitude of the NOx input increases.
For all background values of CI• above the reference value, NO• injected at 12 km increases the ozone column relative to the ozone reduction caused by chlorine, but the increase is never enough to restore ozone to the value it had in the reference model, Table 1. For other injection altitudes the pattern of ozone increase and decrease upon adding NO• is more complicated, and it is well demonstrated by contour plots. Figure 5 gives the percentage change of the ozone vertical column as a function of stratospheric CI• and NOx injection rate at 17 km. Where the slope of a contour line is negative, increasing the rate of NO• input decreases the ozone column. Where the slope is positive, increasing NO• increases the ozone column. Where the contour line is
parallel to the nitric oxide axis, the ozone column is neither increased nor decreased upon an increase of the N O• injection rate. The dashed line in Figure 5 divides the figure into two zones, A and B. In zone A, increasing the input of NO• decreases the ozone column; and in zone B, increasing the input of NOx increases the ozone column. For 9 to 12 ppbv CId, the contour lines in Figure 5 are very nearly parallel for small to moderate injection rates, and according to this model NOx from aircraft would have only a very small effect on the ozone column under these high chlorine condi- tions.
Figure 6 gives a contour plot similar to Figure 5, but the
4O
35
3O
• 25
E 20 o
,,' 15
õ io
<[ 35
._o 30
e 25
20
15
IO
[ I I I [ I 'l ' I I I
-
• 3. l ppbv CIX
_ _
ß 4000
- 0 2000 /• - /• I000 I
- o 500 •3• 7.9ppbv CIX - I 2 3 4 56 8 I0 20 3040
Percentoge Ozone Column Reduction Relotive to I.I ppbv CIX
Fig. 4. Percentage reduction of the ozone vertical column as a function of altitude and magnitude of NO injections. The ozone reduction is calculated relative to the reference atmosphere with 1.1 ppbv of C1 x. The background of C1 x is 3.1 ppbv in the upper panel, and the vertical line on the left-hand side is the ozone reduction
caused by 3.1 ppbv of C1 x. The background of C1 x is 7.9 ppbv in the lower panel, and the vertical line in the center of the panel is the ozone reduction brought about by 7.9 ppbv of C1 x. For a given C1 x background and a given NO injection rate, the injection altitude that produces the maximum ozone reduction is 25 _ 2 km. For injections at 12 km, added nitric oxide decreases the ozone reduction caused by Clx, giving a relative increase of ozone.

JOHNSTON ET AL.' NITROGEN OXIDES FROM HIGH-ALTITUDE AIRCRAFT 16,357
PERCENTAGE CHANGE OF OZONE VERTICAL COLUMN ALTITUDE OF NITRIC OXIDE INJECTION, 17/KM
2O
•15 x
,,..,
'- 10
o
= 5
00 1000 2000 3000 4000 Nitric Oxide Injection Rate/105molecules cm '2 s '1
Fig. 5. Contour plot of percentage change of the ozone vertical column as a joint function of nitric oxide injection rate at 17 km and stratospheric Clx mixing ratio. To the left of the dashed line (at high values of Clx and low nitric oxide injection rates), an increase in nitric oxide injection rate (as if by stratospheric aircraft) decreases the ozone reduction caused by Clx, giving a relative increase of ozone.
injection altitude is 20 km. It, too, has a region B where injection of NOx increases ozone, but the area is much less than it is for 17 km injection altitude. In general, the contour lines in the figure for 20 km injection altitudes are steeper than those for 17 km injection. Figure 7 gives a contour plot of the same sort, where the injection altitude is 30 km. This contour plot is similar to that at 20 km, and there appears to be no new effect for altitudes above 20 km. To summarize
Figures 5-7: at very large Clx mixing ratios, NOx injections in the stratosphere partially counteract the chlorine reduc- tions of ozone, but this effect occurs only in a highly chlorine-perturbed atmosphere where ozone is already greatly depleted.
Two-DIMENSIONAL MODEL RESULTS
The Model
The LLNL zonally averaged two-dimensional chemical- radiative-transport model [Wuebbles et al., 1987, 1989; Kin-
nison, 1989] currently determines the atmospheric distribu- tions of 31 chemically active trace constituents in the troposphere and stratosphere. The model domain extends from pole to pole, and from the ground to 0.56 mbar (approximately 0 to 54 km). The sine of latitude as used as the horizontal coordinate with intervals of about 10 ø. The
vertical coordinate corresponds to the natural logarithm of pressure
z* = -Ho In (P/Po) (1)
where H0 is the assumed scale height of 7.2 km and P0 is the surface pressure (1013 mbar). The vertical resolution in In (P/Po) is 0.417 or about 3 km. Ninety-five chemical and photochemical reactions are included in the model. Reaction rates, solar flux data, absorption cross sections, and quan- tum yields are based on the latest NASA panel recommen- dations [DeMore et al., 1987]. Photodissociation rates, in- cluding the effects of multiple scattering, are computed as a function of time at each zone, with optical depths consistent with calculated species distributions. Recent uses of the model include those of Wuebbles et al. [1989], DeLuisi et a/.[1989], Wuebbles and Kinnison [1988], and Watson et al. [1988].
The diabatic circulation for the ambient atmosphere is determined using net heating rates calculated in an internally consistent way with the derived species distributions. The technique for deriving the diabatic circulation is similar to that used by Solomon et al. [1986]: the vertical velocity is determined from the zonally averaged residual Eulerian thermodynamic equation, while the horizontal velocity is determined using the equation for mass continuity. The net heating rates are determined using accurate solar and infra- red radiative models.
Temperatures for the ambient atmosphere vary continu- ously, over the annual cycle, based on the reference model of Barnett and Corney [1984]. The derived diabatic circula- tion depends strongly on the temperature distribution; by using observed temperatures for the ambient atmosphere, a more accurate representation of the diabatic circulation can be derived.
For the perturbed atmosphere a perturbation form of the thermodynamic equation is solved for the changes in strato- spheric temperatures resulting from changes in the distribu-
PERCENTAGE CHANGE OF OZONE VERTICAL COLUMN ALTITUDE OF NITRIC OXIDE INJECTION, 20/KM
• -1
•' 15 2 -24 x
._o -18 '- 10 -16
o
0 1000 2000 3000 4000
Nitric Oxide Injection Rate/105molecules cm '2 gl Fig. 6. Same as Figure 5, except that nitric oxide injection from
stratospheric aircraft occurs at 20 km.
PERCENTAGE CHANGE OF OZONE VERTICAL COLUMN ALTITUDE OF NITRIC OXIDE INJECTION, 30/KM
0 0 22 ._o '- 10
o
0 1000 2000 3000 4000
Nitric Oxide Injection Rate/105molecules cm '2 s '1 Fig. 7. Same as Figure $, except that nitric oxide injection from
stratospheric aircraft occurs at 30 km.
16,358 JOHNSTON ET AL.: NITROGEN OXIDES FROM HIGH-ALTITUDE AIRCRAFT
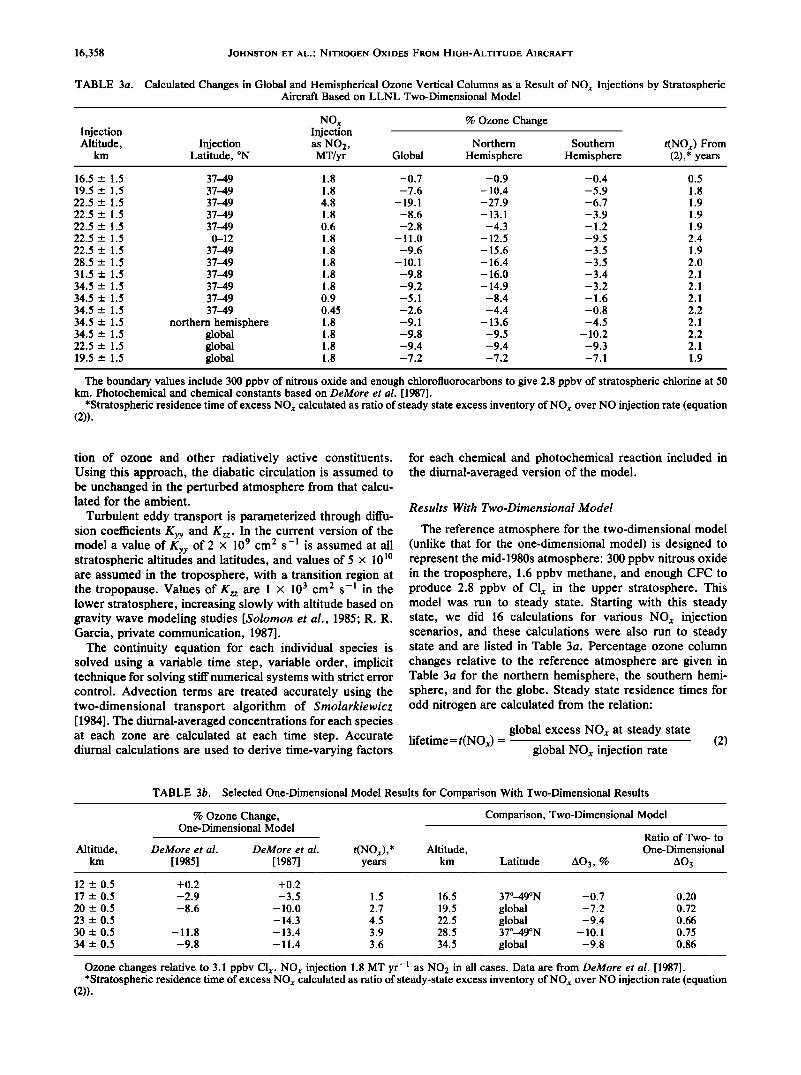
TABLE 3a. Calculated Changes in Global and Hemispherical Ozone Vertical Columns as a Result of NOx Injections by Stratospheric Aircraft Based on LLNL Two-Dimensional Model
NOx % Ozone Change Injection Injection Altitude, Injection as NO2, Northern Southern t(NOx) From
km Latitude, øN MT/yr Global Hemisphere Hemisphere (2),* years
16.5 -+ 1.5 37--49 1.8 -0.7 -0.9 -0.4 0.5 19.5 -+ 1.5 37--49 1.8 -7.6 -10.4 -5.9 1.8 22.5 -+ 1.5 37--49 4.8 -19.1 -27.9 -6.7 1.9 22.5 -+ !.5 37--49 1.8 -8.6 -13.1 -3.9 1.9 22.5 -+ 1.5 37--49 0.6 -2.8 -4.3 - 1.2 1.9 22.5 -+ 1.5 0-12 1.8 - 11.0 - 12.5 -9.5 2.4 22.5 -+ 1.5 37--49 1.8 -9.6 -15.6 -3.5 1.9 28.5 -+ 1.5 37--49 1.8 -10.1 -16.4 -3.5 2.0 31.5 -+ 1.5 37--49 1.8 -9.8 -16.0 -3.4 2.1 34.5 -+ 1.5 37--49 1.8 -9.2 -14.9 -3.2 2.1 34.5 -+ 1.5 37--49 0.9 -5.1 -8.4 -1.6 2.1 34.5 -+ 1.5 37--49 0.45 -2.6 -4.4 -0.8 2.2
34.5 -+ 1.5 northern hemisphere 1.8 -9.1 -13.6 -4.5 2.1 34.5 _+ 1.5 global 1.8 -9.8 -9.5 - 10.2 2.2 22.5 _+ 1.5 global 1.8 -9.4 -9.4 -9.3 2.1 19.5 _+ 1.5 global 1.8 -7.2 -7.2 -7.1 1.9
The boundary values include 300 ppbv of nitrous oxide and enough chlorofluorocarbons to give 2.8 ppbv of stratospheric chlorine at 50 km. Photochemical and chemical constants based on DeMore et al. [1987].
*Stratospheric residence time of excess NOx calculated as ratio of steady state excess inventory of NOx over NO injection rate (equation (2)).
tion of ozone and other radiatively active constituents. Using this approach, the diabatic circulation is assumed to be unchanged in the perturbed atmosphere from that calcu- lated for the ambient.
Turbulent eddy transport is parameterized through diffu- sion coefficients Kyy and Kzz. In the current version of the model a value of Kyy of 2 x 109 cm 2 s -1 is assumed at all stratospheric altitudes and latitudes, and values of 5 x 10 lø are assumed in the troposphere, with a transition region at the tropopause. Values of Kzz are 1 x 103 cm 2 s -• in the lower stratosphere, increasing slowly with altitude based on gravity wave modeling studies [Solomon et al., 1985; R. R. Garcia, private communication, 1987].
The continuity equation for each individual species is solved using a variable time step, variable order, implicit technique for solving stiff numerical systems with strict error control. Advection terms are treated accurately using the two-dimensional transport algorithm of Smolarkiewicz [ 1984]. The diurnal-averaged concentrations for each species at each zone are calculated at each time step. Accurate diurnal calculations are used to derive time-varying factors
for each chemical and photochemical reaction included in the diurnal-averaged version of the model.
Results With Two-Dimensional Model
The reference atmosphere for the two-dimensional model (unlike that for the one-dimensional model) is designed to represent the mid-1980s atmosphere: 300 ppbv nitrous oxide in the troposphere, 1.6 ppbv methane, and enough CFC to produce 2.8 ppbv of Clx in the upper stratosphere. This model was run to steady state. Starting with this steady state, we did 16 calculations for various NOx injection scenarios, and these calculations were also run to steady state and are listed in Table 3a. Percentage ozone column changes relative to the reference atmosphere are given in Table 3a for the northern hemisphere, the southern hemi- sphere, and for the globe. Steady state residence times for odd nitrogen are calculated from the relation:
global excess NOx at steady state lifetime = t(NO•) = (2)
global NO• injection rate
TABLE 3b. Selected One-Dimensional Model Results for Comparison With Two-Dimensional Results
% Ozone Change, One-Dimensional Model
Comparison, Two-Dimensional Model
Ratio of Two- to
Altitude, DeMore et al. DeMore et al. t(NOx),* Altitude, One-Dimensional km [1985] [1987] years km Latitude AO3, % AO3
12 -+ 0.5 +0.2 +0.2 17 -+ 0.5 -2.9 -3.5 1.5 16.5 37ø-49øN -0.7 0.20
20 -+ 0.5 -8.6 -10.0 2.7 19.5 global -7.2 0.72 23 _+ 0.5 -14.3 4.5 22.5 global -9.4 0.66 30 _+ 0.5 -11.8 -13.4 3.9 28.5 37ø-49øN -10.1 0.75
34 _+ 0.5 -9.8 - 11.4 3.6 34.5 global -9.8 0.86
Ozone changes relative to 3.1 ppbv Clx. NOx injection 1.8 MT yr -1 as NO2 in all cases. Data are from DeMore et al. [1987]. *Stratospheric residence time of excess NOx calculated as ratio of steady-state excess inventory of NOx over NO injection rate (equation
(2)).

JOHNSTON ET AL' NITROGEN OXIDES FROM HIGH-ALTITUDE AIRCRAFT 16,359
and these times are entered as the last column in Table 3a.
These stratospheric NOx residence times are 0.5 years at 16.5 km, 1.8 years at 19.5 km, and 2.1 years above 30 km.
Additional one-dimensional model calculations were made
to correspond to the reference atmosphere and injection rates used by the two-dimensional model. These results are given in Table 3b.
The latitudinal and altitudinal NOx distribution for the reference atmosphere in January is given as the top panel of Figure 8. The maximum value is 22 ppbv at about 45 km in the equatorial stratosphere. For a uniform global NO injec- tion equivalent to 1.8 MT NO2 yr -• at 21-24 km, the distribution of mixing ratios of excess nitrogen oxides is given by the middle panel of Figure 8. The maximum local increase of NOx is 8 ppbv at mid-latitude in the northern hemisphere, and the total global increase of NOx is 43% (1.133 x 10 35 to 1.618 x 10 35 molecules). For the same injection between 37 ø and 49øN, the distribution of excess NOx is given by the lower panel of Figure 8. The maximum local mixing ratio of excess NOx is 14 ppbv at 23 km in temperature and polar regions of the northern hemisphere. There is a 2 ppbv increase of NOx in the southern hemi- sphere stratosphere.
For the uniform global injection of nitrogen oxides at
• •1 • ' I ' • I I _ Jan I _ ) 4 -
Jul 1
Apr 1
50 o•. 1 JAN 1ST
40 _•.••-s••••.._• - 3 30 -s • -lO•"• -'•""•'- 10
••1•7o• •• 30 2o lO 300
• = LLNL 2-D MODEL 0 , , ] , • , r , 1000 90S 60 30 0 30 60 90N
Latitude
Fig. 9. Percent change in ozone for the uniform global injection of 1.8 MT NO2 yr -] between 21 and 24 km: (top) change in ozone vertical column as a function of latitude and season; (bottom) change in local ozone during January as a function of latitude and altitude. Compare middle panel of Figure 8.
50
40
30
20
10
5O
• 30 = 20
10
o
50
4o
3o
2o
' 't'18•-'-'7 ' I ' I ' I '
-• C 1 3
---- 10
30
100
300
1000
1
3
3O
100
3OO
1000
1
3
10
3O
100
3OO
0 1000 90 60 30 0 30 60 90
Latitude
Fig. 8. Two-dimensional distributions of nitrogen oxides (ppbv) during January: (top) background mixing ratios in reference atmo- sphere, which includes 2.8 ppbv Clx; (middle) steady state increase of stratospheric nitrogen oxides with injection of 1.8 MT NO2 yr-] spread uniformly over the globe between 21 and 24 km; (bottom) the same altitude and amount of nitrogen oxides injected between 37 ø and 49øN.
22.5 + 1.5 km (conditions shown by the center panel of Figure 8), the percent changes of the ozone column are shown as a function of season and latitude in the upper panel of Figure 9, and the vertical profiles of percentage ozone changes (January) are given as the lower panel of Figure 9. The ozone column reductions are as high as 14% during spring in polar regions, are about 10% in mid-latitudes, and are about 6% at equatorial latitudes. The global average ozone change is -9.4%. In January the maximum local ozone reduction is 25%, occurring at 20 km in the southern polar region.
For the same NOx injection shown in Figure 9 but restricted between 37øN and 49øN (compare the lower panel of Figure 8), the calculated ozone changes are given by Figure 10. Figure 10 shows a maximum ozone column reduction of 22%. The maximum local ozone reduction is
30%. The narrow corridor of injection in the northern hemisphere gives an ozone reduction of about 4-5% in mid-latitudes of the southern hemisphere. The global aver- age ozone reduction is 8.6%.
The same NOx injection in Figure 10 at 34.5 km reduces global average ozone by about the same (9%) as for injection at 22.5 km, but the extreme values are much greater for the high-altitude injection (Figure 11). At 34.5 km injection the maximum reduction of the ozone column is 34% in the polar spring, and the maximum local ozone reduction in January is 55%, compared to 22% and 30%, respectively, for injection at 22.5 km.
For the standard NOx injection over the narrow northern hemisphere band, the maximum global average reduction of the ozone column as a function of injection altitude is 10.1% at 28.5 km. The extremes of ozone reduction are intermedi-
ate between the values based on injection at 22.5 and 34.5 km (Figure 12). The maximum column reduction is 32% and the maximum reduction of local mixing ratio is 45%.
The standard NOx injection (Figure 10) at 19.5 km pro-

16,360 JOHNSTON ET AL ' NITROGEN OXIDES FROM HIGH-ALTITUDE AIRCRAFT
Jan 1
Oct 1
Jul 1
Apr I
5O
4O
•. 20
10
- ••--6 -4 -4 -1 i- _oL ' '
JAN 1ST _
90S 60 30
3
.• - 30 - 100
- 300 LLNL 2-D MODEL
, • , .•---o• _ 1000 0 30 60 90N
Latitude
Fig. 10. Same as Figure 9, except for injection only between 37 ø and 49øN. Compare lower panel of Figure 8.
duces ozone reduction patterns (Figure 13) that are similar to the cases at 22.5 km, but the magnitudes are less. The maximum ozone reduction is 16% in the polar fall, 12 __+ 2% across the northern hemisphere temperate zone (30ø-45ø), 6 _ 2% between 0ø-15øN, and 5 - 1% in the tropical and temperate southern hemisphere. The maximum local ozone reduction is 25% near the region of injection. The global average ozone reduction is 7.6%.
The standard NOx injection (Figure 10) at 16.5 km (15 to 18 km) altitude gives small calculated ozone reductions (Figure 14). The maximum ozone column reduction is about 2% in the northern polar region, about 1% across the northern mid-latitudes, and 0.5% or less in tropical regions and in the temperate southern hemisphere. Ozone increases
about 1% in the troposphere of the northern hemisphere. The global average ozone change is -0.7%.
For NOx injection at 34.5 km and between 37 ø and 45øN, the global ozone reduction increases somewhat slower than linearly with the global rate of NOx injection: 2.6% for 0.45 MT yr -• , 5.1% for 0.90 MT yr -• , and 9.8% for 1.8 MT yr -• (Table 3a). For the same global average NO• injection rate at 34.5 km, the global average ozone reduction according to the two-dimensional model is almost the same, 9.1-9.8%, regardless of whether the injection was globally uniform, was only over the northern hemisphere, or was confined to a narrow latitudinal band (370-49 ø ) in the northern hemisphere.
An interesting case is seen when NOx is injected in an equatorial region, between 0 ø and 12øN at 22.5 km. The global average ozone reduction is 11.0%, which is distinctly greater than the value of 8.6% for the same injection between 37 ø and 49øN (Table 3a, fourth and sixth lines from the top). This difference is due to tropical air rising in the equatorial stratosphere as a part of the global circulation and spreading the injected NOx over the stratosphere of the northern and southern hemispheres, whereas injection at 370-49 ø is closer to the polar sink for stratospheric air.
COMPARISON OF ONE-DIMENSIONAL AND
Two-DIMENSIONAL MODELS
There is a small difference in the chemical model used by the one-dimensional and the two-dimensional models. The
main body of calculations using the one-dimensional model (Table 1) used 1985 chemistry, being completed before the 1987 tabulation was published [DeMore et al., 1985, 1987]. The two-dimensional model calculations were made with the
1987 tabulation. For Table 2 and for injection altitudes of 17, 20, 23, 30, and 34 km, spot calculations were made with the one-dimensional model using 1987 chemistry (Table 3b). At all altitudes above 16 km the calculated ozone reduction
using the 1987 chemistry is 15 -+ 5% greater than that of 1985, according to the one-dimensional model.
LLNL 2-D MODEL _
Jan 1
Oct 1
•o Jul 1
Apr 1
I 50
3 40
lO i 30 =o
ß '- 20 lOO •
300 10
- -4 6 -
LLNL 2-D MODEL
1
3
lO
30 • lOO
300
o , i , t , • , •--o•---.+____ _ 1000 1000 90S 60 30 0 30 60 90N 90S 60 30 0 30 60 90N
Latitude Latitude
Fig. 11. Same as Figure 9, except altitude of injection is 33- Fig. 12. Same as Figure 9, except altitude of injection is 24- 36 km and latitude of injection is 37ø-49øN. 27 km and latitude of injection is 37ø-49øN.

JOHNSTON ET AL.' NITROGEN OXIDES FROM HIGH-ALTITUDE AIRCRAFT 16,361
For a given magnitude and altitude of NOx injection the two-dimensional model gives smaller ozone reductions than the one-dimensional (Table 3b). For globally uniform NOx injection of 1.8 MT yr -1 at 34.5 +-- 1.5 km in the two- dimensional model, the global average ozone reduction is 9.8%; an equivalent injection in the one-dimensional model at 34 +_- 0.5 km reduces ozone by 11.4%, which gives a ratio (two-dimensional/one-dimensional) of 0.86. A similar com- parison at 22.5 and 23 km gives a ratio of 0.66 for the two-dimensional ozone reduction compared to that of the one-dimensional model. For the same magnitude injection at 19.5 -+ 1.5 km in the two-dimensional model, the global ozone reduction is 7.2%; for the equivalent injection at 20 -+ 0.5 km in the one-dimensional model, the ozone column reduction is 10.0%, which gives a ratio of 0.72. Other examples are given in Table 3b. A part of this difference is to be ascribed to the different grid heights of the two models and the 0.5-km offset of the grid centers.
In general, the one-dimensional model gives substantially longer atmospheric lifetimes to injected odd nitrogen than those calculated by the two-dimensional model. The lifetime of excess NOx injected into the stratosphere was calculated from (2) for both one- and two-dimensional models, and these values are included in Table 3. For NOx injection at 34 -+ 0.5 km, the one-dimensional lifetime of excess NOx is 3.6 years, which is 1.6 times the value of 2.2 years for the two-dimensional model (34.5 -+ 1.5 km injection). At 23 -+ 0.5 km injection altitude the one-dimensional lifetime is 4.5 years, which is 2.4 times as long as 1.9 years for the two-dimensional model (22.5 --- 1.5 km). At 20 --- 0.5 km injection altitude the one-dimensional lifetime is 2.7 years, which is 1.4 times as long as 1.9 for the two-dimensional model (19.5 -+ 1.5 km).
From these considerations of stratospheric lifetimes it is clear that the two-dimensional model sweeps excess NOx out of the stratosphere faster than the one-dimensional model. Clearly, the two-dimensional model is more nearly realistic than the one-dimensional model in that it represents
Jan I
Oct 1
c Jul 1 o
Apr I
Fig. 13.
50-
4O
3O
2O
10-
JAN 1ST
LLNL 2-D MODEL
-1
-3
-10
30 •
lOO
- 300
o i , • , [ , i , •.o---.___• , - lOOO 9os 60 30 o 30 60 90N
Latitude
Same as Figure 9, except altitude of injection is 18- 21 km and latitude of injection is 37ø-49øN.
Jan I , , , , , ,
7 Jul 1
Apr I • -
30 '• •
20
10- LLNL 2-D MODEL
Fig. 14.
1
3
lO
30 E
lOO
3oo
__---o----_., , , , , -ooo 60 30 0 30 60 90 Latitude
Same as Figure 9, except altitude of injection is 15- 18 km and latitude of injection is 37ø-49øN.
the effects of atmospheric circulation on global trace gas transport. Both models use empirical eddy diffusion func- tions: Kzz and Kyy for the two-dimensional model and K z for the one-dimensional model. Although these functions repre- sent a small additive part of the transport in the two- dimensional model and the K z function represents all the transport in the one-dimensional model, one should recog- nize that there remain uncertainties in the eddy diffusion formulations in both models.
CONCLUSIONS
Using an old estimate [SCEP, 1970] for the rate of fuel consumption by stratospheric aircraft, the range of nitric oxide injections considered by this paper may be interpreted as covering an eightfold range of emission index (5-40) with both the one- and two-dimensional models. Relations be-
tween various measures of NOx injection rate and calculated ozone reduction for injections at 20 km for the one- dimensional model and at 22.5 km for the two-dimensional
model are presented in Table 4. If no attention is given to reducing nitric oxide emissions below the current values (40-60 g NO per kilogram fuel) for commercial jet engines, large ozone reductions are calculated by both one- and two-dimensional models for an economically viable fleet of stratospheric aircraft operating at or above 20 km. For emission index of 40 (that of current high-performance commercial aircraft flying at about 12 km), Table 4 displays 22% ozone column reduction, according to the one- dimensional model with 20 km injection altitude, and 19% global average ozone reductions according to the two- dimensional model with injection at 22.5 km. These large ozone reductions are outside the expected range of validity of these models, and the exact numerical values are not so important as the conclusion that large ozone reductions are to be anticipated if there should be a large fleet of strato- spheric aircraft with NOx emission characteristics of current commercial aircraft. If engines are redesigned to give an

16,362 JOHNSTON ET AL..' NITROGEN OXIDES FROM HIGH-ALTITUDE AIRCRAFT
TABLE 4. Relation Between Emission Index, NOx Injection Measures, and Calculated Ozone Reduction
NO Injection NO2 Injection Rate,
Emission Index Rate, molecules/10 5 for NO* MT yr-• cm-2 s -•
Calculated AO•
One-Dimensional Two-Dimensional Model Model
Subsonic (1989) 40 4.8 4000 - 22% - 19% Standard (1974) 15 1.8 1500 -8.6% -8.6% NASA goal (1997) 5 0.6 500 -2.4% -2.8
Annual fuel consumption by stratospheric aircraft is assumed to be 7.7 x 10 lø. For one-dimensional model: vertical column AO3, 20 km injection altitude, 3.1 ppbv Clx [DeMore et al., 1985]. For two-dimensional model: global average AO3, injection at 22.5 --- 1.5 km and 37ø-49øN, 2.8 ppbv CI x [DeMore et al., 1987].
*Emission index: grams of nitric oxide in engine exhaust per kilogram of fuel burned.
emission index of 15, both one- and two-dimensional models under the conditions of Table 4 give calculated global ozone reduction of about 9%. If engines are redesigned to reduce the emission index to the NASA goal of 5, global average ozone reductions in Table 4 are between 2 and 3%, and those of the northern hemisphere are about 4% (Table 3a). Even with attainment of the NASA goal, the calculated ozone reduction by stratospheric aircraft is comparable (dependent on altitude of injection) to that calculated for indefinite usage of CFC at the 1985 rate (Figure 4). According to these models the effect of stratospheric aircraft on ozone could be further reduced if they operate at lower altitudes or there is a decrease the number of aircraft or they achieve greater efficiency of fuel consumption.
Acknowledgments. The work at the University of California and the Lawrence Berkeley Laboratory was supported by the Director, Office of Energy Research, Office of Basic Energy Sciences, Chem- ical Sciences Division of the U.S. Department of Energy under contract DE-AC03-76SF00098. Work at Lawrence Livermore Na-
tional Laboratory was performed under the auspices of the U.S. Department of Energy under contract W-7405-ENG-48 and was supported in part by NASA's Upper Atmospheric Program.
REFERENCES
Alyea, F. N., D. M. Cunnold, and R. G. Prinn, Stratospheric ozone destruction by aircraft-induced nitrogen oxides, Science, 188, 117-121, 1975.
Barnett, J. J., and M. Corney, A middle atmosphere temperature reference model from satellite measurements, Adv. Space Res., 5, 125-134, 1984.
Climatic Impact Assessment Program, Report of findings: The effects of stratospheric pollution by aircraft, Rep. DOT- TST-75-50, edited by A. J. Grobecker, S.C. Coroniti, and R. H. Cannon, Jr., 551 pp., Dep. of Transp., Washington, D.C., 1974.
Climatic Impact Assessment Program, Propulsion effluent in the stratosphere, Monogr. 2, U.S. Dep. of Transp., Washington, D.C., 1975a.
Climatic Impact Assessment Program, The stratosphere perturbed by propulsion effluent, Monogr. 3, U.S. Dep. of Transp., Wash- ington, D.C., 1975b.
Cunnold, D. M., F. N. Alyea, N. A. Phillips, and R. G. Prinn, Relative effects on atmospheric ozone of latitude and altitude of supersonic flight, AIAA J., 15, 337-345, 1977.
DeLuisi, J. J., D. J. Longenecker, C. L. Mateer, and D. J. Wuebbles, An analysis of northern middle-latitude Umkehr mea- surements corrected for stratospheric aerosols for 1978-1986, J. Geophys. Res., 94, 9837-9846, 1989.
DeMore, W. B., J. J. Margitan, M. J. Molina, R. T. Watson, D. M. Oolden, R. F. Hampson, M. J. Kurylo, C. J. Howard, and A. R. Ravishankara, Chemical kinetics and photochemical data for use in stratospheric modeling, Publ. 85-37, Jet Propul. Lab., Pasa- dena, Calif., 1985.
DeMore, W. B., J. J. Margitan, M. J. Molina, R. T. Watson, D. M.
Golden, R. F. Hampson, M. J. Kurylo, C. J. Howard, and A. R. Ravishankara, Chemical kinetics and photochemical data for use in stratospheric modeling, Publ. 87-41, Jet Propul. Lab., Pasa- dena, Calif., 1987.
Ferri, A., Better marks on pollution for the SST, Astron. Aeron., 37-41, 1972.
Johnston, H. S., Reduction of stratospheric ozone by nitrogen oxide catalysts from supersonic transport exhaust, Science, 173, 517- 522, 1971.
Kinnison, D. E., Effect of trace gases on global atmospheric chemical and physical processes, Ph.D. thesis, Univ. of Calif., Berkeley, 1989.
Kinnison, D. E., H. S. Johnston, and D. J. Wuebbles, Ozone calculations with large nitrous oxide and chlorine changes, J. Geophys. Res., 93, 14,165-14,175, 1988.
Luther, F. M., J. S. Chang, W. H. Duewer, J. E. Penner, R. L. Tarp, and D. J. Wuebbles, Potential environmental effects of aircraft emissions, Rep. UCRL-52861, Lawrence Livermore Natl. Lab., Livermore, Calif., 1979.
NASA, High Speed Commercial Transport Stratospheric Advisory Committee, report of meeting, Dec. 20, 1988.
National Academy of Sciences (NAS), Environmental Impact of Stratospheric Flight, 348 pp., Washington, D.C., 1975.
Ott, J., High-speed transport study focuses on lower Mach range, Aviat. Week Space Technol., 60-61, 1988.
Smolarkiewicz, P. K., A fully multidimensional positive definitive advection transport algorithm with small implicit diffusion, J. Cornput. Phys., 54, 325-362, 1984.
Solomon, S., R. R. Garcia, and F. Stordal, Transport processes and ozone perturbations, J. Geophys. Res., 90, 12,981-12,989, 1985.
Solomon, S., J. T. Kiehl, R. R. Garcia, and W. Grose, Tracer transport by the diabatic circulation deduced from satellite obser- vations, J. Atmos. Sci., 43, 1604-1617, 1986.
Study of Critical Environmental Problems (SCEP), Man's Impact on the Global Environment: Study of Critical Problems, MIT Press, Cambridge, Mass., 1970.
Watson, R. T., and Ozone Trends Panel, M. J. Prather and Ad Hoc Theory Panel, and M. J. Kurylo and NASA Panel for Data Evaluation, Present state of knowledge of the upper atmosphere 1988: An assessment report, NASA Ref. Publ. 1208, 1988.
Widhopf, G. F., and L. G. Glatt, Two-dimensional description of the natural atmosphere including active water vapor modeling and potential perturbations due to NOx and HOx aircraft emissions, Rep. FAA-E-79-07, High Altitude Pollut. Program, U.S. Dep. of Transp., Washington, D.C., April 15, 1979.
Widhopf, G. F., L. G. Glatt, and R. S. Kramer, Potential ozone column increase resulting from subsonic and supersonic aircraft emissions, AAIA J., 15, 1322-1330, 1977.
World Meteorological Organization (WMO), Atmospheric ozone: Assessment of our understanding of the processes controlling its present distribution and change, Rep. 16, Global Ozone Res. and Monit. Proj., Geneva, 1985.
Wuebbles, D. J., A theoretical analysis of the past variations in global atmospheric composition and temperature, Rep. UCRL- 53423, Lawrence Livermore Natl. Lab., Livermore, Calif., 1983.
Wuebbles, D. J., and J. S. Chang, Sensitivity of time-varying parameters in stratospheric modeling, J. Geophys. Res., 80, 2637-2642, 1975.
Wuebbles, D. J., and D. E. Kinnison, A two-dimensional model

JOHNSTON ET AL.: NITROGEN OXIDES FROM HIGH-ALTITUDE AIRCRAFT 16,363
study of past trends in global ozone, paper presented at Interna- tional Quadrennial Ozone Symposium, Int. Assoc. of Meteorol. and Atmos. Phys., Goettingen, Federal Republic of Germany, Aug. 8-13, 1988.
Wuebbles, D. J., P.S. Cormell, K. E. Grant, R. Tarp, and K. E. Taylor, Initial results with the LLNL two-dimensional chemical- radiative-transport model of the troposphere and stratosphere, Rep. UCRL-21178, Lawrence Livermore Natl. Lab., Livermore, Calif., 1987.
Wuebbles, D. J., K. E. Grant, P.S. Cormell, and J. E. Penner, The role of atmospheric chemistry in climate change, APCA J., 39, 22-28, 1989.
H. S. Johnston, Department of Chemistry, University of Califor- nia, Berkeley, CA 94720.
D. E. Kinnison and D. J. Wuebbles, Atmospheric and Geophys- ical Science Division, Lawrence Livermore National Laboratory, Livermore, CA 94550.
(Received November 8, 1988; revised June 26, 1989;
accepted June 26, 1989.)


![How to reduce emission of nitrogen oxides [NOx] from](https://img.dokumen.tips/doc/110x75/616a4dd111a7b741a35108dc/how-to-reduce-emission-of-nitrogen-oxides-nox-from-.jpg)