Embed Size (px)
Citation preview
Zentrum für Entwicklungsforschung (ZEFc) _______________________________________________________________
Nitrogen management in irrigated cotton-based systems under
conservation agriculture on salt-affected lands of Uzbekistan
Inaugural-Dissertation
zur
Erlangung des Grades
Doktor der Agrarwissenschaften
(Dr. agr.)
der Hohen Landwirtschaftlichen Fakultät
der
Rheinischen Friedrich-Wilhelms-Universität
zu Bonn
vorgelegt am im July 2011
von
Mina Kumari Devkota-Wasti
aus
Nawalparasi, Nepal

Gedruckt mit Unterstützung des Deutschen Akademischen Austauschdienstes (DAAD) 1. Referent: PD Dr. Christopher Martius 2. Referent: Prof. Dr. Paul L.G. Vlek Tag der Promotion: 22.07.2011 Erscheinungsjahr: 2011 Diese Dissertation ist auf dem Hochschulschriftenserver der ULB Bonn http://hss.ulb.uni-bonn.de/diss_online elektronisch publiziert
Dedicated to my late father
Khagu Prasad Wasti

ABSTRACT
Intensive soil tillage and mismanagement of irrigation water and fertilizers reduce soil organic matter and increase secondary soil salinization. These processes are increasing production costs, reducing soil fertility and threatening the sustainability of crop production systems in the irrigated drylands of Uzbekistan, Central Asia. These adverse effects can be counterbalanced by conservation agriculture (CA) practices combined with optimum nitrogen (N) management. This has been demonstrated in rainfed areas, but only sparse findings exist for irrigated crop production. Therefore, the effects of tillage, crop residue management and N rates were examined on growth, yield, water and N use efficiency (NUE), and the N balance of crops as well as the soil salinity dynamics in two cotton-based systems, (i) cotton/wheat/maize and (ii) cotton/cover-crop/cotton, in Khorezm, a region in northwest Uzbekistan. Also, on smaller sub-plots the effect of three different furrow irrigation techniques on the distribution and management of soil salinity on raised beds was studied. These techniques were every-furrow (EFI), alternating skip furrow (ASFI), and permanent skip furrow irrigation (PSFI).
The split-plot experiments with four replications were conducted from 2008-2009 in an area covering 3 ha. They included two tillage methods (permanent raised bed, BP; and conventional tillage, CT); two residue levels (retaining the maximum possible amount, RR; and removing residues according to farmers’ practices, RH); and three N levels: no application (N-0); low-N (125 kg N ha-1 for cotton and 100 kg N ha-1 for wheat and maize); and high-N (250 kg N ha-1 for cotton, and 200 kg N ha-1 for wheat and maize). These treatments were evaluated on land previously cropped using conventional means (CT). The official N recommendation for the study region is 160-180, 180 and 150 kg N ha-1 for cotton, wheat and maize, respectively.
Raw cotton yield and its components were not affected by tillage methods in both cotton-based rotation systems in the first season after transformation from CT to CA practices. However, already one cropping cycle later, wheat and maize under BP produced, respectively, 12 and 42% higher grain yields than under CT. Under BP, water productivity increased in wheat by 27% and in maize by 84%, whilst 12% less water was applied during wheat and 23% during maize production compared to CT. Nitrogen applications significantly increased the growth and yield of all crops under both tillage practices. However, the response to N applied was higher under BP than CT. Increased boll density and boll weight in cotton, number of spikes m-2 and grains per spike in wheat, and cob density and number of grains per cob in maize predominantly caused higher yields. Total NUE in BP was higher by 42% in cotton, 12% in wheat, and 82% in maize crops compared to CT. With high N applications, the apparent positive N balance (N loss) in BP was lower by 71% in the cotton/wheat/maize system and by 53% in the cotton/cover-crop/cotton system than under CT.
Residue retention in BP increased grain yield of wheat and maize in the absence of N applications, but had an insignificant effect on crop yield at low-N and high-N application rates. Residue retention had no effect at all N levels under CT. In BP, it minimized the rate of soil salinity increase by 45% in the top 10 cm and by 18% in the top 90 cm soil profile compared to RH. The inclusion of a winter cover crop in the cotton-cotton rotation reduced the groundwater nitrate contamination considerably, and increased the NUE under both BP and CT.
Soil salinity on top of the beds increased significantly with EFI and ASFI compared to PSFI. The latter practice of salinity management provided the less saline area towards the irrigated furrow, as salts accumulated on the dry furrows. These accumulated salts can be leached, which reduced the salinity level in the center of the beds two-fold compared to EFI and ASFI.
For cotton, wheat and maize, grown in rotation, BP and residue retention with application of the recommended N for maize and ~15% less than recommended N for cotton and wheat were in many aspects superior to CT practices. Permanent bed cotton cultivation with a winter cover crop is a suitable alternative for cotton-cotton based systems in irrigated drylands of Uzbekistan. Should residues not be available, PSFI is a suitable alternative for salt management in raised bed planting in salt-affected irrigated lands.
Stickstoffmanagement im bewässerten Baumwollanbausystem mit konservierender Bodenbearbeitung (conservation agriculture) in versalzten Böden in Usbekistan KURZFASSUNG
Intensive Bodenbearbeitung und inadäquates Management von Bewässerungswasser und Düngemitteln reduzieren organisches Material im Boden und führen zu zunehmender sekundärer Bodenversalzung. Diese Prozesse steigern die Produktionskosten, schmälern die Bodenfruchtbarkeit und bedrohen damit letztendlich die Nachhaltigkeit der Anbausysteme in den bewässerten Trockengebieten von Usbekistan. Konservierende Bodenbearbeitung (CA), die mit optimalen Stickstoff-(N)-gaben kombiniert wird, kann den obengenannten negativen Auswirkungen entgegenwirken. Dies ist in Gebieten mit Regenfeldbau demonstriert worden, es gibt aber kaum Daten für den Bewässerungsanbau. Daher untersucht diese Studie die Auswirkungen von Bodenbearbeitung, Ernterückständen und Stickstoffgaben auf Pflanzenwachstum und -erträge sowie Wasserproduktivität, Effizienz von Stickstoffanwendungen (NUE), Stickstoffbilanz der Anbaupflanzen sowie Bodenversalzungsdynamik in zwei Baumwollsystemen: (i) Baumwolle/Weizen/Mais und (ii) Baumwolle/Gründüngung/Baumwolle in der Region Khorezm im Nordwesten Usbekistans. Außerdem wurden auf kleineren Versuchsparzellen die Auswirkungen von drei verschiedenen Furchenbewässerungsmethoden auf Verteilung und das Management von Bodenversalzung auf erhöhtem Pflanzbett (BP) untersucht und zwar Bewässerung jeder Furche (EFI), alternierendes Auslassen jeweils einer Furche (ASFI), und permanentes Auslassen der zweiten Furche (PSFI).
Die split-plot Feldversuche wurden mit vier Wiederholungen 2008-2009 auf einer Fläche von 3 ha durchgeführt. Untersucht wurden zwei Bodenbearbeitungsmethoden (permanente Pflanzbetten, BP) und konventionelle Bodenbearbeitung, CT); zwei Mengen von Ernterückständen (Belassen der höchstmöglichen Menge, RR, und Entfernen der Rückstände wie durch die Bauern praktiziert, RH); und drei N-Mengen: keine N-Gabe (N-0), niedrige N-Gaben (125 kg N ha-1 für Baumwolle und 100 kg N ha-1 für Weizen und Mais); und hohe N-Gaben (250 kg N ha-1 für Baumwolle und 200 kg N ha-1 für Weizen und Mais). Die Versuche wurden auf Land durchgeführt, das zuvor konventionell bearbeitet wurde (CT). Offiziell werden für das Untersuchungsgebiet Gaben von 160-180, 180 bzw. 150 kg N ha-1 für Baumwolle, Weizen bzw. Mais empfohlen.
Die Bodenbearbeitungsmethode hatte keinen Einfluss auf den Rohbaumwollertrag oder seine Bestandteile in beiden Baumwollrotationssystemen in der ersten Anbauperiode nach der Umwandlung von CT zu CA. Jedoch bereits einen Anbauzyklus nach der Einführung von CA lagen der Weizen- bzw. Maisertrag unter BP 12% bzw. 42% höher als unter CT. Verglichen mit CT nahm unter BP die Wasserproduktivität bei Weizen um 27% und bei Mais um 84% zu, während 12% weniger Wasser bei der Weizen- und 23% bei der Maisproduktion verbraucht wurde. Die Stickstoffgaben führten zu einer signifikanten Zunahme des Pflanzenwachstums und Ertrags aller Anbaupflanzen in beiden Bodenbearbeitungsmethoden, jedoch war der Effekt des Stickstoffs höher unter BP als unter CT. Die erhöhte Dichte und Gewicht der Baumwollbäusche und Anzahl der Weizenähren m-2 bzw. -körner pro Ähre bei Weizen, und die Kolbendichte und Anzahl der Körner pro Kolbe bei Mais führten zu höheren

Erträgen. Bei BP war die Gesamt-NUE 42% höher bei Baumwolle, 12% bei Weizen und 82% bei Mais im Vergleich zu CT. Bei hohen Stickstoffgaben war die apparente positive N-Bilanz (N-Verlust) bei BP 71% niedriger im Baumwoll-/Weizen-/ Maissystem und 53% im System Baumwolle/Gründüngung /Baumwolle als bei CT.
Das Belassen der Ernterückstände führte bei BP zu einem erhöhten Körnerertrag bei Weizen und Mais bei N-0, aber der Effekt war nichtsignifikant bei niedrigen bzw. hohen N-Mengen. Bei CT wurde bei keiner der N-Mengen eine Wirkung beobachtet. Bei BP führten die Rückstände zu einer um 45% bzw. 18% geringeren Zunahme der Bodenversalzung in den oberen 10 bzw. 90 cm des Bodens im Vergleich zu RH. Eine Winter-Gründüngung in der Baumwolle-Baumwolle-Rotation führte zu einer bedeutenden Abnahme der Grundwasserbelastung durch Nitrate sowie zu einer erhöhten NUE sowohl bei BP als auch bei CT.
Die Bodenversalzung bei BP in den oberen Bodenschichten nahm bei EFI und ASFI signifikant zu im Vergleich zu PSFI. Letztere Methode ergab einen weniger versalzten Bereich in Richtung bewässerter Furche, weil sich das Salz in den permanent trockenen Furchen anreicherte. Diese erhöhten Salzmengen können ausgewaschen werden, wodurch die Versalzung in der Mitte zweier Pflanzbetten um ein Zweifaches reduziert wurde im Vergleich zu EFI und ASFI.
Bei in Rotation angebauten Baumwolle, Weizen und Mais war BP mit Ernterückständen zusammen mit der jeweils empfohlenen N-Menge und mit ~15% unter den jeweiligen Empfehlungen liegenden N-Mengen in vielen Aspekten den CT Methoden überlegen. Anbau von Baumwolle auf erhöhten, permanenten Pflanzbetten zusammen mit einer Wintergründungung ist eine geeignete Alternative für Baumwolle-Baumwolle-Systeme in den bewässerten Trockengebieten von Usbekistan. Sollten Ernterückstände nicht verfügbar sein, ist PSFI eine geeignetes alternatives Bodenversalzungsmanagement bei BP auf versalzten bewässerten Flächen.

ИСПОЛЬЗОВАНИЕ АЗОТНЫХ УДОБРЕНИЙ В СИСТЕМЕ ХЛОПКОВОГО СЕВООБОРОТА ПРИ ПРИМЕНЕНИИ РЕСУРСОСБЕРЕГАЮЩИХ ТЕХНОЛОГИЙ НА ЗАСОЛЕННЫХ ЗЕМЛЯХ УЗБЕКИСТАНА
АННОТАЦИЯ
Интенсивная вспашка и неэффективное использование оросительной воды и минеральных удобрений приводят к снижению содержания гумуса и увеличению вторичного засоления почвы. Эти процессы повышают производственные затраты, приводят к падению плодородия почвы, а также являются преградой для ведения устойчивого земледелия на орошаемых землях Узбекистана и Центральной Азии. Эти неблагоприятные эффекты можно предотвратить прилагая ресурсосберегающие и почвозащитные технологий и оптимальные нормы азотных (N) удобрений. В настоящем данная технология широко применяется в богарных условиях, однако ограниченная информация существует для орошаемого земледелия.
Исходя из этого, в условиях Хорезмской области Узбекистана нами была изучена эффективность вспашки, растительных остатков культур и норм азота на рост и продуктивность, эффективность использования воды и азотных удобрений, баланс азота и динамика засоления почв при двух хлопковых севооборотах: (1) хлопчатник-озимая пшеница/кукуруза в повторном севе и (2) хлопчатник-промежуточная культура-хлопчатник. В дополнительном эксперименте изучали влияния трёх методов полива на распределение почвенного засоления в гребнях: (1) полив в каждую борозду, (2) полив через борозду и (2) полив в выборочные борозды.
Полевые опыты были проведены в 2008-2009 гг. в четырех повторениях на площади 3 га методом разделенных делянок. Варианты опыта состояли из двух методов вспашки почвы (обычная вспашка (ОВ) и постоянные гребни (ПГ)) и двух уровней оставления растительных остатков на поле (сохрание растительных остатков всех культур, выращенных на поле и удаление растительных остатков по традиционному методу (практика фермеров). Изучались три нормы азотных удобрений: без внесения удобрений (N0), низкая норма N (125 кг/га под хлопчатник и по 100 кг/га под пшеницу и кукурузу) и высокая норма N (250 кг/га под хлопчатник и по 100 кг/га под пшеницу и кукурузу). До закладки опыта на участке возделывались культуры с применением обычных агротехнологий. Официальные рекомендации по применению N-удобрений в регионе составляют: 160-180 кг/га под хлопчатник, 180 кг/га под пшеницу и 150 кг/га под кукурузу.
В первый год изысканий, с переходом с обычной на почвозащитную технологию при обеих системах севооборота, методы вспашки не оказали влияния на урожай хлопка-сырца. Однако после первого цикла выращивания культур уже было отмечено, что урожай зерна пшеницы и кукурузы на варианте ПГ возрос на 12 и 42% соответственно по сравнению с ОВ. Эффективность оросительной воды на варианте ПГ увеличилась на 27% на пшеничном и на 84% на кукурузном полях. При этом, на выращивание пшеницы и кукурузы было затрачено соответственно на 12 и 23% меньше поливной воды по сравнению с вариантом ОВ.
Применение N-удобрений значительно повысило рост и урожайность всех культур на обеих системах вспашки. Однако эффективность N была выше на варианте ПГ, чем ОВ. Повышение урожайности культур привело к увеличению количества коробочек на одном растении, веса одной коробочки хлопчатника, количества колосьев на м2 и зерна пшеницы, а также количества початков кукурузы и зёрен в нем. Коэффициент использования азота удобрений на варианте ПГ был выше на 42% на хлопчатнике, 12% на пшенице и 82% на кукурузе по сравнению с вариантом ОВ. При высоких нормах азотных удобрений очевидный позитивный баланс N (потери N) на варианте ПГ снизился на 71% в севообороте хлопчатник-пшеница/кукуруза и на 53% в

севообороте хлопчатник-промежуточная культура-хлопчатник по сравнению с вариантом ОВ.
На варианте ПГ без внесения азота сохранение растительных остатков способствовало повышению урожая зерна пшеницы и кукурузы. Однако при низкой и высокой нормах азота уровень растительных остатков не оказал влияние на урожайность этих культур. На варианте ПГ с полным сохранением растительных остатков на поле, в сравнении с удалением растительных остатков, скорость засоления почвы в 0-10 см слое почвы снизился на 45%, а в 0- 90 см слое на 18%. При обеих системах обработки почвы возделывание озимой промежуточной культуры привело к значительному сокращению уровня загрязнения грунтовых вод нитратами и повысило эффективность азотных удобрений. Уровень засоления почвы на поверхности гребней значительно повысился при поливе в каждую или через борозду, чем при поливе в выборочные борозды. В последнем случае площадь накопления солей была значительно меньше, так как концентрация солей происходила в неполиваемых бороздах. Эта соль может быть промыта, и тем самым уровень засоления почвы в данном случае снизится в два раза, чем при поливе в каждую или через борозду.
Возделывание хлопчатника, пшеницы и кукурузы в севообороте на постоянных гребнях с сохранением растительных остатков и использованием рекомендуемых норм азотных удобрений для кукурузы и снижение рекомендуемой нормы на ~15% для хлопчатника и пшеницы во многих аспектах превосходил технологию ОВ. Выращивание хлопчатника на постоянных гребнях с сохранением растительных остатков и последующей подзимней промежуточной культуры является приемлемой альтернативой монокультуре хлопчатника на орошаемых землях Узбекистана. Проведение поливов в выборочные борозды в случае удаления растительных остатков с поля может быть альтернативной технологией полива для контроля засоления почвы при возделывании культур на постоянных гребнях в орошаемых условиях.

TABLE OF CONTENTS
1 GENERAL INTRODUCTION ......................................................................... 1
1.1 Problem setting .................................................................................................. 1
1.2 The potential and challenges of conservation agriculture in irrigated drylands 4
1.3 Research objectives ........................................................................................... 6
1.4 Outline of the thesis ........................................................................................... 7
2 STUDY REGION .............................................................................................. 8
2.1 Geographical and demographical setting .......................................................... 8
2.2 Climate .............................................................................................................. 9
2.3 Soil ................................................................................................................. 11
2.4 Land use ........................................................................................................... 14
3 IMPACT OF TILLAGE AND NITROGEN FERTILIZATION ON PERFORMANCE AND NITROGEN USE EFFICIENCY OF COTTON IN A COTTON/COVER-CROP/COTTON SYSTEM ................................... 17
3.1 Introduction ..................................................................................................... 17
3.2 Materials and methods ..................................................................................... 20 3.2.1 Description of the experimental site ................................................................ 20 3.2.2 Experimental design and treatments ................................................................ 20 3.2.3 Field preparation and sowing .......................................................................... 21 3.2.4 Fertilizer and irrigation application ................................................................. 22 3.2.5 Crop management ............................................................................................ 22 3.2.6 Measurement and analysis ............................................................................... 23 3.2.7 Soil sampling and analysis .............................................................................. 25 3.2.8 Nitrogen use efficiency .................................................................................... 25 3.2.9 Apparent N balance ......................................................................................... 26 3.2.10 Statistical analysis ........................................................................................... 26
3.3 Results ............................................................................................................. 27 3.3.1 Groundwater depth and nitrate concentration ................................................. 27 3.3.2 Cotton growth and development ..................................................................... 28 3.3.3 Yield and yield components ............................................................................ 30 3.3.4 Relationship between soil mineral N (residual plus applied N) and yield ...... 33 3.3.5 Plant N concentration and uptake .................................................................... 33 3.3.6 Nitrogen use efficiency .................................................................................... 35 3.3.7 Apparent N balance ......................................................................................... 36 3.3.8 System apparent N balance.............................................................................. 37 3.3.9 Soil organic carbon .......................................................................................... 39
3.4 Discussion ........................................................................................................ 40

3.4.1 Cover crop and groundwater NO3-N concentration ........................................ 40 3.4.2 Cotton growth yield and yield components ..................................................... 41 3.4.3 Nitrogen uptake and use efficiency ................................................................. 44 3.4.4 Apparent N balance ......................................................................................... 45 3.4.5 Total soil organic carbon ................................................................................. 46
3.5 Summary and conclusions ............................................................................... 47
4 THE IMPACT OF NITROGEN AMENDMENTS ON GROWTH AND WATER PRODUCTIVITY OF IRRIGATED COTTON, WINTER WHEAT AND MAIZE UNDER CONSERVATION AND CONVENTIONAL AGRICULTURE ............................................................................................. 49
4.1 Introduction ..................................................................................................... 49
4.2 Materials and methods ..................................................................................... 52 4.2.1 Site description ................................................................................................ 52 4.2.2 Experimental design and treatments ................................................................ 52 4.2.3 Measurements and data collection ................................................................... 55 4.2.4 Statistical analysis ........................................................................................... 59
4.3 Results ............................................................................................................. 59 4.3.1 Crop growth and development ........................................................................ 59 4.3.2 Crop yield, yield components, and water productivity .................................... 63 4.3.3 Soil moisture .................................................................................................. 75
4.4 Discussion ........................................................................................................ 77 4.4.1 Effect of tillage ................................................................................................ 77 4.4.2 Effect of nitrogen ............................................................................................. 79 4.4.3 Effect of residues ............................................................................................. 81
4.5 Summary and conclusions ............................................................................... 82
5 NITROGEN UPTAKE, USE EFFICIENCY AND BALANCE UNDER CONSERVATION VS. CONVENTIONAL AGRICULTURE PRACTICES IN A IRRIGATED COTTON/WHEAT/MAIZE SYSTEM ........................... 84
5.1 Introduction ..................................................................................................... 84
5.2 Methodology .................................................................................................... 86 5.2.1 Experimental site ............................................................................................. 86 5.2.2 Experimental design and treatments ................................................................ 86 5.2.3 Measurements and analyses............................................................................. 86 5.2.4 Statistical analysis ........................................................................................... 89
5.3 Results ............................................................................................................. 89 5.3.1 Total plant N uptake and concentration ........................................................... 89 5.3.2 Nitrogen use efficiency .................................................................................... 94 5.3.3 Relationship between grain yield, N level and total N uptake ........................ 96 5.3.4 Apparent N balance ......................................................................................... 98 5.3.5 System N use efficiency .................................................................................. 99 5.3.6 Changes in major soil nutrients ..................................................................... 103

5.4 Discussion ...................................................................................................... 103 5.4.1 Total plant N uptake and crop yield .............................................................. 103 5.4.2 Nitrogen use efficiency .................................................................................. 106 5.4.3 Apparent N balance and system N efficiency ............................................... 108
5.5 Summary and conclusions ............................................................................. 109
6 SALT DYNAMICS AND MANAGEMENT UNDER DIFFERENT TILLAGE AND RESIDUE LEVELS IN A COTTON/WHEAT/MAIZE SYSTEM IN SALT-AFFECTED IRRIGATED DRYLANDS .................... 111
6.1 Introduction ................................................................................................... 111
6.2 Materials and methods ................................................................................... 113 6.2.1 Salt dynamics under conservation and conventional agriculture practices ... 113 6.2.2 Effect of furrow irrigation techniques on soil salinity in raised beds ............ 114 6.2.3 Statistical analysis ......................................................................................... 117
6.3 Results ........................................................................................................... 118 6.3.1 Salt dynamics under conservation and conventional agriculture practices ... 118 6.3.2 Soil moisture dynamics ................................................................................. 122 6.3.3 Effect of different furrow irrigation techniques on salt distribution and
leaching under raised beds ............................................................................. 124 6.3.4 Cotton yield and yield attributes with different furrow irrigation techniques 128
6.4 Discussion ...................................................................................................... 128 6.4.1 Effect of tillage and residue management on salt dynamics ......................... 128 6.4.2 Effect of furrow irrigation technique on salt movement in raised beds ........ 130
6.5 Summary and conclusions ............................................................................. 132
7 GENERAL DISCUSSION AND CONCLUSIONS ..................................... 134
7.1 Introductory remarks ..................................................................................... 134
7.2 Discussion ...................................................................................................... 134 7.2.1 A rationale for conservation agriculture in Uzbekistan ................................. 134 7.2.2 Impact of CA practices on crop yield and N use efficiency in a cotton/cover-
crop/cotton rotation ....................................................................................... 135 7.2.3 Impact of CA practices on water productivity, N use efficiency and soil
salinity in a cotton/wheat/maize rotation ....................................................... 138 7.2.4 Impact of irrigation method on soil salinity management on permanent raised
beds 141
7.3 Conclusions and outlook ............................................................................... 143
7.4 Recommendations for management of CA practices .................................... 145
8 REFERENCES .............................................................................................. 146
9 APPENDICES ............................................................................................... 162


General introduction
1
1 GENERAL INTRODUCTION
1.1 Problem setting
Irrigated agriculture plays a major role in the world's food security as it provides 40% of
the global food production, although only from 17% of the total cultivated land (FAO
2000). The role of irrigation is expected to grow significantly in the near future. The
FAO (2002) predicted that the irrigated area in developing countries needs to be
expanded from 202 million ha in 1999 to 242 million ha in 2030 to meet the increasing
food demand. The demand for irrigation will in particular increase in arid and semi-arid
regions where more than 90% of agriculture depends on irrigation, due to predictions on
the impact of climate change that will reduce irrigation water availability.
The high population growth rate, degradation of agricultural lands and scarcity
of fresh water have raised doubt about the future suitability of the dominant agricultural
practices for irrigated drylands. In face of the environmental and economic challenges,
there is an urgent need to reconsider the existing classical agricultural systems and to
adapt agricultural systems that can help to prevent soil quality and soil fertility
degradation, and hence increase productivity. Uzbekistan is one of the countries most
seriously affected by land degradation and desertification in the world, as is evidenced
by the 85% of the land that now suffers from various levels of secondary salinization
(Dintzburger et al. 2003; Figure 1.1). It is further reported that approximately 20 000 ha
of irrigated land in Uzbekistan are lost to salinity and invariably abandoned every year
(Toderich et al. 2009). Irrigated agriculture is one of the main pillars of Uzbekistan’s
economy, e.g. this sector contributes to 22% of the country’s GDP and employs 44% of
its labor force (CIA Factbook 2010).
In Uzbekistan, cotton (Gossypium hirsutum L.) is the predominant crop in the
agriculture system. It has played a major role in the country’s economic development
since the Soviet Union era (1926-1991). With an annual raw cotton production of 3.7
million t in 2008 (FAOSTAT 2010), Uzbekistan is the world’s sixth largest cotton
producer and third largest cotton exporter (Bremen Cotton Report 2010) and accounts
for 13-18% of the national GDP (Wehrheim and Martius 2008).
After Uzbekistan’s independence in 1991, winter wheat (Triticum aestivum L.)
in Uzbekistan has gained importance and has become the second strategic crop for

General introduction
2
satisfying domestic food needs (Guadagni et al. 2005). The area under wheat was only
around 0.62 million ha in 1992, mainly in the rainfed areas, but expanded rapidly to 1.4
million ha in 1997 and has remained almost constant (FAOSTAT 2010), covering 31%
of the irrigated regions of Uzbekistan (FAO 2002). Maize (Zea mays L.) is the third
major cereal crop after wheat and rice in Uzbekistan. It is cultivated annually on about
35,000 ha and yields on average 6.6 t ha-1 (FAOSTAT 2010). It is mostly used as feed
but also for human consumption (Christmann et al. 2009). Cotton-based systems are the
major crop rotation systems in Uzbekistan (Conrad et al. 2010).
Figure 1.1 Water management in Central Asia: state and impact. (Source: P. Rekacewicz UNEP/GRID-Arendal; http://maps.grida.no/)

General introduction
3
Conventional agriculture practices
Cropping systems Tillage and residue management
Nutrient and watermanagement
- Cotton mono-crop system - State order crop production
- Deep ploughing in every 2-3 years- Intensive tillage- Clean ploughing (straw removal or burning)- No proper land levelling
- High and imbalanced use of chemical fertilizer- Flood and over-irrigation- Poor irrigation and drainage management
Problems:
Destruction of soil structureWind erosionIncrease a evaporation lossSoil compactionDecreased SOM Water loggingIncreased production cost
Denitrification and leaching lossLow fertilizer use efficiencyIncreased soil salinity Raised groundwater tableLow water use efficiencyWater erosionSecondary soil salinizationHigh production costs
Declining soil fertilityCrop yield stagnation Incrasing soil salinityDecrease SOM
Impacts:
Increasing soil salinity and desertification
Declining soil fertility
Unsustainable irrigated dryland agriculture
Figure 1.2 Problems associated with conventional agriculture systems in irrigated drylands in Uzbekistan. SOM=soil organic matter
Crop production under conventional agriculture practices in the irrigated
drylands in Uzbekistan is influenced by various factors (Figure 1.2). Decades of
intensive soil tillage, constant removal of crop residues, extensive use of chemical
inputs and over-irrigation have contributed to declining soil fertility and increasing
secondary soil salinization, leading to land degradation and desertification of irrigated
areas. Due to intensive soil tillage and cotton mono-cropping, the soil organic matter in
the region is rather low, i.e., 0.33 to 0.6% (Kienzler 2010). Furthermore, due to
destruction of soil structure through excessive soil tillage and residue removal, the soil
in the region is highly susceptible to wind erosion. An excessive use of irrigation water

General introduction
4
raises groundwater tables and this has increased secondary soil salinization and a
deterioration of the soil quality (Figure 1.1). During the vegetation period, about 67% of
the fields in Uzbekistan have groundwater levels above the threshold values that induce
secondary salinization (Ibrakhimov et al. 2007).
Previous findings confirmed that nitrogen (N) use efficiency in the
conventional production systems in Uzbekistan is rather low (Kienzler 2010). High
temperatures and intensive irrigation and soil tillage under conventional practices
enhance the mineralization of soil N (Vlek et al. 1989), which leads to N losses through
denitrification (Scheer et al. 2008) and leaching (Kienzler 2010). The high N losses are
not only a source of environmental pollution, they also increase production costs. All
these factors threaten the sustainability of crop production in Uzbekistan.
1.2 The potential and challenges of conservation agriculture in irrigated
drylands
Land degradation and land use are highly linked to each other. As explained above,
intensive soil tillage, decreasing soil organic matter, increasing secondary soil
salinization and mismanagement of irrigation water and fertilizers are presently
increasing production costs, reducing soil fertility and threatening the sustainability of
the crop production systems in the irrigated drylands of Uzbekistan, Central Asia. There
is urgent need to take preventive steps to overcome the current conventional agricultural
approach to make agriculture in irrigated drylands sustainable.
Conservation agriculture (CA) that aims at reduced tillage, proper crop
rotation, and retention of optimal levels of crop residues (Sayre and Hobbes 2004) can
minimize the adverse effect of conventional agriculture practices. During the 1970s,
conservation tillage and soil mulching were proposed to counterbalance and combat soil
erosion. During the 1980s, sub-soiling and deep ploughing were proposed to alleviate
soil compaction. Since the 1990s, soil quality and CA practices like reduced or no
tillage and crop residue retention have received considerable attention (Wang 2006).
Different forms of CA practices are now applied on more than 100 million ha
worldwide (Derpsch and Friedrich 2009). CA practices are becoming increasingly
attractive also in countries where conventional agriculture has to cope with serious
problems due to land degradation and increasingly unreliable climatic conditions.

General introduction
5
Among the wide range of CA practices worldwide, permanent raised bed
planting is gaining importance for many row-spaced crops. The reported benefits
associated with permanent raised beds include, (1) better irrigation management (Sayre
and Hobbes 2004; Hassen et al. 2005), which saves 25-30% of irrigation water with
increased water productivity, (2) improved nutrient availability (Govaerts et al. 2005)
through proper placement of fertilizer, (3) reduced soil salinity (Bakker et al. 2010) by
reducing evaporation loss of water and leaching salts from the furrows, which also
prevents water logging, (4) energy and labor savings, thus reducing production costs
(Gupta et al. 2009), and (5) equivalent or higher yields compared to those from
conventional tillage practices (Sayre and Hobbes 2004; Govaerts et al. 2005; Hassen et
al. 2005). Crop residue retention increases the soil organic matter content (Govaerts et
al. 2005; Egamberdiev 2007), decreases soil salinity, reduces soil evaporation loss and
thus increases water use efficiency (Huang et al. 2001; Deng et al. 2003). The
combination of conservation tillage (permanent beds), residue retention and proper N
management has been shown to be an alternative option for sustainable crop production
systems under rainfed as well as irrigated systems (Limon-Ortega et al. 2000; Sayre and
Hobbes 2004; Govaerts et al. 2005; Wang et al. 2007).
Despite these apparent advantages, CA research has only recently been
introduced in Uzbekistan. Consequently, the effects of N application, reduced tillage,
residue management, and crop rotation on crop performance, production, water
productivity and its effect on soil salinity under the specific conditions of the irrigation
system and practices in Uzbekistan are still poorly understood (Gupta et al. 2009).
Due to the numerous interacting factors, crop yield is not always higher with
CA than with conventional practices, and certainly not so at the onset of the transition
period from conventional to CA. A frequently cited concern regarding CA is the
decreasing availability of plant-available N due to its immobilization by crop residues
(Rice and Smith 1984; Franzluebbers et al. 1995; Doran et al. 1998). However, it is not
clear to what extent this may occur or not when implementing CA practices in irrigated
lands. Furthermore, crop residue retention competes often with farmers’ practices in
Uzbekistan for using this resource as livestock feed, which limits the field application of
crop residue. Thus, proper N application and management with optimal levels of residue
retention together with conservation tillage needs to be developed specifically for the

General introduction
6
cropping systems in Uzbekistan. A better understanding of crop growth, yield and water
productivity of major crops under CA, and greater knowledge of the short- and long-
term impacts of CA practices on the nutrient balance, soil salinity and sustainable crop
production is necessary in irrigated drylands.
The Khorezm region, south of the Aral Sea in Uzbekistan, was selected in the
current study as an area representative for the degradable areas in the region The
German-Uzbek project of the Center for Development Research (ZEF) of the University
of Bonn, Germany (www.khorezm.uni-bonn.de), has been working in the region since
the year 2001. Khorezm is a suitable pilot area for developing concepts for ecological
and economic sustainable land use in the Aral Sea Basin (ZEF 2001). It is hoped that
the findings of the present study will be effective not only in the intervention region but
also in other areas of irrigated drylands suffering from similar problems.
1.3 Research objectives
Considering the presently unsustainable conventional crop production systems in the
irrigated drylands of Uzbekistan, the aim of this study was to compare crop growth,
yield and water productivity of major crops under conservation and conventional
agriculture practices with different N rates and its effect on soil salinity and N use
efficiency in cotton-based cropping systems to define a sustainable crop production
system for the irrigated drylands of Uzbekistan. The outcomes of this study are,
therefore, expected to support the development of sustainable agriculture practices in
irrigated drylands that can help to increase crop productivity, and minimize the negative
effects associated with existing conventional agriculture practices.
The specific objectives were to:
1. Analyze cotton growth and yield and determine N use efficiency and N balance
under conservation tillage with a terminated wheat cover crop and selected N
fertilizer application rates;
2. Analyze growth, crop yield, and water productivity of cotton, wheat and maize in
rotation under conservation agriculture practices with different N fertilizer
application rates;

General introduction
7
3. Compare N uptake, efficiency and balance of applied N in a cotton/wheat/maize
rotation systems under conservation and conventional practices with different N
rates;
4. Compare soil salinity dynamics under conventional and conservation agriculture
practices;
5. Investigate the effect of different furrow irrigation techniques on salt distribution,
crop performance and salt leaching under raised bed systems.
1.4 Outline of the thesis
The thesis consists of seven chapters, including this general introduction (Chapter 1),
which is followed by providing details of the study region (Chapter 2).
In Chapter 3, the effect of CA practices and N rates on cotton growth, yield
and yield components, N use efficiency and apparent N balance in a cotton/cover-
crop/cotton rotation is analyzed. The effect of a winter cover crop on groundwater NO3-
N contamination is also described.
Chapter 4 compares the effects of conservation and conventional agriculture
practices with different N fertilizer rates on growth, yield and water productivity of
cotton, wheat, and maize in rotation.
Chapter 5 describes the effect of different tillage methods, residue and N rates
on N uptake and use efficiency and apparent N balance and system N use efficiency in
cotton, wheat and maize in rotation.
Chapter 6 deals with salt dynamics under conservation and conventional
agriculture practices in cotton/wheat/maize rotation systems, and also the effect of
different irrigation techniques on salt dynamics and leaching efficiency in bed planting.
In the general discussion in Chapter 7, conservation agriculture practices with
different N levels with respect to crop yield, water productivity, N use efficiency,
apparent N balance, and soil salinity dynamics are assessed in two cotton-based
systems. Furthermore, the main conclusions and recommendations are presented.
Study region
8
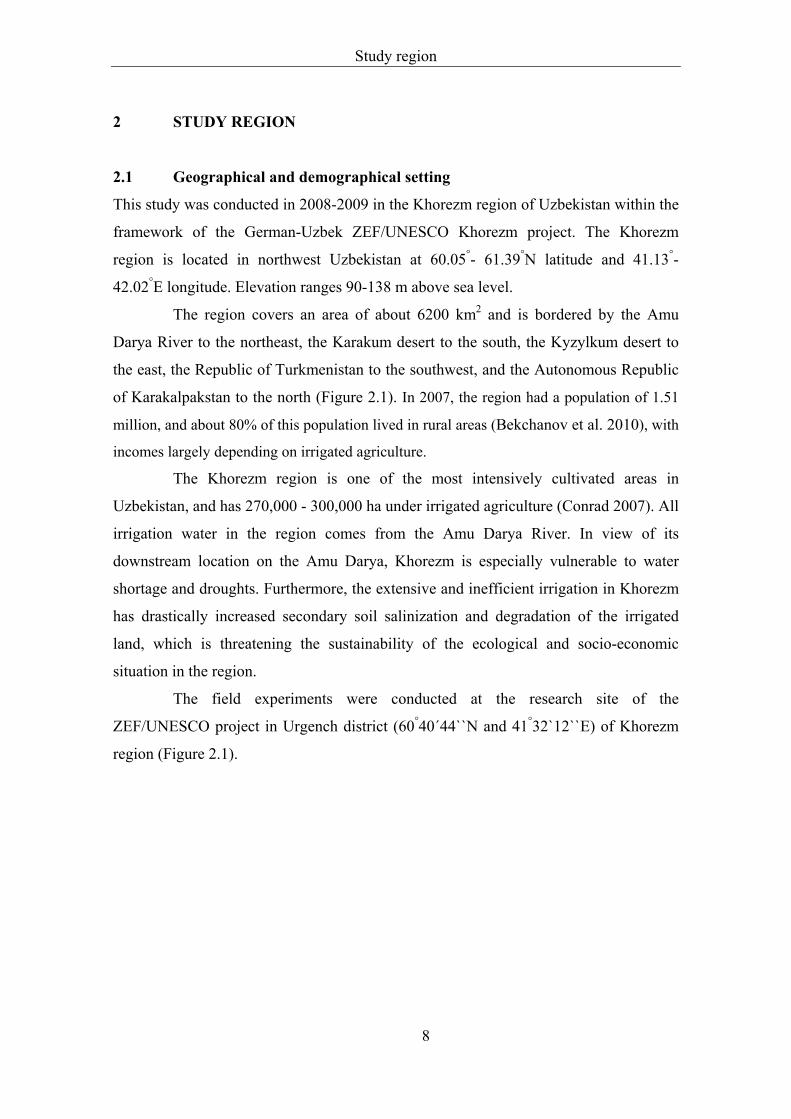
2 STUDY REGION 2.1 Geographical and demographical setting
This study was conducted in 2008-2009 in the Khorezm region of Uzbekistan within the
framework of the German-Uzbek ZEF/UNESCO Khorezm project. The Khorezm
region is located in northwest Uzbekistan at 60.05°- 61.39°N latitude and 41.13°-
42.02°E longitude. Elevation ranges 90-138 m above sea level.
The region covers an area of about 6200 km2 and is bordered by the Amu
Darya River to the northeast, the Karakum desert to the south, the Kyzylkum desert to
the east, the Republic of Turkmenistan to the southwest, and the Autonomous Republic
of Karakalpakstan to the north (Figure 2.1). In 2007, the region had a population of 1.51
million, and about 80% of this population lived in rural areas (Bekchanov et al. 2010), with
incomes largely depending on irrigated agriculture.
The Khorezm region is one of the most intensively cultivated areas in
Uzbekistan, and has 270,000 - 300,000 ha under irrigated agriculture (Conrad 2007). All
irrigation water in the region comes from the Amu Darya River. In view of its
downstream location on the Amu Darya, Khorezm is especially vulnerable to water
shortage and droughts. Furthermore, the extensive and inefficient irrigation in Khorezm
has drastically increased secondary soil salinization and degradation of the irrigated
land, which is threatening the sustainability of the ecological and socio-economic
situation in the region.
The field experiments were conducted at the research site of the
ZEF/UNESCO project in Urgench district (60°40´44``N and 41°32`12``E) of Khorezm
region (Figure 2.1).

Study region
9
Figure 2.1 Khorezm region in the northwest of Uzbekistan and location of the study
farm (for further details see figure 4.1)
2.2 Climate
The climate of the Khorezm region is, according to the Köppen-Geiger Climate
Classification System, a typical continental, cold arid desert climate with long, hot and
Urgench
Legend Drain
P
ump
canal
Shavat canal
Field canal
Road
Cotton Research Station
Cotton Research Station

Study region
10
dry summers and short, very cold dry winters (Kottek et al. 2006). Potential
evapotranspiration (1200 mm year-1) always greatly exceeds precipitation. Higher
precipitation generally occurs in April and November (Forkutsa 2006). The
meteorological station in Urgench reported a mean annual temperature of 13.4 °C with a
minimum in January/February (-7 °C) and a maximum in June/July (40 °C) for the last
37 years. Mean annual rainfall in the same period amounted to 94.6 mm (Figure 2.2).
The average yearly frost-free period is 205 days (Khamzina 2006).
The climatic conditions favor the growing of annual, warm-season crop such
as cotton and maize, since these crop favor frost-free regions with high temperature,
high solar radiation and little precipitation (Chaudhary and Guitchonouts 2003; Kienzler
2010), and also winter wheat, which can survive under low temperature during winter
(Fowler et al. 1999). Crop production under the continental climatic conditions,
however, is possible only with assured irrigation. However, a declining availability of
irrigation water in the region, where the average probability of obtaining the sufficient
irrigation water declined by 16% since the past two decades (Müller 2006), necessitates
the development of a crop production technology that can increase the water use
efficiency.
The region is characterized by a north-easterly wind during the main crop-
growing season (from April until October) with an average wind velocity of 1.4 to 5.5
ms-1 with maximum velocities reaching 7-10 ms-1 (Forkutsa 2006). Wind erosion on the
tilled and uncovered soil is high under such a climatic condition. The introduction of
conservation tillage and mulching techniques may thus help to conserve soil nutrients
and preserve/re-introduce soil life, and prevent further soil loss to wind erosion.

Study region
11
-10
0
10
20
30
-20
0
20
40
60
J F M A M J J A S O N D
[°C]Urgench (95 m) 13.4 °C 94.6 mm [mm]
2008-2009
1970-2007
[25]
Figure 2.2 Mean monthly air temperature and monthly precipitation for Urgench, Khorezm, Uzbikistan, according to Walter and Leith (1967)
2.3 Soil
According to the FAO classification, Khorezmian soils can be classified into three
major types (FAO 2003): (i) calcaric gleysoils, i.e., meadow soils in the irrigated areas
characterized by a shallow groundwater table often with elevated groundwater salinity
and secondary salinization in the upper soil, (ii) calcaric fluvisoils, i.e., meadow soils
commonly found mainly along the Amu Darya River in the eastern part of Khorezm,
and (iii) yermic regosols, soils that are formed from alluvial rock debris deposits outside
the irrigated areas and also from the dunes of the Kara Kum desert mainly in the south
of Khorezm (Figure 2.3). However, the FAO classification is rather broad and does not
include the detailed characteristics of the Russian/Uzbek classification. According to the
latter classification, the major soil type of the region is an irrigated alluvial meadow,
which covers 60% of the area. The other common soils in Khorezm are boggy-meadow
(covering 16%), takyr-meadow (15%), boggy (5%), grey-brown and takyr (2%)
(Rasulov 1989 cited by Kienzler 2010). The soil textures are light, medium and heavy
loams (Rizayev 2004 cited by Scheer 2008).
The inherent fertility of all Khorezmian soil types is rather low, thus cultivation of
agricultural crops requires the input of fertilizers. The organic matter content in the

Study region
12
Figure 2.3 Predominant soils of Khorezm (from FAO 2003)

Study region
13
Khorezmian soils ranges from 0.33 to 0.6%. In the experimental field the soil organic
matter (SOM) content was rather low with 0.4-0.5% in top 30 cm soil depth (Table 2.1).
The low SOM contents in the study region is due to high temperatures and intensive
irrigation and soil tillage practices, which enhance fast decomposition in the plow layer
(Vlek et al. 1981) and continuous cotton mono-crop (Sainju et al. 2006). Hence with
annual crop residue retention as is advocated under CA, it should be able to increase
SOM at least for a short period.
Nitrogen is considered the most limiting nutrient in the Khorezmian soil
(Ibragimov 2007). The total organic N (Norg) content usually comprises around 90-95%
of the soil total N content in the plowing layer of agriculture soils, and is closely
associated with the SOM (Vlek et al. 1981). For Khorezm, Norg-content in the soils has
been reported to vary from 0.012-0.073% in 0-30 cm depth (Kienzler 2010). In the
experimental field the total N content was 0.04 to 0.05% in top 30 cm soil depth (Table
2.1).
The total soil P (0.10-0.21%) and K (1.0-2.2%) concentrations are relatively
high in the 0-30 cm layer. The concentration of the plant-available form of P (P2O5) is
generally moderate (15-93 mg P2O5 kg-1) in the Khorezmian soils (Djumaniyazov 2006;
Kienzler 2010). The exchangeable form of K (K2O) in the soil reportedly ranged from
low (84 mg K kg-1) to high (470 mg K kg-1), greatly depending on preceding crops and
fertilizer management (Djumaniyazov 2004; Kienzler 2010). In the experimental field
the available phosphorus (22-28 mg kg-1) and exchangeable potash (89-99 mg kg-1)
were in the moderate range (Table 2.1). Therefore these two nutrients did not receive
priority in this study.
Table 2.1 Initial soil properties of the experimental site in 2008.
Depth (cm)
Bulk density (g cm-3)
Soil pH
NH4-N (mg kg-
1) NО3-N
(mg kg-1)
Total N
(%)
Organic carbon
(%)
Available phosphorus (mg kg-1)
Exchange-able potash (mg kg-1)
0-10 1.35 5.57 5.4 5.3 0.05 0.36 27.9 98.5 10-20 1.41 5.56 6.5 4.4 0.05 0.30 25.9 95.0 20-30 1.42 5.57 6.3 5.2 0.04 0.26 21.9 89.3 30-60 1.52 5.69 6.3 4.0 0.03 0.23 19.2 81.4 60-90 1.57 5.78 5.2 3.9 0.03 0.19 17.6 76.8 Note: SOM = 1.56 x organic carbon

Study region
14
Inefficient and excessive use of irrigation water on the agricultural lands in the
region over several decades has led to highly saline soils (Ibragimov 2007). The
fluctuation of the groundwater table in the region is mostly driven by irrigation and
leaching activities (Ibrakhimov et al. 2004). During the growing period, i.e., March to
August, the average groundwater table rises up to 1.2 m and drops to about 1.8 m in
October. The average salinity of the groundwater ranges between 1.68 g l-1 in October
and 1.81 g l-1 in April (Ibrakhimov et al. 2004). The higher groundwater levels enhance
soil salinization by annually adding 3.5-14 t ha-1 of salts depending on the salinity level
of the groundwater (Ibrakhimov et al. 2007). According to official government data
(1999-2001), the entire irrigated area in the Khorezm region suffers from secondary soil
salinization, and about 81% of the area has water-logging problems (Abdullaev 2003).
Thus, prior to crop planting, i.e., in early spring, 20-25% of the water given
later for irrigation is applied to leach the salts from fields (Conrad et al. 2011). Although
perhaps effective, the leaching with the huge amounts of water raises the groundwater
tables further and hence increases the risk of increasing secondary salinisation
(Akramkhanov et al. 2010). In the absence of an efficient drainage system, this is
common in most areas. The risk of re-salinization in the root zone increases (Forkusa et
al. 2009). Under saline and high groundwater table conditions, agriculture practices
such as CA, which reduces irrigation water use and minimizes soil salinity, is expected
help to sustain the agriculture systems.
2.4 Land use
Agriculture has been practiced in Khorezm region for thousands of years, mainly with
millet, wheat, barley, water melons, and gourds (Forkutsa 2006). After the development
of large irrigation and drainage systems from the mid 20th century onwards, agriculture
began to bloom with the diversion of massive amounts of water from the river valleys to
the surrounding areas mainly for cotton production. From that period onwards, the
quality of the river water has deteriorated due to the discharge from the upstream
collector-drainage systems to the river (Vinogradov and Langford 2001; Forkutsa
2006).
During the Soviet era, cotton became the priority crop, and about 70% of the
irrigated land was used for cotton in 1970, but this declined to 56% in 1990 (before

Study region
15
independence). The cotton area has further declined since independence due to the
introduction of wheat as a second priority crop (Wehrheim and Martius 2008). Currently,
about 265,000 ha of land are used for irrigated agricultural production in Khorezm
(Bekchanov et al. 2010). Cotton, wheat, rice, and fodder maize are the dominant crops
in the region (Wehrheim and Martius 2008), where cotton uses 42% of the irrigated area
followed by winter wheat (20%), rice (7%), while fodder (10%), fruits and vegetables
(10%) and garden crops occupy the remaining irrigated area in 2007 (Figure 2.3). Thus,
for introducing sustainable agricultural practices which are advocated with CA, most
gains can be made when addressing with priority the cotton and wheat based rotations.
Are
a (,
000
ha)
0
50
100
150
200
250
1991
1995
2000
2001
2002
2003
2004
2005
2006
2007
2008
Cotton Rice Fodder
Fruits & veretables
Wheat
Figure 2.4 Area under different crops in Khorezm region (1991-2008) according to the regional department of statistics.
According to “bonity” classification, which indicates the quality of irrigated
land (Figure 2.5) about 40% the total irrigated land in the Khorezm region is very good
and capable of producing 81-100% of the potential cotton yield, about 26% is good
indicating to be capable of producing 61-80% of the potential cotton yield, 19% is of
moderate quality and capable of producing 41-60% of the potential cotton yield, and
15% is poor and capable of producing 40% of the potential cotton yield.

Study region
16
Very good
40%
Poor
15%
Moderate qualitiy 19%
Good
26%
Figure 2.5 Quality of land bonitation (“bonitet”) suitable for irrigation (% irrigated land) in the Khorezm region (FAO 2003).
In Uzbekistan, agricultural production is mainly state controlled. Three main
farm types have been formed in different steps after independence from the Soviet
Union (Scheer 2008): (1) shirkats - the agriculture cooperatives were formed as a
transitory successor of former kolhozes and sovkhozes, (2) dehqon farms - household
farms, i.e., subsistence-oriented household plots that represent an important contribution
to household food security, and (3) fermer enterprises - a new type of farm that has
emerged during the past five years established on the basis of long-term leases with a
commercial orientation (Wehrheim and Martius 2008). Conservation agriculture
practices are mostly relevant in dehqon farms and fermer enterprises, which have a
major contribution to food security.

Impact of tillage and nitrogen on cotton in a cotton/cover-crop/cotton system
17
3 IMPACT OF TILLAGE AND NITROGEN FERTILIZATION ON
PERFORMANCE AND NITROGEN USE EFFICIENCY OF COTTON IN A
COTTON/COVER-CROP/COTTON SYSTEM
3.1 Introduction
Cotton (Gossypium hirsutum L.) is grown annually on more than 1.45 million ha in the
irrigated drylands of Uzbekistan (FAOSTAT 2010). Since the Soviet Union era (1924-
1991) cotton production has played a major role in the country’s economic development
and this has remained after the country’s independence in 1991. Uzbekistan is the sixth
largest producer and third most important exporter of cotton fiber in the world (Bremen
Cotton Report 2010). Cotton accounts for 13-18% of the national GDP (Wehrheim and
Martius 2008).
More than 90 years of cotton mono-crop cultivation with excessive tillage and
use of fertilizers and irrigation water to fulfill the state-order cotton production in
Uzbekistan have led to soil and environmental degradation. Conventional practices in
the region typically involve intensive land preparation for each crop with up to 4-5
machinery passes, deep tillage to reduce the sub-soil compaction, flood irrigation with
insufficient drainage, and excessive use of fertilizers. The wasteful use of the resources
creates environmental pollution, for instance through N2O emissions (Scheer et al.
2008) and NO3 leaching (Kienzler 2010); it increases production costs (Tursunov 2009),
raises secondary soil salinization through rising groundwater levels (Forkutsa et al.
2009), and causes deterioration of soil quality (Lal et al. 2007). Due to crop residue
removal and excessive soil tillage, evaporation loss of water is high in the region, results
in increases the surface soil salinity. Also soils in the region are in particular highly
susceptible to wind erosion in spring, which in turn reduces the organic matter content
in the soil. Under such conditions, conservation agriculture (CA) technologies which
reduce soil disturbance and retain crop residues can minimize soil evaporation and soil
erosion losses, increase soil carbon sequestration, increase the nutrient use efficiency,
and reduce energy requirements for crop establishment compared with conventional
tillage (Sayre and Hobbs 2004; Lal et al. 2007). Among CA practices, permanent raised
bed is gaining importance, and has been introduced in Asia and arid western USA
(Sayre 2004). Permanent raised bed is credited with numerous advantages, such as

Impact of tillage and nitrogen on cotton in a cotton/cover-crop/cotton system
18
better irrigation management by reducing the deep percolation, plant establishment by
providing favorable root development environment (Sayre and Hobbs 2004) and
opportunities for inter-bed cultivation for weed control. It gives comparatively better
yields and an efficient use of input resources, i.e., water, fertilizers and herbicides, and
also can help reducing production costs compared to conventional tillage (Mehta and
Bandyopadhyay 2004).
The effects of tillage on cotton growth and yield have been variable. Some
studies have shown that cotton yield was similar to or greater in CA than in
conventional tillage (Daniel et al. 1999; Nyakatawa et al. 2000). Others have reported
lower cotton yield in CA (Ishaq et al. 2001; Pettigrew and Jones 2001; Schwab et al.
2002). Moreover, others have reported that increased cotton yields with CA were
observed only after several years (Triplett et al. 1996). Higher soil moisture resulting
from the accumulation of surface residue in CA has been reported to increase cotton
seed germination, root growth, and yield compared with conventional tillage
(Bordovsky et al. 1994; Nyakatawa and Reddy 2000; Nyakatawa et al. 2000) while poor
root penetration and difficulties in getting adequate crop stands and weed control have
been caused to reduce cotton yields in CA (Schertz and Kemper 1994; Triplett et al.
1996). However, decreased production cost with increased environmental benefits of
reduced soil erosion and N leaching and increased C sequestration suggests that CA will
improve soil quality and sustain crop production (Smart and Bradford 1999; Paxton et
al. 2001; Tursunov 2009).
Nitrogen (N) is the key limiting nutrient for cotton production on irrigated
dryland. Nitrogen management practices under conventional cotton cultivation practices
in Uzbekistan are highly inefficient, but can be substantially improved through better
fertilizer management, i.e., better scheduling of fertilizer and irrigation application time
(Kienzler 2010). Even with judicious N applications, the warm and moist soil conditions
can favor the buildup of inorganic N in the soil profile presumably through organic
matter mineralization and the decomposition of decaying roots and other plant residues
while N uptake does not occur (Vlek et al. 1981; Weinert et al. 2002). In Uzbekistan,
cotton is planted in April and harvested in September. Crop N uptake reduces during
later crop growth stages and uptake could not occur after leaf defoliation, which is a
common practice to induce boll opening and ease harvesting. In the absence of a living

Impact of tillage and nitrogen on cotton in a cotton/cover-crop/cotton system
19
crop, the buildup of residual soil N during later crop growth stage being leached out
when salt leaching is practiced during early-spring. Late summer-sown cover crops can
sequester N and store it over the winter, when soil pools of NO3 are prone to leaching
(Huntington et al. 1985; and Shipley et al. 1992; Weinert et al. 2002). A winter cereal
cover crop can accumulate up to 150 kg N ha-1 (Shennan 1992; Ditsch et al. 1993), with
rooting systems reaching down to 80 cm (Frye et al. 1985), and –if retained in the field-
can supply N for the following summer crop (Sainju et al. 2007). Furthermore, earlier
research shows that inclusion of cover crops in mono-crop cotton systems increases the
soil organic carbon (Sainju et al. 2005). Due to the sparse and stiff cotton residues, the
introduction of a winter cover crop in a mono-crop cotton system increased the carbon
inputs and soil organic carbon compared with a bare fallow (Sainju et al. 2006).
Nitrogen response to cotton yield may vary with tillage method (Sainju et al.
2006). In 5 yrs of field study in Midsouth USA, Boquet et al. (2004) reported that
without N application cotton yields were lower in CA than in conventional tillage, but
with optimum N application, yields were higher in CA. Similarly, on irrigated Vertisols
of Australia, Constable et al. (1992) observed that the optimum N dose was lower for
the CA than the conventional tillage. In 3 years of study, Bronson et al. (2001),
however, reported that to produce the economically optimum lint yield, 19 to 38 kg ha-1
additional N was needed with CA compared to conventional tillage.
Cultivation practices based on CA principles have only recently been
introduced in the irrigated areas of Central Asia. Hence, the impact of CA on soil
properties, crop yields, and N management are insufficiently characterized in these
environments. The few experiments previously conducted in the region have shown the
potential of CA in cotton production, while the impact of different tillage methods on
yields has been analyzed (Tursunov 2009). Furthermore, recent studies in irrigated
drylands addressed N fertilizer response in mono-crop cotton in conventional systems
(Kienzler 2010; Norton and Silvertooth 2007; and Mahmood et al. 2008). However, the
interaction between tillage and N fertilization effect on cotton production had not been
investigated in irrigated drylands of Uzbekistan. This study analyzes cotton growth and
yield, and determines N use efficiency and the N balance under conservation and
conventional tillage with various level of N fertilizer application.

Impact of tillage and nitrogen on cotton in a cotton/cover-crop/cotton system
20
3.2 Materials and methods
3.2.1 Description of the experimental site
Experiments were conducted during 2008 and 2009 in Khorezm, in western Uzbekistan
(60°40´44``N and 41°32`12``E, 100 m a.s.l.). The experimental field had been mono-
cropped with cotton under heavily mechanized production conditions for more than 20
years. Annual fertilizer applications had been in the order of 200:140:100 kg NPK ha-1.
Following field preparations that included deep ploughing, laser-leveling and salt
leaching in February/March 2008, cotton was sown as the first transition crop in May
2008 and harvested in October 2008. After this, the impact of the treatments of tillage
and N level on the rotation of cover crop (October 2008-April 2009) and cotton (April-
October, 2009) was effectively studied.
The soil in the experimental area is an irrigated alluvial meadow, with sandy
loam to loamy soil, low in organic matter (0.3-0.6%) and saline (salinity ranging from
2-16 dS m-1). The groundwater table is shallow (0.5-2 m). The climate is arid, with long,
hot and dry summers and short, very cold winters. Average precipitation is less than 100
mm year-1. Potential evapotranspiration (1200 mm year-1) always greatly exceeds
precipitation. The mean annual temperature is 13.6 ° C (Figure 2.2).
3.2.2 Experimental design and treatments
A two-factor, split-plot experiment with four replications was designed to explore the
influence of two tillage methods (bed planting, BP and conventional tillage, CT) as the
main factor and three N levels (no application (N-0), less than recommended (N-125)
and more than recommended (N-250)) as the subplot treatments. The officially
recommended N application rate for cotton is 160-180 kg ha-1 (MAWR 2000). The
subplot (12 m x 6 m size) treatments were completely randomized. In this study the
term bed planting is used for permanent raised bed, as the beds were freshly prepared in
2008, but was maintained as permanent afterwards.

Impact of tillage and nitrogen on cotton in a cotton/cover-crop/cotton system
21
Table 3.1 Field activities in bed planting and conventional tillage in cotton under cotton/cover-crop/cotton rotation system.
Cotton Bed planting Conventional tillage Time 2008 Salt leaching February
Deep ploughing, laser leveling March Bed making Flat leveling April Cotton sowing on bed Cotton sowing on flat May 6 Furrow cultivation followed by band application of N fertilizer
Inter-row cultivation followed by band application of N fertilizer and furrow opened for irrigation
June
Band application of N fertilizer
Inter-row cultivation followed by band application of N and furrow opened for irrigation
July
Broadcast seeding of wheat (for cover crop) on standing cotton after 2nd picking
October
2009 Glyphosate applied to terminate the cover crop First week of April
Cotton sowing on bed without cultivation
Cotton sowing on flat after three times soil tillage and rough leveling
April 25
Phosphorus and potassium fertilizers were drilled during planting
Phosphorus and potassium fertilizers were broadcast applied during field preparation
Band application of N fertilizer
Inter-row cultivation followed by band application of N and furrow opened for irrigation
June
Band application of N fertilizer
Inter-row cultivation followed by band application of N and furrow opened for irrigation
July
3.2.3 Field preparation and sowing
Cotton
Details of field activities applied in both bed planting and conventional tillage in cotton
are shown in Table 3.1. In 2008, fresh beds were prepared with a 90 cm spacing from
furrow to furrow in BP. Cotton was sown as a single row at the recommended seed rate
of 60 kg ha-1 in the center of the beds. In CT, seeds were sown on the flat field with the
same spacing and seed rate as in BP. In 2009, the beds were kept as permanent bed and
no soil tillage occurred apart from seed and fertilizer drilling. Under CT, three
ploughings followed by rough leveling were performed before seeding. The same seed
rate and spacing as in 2008 was used in both tillage methods.

Impact of tillage and nitrogen on cotton in a cotton/cover-crop/cotton system
22
Cover crop
After the second picking of cotton in mid October 2008, winter wheat was broadcast-
seeded at the rate of 150 kg seeds ha-1 in both tillage systems to serve as a winter cover
crop. No fertilizer was applied to the winter cover crop. Since salt leaching was
practiced in the surrounding fields, single flood irrigation was applied to the
experimental site to prevent salt movement from the adjacent fields into the
experimental site. Two weeks before cotton sowing, glyphosate [N-(phosphonomethyl)
glycine] was applied to the entire experimental area to fully terminate wheat growth. At
this time, wheat was near the booting stage (Zadoks et al. 1974), and had accumulated a
dry biomass of 1.8 to 2 t ha-1. In the BP treatments, the cover crop was retained on the
soil surface, while in the CT treatments it was incorporated into the soil during field
preparation.
3.2.4 Fertilizer and irrigation application
Phosphorus (P) and potash (K) at 140 and 100 kg ha-1, respectively, were applied as
basal applications during sowing in all treatments (Table 3.1). Phosphorus was applied
as single super phosphate (10% P2O5) in the N-0 treatments, while ammonium
phosphate (11% N and 16% P2O5) was applied in all other N treatments. Muriate of
potash (60% K2O) was applied in all plots. Nitrogen was top dressed as a band
application in two equal split during budding (38 days after sowing; DAS) and
flowering (52 DAS) in both years. In CT, after each cultivation and N application,
furrows were opened in between two rows to apply irrigation water. Cotton was furrow
irrigated five times in 2008 (totaling 450 mm ha-1), and four times in 2009 (totaling 395
mm ha-1). Irrigation water was applied as needed, which was determined by leaf rolling.
The amount of irrigation water was measured for each plot. Methods of irrigation water
measurement and calculation are presented in section 4.2.3, Irrigation water. Water
samples were collected from the irrigation canal during all irrigation events and
analyzed immediately for NO3-N concentration.
3.2.5 Crop management
The cotton stand was thinned manually 20-25 DAS to achieve a uniform plant
population, keeping 6-7 plants per m2. In 2008, weeds were controlled with a single

Impact of tillage and nitrogen on cotton in a cotton/cover-crop/cotton system
23
furrow cultivation at 40 DAS in BP and two cultivations (at 40 and 60 DAS) under CT.
In 2009, although weed densities were lower, two cultivations (at 35 and 60 DAS) were
needed for CT, but no cultivation for BP system (Table 3.1). After the formation of 12-
14 sympodial branches, cotton growing tips were de-topped to stop indeterminate
growth and to induce synchronous maturity. Similarly, a defoliant (magnesium chloride
9 kg ha-1) dissolved in 200 l water was applied to induce boll opening, 10-15 days
before the first cotton picking.
3.2.6 Measurement and analysis
Groundwater measurement
Across the experimental field, 20 piezometers were randomly installed up to 2.75 m
depth. Groundwater depth and NO3-N concentration were measured in 15-day intervals
during the entire cotton and cover crop growing period in both years from March to
November. The periods December to February were not sampled, since the groundwater
level had dropped below the depth of the piezometers. The groundwater depth was
measured using a hand-operated sounding apparatus with acoustic and light signals
(Eijkelkamp 2002). The groundwater water was sampled in a water sampling bottle
from all piezometers separately and analyzed immediately for NO3-N concentration.
The NO3-N concentration was determined using nitrate test sticks (color scale in steps
of 10-25-50-100-250-500 mg NO3 l-1 (Merkoquant®, Merk® KGAA)) and
photometrically with a calibration solution (0.5-20 mg l-1) (Spectroquant®, Merk®
KGAA).
Cotton growth, yield and yield components
Leaf area and aboveground biomass
Plant height, leaf area, branch number, boll density and aboveground biomass were
recorded at the five major growth stages of cotton, i.e., 2-4 leaf stage, budding,
flowering, boll formation and physiological maturity. At each stage, 40 plants from each
plot were measured for plant height, branch number and boll number. In addition, five
representative plants were sampled for leaf area, partitioned biomass determination, and
N uptake. Each cotton plant was separated into leaves, stem, flowers and bolls. The leaf
area of fresh leaves was measured with a leaf area meter (Li-Cor, LI-3100) in cm2 and

Impact of tillage and nitrogen on cotton in a cotton/cover-crop/cotton system
24
converted to leaf area index (m2 m-2) as leaf area per unit land area. Total aboveground
biomass was calculated from the sum of plant parts, i.e., cotton stems, leaves, fruit
elements, and seed cotton after oven drying the samples at 70 °C for 24 h. The harvest
index (HI) was calculated as the ratio of raw cotton to total biomass (equation 3.1).
100X)plant(gbiomassTotal
)plant(gRawcotton(%)HI
1
1
(3.1)
Yield and yield components
To measure cotton yield, an 8 m x 1.8 m area covering two central rows was delineated
in each subplot. The cotton from each subplot was harvested manually at 142, 154, 171,
and 179 DAS. The raw cotton yield was adjusted to 6% moisture level by oven drying a
sub-sample of 100 g from each harvest at 70 °C for 16 h. The number of bolls and
percentage of open bolls were determined prior to defoliation from 40 randomly
selected plants from each plot. Similarly, 40 bolls were picked randomly at each picking
and oven dried to calculate average boll weight. Ginning percent was calculated by
separating the lint and seed from 200 g oven-dry raw cotton and weighed separately for
each picking. It was calculated as the ratio of lint to seed cotton (equation 3.2).
100X(g)weightlint)(seedcottonRaw
(g)weightLint(%)percentGinning
(3.2)
Total plant N uptake
The plant samples were ground to pass a 1-mm sieve for N concentration. The samples
were analyzed for percent N content in Cotton Research Institute, Tashkent, Uzbekistan
by Kjeldahl method (Bremner and Mulvaney 1982). The N concentration of stem, leaf,
seed cotton, senescence leaf, and fruit elements were determined separately. For the
calculation of N uptake, the N content (%) was multiplied with the respective dry
weight of the plant component (equation 3.3), and next summed to determine the total N
uptake.
%NX )ha (kg yieldmatter Dry )ha kg(uptake N -1-1 (3.3)

Impact of tillage and nitrogen on cotton in a cotton/cover-crop/cotton system
25
3.2.7 Soil sampling and analysis
Soil samples were collected before the start of the experiment and analyzed for total N
(TN) and carbon (C) as well as mineral N to estimate the initial fertility status of the
experimental site. Soil samples were furthermore collected from each plot after the
cotton harvest in both years. They were collected from 0-10, 10-20, 20-30, 30-60 and
60-90 cm soil depths at three different points in each plot and mixed thoroughly to
obtain a composite sample. Samples were collected by using a tube auger. The samples
were dried in a solar drier until completely dry, ground to pass a 1-mm sieve, and mixed
thoroughly.
Total and mineral N and total C were analyzed using standard procedures in
Uzbekistan (Kuziev 1977). Total N was analyzed by the Kjeldahl method (Bremner and
Mulvaney 1982), NO3-N content (mg kg-1) by the Granvald-Ljashu method, and NH4-N
content (mg kg-1) by colorimetric analysis using the Nessler reagent (Protasov 1977).
Organic carbon (C) was determined according to Tyurin (Cotton Research Institute
1977, Durynina and Egorov 1998), which is a modified Walkley-Black method (Nelson
and Sommers 1982).
3.2.8 Nitrogen use efficiency
Apparent recovery efficiency of nitrogen (AREN), i.e., plant N uptake (kg ha-1) per kg N
applied, was calculated as suggested by Dilz (1988) (equation 3.4)
100 Xplot Nat )ha (kg rate N
plot N0at )ha (kg uptake N-plot Nat )ha (kg uptake NARE
app1-
-1app
-1
N (3.4)
Physiological efficiency of nitrogen (PEN), i.e., kg grain yield per kg N uptake, was
calculated according to Isfan (1990) (equation 3.5).
plot N0at )ha (kg uptake N-plot Nat )ha (kg uptake N
plot N0at )ha (kg Yield-plot Nat )ha (kg YieldPE
1-app
1-
-1app
-1
N (3.5)
Agronomic efficiency of nitrogen (AEN), i.e., the yield (kg ha-1) increase for each kg N
applied, was calculated according to Nova and Loomis (1981) (equation 3.6)

Impact of tillage and nitrogen on cotton in a cotton/cover-crop/cotton system
26
plot Nat )ha (kg rate N
plot N0at )ha (kg Yield -plot Nat )ha (kg Yield AE
app1-
-1app
-1
N (3.6)
where, Napp= nitrogen applied
3.2.9 Apparent N balance
The apparent N balance was estimated from total plant N uptake (cotton and cover
crop), initial and residual (at crop harvest) soil mineral N in the top 90 cm soil profile,
applied N fertilizer, and NO3-N brought with irrigation water. Cumulative N input and
output were calculated for each treatment. Nitrogen loss (via leaching and
denitrification) and N supply from decomposition of cover crop and fallen previous
season cotton leaves were not considered in the N balance. Nitrate N supply from
irrigation water was 11 kg ha-1, which was calculated from the total amount of irrigation
water applied (920 mm ha-1) in the system, i.e., 450 mm for cotton 2008, 750 mm for
cover crop and 395 mm for cotton 2009, and the average NO3-N concentration in
irrigation water (1.2+0.14 mg l-1). Nitrate-N concentration in irrigation water was
measured by sampling irrigation water in three sampling bottles separately for each
irrigation and analyzed immediately for NO3 concentration as described in section 3.2.6,
groundwater. Apparent N balance for cotton/cover-crop/cotton system was calculated
according to formula modified from Timsina et al. (2001) (equation 3.7).
2009)(cottonharvestatNmineralSoilcotton)cropcover
(cottonuptakeNplant(totalOutput)irrigationfromNappliedNamount
Nmineralsoil(initialInput)ha(kgbalanceNsystemApparent 1
(3.7)
3.2.10 Statistical analysis
Crop parameters, i.e., yield, yield components, N uptake and use efficiencies were
statistically analyzed for analysis of variance as a split-plot factorial design with four
replications for yield and yield components, and with three replications for N uptake
and N use efficiency. Leaf area index and aboveground biomass production over
different times were analyzed using repeated measures. Treatment effects were
compared through the analysis of variance using GenStat Discovery Edition 3. Main
and interaction effects were compared using Fisher’s protected LSD (least significant

Impact of tillage and nitrogen on cotton in a cotton/cover-crop/cotton system
27
difference; P=0.05), unless stated otherwise. Simple non-linear regression analysis was
also carried out for the yield response to mineral N in soil and plant N concentration and
biomass yield. The curves were fitted using a quadratic function in SigmaPlot version
11.0.
In the absence of an effect of tillage and N level on the groundwater NO3
concentration and depth, the values presented hereafter are averaged across the
experiment’s twenty piezometers.
3.3 Results
3.3.1 Groundwater depth and nitrate concentration
Groundwater depth and NO3-N concentration varied according to water availability and
growing season. The groundwater depth ranged from 2.5 to 1.5 m in 2008 and from 2.5
to 0.9 m in 2009. The NO3-N concentration in the groundwater varied between 3 and 14
mg l-1 (Figure 3.1).
The temporal dynamics of groundwater NO3-N concentration were linked to
the irrigation and fertilizer application events. The NO3-N concentration always
increased immediately after N fertilizer application followed by irrigation. Groundwater
NO3-N started with a maximum of 14 mg l-1 in the beginning of the 2008 cotton season
and could have been even higher in March/April (immediately after leaching), but
measurements were not available for that period. In 2009, after inclusion of a winter
cover crop in the cotton-cotton system, the groundwater NO3-N after salt leaching, i.e.,
in March-May was with <4 mg l -1 much lower.

Impact of tillage and nitrogen on cotton in a cotton/cover-crop/cotton system
28
May
/08
Jun/
08
Jul/0
8
Aug
/08
Sep
/08
Oct
/08
Nov
/08
Dec
/08
Jan/
09
Feb
/09
Mar
/09
Apr
/09
May
/09
Jun/
09
Jul/0
9
Aug
/09
Sep
/09
Oct
/09
Gro
undw
ater
dep
th, (
m)
0.0
0.5
1.0
1.5
2.0
2.5
3.0
3.5
4.0
4.5
Gro
undw
ater
nitr
ate
(NO
3), m
g l-1
0
2
4
6
8
10
12
14
16
Depth NO3-N
N applicationIrrigation
Figure 3.1 Nitrate concentrations (mg l-1) in groundwater and groundwater depth (m) between May 2008 and October 2009. The dotted and solid arrows represent N fertilization and irrigation events, respectively.
3.3.2 Cotton growth and development
2008
Soil tillage did not significantly affect leaf area index (LAI) and aboveground biomass
(AGB) production in 2008. Nevertheless, the initial growth (before flowering) was
higher under CT than in BP, while after flowering (i.e., after applying fertilizer and
irrigation) the growth rate in BP increased compared to CT (Figures 3.2A and 3.2B). An
effect of N fertilizer level on LAI and AGB was observed only after flowering, where
treatments with N had 57% higher (p<0.05) LAI and 33% higher AGB during boll
formation (103 DAS) than with N-0. At maturity, both LAI and AGB increased
(p<0.05) by 38% in the N treatments compared to N-0. The differences between N-125
and N-250 in LAI and AGB were insignificant at all growth stages (Figures 3.2A and
3.2B).

Impact of tillage and nitrogen on cotton in a cotton/cover-crop/cotton system
29
2008 2009
30 50 70 90 110 130
Leaf
are
a in
dex
(m
2 m
-2)
0
1
2
3
4
5
6BP N0 BP N125 BP N250
2-4 leaf
FL
BF
BU
M
(A)
LSD(0.05)
Time x N
45 60 75 90 105 120 1350
1
2
3
4
5
6
CT N0 CT N125 CT N250
2-4 leaf
FL
BFBM
BU
M
Tillage x N
LSD(0.05)
(C)
Days after sowing
30 50 70 90 110 130
Ab
oveg
rou
nd
bio
mas
s (k
g h
a-1 )
0
3000
6000
9000
12000
15000
18000
(B)P level
Tillage nsNitrogen (N) <0.001Tillage x N nsTime x N <0.001Time x Tillage ns
LSD(0.05)
Time x N
Days after sowing
45 60 75 90 105 120 1350
3000
6000
9000
12000
15000
18000Tillage 0.02Nitrogen (N) <0.001Tillage x N 0.03Time x N <0.001Time x Tillage 0.04
P level
Tillage x N
LSD(0.05)
(D)
Figure 3.2. Leaf area index (A) and aboveground cotton biomass (B) in 2008; leaf
area index (C) and aboveground biomass (D) in 2009 under two tillage (BP=bed planting, CT=conventional tillage) and three N levels (0, 125 and 250 kg ha-1). BU=budding, FL=flowering, BF=boll formation, BM=boll maturation, M=maturity. Significance level is similar for LAI and AGB in respective year. LSD=least significant difference; ns=non significant. Bars represent standard error.
2009
The main and interaction effects of tillage and N level were significant for LAI and
AGB production of cotton during the entire growth stages in 2009 (Figure 3.2). Tillage
had no effect on cotton growth with N-0, but with the higher N levels BP had a
significantly higher (p<0.05) LAI and AGB than under CT. With N application, LAI
and AGB production increased significantly under both tillage methods, while the
response of cotton to an increased N level from N-125 to N-250 was higher in BP than

Impact of tillage and nitrogen on cotton in a cotton/cover-crop/cotton system
30
under CT. BP with N-250 showed an increase of LAI by about 55% and of AGB by
35% during the entire growing period compared to N-125. In contrast, under CT, the
increase from N-125 to N-250 had a visible effect only after flowering, where a 37-48%
higher LAI and 19-36% higher AGB were observed (Figures 3.2C and 3.2D).
3.3.3 Yield and yield components
The average raw cotton yield varied little and was 3.8-3.9 t ha-1 in both years (Table
3.2). The yield was not affected (p>0.05) by tillage method, while it increased
significantly with N application in both years (Table 3.2). With N fertilizer, up to 5.1 t
ha-1 cotton yield could be achieved (in 2009; Table 3.2). Irrespective of the tillage
method, raw cotton yield with N-125 was higher than the average by 25% in 2008 and
was more than two times higher (143%) in 2009 than for N-0. With N-125 to N-250,
yield was not affected in 2008, while it increased (p<0.05) by 22% in 2009. A similar
trend as for yield was observed for AGB production at maturity.
Tillage did not affect (p>0.05) harvest index (HI), which did, however,
decrease (p<0.05) with N application rate in both years. A significant interaction effect
between tillage and N level (p=0.01) was observed for HI in 2009. In BP, HI decreased
by 17% with N-125 compared to N-0. In contrast, HI was not significantly affected by
N application under CT in both years. The average ginning percentage was 39% in both
years. It was not affected (p>0.05) by tillage method, but decreased (p<0.05) with N
applications in both years (Table 3.2). Irrespective of the tillage method, ginning
percentage decreased (p<0.05) by 6% with N-250 compared to N-0 in both years.
Tillage method did not affect boll density, boll weight, and plant height in
either year except boll weight at third picking in 2008, where it was 6% higher in BP
than under CT (Table 3.3). Nitrogen application significantly increased boll density in
both years (Table 3.3). Averaged across both tillage methods, an application of N-125
increased (p<0.05) boll density by 20% in 2008 and by 86% in 2009 compared to N-0.
With a further increase in N level from N-125 to N-250, boll density increased by 13%
in 2009, but there was no difference in 2008.

Impact of tillage and nitrogen on cotton in a cotton/cover-crop/cotton system
31
Table 3.2 Main effects of tillage method and N level on raw cotton yield, aboveground biomass (AGB), harvest index and ginning percent of cotton in 2008 and 2009.
Treatment Raw cotton yield (kg ha-1)
AGB (kg ha-1)
Harvest index (%)
Ginning percent (%)
2008 2009 2008 2009 2008 2009 2008 2009 Tillage BP 3901 3790 10633 10734 37.1 35.8 39.2 38.8 CT 3877 3777 10181 9372 37.7 37.6 39.9 39.1 LSD (0.05) 687 606 2206 1973 2.1 6.2 2.6 1.9 Nitrogen (kg ha-
1)
0 3269 2091 8234 5015 39.7 39.3 40.6 40.1 125 4084 4171 11004 10571 37.4 37.3 39.8 38.7 250 4313 5090 11984 14573 36.1 33.3 38.2 38.1 LSD (0.05) 254 456 1179 1236 2.8 3.9 1.5 1.6
ANOVA Tillage (T) ns ns ns ns ns ns ns ns Nitrogen (N) *** *** *** *** * * ** * T x N ns ns ns ns ns ** ns ns LSD (0.05) 636 668 2152 1999 3.5 6.3 2.6 2.3 Mean 3889 3784 10407 10053 37.4 36.7 39.5 38.9
BP=bed planting, CT=conventional tillage. *P≤0.05, **P≤0.01, *** p≤0.001, ns=non significant
Nitrogen applications increased boll weight in both years. With N-125 boll
weight was higher by 7% in 2008 and by 10% in 2009 than for N-0. With N-125 to N-
250, boll weight increased only by 3% in 2008, while it was increased by 15% in 2009.
Plant height was not affected by tillage and N level (p>0.05) in 2008, while significant
(p=0.03) interaction effects between tillage and N were observed in 2009 (Table 3.4).

Impact of tillage and nitrogen on cotton in a cotton/cover-crop/cotton system
32
Table 3.3 Main effects of tillage and N level on boll weight, boll density, percent open boll and plant height of cotton in 2008 and 2009.
Treatment Boll weight first picking
(g)
Boll weight third picking
(g)
Boll density (m-2)
Open boll at defoliation
(%)
Plant height (cm)
2008 2009 2008 2009 2008 2009 2008 2009 2008 2009 Tillage BP 6.3 5.5 5.9 4.7 69 76 28 27 92 91 CT 6.2 5.4 5.6 4.7 68 71 43 41 93 92 LSD (0.05) 0.2 0.5 0.2 0.6 5.8 22 10.8 16.5 6.6 8 Nitrogen 0 5.9 4.8 5.4 4.3 62 45 46 45 88 80 125 6.3 5.6 5.8 4.4 74 83 31 36 94 97 250 6.4 6.1 6.1 5.4 71 94 28 22 95 97 LSD (0.05) 0.3 0.35 0.4 0.5 9 12.6 12 7.6 7 5.2
ANOVA Tillage (T) ns ns ** ns ns ns * + ns ns Nitrogen (N) * *** ** ** * *** ** *** ns *** T x N ns ns ns ns ns ns ns * ns * LSD (0.05) 0.4 0.55 0.48 0.75 11 22 15.6 15.4 9 7.3 Mean 6.2 5.5 5.8 4.7 68.7 74 35.4 34 92 91.4
BP=bed planting, CT=conventional tillage. +P ≤0.1, *P≤0.05, **P≤0.01, *** p≤0.001, ns=non significant
Table 3.4 Interaction effects between tillage method and N level on harvest index, plant height, and percent open bolls of cotton in 2009.
Tillage Nitrogen (kg ha-1)
Harvest index (%)
Percent open boll at defoliation (%)
Plant height (cm)
BP 0 42 43 76 125 35 29 96 250 30 9 100
CT 0 37 46 84 125 40 44 98 250 37 34 94
LSD (0.05) 6.3 15.4 7.3 BP=bed planting, CT=conventional tillage
In both years, 35% of the bolls opened prior to defoliation. In 2008, the share
of opened bolls was significantly affected by tillage and N level (Table 3.3).
Irrespective of the N level, under CT 52% more (p=0.02) bolls opened than in BP.
Percent open bolls decreased with N applications and was lower (p<0.05) by 33% with
N-125 and by 39% with N-250 compared to N-0. The difference in the number of
opened bolls between N-125 and N-250 was non-significant. In 2009, a significant
interaction effects (p=0.03) between tillage and N level was observed for the percentage

Impact of tillage and nitrogen on cotton in a cotton/cover-crop/cotton system
33
of opened bolls. The number of opened bolls was higher (p=0.03) under CT than in BP
with N applications, but there was no significant effect in the N-0 treatments (Table
3.4).
3.3.4 Relationship between soil mineral N (residual plus applied N) and yield
Tillage had no effect on the relationship between cotton yield and soil mineral N content
(residual mineral N plus applied N) (Figure 3.3). The combined data for 2008 and 2009
show that to obtain about 4500 kg raw cotton yield ha-1, nearly 300 kg available mineral
N ha-1 in the top 90 cm soil profile (either from residual soil N or applied N) was
required under both tillage methods. However, cotton yield increased linearly with
available soil N until 200 kg and then tapered off. Hence, any N added above 150 kg ha-
1 (assuming that about 50 kg are residual) does not lead to the same relative effect on
cotton yield.
Residual plus applied N (kg ha-1)
0 50 100 150 200 250 300 350 400
Co
tton
yie
ld (
kg h
a-1)
0
1000
2000
3000
4000
5000
6000BP, R2= 0.85
CT, R2= 0.80
Figure 3.3 Cotton yield as a function of residual soil mineral N in the top 90 cm soil profile plus applied N under two tillage methods (BP=bed planting and CT=conventional tillage). Curve fit is sigmoid, 3 parameters.
3.3.5 Plant N concentration and uptake
Plant N concentration increased with N application in both years (Figure 3.4). With the
same amount of AGB accumulation, cotton plants with N-0 had a lower N concentration
than plants fertilized with N-125 and N-250 after accumulation of more than 2 t ha-1

Impact of tillage and nitrogen on cotton in a cotton/cover-crop/cotton system
34
AGB in both years. In 2008, due to high initial residual soil mineral N, plant N
concentration did not increase when N was increased from N-125 to N-250, while in
2009 the concentration was higher with N-250 than with N-125 (Figure 3.4). A similar
response to N was recorded for cotton yield and AGB production (Table 3.2).
Averaged over N application rates, aboveground plant N uptake before
flowering (i.e., before irrigation and fertilizer application) was higher (p<0.05) under
CT than in BP in both years (Table 3.5). This increased N uptake coincided with the
faster early growth and higher biomass production during the early stage under CT
(Figure 3.2). After flowering, N uptake was not affected by tillage methods in 2008,
while in 2009; N uptake was significantly higher in BP than under CT. A significant
interaction effect between tillage and N level was observed in total N uptake at maturity
in 2009. With N-250, BP showed 56% higher N uptake than CT, while with N-0 and N-
125, tillage had no significant effect (Figure 3.5A).
Aboveground biomass (t ha-1)
0 2 4 6 8 10 12 14 16 18
Pla
nt N
con
cent
ratio
n (%
)
0.0
0.5
1.0
1.5
2.0
2.5
3.0
3.5 y = 3.03 - 0.2x, R2=0.85
y = 3.1 - 0.87x, R2=0.87
y = 2.96 - 0.11x, R2=0.86
N-0
N-125
N-250
(A)
N-0 N-125 N-250
Aboveground biomass (t ha-1)
0 2 4 6 8 10 12 14 16 180.0
0.5
1.0
1.5
2.0
2.5
3.0
3.5 y = 2.84 - 0.09x, R2=0.75
y = 2.8 - 0.3x, R2=0.76
y = 2.9 - 0.13x, R2=0.85N-0N-125
N-250
(B)
Figure 3.4 Relation between plant N concentration (%) and aboveground biomass (t ha-1) of cotton at three N levels, i.e., N-0, N-125 and N-250 kg ha-1 (A) in 2008 (N=25); (B) in 2009 (N=18)
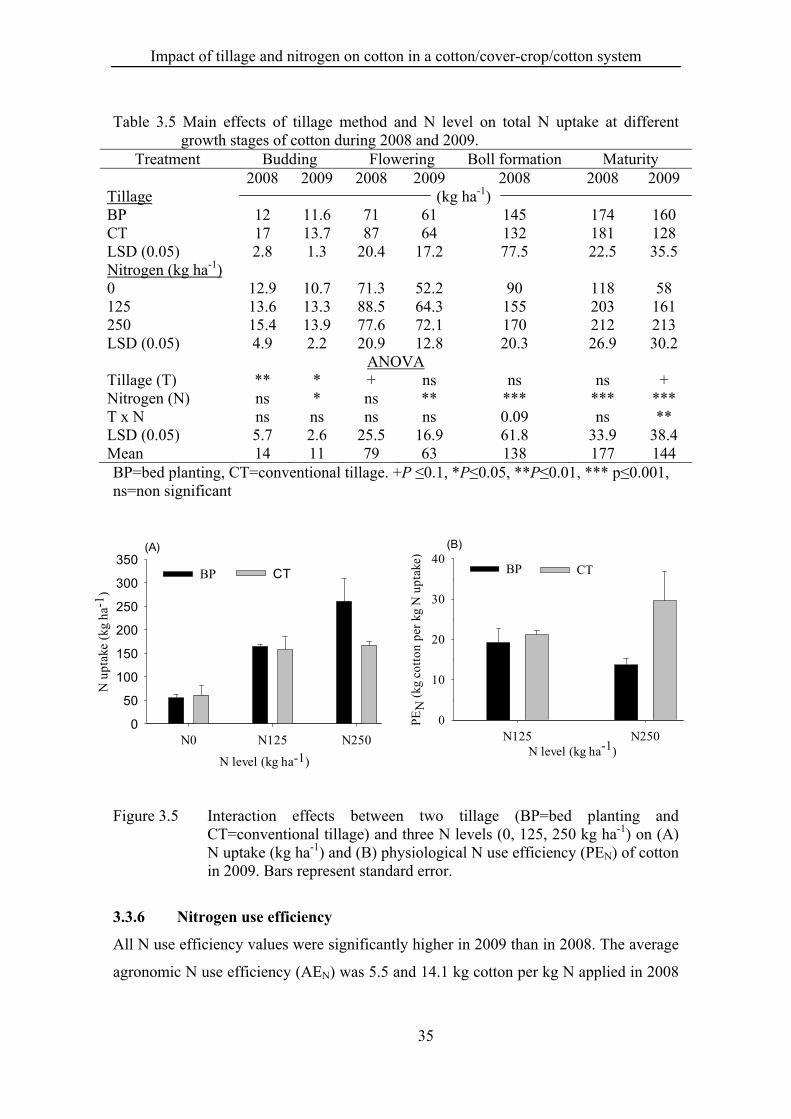
Impact of tillage and nitrogen on cotton in a cotton/cover-crop/cotton system
35
Table 3.5 Main effects of tillage method and N level on total N uptake at different growth stages of cotton during 2008 and 2009.
Treatment Budding Flowering Boll formation Maturity 2008 2009 2008 2009 2008 2008 2009
Tillage (kg ha-1) BP 12 11.6 71 61 145 174 160 CT 17 13.7 87 64 132 181 128 LSD (0.05) 2.8 1.3 20.4 17.2 77.5 22.5 35.5 Nitrogen (kg ha-1) 0 12.9 10.7 71.3 52.2 90 118 58 125 13.6 13.3 88.5 64.3 155 203 161 250 15.4 13.9 77.6 72.1 170 212 213 LSD (0.05) 4.9 2.2 20.9 12.8 20.3 26.9 30.2
ANOVA Tillage (T) ** * + ns ns ns + Nitrogen (N) ns * ns ** *** *** *** T x N ns ns ns ns 0.09 ns ** LSD (0.05) 5.7 2.6 25.5 16.9 61.8 33.9 38.4 Mean 14 11 79 63 138 177 144 BP=bed planting, CT=conventional tillage. +P ≤0.1, *P≤0.05, **P≤0.01, *** p≤0.001, ns=non significant
N level (kg ha-1)
N0 N125 N250
N u
ptak
e (k
g ha
-1)
0
50
100
150
200
250
300
350BP CT
(A)
N level (kg ha-1)N125 N250
PE
N (
kg c
otto
n pe
r kg
N u
ptak
e)
0
10
20
30
40BP CT
(B)
Figure 3.5 Interaction effects between two tillage (BP=bed planting and CT=conventional tillage) and three N levels (0, 125, 250 kg ha-1) on (A) N uptake (kg ha-1) and (B) physiological N use efficiency (PEN) of cotton in 2009. Bars represent standard error.
3.3.6 Nitrogen use efficiency
All N use efficiency values were significantly higher in 2009 than in 2008. The average
agronomic N use efficiency (AEN) was 5.5 and 14.1 kg cotton per kg N applied in 2008

Impact of tillage and nitrogen on cotton in a cotton/cover-crop/cotton system
36
and 2009, respectively (Table 3.6). Tillage did not affect (p>0.05) AEN. However, AEN
significantly decreased (p<0.05) with increased N level in both years, by 42% in 2008
and by 30% in 2009 with N-125 to N-250.
Table 3.6 Main effects of tillage and N level on agronomic N efficiency, physiological N efficiency, and apparent recovery N efficiency of cotton in 2008 and 2009.
Treatment Agronomic efficiency Physiological efficiency Recovery efficiency 2008 2009 2008 2009 2008 2009
Tillage (kg cotton kg-1 N applied) (kg cotton kg-1 N uptake) (%) BP 5.6 14 10.5 16.4 56.5 84.8 CT 5.4 14.3 11.9 25.4 50.3 59.5 LSD (0.05) 5.3 7.8 11.6 13.5 50 31.7 Nitrogen 125 7.0 16.6 10.3 20.2 68.3 82.2 250 4.0 11.7 13.3 21.6 38.1 62.2 LSD (0.05) 2.4 5.1 4.8 6.6 20 23
ANOVA Tillage (T) ns ns ns ns ns + Nitrogen (N) * * ns ns ** + T x N ns ns ns * ns ns LSD (0.05) 4.9 6.5 10.7 10.7 50 27 Mean 5.5 14.1 11.2 20.9 53 70
BP=bed planting, CT=conventional tillage. +P ≤0.1, *P≤0.05, **P≤0.01, *** p≤0.001, ns=non significant
The average apparent N recovery efficiency (AREN) was 53% in 2008 and
72% in 2009. Tillage did not affect the AREN in 2008, while in 2009 AERN was 42%
higher in BP than under CT. It also decreased with increased N level, i.e., by 44% in
2008 and by 24% in 2009 with N-125 to N-250.
Tillage and N level had no significant effect on physiological N use efficiency
(PEN) in both years, while a significant interaction effects between tillage and N level
was observed in 2009. In 2009, BP with N-250 showed a 54% lower (p<0.05) PEN than
CT with N-250, while with N-125, tillage had no significant effects (Figure 3.5B).
3.3.7 Apparent N balance
A significant year effects was observed for apparent N balance. The average apparent
N balance was positive, i.e., 10 kg ha-1 in 2008, while it was negative, i.e., -36 kg-1 in
2009. Tillage did not affect (p>0.05) the apparent N balance in 2008, while in 2009, BP
had a higher negative balance than CT (Table 3.7). Nitrogen applications led to a

Impact of tillage and nitrogen on cotton in a cotton/cover-crop/cotton system
37
significantly higher N balance compared to N-0 in both years. In 2008, the highest
(p<0.05) positive N balance (+99 kg N ha-1) was observed with N-250, while the N
balance with N-125 (-19 kg N ha-1) and N-0 (-50 kg N ha-1) was negative.
In 2009, a significant interaction effects between tillage and N level was
observed for the apparent N balance. With N-0 and N-125, tillage had no effect on the
apparent N balance and was even negative with both tillage methods. In contrast, with
N-250, CT showed a positive N balance (+42 kg ha-1), while it was negative for BP (-29
kg ha-1) (Table 3.7).
Table 3.7 Interaction effects between tillage and N level on total input, total out put and apparent N balance of cotton at maturity in 2008 and 2009.
Tillage Nitrogen level
Apparent N balance Total input Total output 2008 2009 2008 2009 2008 2009
(kg ha-1) BP 0 -40 -60 154 87.6 194 148
125 -20 -44 279 234 299 277 250 96 -29 404 353 308 383
CT 0 -59 -61 154 96 214 157 125 -18 -64 279 221 297 285 250 102 42 404 343 302 301
ANOVA Tillage (T) ns *** - ns ns + Nitrogen (N) *** ** - *** *** *** T x N ns * - ns ns ** LSD (0.05) 41 37 - 20 41 36 Mean 10 -36 280 222 269 258 BP=bed planting, CT=conventional tillage. +P ≤0.1, *P≤0.05, **P≤0.01 *** p≤0.001, ns=non- significant 3.3.8 System apparent N balance
In the cotton/cover-crop/cotton rotation system, system N input was 411 kg ha-1, N
output was 437 kg ha-1 and apparent N balance was -26 kg N ha-1 (Table 3.8). Total N
input was the same for both tillage methods. A significant interaction effects was
observed between tillage and N for the total N output. BP with N-250 had a higher
(p<0.05) N output (597 kg N ha-1), which was 78 kg N ha-1 higher than CT with the
same N level (data not shown).

Impact of tillage and nitrogen on cotton in a cotton/cover-crop/cotton system
38
Table 3.8 Main effect of tillage and N on mineral N at harvest, total input, total out put and apparent N balance of cotton/cover-crop/cotton rotation system.
Treatment Soil mineral N on top 90 cm,
at harvest
Total N uptake Total input
Total output
Apparent N balance
2008 2009 Cotton 2008
Cover crop
Cotton 2009
Tillage (kg ha-1) BP 93 64 174 45 160 411 444 -33 CT 90 74 181 45 128 411 430 -19 LSD (0.05) 21.9 9.9 22.5 - 35.5 - 19.7 19.7 Nitrogen 0 86 65 118 30 58 161 269 -108 125 95 68 203 53 161 411 484 -73 250 93 75 212 53 213 661 558 103 LSD(0.05) 13 9.5 26.9 - 30.2 - 44.7 44.7
ANOVA Tillage (T) ns * ns + - + + Nitrogen ns + *** *** - *** *** T x N ns ns ns ** - * * LSD (0.05) 22 11.8 33.9 38.4 - 52.1 52.1 Mean 92 69 178 144 411 437 -26 BP=bed planting, CT=conventional tillage. +P ≤0.1, *P≤0.05, **P≤0.01, *** p≤0.001, ns=non significant
The apparent system N balance was negative with N-0 and N-125, but positive
with N-250 with both tillage methods. Irrespective of N level, BP had a 73% higher
negative N balance than CT. A significant interaction effects between tillage and N
level was observed where, with N-0, CT had a 32% higher negative N balance than BP.
With N-250, CT had a significantly higher positive N balance (+142 kg N ha-1), which
was more than twice as high (66 kg ha-1) as for BP (Figure 3.6).

Impact of tillage and nitrogen on cotton in a cotton/cover-crop/cotton system
39
N level (kg ha-1)
N0 N125 N250
App
aren
t N
bal
ance
(kg
ha-
1 )
-150
-100
-50
0
50
100
150
200BP CT
Figure 3.6 Interaction effects between tillage (BP=bed planting and CT=conventional tillage) and N level (0, 125 and 250 kg ha-1) on apparent system N balance (kg ha-1) in cotton/cover-crop/cotton rotation. Bars represent standard error.
3.3.9 Soil organic carbon
The average soil organic carbon (OC) content in the experimental field was less than
0.40% which is considered as very low according to the FAO soil classification.
Averaged over tillage method and N level, it was significantly higher (p<0.05) in
October 2009, i.e., after inclusion of the cover crop in the system, than at the other
sampling dates in October 2008 and March 2008 at all soil depths. In contrast, in the top
30-cm soil depth in October 2008 it decreased significantly by 15-20% compared to the
initial level. A significant interaction effects between soil depth and sampling dates was
observed (Figure 3.7). Averaged across the treatments and sampling dates, soil organic
C decreased with soil depth.
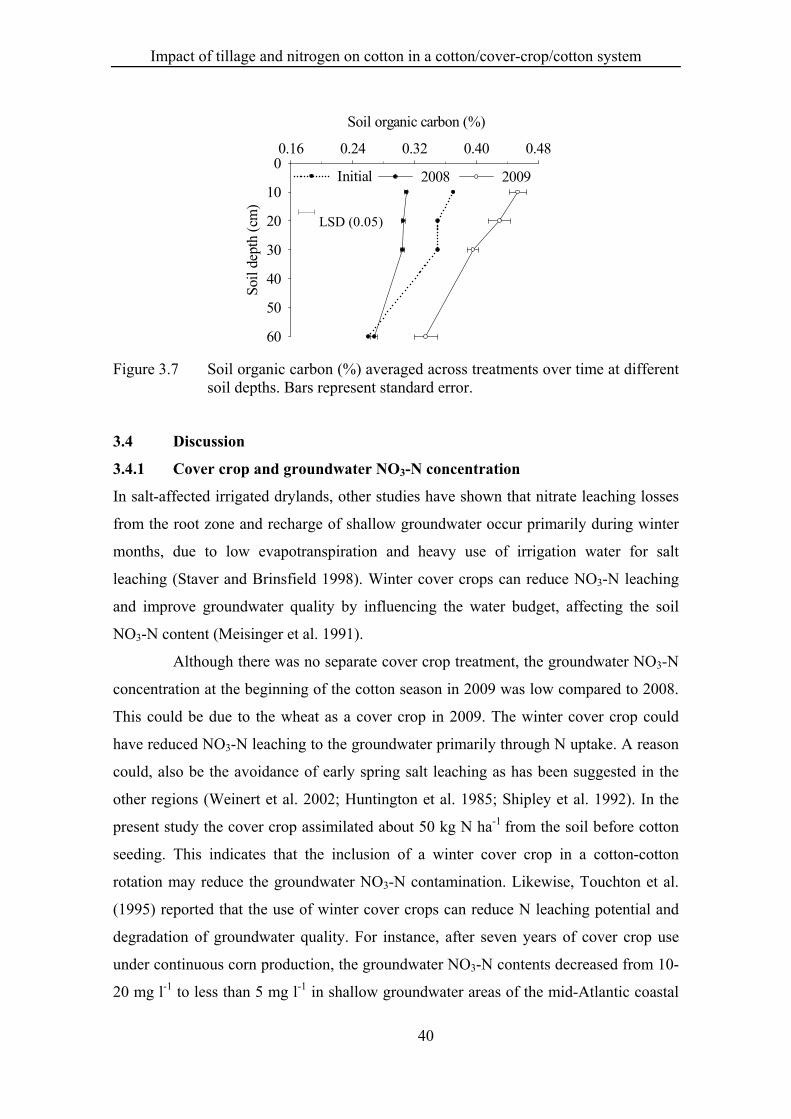
Impact of tillage and nitrogen on cotton in a cotton/cover-crop/cotton system
40
Soil organic carbon (%)
0.16 0.24 0.32 0.40 0.48
Soil
dept
h (c
m)
0
10
20
30
40
50
60
LSD (0.05)
2008 2009Initial
Figure 3.7 Soil organic carbon (%) averaged across treatments over time at different soil depths. Bars represent standard error.
3.4 Discussion
3.4.1 Cover crop and groundwater NO3-N concentration
In salt-affected irrigated drylands, other studies have shown that nitrate leaching losses
from the root zone and recharge of shallow groundwater occur primarily during winter
months, due to low evapotranspiration and heavy use of irrigation water for salt
leaching (Staver and Brinsfield 1998). Winter cover crops can reduce NO3-N leaching
and improve groundwater quality by influencing the water budget, affecting the soil
NO3-N content (Meisinger et al. 1991).
Although there was no separate cover crop treatment, the groundwater NO3-N
concentration at the beginning of the cotton season in 2009 was low compared to 2008.
This could be due to the wheat as a cover crop in 2009. The winter cover crop could
have reduced NO3-N leaching to the groundwater primarily through N uptake. A reason
could, also be the avoidance of early spring salt leaching as has been suggested in the
other regions (Weinert et al. 2002; Huntington et al. 1985; Shipley et al. 1992). In the
present study the cover crop assimilated about 50 kg N ha-1 from the soil before cotton
seeding. This indicates that the inclusion of a winter cover crop in a cotton-cotton
rotation may reduce the groundwater NO3-N contamination. Likewise, Touchton et al.
(1995) reported that the use of winter cover crops can reduce N leaching potential and
degradation of groundwater quality. For instance, after seven years of cover crop use
under continuous corn production, the groundwater NO3-N contents decreased from 10-
20 mg l-1 to less than 5 mg l-1 in shallow groundwater areas of the mid-Atlantic coastal

Impact of tillage and nitrogen on cotton in a cotton/cover-crop/cotton system
41
plain (Staver and Brinsfield 1998). Since the study covered only the first two seasons of
a long-term trial, further research results will have to confirm if the initial effects of the
cover crops on groundwater NO3 contamination are sustained.
3.4.2 Cotton growth yield and yield components
Effect of tillage
No difference between BP and CT with respect to raw cotton yield was observed in
either year (Table 3.2). In 2008, this could be due to good field preparation, which could
have helped avoiding the usually expected temporary reduction in yield when changing
from conventional to conservation practices (Hicks et al. 1989; Boquet et al. 2004;
Tursonov 2009). Despite the faster initial growth of cotton under CT, after fertilizer and
irrigation applications, growth rates in BP surpassed those in CT, but later these
differences became insignificant. After the field was ploughed several times and laser-
leveled, the beds were freshly prepared, resulting in lower soil moisture contents in BP
compared to CT. Volumetric moisture in top 10 cm soil during cotton sowing was
10+1% in BP and 13+0.5% in CT. The resulting lower soil moisture perhaps delayed
germination and initial growth in BP by 3-5 days. The comparatively faster growth in
BP after budding could be due to less soil compaction since field traffic was reduced
and less root injury had occurred. For the Khorezm region, Tursonov (2009) reported
that, due to effective field preparation, there was no yield reduction in cotton during the
transition season from conventional to conservation agriculture.
The absence of differences in raw cotton yields between BP and CT especially
in 2009 suggests that cotton can be planted on permanent raised beds without yield
reduction. The cover crop may have been an additional element creating a more
favorable environment for seed germination and stand establishment in BP, which in
turn may have led to equal yields in BP and CT. The consistently better growth in BP
with N applications can be attributed to a more evenly distributed N mineralization over
the entire growing season, while under CT where the field was ploughed, a flush of N
mineralization likely occurred following cultivation. This hypothesis is supported by the
comparatively higher mineral N content with N-250 under CT at budding (60 DAS)
than in BP in 2009. In contrast, at later stages, i.e., flowering and maturity, the mineral
N content did not vary between the tillage treatments (Figure 3.8). Francis and Knight

Impact of tillage and nitrogen on cotton in a cotton/cover-crop/cotton system
42
(1993) reported that a flush of N mineralization occurs following cultivation prior to the
onset of rapid early crop growth under CT, while under conservation tillage
mineralization is more evenly distributed over the growing season. This further supports
the hypothesis in this study. Also, Keeling et al. (1989) concluded this after recording
similar cotton yields in conventional and conservation tillage practices while including a
winter wheat cover crop. The findings from this short-term study suggests that cotton
can be cultivated on permanent raised beds without yield differences compared to CT
using a winter cover crop in rotation. However, it is important to assess whether the
growth and active termination of the winter cover crop is also a financially feasible
practice, since the cover crop cultivation and termination demand additional expenses.
The present results indicate that these costs are not recovered by higher yields but
perhaps compensated for by the reduced cost of using BP in general.
Growth stagesBudding Flowering Maturity
Min
eral
N (
mg
kg-1
)
0
4
8
12
16
20BP CT
Figure 3.8 Mineral N content in top 30 cm soil under bed planting (BP) and conventional tillage (CT) at different growth stages of cotton with 250 kg N ha-1 in 2009.
Effect of nitrogen
Increased cotton growth (Figure 3.2), yield, yield components (Table 3.2), and plant N
concentration (Figure 3.4) with N application under both tillage methods indicates that
cotton yield in both tillage types can be increased with N application. The higher cotton
yields with N applications compared to N-0 were mostly due to an increased boll
density and increased boll weight (Table 3.3) which have been previously suggested as
the major yield determining components for cotton (Pettigrew and Jones 2001; Wiatrak

Impact of tillage and nitrogen on cotton in a cotton/cover-crop/cotton system
43
et al. 2005). Obviously, N applications increase the photosynthesis rates leading in turn
to a higher accumulation of metabolites and thus higher boll weight.
In 2009, cotton yield was doubled with N-125 compared to N-0, but with the
addition of another 125 kg N (double the farmer’s investment) the relative gain was
much lower (Table 3.2). Thus, it is not worth investing in 250 kg N ha-1 during the
transition period from CT to BP under such soil and climatic conditions. Obviously, the
effect of the amount of N applied depended on the initial soil mineral N content as
indicated by the lower response of applied N in 2008 than in 2009. Also, there was a
linear increase in cotton yield with the available soil mineral N until 200 kg ha-1, which
then it tapered off. Therefore, every kg of N added above 150 kg (assuming that about
50 kg N are residual) does not lead to the same relative effect. The effect of applied N
was not so marked in 2008, where the raw cotton yield of the N-0 treatments was on
average only 25% less than that of the N-125 and N-250 treatments; and there was also
no further yield increment from N-125 to N-250 (Table 3.2). This could be due to the
relatively high residual mineral N content in the soil, which was apparently sufficient to
compensate for the absence of N fertilizer applications. Since the experimental field had
previously been cropped with heavily fertilized cotton for virtually 20 years, the initial
soil N analyses revealed nearly 135 kg residual mineral N ha-1 in the top 90 cm soil
profile (Table 2.1). However, in 2009 only about 40-50 kg residual mineral N was
available before cotton planting. This is related to the comparatively low mineral N
during the cotton harvest in 2008 (92 kg N ha-1) (Table 3.8) and also to the N uptake by
the cover crop (50 kg N ha-1) from harvest to before cotton planting.
The average yield of cotton under the recommended N application of 180 kg
ha-1 in the study region is 2.7 t ha-1 (Statistical Department of Khorezm 2009). Even
with the application of a lower than recommended N rate, i.e., 125 kg ha-1, the average
yield in both years was higher by 53% than the average yields observed in this region
during the same periods. The yield increase could have been caused by a number of
factors, not the least being the laser-leveling of the field prior to the establishment of the
experiment. Previous studies had reported increased crop yields under laser-leveled
fields compared to traditionally leveled fields (Tyagi 1984; Jat et al. 2003). The laser-
leveled field reduces the water logging in low-lying areas and the soil water deficit at

Impact of tillage and nitrogen on cotton in a cotton/cover-crop/cotton system
44
higher spots, which leads to uniform soil moisture distribution which results in good
germination; it enhances input use efficiency and crop yields (Jat et al. 2006).
3.4.3 Nitrogen uptake and use efficiency
The AEN and AREN were not significantly affected by tillage methods, although the
values significantly decreased with increasing N rates in both years. The efficiency of
the applied N decreases with an increased rate of N application because other factors
usually become limited (De Wit 1992). Yet, this alone cannot explain the low N use
efficiency in 2008. In addition, the high initial residual soil mineral N contents at the
onset of the experiment in 2008 had decreased the applied N fertilizer response.
Likewise, Rochester et al. (2001) reported that higher inherent mineral N reduced the
reliance of the cotton crop on applied N fertilizer. This indicates that before applying N
fertilizer, the residual soil mineral N need to be considered to increase its efficiency,
hence it minimizes the N loss to the environment.
In a study by Kienzler (2010), the AEN in the study region under CT with 180
kg N ha-1 was 4-8 kg cotton kg-1 N, which was near the AEN in 2008 in the present
study, where AEN was 7 and 4 kg kg-1 with N-125 and N-250 kg ha-1, respectively. In
contrast, during 2009, AEN increased and was 17 and 12 kg kg-1 with N-125 and N-250,
respectively. This could be due to the lower initial residual mineral N in the soil profile,
where a winter cover crop before cotton had taken about 50 kg N ha-1 from the soil. This
N absorbed by the cover crop may have been available to the cotton crop at a later stage.
This indicates that introducing a winter cover crop could increase N use efficiency of
applied N in irrigated cotton-cotton systems.
The higher AREN under BP in 2009 than under CT is related to higher total N
uptake in BP, which was 25% higher during maturity (Figure 3.5A). This increased N
uptake particularly at this stage is related to the increased LAI and AGB accumulation
in BP compared to CT (Figure 3.2). The increased LAI and AGB accumulation with N
applications has been attributed to an increased root biomass. For example, Weston and
Zandstra (1989) as well as Garten and Widders (1990) postulated that an increased LAI
and AGB in BP with N-250 after flowering could have triggered root growth due to N
fertilization. Slow release of mineral N on top 30 cm soil during initial stage of cotton
growth in BP (Figure 3.8) may have forced the plants to increase the rooting depth for

Impact of tillage and nitrogen on cotton in a cotton/cover-crop/cotton system
45
nutrient uptake. As a result, cotton root in BP could have reached deeper soil layer
compared to CT. Sainju et al. (2005) also observed that cotton root biomass increased
more strongly under conservation tillage with 60 kg N ha-1 than under CT with 120 kg
N ha-1 application. However, rooting depth was not measured throughout the study
period, it can be neither confirm nor reject this postulation.
Significantly lower PEN with N-250 in BP than under CT during 2009 could
be due to increasing LAI and AGB in BP even at the time of defoliant application,
which may be the reason why there was no increase in raw cotton yield. A significantly
lower number of open bolls and increasing biomass accumulation and LAI at the time of
defoliant application in BP with higher N application than under CT indicated that
cotton was still actively growing. It also suggests that the growth duration of cotton in
BP with higher N application tends to be longer than under CT. To reap the potential
yield benefit from BP, cotton planting should either be earlier than under CT or short-
duration cotton varieties should be introduced.
3.4.4 Apparent N balance
The greater positive N balance (N loss) with high N application in 2008 than in 2009
could be, as explained above, due to the higher initial residual mineral N in the soil
profile that could have reduced the crop uptake of applied N. The applied N may have
been lost either through gaseous loss to the environment or leaching to the groundwater.
A previous study in the region under a conventional system showed that about 40% of
applied N could be lost through denitrification (Scheer et al. 2009). In contrast, the
decrease in the positive N balance with a high N application in 2009 could be due to the
presence of the cover crop, which had taken about 50 kg N ha-1 during the winter. This
N might have become available to the following cotton crop. The slightly negative N
balance (-29 kg ha-1) observed in BP with N-250 could be related to an increased LAI
and AGB production after flowering, which could also have increased N uptake in the
later stage.
A greater negative N balance with N-0 and N-125 than with N-250 under both
tillage methods could have been caused by various factors. Firstly, the cotton plants
may have taken N from the decomposed cover crop and the fallen cotton leaves, which
was not accounted for during the N balance calculation. Yet, previous findings showed

Impact of tillage and nitrogen on cotton in a cotton/cover-crop/cotton system
46
that the rapidly increasing spring temperatures, adequate soil moisture, low soil organic
matter and well drained soils favor a rapid accumulation of inorganic N during cover
crop decomposition (Weinert et al. 2002). Malpassi et al. (2000) quantified that even up
to 55% of the N contained in the roots of a spring-terminated cereal cover crop became
available to the following crop.
A second reason for the negative N balance could be the ammonium
concentrations in the irrigation water. Although not regularly measured, the occasional
recordings showed a concentration of 4-5 mg NH4-N l-1. These amounts were not
included in the N balance accounting, but indicate that irrigation may have added even
more N to the soil. Although only irregularly measured, the available data indicated that
at least 36 kg N ha-1 was added via the irrigation water. When taken this into account,
the averaged N balances in the system could be almost equalized.
Furthermore, the groundwater could have been an additional source of NO3-N
as previously postulated by Kienzler (2010). In particular since the groundwater levels
were relatively shallow during the study period, i.e., 1.4 m in 2008 and 0.9 m in 2009.
The measured NO3 concentration in the groundwater throughout the cotton growing
period (budding to boll maturation) varied from 4-10 mg l-1 (Figure 3.1). Thus, it is not
unlikely that groundwater at least at some stages may have contributed to satisfy crop
NO3-N demand. Kienzler (2010) estimated that groundwater NO3 contribution to cotton
grown under shallow groundwater conditions and a content of 8 mg l-1 NO3
concentration, contributed about 29 kg NO3-N during the cotton growing season.
3.4.5 Total soil organic carbon
Continuous mono-cropped cotton over the past two decades under intensive soil tillage
in the study region could be the reason for the low organic carbon in the soil. Schwab et
al. (2002) reported that as a low-residue crop, cotton, grown continuously for a long
time as mono-crop, reduces the organic matter content in soil. A low carbon input in
such a system is due to the sparse and stiff cotton residues, which take a longer time to
release organic carbon. Furthermore, intensive soil tillage in the irrigated system could
lead to a high mineralization of the soil organic matter, and as a result low organic
carbon in the soil.

Impact of tillage and nitrogen on cotton in a cotton/cover-crop/cotton system
47
The significantly increased soil organic carbon in October 2009 compared to
the other sampling dates could be due to the cover crop in the system. This may have
increased the carbon inputs and soil organic carbon compared to bare fallow. This in
turn suggests that growing cover crops in irrigated mono-crop cotton has the potential to
increase carbon sequestration and improve soil quality. Likewise, Sainju et al. (2007)
reported that an introduction of a winter cover crop in a mono-cropped cotton rotation
increased the carbon inputs and soil active carbon fraction compared with bare fallow in
two years of study under irrigated cotton in southern Georgia, USA. The significantly
lower organic carbon in October 2008 than in the initial soil may thus be due to
intensive soil tillage and laser leveling followed by deep ploughing, which may have
destroyed the soil structure led to the low organic carbon content.
Several studies have shown improvements in soil quality in conservation
tillage over time. For example, available organic carbon and total N were found to be
higher in long-term conservation tillage than in short-term (Omonode et al. 2006). This
could be why there was no difference in yield and soil quality (organic carbon) in the
BP and CT treatments in this study. However, the increase in soil organic carbon with
the winter cover crop in both tillage treatments could be due to the faster decomposition
of root biomass in BP and shoot biomass decomposition in CT, where the cover crop
was incorporated. As the present study is based on two years only, further research
could explain the long-term affect of cover crop on soil organic carbon under
conventional and conservation tillage practices.
3.5 Summary and conclusions
The findings show that in irrigated areas, cotton can be planted after cotton in
permanent raised beds without reducing yield or biomass production compared to the
conventional tillage system. Thus, cotton cultivation does not require intensive soil
tillage, and reducing tillage can minimize the negative effects associated with intensive
soil tillage in irrigated drylands.
The similar cotton yields at different N levels under both tillage methods in
this study indicate that during the transition period, the necessary N level for irrigated
cotton does not differ between conventional and conservation tillage methods. The
cotton yield response to increased N application from N-125 to N-250 decreased in both

Impact of tillage and nitrogen on cotton in a cotton/cover-crop/cotton system
48
study years, and also the linear increase in cotton yield up to 200 kg mineral N and
beyond this N level the relative increment decreased. Thus it is not worth investing in
250 kg N instead of 150 kg N ha-1 during the transition period from CT to BP under
such soil and climatic conditions. However, higher leaf area and biomass production,
lower negative N balance (loss), higher N recovery efficiency but lower physiological N
use efficiency together with lower number of open bolls during first picking is observed
with high-N (N-250) application in BP than in CT. This shows the possibility to further
yield benefits from the permanent raised beds with high-N application by advancing
cotton seeding a few days compared to the present planting time with CT practices.
The introduction of a winter cover crop in cotton mono-cropping systems can
increase the efficiency of applied N and reduce the NO3-N concentration in the
groundwater. It also seems to improve soil organic carbon.
Thus, if cotton mono-cropping is to be maintained, its cultivation on
permanent raised beds combined with a winter cover crop and N applications rates of
~150 kg N ha-1 could be a suitable option for sustainable cotton production in the salt-
affected irrigated drylands of Uzbekistan.

Growth, yield and water productivity of irrigated cotton, wheat and maize
49
4 THE IMPACT OF NITROGEN AMENDMENTS ON GROWTH AND
WATER PRODUCTIVITY OF IRRIGATED COTTON, WINTER
WHEAT AND MAIZE UNDER CONSERVATION AND
CONVENTIONAL AGRICULTURE
4.1 Introduction
Irrigated agriculture makes a substantial contribution to world food security by
providing 40% of the global agriculture production from just 20% of the total cultivated
land. The demand for irrigation water is expected to grow significantly in the near
future. For example, the FAO (2002) predicted that in order to meet the food demands
of the growing population in developing countries, their irrigated area needs to be
expanded from the 202 million ha in 1999 to 242 million ha by 2030. Irrigation water is
particularly important in semi-arid climate conditions, where potential
evapotranspiration always exceeds precipitation. Over 80% of Central Asia is arid and
sustaining the agricultural production system is most important for food security,
employment, livelihoods and environmental protection in the irrigated drylands of this
region.
Cotton, wheat and maize are the major commercial and food crops grown in
the five Central Asian counties (FAOSTAT 2010), often as mono-cultures on large
areas using conventional agriculture practices. Intensive soil tillage, poorly managed
flood irrigation and excessive use of chemical inputs are the typical for the conventional
land use practices. These practices not only increasing production costs, but also
reducing soil fertility, increasing soil salinity and threatening the sustainability of crop
production systems in the irrigated drylands of Uzbekistan, Central Asia. Yields of the
major crops in Central Asia, Uzbekistan, are reportedly one third of the yields elsewhere
with the application of only half the amount of irrigation water has been reported by
Vlek et al. (2001). Also, the previous findings confirmed that nitrogen (N) use
efficiency in such conventional production systems is rather low, i.e., 33% (Kienzler
2010).
Conservation agriculture (CA) practices that imply reduced tillage, proper crop
rotation, and retention of optimal level of crop residues have been adopted by farmers
on more than 100 million ha world wide as of 2008 (Derpsch and Friedrich 2009).

Growth, yield and water productivity of irrigated cotton, wheat and maize
50
Conservation agriculture is predominantly practiced in North and South America, but
increasingly also in Australia, South Africa, and in semi-arid areas of the world
(Holland 2004). Among the various CA practices, minimum tillage is considered as the
predominant practice worldwide (Yau et al. 2010). Minimum tillage technologies
effectively minimize soil disturbance, control evaporation from soils, minimize soil
erosion losses, enhance soil carbon sequestration, and reduce energy needs and thus
lowers production costs (Lal et al. 2007). Crop residue is a renewable source of soil
organic matter. It improves the physical, chemical and biological properties of soil
(Ding et al. 2002), reduces evaporation loss of water and increases the water retention
capacity of soils (Gant et al. 1992).
The use of permanently raised bed planting (BP) is gaining importance, but the
technology is still rarely applied in Central Asia. Previous studies have shown that BP
with residue retention can have an advantage over zero tillage and CT (e.g., Limon-
Ortega et al. 2000; Sayre and Hobbes 2004; Tursunov 2009; section 3.3.3). The benefits
are attributed to better irrigation management (Sayre and Hobbes 2004; Hassen et al.
2005), plant establishment (Khalequei et al. 2008; Gursoy et al. 2010), and it also
increases the ability to use inter-bed cultivation for weed control (Govaerts et al. 2005).
Crop production on permanent beds is 9% more energy efficient than zero tillage, 12%
more efficient than annually fresh made beds and 19% more efficient than conventional
practices (Rautaray 2005). It has been further estimated that the costs of cultivating with
BP in Central Asia can be reduced by one third (Gupta et al. 2009). Permanent bed
combined with proper rotation and residue retention in maize and wheat produced
similar grain and aboveground biomass compared to zero tillage, with advanced
weeding and fertilizer application practices (Govaerts et al. 2005). Besides these
advantages, permanent beds have been shown to increase grain yield and water use
efficiency in wheat (Sayre and Hobbes 2004; Hassen et al. 2005; Wang et al. 2004;
Gupta et al. 2009) and maize (Harris and Krishna 1989; McFarland et al. 1991; Hassen
et al. 2005).
Conservation agriculture is equally important in both rainfed and irrigated
agriculture to conserve moisture or save irrigation water (Erenstein et al. 2008).
Increasing crop water productivity is a challenge for sustainable production in irrigated
agriculture. In Central Asia, water productivity in irrigated agriculture has been

Growth, yield and water productivity of irrigated cotton, wheat and maize
51
drastically decreasing since decades (Abdullaev and Molden 2004). The average water
productivity of the cotton-growing area in the Syr Darya basin of Central Asia is about
0.37 kg m-3, which is much lower than the world average of 0.60 kg m-3 (Abdullaev and
Molden 2004). Several studies showed the potential of permanently raised beds to
increase crop water productivity in irrigated agriculture (Sayre and Hobbes 2004;
Hassan et al. 2005; Akbar et al. 2007).
Conservation tillage technology is especially effective when combined with a
surface mulch of crop residues (Lal et al. 2007). For example, reduced tillage with crop
residue retention offers great potential to increase water availability to the crop (Unser
et al. 1991; Fischer et al. 2002; Wang et al. 2010) increase soil organic carbon (Lal et al.
2007 Sainju et al. 2009) and nutrient availability (Verhulst et al. 2010), and decrease
soil salinity (Egamberdiev 2007; Verhulst et al. 2010). However, delayed seedling
emergence and slower initial crop growth under conservation tillage with residue
retention has also been reported by Tursonov (2009) and Verhulst et al. (2011). Also,
the N response in conservation tillage under retained residues differs from the situation
where residues have been removed. Randall and Bandel (1991) concluded that in
conservation tillage with residue retention, fertilizer N rates at the onset need to be
increased by about 25% to counteract the adverse effect on yield from short-term N
immobilization. However, Torvert and Revert (1994) concluded that, in the long-run, N
applications can be reduced under CA practices due to an increase in N uptake
efficiencies caused by reduced soil traffic.
The advantages of conservation over conventional practices have been
repeatedly shown for rainfed conditions (Lopez-Bellido et al. 1996; Vita et al. 2007),
but there still is much skepticism about the practicability and efficiency of CA under
irrigation. This is particularly true in irrigated drylands of Central Asia, where also the
effects of N application, residue management, and crop rotation on crop performance,
production and water productivity of major crops such as cotton and wheat are still
poorly understood (Gupta et al. 2009). In the present study, growth, crop yield, and
water productivity of cotton, wheat and maize in rotation under CA crop management
systems were analysed, while considering reduced tillage, crop residues retention and
various levels of N fertilizer application.

Growth, yield and water productivity of irrigated cotton, wheat and maize
52
4.2 Materials and methods
4.2.1 Site description
In the beginning of 2008, a long-term experiment in a cotton/wheat/third crop rotation
system was implemented in the Khorezm region in western Uzbekistan (60°40'44''N,
41°32'12''E; 100 m a.s.l.). The experimental field of 3 ha had been mono-cropped with
cotton under heavily mechanized production conditions for more than 20 years. For
details see section 3.2.1.
Similar to the experimental field for cotton/cover-crop/cotton rotation (section
3.2.1) following salt leaching in February 2008 and field preparations that included deep
ploughing and laser-leveling in March 2008, cotton was sown as the transition crop1 in
May 2008 and harvested in October 2008. In this experimental field the impact of
tillage, N level, and residue level on the rotation of winter wheat (October 2008-June
2009) and maize (June-October, 2009) was studied. The experimental fields under
cotton/cover-crop/cotton rotation and cotton/wheat/maize rotation were adjacent to each
other; hence the soil and climatic conditions were similar (for details see sections 2.3
and 3.2.1).
4.2.2 Experimental design and treatments
A three-factorial, split-plot experiment with four blocks was implemented with tillage
treatments bed planting (BP) and conventional tillage (CT) as the main factor. These
were combined with two residue levels (residue retained: RR and residue harvested:
RH) and three N levels (no application, and less than and more than the recommended
dose) as the sub-plot factors. In the RR treatments, residues from the previous crop were
retained, whereas in the RH treatments all residues were removed.
The officially recommended N rate for cotton and wheat is 180 kg N ha-1
(MAWR 2000) and 150 kg N ha-1 for short-duration maize. Previous research had
shown that these rates, determined decades earlier, needed to be adjusted (e.g. Kienzler
2010). Therefore, in this experiment, three N fertilizer levels were applied in the
subplots, i.e., no application (N-0), less than recommended (125 kg N ha-1 for cotton
and 100 kg N ha-1 for wheat and maize), and more than recommended (250 kg N ha-1
for cotton and 200 kg N ha-1 for wheat and maize). The main and subplot treatments
were completely randomized (Figure 4.1). The size of the experimental subplots was
550 m2 (11 m x 50 m)
1 The first crop planted when changing from conventional to conservation agriculture practices

Growth, yield and water productivity of irrigated cotton, wheat and maize
53
11 m 6m Plot broder
50
m BP RH N-0 2
m
BP RR N-250
BP RR N-125
BP RH N-250
BP RR N-0
BP RH N-125
CT RH N-0
CT RH N-125
CT RR N-250
CT RH N-250
CT RR N-0
CT RR N-125 R
ep -
I
4m (Distance between replication)
CT RR N-125
CT RH N-125
CT RR N-250
CT RR N-0
CT RH N-0
CT RH N-250
BP RR N-125
BP RR N-250
BP RH N-0
BP RH N-250
BP RH N-125
BP RR N-0
Rep
- I
I
4m (Distance between replication)
BP RH N-125
BP RR N-125
BP RH N-0
BP RH N-250
BP RR N-0
BP RR N-250
CT RH N-250
CT RR N-0
CT RH N-0
CT RR N-125
CT RH N-125
CT RR N-250
Rep
- I
II
4m (Distance between replication)
50
m CT RR N-0
CT RH N-0
CT RH N-125
CT RR N-250
CT RH N-250
CT RR N-125
BP RH N-125
BP RR N-0
BP RR N-125
BP RH N-0
BP RR N-250
BP RH N-250
Rep
- I
V
11 m 6m Plot broder
Figure 4.1 Layout of the experimental plots. BP=bed planting, CT=conventional tillage, RR=residue retention, RH=residue harvest, N-0=no N application, N-125=less than recommended N, N-250=more than recommended N application. Shaded area represents the bed planting.
Cotton planting method and time and all other crop management practices in
cotton/ wheat/maize rotation were similar to those of the cotton in the cotton/cover-
crop/cotton rotation in 2008 (section 3.2.3, cotton); a brief description is given below to
make clear understanding of this chapter.
Before seeding cotton (Gossypium hirsutum L., cv. Khorezm 127) as a transition
crop fresh raised beds were prepared with 90-cm spacing between furrows in BP. Next,
cotton was seeded in the center of these beds in early May 2008 at the recommended
seed rate of 60 kg ha-1 for each of the tillage treatments (CT and BP). Harvest occurred
in October 2008. The average plant density was 45,000 plants ha-1. In CT, cotton seeds
were sown on flat land with the same spacing as in BP. Urea granules (a common N-
fertilizer in the region) were top dressed as band application during the budding (38
days after sowing, DAS) and flowering stages (52 DAS). A defoliant (9 kg ha-1
6 m plot border
6 m plot border

Growth, yield and water productivity of irrigated cotton, wheat and maize
54
magnesium chloride dissolved in 200 l water) was applied to induce boll opening, 12
days before the first cotton picking.
Table 4.1 Field activities in bed planting and conventional tillage treatments for cotton, wheat and maize grown in rotation.
Crop Bed planting Conventional tillage Time Residue management Salt leaching February,
2008
Deep ploughing and Laser leveling March Bed making Flat leveling April
Cotton Cotton sowing May 6 Wheat residues at 3 t ha-1 applied externally during field preparation in CT and after planting in BP on residue retained treatments
Furrow cultivation followed by band application of N fertilizer
Inter-row cultivation followed by band application of N fertilizer and furrow opened for irrigation
June
N application Inter-row cultivation followed by band application of N fertilizer and furrow opened for irrigation
July
Wheat Drilling of wheat seed on beds without cultivation
Two cultivations and broadcast seeded wheat on standing cotton after 2nd picking
October Chopping and spreading the cotton stalks on residue retained plots
Wheat harvesting Mid June Equal distribution of wheat residue on residue retained plots
Maize Maize sowing on bed without cultivation
Maize sowing after three cultivations and rough leveling
June 28, 2009
Phosphorus and potassium fertilizers were drilled at planting
Phosphorus and potassium fertilizers were broadcasted at field preparation
N application N application June N application Inter-row cultivation
and N application July
Since crop residues from the previous crop were absent at the very onset of this
long-term experiment, wheat stover was imported at a rate of 3 t ha-1 and equally
distributed over the residue retention (RR) plots. During cotton season 29% in BP and
64% in CT of the applied wheat residues were decomposed. The cotton stalks from the
previous year in these RR treatments were chopped and spread during the preceding

Growth, yield and water productivity of irrigated cotton, wheat and maize
55
winter. In the RH treatments, all cotton stalks were cut at ground level and removed
(Table 4.1).
The beds were permanently maintained after the cotton crop. Winter wheat
(Triticum aestivum L., cv. Krasnodar) was seeded at the recommended seed rate of 200
kg ha-1 on 10 October 2008 just after the 2nd cotton picking and harvested on 16 June
2009. In BP, wheat was seeded in rows at a distance of 22.5 cm (4 rows on each 90-cm
bed) with double disk seed openers. In CT, seeds were broadcasted manually into
standing cotton after a single cultivation followed by a further cultivation to cover the
seeds as is commonly practiced by local farmers. Average plant density was 400 plants
m-2 in both tillage methods. N-fertilizer was broadcasted as urea granules in two equal
splits at 172 DAS (F6 stage) and 190 DAS (F8). After the wheat harvest, stover was
uniformly spread over the RR plots but removed from the RH plots.
After the winter wheat harvest, hybrid maize (Zea mays L., cv. Maldoshki)
was sown as a summer crop at a seed rate of 40 kg ha-1 with 45 cm x 45 cm seed
spacing on 28 June 2009, and harvested as grain on September 2009. The average plant
density was 50,000 plants ha-1. The seeder was equipped with a double disk seed opener
for the BP treatments. In CT, maize was sown after three cultivations followed by rough
leveling, whereas under BP, soil was not tilled aside from the drilling of seed and N
fertilizer. In both tillage methods, urea (46% N) was top dressed as a band application at
32 and 42 DAS.
Phosphorus (P) and potash (K) at 160 and 70 kg ha-1 for wheat and maize and
140 and 100 kg ha-1 for cotton, respectively, were applied as basal applications during
sowing. The P fertilizer was applied as single super phosphate (10% P2O5) in the N-0
treatments, whilst ammonium phosphate (AOP) (11% N or 46% P2O5) was applied in
all other N treatments. A basic dressing of muriate of potash (60% K2O) was applied in
all plots.
4.2.3 Measurements and data collection
Irrigation water
All three crops were irrigated when needed, which was indicated by first leaf roll.
Irrigation water was applied seven times during wheat and five times during cotton and
maize cultivation (Table 4.2). During the cotton season, both BP and CT treatments

Growth, yield and water productivity of irrigated cotton, wheat and maize
56
received equal amounts of irrigation water, as both systems were furrow-irrigated.
Based on the irrigation needs, wheat and maize in BP received, respectively, 11 and
23% less water than under CT (Table 4.2). Irrigation water was measured using a
standard trapezoidal Cipolletti weir combined with a DL/N 70 diver, which measured
the water flow through the weir based on pressure in one-minute intervals. To measure
the amount of water applied, two weirs (with divers installed 40 cm in front of the weir
crest) were installed. Each plot was irrigated separately, and the irrigation time during
each irrigation event was recorded independently. Height of water above crest width
was measured 4-5 times manually during each irrigation event. The pressure measured
by the diver was transformed to height above crest (m) to estimate the discharge (m3 s-1)
according to Kraatz and Mahajan (1975) (equation 4.1)
2
3
HL1.86Q (4.1)
where, Q=discharge (m3 s-1), L=crest width (m), H=height of water above crest width (m)
Water productivity for wheat and maize was calculated as the ratio of grain
yield (in kg at 12% moisture) over total water input (in m3). Raw cotton yield was used
for the estimates of water productivity in cotton.

Growth, yield and water productivity of irrigated cotton, wheat and maize
57
Table 4.2 Amount of irrigation water applied (m3 ha-1) during cotton, wheat and maize growing seasons.
Cotton Wheat Maize Application time (DAS)
Amount applied for BP and CT (m3 ha-1)
Application time (DAS)
Amount applied (m3 ha-1)
Application time (DAS)
Amount applied (m3 ha-1)
BP CT BP CT
54 537 1 697 803 1 1555 2360 69 556 150 750 750 18 1181 1433 84 661 173 699 806 33 1213 1499 101 1350 190 582 670 43 1218 1427 115 1303 208 704 812 70 1118 1427 - - 222 689 794 - - - - - 236 649 748 - - - Total 4454 - 4770 5383 - 6285 8146
BP=bed planting, CT=conventional, DAS=days after sowing
Soil moisture
Before each irrigation event, soil was sampled at 0-10, 10-20, 20-30, 30-60, and 60-90
cm depths with a tube auger at six fixed points in each subplot for determining soil
moisture content. In BP, soils were sampled both from the bed and furrow sections to
obtain an average moisture level for the beds. To determine the gravimetric soil
moisture content, soil samples were weight before and after drying in an oven at 105 °C
for 24 h. The soil moisture content was calculated according to Gardner et al. (2001)
(equation 4.2):
Dry weight
Dry weight-Wet weightd)(content moisture cgravimetri Soil (4.2)
The soil gravimetric moisture content (θd) was converted to volumetric
moisture percent (%) by multiplying the gravimetric moisture content with the bulk
density of the respective soil layers.
Leaf area and biomass
Leaf area and total aboveground biomass were recorded every 15 days for wheat and
maize, but for cotton according to growth stages (i.e., 2-4 leaf, budding, flowering, boll
formation and maturity). Wheat plants were sampled from a 0.25 m2 area. For cotton
and maize, five representative plants were sampled each time. Biomass was separated

Growth, yield and water productivity of irrigated cotton, wheat and maize
58
into green leaves, senescence leaves, stem and floral parts and oven dried at 70 °C till
constant weight. The leaf area of fresh leaves was measured with a leaf area meter (Li-
Cor, LI-3100) in cm2 and converted to leaf area index (LAI, m2 m-2), i.e., leaf area per
unit land area. The wheat leaf area was measured from a subsample of 25 g green fresh
leaves. Total leaf area of the sample area was calculated on the basis of total dry weight
of the green leaves. For cotton and maize, the whole green leaf material was used for
measuring leaf area.
Yield and yield components
To measure cotton yield, a 15 m x 4 m area was delineated in each subplot, which
covered the four central rows of each plot. The delineated area was harvested manually
during four picks as is common practice in the region. The raw cotton yield was
adjusted to 6% moisture level; the moisture level was determined with subsamples taken
at each harvest after oven drying at 70 °C for 16 h. The cotton population density was
determined by counting the number of plants in the harvest area on each plot. Boll
density (bolls per plant), branches per plant and percentage of open bolls were
determined prior to defoliation from 40 randomly selected plants (10 plants each row) in
the harvest area. Next, 40 bolls were picked randomly at each picking and oven-dried to
calculate average boll weight. The ginning percentage was calculated by separating the
lint and seed from 200 g oven-dried raw cotton and weighed separately for each picking
(equation 3.2).
Wheat was harvested from three areas in each plot, each covering 1.8 m2 (2
beds with 1 m length). The ears were threshed and weighed. Subsamples of 150 g each
of straw and grain were oven dried at 70 °C for 36 h to determine moisture content. To
determine number of grains per spike and spike weight, 50 spikes were taken randomly
from each plot, oven dried and weighed after which the grains were separated from the
spikes, weighed and counted for each plot.
To measure maize yield and its yield components, three subplots of 4 m2 each
in each plot were harvested. Six cobs from each subplot were randomly selected to
record the number of grains, cob weight, and 1000-grain weight. Ears were separated
from stover, shelled, and the grain was weighed after 2-3 days of sun drying; then a
subsample of 200 g was taken to determine moisture content. Stover was separated into

Growth, yield and water productivity of irrigated cotton, wheat and maize
59
tassel, leaf and stem, and each fraction was weighed separately fresh on-site; a
subsample of each was taken and oven dried to determine the moisture content. Grain
yields of wheat and maize were converted to 12% moisture content. The harvest index
for each crop was calculated as a fraction of seed/raw cotton yield over total
aboveground dry matter yield (equation 3.1).
4.2.4 Statistical analysis
Crop parameters, i.e., yield, yield component and water productivity for cotton, wheat
and maize, were statistically analyzed as a split-plot factorial design with four
replications. As no residue effect was observed for cotton growth and yield (data not
shown), only the data from the residue-harvested treatments were used, for the statistical
analysis of this crop. Crop growth and soil moisture content over time were analyzed
using repeated measures. Treatment effects were compared through the analysis of
variance using GenStat Discovery Edition 3. Main and interaction effects were
compared using Fisher’s protected LSD (least significant difference; P=0.05) unless
stated otherwise. To examine associations with significant yield variation, correlation
analyses were made based on treatment means. SigmaPlot version 11.0 was used for the
graphical presentation.
4.3 Results
4.3.1 Crop growth and development
The leaf area development peaked at boll formation stage in cotton (102 DAS; 1.95 to
3.3 m2 m-2) (Figure 4.2), during heading in wheat (200 DAS; 0.95 to 7.8 m2 m-2) (Figure
4.3) and during silking in maize (51 DAS; 0.95 to 2.2 m2 m-2) (Figure 4.5). Nitrogen
applications increased (p<0.001) LAI and aboveground biomass (AGB) production in
both wheat and maize (Figures 4.3 and 4.5), while in cotton, an effect of N application
in both tillage methods was observed only after flowering (i.e., after irrigation).

Growth, yield and water productivity of irrigated cotton, wheat and maize
60
Days after sowing30 50 70 90 110 130
Lea
f ar
ea in
dex
(m2 m
-2)
0.0
0.5
1.0
1.5
2.0
2.5
3.0
3.5
4.0
BP N0 BP N125 BP N250
2-4 leaf
FL
BF
BU
M
(A)
LSD(0.05)
CT N0 CT N125 CT N250
Days after sowing
30 50 70 90 110 130
Abov
egro
und b
iom
ass
(kg h
a-1 )
0
3000
6000
9000
12000
15000
2-4 leaf FL
BF
BU
M
(B)P level
Tillage nsNitrogen (N) <0.001Tillage x N nsTime x N <0.001Time x Tillage ns
LSD(0.05)
Figure 4.2 Leaf area index development (A) and aboveground biomass
accumulation (B) in cotton as affected by tillage method (BP=bed planting, CT=conventional tillage) and three N applications level (0, 125 and 250 kg ha-1). P level similar for A and B. P values are derived from an analysis of variance; ns=non significant. LSD is between time and nitrogen. BU=budding, FL=flowering, BF=boll formation, M=maturity. Bars represent standard error.
Irrespective of N level, LAI and AGB production in cotton was higher
(p>0.05) under CT up to flowering than in BP (Figures 4.2A and 4.2B). However, after
flowering, LAI and AGB production in BP was higher (p>0.05) than under CT.
Nitrogen applications significantly increased LAI and AGB production only after
flowering (75 DAS), resulting in 45% higher LAI and 38% higher AGB compared to N-
0 at boll formation and maturity stages. There were no differences (p>0.05) in AGB and
LAI between the N-125 and N-250 treatments.
Irrespective of time and N level, LAI and AGB production in wheat were
consistently greater (p<0.003) under BP than in CT (Figures 4.3A and 4.3B). A
significant three-way interaction effects (p=0.01), i.e., tillage by N by time was
observed for LAI. The LAI under BP during flowering (200 DAS) was higher by 85%
in N-0, 77% in N-100 and 20% in N-200 (Figure 4.3A) than in CT at the respective N
levels. Similarly, AGB production under BP was higher by 41-69% in N-0, 10-20% in
N-100, and 3-6% in N-200 during the different growth stages than in CT at the
respective N levels (Figure 4.3B).

Growth, yield and water productivity of irrigated cotton, wheat and maize
61
Days after sowing
160 170 180 190 200 210 220 230
Leaf
are
a in
dex
(m
2 m
-2)
0
2
4
6
8
10
BP N0 BP N100 BP N200
Tillage (T) 0.003Nitrogen (N) <0.001T x N nsTime x T x N 0.01
P levelLSD(0.05)
(A)CT N0 CT N100 CT N200
Days after sowing
160 170 180 190 200 210 220 230 240
Ab
oveg
rou
nd
bio
mas
s (k
g h
a-1 )
0
5000
10000
15000
20000
25000
Tillage (T) 0.003Nitrogen (N) <0.001T x N nsTime x N <0.001Time x T 0.01
P levelLSD(0.05)
Time x N Time x T(B)
Figure 4.3 Leaf area index development (A) and aboveground biomass
accumulation (B) in wheat as affected by tillage method (BP=bed planting, CT=conventional tillage) and N applications level (0, 100 and 200 kg ha-1). P values are derived from an analysis of variance; ns=non significant. LSD is between (A) time, tillage and N and (B) time by N and time by tillage. Bars represent standard error.
Days after sowing
160 170 180 190 200 210 220 230
Leaf
are
a in
dex
(m
2 m
-2)
0
2
4
6
8
10
Residue (R) 0.01Nitrogen (N) <0.001R x N nsTime x N <0.001
P level(A)
LSD(0.05)
Time x N Residue
N0 RH N200 RHN0 RR N200 RR
Days after sowing
160 170 180 190 200 210 220 230 240
Ab
oveg
rou
nd
bio
mas
s (k
g h
a-1 )
0
5000
10000
15000
20000
25000
Residue (R) <0.001Nitrogen (N) <0.001R x N <0.001Time x N <0.001TIme x R x N <0.001
P level LSD(0.05)
(B)
Figure 4.4 Leaf area index development (A) and aboveground biomass
accumulation (B) in wheat as affected by N application level (0, 100 and 200 kg ha-1) and residue management (RH=residue harvested, RR=residue retained). P values are derived from an analysis of variance; ns=non significant. LSD is between time, residue and N (A) and time by N and time by tillage (B). Bars represent standard error.
Averaged over time and N level, the RR treatment showed greater (p<0.05)
LAI and AGB than the RH (Figures 4.4A and 4.4B). The increment was higher with N-
0 compared to N-200. With N-0, RR increased (p<0.05) the LAI by 53-143% during the
growing season compared to RH, while with N-200, increment of LAI due to residues
was only 10-12%. Similarly, with N-0, RR increased (p<0.05) the AGB by 50-70%

Growth, yield and water productivity of irrigated cotton, wheat and maize
62
compared to RH. However, RR did not affect AGB production with N-200 application
(Figure 4.4B).
For maize, LAI and AGB production were significantly (p<0.001) affected by
main and interaction effects of tillage, N and time (Figures 4.5A and 4.5B). In the BP
plots, N-200 produced significantly higher LAI, AGB, and root biomass (Figure 4.7)
throughout the growing season followed by N-100, while no effect of tillage was
observed in N-0. In CT, the temporal curves of LAI, AGB, and root biomass were
greater (p<0.05) with N application than with N-0. When doubling the N level from N-
100 to N-200, LAI and AGB production in CT were only affected at maturity, where N-
200 had a 32% higher AGB production than under N-100 (Figures 4.5A and 4.5B). In
BP, RR increased (p<0.05) LAI by 19-21% after tasseling (40 DAS) compared to RH.
Similarly, AGB production in BP with RR increased (p<0.05) by 28% during maturity
compared to RH, while the increment was non-significant during the other growing
stages (Figures 4.6A and 4.6B).
Days after sowing
20 30 40 50 60 70 80 90 100
Leaf
are
a in
dex
(m
2 m
-2)
0.0
0.5
1.0
1.5
2.0
2.5
3.0
BP N0 BP N100 BP N 200
LSD(0.05)
(A)CT N0 CT N100 CT N200
Days after sowing
20 30 40 50 60 70 80 90 100
Ab
oveg
rou
nd
bio
mas
s (k
g h
a-1 )
0
3000
6000
9000
12000
15000
18000
Time <0.001Tillage <0.001Nitrogen (N) <0.001Time x Tillage x N <0.001
P level
LSD(0.05)
(B)
Figure 4.5 Leaf area index development (A) and aboveground biomass
accumulation (B) in maize, as affected by tillage method (BP=bed planting, CT=conventional) and N application level (0, 100 and 200 kg ha-1). P values derived from an analysis of variance. P level similar for A and B; LSD is the difference between time, tillage and N. Bars represent standard error.

Growth, yield and water productivity of irrigated cotton, wheat and maize
63
Days after sowing
20 30 40 50 60 70 80 90 100
Leaf
are
a in
dex
(m
2 m
-2)
0.0
0.5
1.0
1.5
2.0
2.5
3.0 BP RH BP RR CT RH
LSD(0.05)
(A)
Days after sowing
20 30 40 50 60 70 80 90 100
Ab
oveg
rou
nd
bio
mas
s (k
g h
a-1 )
0
3000
6000
9000
12000
15000
18000
Time <0.001Treatment 0.01Time x Treatment 0.009
P level
LSD(0.05)
(B)
Figure 4.6 Leaf area index development (A) and aboveground biomass
accumulation (B) in maize, as affected by tillage method (BP=bed planting, CT=conventional tillage) and residue management (RH=residue harvested, RR=residue retained). P level similar for A and B. P values derived from an analysis of variance. LSD is the difference between time and treatment. Bars represent standard error.
Days after sowing
20 30 40 50 60 70 80 90 100
Roo
t b
iom
ass
(g p
lan
t-1 )
0
2
4
6
8
10
12
14 BP N0 BP N100 BP N200
CT N0 CT N100 CT N200
*
*
*
* *
LSD0.05
Figure 4.7 Maize root growth (g plant-1) over time as affected by tillage (BP=bed planting and CT=conventional tillage) and N application level (0, 100 and 200 kg ha-1); *=significance at p=0.05. LSD is difference between treatments and time.
4.3.2 Crop yield, yield components, and water productivity
Cotton
Cotton yield and biomass
Across tillage and N level, average raw cotton yield was 3923 kg ha-1. Tillage method
had no effect (p=0.81) on raw cotton yield or AGB production, while the effect of N

Growth, yield and water productivity of irrigated cotton, wheat and maize
64
was highly significant. Similar results were observed in the cotton/cover-crop/cotton
rotation (Table 3.2). Irrespective of tillage, N-125 showed a 26% higher (p<0.05) raw
cotton yield and 31% higher AGB than N-0. Raw cotton yield and AGB did not increase
significantly with increased N level from N-125 to N-250. No significant tillage by N
interaction effects was observed for yield, AGB, and yield components of cotton (Table
4.3). The harvest index (HI) of cotton was not affected (p>0.05) by tillage method, but
was decreased (p<0.05) by N application.
Tillage method did not affect (p>0.05) the ginning percent of cotton, but this
was decreased (p<0.05) with increased N level. Irrespective of tillage method, with N-
125 to N-250 the ginning percent was decreased (p<0.05) by 6 and 3.8% compared to
N-0 and N-125, respectively, while no difference was observed between N-0 and N-125
(Table 4.3).
Table 4.3 Main effect of tillage and N level on raw cotton yield, aboveground biomass (AGB), harvest index (HI) and water productivity (WP) in cotton.
Treatment Raw cotton yield (kg ha-1)
AGB (kg ha-1)
HI (%)
Ginning percent (%)
WP (kg m-3)
Tillage BP 3929 10723 37.4 39.2 0.88 CT 3916 10221 38.4 39.9 0.88 LSD (0.05) 697 2235 2.07 2.6 0.16 N levels 0 3299 8342 39.8 40.6 0.74 125 4168 11088 37.7 39.8 0.94 250 4301 11986 36.2 38.2 0.97 LSD (0.05) 257 1198.4 2.8 1.5 0.05
ANOVA Tillage (T) ns ns ns ns ns Nitrogen (N) *** *** * * *** T x N ns ns ns ns ns Mean 3923 10472 37.9 39.5 0.88 BP=bed planting, CT=conventional tillage. Significance level: *P≤0.05; **P≤0.01; *** p≤0.001; ns=non significant
Average water productivity (WP) of raw cotton was 0.88 kg m-3 irrespective of
the tillage method. Furthermore, averaged over the tillage method, N-125 increased
(p<0.05) WP, which was 27% higher than with N-0. Water productivity was not
affected by N-125 to N-250 (Table 4.3). A similar trend was observed for raw cotton
yield.

Growth, yield and water productivity of irrigated cotton, wheat and maize
65
Yield components
No differences were detected between tillage methods for boll density and boll weight
during 1st picking, while boll weight at the 3rd pick under BP was higher (p<0.05) by 6%
than in CT (Table 3.3). Application of N-125 increased (p<0.05) the boll density by
20%, and boll weight at the 1st and 3rd picking by 6 and 9%, respectively, compared to
N-0. With N-125 to N-250, boll weight during 3rd picking was increased only by 4%.
The higher boll weight during 3rd cotton pick in BP with N application remained
important for the cotton yield for BP. Where, the share of the 3rd pick in total cotton
harvest in BP was 31% with N-250 and 28% with N-125, but in CT it was 20% in both
N-125 and N-250.
Averaged over tillage and N level, 35% cotton bolls were opened just prior to
defoliation. Percent opened boll was affected by tillage (p=0.02) and N (p=0.01), but an
interaction effect of tillage by N was not observed (Table 3.3). Irrespective of N level,
CT showed 52% more (p<0.05) opened bolls prior to defoliation than BP. Disregarding
tillage method, percent opened bolls was decreased with N application, i.e., by 33%
with N-125 compared to N-0. With N-125 to N-250, percent opened bolls decreased
(p>0.05) by 10%.
Wheat
Grain yield and biomass
Tillage had a significant effect (p=0.03) on grain yield of wheat across the three N and
two residue levels (Table 4.4). The BP system had a 12% higher grain yield than CT.
The main effects of N on grain yield were highly significant. With N fertilizer, up to
11.2 t ha-1 winter wheat yield could be achieved (in BP; Figure 4.8). Wheat yield was
increased (p<0.05) 3-fold with application of N-100 compared to N-0. However, when
doubling the N level from N-100 to N-200 kg ha-1, grain yield was increased (p<0.05)
by only 18%. Irrespective of tillage method and N level, the RR treatment showed a 5%
higher (p=0.05) grain yield than the RH.

Growth, yield and water productivity of irrigated cotton, wheat and maize
66
Table 4.4 Main effects of tillage, N level, and residue on grain yield (12% moisture), aboveground biomass (AGB), harvest index (HI), water productivity (WP), spike density (spikes m-2), grains spike-1, 1000 kernel weight (TKW), and days to maturity of winter wheat.
Treatment
Grain yield (kg ha-1)
AGB (kg ha-1)
HI (%)
WP (kg m-3)
Spike density (m-2)
Grains spike -1
TKW (g)
Maturity (days)
Tillage (T) BP 8269 15488 46.8 1.73 685 30.7 34.4 228 CT 7345 13517 47.6 1.36 620 30.1 34.9 228 LSD (0.05) 800.9 1540 - 0.2 44 - - 0.25 Residue (R) RH 7615 14128 47.3 1.5 646 29.6 34.3 228 RR 7998 14877 47.1 1.6 659 31.3 35.1 228 LSD (0.05) 384 775 - 0.07 - 1.14 0.76 0.27 Nitrogen (N) 0 3367 6516 45.8 0.67 389 25.7 33.9 226 100 9204 16948 48 1.83 718 33.1 34.9 228 200 10849 20043 47.8 2.15 851 32.5 35.2 230 LSD (0.05) 471 949 1.5 0.09 45.3 1.39 0.94 0.3
ANOVA Tillage * * ns ** * ns ns * Residue * + ns * ns ** * ** N level *** *** ** *** *** *** * *** N x T ns ns ns ns ns ns ns ns N x R + + ns + ns * ns ns T x R ns ns ns ns ns ns * ns N x T x R ns + ns ns ns ns ns ns Mean 7807 14503 47 1.5 685 30.7 34.4 228 BP=bed planting, CT=conventional tillage, RH=residue harvest, RR=residue retained. Significance level: +P≤0.1 (weakly significant); *P≤0.05; **P≤0.01; *** p≤0.001; ns=non significant
There were no significant three-way interaction effects, i.e., tillage by N by
residue, but weak two-way interaction effects (p=0.08) were observed between N and
residue levels for grain yield (Table 4.4). Although there was no significant interaction
effects between tillage and N levels, grain yield under BP was higher for all N levels,
i.e., by 32% in N-0, 14% in N-100 and 6% in N-200 than in CT at the respective N level
(Figure 4.8A). BP with RR in the N-0 treatment increased (p<0.05) grain yield by 48%
over RH, while RR did not affect yield significantly in the N applied treatments (Figure
4.8B).

Growth, yield and water productivity of irrigated cotton, wheat and maize
67
Total AGB at harvest was highly significant with N level (p=<0.001),
significant with tillage method (p=0.03) and weakly significant with residue level
(p=0.058) (Table 4.4). Irrespective of N and residue levels, total AGB under BP was
14% higher (p<0.05) than in CT. Averaged over tillage and residue level, AGB
increased (p<0.05) 2.6-fold with N-100 compared to N-0. However, when doubling the
N level from N-100 to N-200 kg ha-1 AGB was increased (p<0.05) by 18%. A similar
trend as for yield was observed for AGB production of wheat in all treatments. The
AGB of wheat was strongly correlated (r=0.99, P<0.001) to grain yield (Table 4.5). The
HI was affected (p<0.05) by N level but not by tillage method and residue level (Table
4.4).
Crop growth duration in wheat was increased (p<0.05) by N application, but
tillage and residue did not extend the growing period (Table 4.4). In the N-0 treatment,
wheat matured 2 and 4 days earlier compared to N-100 and N-200, respectively.
N level (kg ha-1)
N0 N100 N200
Gra
in y
ield
(kg
ha
-1)
0
2000
4000
6000
8000
10000
12000 BP CT(A)
LSD(0.05)
N level (kg ha-1)
N0 N100 N2000
2000
4000
6000
8000
10000
12000 RH RR(B)
LSD(0.05)
Figure 4.8 Interaction effects between (A) tillage method and N level and (B) N and
residue level under BP on grain yield of winter wheat. BP=bed planting, CT=conventional tillage, RH=residue harvested, and RR=residue retained. LSD is the difference between (A) tillage and N and (B) N and residue level. Bars represent standard error.

Growth, yield and water productivity of irrigated cotton, wheat and maize
68
N level (kg ha-1)
N0 N100 N200
Wa
ter
pro
duc
tivity
(kg
m-3
)
0.0
0.5
1.0
1.5
2.0
2.5
3.0BP CT
LSD(0.05)
(A)
N level (kg ha-1)
N0 N100 N2000.0
0.5
1.0
1.5
2.0
2.5
3.0RH RR
LSD(0.05)
(B)
Figure 4.9 Interaction effects between (A) tillage and N level and (B) N and residue
level under BP on water productivity (kg m-3) in wheat. BP=bed planting, CT=conventional tillage, RH=residue harvested and RR=residue retained. LSD is the difference between (A) tillage and N and (B) N and residue level. Bars represent standard error.
Water productivity
The average water productivity (WP) in wheat was 1.5 kg grain per m-3 water
application. Main effects of tillage and N level were highly significant for water
productivity (WP) of wheat. There was a weak interaction effects (p=0.05) between
residue and N level, and a significant effect of residue main effects (p=0.04) (Table 4.4).
Averaged over N and residue levels, WP under BP was 27% higher (p<0.05) than in
CT. The higher WP is shown by the lower water application (Table 4.2) and increased
grain yield. Water saving in BP was 12% compared to CT. Water productivity increased
significantly with increased N level (Table 4.4), and was 3 times higher (p<0.05) with
N-100 compared to N-0. However, when doubling the N level from N-100 to N-200 kg
ha-1, WP increased (p<0.05) by only 17%. A similar trend to that of yield was observed
for WP of wheat in all treatments.
Similar to grain yield, a weak interaction effects (p=0.06) was observed
between N and residue levels for WP (Table 4.4). Water productivity under BP was
higher (p<0.05) for all N levels, i.e., by 50% for N-0, 29% for N-100 and 19% for N-
200 than in CT at the respective N level (Figure 4.9A). In BP, RR with the N-0
treatment showed a 47% higher (p<0.05) WP than with RH, but no effect of N
application was observed (Figure 4.9B).

Growth, yield and water productivity of irrigated cotton, wheat and maize
69
Table 4.5 Correlation coefficients (r) among grain yield, aboveground biomass (AGB), harvest index (HI), spike density (m-2), 1000 kernel weight (TKW), grains spike-1, and maturity days of wheat.
a P≤0.05; b P≤0.01; ns=non significant
Yield components
Spike density (spikes m-2) was significantly (p<0.05) affected by tillage method and N
level (Table 4.4). Averaged over N and residue levels, spike density under BP was 10%
higher than in CT, and was strongly correlated to grain yield (r=0.99, P<0.001) (Table
4.5). Spike density increased (p=<0.001) with increasing N level and was higher by
85% with N-100 than with N-0. However, with N-100 to N-200, spike density increased
(p<0.05) by 18%. In BP, RR showed a 6% higher (p>0.05) spike density than RH.
The grains per spike were significantly affected by main and interaction effect
of N and residue levels, but effect of tillage was non-significant (Table 4.4). Averaged
over tillage method, RR in the N-0 plots showed 15% more (p<0.05) grains per spike
than under RH, but RR showed no increase in grains per spike in the N applied
treatments in both tillage systems. Grains per spike were strongly correlated with grain
yield (r=0.92, P<0.001) (Table 4.5).
Thousand kernel weight (TKW) of wheat was not affected (p>0.05) by tillage
method (Table 4.4). Irrespective of tillage method, TKW increased by 1.1 and 1.3 g
with N-100 and N-200, respectively, compared to N-0, but there was no difference
between N-100 and N-200. A significant interaction effect was observed between tillage
and residue level. RR increased the TKW by 1.7 g in CT compared to RH, but had no
effect on BP.
AGB Yield HI Spike density TKW
Grains spike-1
AGB 1 Yield 0.99b 1
HI 0.68a 0.70a 1 Spike density 0.99b 0.99b 0.67a 1 TKW 0.54ns 0.55ns 0.62a 0.49ns 1
Grains spike-1 0.92b 0.92b 0.70a 0.89b 0.62b 1
Maturity days 0.95b 0.95b 0.65a 0.91b 0.55ns 0.81b

Growth, yield and water productivity of irrigated cotton, wheat and maize
70
Maize
Grain yield and biomass
The main effects of tillage, N and residue levels were significant for maize grain yield,
AGB and water productivity (Table 4.6). Averaged over N and residue level, grain yield
under BP was 41% higher (p<0.05) than in CT. Irrespective of tillage and residue, grain
yield increased (p<0.05) by two-fold with N-100 compared to N-0. However, when
doubling the N level from N-100 to N-200 grain yield increased (p<0.05) by 23%.
Irrespective of tillage and N levels, RR showed a 10% higher (p<0.05) grain yield than
RH (Table 4.6).
There was a significant interaction effect (p=<.001) between tillage and N
level, such that N response was greater in BP than under CT (Table 4.6). In BP with N
fertilizer, up to 8.1 t ha-1 maize grain yield could be achieved (Figure 4.10). Grain yield
in BP was 2.5 times higher (p<0.05) with N-100 than with N-0. However, with the
increase from N-100 to N-200, grain yield in BP increased by 32%. In CT, grain yield
was 2 times higher (p<0.05) with N-100 than with N-0, while it increased (p>0.05) by
only 10% when going from N-100 to N-200. BP, however, showed a 34 and 61% higher
(p<0.05) grain yield with N-100 and N-200, respectively, compared to CT at respective
N level (Figure 4.10A). Tillage had no effect on grain yield at N-0.
A significant tillage by residue interaction effects was observed for maize
grain yield (Table 4.6). In BP, irrespective of N level, RR increased (p<0.05) grain yield
by 15% compared to RH. However, RR under CT had no effect (p>0.05) on grain yield
(Figure 4.10B). Similarly, RR in BP increased grain yield by 54% (2966 kg ha-1 vs.
1929 kg ha-1) with N-0, by 12% (6517 kg ha-1 vs. 5686 kg ha-1) with N-100, and by 6%
(8334 kg ha-1 vs. 7797 kg ha-1) with N-200 compared to RH.
Averaged over time and N level, the RR treatment showed greater (p<0.05)
LAI and AGB than the RH (Figures 4.4A and 4.4B). The increment was higher with N-
0 compared to N-200. With N-0, RR increased (p<0.05) the LAI by 53-143% during the
growing season compared to RH, while with N-200, increment of LAI due to residues
was only 10-12%. Similarly, with N-0, RR increased (p<0.05) the AGB by 50-70%
compared to RH. However, RR did not affect AGB production with N-200 application
(Figure 4.4B).

Growth, yield and water productivity of irrigated cotton, wheat and maize
71
Table 4.6 Main effects of tillage, N level, and residue on grain yield, aboveground biomass (AGB), harvest index (HI), water productivity (WP), yield components and maturity days of hybrid maize.
Treatment
Grain yield
(kg ha-
1)
AGB (kg ha-1)
HI (%)
WP (kg m-
3)
Ear density
m-2
Grains ear -1
TKW (g)
Tasseling (days)
Maturity (days)
Tillage BP 5520 9551 50.5 0.88 6.2 375 200.4 38 86 CT 3910 6510 52.4 0.48 5.0 343 206.7 40 88 LSD(0.05) 922 1636 2.3 0.12 1.0 20.7 3.7 0.65 0.9 Residue RH 4490 7598 51.8 0.64 5.5 340 201.3 39 87 RR 4940 8464 51.2 0.72 5.7 378 205.7 38 87 LSD(0.05) 317 548 1.0 0.04 0.3 12.4 7.2 0.7 0.6 N levels
0 2331 4161 49.7 0.33 4.9 264 180.7 42 88 100 5295 8893 52.5 0.76 5.6 392 206.3 37 86 200 6519 11038 52.3 0.95 6.2 421 223.6 37 87 LSD(0.05) 388 671 1.2 0.05 0.4 15.2 8.9 0.8 0.7
ANOVA Tillage (T) * ** + ** * * * ** ** Residue(R) ** ** ns ** ns *** ns * ns N level (N) *** *** *** *** *** *** *** *** ** N x T *** *** ns *** ** *** * *** ** LSD(0.05) 855 1513 2.3 0.11 0.98 22.7 10.5 1.1 1.06 N x R ns ns ns ns ns ** + + ns LSD(0.05) 549.6 949 1.8 0.08 21.5 12.5 1.27 T x R * * ns * ns + ns * ns LSD(0.05) 848. 1508 2.1 0.11 0.98 19.9 7.6 0.85 N x T x R ns ns ns ns ns ns ns ns ns Mean 4715 8031 51.5 0.68 5.6 359 203.5 8.3 87 BP=bed planting, CT=conventional tillage, RH=residue harvested, RR=residue retained, TKW=thousand grain weight. Significance level: +P≤0.1 (weakly significant); *P≤0.05; **P≤0.01; *** p≤0.001; ns=non significant
The main and interaction effect of tillage and N level on AGB production were
significant (p=<0.001) (Table 4.6). Similar to the grain yield, AGB production in BP
with N-100 increased (p<0.05) by 40% (10373 vs. 7412 kg ha-1) and 67% (13810 vs.
8267 kg ha-1) with N-200 compared to CT at respective N level (Figure 4.5B).
Irrespective of N level, RR in BP increased (p<0.05) AGB production by 17% (10317
vs. 8785 kg ha-1) compared to RR, while RR under CT had no effect on AGB
production at maturity (Figure 4.6B). AGB production strongly correlated with grain
yield (r=0.99, P<0.001) (Table 4.8). The HI was increased (p<0.05) with N application

Growth, yield and water productivity of irrigated cotton, wheat and maize
72
compared to the N-0. Tillage method and residue level did not, however, affect the HI
(Table 4.6).
Nitrogen level and tillage method had a significant effect on growth duration
of maize (Table 4.6). Tasseling was delayed by 3-9 days under BP and by 2-3 days in
CT with N-0 as compared to N-100 and N-200. Similarly, maturity was delayed by 2-3
days with N-0 compared to N-100 and N-200 under BP, but the crop matured at same
time in CT for all N levels. Crop residue did not affect growth duration of maize in any
of the tillage treatments (Table 4.6).
N level (kg ha-1)
N0 N100 N200
Gra
in y
ield
(kg
ha
-1)
0
2000
4000
6000
8000
10000BP CT(A)
LSD(0.05)
Tillage
BP CT0
2000
4000
6000
8000
10000RH RR
(B)
LSD(0.05)
Figure 4.10 Interaction effects between (A) tillage and nitrogen level and (B) tillage and residue level on maize grain yield (kg ha-1). BP=bed planting, CT=conventional tillage, RH=residue harvested and RR=residue retained. LSD is interaction between (A) tillage and N and (B) N and residue level. Bars represent standard error.

Growth, yield and water productivity of irrigated cotton, wheat and maize
73
N level (kg ha-1)
N0 N100 N200
Wa
ter
pro
du
ctiv
ity (
kg m
-3)
0.0
0.2
0.4
0.6
0.8
1.0
1.2
1.4BP CT(A)
LSD(0.05)
Tillage
BP CT0.0
0.2
0.4
0.6
0.8
1.0
1.2
1.4
RH RR(B)
LSD(0.05)
Figure 4.11 Interaction effects between (A) tillage and nitrogen level, and (B) tillage
and residue level, on water productivity (kg m-3) in maize. BP=bed planting, CT=conventional tillage, RH=residue harvested, RR=residue retained. LSD is difference between (A) tillage and N and (B) N and residue level Bars represent standard error.
Water productivity
There were a highly significant interaction effects between tillage and N, and a
significant interaction between tillage and residue level on WP in maize (Table 4.6).
Averaged over N and residue level, WP in BP was almost twice as high (85% higher) as
under CT (Table 4.6). The highest WP (1.3 kg grain m-3 water applied) was observed in
BP with N-200. Water productivity in BP was higher (p<0.05) for all N levels, i.e., by
44% with N-0, 73% with N-100 and 110% with N-200 than under CT at the respective
N level (Figure 4.11A). In BP, it was 2.6 times higher (p<0.05) with N-100 than with N-
0, and by 32% (p<0.05) with N-100 compared to N-200. Similarly, under CT, WP
increased by 107% with N-100 compared to N-0, while no difference was observed
between N-100 and N-200 (Figure 4.11A). Irrespective of the N level, WP in BP with
RR was 15% higher than with RH. In contrast, RR had no effect on WP under CT
(Figure 4.11B).
Yield components
There was a significant tillage by N interaction effects for yield components (ear
density, grains ear-1, and TKW) of maize (Table 4.6). In BP, ear density was higher
(p<0.05) by 21% with N-100 than N-0, and for N-100 to N-200 ear density (m-2)
increased (p>0.05) by 15%. In contrast, under CT, N application had no effect on ear

Growth, yield and water productivity of irrigated cotton, wheat and maize
74
density. A strong correlation (r=0.9; P=0.01) was observed between ear density and
grain yield (Table 4.8). Number of grains per ear and TKW were higher (p<0.05) with
increased N level in both tillage systems. Grains per ear increased (p<0.05) by 76%
under BP and by 33% in CT with N-100 compared to N-0, and doubling the N level
from N-100 to N-200 led to an increase (p<0.05) of 8% in BP and 7% in CT. In BP,
grains per ear was higher (p<0.05) by 14% with N-100 and 16% with N-200 than under
CT at respective N level (Table 4.7). TKW was not affected by tillage method in N
application treatments, while it was greater (p<0.05) by 13% under CT than in BP in N-
0 treatments. TKW increased (p<0.05) by 21% in BP and 8% under CT with N-100
compared to N-0, and doubling the N level from N-100 to N-200 led to an increase
(p<0.05) of 9% in both BP and CT.
Irrespective of tillage method, grain density per ear in the RR treatment was
31% higher (p<0.05) with N-0 and 8% higher (p<0.05) with N-100 than in the RH
treatment, but were not affected by RR under high N application (N-200). Averaged
over tillage method, RR in the N-0 plots increased the TKW by 8% compared to RR,
but had no effect in the N applied treatments. Grains per ear and TKW were strongly
correlated with grain yield (r=0.96 and 0.83; P=0.01) (Table 4.8).
Table 4.7 Interaction effects between N and tillage on yield components and maturity days of hybrid maize.
Tillage N level (kg ha-1)
Ear density (m-2)
Grains ear -1
TKW (g)
Tasseling (days)
Maturity (days)
Bed planting 0 5.1 254 170 42 87 100 6.2 418 206.4 35 85 200 7.1 453 224.7 36 85
Conventional 0 4.7 274 191.4 42 88 100 4.9 366 206.1 39 88 200 5.2 390 222.4 39 88
LSD (0.05) 0.98 22.7 10.5 1.1 1.1 TKW=Thousand grain weight

Growth, yield and water productivity of irrigated cotton, wheat and maize
75
Table 4.8 Correlation coefficient (r) among yield, aboveground biomass (AGB), harvest index (HI), ear density, grains ear-1, and 1000 kernel weight (TKW) of maize. AGB Yield HI Ear density Grains ear-1 AGB 1 Yield 0.99b 1
HI 0.31ns 0.38ns 1 Ear density 0.92b 0.90b 0.06ns 1
Grains ear-1 0.95b 0.96b 0.37ns 0.79b 1
TKW 0.80b 0.83b 0.60ns 0.56ns 0.88b a p=0.05; b p=0.01; ns=non significant
4.3.3 Soil moisture
During the wheat season, no significant differences in soil moisture content were
detected among tillage treatments in all stages, but BP showed a consistently higher soil
moisture percent in the top 90 cm soil profile (average moisture 32%) over the wheat
growing period than under CT (average moisture 30%; an increase of 6%). Similarly,
soil moisture content in the top 90 cm soil in BP was higher by 10% during tillering and
by 5% during heading and grain-filling stage than under CT (Figure 4.12).
During the maize growing period, soil moisture before irrigation was
consistently higher in BP with RR followed by BP with RH and CT (Figure 4.12). On
average, BP with RR showed the highest soil moisture content (average moisture
33.9%) followed by BP with RH (average moisture 32.3%) and CT (average moisture
30.6%) in the top 90 cm soil profile. There was a significant (p=0.01) three-way
interaction effects for soil moisture, i.e., time, treatment and soil depth. Soil moisture
before irrigation in the top 10 cm soil depth in BP with RR had a 3-6% higher moisture
content than in BP with RH and a 13-19% higher moisture content than under CT.

Growth, yield and water productivity of irrigated cotton, wheat and maize
76
Volumetric moisture content (%)
0 10 20 30 40 50
Soil
dept
h (c
m)
0
15
30
45
60
75
90
BPCT
A
Tillering
Volumetric moisture content (%)
0 10 20 30 40 500
15
30
45
60
75
90
BPCT
B
Heading
0 10 20 30 40 50
Soil
dept
h (c
m)
0
15
30
45
60
75
90
BPCT
C
Grain-filling
0 10 20 30 40 500
15
30
45
60
75
90
BP RRBP RHCT
*
*
*
*
*
LSD 0.05
D
Tasseling
0 10 20 30 40 50
Soi
l de
pth
(cm
)
0
15
30
45
60
75
90
BP RRBP RHCT
*
*
*
nsns
LSD 0.05
E
Soft dough stage
0 10 20 30 40 500
15
30
45
60
75
90
BP RRBP RHCT
*
nsns
*
*
LSD 0.05
F
Maturity
Figure 4.12 Soil moisture before irrigation in different soil depths under two tillage methods and residue levels in wheat season (A, B, and C) and in maize season (D, E and F). BP RR=bed planting with residue retention, BP RH=bed planting with residue harvest, CT=conventional tillage with residue harvest. *-significance at p=0.05; ns= non significant.

Growth, yield and water productivity of irrigated cotton, wheat and maize
77
4.4 Discussion
4.4.1 Effect of tillage
Permanent raised bed (BP) planting has the potential to increase crop yield and water
productivity in many row-grown crops (Sayre and Hobbes 2004). In this study, during
the transition year from conventional to conservation agriculture (CA), cotton yield was
not affected by tillage method. In contrast, after one season of CA practices, BP
increased the grain yield of wheat by 12% and that of maize by 41% compared to CT
when averaged over the residue and N levels. This suggests that cotton, wheat and
maize cultivation in irrigated drylands may not need intensive soil tillage.
The higher grain yield of wheat and maize in BP than under CT in such short
period of CA practice could have various reasons. Drilling of wheat seed in line under
BP may have provided better soil-seed contact than broadcast seeding under CT,
resulting in a more vigorous crop growth as indicated by higher LAI and AGB
production (Figure 4.3), which again led to high grain yield. These findings confirm
previous results from Gursoy et al. (2010) reporting higher winter wheat yields with
drill-seeding than with conventional broadcast seeding in Turkey or from Mann et al.
(2008) in Punjab, Pakistan.
The increased grain yield of wheat under BP was mostly due to the high
number of effective spikes m-2, even though the same seed rate was used for both tillage
systems. As the wheat was sown in rows on the shoulders and not on the top of the bed,
it was closer to the furrow, where the soil was moister. The constantly higher soil
moisture content in BP may also have increased the nutrient availability and
consequently the number of tiller-bearing plants per m2 (143 m-2 in BP and 130 m-2 in
CT, 10% higher). The combination of positive effects may explain the yield advantage
of BP at the different N levels compared to CT. Likewise, Khalequei et al. (2008)
observed a higher spike density in BP spring wheat compared to a CT in Bangladesh.
In maize, the absence of grain yield differences between BP and CT with N-0,
averaged over residue level, indicates that bed-planting of maize in such a short time
after the conversion to no-tillage operations is superior to CT only with N application.
The increased maize grain yields in BP with N applications is attributed to various
factors such as an earlier seedling emergence and stand establishment, faster growth
rate, earlier tasseling, and longer grain filling periods in BP than under CT (Figure 4.5

Growth, yield and water productivity of irrigated cotton, wheat and maize
78
and Table 4.7). All these factors could have contributed to the increased ear density and
grains ear-1 in BP, which have previously been identified as prime yield determining
components (Fischer et al. 2002). These authors also reported a better performance of
maize in conservation tillage due to earlier seedling emergence and faster growth in the
first few weeks compared to CT. Better early growth resulted in increased aboveground
(Figure 4.5) and root biomass accumulation (Figure 4.7) and led to increased cob
density and grains per cob (Table 4.8). That higher biomass production before silking
increases the maize grain yield mainly by increased ear density was also reported by
Nakaseko et al. (1978). The maize in BP was furrow irrigated, which could have led to a
better microclimate, higher soil moisture, and better nutrient availability than in the
conventionally tilled, flood-irrigated system. Similar findings are reported by Sayre and
Hobbs (2004) and Govaerts et al. (2005).
Like the findings of Hobbs et al. (1998), Sayre and Hobbs (2004), and
Govaerts et al. (2005), who reported permanent raised beds a better option for maize
and wheat cultivation under rainfed conditions, the present results showed that there is a
potential to grow these crops on permanent raised beds under irrigated conditions in
dryland regions as well. The results, however, do not support the findings of Ishaq et al.
(2001), who reported that wheat following cotton requires a plough-based method of
seed bed preparation to alleviate surface compaction and to improve soil tilth in sandy
clay loam soil in Pakistan. Also for maize, Cambel et al. (1984) reported higher grain
yield under conventional tillage than under conservation tillage in irrigated system for
three years.
The absence of differences in cotton growth, yield and biomass production
between BP and CT supports previous evidence that good field preparation helps to
avoid the usually expected temporary reduction in yields when changing from
conventional to conservation practices (Hicks et al. 1989; Boquet et al. 2004; Tursonov
2009; section 3.3.3). The low percentage of boll opening made a chemical defoliation of
BP cotton necessary. It was caused by the slow initial crop growth rate in BP, where
emergence was delayed by 3-5 days compared to CT. The low rate of boll opening in
BP before defoliation did, however, not affect the yield of raw cotton. It can be assumed
that this initial disadvantage was counterbalanced by an increased crop growth rate in
BP after irrigation and fertilizer application, which enhanced boll maturation that in turn

Growth, yield and water productivity of irrigated cotton, wheat and maize
79
resulted in the higher boll weight during the third picking in BP than under CT. Where,
in BP with N application, cotton yield from the third picking shared one-third of the
total cotton harvest. Tursunov (2009) observed in Khorezm that cotton planted on beds
had slow initial growth, but compared to CT, the growth was stabilized after irrigation
at the flowering stage. Bed-planted cotton delayed maturity compared to CT as
indicated by the low percentage of open bolls prior to defoliation as also reported by
Schwab et al. (2002).
The differences in water productivity in cotton under BP and CT were
insignificant since an equal amount of water was applied in both tillage methods (Table
4.2), and owing to the non-significant differences in cotton yield (Table 4.3). However,
the higher water productivity in BP than under CT for the subsequent crops wheat and
maize suggests that a reduction in irrigation water use can be already expected without
compromising yields after 1-2 growing seasons. Hassan et al. (2005) also reported 36
and 32% irrigation water saving and 50 and 65% higher water productivity in wheat and
maize, respectively, when comparing BP to CT in a semi-arid region of Pakistan.
Reduced amounts of irrigation water have been reported by Sayre and Hobbs (2004) as
caused by the compaction in the furrow bottoms from machine traffic which in turn
increased lateral water infiltration and forward water advance. It is very likely that the
same occurred in the present experiment. Visual observations indicated greater soil
cracking under CT during the maize season, which could also be the reason for higher
irrigation amounts needed under CT especially during the maize season.
Increased crop water productivity in BP can be important for the irrigated
dryland in Central Asia, particularly in Uzbekistan where crop water productivity is low
compared to irrigated agriculture in other regions. As the experimental plots were
sufficiently large (600 m-2 each), similar water saving can be expected in the
farmers`fields.
4.4.2 Effect of nitrogen
Increased cotton yield with N application under both tillage methods (Table 4.3)
illustrates that cotton in BP can be grown with the same level of N application as under
CT during the transition period from conventional to CA without compromising yield.
This finding contrast with the findings of Bronson et al. (2001) who stated that 19 to 38

Growth, yield and water productivity of irrigated cotton, wheat and maize
80
kg additional fertilizer N would be needed for conservation tillage to produce similar
lint yield to CT during the initial three years. Greater cotton yields with N application in
this study not only increased boll density, as indicated by previous research (Wiatrak et
al. 2005) but also significantly increased boll weight compared to N-0 (Table 3.3).
Whereas previous research indicates that cotton yield components such as boll density
and boll weight have an impact on yield (Pettigrew and Jones 2001), the impact of N is
mainly through the boll density and boll weight in irrigated cotton (Wright et al. 1998;
Wiatrak et al. 2005). Similar to the cotton/cover-crop/cotton rotation system, with
increased N from N-125 to N-250 cotton yield and biomass did not further increase
(section 3.4.3 effect of nitrogen). Hence, it is not worth investing in 250 kg N ha-1
instead of 125 kg ha-1 under such high initial residual mineral N conditions.
The decrease in ginning percentage with increased N levels was caused by an
increase in seed weight under high N application. This implies that N not only increases
lint weights but even more so seed weights, which confirms earlier findings (Elbehar
1991; Reiter et al. 2008; Kienzler 2010).
The increase in grain yield of wheat with N application in CT and BP was
mainly caused by the increased spike density (r=0.99, P<.001) and grains spike-1
(r=0.92, P<.001) (Table 4.5). This is supported by the higher spike density, grains per
spike, TKW and growth duration of wheat in this study with N application than with N-
0. It has been widely reported that an adequate N supply promotes tiller production and
survival (Davidson and Chevalier 1992), delays leaf senescence, sustains leaf
photosynthesis during the grain-filling period, and extends the grain filling period
(Fredrick and Camberato 1995). The greater grain yield of wheat in BP with all N level
than in CT suggests a greater response of applied N in BP. The higher soil moisture
availability has let to a vigorous plant growth and hence has increased the response of
applied N under BP.
The increased maize grain yield with N application in both BP and CT was
caused by an increase crop growth rate and biomass accumulation which in turn
increased the number of grains ear-1 (r=0.96, P<.001), and TKW (r=0.83, p<.001)
compared to N-0 (Table 4.8). Similar to wheat, the response of applied N in maize was
high in BP than under CT. As explained in section 4.4.1, the earlier crop germination
and faster initial growth in BP with N application resulting in higher LAI, AGB and root

Growth, yield and water productivity of irrigated cotton, wheat and maize
81
biomass may have increased the N depend of crop and has fulfilled by N application.
The lack of differences in yield and biomass production of maize between N-100 and N-
200 under CT indicates low N use efficiency when N amendments are increased beyond
N-100. This is supported by the findings of Ahmad et al. (2009), who reported
significantly increased grain yields of maize under CT of up to 120 kg N ha-1; additional
N application beyond this failed to increase the yield.
All these indicate that under both low (N-100) and high (N-200) N application,
BP can produce higher grain yields and biomass of winter wheat and maize grown in
rotation than under CT in irrigated dry lands. Although wheat and maize grain yield
increased with N application, the relative gain is much less with increasing N
application from N-100 to N-200 (doubling the farmers’ investment) in both tillage
methods. Thus it may not be worthwhile for the farmers investing in 200 kg N ha-1
instead of 100 kg N ha-1 for irrigated winter wheat and maize under such soil and
climatic conditions.
The average yield of cotton wheat and maize under the recommended N
application in the region are 2.71, and 4.85, and 5.5 t ha-1, respectively (Statistical
Department of Khorezm Region 2009). Even with the application of a lower than
recommended N rate (i.e., 125 for cotton and 100 kg N ha-1 for wheat and maize), the
averaged yield of cotton, wheat and maize was nevertheless higher by 53, 90 and 14%,
respectively, than the average yield of those crops observed in this region. This could be
due to as explain in section 3.4.2 the impact of proper land leveling, which may have
helped for the improvement in growth and yield components of the crop due to the
better environment for the development of the plants on well-leveled fields. Tyagi
(1984) also reported a 50% higher grain yield in laser-leveled plots compared to
traditionally leveled plots
4.4.3 Effect of residues
Residue retention in BP had increased grain yield of wheat and maize with N-0
treatment compared to RH. This could be due to the higher amount of mineralizable N
in the top soil layer (Campbell et al. 1993), where residues were left as surface mulch.
This suggests that crop residues retained as mulch are the potential sources of N, which

Growth, yield and water productivity of irrigated cotton, wheat and maize
82
then can compensate for the 0-N level and can sustain the wheat and maize yields in this
cropping system. Similar finding was reported by Limon-Ortega et al. (2000) for a
maize-wheat system in Mexico. However, with N application wheat yield did not
increase, while it was increased in subsequent maize crop. This could be due to
immobilization of applied N in the surface-retained residue, where N fertilizer in wheat
was surface broadcast applied. On the other hand in maize season, fertilizer N was band
applied, hence avoided the contact of fertilizer on crop residues. All these indicate that
the positive effect of residue retention in permanent raised beds under
cotton/wheat/maize rotation system will increases over time. Thus, it is suggested to
retained crop residues in permanent raised beds in irrigated drylands.
4.5 Summary and conclusions
During the transition phase from conventional to conservation agriculture, tillage had no
effect on cotton growth, yield and biomass production. However, one or two seasons
after introducing CA practices, wheat and maize yields and water productivity were
already increased in BP compared to CT. This indicates irrigated cotton, wheat and
maize crops grown in permanent raised beds have potential to increase crop yield by
reducing cultivation cost and irrigation water demand. This is particularly important to
the farmers to increase their farm income and food security. Yields of cotton, wheat and
maize were increased with N application, while due to remaining residual N in the
intensively used field, cotton yield under both tillage methods responded only up to 125
kg N ha-1. Grain yields of wheat and maize were similar under BP and CT with N-0.
Response to N fertilization of wheat and maize was greater in BP than under CT. It can
therefore be concluded that winter wheat and short-duration maize cultivated on
permanent raised beds can produce higher grain yield and biomass than under CT under
low (N-100) as well as high (N-200) N application. Thus, permanent raised beds could
be the best-bet agronomic practice for cotton, wheat and maize grown in rotation in the
irrigated agriculture systems of Uzbekistan, Central Asia.
Residue retention in BP always had greater soil moisture and biomass
production, and subsequently increased the grain yield and water productivity of wheat
and maize in the N-0 compared to the RH treatments. In contrast, with N application,
residue retention in BP had no effect on growth and yield of wheat, but grain yield was

Growth, yield and water productivity of irrigated cotton, wheat and maize
83
increased in subsequent maize crop (15% higher with N-100 and 7% higher with N-
200). This indicates that in high-yielding environments the benefits of crop residue will
increase over time.
Thus, from the initial 2-3 years study on conservation agriculture practices, it
can be concluded that permanent raised beds with residue retention and proper N
management in cotton/wheat/maize rotation can be the best alternative for the current
conventional crop production system in Uzbekistan.

Nitrogen use efficiency under conservation vs. conventional agriculture practices
84
5 NITROGEN UPTAKE, USE EFFICIENCY AND BALANCE UNDER
CONSERVATION VS. CONVENTIONAL AGRICULTURE
PRACTICES IN A IRRIGATED COTTON/WHEAT/MAIZE SYSTEM
5.1 Introduction
Nitrogen (N) is the major fertilizer nutrient applied to enhance crop growth and yield.
The efficiency of applied N in the world crop production system is however less than
50% (Raun and Johnson 1999). The ability of crops to use the applied N depends on the
uptake and utilization efficiency. Nitrogen uptake can be increased through improved
cultivation practices, while the utilization efficiency is genetically predetermined (Hirel
et al. 2007). Furthermore, fertilizer use efficiency depends on fertilizer nutrient rate, soil
properties and climatic conditions and also on cropping systems and tillage methods
(Engelstad 1985; Etana et al. 1999; Habtegebrial et al. 2007). Higher fertilizer use
efficiency is always associated with low fertilizer rates; therefore cultivation practices
that promote nutrient efficiency can help to reduce the loss of applied fertilizers.
Cotton/wheat/summer-crop is the major crop rotation system in Uzbekistan
(Conrad et al. 2010). Cultivation of these crops under intensive tillage using heavy
inputs of water and N fertilizers is a common practice. Nitrogen management of cotton-
wheat systems under conventional crop production practices in Uzbekistan was shown
to be highly inefficient (Kienzler 2010), where the recovery of the applied N is not more
than 37-40% in an irrigated meadow soil and 21-31% in a light soil (Khadjiyev 1998;
Ibragimov 2007). High temperatures and intensive irrigation and tillage under
conventional practices enhance the mineralization of soil N (Vlek et al. 1981), which
leads to N losses through denitrification (Scheer et al. 2008) and leaching (Kienzler
2010).
Conservation agriculture (CA) practices, i.e., reduced tillage, residue
management and proper crop rotation, is gaining importance with respect to sustaining
the agriculture production systems in different parts of the world. These practices
effectively minimize soil disturbance, control soil evaporation, minimize soil erosion
losses, and enhance soil carbon sequestration (Lal et al. 2007). Among conservation
tillage practices, permanent raised bed planting (BP) is gaining importance in irrigated
systems, and has been introduced in row-spaced crops in Asia and arid western United

Nitrogen use efficiency under conservation vs. conventional agriculture practices
85
States (Sayre 2004). BP has numerous advantages, e.g., better irrigation management,
plant establishment, and opportunity for inter-bed cultivation for weed control. It gives
comparatively better yields through an efficient use of input resources, i.e., water,
fertilizer and herbicides, whilst production costs can be reduced compared to
conventional tillage (Limon-Ortega et al. 2000; Mehta and Bandyopadhyay 2004;
Govaerts et al. 2005). Furthermore, nitrogen use efficiency (NUE) in BP could be
improved by more than 10% because of improved N placement possibilities compared
to conventional systems (Fahong et al. 2004).
Besides the numerous benefits, frequently cited concerns regarding CA refer to
a decreased availability of plant-available N due to immobilization (Randall and Bandel
1991; Blevins and Frye 1993; Doran et al. 1998; Power and Peterson 1998). However,
proper management of N in CA has potential advantages regarding NUE as reported by
Reeves et al. (1993); Raun and Johnson (1999); Torbert et al. (2001). The initial lower
fertilizer use efficiency due to N immobilization under crop residue retention which is a
tenet of CA is counterbalanced by a conservation of soil and fertilizer N as soil organic
matter. Thus, fertilizer requirements may decrease over time under conservation tillage
(Karlen 1990).
Most of the existing research and field evaluations on CA practices have been
conducted under rainfed conditions, but many of the benefits are possible in irrigated
systems. Despite these apparent advantages, CA practices have mainly only been
introduced in a few research projects in the irrigated areas of Uzbekistan. The few
experiments previously conducted in the region have shown the potential of CA in
cotton-wheat systems, which compared different tillage methods (Tursunov 2009) and
N fertilizer effect under conventional systems (Kienzler 2010; Djumaniyazova et al.
2010), but these studies did not address the N fertilization effects and NUE under CA
practices. Fertilizer N recommendations developed for tilled systems may be inadequate
for optimum crop production under conservation tillage (McConkey et al. 2002).
In general, adoption of CA practices is considered if farmers see a gain in net
benefits compared to conventional practices (Uri 1999). Among the crop production
factors, fertilizer in general contributed 20-50% to crop productivity (Ahmad et al.
1996). To promote the adoption of CA practices, proper N management strategies and
technologies, which can increase the efficiency of the applied N, need to be identified.

Nitrogen use efficiency under conservation vs. conventional agriculture practices
86
The main objective of this study was to assess the effect of different levels of N
application on N uptake, use efficiency, and N balance in a cotton/wheat/maize rotation
system under conservation and conventional agriculture practices in irrigated drylands
of Uzbekistan.
5.2 Methodology
5.2.1 Experimental site
The study was carried out on a research site of the ZEF/UZESCO project in the
Khorezm region, Uzbekistan during 2008 and 2009 in a cotton/wheat/maize rotation
system. For details in experimental site see section 3.2.1.
5.2.2 Experimental design and treatments
A three-factor, split-plot experiment with four replications was implemented, with bed
planting (BP) and conventional tillage (CT) as the main factor. These were combined
with two residue levels (residue retained: RR and residue harvested: RH) and three N
levels (no application (0-N), and less than (Low-N) and more than (High-N) the
recommended dose) as the sub-plot factors. For treatment details see section 4.2.2.
5.2.3 Measurements and analyses
Total plant N uptake
Plant samples were collected to measure biomass accumulation and N concentration in
respective plants parts in every 15 days for wheat and maize, and for cotton according to
growth stages (i.e., 2-4 leaf, budding, flowering, boll formation and maturity). Wheat
plants were sampled from a 0.25 m2 area. For cotton and maize, five representative
plants were sampled each time. Biomass was separated into green leaves, senescence
leaves, stem and floral parts and oven dried at 70 °C till constant weight. The dried plant
samples were ground to pass a 1-mm sieve and analyzed for N concentration. The N
concentration of each plant component was determined as % N content by Kjeldahl
method (Bremner and Mulvaney 1982). The total plant N concentration was determined
by the average N concentration of each plant part. For the calculation of N uptake, the N
content (%) was multiplied with the respective dry weight of the plant component
(equation 3.3), and summed to determine the total N uptake.

Nitrogen use efficiency under conservation vs. conventional agriculture practices
87
Soil sampling and analysis
Initial soil samples were collected before the start of the experiment and analyzed for
total N and organic carbon (OC), available phosphorus (P2O5), exchangeable potash
(K2O) and mineral N (NO3-N and NH4-N) to estimate the chemical properties of the
experimental site. Soil samples were furthermore collected from all plots after each crop
harvest. Samples were collected from five different depths, i.e., 0-10, 10-20, 20-30, 30-
60 and 60-90 cm, at three different points in each plot and mixed thoroughly to obtain a
composite sample. The samples were dried in a solar drier until completely dry, ground
to pass a 1-mm sieve, and mixed thoroughly. Total and mineral N, available P2O5,
exchangeable K2O and total C were analyzed using standard procedures in Uzbekistan
as described by Kienzler (2010). Total N was analyzed by the Kjeldahl method
(Bremner and Mulvaney 1982), i.e., wet oxidation of soil organic matter using sulfuric
acid. The NO3-N content (mg kg-1) was analyzed by calorimetrically with phenol
disulphonic acid according to modified methods of Granvald-Ljashu method from 1886
(Silber 1913; Haper 1924; Durynina and Egorov 1998), and NH4-N content (mg kg-1)
was analysed using the Nessler reagent (Yuen and Pollard 1952; Yuen and Pollard
1954; Durynina and Egorov 1998). Organic carbon (C) was determined according to
Tyurin (Cotton Research Institute 1977; Durynina and Egorov 1998), which is a
modified Walkley-Black method (Nelson and Sommers 1982). Available P2O5 (mg
kg-1) and exchangeable K2O (mg kg-1) were analyzed according to the method described
by Machigin-Protasov2, which can be compared to the Olsen methodology (Olsen and
Sommers 1982).
Nitrogen use efficiency
Nitrogen use efficiencies at crop harvest were calculated for each crop according the
formula given in section 3.2.8. Agronomic efficiency (AEN, grain yield per kg N
applied) was computed following Novoa and Loomis (1981) (equation 3.6),
physiological efficiency (PEN, grain yield per kg N uptake) was computed following
Isfan (1990) (equation 3.5), and apparent recovery efficiency (AREN, N uptake per kg
of N applied) were calculated following (Dilz, 1988) (equation 3.4).
2 Extraction of P and K compounds with 1%-solution ammonium carbonate, pH 9.0,flame photometer

Nitrogen use efficiency under conservation vs. conventional agriculture practices
88
Apparent N balance and system efficiency
The apparent N balance was estimated from total plant N uptake (cotton, wheat and
maize), initial residual mineral N in the top 90 cm soil profile, applied N, and NO3-N in
irrigation water. The cumulative N input and output were calculated for each treatment.
Nitrogen loss (via leaching and denitrification) and N supply from organic N and fallen
leaves from the previous crop were not considered in the N balance calculation. Nitrate
N supply by irrigation water was calculated from the total amount of irrigation water
applied during the three cropping seasons multiplied by the average NO3-N
concentration in irrigation water (1.2+0.14 mg l-1). For details on the amount of water
applied to each crop for bed planting and conventional tillage is presented in Table 4.2.
Measurement for NO3-N concentration in irrigation water is described in section 3.2.9.
Apparent N balance for cotton/wheat/maize systems was hence calculated according to
formula modified from Timsina et al. (2001) (equation 5.1).
harvest maizeat N mineral soilmaize))wheat(cotton
uptake Nplant ((totalOutput - )irrigation from N applied Namount
N mineral soil (initialInput )ha (kg balance N systemApparent -1
(5.1)
Similarly, to calculate the apparent N balance for the individual crop, i.e., cotton or
wheat or maize, input (mineral N before planting + amount N applied + N from
irrigation) - output (N uptake by the crop + soil mineral N at crop harvest) were
considered.
Nitrogen use efficiency of the cotton/wheat/maize system was calculated
according to Timsina et al. (2001) as: (equation 5.2)
100Xirrigation and fertilizer fromaddition Ndepth soil cm 90in N mineral Initial
soil cm 90 in topharvest at N mineralmaize)wheat(cotton uptake N Total
(%) efficiencyN System
(5.2)

Nitrogen use efficiency under conservation vs. conventional agriculture practices
89
5.2.4 Statistical analysis
Nitrogen uptake, use efficiencies and apparent N balance were statistically analyzed as a
split-plot factorial design with four replications. Major soil nutrients changes over time
under different treatments were analyzed using repeated measures. Treatment effects
were compared through the analysis of variance using GenStat Discovery Edition 3.
Main and interaction effects were compared using Fisher’s protected LSD (least
significant difference; P=0.05). Simple non-linear regression analysis was also carried
out for the grain yield response to N rates and N uptake. The curves were fitted using a
quadratic function using SigmaPlot version 11.0.
5.3 Results
5.3.1 Total plant N uptake and concentration
Cotton
The total aboveground plant N uptake before flowering (i.e., before irrigation and
fertilizer application) was higher (p<0.05) under CT than in BP (Table 3.5). This
increased N uptake coincided with the faster early growth and higher biomass
production during the early stage under CT (Figure 3.2). However, after flowering, no
significant difference was observed between tillage methods in N uptake. Nitrogen
application increased total N uptake only after flowering (i.e., after irrigation) compared
to N-0, while no difference was observed with increased N level from N-125 to N-250.
Wheat
Irrespective of N level, the total plant N uptake in wheat was higher in BP than under
CT at all growth stages, but a significant difference was observed only at heading and at
maturity (Table 5.1). Averaged over the N rates, the total N uptake at maturity was
higher (p=0.1) by 14% in BP (170 kg ha-1) than under CT (149 kg ha-1), which is
consistent with the 12% higher grain yield recorded for BP. Nitrogen applications
increased (p<0.001) the total plant N uptake compared to N-0 for the whole period,
being highest at 200 kg N ha-1 with both tillage methods. A significant tillage by N
interaction effects for total N uptake was observed at heading and grain-filling stages,
where BP with N-100 showed higher (p<0.05) N uptake by 61% at heading and by 51%

Nitrogen use efficiency under conservation vs. conventional agriculture practices
90
at grain-filling than CT (Figure 5.1). But the tillage had no significant effect on total N
uptake with N-0 and N-200.
Total plant N concentration in wheat was not affected (p>0.05) by tillage
method, while it increased significantly (p<0.05) with N application compared to N-0 at
all growth stages (Figure 5.2). Irrespective of tillage method, N-100 increased the plant
N concentration by 74% at heading, by 58% at grain-filling and by 35% at maturity
compared to N-0. However, with N-100 to N-200, total N concentration increased by
15% after heading (Figure 5.2). Although there was a significant tillage by N interaction
effect only at heading, with N-100, BP showed a higher total N concentration than CT;
it was higher by 20% at heading and by 14% at grain-filling and maturity. In contrast,
with N-200, CT had higher total plant N concentration than BP; it was higher by 17% at
heading and by 10% at grain-filling (Figure 5.2).
Maize
In maize, total plant N uptake during the growing season was significantly affected by
the main effects of tillage and N application rate and their interaction effects (Table
5.1). Irrespective of the N level, the total N uptake in BP was higher (p<0.05) than
under CT; it was higher by 2.3-fold at the vegetative, 47% at the reproductive, and 41%
at the maturity stage (Table 5.1). The total N uptake at maturity in BP is consistent with
the 42% higher grain yield recorded for BP.
Although total N uptake in maize increased with N application in both tillage
methods, the uptake was higher in BP than under CT at all growth stages (Figure 5.3).
During the vegetative stage, with N application BP had a more than two times higher
(125% higher) N uptake than CT. Similarly, with N-100, total N uptake in BP was
higher by 38% after the reproductive stage than under CT. This response was even
higher with the increased N level, i.e., with N-200. In contrast, tillage had no significant
effect on total N uptake with N-0.

Nitrogen use efficiency under conservation vs. conventional agriculture practices
91
Table 5.1 Main effects of tillage method and N fertilizer level (kg ha-1) on plant N uptake of wheat and maize at different growth stages.
Treatment
Wheat growth stage (DAS) Maize growth stage (DAS) Spike
initiation (167)†
Heading (199)
Grain-filling (215)
Maturity (240)
Vegetative (23)
Reproductive (51)
Maturity (93)
(kg ha-1) Tillage BP 36 118 155 170 4.3 47 130 CT 34 103 137 149 1.8 32 92 LSD 41 8 43 35 1.2 16 25.8 Nitrogen 0 13 26 35 53 1.7 15 51 100 42 123 169 178 3.4 41 117 200 51 183 233 247 4.1 63 165 LSD 14 16 38 30 0.87 4 16
ANOVA Tillage ns ** ns + ** * * N level *** *** *** *** *** *** *** N x T ns *** * ns ** *** *** LSD 31 19 48 42 1.2 12 26 Mean 35 110 146 159 3 39 111 BP=bed planting and CT=conventional tillage. Significance level: +P≤0.1; *P≤0.05; **P≤0.01; *** p≤0.001; ns=non significant. †Values in parenthesis represent the sampling time; DAS=days after sowing.
Irrespective of the N application, RR in BP increased total N uptake compared
to RH at all growth stages of maize, and the effect was stronger in the early growth
stages (Figure 5.4). Although there was no significant interaction (p>0.05) between N
and residue level, the values were comparable. The RR in the N-0 treatment increased
(p<0.05) total N uptake by more than two-fold at the vegetative (103% higher), and the
reproductive (123% higher) stages and by 64% at the maturity stages compared to RH.
However, RR had no significant effect in the N-applied treatments.
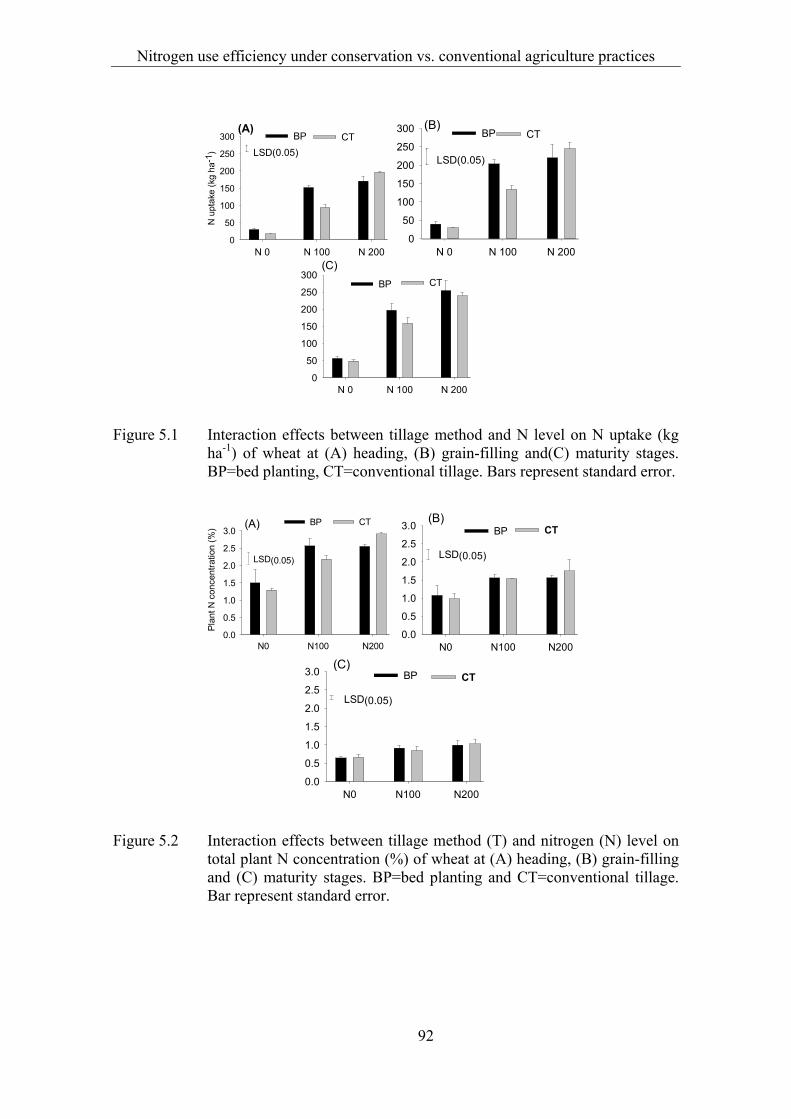
Nitrogen use efficiency under conservation vs. conventional agriculture practices
92
N 0 N 100 N 200
N u
ptak
e (k
g ha
-1)
0
50
100
150
200
250
300 BP CT(A)
LSD(0.05)
N 0 N 100 N 2000
50
100
150
200
250
300 (B)BP CT
LSD(0.05)
N 0 N 100 N 2000
50
100
150
200
250
300(C)
BP CT
Figure 5.1 Interaction effects between tillage method and N level on N uptake (kg ha-1) of wheat at (A) heading, (B) grain-filling and(C) maturity stages. BP=bed planting, CT=conventional tillage. Bars represent standard error.
N0 N100 N200
Pla
nt N
con
cent
ratio
n (%
)
0.0
0.5
1.0
1.5
2.0
2.5
3.0BP CT
LSD(0.05)
(A)
N0 N100 N2000.0
0.5
1.0
1.5
2.0
2.5
3.0 BP CT
LSD(0.05)
(B)
N0 N100 N2000.0
0.5
1.0
1.5
2.0
2.5
3.0 BP CT
LSD(0.05)
(C)
Figure 5.2 Interaction effects between tillage method (T) and nitrogen (N) level on total plant N concentration (%) of wheat at (A) heading, (B) grain-filling and (C) maturity stages. BP=bed planting and CT=conventional tillage. Bar represent standard error.

Nitrogen use efficiency under conservation vs. conventional agriculture practices
93
N 0 N 100 N 200
N u
ptak
e (k
g h
a-1
)
0.0
1.5
3.0
4.5
6.0
7.5 BP CT(A)
LSD(0.5)
N 0 N 100 N 2000
20
40
60
80
100 BP CT(B)
LSD(0.05)
N 0 N 100 N 2000
50
100
150
200
250BP CT(C)
LSD(0.05)
Figure 5.3 Interaction effects between tillage method (T) and N level on total N
uptake (kg ha-1) of maize at (A) vegetative, (B) reproductive and (C) maturity stages. BP=bed planting and CT=conventional tillage. Bars represent standard error.
N 0 N 100 N 200
N u
ptak
e (k
g ha
-1)
0.0
1.5
3.0
4.5
6.0
7.5RH RR(A)
N 0 N 100 N 2000
20
40
60
80
100RH RR
(B)
N 0 N 100 N 2000
50
100
150
200
250 RH RR(C)
Figure 5.4 Interaction effects between residue (R) and nitrogen (N) level on total N
uptake (kg ha-1) of bed planted maize at (A) vegetative, (B) reproductive and (C) maturity stage. RH=residue harvested and RR=residue retained. Bars represent standard error.

Nitrogen use efficiency under conservation vs. conventional agriculture practices
94
5.3.2 Nitrogen use efficiency
Cotton
Tillage method did not affect (p>0.05) N use efficiency (NUE) parameters (i.e., AEN,
AREN and PEN). The highest AEN (7 kg raw cotton per kg N applied) and AREN (68%)
were observed with N-125 in both tillage methods, but PEN was highest with N-250 (13
kg raw cotton per kg N uptake). However, AEN and AREN were significantly decreased
(p<0.05) with increased N level, where AEN decreased by 42% and AREN by 44% with
N-125 to N-250 (Table 3.6).
Wheat
Similar to the cotton crop, none of the NUE parameters were significantly (p>0.05)
affected by tillage method. Although the effect was non-significant, BP showed slightly
higher AEN and AREN values than CT (Table 5.2). The 12% higher AREN in BP than
under CT is consistent with the higher grain yields recorded for BP. The highest NUE
parameters were observed with N-100 in both tillage methods, i.e., AEN was 51 kg grain
per kg N applied, PEN was 43 kg grain per kg N uptake, and AREN was 128%. Which,
however were decreased significantly with increased N application rates from N-100 to
N-200. Averaged over tillage method, the AEN decreased by 55%, PEN by 17% and
AREN by 30% with increased N level from N-100 to N-200. Irrespective of tillage and
N level, RR increased (p<0.05) the AEN by 12% compared to RH.
Maize
In maize, the highest NUE parameters were observed with N-100 in both tillage
methods, i.e., AEN was 26 kg grain per kg N applied, PEN was 40 kg grain per kg N
uptake, and AREN of applied N was 67%. AEN and AREN were higher (p<0.05) in BP
than under CT, while PEN was not affected (p>0.05) by tillage method (Table 5.2).
Irrespective of N and residue level, AEN and AREN in BP were higher by 75 and 82%,
respectively, than with CT. With increased N level in maize all NUE parameters were
significantly lower, where AEN decreased by 41%, PEN by 30% and AREN by 17% with
N-200 compared to N-100.

Nitrogen use efficiency under conservation vs. conventional agriculture practices
95
Table 5.2 Main effect of tillage method, N level, and residue on agronomic efficiency (AEN), physiological efficiency (PEN) and apparent recovery efficiency (AREN) of N fertilizer applied in wheat and maize.
Treatment
Wheat Maize
AEN
(kg kg-1) PEN
(kg kg-1)AREN
(%) AEN
(kg kg-1)
PEN
(kg kg-
1)
AREN
(%)
Tillage BP 42.5 39.1 120 28 34.7 80 CT 41.9 40.7 107 16 36.6 44 LSD (0.05) 9.5 8.9 26.9 5.9 14.2 12 Nitrogen (kg ha-1) 100 51.4 43.1 128.1 26.1 40.4 66.6 200 33 36.7 98.8 18.4 30.9 56.7 LSD (0.05) 5.9 4.3 21.9 3.9 7.1 12.5 Residue RH 44.7 - - 21.3 33.8 61.1 RR 39.7 - - 23.2 37.5 62.2 LSD (0.05) 3.9 - - 3.9 7.1 12.5
ANOVA Tillage (T) ns ns ns ** ns ** Nitrogen (N) *** ** ** *** * + Residue (R) ** - - ns ns ns N x T ns ns ns ns ns ns T x R + - - * ns * LSD (0.05) 9.5 - - 5.8 13.2 14.9 N x R ns - - ns ns ns T x N x R ns - - ns ns ns Mean 42 40 113 22 36 62 BP=bed planting, CT=conventional tillage, RH=residue harvested, and RR=residue retained. Significance level: +P≤0.1 *P≤0.05; **P≤0.01; *** p≤0.001; ns=non significant.
A significant interaction effects between tillage and residue level was observed
for AEN and AREN in maize. Under CT, RR increased (p<0.05) the AEN and AREN by
42% compared to RH. However, RR in BP decreased (p>0.05) the AEN by 7% and
AREN by 15% compared to RH (Figures 5.5A and 5.5B).

Nitrogen use efficiency under conservation vs. conventional agriculture practices
96
Residue RH RR
AE
N (
kg g
rain
per
kg
N a
ppl
ied
)
0
10
20
30
40BP CT
(A)
Residue
RH RR
AR
EN
(%
)
0
20
40
60
80
100BP CT
(B)
Figure 5.5 Interaction effects between tillage method and residue level in (A)
agronomic efficiency (AEN) and (B) apparent recovery efficiency (AREN), of applied N in maize. BP=bed planting, CT=conventional tillage, RH=residue harvested, RR=residue retained. Bars represent standard error.
5.3.3 Relationship between grain yield, N level and total N uptake
Wheat
Wheat grain yield vs. N level
Wheat grain yield as a function of N application for both tillage methods increased from
2.5 to 10 t ha-1 as the N level increased from 0 to 200 kg ha-1 (Figure 5.6A). In both
tillage methods, grain yield was increased linearly with applied N up to 150 kg ha-1 after
which the relative increase in yield was lower. Thus, every kg of N added above 150 kg
ha-1 does not lead to the same relative effect. The average grain yield at all N levels was
higher in BP than under CT, i.e., higher by 33% in N-0, 15% in N-100 and 5% in N-
200. This shows that changing the tillage method from CT to BP tended to increase
grain yield of wheat with both low and high N supply.
Wheat grain yield vs. N uptake
The relationship between grain yield and total N uptake is similar for both tillage
methods up to 200 kg N uptake. However, grain yield in BP was higher than under CT
when N uptake was more than 200 kg ha-1, i.e., BP had an 8% higher grain yield (10196
kg ha-1) than CT (9428 kg ha-1) at 275 kg ha-1 N uptake (Figure 5.6B).

Nitrogen use efficiency under conservation vs. conventional agriculture practices
97
N level (kg ha-1)
0 50 100 150 200 250
Gra
in y
ield
(kg
ha-
1 )
0
2000
4000
6000
8000
10000
12000BP CT
(A)
N uptake (kg ha-1)
0 50 100 150 200 250 3000
2000
4000
6000
8000
10000
12000 CTBP
(B)
Figure 5.6 Relationship between (A) grain yield and N level and (B) grain yield and
total N uptake, with two tillage methods in wheat. BP=bed planting and CT=conventional tillage. Fitted relationships between yield and N level: Y(BP)=9946/(1+exp(-(x-25)/39))), r2=0.97; Y(CT)=9521/(1+exp(-(x-42)/42))), r2=0.98; and between yield and N uptake: Y(BP)=10765/(1+exp(-(x-105)/57))), r2=0.97; Y(CT)=9503/(1+exp(-(x-87)/43))), r2=0.98
Maize
Maize grain yield vs. N level
Grain yield of maize increased from 1.7 to 7.2 t ha-1 as the N level increased from 0 to
200 kg ha-1 (Figure 5.7A). When changing the tillage method from conventional to
conservation, with per kg N fertilized, grain yields in BP was always higher than under
CT, except for N levels below 50 kg ha-1, where yields under CT were higher (Figure
5.7A). The combination of RR and BP showed a high response of applied N, which
exceeded that of all other treatments even at low N levels. However, RR under CT had a
negative effect; as the grain yield with N application was always about 200 kg ha-1
lower than with RH.
Maize grain yield vs. N uptake
The relationship between grain yield and total N uptake was similar in both tillage
methods up to 125 kg ha-1 N uptake. However, afterwards with per kg N uptake BP
showed higher yield response than CT. With an uptake of 180 kg ha-1 N, BP showed a
19% higher grain yield (6646 kg ha-1) than CT (5563 kg ha-1) (Figure 5.7B). A further
increase in N uptake was not observed under CT, while in BP it was up to 240 kg ha-1
with a grain yield of 7335 kg ha-1.

Nitrogen use efficiency under conservation vs. conventional agriculture practices
98
N level (kg ha-1)
0 50 100 150 200
Gra
in y
ield
(kg
ha
-1)
0
1600
3200
4800
6400
8000 BP RHBP RR
CT RRCT RH
(A)
N uptake (kg ha-1)
0 50 100 150 200 2500
1600
3200
4800
6400
8000
BPCT
(B)
Figure 5.7 Relationship between (A) grain yield and N fertilizer level in two tillage methods and two residue levels and (B) grain yield and total N uptake under BP and CT in maize. BP RH=bed planting with residue harvested and BP RR=bed planting with residue retained, CT RH=conventional tillage with residue harvested, and CT RR=conventional tillage with residue retained. BP=bed planting and CT=conventional tillage. Fitted relationships between yield and N level: Y(BP RH)= 7209/(1+exp(-(x-60)/51))), r2=0.94; Y(BP RR)= 7798/(1+exp(-(x-40)/59))), r2=0.94; Y(CT
RH)= 4334/(1+exp(-(x-0.7)/51))), r2=0.64; Y(CT RR)= 4581/(1+exp(-(x-17)/35))), r2=0.84; and between yield and N uptake: Y(BP)= 7705/(1+exp(-(x-103)/46))), r2=0.98; Y(CT)= 5701/(1+exp(-(x-77)/34))), r2=0.92.
5.3.4 Apparent N balance
In wheat, apparent N balance remained negative with both tillage methods (Table 5.3).
Averaged over the N levels, BP showed a 38% higher (p=0.1) negative N balance (-80
kg ha-1) than CT (-58 kg ha-1). Nitrogen level had no significant effect on apparent N
balance, and the balance remained negative with all three N levels (Figure 5.8A). This
indicates, in wheat season N loss did not occur with high- and low- N applications in
both BP and CT.
The main effects of both tillage and N level showed a significant effect on
apparent N balance in maize (Table 5.3). Averaged over tillage method, with N-0 the
apparent N balance was negative, while with N-100 and N-200 the N balance was
positive. With N-0, BP showed a 40% higher negative N balance than CT (Figure 5.8B).
Similarly, with N-100, BP showed an equal N balance (-0.4 kg ha-1), while CT showed
a positive N balance (+27 kg ha-1). With N-200, CT showed a higher positive N balance
(79 kg ha-1) than BP (11 kg ha-1).

Nitrogen use efficiency under conservation vs. conventional agriculture practices
99
N level (kg ha-1)N0 N 100 N 200
Ap
pa
ren
t N
ba
lanc
e (
kg h
a-1
)
-120
-100
-80
-60
-40
-20
0BP CT(A)
N level (kg ha-1)
N0 N 100 N 200
Ap
pa
ren
t N
ba
lan
ce (
kg h
a-1
)
-60
-40
-20
0
20
40
60
80
100BP CT
(B)
Figure 5.8 Interaction effect between tillage and N level in apparent N balance (A)
for wheat and (B) for maize. BP=bed planting and CT=conventional tillage. Bars represent standard error.
Averaged over N level, the apparent N balance in the cotton/wheat/maize
rotation systems was negative with both tillage methods, i.e., -83 kg ha-1 in BP and -37
kg ha-1 under CT. Irrespective of tillage, 0-N and low-N application level showed a
negative N balance, while high-N showed a positive balance (Table 5.3).
With 0-N, BP and CT showed similar negative N balances (-154 kg ha-1),
while with low-N application BP showed a higher negative N balance (-127 kg ha-1)
than CT (-64 kg ha-1). In contrast, with high-N application a positive N balance was
observed, where CT showed a higher positive N balance (133 kg ha-1) than BP (38 kg
ha-1). Under residues retained conditions in BP, the negative N balance was further
higher in 0-N, but the effect of residue was not observed with high-N application
(Figure 5.9A).
5.3.5 System N use efficiency
Irrespective of N level, the system N efficiency was higher (p>0.05) in BP (141%) than
under CT (134%). The efficiency decreased (p<0.05) with increased N level in both
tillage methods. Irrespective of tillage, system N efficiency was 200% with 0-N-0,
121% with low-N, and 91% with high-N (Table 5.3), which is consistent with the
decrease in NUE with increased N level. System N efficiency in the RR treatments in
BP was higher with 0-N, but no effect with high-N was observed (Figure 5.9B).

Nitrogen use efficiency under conservation vs. conventional agriculture practices
100
N level
Sys
tem
N b
ala
nce
(kg
ha
-1)
-250
-200
-150
-100
-50
0
50
100
150
200BP RH BP RR
CT RH CT RR
LSD(0.05)
(A)
0-N Low-N High-N
N level
Sys
tem
N e
ffici
en
cy (
%)
0
50
100
150
200
250 BP RH BP RR
CT RH CT RR
LSD(0.05)
(B)
0-N Low-N High-N
Figure 5.9 Interaction effects of tillage method, N level (0-N (no application), low-N
(125 kg N ha-1 for cotton and 100 kg N ha-1 for wheat and maize, and high-N (250 kg N ha-1 for cotton and 200 kg N ha-1 for wheat and maize)), and residue level on (A) system apparent N balance (kg ha-1) and (B) system N efficiency (%), in cotton/wheat/maize system. BP RH=bed with residue harvest, BP RR=bed with residue retention, CT RH=conventional tillage with residue harvest, and CT RR=conventional tillage with residue retention.

Nitrogen use efficiency under conservation vs. conventional agriculture practices
101
Table 5.3 Main effects of tillage method and N level (kg ha-1) on mineral N at harvest, total input, total output and apparent N balance and system level N efficiency of cotton/wheat/maize system in irrigated drylands .
Treatment Mineral N at 90 cm soil depth after harvest Wheat Maize
Total N from Irrigation
System level N balanced
System level N efficiencye
Cotton Wheat Maize Inputa Outputb Balancec Inputa Outputb Balancec
Tillage (kg ha-1) (%) BP 93 106 93 191 271 -80 215 223 -8 17.7 -83 141 CT 90 107 101 196 254 -58 220 193 27 20.7 -37 134 LSD 22 13 33 17 25 32 13 40 42 - 76 29 Nitrogen 0-N 86 106 95 92 152 -60 116 146 -30 19.2 -155 200 Low-N 95 104 85 202 279 -78 215 202 13 19.2 -99 121 High-N 93 109 111 287 356 -69 322 276 45 19.2 73 91 LSD 13 14 24 26 27 25 14 35 36 - 45 17
ANOVA Tillage ns ns ns ns + + ns 0.09 0.07 - + ns N level (N) ns ns 0.09 *** *** ns *** *** ** - *** *** N x T ns ns ns ns ns ns ns ns ns - + ns LSD 22 18 36 32 35 36 18 48 50 - 76 29 Mean 92 107 97 194 262 -69 217 208 9 - -60 137 BP=bed planting, CT=conventional tillage. Significance level: + P≤0.1 *P≤0.05; **P≤0.01; *** p≤0.001; ns=non significant, LSD- least significant difference at (p=0.05). a Input = (mineral N during planting + mineral N from fertilizer and irrigation); b Output = (crop N uptake + mineral N at harvest); c N
balance = (N input – N output). For N uptake by cotton see section 3.3.5 and N uptake by wheat and maize see Table 5.1. Mineral N before cotton was 135 kg ha-1 in all treatments.
d System apparent N balance = (N uptake by crops (cotton, wheat and maize) + mineral N after maize)-(N addition from fertilizer and irrigation + mineral N before cotton);
e System level efficiency = (N uptake by crops + mineral N after maize)/ (N from fertilizer and irrigation + mineral N before cotton).
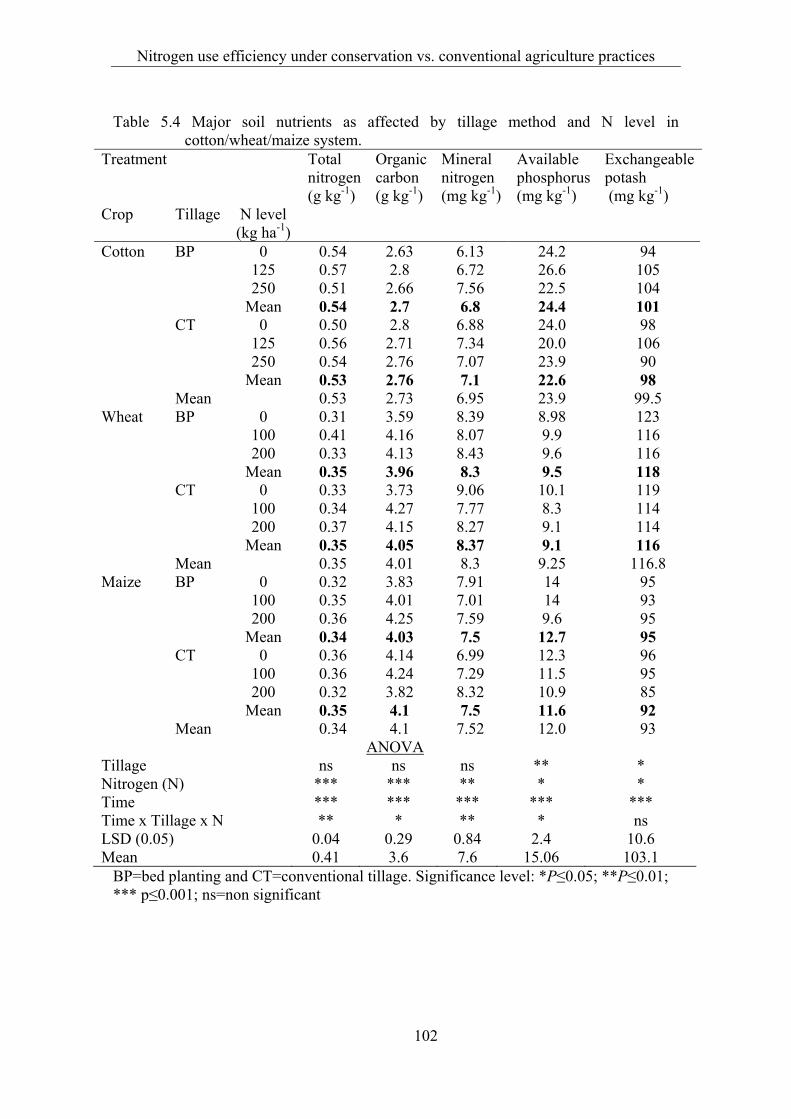
Nitrogen use efficiency under conservation vs. conventional agriculture practices
102
Table 5.4 Major soil nutrients as affected by tillage method and N level in cotton/wheat/maize system.
Treatment Total nitrogen (g kg-1)
Organic carbon (g kg-1)
Mineral nitrogen (mg kg-1)
Available phosphorus (mg kg-1)
Exchangeable potash (mg kg-1)
Crop Tillage N level (kg ha-1)
Cotton BP 0 0.54 2.63 6.13 24.2 94 125 0.57 2.8 6.72 26.6 105 250 0.51 2.66 7.56 22.5 104 Mean 0.54 2.7 6.8 24.4 101 CT 0 0.50 2.8 6.88 24.0 98 125 0.56 2.71 7.34 20.0 106 250 0.54 2.76 7.07 23.9 90 Mean 0.53 2.76 7.1 22.6 98 Mean 0.53 2.73 6.95 23.9 99.5 Wheat BP 0 0.31 3.59 8.39 8.98 123 100 0.41 4.16 8.07 9.9 116 200 0.33 4.13 8.43 9.6 116 Mean 0.35 3.96 8.3 9.5 118 CT 0 0.33 3.73 9.06 10.1 119 100 0.34 4.27 7.77 8.3 114 200 0.37 4.15 8.27 9.1 114 Mean 0.35 4.05 8.37 9.1 116 Mean 0.35 4.01 8.3 9.25 116.8 Maize BP 0 0.32 3.83 7.91 14 95 100 0.35 4.01 7.01 14 93 200 0.36 4.25 7.59 9.6 95 Mean 0.34 4.03 7.5 12.7 95 CT 0 0.36 4.14 6.99 12.3 96 100 0.36 4.24 7.29 11.5 95 200 0.32 3.82 8.32 10.9 85 Mean 0.35 4.1 7.5 11.6 92 Mean 0.34 4.1 7.52 12.0 93
ANOVA Tillage ns ns ns ** * Nitrogen (N) *** *** ** * * Time *** *** *** *** *** Time x Tillage x N ** * ** * ns LSD (0.05) 0.04 0.29 0.84 2.4 10.6 Mean 0.41 3.6 7.6 15.06 103.1
BP=bed planting and CT=conventional tillage. Significance level: *P≤0.05; **P≤0.01; *** p≤0.001; ns=non significant

Nitrogen use efficiency under conservation vs. conventional agriculture practices
103
5.3.6 Changes in major soil nutrients
In the cotton/wheat/maize system, total soil nitrogen (TN) and organic carbon (OC)
content were not affected (p>0.05) by tillage method (Table 5.4). Averaged over tillage
and N level, TN decreased (p<0.05) by 35%, while OC increased (p<0.05) by 47% at
wheat harvest compared to cotton harvest. However, at the end of the maize season, TN
and OC were unchanged compared to wheat season. The effects of N level on TN and
OC were inconsistent over the crop season, but in general increased (p<0.05) with N
application with both tillage methods.
Irrespective of crop season and N level, available phosphorus (AP) and
exchangeable potassium (EK) were higher (p<0.05) in BP than under CT. The effects of
N level on AP and EK were inconsistent over the crop season, but in general decreased
with N application with both tillage methods. Irrespective of tillage and N level, AP
decreased (p<0.05) by 61% in wheat compared to cotton, but increased by 29% in maize
compared to wheat season. In contrast, EP increased (p<0.05) by 17% in wheat season
compared to cotton, but decreased by 20% in maize compared to wheat (Table 5.4).
Irrespective of time and N level, tillage had no effect (p>0.05) on soil mineral
N concentration, while this increased with N application with both tillage methods
except in few cases. Irrespective of tillage and N level, mineral N during the wheat
season was higher (p<0.05) by 17% than in the cotton and by 11% than in the maize
season (Table 5.4).
5.4 Discussion
The response of a crop to the amount of applied N and the nitrogen use efficiency are
important criteria for evaluating crop N requirements for maximum (economic) yields.
Low N use efficiency is not only responsible for increased production cost, but also for
environmental pollution (Fageria and Baligar, 2005). Thus, a balanced use of N
fertilizer is important for an economically and ecologically sustainable crop production
system.
5.4.1 Total plant N uptake and crop yield
The higher total plant N uptake under CT than in BP during the initial stage of cotton
growth is associated with faster initial growth (section 3.3.2, 2008). The slower initial

Nitrogen use efficiency under conservation vs. conventional agriculture practices
104
growth in BP could be due to the delayed germination of 3-5 days; perhaps due to the
lower soil moisture contents in BP compared to CT. Volumetric moisture percent in the
top 10 cm soil during cotton sowing was 10+1% in BP and 13+0.5% under CT. After
fertilizer and irrigation applications, growth rates in BP surpassed those under CT;
hence the difference between total N uptake in BP and CT became non-significant. This
indicates that during the transition season from conventional to conservation agriculture
total N uptake by the cotton plants was not affected by tillage method, which is
consistent with the no difference in cotton yields between BP and CT. Although
previous studies indicated usually increased total N uptake with N application
(Rochester et al 1997; Chua et al. 2003), some studies reported only slight difference in
N uptake with varying N application (Kienzler 2010). The relatively high residual
mineral N content in the soil was apparently sufficient to compensate for the absence of
or low N fertilizer applications. An uptake of 118 kg N ha-1 with the N-0 treatment and
no significant difference in N uptake between the N-125 and N-250 treatments supports
this hypothesis (initial mineral N in top 90 cm soil was 135 kg N ha-1).
After one season of CA practices, the higher total plant N uptake in BP than
under CT with N application in both wheat and maize crops suggests that availability of
applied N was higher in BP than under CT. Grain yield per kg of applied N for both
wheat and maize crops was always higher in BP than under CT (Figures 5.6 and 5.7).
This shows that to obtain the same yield benefits, BP demands lower N application
levels than CT. In wheat, the increased N availability could have been due not only to
the consistently higher soil moisture in BP than under CT (section 4.3.3), but also to a
better contact between seeds and soil due to seed drilling compared to the broadcast
seeding under CT (Gursoy et al. 2010). The greater difference in total plant N uptake
between BP and CT with N-100 in this study suggests that BP was even more efficient
than CT with low-N applications. This is supported by higher plant N concentrations
(Figure 5.2) and a 10-20% higher aboveground biomass accumulation (Figure 4.3B) in
BP with N-100 than under CT. Furthermore, the higher soil mineral N concentration in
the top 90 cm soil, i.e., higher by 5% at heading, 30% at grain-filling and 10% at
maturity in BP than under CT with N-100, also supports the high N availability in BP
with N-100. Higher soil mineral N in the system led in turn to high plant N uptake
(Anga's et al. 2006).

Nitrogen use efficiency under conservation vs. conventional agriculture practices
105
However, with N-200, the higher plant N concentration and uptake during the
initial growth stage of wheat under CT than in BP could also have been caused by high
initial soil mineral N concentration. For example, CT with N-200 had higher soil
mineral N concentration by 23% (11.14 vs. 9.08 mg kg-1) at spike initiation and by 32%
(9.49 vs. 7.18 mg kg-1) at heading than under BP. It may have been that a flush of N
mineralization had occurred following cultivation prior to the onset of rapid early crop
growth under CT as previously suggested (Francis and Knight 1993). Furthermore,
previous research by Carter (1991) and Braim et al. (1992) showed that soil loosening
prior to seeding in sandy loam soil increased the release of mineral N from SOC and
applied fertilizer, which leads to increased N accumulation in plants, while under
conservation tillage, mineralization used to be more evenly distributed over the growing
season.
In maize, higher response of applied N in BP than CT could be due to earlier
seedling emergence and faster growth and development of maize in BP than in CT
(Figure 4.5). In an experiment in the central highlands of Mexico in moderately heavy
soil, Fischer et al. (2002) observed that maize under conservation tillage emerged three
days earlier and showed greater growth during the first week after seeding, which led to
higher biomass accumulation than under CT. An improvement of early growth resulted
in increased aboveground (Figure 4.5) and root biomass accumulation (Figure 4.7),
which may have increased the plant N requirement that could be satisfied by the applied
N fertilizer. Crop-N demand generally is determined by root and shoots biomass
accumulation (Cassman et al. 2002). Furthermore, Gastal and Lemaire (2002) reported
that N uptake rate of crops is regulated not only by N application and soil availability
but also by crop growth rate. This could be the reason for low N uptake in CT in this
study even with high-N application.
Furthermore, the higher availability of P2O5 in BP (15.4 mg kg-1) than under
CT (14.3 mg kg-1), and higher exchangeable K2O in BP (105 mg kg-1) than under CT
(102 mg kg-1) could have contributed to the increased N uptake in BP. High P2O5
concentration in the soil stimulates crop root growth, which contributes to increase N
uptake is also reported by Hollanda et al. (1998).
The increase in total plant N uptake in BP led to increased crop yield (section
5.3.3) while reducing N loss. This finding is important for farmers and for the

Nitrogen use efficiency under conservation vs. conventional agriculture practices
106
environment. Increased wheat grain protein with high N uptake was also reported by
Kienzler (2010) for the study region. This is important for Uzbekistan where the quality
of the wheat grain is usually low (Kienzler 2010).
5.4.2 Nitrogen use efficiency
The higher AEN and AREN in wheat and maize in BP than under CT in this study is
related to the higher N uptake (Table 5.2) and grain yield (section 4.3.2). No significant
difference in PEN in both the wheat and maize crops indicates that the change in grain
yield per unit N accumulation in the aboveground biomass is largely governed by
genetic factors (Yusuf et al. 2009).
Nitrogen use efficiency was decreased as N fertilizer level increased in all
three crops, i.e., cotton, wheat and maize (Table 5.2). This could be due to the fact that
grain yield rose less than the N supply by fertilizer as indicated by the linear increase in
grain yield of wheat and maize up to 150 kg N ha-1 application; beyond this N level, the
relative increment decreased (Figures 5.6 and 5.7). Decrease NUE with increasing N
level had also been reported by Lopez-bellido and Lopez-bellido (2001), Latiri-Souki et
al. (1998), and Palta and Fillery (1995) for wheat. This indicates that it may not be
worthwhile for the farmers to grow wheat and maize under such conditions with
investing more than 150 kg N ha-1 during the transition phase from CT to BP practices.
Decreased AEN in wheat, and AEN and AREN in maize in BP with RR
treatments compared to RH could be due to immobilization of applied fertilizer N in the
surface residues which were also previously reported by Carter and Rennie (1984) and
Verachtert et al. (2009). However, Karlen (1990) argued that the initial lower fertilizer
use efficiency due to N immobilization under conservation tillage also indicated a
conservation of soil and fertilizer N as soil organic matter, and thus that the fertilizer
requirements may decrease over time under conservation tillage. The immobilization
alone, however, cannot explain the low NUE with the RR treatments in both wheat and
maize. In addition, the higher grain yield and N uptake of wheat and maize in N-0 with
RR resulted in a larger supply and higher uptake of residual or mineralized N from
residues which were also previously reported (Limon-Ortega et al. 2000) for a maize-
wheat system in Mexico and for a rice-wheat-maize system in Bangladesh under
conservation agriculture (Talkudar et al. 2008). In contrast, increased AEN and AREN in

Nitrogen use efficiency under conservation vs. conventional agriculture practices
107
maize under CT with RR treatments compared to RH could be explained by the rapid
decomposition and slower release of applied and immobilized N, which may have
increased the NUE. Beare et al. (1993) reported that incorporated residues decomposed
3-4 times faster than residues left on the soil surface.
In wheat, the AEN was considerably higher (average 42 kg grain kg-1 N
applied) than the 7-11 kg kg-1 observed by Kienzler (2010) in the same study region in a
conventional system with 120 and 180 kg N ha-1, and a 29 kg grain per kg N supply
observed by Limon-Ortega et al. (2000) in northern Mexico in permanent bed planting.
Similarly, the AREN (113%) of the applied N in the wheat in this study was higher than
that reported by Kienzler (2010), who found only 37% in a conventional system in the
study area, by Carefoot and Janzen (1997) who reported 30-45% in Canada, and
Krupnik et al. (2004) 33-45% in India. Compared with others, the higher NUE of wheat
in this study could be due to better management practices, i.e., better crop
establishment, no weed infestation, proper soil moisture during the growing season and
the properly laser-leveled field. Jat et al. (2006) reported that laser leveling significantly
increased NUE in India. Thus, all this indicates that better management practices
increase NUE of field crops which was also postulated by Peng and Cassman (1998),
Dobermann et al. (2000), and Yusuf et al. (2009).
Similarly, in maize, the AEN in BP (28 kg grain kg-1 N applied) and CT (16 kg
grain kg-1 N applied) obtained in this study is not very different to that of Yusuf et al.
(2009), who reported AEN of 25 kg grain kg-1 N under conventional practices in a high
rainfall area in Nigeria. Cassman et al. (2002) reported 40% AREN in maize in USA,
which is nearly identical to that under CT (44%) in this study, while it is two times
lower than that observed in BP (80%). The higher AREN in BP than under CT in this
study, and also than in other regions, could be due to better micro-climatic conditions
and for instance better growth. Fahong et al. (2004) reported that NUE in BP crops
could be improved by more than 10% through better N placement possibilities in BP
than under CT. Furthermore, upland crops normally can recover about 40-60% of
applied N under field managed conditions (Vlek and Byrnes 1986).
However, with flood irrigation followed by N fertilizer application under CT,
the applied N may have been lost by NO3-N leaching to the groundwater as observed in
other reasons (Elmi et al. 2002; Jaynes et al. 2001). This may have reduces the

Nitrogen use efficiency under conservation vs. conventional agriculture practices
108
efficiency of applied N under CT. The increased groundwater NO3 concentration (10-12
ppm) from mid July to mid August in 2009, i.e., at fertilization and irrigation events in
maize, in this study (Figure 3.1) further supports the hypothesis.
5.4.3 Apparent N balance and system N efficiency
In this study, apparent N balance always remained lower in BP than under CT in wheat,
maize and also in the cotton/wheat/maize rotation system. This could be related to less
N input due to less N addition from irrigation water and high output due to increased
yield and N uptake in BP.
The high negative N balance but decreasing response to increasing N
application in wheat in this study (Table 4.4) indicates that N application in wheat was
not adequately or timely administered. Hence, wheat plants might have taken N after the
mineralization of organic N present in the soil and also might have been from other
unknown sources. Soil fertility exhaustion at wheat harvest, where TN decreased by
32% and available P2O5 by 61% compared to the cotton season in this study (section
5.3.6) can support the assumption. Since N input from the mineralization of organic N
was not considered while N balance calculation (equation 5.1). A negative N balance
even with the application of 180 and 240 kg N ha-1 in winter wheat in a conventional
production system has also been reported for the study region (Djumaniyazova et al.
2010).
During the maize growing season, the higher apparent positive N balance with
increasing N level under CT suggests that the maize crop had poorly utilized the
increased N offer by 100 kg ha-1, as crop yield and N uptake did not differ between N-
100 and N-200. This could be due to a slow initial crop growth and poor root growth
under conventional flood irrigation. This indicates that under high-yielding environment
N loss can be minimized with the adoption of permanent raised beds. From a two-year
study in China, Liu et al. (2003) reported about 38 and 92 kg apparent N balance in
maize under CT with the application of 120 and 240 kg N ha-1, respectively, which is
closer to the value observed in this study, i.e. 35 and 80 kg ha-1 with N-100 and N-200,
respectively (Figure 5.8B).
In cotton/wheat/maize rotation system, BP showed a lower positive N balance
(N loss) than CT under high-yielding environment (high-N application). Furthermore,

Nitrogen use efficiency under conservation vs. conventional agriculture practices
109
an overall system level N efficiency was higher in BP than under CT in the system. This
suggests that N loss from irrigated cotton/wheat/maize rotation system can be
minimized by increasing the efficiency of applied N through the adoption of permanent
raised beds compared to the conventional tillage practices.
Residue retention in BP showed a higher negative N balance and system N use
efficiency than with RH at N-0, while no effect with N-200. Similar to this Limon-
Ortega et al. (2002) reported high N uptake and yield of wheat and maize under RR in
BP with N-0 and no effect in N applied treatments. This indicates the residue retention
in permanent beds can be the potential source of N that compensate for the 0-N
application to sustain the crop yield in this system. However, significantly higher
negative N balance with crop residue retention without N application also indicates that
this practice can slowly mine the soil-N resources in the system. Thus, under the present
conditions, retaining crop residues without N application should be avoided. No effect
of RR in BP with high N levels compared to RH indicates that residue may have
immobilized the applied N. All these findings indicates the permanent raised beds with
residue retention, and the application of ~150 kg N ha-1 for each crop in
cotton/wheat/maize rotation can reduce the N loss to the environment.
5.5 Summary and conclusions
Application of fertilizer N increased grain yield and N uptake of wheat and maize
grown in rotation under both CA and CT practices. Also, efficiency of applied N
decreased with higher N levels. Yield, N uptake and NUE were higher in BP than under
CT with both high and low N levels in both wheat and maize crops. Thus, in BP the
same yield can be achieved as under CT but with lower N fertilizer amounts.
Lower partial N balance (N loss) and higher N use efficiency in BP than under
CT with both low- and high-N applications indicates that the N loss with high-yielding
environment can be minimized by adopting CA practices in cotton/wheat/maize rotation
systems. This is important from the environmental point of view, as N losses into the
environment are smaller, especially in irrigated drylands of Central Asia, where in a
study by Scheer et al. (2009) 40% of the loss of applied N occurred from the cotton field
under CT.

Nitrogen use efficiency under conservation vs. conventional agriculture practices
110
Residue retention in BP, however led to a high response of applied N as
indicated by the small increase in N uptake and grain yield in maize and higher NUE
especially in the N-0 and N-100 treatments compared to RH; the differences likely will
increase with time under these management systems. However, RR under CT is
counterproductive, as the grain yield with N application was always lower than for RH.
Thus, BP and partial residue retention with proper N application under
cotton/wheat/maize rotation could be an option to increase crop yield while reducing the
N loss in the salt-affected irrigated lands of Uzbekistan.

Salt dynamics and management under conservation and conventional agriculture practices
111
6 SALT DYNAMICS AND MANAGEMENT UNDER DIFFERENT
TILLAGE AND RESIDUE LEVELS IN A COTTON/WHEAT/MAIZE
SYSTEM IN SALT-AFFECTED IRRIGATED DRYLANDS
6.1 Introduction
Soil salinity is a serious threat to global agriculture (Zhang et al. 2007). About 20% of
the world’s cultivated area and nearly 50% of its irrigated lands are affected by soil
salinity (Zhu 2001). Dryland regions, which mostly depend on irrigation for crop
production, are even more vulnerable to soil salinity (Brady and Well, 2008). About 1-
2% of the irrigated areas in dryland regions are becoming increasingly unsuitable for
crop production due to salinity each year (FAO 2002). In irrigated agriculture, salts are
brought to the field with irrigation water (primary salinization). Next, when not leached
out they can accumulate in the soil profile through evaporative water loss, a process that
removes the soil water mainly from the topsoil but leaves the salts (secondary
salinization). Intensive soil tillage with residue removal on salt-affected lands entails the
dispersion of soil aggregates, and a reduction in soil organic substances, which leads to
increased evaporation loss and salinity levels in soils (Lal et al. 2007; Egamberdiev
2007). Furthermore, the generally shallow groundwater levels in the study region (<1 m,
i.e., above critical limit) during the summer are caused by heavy irrigation of virtually
all crops including rice. However, this practice has also contributed to increasing
secondary soil salinization (Forkutsa et al. 2009)
Salinity levels in the soil profile have to be reduced by appropriate soil and
water management practices (Ayers and Westcot 1985; Dong et al. 2008), as salinity
affects crop growth, yield and quality, and hence the sustainability of irrigated
agriculture (Dong et al. 2008; Razzouk and Whittington 1991). To reduce soil salinity
or its impact on crop establishment and growth in salt-prone areas, several management
practices have been applied. Examples are irrigation at night to reduce evaporation loss
(Rhoades et al. 1992; Rhoades 1999), pre-sowing seed treatments to enhance
germination even under saline conditions, planting methods such as sowing on raised
beds (Bakker et al. 2010; Sayre 2007; Egamberdiev 2007), increased seed rates per unit
area (Minhaus 1998), increased amounts of nitrogen and potassium fertilizer (Minhas
1996; Tanji and Kielen 2002), mulching the soil surface with crop residues (Pang et al.

Salt dynamics and management under conservation and conventional agriculture practices
112
2009; Bezborodov et al. 2010; Egamberdiev 2007), plastic (Dong et al. 2008), or a
combination of sand and soil (Bakker et al. 2010).
Conservation agriculture (CA) practices, i.e., reduced tillage and residue
retention, can influence the location and accumulation of salts by reducing evaporation
from the soil surface, which again reduces the upward transport of soluble salts (Brady
and Well 2008). Among CA practices, raised bed planting is gaining importance in
many parts of the world for row-spaced crops (Sayre 2007). Raised beds can save 25-
30% irrigation water, increase water use efficiency (Hassan et al. 2005; Ahmad et al.
2010; Sayre and Hobbes 2004; Mallik et al. 2005; Chaudhary et al. 2008) and also
provide the opportunity to leach salts from the furrows (Bakker et al. 2010). However,
under saline conditions, salt accumulation on the top of the beds has been reported by
Chaudhary et al. (2008) due to the upward movement of salts through capillary rise in
response to evaporation gradients.
Mulching for example with crop residues is a promising option to manage the
soil salinity, as it decreases soil water evaporation, increases infiltration and regulates
soil water and salt movement (Tian and Lei 1994; Pang and Xu 1998; Pang 1999; Li
and Zhang 1999; Li et al. 2000; Huang et al. 2001; Deng et al. 2003; Qiao et al. 2006).
For instance, wheat straw mulching prevents salt accumulation in the soil profile and
leads to a relatively constant salt level on the top 30 cm depth (Huang et al. 2001). Thus,
a combination of raised bed planting with residue retention could be more effective than
the effect of each practice alone, as it has the potential to reduce soil salinity in the long
term in salt-affected irrigated areas.
Although residue retention has great potential to reduce soil salinity in salt-
affected areas, residues may not be available in the quantities and qualities needed and
residue retention on the field may also compete with the present farmers’ practices in
Khorezm of using this resource as livestock feed or, as in the case of cotton stalks, used
as biofuel in bakeries. When crop residues are insufficient different irrigation techniques
have been proposed as a supplement or alternative management approach to control salt
on raised bed systems.
The amount, frequency, and method of irrigation collectively determine the
quantity, status, and distribution of salts in soil (El-Swaify 2000). When irrigation water
is applied to the furrows on every side of the bed, salts move to the centre of the bed,
which may damage (young) plants planted there (Brady and Well 2008). The ‘managed

Salt dynamics and management under conservation and conventional agriculture practices
113
accumulation’ approach, which proposes irrigating every other furrow and leaving
alternate furrows permanently dry, could be an effective option in salt-affected
drylands. The principle behind this approach is to direct salt concentrations away from
the plant roots by applying irrigation water very rationally and targeted. In addition, this
procedure can allow higher levels of salt to accumulate without damage to the crop, as
salts are “pushed” across the bed from the irrigated side of the furrow, where plants are
located, to the dry side without plants. This control of root zone salinity is considered a
beneficial strategy to improve emergence, stand establishment and finally crop yield in
saline fields (Meiri and Plaut 1985).
Salt leaching efficiency is determined also by the amount of water needed per
unit depth of soil to achieve a reduction in the salt content of the soil as a fraction of the
initial salt concentration (Bakker et al. 2010). In raised beds flow of irrigation water is
rapid (Holland et al. 2007), thus from a salt-leaching point of view the benefit of rapid
flow of irrigation water is uncertain because it provides less time to dissolve salts and to
remove them from the soil (Scotter 1978). However, under the ‘managed accumulation’
approach, the salts accumulated in the dry furrow can be leached properly. Effective salt
accumulation and leaching of salts in raised bed systems have not yet been explored in
the dryland areas of Uzbekistan. Thus, the objectives of this study were (1) to compare
salt dynamics under conventional and conservation agriculture practices, and (2) to
investigate the effect of different furrow irrigation techniques on salt distribution, crop
performance and salt leaching under raised bed cultivation in irrigated drylands.
6.2 Materials and methods
Two field experiments were conducted in the Khorezm region of Uzbekistan over two
years (2008 and 2009). In experiment I, the salt dynamics under conservation and
conventional agriculture practices were studied, and in experiment II, the effect of
different furrow irrigation techniques on salt distribution, crop performance and salt
leaching in raised beds were studied. For details of the study sites see section 3.2.1.
6.2.1 Salt dynamics under conservation and conventional agriculture practices
The study was conducted within an experimental area of cotton/wheat/maize rotation
systems under conservation and conventional agriculture practices (see Chapter 4). To
study the salt dynamics under this system, three treatments were evaluated: (i) bed
planting with residue retention (BP+RR), (ii) bed planting with residue harvested
Salt dynamics and management under conservation and conventional agriculture practices
114
(BP+RH), and (iii) conventional tillage (CT). In the residue retained treatment, 3 t ha-1
wheat residues, 6 t ha-1 cotton residues and 10 t ha-1 wheat residues were retained during
the cotton, wheat and maize season, respectively. In all residue harvested (RH)
treatments, residues were removed from the field. Slightly saline areas (ranging from
2.3-2.7 dS m-1) were selected randomly within each treatment during the cotton season
of 2008 (Appendix 9.1). Each sample point was tagged and soil samples were taken
each time around the fixed points over the three crop seasons, i.e., cotton, wheat and
maize grown in rotation.
For each treatment three subplots with each 600 m2 in size were randomly
selected. Within each plot two points were selected randomly in central four beds, given
thus a total of six replications for each treatment (Appendix 9.1).
Soil sampling and analysis
Soil was sampled from the predetermined sampling points with six replications for each
treatment to measure the soil salinity level. In BP, soil was sampled from both the top of
the bed and center of the furrow. Soils were sampled from 0-10, 10-20, 20-30, 30-60,
and 60-90 cm soil depths, one day before irrigation and at each crop harvest. The
collected soil samples were analyzed for gravimetric soil moisture content according to
Gardner et al. (2001) (equation 4.2), and electrical conductivity (ECp), which is the EC
of 1:1 water soil paste, according to Chernishov and Shirokova (1999) cited by Forkutsa
(2006) based on the EC of 1:1 water soil paste. The ECp was converted to the
international standard EC value of the saturated soil extract, ECe (Rhoades et al. 1999)
derived from the relationship according to equation (6.1) (R2=0.90) specially developed
for the soils in the study region (Akramkhanov 2010).
)EC x (2.06 EC 1):(1pe (6.1)
6.2.2 Effect of furrow irrigation techniques on soil salinity in raised beds
To compare soil salinity dynamics on raised beds that were subjected to three different
irrigation techniques, a separate experiment was conducted from July to September
during the cotton growing seasons in 2008 and 2009.

Salt dynamics and management under conservation and conventional agriculture practices
115
Experimental set up and treatments
The experiment was laid out in a complete block design with three irrigation treatments
replicated three times. Each replication consisted of 12 beds, sizes 0.9 m spacing and 25
m length. The irrigation treatments were arranged as shown in Appendix 9.2. In the
same way the treatments were allocated for the other two replications.
In 2008, the study was conducted within the experimental area of the
cotton/wheat/maize rotation systems, where beds were prepared in 90 cm spacing,
before planting cotton in April 2008. The chosen parts within the experimental plots
were without cotton plants, since plants had not germinated owing to high salinity. The
average initial soil salinity in the top 30 cm soil of this selected area was more than 12
dS m-1.
In 2009, the study was conducted along the side of the cotton/wheat/maize
rotation experiment in a cotton field, where cotton was planted on 90 cm spaced beds
under recommended practices; here the initial soil salinity before applying the irrigation
treatment was 6-7 dS m-1 in the top 30 cm.
Three irrigation cycles in 2008 and four irrigation cycles in 2009 were applied
in each treatment at 10-12 days intervals.
The three irrigation techniques used in the study were:
- Every-furrow irrigation (EFI): Irrigation water was applied uniformly in all
furrows during each irrigation event (Figure 6.1A)
- Alternating skip furrow irrigation (ASFI): Irrigation water was applied
alternately in each furrow. Irrigation was applied on one side of furrow while the
other furrow was kept dry. During the next irrigation event the previously irrigated
furrow was kept dry and the other furrow was irrigated (Figure 6.1B).
- Permanent skip furrow irrigation (PSFI): Irrigation water was applied always in
the same furrow of the bed. Hence, the alternate furrow was never flooded and kept
constantly dry (Figure 6.1C).

Salt dynamics and management under conservation and conventional agriculture practices
116
A. Every-furrow irrigation
.
. . .. .. .. .. . .
.. . .
...... .
.. .. .
.
. . .. .. .. .. . .
.. . .
...... .
.. .. .
.
. . .. .. .. .. . .
.. . .
...... .
.. .. .
.Irrigated furrow
Irrigated furrow Irrigated furrow
B. Alternating skip furrow irrigation
. . .. .. .. .. . .
.. . .
...... .
.. .. .
.
. . .. .. .. .. . .
.. . .
...... .
.. .. .
.
Alternately irrigated furrow
Alternately dry furrow
Alternately irrigated furrow
Alternately dry furrow
C. Permanent skip furrow irrigation
Permanently dry furrow
Permanently irrigated furrow
Permanently irrigated furrow
Permanently dry furrow
. . .. .. .. .. . .
.. . .
...... .
.. .. .
.
. . .. .. .. .. . .
.. . .
...... .
.. .. .
.
Figure 6.1 Methods of irrigation applied under raised bed planting. The arrows denote the direction of anticipated salt movement.
Salt leaching
After applying 3-4 irrigation cycles, the accumulated salt on top of the bed and furrows
was leached for each treatment. Therefore irrigation water was applied in all furrows at
the same time in the EFI and ASFI treatments. Under PSFI, salt leaching was started by
applying irrigation water to the permanently irrigated furrow first and after filling the
irrigated furrow, the dry furrow was irrigated. The hypothesis behind this procedure was
that the salt accumulated in the dry furrow could then not move laterally anymore as the
irrigation had already been applied to the irrigated furrows. Leaching was performed by
keeping 5-6 cm of standing water (on the top of the bed) for about 24 h.
Soil sampling
Soils were sampled before applying the irrigation treatments and before leaching, i.e.,
after three irrigation cycles in 2008 and four irrigation cycles in 2009 and immediately

Salt dynamics and management under conservation and conventional agriculture practices
117
(after 3 days) after leaching. Samples were taken each time from seven points (centre of
the bed, two sides of the bed, slope of both furrows and centre of the furrows) from a
bed as shown in figure 6.2 with three replications in each treatment. Samples were taken
at every 15 cm soil depth down to 90 cm using a tube auger. After air-drying, samples
were analyzed for ECe as described above (section 6.2.1, Soil sampling and analysis).
12
3 4 5
67
Center of bed
Center of furrow
Side of bed
Slope
Center of furrow
Slope
Side of bed
Figure 6.2 Vertical cut through a bed flanked by 2 furrows. Soil sampling points, the circle represents the position of sampling points in bed and furrow.
Yield and yield components measurement
In 2009, cotton yield and yield components were measured for each treatment with three
replications. Cotton was harvested from an area of 0.9 m x 15 m of each replication (an
entire bed where soil samples were taken) in three picks and weighed separately for
yield measurement. The average number of bolls per plant was calculated by counting
the bolls in each plant of the harvested row. Similarly, ten bolls were picked randomly
at each picking and oven dried at 70 °C for 16 h and weighed to calculate the average
boll weight.
6.2.3 Statistical analysis
Analysis of variance was conducted using repeated measures in the statistical analysis
system GenStat Discovery Edition 3. The treatment means were separated by Fisher’s
protected LSD (least significant difference (P=0.05)). For yield and yield components,
treatment mean + standard error is reported.

Salt dynamics and management under conservation and conventional agriculture practices
118
6.3 Results
6.3.1 Salt dynamics under conservation and conventional agriculture practices
Soil salinity at different soil depth
A significant treatment effect on soil salinity was observed in the top 30 cm soil depth
(Figure 6.3). Compared to the initial value, soil salinity in the top 30 cm depth increased
in all treatments during the cotton and maize seasons, while negligible changes occurred
during the wheat season. The effect of tillage method and residue level on soil salinity
was reduced with increasing soil depth.
At cotton harvest, the salinity in the top 30 cm was 63% higher under BP+RH,
followed by CT (49% higher) and BP+RR (29% higher) compared to the initial level
(pre-experiment). However, at wheat harvest, soil salinity was significantly lower in all
depths for all treatments than the cotton season. Salinity in the top 90 cm soil was
decreased by 29% in BP+RH, by 35% in BP+RR and by 45% in CT, at wheat harvest.
Similarly, compared to the initial value, salinity at wheat harvest was lower by 31% in
the top 30 cm under BP+RR, but was slightly higher under BP+RH and CT. At maize
harvest, salt was mostly accumulated in the top 10 cm soil. Compared to the wheat
season, salinity at the maize harvest in the top 10 cm increased significantly in all
treatments, i.e., by 87% in CT, by 24% in BP+RR, and by 13% in BP+RR. Similarly, in
comparison to the initial value, salinity in maize was significantly increased in all
treatments up to 60 cm soil depth, while it decreased thereafter ( 90 cm soil depth;
Figure 6.3).

Salt dynamics and management under conservation and conventional agriculture practices
119
Salinity, ECe (dS m-1)
0 1 2 3 4 5 6S
oil
dept
h (c
m)
0
15
30
45
60
75
90
Treatment (T) 0.4Depth <0.001T x depth 0.1
P level
BP+RR BP+RH CT
Initial
(A)
Salinity, ECe (dS m-1)0 1 2 3 4 5 6
0
15
30
45
60
75
90
LSD (0.05)
Treatment (T) 0.04Depth <0.001T x depth 0.1
P levelTreatment
Depth
Cotton
(B)
0 1 2 3 4 5 6
Soi
l de
pth
(cm
)
0
15
30
45
60
75
90
LSD (0.05)Treatment (T) <0.001Depth <0.001T x depth <0.001
P level
Wheat
(C)0 1 2 3 4 5 6
0
15
30
45
60
75
90
LSD (0.05)
Treatment (T) <0.001Depth <0.001T x depth <0.001
P level
Maize
(D)
Figure 6.3 Soil salinity level expressed as ECe (dS m−1) at pre-experiment and in different crop harvest seasons at different soil depths (10, 20, 30, 60 and 90 cm) as affected by tillage method and residue level. BP+RR=bed planting with residue retention, BP+RH=bed planting with residue harvest, and CT=conventional tillage. The horizontal bars indicate the least significant difference (LSD) between treatment and soil depth (B) and interaction between treatment and soil depth (C and D).
Salt dynamics in bed
The soil salinity in the top 10 cm soil increased significantly in all three treatments (i.e.,
CT, BP+RH, and BP+RR) over time compared to the initial levels. An effect of residue
retention on soil salinity was observed at the end of cotton season at which the salinity
level in BP+RR remained consistently lower than under BP+RH and CT (Figure 6.4A).
Although soil salinity increased in all treatments, after three crop cycles, the salinity
levels (dS m-1) in the top 10 cm of soil were 7.1 dS m-1 in BP+RH, 5.8 dS m-1 in CT, and
3.9 dS m-1 in BP+RR, i.e., 2.6 times higher in BP+RH, 2.1 times higher under CT and
0.4% times higher in BP+RR compared to the initial level. The results show that the rate
of soil salinity increase on top of the bed can be reduced by retaining crop residues, but
without RR, soil salinity on top of the beds can be higher than under CT. A similar trend
was observed for the top 30 cm soil (Figure 6.4B).

Salt dynamics and management under conservation and conventional agriculture practices
120
Apr
/08
M
ay/0
8
Jun/
08
Jul/
08
Aug
/08
Se
p/08
O
ct/0
8
Nov
/08
D
ec/0
8
Jan/
09
Feb
/09
M
ar/0
9
Apr
/09
M
ay/0
9
Jun/
09
Jul/
09
Aug
/09
Se
p/09
O
ct/0
9
Nov
/09
Sal
init
y, E
ce (
dS m
-1)
0
1
2
3
4
5
6
7
8
Cotton Wheat Maize
P level
Time <0.001Treatment (T) <0.001Time x T <0.001
LSD(0.05)
Initial
BP+R H CTBP+RR(A)
Apr
/08
M
ay/0
8
Jun/
08
Jul/0
8
Aug
/08
Se
p/08
O
ct/0
8
Nov
/08
D
ec/0
8
Jan/
09
Feb/
09
Mar
/09
A
pr/0
9
May
/09
Ju
n/09
Ju
l/09
A
ug/0
9
Sep/
09
Oct
/09
N
ov/0
9
Sal
init
y, E
ce(d
s m
-1)
0.00.51.01.52.02.53.03.54.04.55.0
Time <0.001Treatment (T) <0.001Time x T <0.001
P level
LSD(0.05)
Cotton WheatInitial Maize
(B)
Apr
/08
M
ay/0
8
Jun/
08
Jul/0
8
Aug
/08
Se
p/08
O
ct/0
8
Nov
/08
D
ec/0
8
Jan/
09
Feb/
09
Mar
/09
A
pr/0
9
May
/09
Ju
n/09
Ju
l/09
A
ug/0
9
Sep/
09
Oct
/09
N
ov/0
9
Sal
inity
, Ece
(ds
m-1
)
0.0
0.5
1.0
1.5
2.0
2.5
3.0
3.5
4.0
4.5
5.0
Time <0.001Treatment (T) <0.001Time x T <0.001
P level
LSD(0.05)
Cotton WheatInitial Maize
(C)
Figure 6.4 Soil salinity level over time, expressed as ECe (dS m−1) in (A) top 10 cm soil, (B) top 30 cm soil profile and (C) top 90 cm soil as affected by tillage method and residue level in a cotton/wheat/maize system. BP+RR=bed planting with residue retention, BP+RH=bed planting with residue harvest and CT=conventional tillage. Bars represent standard error. LSD is the least significant difference of time and treatment.
The treatment effects in terms of salinity changes in the top 90 cm over time
were not as large as in the case of the top 10 cm soil depth (Figure 6.4C). Like at the top
10 cm soil depth, the salinity level at the top 90 cm under BP+RR was consistently
lower than in BP+RH and CT. At the end of three crop seasons, i.e., after
cotton/wheat/maize, BP+RR showed a negligible increment in salinity, while this
increased by 29% in BP+RH and CT treatments compared to the initial level (Figure
6.4C).

Salt dynamics and management under conservation and conventional agriculture practices
121
Salt dynamics in furrow
Irrespective of treatment and crop, salinity level in the furrow remained significantly
low compared to the bed over the top 10 and 90 cm soil profiles. In the wheat season,
the salinity levels in the top 10 cm of the furrow were equal in both residue harvested
and retained treatments, i.e., 1.6 dS m-1 during growing season and 2.4 dS m-1 at
harvest. An effect of residue on the salinity level on top of the furrow was observed
only after the wheat season, when the amount of residue level increased, where the
salinity level was significantly higher in RH furrows (30% higher) than in RR furrow
(Figure 6.5A).
Mar
/09
Apr
/09
May
/09
Jun/
09
Jul/0
9
Aug
/09
Sep/
09
Oct
/09
Nov
/09
Salin
ity, E
ce (
ds m
-1)
0.0
0.5
1.0
1.5
2.0
2.5
3.0
3.5
4.0
4.5
5.0
Time <0.001Treatment (T) 0.006Time x T 0.002
P levelLSD(0.05)
Wheat Maize
Furrow RR Furrow RH(A)
Mar
/09
Apr
/09
May
/09
Jun/
09
Jul/
09
Aug
/09
Sep
/09
Oct
/09
Nov
/09
0.00.51.01.52.02.53.03.54.04.55.0
Time <0.001Treatment (T) <0.001Time x T 0.003
P levelLSD(0.05)
Wheat Maize
(B)
Figure 6.5 Soil salinity level over time expressed as ECe (dS m−1) in the furrow of (A) top 30 cm soil and (B) top 90 cm soil; as affected by residue level in cotton/wheat/ maize system. RR=residue retention and RH=residue harvest. Bars represent standard errors. LSD is the least significant difference of time and treatment.
In the top 90 cm, the salinity level, however, was higher under RR furrows
(11% higher, p<0.001) compared to the RH furrow during the wheat season. During the
maize growing season, salinity level in both RR and RH furrows did not differ over the
90 cm soil profile (Figure 6.5B).
Salt dynamics combined over bed and furrow
Similar to the salinity on top of the beds, BP+RR had consistently lower (P<0.05)
salinity levels, when averaged over bed and furrow than BP+RH and CT in all soil
depths (Figure 6.6). Up to the wheat season, i.e., after two cropping seasons, the salinity
level in the top 30 cm and 90 cm profile was higher (p<0.001) in BP+RH than under

Salt dynamics and management under conservation and conventional agriculture practices
122
CT. However, during the maize season, the averaged salinity level in the top 30 cm soil
in BP (bed furrow) was lower in both the with residues harvested (by 15-30%) and with
residue retained (by 36%) treatments than in the CT treatments (Figure 6.6A). M
ar/0
9
Apr
/09
May
/09
Jun/
09
Jul/0
9
Aug
/09
Sep/
09
Oct
/09
Nov
/09
Salin
ity, E
ce (
ds m
-1)
0
1
2
3
4
5
Time <0.001Treatment (T) <0.001Time x T <0.001
P level
LSD(0.05)
Wheat Maize
BP+RR BP+RH CT(A)
Mar
/09
Apr
/09
May
/09
Jun/
09
Jul/0
9
Aug
/09
Sep/
09
Oct
/09
Nov
/09
0
1
2
3
4
5
Time <0.001Treatment (T) <0.001Time x T <0.001
P level
LSD(0.05)
Wheat Maize
(B)
Figure 6.6 Salinity level over time, expressed as ECe (dS m−1) in (A) top 30 cm and (B) top 90 cm soil depth; as affected by tillage method and residue level in cotton/wheat/maize system. BP+RR=bed with residue retention, BP+RH=bed with residue harvest and CT=conventional tillage. Bars represent standard error. LSD is the least significant difference of time and treatment.
With respect to the entire 90 cm soil depth, the treatment effects on salinity
level over time were not as large as in the case of the top 30 cm soil depth. The effect of
tillage and residue on salinity in the top 90 cm soil showed a similar trend to that in the
top 30 cm soil in both crop seasons (Figure 6.6B).
6.3.2 Soil moisture dynamics
The temporal soil moisture curve indicated that volumetric soil moisture content in the
top 10 and 90 cm soil during the cotton and wheat growing season was neither affected
by soil tillage nor crop residue level (Figure 6.7). In contrast, during the maize season,
BP had higher (p<0.05) soil moisture content than CT before and after irrigation.
Irrespective of time, soil moisture in the top 90 cm soil was higher by 9% in BP
(average moisture 33%) than under CT (average moisture 30%), while in BP, RR
increased soil moisture content by 3% compared to RH. Similarly, in the top 10 cm soil
moisture in BP was 17% higher than under CT. Residue retention in BP increased
moisture content by 3-5% compared to RH (Figure 6.7A).

Salt dynamics and management under conservation and conventional agriculture practices
123
Apr
/08
M
ay/0
8
Jun/
08
Jul/0
8
Aug
/08
S
ep/0
8
Oct
/08
N
ov/0
8
Dec
/08
Ja
n/09
F
eb/0
9
Mar
/09
A
pr/0
9
May
/09
Ju
n/09
Ju
l/09
A
ug/0
9
Sep
/09
O
ct/0
9
Nov
/09
Vol
umet
ric s
oil m
oist
ure
(%)
5
10
15
20
25
30
35
40
Initial Cotton Wheat Maize
BP+RR BP+RH CT(A)
Apr
/08
M
ay/0
8
Jun/
08
Jul/0
8
Aug
/08
Sep
/08
O
ct/0
8
Nov
/08
D
ec/0
8
Jan/
09
Feb
/09
M
ar/0
9
Apr
/09
M
ay/0
9
Jun/
09
Jul/0
9
Aug
/09
Sep
/09
O
ct/0
9
Nov
/09
Vol
umet
ric s
oil m
oist
ure
(%)
5
10
15
20
25
30
35
40
Initial Cotton Wheat Maize
BP+RR BP+RH CT
(B)
Figure 6.7 Soil moisture level expressed as volumetric moisture (%) in (A) top 10 cm and (B) top 90 cm soil; as affected by tillage method and residue level in cotton, wheat, maize in rotation. BP+RR=bed with residue retention, BP+RH=bed with residue harvest, and CT=conventional tillage. Bars represent standard error.

Salt dynamics and management under conservation and conventional agriculture practices
124
6.3.3 Effect of different furrow irrigation techniques on salt distribution and
leaching under raised beds
Pre-experiment soil salinity
The pre-experiment soil salinity level in top 30 cm soil in terms of electrical
conductivity (ECe) in 2008 was significantly higher than in 2009 (Table 6.1). The soil
salinity levels at the different depths were in the range of 2.8-14.5 dS m−1 in 2008 and
5.7-6.8 dS m-1 in 2009.
Table 6.1 Pre-experiment soil salinity level at different soil depths during 2008 and 2009.
Year Soil salinity (dS m-1) at different soil depths (cm) 0-15 cm 15-30 cm 30-45 cm 45-60 cm 60-75 cm 75-90 cm
2008 14.5+1.5 12.2+0.6 5.12+0.5 3.2+0.3 2.8+0.15 - 2009 6.8+1.1 6.4+0.5 6.4+0.4 6.2+0.4 5.7+0.3 5.7+0.2
Salt distribution in raised beds under different irrigation techniques
Salt distribution after 3-4 irrigation cycles on raised beds was significantly affected by
irrigation methods in both years (Appendix 9.3; Figures 6.8 and 6.9). The salinity level
on top of the beds (15 cm depth) was significantly higher with the every-furrow
irrigated (EFI) and alternating skip furrow irrigated (ASFI) methods compared to the
pre-experiment salinity level in both years. However, under permanent skip furrow
irrigation (PSFI) salinity level was decreased by 38% in 2008, while it remained
unchanged in 2009 compared to the pre-experiment level (Table 6.2). With PSFI, the
salts had moved towards the top 15 cm of the side and center of the dry furrow in both
years, where the salinity level in the irrigated furrows and side of the beds was lower
than in the dry furrows (Figures 6.8 and 6.9). The treatment effects in terms of salinity
changes with increased soil depth were not as large as in the case of the top 15 cm soil
depth (Figures 6.8 and 6.9).

Salt dynamics and management under conservation and conventional agriculture practices
125
Table 6.2 Soil salinity (dS m-1) on top of the bed at top 15 cm soil depth before and after leaching under three different irrigation methods.
Treatment Soil salinity (ECe) dS m-1 at top 15 cm 2008 2009
Before leaching
After leaching
Before leaching
After leaching
Every-furrow irrigation (EFI) 18.6 4.2 12.8 5.5 Alternating skip-furrow irrigation (ASFI) 17.4 6 9 5.2 Permanent skip-furrow irrigation (PSFI) 10.5 2.5 6.5 2.7
Salt distribution in raised beds after leaching
After applying leaching water, the accumulated salts were washed out of the raised
beds, hence salinity levels in all irrigation treatments decreased significantly in both
years (Appendix 9.4). Among the treatments, the salinity level on the top 15 cm soil in
all positions and in the top 90 cm soil on the center of the beds was lower, i.e., <3 dS m-
1 under PSFI. This was lower than the 5-6 dS m-1 that remained on the side to center of
the bed in the top 60 cm soil depth in EFI and ASFI in both years (Figures 6.8 and 6.9).
This indicates that the salts from the top of the bed in the PSFI treatment, i.e., under
managed accumulation, leached properly compared to the EFI and ASFI treatments.

Salt dynamics and management under conservation and conventional agriculture practices
126
Figure 6.8 Salt distributions (ECe, dS m-1) before leaching (BL) and immediately after leaching with different irrigation / leaching methods in 2008.
0 20 40 60 80
Soil d
epth
(cm
)10
20
30
40
50
60
5 10 15 20
Every-furrow irrigation_BL
0 20 40 60 80
10
20
30
40
50
60
2 4 6 8 10 12 14 16
Alternating skip-furrow irrigation_BL
Permanent skip-furrow irrigation_BL
0 20 40 60 80
10
20
30
40
50
60
5 10 15 20
Distance from furrow to furrow (cm)
0 20 40 60 80
So
il d
epth
(cm
)
10
20
30
40
50
60
1.5 2.0 2.5 3.0 3.5 4.0
Distance from furrow to furrow (cm)
0 20 40 60 80
10
20
30
40
50
60
2 3 4 5 6
Distance from dry to irrigated furrow (cm)
0 20 40 60 80
10
20
30
40
50
60
1.5 2.0 2.5 3.0 3.5 4.0 4.5
Salt distribution immediately after leaching

Salt dynamics and management under conservation and conventional agriculture practices
127
Every- furrow irrigation_BL
0 20 40 60 80
Soil d
epth
(cm
)
10
20
30
40
50
60
70
80
2 4 6 8 10 12
Alternating skip-furrow irrigation_BL
0 20 40 60 80
10
20
30
40
50
60
70
80
3 4 5 6 7 8 9
Permanent skip-furrow irrigation_BL
0 20 40 60 80
10
20
30
40
50
60
70
80
4 6 8 10 12 14 16
Distance from furrow to furrow (cm)
0 20 40 60 80
Soil
dep
th (cm
)
10
20
30
40
50
60
70
80
2 3 4 5 6
Distance from furrow to furrow (cm)
0 20 40 60 80
10
20
30
40
50
60
70
80
2.5 3.0 3.5 4.0 4.5 5.0
Distance from dry furrow (cm)
0 20 40 60 80
10
20
30
40
50
60
70
80
2.5 3.0 3.5 4.0 4.5 5.0
Figure 6.9 Salt distributions (ECe, dS m-1) before leaching (BL) and immediately after leaching with different irrigation / leaching methods in 2009.
Salt distribution immediately after leaching

Salt dynamics and management under conservation and conventional agriculture practices
128
6.3.4 Cotton yield and yield attributes with different furrow irrigation
techniques
The raw cotton yield was higher under PSFI than with ASFI (by 65%) and EFI (by
97%) (Table 6.3). Similarly, cotton yield in ASFI was higher by 19% than under EFI.
Bolls per plant and per boll weight were higher in PSFI than under ASFI, where the
number of bolls per plant was higher by 55% and boll weight by 15%, respectively. The
difference in bolls per plant between ASFI and EFI was insignificant.
Table 6.3 Cotton yield and yield attributes in different irrigation treatments in 2009. Irrigation method Raw cotton yield
(kg ha-1) Bolls per plant Boll weight
(g) Every- furrows (EFI) 1019 +40 5.6 +0.5 4.92 +0.04 Alternating skip furrow (ASFI) 1216 +120 5.6 +0.9 5.25 +0.23 Permanent skip furrow (PSFI) 2003 +182 8.7 +0.01 6.05 +0.15
+=standard error
6.4 Discussion
6.4.1 Effect of tillage and residue management on salt dynamics
Salt dynamics in soils are the result of the interaction between soil, water, and
management practices, which contribute to the actual salt movement in the soil profile
(El-Swaify, 2000). Soil salinity in irrigated drylands such as Uzbekistan is strongly
determined by groundwater level (Forkutsa et al. 2009), which is associated with the
growing season, management practices, soil type, and irrigation and drainage methods
and efficiency. An application of agriculture practices that can minimize the increase in
soil salinity is essential for sustainable crop production in salt-affected irrigated lands.
After irrigation, water moves through the soil and the soluble salts present in
the profile will dissolve and lead to an increased concentration in the groundwater.
When the water reaches an exposed surface, the water evaporates and the salts are left
behind and in turn accumulate on the soil surface (Bakker et al. 2010). This was
confirmed in the present study by a significant increase in soil salinity in the top 10 cm
in all treatments compared to the top 90 cm soil profile (Figure 6.4).
Crop residues retained on the soil surface shade the soil, and in turn serve not
only as a water vapor barrier against evaporation losses, but also slow down surface
runoff, and increase infiltration (Huang et al. 2005; Mulumba and Lal 2008). In the
present study, the decreased rate in soil salinity increase with BP+RR compared to CT
and BP+RH indicates that this impact can be minimized with the retention of crop

Salt dynamics and management under conservation and conventional agriculture practices
129
residues already after three cropping cycles. Although crop residues on the soil surface
reduce evaporative water losses (Sauer et al. 1996; Jalota and Arora 2002), thereby
regulating the upward movement of salt and water from the shallow and saline
groundwater to the root zone (Qiao et al. 2006; Deng et al. 2003), it often is unclear how
much crop residues need to be retained. In a study of salt dynamics under mulching and
different water quality treatments in Central Asia, Bezborodov et al. (2010) reported an
approximately 20% increase in surface soil salinity, after three crop seasons, of the non-
mulching treatments compared to a mulching with 1.5 t ha-1 wheat residue under
conventional tillage. In the present study, compared to the initial level, the almost
similar salinity level (3 dS m-1) in the top 30 cm soil under BP+RR, and the increased
salinity under BP+RH and CT after three crop cycles suggests that BP with RR could be
an alternative strategy to manage soil salinity in salt-affected irrigated drylands.
However, the higher salinity level on BP+RH than under CT indicates that salinity can
be worse in BP than under current conventional practices. Huang et al. (2001) also
reported a reduced salt content in the top 30 cm soil and smaller reductions in salt
content in the 30-60 cm soil depth than in those of the overlying layers when soil was
mulched with wheat straw. The findings of the present study together with that of
Huang et al. (2001), who confirm the effect of residues up to the 30 cm soil depth, while
below this level, the effect on salinity was negligible.
High evaporation rate leads to a higher amount of salt accumulation in
uncovered topsoil over shallow and saline groundwater tables (Chaudhary et al. 2008;
Cardon et al. 2010). Hot and dry weather conditions during the cotton and maize season,
a reduced ground coverage due to row and spaced planting could have contributed to the
increased evaporation loss in this study. Remedies to reduce secondary soil salinity
should focus therefore on preventing rising groundwater tables and minimizing the
evaporation loss of water, for example by a mulch of crop residues. Although such
practices should be applied irrespective of the crop cultivated, some crops demand a
higher share in ground coverage than others, for example, wheat used to be more
narrowly spaced than cotton and maize, which lowers soil temperatures. Given that
groundwater tables during the wheat growing season were less shallow (Figure 3.1),
evaporation losses from the soil profile were lower than during the cotton and maize

Salt dynamics and management under conservation and conventional agriculture practices
130
season, resulting in decreased soil salinity. As a result, the salinity level during the
wheat season was lower in all treatments than that in the cotton and maize crops.
Salinity at the soil surface increases as the soil dries out (Bakker et al. 2010).
During maize cultivation, comparatively higher soil salinity under CT than in BP could
be related to the low soil moisture content on the top 10 cm as well as in the top 90 cm
soil profile (Figure 6.7). Visual observation indicated the greater soil cracking in CT,
hence irrigation water may have been lost through the wide soil cracks. Moreover, bed
and furrow configuration on raised bed can provide steady flow of irrigation water into
the furrow and prevents water logging (Bakker et al. 2010), which could have increased
the salt leaching from the soil profile in BP as suggested by Sayre (2007). All these
indicate that furrow irrigation on raised bed planting is more effective to minimize soil
salinization than CT with flood irrigation.
6.4.2 Effect of furrow irrigation technique on salt movement in raised beds
After 3-4 cycles of furrow irrigation, salts in the EFI and ASFI treatments were mostly
accumulated on the top and sides of the beds, while in the PFSI treatments salts were
mostly accumulated towards the dry furrow (Figures 6.8 and 6.9). The higher salt
accumulation towards the side and center of the bed under EFI and ASFI indicates that
when irrigation water is applied to both sides of the furrows in the raised beds, the salts
tend to move towards the side and center of the bed. Consequently, in salt-affected
irrigated lands the every-furrow irrigation system, which is a common method under
bed and furrow system, increases the salt accumulation on the center of the beds. Under
such a condition, crops grown on the bed will have high salt injury (Brady and Well
2008). This is supported by decreased yield and yield components of cotton grown
under EFI compared to the PSFI treatment in the present study.
However, the accumulation of salts towards the dry furrow under PSFI
treatment indicates that salts will move across the bed from the irrigated side (wet zone)
of the furrow to the dry side (dry zone) if a sufficient amount of irrigation water is
applied in the same furrow during all irrigation events. A similar salt movement under
PSFI was reported by Cardon et al. (2010) for a salt-affected region in Colorado, USA.
This implies that with the PSFI method in raised bed planting in salt-affected areas can
lead to a distinguished zone suitable for plant growth due to the lower soil salinity level.

Salt dynamics and management under conservation and conventional agriculture practices
131
The explanation is that under such conditions, plant roots grow towards the irrigated
furrow as to compensate for the reduced water and nutrient uptake by the roots exposed
to higher saline areas. This is evidenced also by the increased yield and yield attributes
of cotton under PFSI treatment compared to EFI and ASFI (Table 6.3). The
experimental area had salinity of 6.8 dS m-1; the raw cotton yield under PSFI (2.1 t ha-1)
in this study was almost similar to the averaged yield of cotton in the study region (2.7 t
ha-1). The determination of root growth and nutrient uptake fell beyond the scope of this
study, but previous findings show that the root biomass and nutrient and moisture
uptake decrease with increase salinity level (Chen et al. 2009; Maas and Grattan 1999).
Based on these findings, it can be assumed that in salt-affected irrigated lands, PSFI
techniques could be an effective irrigation alternative when introducing permanent
raised beds.
Salinity measurements after 24 h of salt leaching under EFI and ASFI showed
that 5-6 dS m-1 salt still remained on the top to side of the beds compared to the <3 dS
m-1 observed under PSFI method. In spite of the similar amount of water used for
leaching in all irrigation methods, the leaching efficiency with EFI and ASFI is lower
than with PSFI. It can be assumed that to leach the accumulated salt from the top of the
beds under EFI and ASFI, either more water would be needed or the beds would need to
be dismantled.
In conventional agriculture practices on salt-affected irrigated lands of
Uzbekistan, crop production, however, currently is possible only after leaching the
accumulated salt in early spring (Forkutsa et al. 2009). Salt leaching in early spring by
dismantling the beds, made for the irrigation during vegetative period, and applying of
about 4500 m3 ha-1 of water, is a common practice in the study region (Forkutsa et al.
2009). According to Ochs and Smedema (1996), in the Aral Sea Basin, even more water
is applied for the leaching of seriously saline land; about 5000 to 10000 m3 ha-1 yr-1.
Such practices can hardly be sustainable as the availability of irrigation water is
declining in the region (Gupta et al. 2009; Forkutsa et al. 2009).
After leaching, the low salinity level (<3 dS m-1) observed on the top of the
beds under PSFI compared to EFI and ASFI in both years suggests that salinity in BP in
irrigated drylands could be leached effectively with the use of PSFI method. This could
be due to the fact that the accumulated salt in dry the furrow moved downward instead
Salt dynamics and management under conservation and conventional agriculture practices
132
of laterally (Figures 6.8 and 6.9), because the water in the dry furrow was applied only
after filling all the furrows designated for irrigation. There is no doubt that applying
water in alternate furrow under PSFI can significantly reduce the amount of irrigation
water compared to the conventional method. Thus, this practice also can reduce the
harmful effect of over-irrigation in saline and shallow groundwater areas.
However, PSFI can be effective under controlled irrigation conditions, for
example if high rainfall or accidentally irrigated water fills the normally dry furrows
and pushes salts back across the bed toward the plants where it will cause salt injury to
the plants. Moreover, under PSFI method there is also a possibility to leach the
accumulated salts on dry furrow even during the vegetative growth stages. This practice
further helps avoiding salt injury during crop growth stages, and increasing crop
productivity in salt-affected irrigated lands.
In this study, the cotton was planted on the center of the bed. When planted on
the side of the irrigated furrow, without reducing the plant population, it can be
expected that cotton yield could be further increased under PSFI, as the salinity level on
the irrigated side of the furrow is always low and crops can thus grow in a less saline
environment (Figures 6.8 and 6.9). Benefits would be even greater if a salt-sensitive
crop was planted on the side of the irrigated furrow and a salt-tolerant crop was planted
on the side of the dry furrow.
6.5 Summary and conclusions
In the raised bed system, soil salinity on top of the beds increases over time in the
absence of crop residues compared to the conventional practices. When retaining crop
residues, the increasing salinity level on the raised beds can be reduced by 45% in the
top 10 cm and by 18% over the top 90 cm soil profile. Such reduction in increasing soil
salinity will have considerable importance in a region like Central Asia where land
degradation due to increased soil salinity is widespread, and in particular in Uzbekistan,
where more than 90% of irrigated lands suffer from soil salinity. Thus, raised bed
planting with residue retention could be a promising option to slow down the on-going
soil salinization in salt-affected irrigated drylands.
This study had only two residue treatments, i.e., residue retained and residue
harvested, and at the end of three crop seasons about 13 t ha-1 wheat residues and

Salt dynamics and management under conservation and conventional agriculture practices
133
6 t ha-1 of cotton residues were retained. Retaining all residues after each crop cycle
may, however, not be necessary. A partial removal of crop residues would also ease the
present competition of residues for other uses than for mulch.
Soil salinity on top of raised beds increases if irrigation water is applied to
every sides of the furrow. In permanent skip furrow irrigation, salts accumulate towards
the dry furrows and hence, this technology reduces the salt concentration on the top and
the side of the raised beds by 2-3 times compared to EFI and ASFI. Therefore, the
salinity level on the irrigated side of the furrow under PSFI is always low, and crops can
grow in a less saline environment. Cotton yield was significantly affected by irrigation
methods; PSFI performed better and produced yields of 984 kg ha-1 (96% higher) and
787 (64% higher) kg ha-1 higher cotton yield than EFI and ASFI methods, respectively.
The salts from the beds can be leached properly under PSFI compared to the ASFI and
EFI method. After leaching, salinity level on top of the bed under PSFI reduced to <3
dS m-1 (i.e., by 100%) compared to 5-6 dS m-1 under ASFI and BFI. Permanent skip
furrow irrigation, however, reduces the amount of irrigation water and thus can
minimize the secondary soil salinization problem under saline and shallow groundwater
table areas. Thus, in the absence of crop residues, permanent skip furrow irrigation
could be an effective method to manage the salt under raised bed in salt-affected
irrigated drylands. This practice could be more beneficial to farmers if salt-sensitive
crops were planted on the side of the irrigated furrow and a salt-tolerant crop planted on
the side of the dry furrow. Further research is needed to identify the combination of the
salt- tolerant and susceptible crops to cultivate on raised bed with permanent skip
furrow irrigation and its benefits to the farmers and to the environment.

General discussion and conclusions
134
7 GENERAL DISCUSSION AND CONCLUSIONS
7.1 Introductory remarks
This thesis addresses the scope for conservation agriculture (CA) practices with
different nitrogen (N) fertilization levels in cotton-based systems in salt-affected,
irrigated drylands in Uzbekistan, Central Asia. Crop growth, yield and water
productivity of the major crop rotation (cotton/winter wheat/third crop, e.g., maize, and
cotton mono-crop) as practiced by farmers in the study region Khorezm were compared
under conservation and conventional agriculture practices with three different N levels
during 2008 and 2009. The treatments examined were screened also for their effect on
soil salinity and N use efficiency, and it was defined under what conditions certain CA
practices, as advocated until now mainly under rainfed conditions can be suitable also
for the irrigated drylands in Uzbekistan.
The following synthesis indicates how the separate research findings as
outlined in the different chapters have overall contributed to a better understanding of
the problems and potential solutions and to progressing science. The findings of this
study could be extrapolated to areas with soils and agro-ecology similar to those in
Khorezm.
7.2 Discussion
7.2.1 A rationale for conservation agriculture in Uzbekistan
In the former Soviet republic Uzbekistan, cotton mono-cropping with intensive soil
tillage and excessive use of irrigation water and chemicals has been practiced since the
Soviet Union era. Intensive soil tillage increases the production costs, contributes to
greenhouse gas emissions, degrades cropland, compacts soils, deteriorates soil fertility,
and renders soils susceptible to wind and water erosion (Cox et al. 1990; Lopez et al.
1998; Tursonov 2009). Cotton mono-crop production without rotation has also caused
widespread soil exhaustion and degradation in Uzbekistan. The long-time practice of
flood-and-furrow irrigation without adequate drainage has drastically increased soil
salinity, which in turn requires large amounts of fresh water for salt leaching to ensure
crop establishment. Soil salinity causes losses in crop yield even up to 50%, which is
General discussion and conclusions
135
detrimental in Uzbekistan given that more than 90% of the irrigated land suffers from
different levels of salinity (Vlek et al. 2001).
Conservation agriculture practices, i.e., reduced tillage, proper residue
retention and crop rotation, have effectively reduced soil erosion, conserved soil
moisture, improved soil quality, enhanced soil carbon sequestration and reduced the
production costs, but these findings stem mainly from rainfed agriculture (Cantero-
Martıne et al. 2003; Wang et al. 2007; Giller et al. 2009). On the other hand, critics have
emerged on the use of CA as a blanket recommendation (e.g., Giller et al 2009). For
example, the effects of CA practices on growth and yields have been inconsistent. Some
studies showed that crop yields remained similar to or were not always higher with CA
than with conventional agriculture practices (Daniel et al. 1999; Nyakatawa et al. 2000;
He et al. 2009b; Gursoy et al. 2010). Others even reported lower yields (Ishaq et al.
2001; Pettigrew and Jones 2001; Schwab et al. 2002). Yet, accumulating evidence
suggests that many of the benefits from CA practices may also occur under irrigated
conditions (Sayre and Hobbs 2004; Tursonov 2009). Conservation agriculture practices
may, therefore, minimize the adverse effects of the conventional crop production
systems in the irrigated areas of Central Asia in general and in Uzbekistan in particular.
Recent findings underpin that to ensure effective and sustainable outcomes, CA
practices must be combined with appropriate N application levels, since N application
requirements under CA practices differ from those of conventional systems (Randall
and Bandel 1991; Torvert and Revert 1994). The identification of proper N management
under CA may help to not only increase N use efficiency, but also water productivity, to
decrease soil salinity, to decrease production cost and in the end also to increase carbon
sequestration in the soil.
The effects of CA practices were examined in two cotton-based rotation
systems, i.e., (1) cotton/cover-crop/cotton, and (2) cotton/wheat/maize while addressing
agronomic and soil property aspects.
7.2.2 Impact of CA practices on crop yield and N use efficiency in a
cotton/cover-crop/cotton rotation
In both study years, raw cotton yields in permanent raised beds (BP) and under
conventional tillage (CT) practices were similar in the cotton/cover-crop/cotton rotation.

General discussion and conclusions
136
Yield is an important indicator for the state-ordered cropping system in Uzbekistan,
which includes cotton and wheat and focuses in the first place on satisfying imposed
production quota for these crops. Hence, the absence of yield differences indicates that
CA practices may be a suitable alternative to the present intensive soil tillage activities
for irrigated cotton production (section 3.3.3). However, benefits are expected not only
for the government but also for farmers to whom CA offers a scope for increasing
income generation. The highest costs for the farmers are presently caused by machinery
use and fuel; they constitute about 33% of the total production cost (Rudenko and
Lamers 2006; Tursunov 2009). Hence, similar yields with CA compared to CT practices
with concurrent reduced production and operational costs for cotton production results
in higher gross margins (Tursunov 2009). Therefore, based on the yield aspect,
introducing CA practices should be in the interest of farmers and administrators
promoting sustainable cotton production in Uzbekistan.
Also important for farmers in particular and the society as a whole who are
concerned about the environment is the N use efficiency during crop cultivation, which
under the present conventional practices suffers from N losses via emissions and/or
leaching (Scheer et al. 2008; Kienzler 2010). The observed similar cotton yields despite
different N levels and tillage methods indicate that during the transition period from CT
to CA, the optimum application N level for irrigated cotton does not differ between soil
tillage method (section 3.3.3), and obviously depended on the initial soil mineral N
content (section 3.3.4). However, the findings show a linear yield response to soil
available N until about 200 kg ha-1, which than tapered off with higher N levels. This
indicates that every kg of N added above 150 kg N ha-1 (assuming about 50 kg N ha-1 is
residual) does not lead to the same effect as application rates below this threshold figure
(Figure 3.3). It may, therefore, not be worthwhile for farmers to invest in more than 150
kg N ha-1 during the transition phase from CT to BP practices. Furthermore, in BP,
lower amounts of N could be used compared to the recommended amount of ca 180 kg
N ha-1 with CT in the region. Also, the apparent recovery of applied N in BP was higher
than under CT, whereas the physiological N use efficiency (NUE) was lower. Hence,
during the transition period, less N is needed, indicating lower production costs for
farmers and less pollution of the environment, which is also beneficial to the society as
a whole.

General discussion and conclusions
137
Furthermore, due to higher N application levels, there was a linear increase in
leaf area and biomass production (Figure 3.2), and a smaller number of open bolls
during first picking (Table 3.4); hence, the growth duration of cotton in BP with higher
N application levels was extended compared to CT. In case farmers still intend to apply
larger amounts of N in BP as they are presently used to, yield benefits from this CA
practice can still be captured. In order to do so, farmers would need to advance the
cotton seeding time compared to the present seeding time. When considering that for an
effective germination of cotton seeds, the soil temperature must be >12 °C, earlier
planting dates may be restricted under the agro-climatic conditions in Khorezm. Yet, a
recent analysis of weather parameters showed that the present seeding recommendations
have become conservative and that site-specific adjustments are viable (Conrad et al.
2011); the authors are thus in favor of this proposed strategy. The analysis showed
furthermore that the impact of climate change had not yet resulted in longer frost
periods or later spring onsets as previously predicted (Vinogradov and Langford 2001).
Obviously, also the introduction of short-duration cotton varieties can be an alternative
to reap the potential benefits from permanent raised beds especially when applying
higher rates of N fertilizer than needed. Finally, given the increasing costs of inputs
such as N fertilizers (Rundenko and Lamers 2006) under virtually similar product prices
for cotton, BP with lower levels of N is also advantageous for increasing the farmers’
income from the state-ordered cotton production.
Hence, the two main indicators, i.e., yield and N management, show that the
introduction of permanent beds is a promising option. However, the findings also show
residual soil N losses due to early spring salt leaching (section 3.3.1). These losses can
be counterbalanced by introducing a cereal cover crop instead of a winter fallow, thus
reducing the groundwater-NO3 concentration. This in turn can increase the N uptake
and NUE for the following summer crop (Gabriel and Quemada 2011; Staver and
Brinsfield 1998) such as cotton. Analyses of such a strategy in a cotton mono-crop
situation indeed showed an up to 3-fold reduced groundwater-NO3 concentration in
early spring compared to a winter fallow (section 3.3.1). The inclusion of a cereal cover
crop in a cotton mono-crop system increased not only N uptake, hence minimized N
leaching, but also the carbon input. Findings show that carbon increased by 16% in the

General discussion and conclusions
138
top 30 cm soil profile (section 3.3.9) compared to the initial level. This is especially
interesting given the on-going carbon losses with conventional cultivation practices.
The combined findings on the effects of CA practices show that introducing
CA practices and a winter cover crop in a cotton mono-crop system is a promising
option. Yields were similar under the two tillage methods involved in this study, which
is of particular interest given the state order quotas. The N use efficiency in the CA
practices was higher, which is important given the increasing N prices and the present
environmental pollution, and the reduced production costs with BP will result in higher
profits. In particular, cotton mono-cropping in BP combined with a winter cover crop
and an N application rate of 150 kg N ha-1 is a suitable option to increase sustainable
cotton production in the salt-affected irrigated drylands in Uzbekistan. It would
important to determine whether or not the cultivation and active termination of the
winter cover crop with, for example, herbicides is also a financially feasible practice.
7.2.3 Impact of CA practices on water productivity, N use efficiency and soil
salinity in a cotton/wheat/maize rotation
Targeted field preparation helped avoiding the usually reported temporary reduction in
yields when changing from CT to CA practices (section 4.3.2). Whilst during the first
season of CA practices, cotton yields were not affected by soil tillage method, already in
the next season the subsequent wheat crop yielded 12% and the next crop maize 41%
more with BP than under CT. The observed significant yield increases in both wheat
and maize in BP were caused mainly by specific yield-determining components such as
higher number of spikes m-2 in wheat, and higher number of maize cobs ha-1 and grains
per cob (section 4.3.2). Furthermore, BP practices lowered irrigation water demands by
12 and 23% during the wheat and maize season, respectively, compared to conventional
flood irrigation (section 4.3.2). If such reductions in irrigation water usage are up-
scaled, the findings will have considerable importance for Uzbekistan, where both the
problem of secondary soil salinization due to excessive water needs through
conventional flood irrigation is increasing and the freshwater supply is diminishing.
Hence, increasing crop yields while reducing production cost and irrigation water
amount in BP is important from the economical as well as food security point of view,
as wheat and maize are the major food and feed crops in Uzbekistan. This should be in

General discussion and conclusions
139
the interest of the farmers, as production costs can be reduced (section 7.3) and crops
could be grown under diminished freshwater supply conditions.
Furthermore, crop yield response to each kg of N applied was higher in BP
than under CT in both wheat and maize crops (section 5.3.3). Also, the increased N
uptake and use efficiency in BP led to smaller N losses and higher NUE compared to
CT (Table 5.3). Options for increasing crop yield per kg N application while reducing N
losses can have important implications for both the environment and income generation
of farmers under the hot and dry conditions of Central Asia, where up to 40% of
applied-N losses occurred in cotton grown under CT (Scheer et al. 2009). Given the
higher NUE of a cotton/wheat/maize rotation in irrigated drylands with BP than under
CT may therefore reduce production costs for farmers, environmental pollution through
greenhouse gas emissions, and groundwater pollution.
The response of the combination of residue retention (RR) and BP to each kg
of applied N especially during the maize season exceeded that of all the other treatments
even at low N levels (Figure 5.7). As in the case of the cotton/cover-crop/cotton
rotation, yield benefits can thus be obtained by applying less N than presently
recommended if it is possible to retain crop residues. However, as long as N fertilizer is
still affordable, farmers may not feel encouraged to leave crop residues for increasing
NUE. Only after CA practices have led to an increased level of organic matter and N
content in the soil, may fertilizer N requirements for the crop decrease with CA
practices as experienced under rainfed conditions (Karlen 1990 and Salinas-Garcia et al.
2001). Similarly, the higher negative N balance with the combination of RR and N-0
(Figure 5.9) indicates that this practice slowly mines the soil-N resources. Thus, under
the present conditions, solely retaining crop residues without N application should be
avoided.
In the absence of crop residues, the salinity level in BP increased, while it
could be reduced significantly with the retention of crop residues. This increase was
even higher than under CT (Figure 6.4), thus complete removal of residues in BP is not
recommended. This is particularly important in Uzbekistan, where more than 90% of
the area is affected by (secondary) soil salinization.
However, leaving crop residues on the field competes with current farmers'
practices, because residues are presently used as animal feed (wheat straw) and also as

General discussion and conclusions
140
fuel (cotton stems). To achieve a balanced use of crop residues for improving soil
properties and farmers’ requirements, it is necessary to conduct further research to
determine the optimum level of retained residues and how much can be harvested.
No effect of residues on soil salinity during the (first) cotton season was
observed, where only 3 t ha-1 wheat residues were applied. However, salinity was
decreased after the cotton season, i.e., after the retention of 6 t ha-1 cotton residues
during the wheat season, and then after the retention of 10 t ha-1 wheat residues during
the maize season (section 6.3). This indicates that at least more than 3 t ha-1 crop
residues are needed for reducing soil salinity when introducing CA practices. Although
the assessment of an optimal rate of residue retention was beyond the scope of this
study, from the present findings it is clear that retaining all residues each time from all
crops is unnecessary. Since the irrigated winter wheat crops produced substantial
amounts of crop residues (8-10 t ha-1), leaving all these residues as a thick surface layer
may reduce seedling emergence and render field operations difficult, i.e., seeding,
irrigation, and fertilizer management. According Rawson and Macpherson (2000), a
retention of about 4 t ha-1 crop residue is the amount to be targeted for to reach better
crop growth and management. In a six years of study in CA practices Salinas-Garcia et
al. (2001) reported that under the condition of rapidly oxidization of soil organic matter,
it is necessary to leave at least 60% of the crop residues. Similarly, after three years of
field research in Uzbekistan, Bezborodov et al. (2010) reported that soil salinity levels
in cotton fields reduced by 20% with retention of 1.5 t ha-1 wheat residues in each
season compared to no-residue treatments. Thus, to achieve a balanced use of residues
on the degraded croplands, a partial removal of the residues from the fields seems to fit
the agronomic and economic demands. However, this needs approval from the
administration, which presently recommends the total removal of crop residues.
Although crop residue retention is a key factor in CA practices such as BP, its
application in the irrigated drylands in Uzbekistan needs much more attention. Consent
exists that crop residue is a renewable source of soil organic matter, and as such has the
potential to improve the soil quality especially in low soil-organic matter conditions
(Lal et al. 2007; Sainju et al. 2007). This is particularly important in the irrigated
drylands of Uzbekistan, since this region is experiencing soil quality degradation owing
to cotton mono-cropping with extensive tillage and crop residue removal that has

General discussion and conclusions
141
reached alarming levels (Kienzler 2010). On the other hand, soil organic carbon
reportedly only increases slowly, and the process may take several years, depending on
temperature, moisture conditions, management practices, and quantity and quality of
carbon input and mineral N added (Wang 2006). However, the higher soil organic
carbon level at wheat and maize harvest than the pre-experiment level and at cotton
harvest in 2008 (Table 5.4; section 3.3.9) indicates that proper crop rotation with residue
retention in BP can improve the soil quality at the beginning of CA practices.
The findings combined indicate that BP together with residue retention and
crop rotation increases crop yield, saves irrigation water, increases NUE and minimizes
N loss, increases soil organic carbon, and reduces the increasing salinity in salt-affected
irrigated drylands. The optimal level of crop residue retention, however, needs to be
determined.
Although no reduction in crop yield and a high N use efficiency in BP
compared to CT under both cotton/cover crop/cotton and cotton/wheat/maize rotations
was observed, the latter rotation could be more beneficial from an economic point of
view. Here, farmers can harvest three crops in rotation, while with the cotton/cover
crop/cotton rotation farmers will get only two cotton crops with, however, extra costs
for growing and terminating the winter cover crop. An economic analysis, however, has
not been conducted for this system; an economical analysis of a cotton-wheat system
under CA in the region by Tursonov (2009) showed that the total gross margin is always
higher for the wheat crop than for the cotton. Hence, cotton/wheat/maize rotations under
CA practices could be more profitable than cotton/cover crop/cotton rotation in salt
affected irrigated lands of Uzbekistan.
7.2.4 Impact of irrigation method on soil salinity management on permanent
raised beds
Although residue retention has great potential to reduce the salinity levels in salt-
affected irrigated drylands (section 6.3.1), residues may not be available in the
quantities and quality needed (section 7.2.1). In the absence of crop residues, the
salinity level on top of the raised beds increases (Devkota et al. 2010), and in particular
when applying irrigation water from both sides of the furrow, which is presently a
common irrigation practice. This can cause salt injury to the growing plants (Brady and

General discussion and conclusions
142
Well 2008) and also demands more irrigation water or the beds need to be destroyed to
leach the accumulated salts out from the top of the beds. Hence, the benefits of BP (see
Chapter 3, 4 and 5) in the absence of crop residues and with the common farmers’
irrigation practice are not sustainable in the long run.
However, permanent skip furrow irrigation (PSFI) in BP did not increase the
salinity level on top of the bed (section 6.3.3). Because of the accumulated salt in the
dry furrows under PSFI, the salinity level at the irrigated furrow side always remained
low. The crops thus enjoyed a more favorable environment, which resulted in
significantly higher cotton yields compared to every-furrow (EFI) and alternate skip-
furrow irrigation (ASFI) (section 6.3.3). This is particularly beneficial for crops grown
on raised beds in salt-affected areas. Use of PSFI in BP can further reduce the amount
of irrigation water needed compared to EFI, and thus can minimize secondary soil
salinization in saline and shallow groundwater areas. This is particularly important in
Uzbekistan, where more than 90% of the area is affected by (secondary) soil
salinization. The PSFI practice could further be more beneficial to farmers if, for
example, a salt-sensitive crop were to be planted on the side of the irrigated furrow and
a salt-tolerant crop on the side of the dry furrow.
After applying similar amounts of leaching water, the salinity level in BP
under PSFI remained at <3 dS m-1 (below threshold level for most of the crops)
compared to 5-6 dS m-1 in the EFI and ASFI treatments. This indicates that it is possible
not only to leach the salt out efficiently from the bed keeping it permanent, but also to
grow crops in permanent raised beds in the absence of crop residues. The accumulated
salt on the dry furrow side can be leached efficiently even in the middle of the crop
growing season; this practice can ultimately increase crop productivity. This is
especially interesting given the decreased crop yield due to increased soil salinity under
CT.
These combined findings show that PSFI has win-win opportunities: it supports
management of soil salinity and makes it possible to grow crops in salt-affected
irrigated drylands while keeping the beds permanent. Thus, should sufficient crop
residues not be available, PSFI can be a supplement or alternative management
approach to control salt on permanent raised beds. Furthermore, use of crop residues to
increase soil organic matter will increase the sustainability of the practice. Leaving a

General discussion and conclusions
143
small amount of crop residues together with proper crop rotation and PSFI with BP
could be the most sustainable option for crop production in salt-affected and degraded
irrigated lands.
7.3 Conclusions and outlook
Conservation agriculture practices with proper N application can be an alternative for
sustaining crop production in salt-affected irrigated drylands. A proper application of
CA practices leads to short- and long-term economical and environmental benefits that
support food security. The results of this study allow the following conclusions:
- No yield reduction/increasing crop yield
There was no significant difference in raw cotton yield between permanent raised
beds and conventional tillage in all study years. However, grain yield of wheat and
maize grown in a cotton/wheat/maize rotation on permanent raised beds increased
by 12% and 42%, respectively, compared to conventional tillage. Hence, intensive
soil tillage is deemed unnecessary for growing crops in irrigated drylands, which can
reduce cultivation cost and the negative effect associated with intensive soil tillage.
- Reduction in amount of irrigation water
Crops cultivated on permanent raised beds need less irrigation water, i.e., 12% less
during the wheat season and 23% less during the maize season, compared to
conventional flood irrigation. Given the predictions of diminishing water supply and
increasing secondary soil salinization associated with over-irrigation under
conventional flood irrigation system, the introduction of permanent raised beds can
be a suitable alternative for irrigated saline area with shallow groundwater in the
drylands of Uzbekistan.
- Increase in efficiency of N fertilizer
Already after one season of CA practices, apparent N recovery in permanent raised
beds was higher in all crops, i.e., 42% higher in cotton, 12% in wheat, and 82% in
maize compared to conventional practices. With high-yielding environment (high-
N), the apparent positive N balance (N loss) in permanent raised beds remained 71%

General discussion and conclusions
144
lower in the cotton/wheat/maize rotation and 53% lower in the cotton/cover-
crop/cotton rotation compared to the conventional practice. The higher NUE is
related to increased N availability and N uptake by crops in permanent raised beds
than under the conventional system. In the current conventional cropping system in
the irrigated lands of Uzbekistan, which are characterized by low N use efficiency
and high N loss, permanent raised beds can be a suitable alternative.
- Reduction in NO3 concentration in groundwater
After inclusion of a winter cereal cover crop in the cotton-cotton rotation, the
groundwater-NO3 concentration during early spring was 3 times lower, i.e.,
14 mg l-1 at the beginning of the 2008 cotton season and less than 4 mg l-1 at the
beginning of the cotton season 2009 after inclusion of a cover crop. The reduction in
groundwater-NO3 concentration was related to an N uptake and reduced amount of
irrigation water for early spring salt leaching.
- Minimization of increasing soil salinity
When retaining crop residues, the increase in the salinity level on permanent raised
beds was reduced by 45% in the top 10 cm and by 18% in the top 90 cm soil profile
compared to conditions where all residues had been removed. In salt-affected
irrigated drylands where degradation of croplands is increasing due to soil salinity,
permanent raised beds with residue retention can therefore be beneficial for
decreasing the ongoing rate of soil degradation caused by soil salinity.
- Increase in soil carbon input
Inclusion of cereal crops in the cotton mono-crop system added carbon inputs and
hence increases the soil organic carbon. In the top 30 cm soil depth it was 16%
higher in the cotton/cover-crop/cotton rotation and 22% higher in the
cotton/wheat/maize rotation compared to the initial levels.
The evaluation of different furrow irrigation techniques for salt management in
raised beds judged by the salt movement, leaching, and crop performance showed that:

General discussion and conclusions
145
- permanent skip furrow irrigation had advantages for the accumulated salt
management, and which resulted in a less saline environment towards the irrigated
furrow. In turn plants showed less salt injury compared to conventional irrigation
practices such as every-furrow and alternating skip furrow irrigation.
- permanent skip furrow irrigation leached the accumulated salts in the dry furrow
properly and hence, the salinity level on the center of the beds was reduced by two-
fold compared to every-furrow and alternate skip furrow irrigation.
7.4 Recommendations for management of CA practices
No yield reduction in cotton and increasing grain yields of the following wheat and
maize crops while using 12-23% less irrigation water under conservation agriculture
practices compared to conventional practices is encouraging evidence for the
introduction of permanent raised beds. Reductions in the increase in salinity level with
retention of crop residues on permanent raised beds and under permanent skip furrow
irrigation further support the importance of CA and other smart practices. Higher yields
with lower cultivation costs under permanent raised beds should motivate farmers and
administrators in Uzbekistan to accept CA practices. In particular because the present
results have been obtained, not from small experimental plots but from operational sized
plots i.e., in an area of >3 ha; hence similar results can be expected on farmers’ fields
with some consideration. Based on the experience of three cropping cycles with CA
practices, considering the following aspects further adds to the successful application of
CA practices in farmers’ fields.
- a proper field preparation, including for instance a laser-guided land leveling is
necessary before bed making to facilitate a uniform distribution of irrigation water;
- a suitable bed height, i.e., 10-15 cm height, is needed for efficient salt leaching;
- adequate soil moisture content needs to be ensured during planting to obtain a
proper plant stand;
- the use of appropriate herbicides for weed control is advantageous;
- the use of appropriate machinery to drill seed and fertilizer at the proper depth is
compulsory;
- a reshaping of beds during planting, if necessary;
- the use of short-maturing crop varieties is advantageous.

References
146
8 REFERENCES
Abdullaev C (2003) Republic of Uzbekistan. Land degradation assessment in dry lands (LADA). State Design and Research Institute (Uzgip), Tashkent
Abdullaev I and Molden D (2004) Spatial and temporal variability of water productivity in the Syr Darya Basin, Central Asia. Water Resources Research 40, doi:10.1029/2003WR002364
Ahmad IM, Qubal B, Ahmad G and Shah NH (2009) Maize yield, plant tissue and residual soil N as affected by nitrogen management and tillage system. Journal of Agriculture and Biological Sciences 1(1):19–29
Ahmad N, Rashid M and Vaes AG (1996) Fertilizer and their use in Pakistan. NFDC publication No. 4/96, 2nd edition, Islamabad, Pakistan, p 274
Akbar G, Hamilton G, Hussain Z and Yasin M (2007) Problems and potentials of permanent raised bed cropping systems in Pakistan. Pakistan Journal of Water Resources 11(1):11–21
Akramkhanov A, Ibrakhimov M and Lamers JPA (2010) Managing soil salinity in the lower reaches of the Amudarya delta: How to break the vicious circle? Case Study No. 8-7. In: Per Pinstrup-Andersen and Fuzhi Cheng (eds.), Food Policy for Developing Countries: Case Studies, p 13
Akramkhanov A, Lamers JPA, and Martius C (2010) Conversion factors to estimate soil salinity based on electrical conductivity for soils in Khorezm region, Uzbekistan. In: Qadir M, Wichelns D, Oster J, Jacobsen SE, Basra SMA and Choukr-Allah R (eds.): Sustainable management of saline waters and salt-affected soils for agriculture. Proceedings of the Second Bridging Workshop, 15-18 November 2009, Aleppo, Syria
Anga´s P, Lampurlanes J and Cantero-Martinez C (2006) Tillage and N fertilization Effects on N dynamics and Barley yield under semiarid Mediterranean conditions. Soil and Tillage Research 87:59–71
Ayers R S and Westcot D W (1985) Water quality for agriculture. FAO Irrigation and Drainage paper 29, Rev.1. FAO, Rome, pp 1–174
Bakker DM, Hamilton GJ, Hetherington R and Spann C (2010) Salinity dynamics and the potential for improvement of water logged and saline land in a Mediterranean climate using permanent raised beds. Soil and Tillage Research 110(1):8–24
Beare MH, Pohland BR, Wright DH and Coleman DC (1993) Residue placement and fungicide effects on fungal communities in conventional and no-tillage soils. Soil Sci Soc Am J 57:392–399
Bekchanov M, Karimov A and Lamers JPA (2010) Impact of water availability on land and water productivity: A temporal and spatial analysis of the case study region Khorezm, Uzbekistan. Water 2:668–684
Bezborodov GA, Shadmanov DK, Mirhashimov RT, Yuldashev T, Qureshi AS, Noble AD and Qadir M (2010) Mulching and water quality effects on soil salinity and sodicity dynamics and cotton productivity in Central Asia. Agriculture, Ecosystems and Environment 138:95–102

References
147
Blevins RL and Frye WW (1993) Conservation tillage: an ecological approach to soil management. Advances in Agronomy 51:33-78
Boquet D, Robert J, Hutchinson L and Breitenbeck GA (2004) Long-term tillage, cover crop, and nitrogen rate effects on cotton: Yield and fiber properties. Agron J 96:1436–1142
Bordovsky JP, Lyle WM and Keeling JW (1994) Crop rotation and tillage effects on soil water and cotton yield. Agron J 86:1–6
Brady NC and Weil RR (2008) The Nature and Properties of Soils. 14th edition, Pearson-Prentice Hall, Upper Saddle River, NJ, p 990
Braim MA, Chaney K and Hodgson DR (1992) Effects of simplified cultivation on the growth and yield of spring barley on a sandy loam soil. 2. Soil physical properties and root growth; root: shoot relationships, inflow rates of nitrogen; water use. Soil and Tillage Research 22:173–187
Bremen Cotton Report (2010) Cotton Report No.25/26. http://www.baumwollboerse.de Cited 02 July 2010
Bremner JM and Mulvaney CS (1982) Nitrogen-total. In: Page AL (ed) Methods of soil analysis: Part 2. Chemical and microbiological properties. Agron Monograph Number 9, ASA and SSSA, Madison, WI, pp 595–624
Bronson KF, Onken AB, Keeling JW, Booker JD and Torbert HA (2001) Nitrogen response in cotton as affected by tillage system and irrigation level. Soil Sci Soc Am J 65:1153–1163
Campbell CA, Zentner RP, Selles F, McConkey BG and Dyck FB (1993) Nitrogen management for spring wheat grown annually on zero-tillage: Yields and nitrogen use efficiency. Agron J 85:107–114
Campbell RB, Karlen DL and Sojka RE (1984) Conservation tillage for maize production in the U.S. Southeastern coastal plain. Soil and Tillage Research 4:511–529
Cantero-Martınez CP, Angas and Lampurlanes J (2003) Growth, yield and water productivity of barley (Hordeum vulgare L.) affected by tillage and N fertilization in Mediterranean semiarid, rainfed conditions of Spain. Field Crops Research 84:341–357
Cardon GE, Davis JG, Bauder TA and Waskom RM (2010) Managing Saline soils. http://www.ext.colostate.edu/pubs/crops/00503.htm. Cited 27 Aug 2010
Carefoot JM and Janzen HH (1997) Effect of straw management, tillage timing and timing of fertilizer nitrogen application on the crop utilization of fertilizer and soil nitrogen in an irrigated cereal rotation. Soil and Tillage Research 44(3-4):195–210
Carter MR (1991) Evaluation of shallow tillage for spring cereals on a sandy loam. 1. Growth and yield components, N accumulation and tillage economics. Soil and Tillage Research 21:23–35
Carter MR and Rennie DA (1984) Crop utilization of placed and broadcast 15N urea fertilizer under zero and conventional tillage. Canadian Journal of Soil Science 64:563–570

References
148
Cassman KG, Dobermann A and Walters DT (2002) Agro-ecosystems, nitrogen-use efficiency, and nitrogen management. AMBIO 31:132–140
Chaudhry MR and Guitchonouts A (2003) Cotton Facts. Technical paper No. 25 of the common fund for commodities. International Cotton Advisory Committee, p 158
Choudhary MR, Munir A and Mahmood S (2008) Field soil salinity distribution under furrow-bed and furrow-ridge during wheat production in irrigated environment. Pakistan Journal of Water Resources 12 (2):33–40
Christmann S, Martius C, Bedoshvili D, Bobojonov I, Carli C, Devkota K, Ibragimov Z, Khalikulov Z, Kienzler K, Manthrithilake H, Mavlyanova R, Mirzabaev A, Nishanov N, Sharma RC, Tashpulatova B, Toderich K and Turdieva M (2009) Food Security and Climate Change in Central Asia and the Caucasus, Tashkent, Uzbekistan. CGIAR-PFU, ICARDA Tashkent, p 39
Chua TT, Bronson KF, Booker JD, Keeling JW, Mosier AR, Bordovsky JP Lascano RJ, Green CJ and Segarra E (2003) In-season nitrogen status sensing in irrigated cotton: I. Yields and nitrogen-15 recovery. Soil Sci Soc Am J 67:1428–1438
CIA Factbook (2010) Central Intelligence Agency. Central Asia, Uzbekistan. https://www.cia.gov/library/publications/the-worldfactbook/geos/uz Cited 28 Dec 2010
Conrad C, Fritsch S, Zeidler J, Rücker G and Dech S (2010) Per-field irrigated crop classification in arid Central Asia using SPOT and ASTER data. Remote Sensing 2(4):1035–1056
Conrad C, Schorcht G, Tischbein B, Davletov S, Sultonov M, Lamers JPA (2011) Agro-meteorological trends of recent climate development in Khorezm and implications for crop production. In: Martius C, Rudenko I, Lamers JPA, and Vlek PLG (eds.) Cotton, water, salts and Soums - economic and ecological restructuring in Khorezm, Uzbekistan
Constable GA, Rochester IJ and Daniells IG (1992) Cotton yield and nitrogen requirement is modified by crop rotation and tillage method. Soil and Tillage Research 23:41–59
Cotton Research Institute (1977) Methods of agrochemical analyses for soil and plants of Central Asia (in Russian). 5th edition Tashkent, Uzbekistan Cotton Research Institute, p 187
Cox WJ, Zobel RW, van Es HM and Otis DJ (1990) Tillage effects on some soil physical and corn physiological characteristics. Agron J 82:806–812
Daniel JB, Abaye AO, Alley MM, Adcock CW and Matland JC (1999) Winter annual cover crops in a Virginia no-till cotton production system. II. Cover crop and tillage effects on soil moisture, cotton yield and cotton quality. Journal of Cotton Science 3:84–91
Davidson DJ and Chevalier PM (1992) Storage and remobilization water soluble carbohydrates in stems of spring wheat. Crop Sci 32:186–190
De Wit CT (1992) Resource use efficiency in agriculture. Agricultural Systems 40 121–151

References
149
Deng L, Chen M, Liu Z, Shen Q, Wang H and Wang J (2003) Effects of different ground covers on soil physical properties and crop growth on saline-alkaline soil. Chinese Journal of Soil Science 34 (2):93–97
Derpsch R and Friedrich T (2009) Global overview of conservation agriculture no-till adoption. In 4th World Congress on Conservation Agriculture New Delhi, India, 4-7 February. http://www.fao.org/ag/ca/doc/Global-overview-CA-adoption-Derpsch comp2.pdf. Cited 12 Oct 2010
Devkota MK, Martius C, Sayre KD, Egamberdiev O, Devkota KP, Gupta RK, Manschadi AM and Lamers JPA (2010) Performance of maize under conservation agriculture on salt-affected irrigated croplands of Uzbekistan, Central Asia. http://wwwtropentagde/2010/abstracts/full/1022pdf. Cited 22 Nov 2010
Dilz K (1988) Efficiency of uptake and utilization of fertilizer nitrogen by plants. In: Jenkinson DS and Smith KA (eds) Nitrogen efficiency in agricultural soils. Elsevier Applied Science, London, pp 1–26
Ding G, Novak JM, Amarasiriwardena D, Hunt PG and Xing B (2002) Soil organic matter characteristics as affected by tillage management. Soil Sci Soc Am J 66:421–429
Ditsch DC, Alley MM, Kelly KR and Lei YZ (1993) Effectiveness of winter rye for accumulating residual fertilizer N following corn. Journal of Soil and Water Conservation 48:125–132
Djumaniyazova Y, Sommer R, Ibragimov N, Ruzimov J, Lamers J and Vlek P (2010) Simulating water use and N response of winter wheat in the irrigated floodplains of Northwest Uzbekistan. Field Crops Research 116: 239–251
Dobermann A, Dawe D, Roetter RP and Cassman KG (2000) Reversal of rice yield decline in a long-term continuous cropping experiment. Agron J 92:633–643
Dong H, Li W, Tang W and Zhong D (2008) Furrow seeding with plastic mulching increases stand establishment and lint yield of cotton in saline field. Agron J 100:1640–1646
Doran JW, Elliott ET and Paustian K (1998) Soil microbial activity, nitrogen cycling, and long-term changes in organic carbon pools as related to fallow tillage management. Soil and Tillage Research 49:3–18
Durynina EP and Egorov VS (1998) Agrochemical analysis of soil, plants and fertilizer. Moscow, Moscow University (MGU), p 113
Egamberdiev O (2007) Dynamics of irrigated alluvial meadow soil properties under the influence of resource saving and soil protective technologies in the Khorezm region. Dissertation, National University of Uzbekistan
Eijkelkamp (2002) Eijkelkamp catalogue. Eijkelkamp Agrisearch Equipment, the Netherlands
Elbehar JW (1991) Producing quality cotton in 1991: Plant nutrition management. In: Herber DJ and Richter DA (eds.) Proceedings of Beltwide Cotton Conference San Antonio, TX. 8–12 January National Cotton Council of America Memphis, TN, pp 55–58

References
150
Elmi AA, Madramootoo C, Egeh M, Liu A and Hamel C (2002) Environmental and agronomic implications of water table and nitrogen fertilization management. J Environ Qual 31:1858–1867
El-Swaify SA (2000) Soil and water supply. In: Silva JA and Uchida R (ed.) Plant nutrient management in Hawaii’s soils: Approaches for tropical and subtropical agriculture. http://www.ctahr.hawaii.edu/oc/freepubs/pdf/. University of Hawaii, Manoa
Engelstad OP (1985) Fertilizer technology and use. Soil Science Society of America, Inc, Mdison, WI, p 633
Erenstein O, Sayre K, Wall P, Dixon J and Hellin J (2008) Adapting no-tillage agriculture to the conditions of smallholder maize and wheat farmers in the tropics and sub-tropics. In:Goddard T, Zoebisch M, Gan Y, Ellis W, Waston A and Sombatpanit S (eds.) No-till farming systems. Special publication 3:253-278. World Association of Soil and Water Conservation (WASWC), Bangkok
Etana A, Hakansson I, Zagal E and Bucas S (1999) Effect of tillage depth on organic carbon content and physical properties in five Swedish soils. Soil and Tillage Research 52:129–139
Fageria NK and Baligar VC (2005) Enhancing nitrogen use efficiency in crop plants. Advances in Agronomy 88:97–185
Fanong W, Xuqing W and Sayre K (2004) Comparison of conventional, flood irrigated, flat planting with furrow irrigated, raised bed planting for winter wheat in China. Field Crops Research 87:35–42
FAO (2000) Crops and drops. Land and Water Division of the food and agriculture organization. FAO, Rome, Italy
FAO (2002) The salt of the earth: hazardous for food production. Cited 10 Sept 2010
FAO (2002) Uzbekistan country report FAO. Cited 30 Oct 2008
FAOSTAT (2010) Agriculture data, agricultural production. http://faostat.fao.org/, Cited 28 July 2010
Fischer RA, Santiveri F and Vidal IR (2002) Crop rotation, tillage and crop residue management for wheat and maize in the sub-humid tropical highlands: II. Maize and system performance. Field Crops Research 79 (2-3):123–137
Forkutsa I (2006) Modelling water and salt dynamics under irrigated cotton with shallow groundwater in the Khorezm region of Uzbekistan. Dissertation, ZEF/Rheinische Friedrich-Wilhelms-Universität Bonn
Forkutsa I, Sommer R, Shirokova Y, Lamers JPA, Kienzler K, Tischbein B, Martius C, and Vlek PLG (2009) Modeling irrigated cotton with shallow groundwater in the Aral Sea Basin of Uzbekistan: I. Water dynamics. Irrigation Sci 27(4):331–346
Fowler DB, Limin AE, and Ritchie JT (1999) Low-temperature tolerance in cereals: Model and genetic interpretation. Crop Sci 39:626–633
Francis GS and Knight TL (1993) Long-term effects of conventional and no-tillage on selected soil properties and crop yields in Canterbury, New Zealand. Soil and Tillage Research 26 (3):193–210

References
151
Franzluebbers AJ, Hons FM and Zuberer DA (1995) Soil organic carbon, microbial biomass, and mineralizable carbon and nitrogen in sorghum. Soil Sci Soc Am J 59:460–466
Fredrick JR and JJ Camberato (1995) Water and nitrogen effects on winter wheat in the southeastern central plain: I. Grain yield and kernel traits. Agron J 87:521–526
Frye WW, Smith WG and Williams RJ (1985) Economics of winter cover crops as a source of nitrogen in no-till corn. Journal of Soil and Water Conservation 40:246–249
Gabriel JL and Quemada M (2011) Replacing bare fallow with cover crops in a maize cropping system: Yield, N uptake and fertilizer fate. European Jourrrnal of Agronomy DOI 10.1016/j.eja.2010.11.006
Gant CA, Gauer LE and Bailey LD (1992) Tillage and soil physical quality. In: www.mandakzerotill.org/books/proceddings/proceeding%201992/cynt Cited 10 Oct 2010
Gardner CMK, Robinson D, Blyth K and Cooper JD (2001) Soil water content. In: Smidth KA and Mullins CE (eds.) Soil and environmental analysis: physical methods. Marcel Deccer Inc, New York, USA, pp 1–65
Garten RW and Widders IE (1990) N and P preconditioning of small seedlings influences growth and yield processing tomatoes. Hort Science 25:655–657
Gastal F and Lemaire G (2002) N uptake and distribution in crops: an agronomical and ecophysiological perspective. Journal of Experimental Botany 53 (370):789–799
Govaerts B, Sayre KD and Deckers J (2005) Stable high yields with zero tillage and permanent bed planting? Field Crops Research 94:33–42
Guadagni M, Raiser M, Crole-Rees A and Khidirov D (2005) Cotton taxation in Uzbekistan: Opportunities for reform. ECSSD Working Paper No 41, Europe and Central Asia Region. World Bank, Washington DC, p 29
Gupta R, Kienzler K, Martius C, Mirzabaev A, Oweis T, de Pauw E, Qadir M, Shideed K, Sommer R, Thomas R, Sayre K, Carli C, Saparov A, Bekenov M, Sanginov S, Nepesov M and Ikramov R (2009) Research Prospectus: A Vision for Sustainable Land Management Research in Central Asia. ICARDA Central Asia and Caucasus Program. Sustainable Agriculture in Central Asia and the Caucasus Series No.1. CGIAR-PFU, Tashkent, Uzbekistan
Gürsoy S, Sessiz A and Malhi SS (2010) Short-term effects of tillage and residue management following cotton on grain yield and quality of wheat. Field Crops Research 119:260–268
Habtegebrial K, Singh BR and Haile M (2007) Impact of tillage and nitrogen fertilization on yield, nitrogen use efficiency of tef (Eragrostis tef (Zucc.) Trotter) and soil properties. Soil and Tillage Research 94:55–63
Haper HJ (1924) The accurate determination of nitrates in soils. Journal of Industrial and Engineering Chemistry 16:180-183
Harris BL and JH Krishna (1989) Furrow diking to conserve moisture. Journal of Soil and Water Conservation 44:271–273

References
152
Hassan I, Hussain Z and Akbar G (2005) Effect of permanent raised beds on water productivity for irrigated maize–wheat cropping system. In: Roth CH, Fischer RA and Meisner CA (eds.) Evaluation and performance of permanent raised bed cropping systems in Asia, Australia and Mexico. ACIAR Proceeding No. 121
Hicks SK, Wendt CW, Gannaway JR and Baker RB (1989) Allelopathic effects of wheat straw on cotton germination, emergence, and yield. Crop Sci 29:1057–1061
Hirel B, Le Gouis J, Ney B and Gallais A (2007) The challenge of improving nitrogen use efficiency in crop plants: Towards a more central role for genetic variability and quantitative genetics within integrated approaches. Journal of Experimental Botany 58 (9):2369–2387
Holanda FSR, Mengel DB, Paula MB, Carvaho JG and Bertoni JC (1998) Influence of crop rotations and tillage systems on phosphorus and potassium stratification and root distribution in the soil profile. Communications in Soil Science and Plant Analysis 29 (15-16):2383–2394
Holland JE, White RE and Edis R (2007) The relation between soil structure and solute transport under raised bed cropping and conventional cultivation in south-western Victoria. Australian Journal of Soil Research 45:577–585
Holland JM (2004) The environmental consequences of adopting conservation tillage in Europe: reviewing the evidence. Agriculture, Ecosystems and Environment 103:1–25
Huang Q, Yin Z and Tian C (2001) Effect of two different straw mulching methods on soil solute salt concentration. Arid Land Geography 24:52–56.
Huang YL, Chen LD, Fu BJ, Huang, ZL and Gong E (2005) The wheat yields and water-use efficiency in the Loess Plateau: straw mulch and irrigation effects. Agricultural Water Management 72 (3):209–222
Huntington TG, Grove JH and Frye WW (1985) Release and recovery of nitrogen from winter annual cover crops in no-till corn production. Communications in Soil Science and Plant Analysis 16:193–211
Ibragimov NM (2007) Ways of increasing the nitrogen fertilizer efficiency on cotton in the belt with irrigated sierozem soils (Habilitation, in Russian). Dissertation, Uzbekistan Cotton Research Institute
Ibrakhimov M, Khamzina A, Forkutsa I, Paluasheva G, Lamers JPA, Tischbein B, Vlek PLG and Martius C (2007) Groundwater table and salinity: Spatial and temporal distribution and influence on soil salinization in Khorezm region, Uzbekistan, Aral Sea Basin. Irrigation and Drainage Systems 21 (3-4):219–236
Ibrakhimov M, Park SJ and Vlek PLG (2004) Development of groundwater salinity in a region of the lower Amu-Darya River, Khorezm, Uzbekistan Agriculture in Central Asia: Research for Development Proceedings of a Symposium held at the American Society of Agronomy Annual Meeting at Indianapolis, Indiana, USA, 10-14 Nov International Centre for Agricultural Research in the Dry Areas (ICARDA), Aleppo, Syria, pp 56-75
Isfan D (1990) Nitrogen physiological efficiency index in some selected spring barley cultivars. Journal of Plant Nutrition 13:907–914

References
153
Ishaq M, Ibrahim M and Lal R (2001) Tillage effect on nutrient uptake by wheat and cotton as influenced by fertilizer rate. Soil and Tillage Research 62:41–53
Jalota SK and Arora VK (2002) Model-based assessment of water balance components under different cropping systems in North-West India. Agricultural Water Management 57:75–87
Jat ML, Chandna P, Gupta R, Sharma SK and Gill MA (2006) Laser land leveling: A precursor technology for resource conservation Rice-wheat consortium technical bulletin series 7 New Delhi, India: Rice-Wheat Consortium for the Indo-Gangetic Plains, p 48
Jat ML, Pal SS, Subba Rao AVM and Sharma SK (2003) Improving resource use efficiency in wheat through laser land leveling in an ustochrept of Indo-Gangetic plain. In: National Seminar on Developments in Soil Science, 68th Annual Convention of the Indian Society of Soil Science, November 4-8, CSAUAT, Kanpur (UP)
Jaynes DB, Colvin TS, Karlen DL, Gambardella CA and Meek DW (2001) Nitrate loss in sub-surface drainage as affected by nitrogen fertilizer rate. J Environ Qual 30: 1305–1314
Karlen RL (1990) Conservation tillage research needs. Journal of Soil and Water Conservation 45:365–369
Keeling WJ, Segarra E and Abernathy JR (1989) Evaluation of conservation tillage systems for cotton on the Texas Southern High Plains. Journal of Production Agriculture 2:269–273
Khadjiyev TK (1998) Fertilizer-nitrogen transformation and ecological basics of increasing its efficiency in irrigated soils of sierozem belt (Habilitation, in Russian) Extended abstract Dissertation, Uzbekistan Committee on Soil Resources, Cadaster and Bonitet, p 49
Khaleque M, Paul N and Meisner C (2008) Yield and N use efficiency of wheat as influenced by bed planting and N application Bangladesh. Journal of Agricultural Research 33(3):439–448
Khamzina A (2006) The assessment of tree species and irrigation techniques for afforestation of degraded agricultural landscapes in Khorezm, Uzbekistan, Aral Sea Basin Dissertation, ZEF/Rheinische Friedrich-Wilhelms-Universität Bonn
Khorezm Regional Department of Statistics (2009) Agricultural Indicators for Khorezm Oblast, OblStat: Urgench, Uzbekistan
Kienzler K (2010) Improving the nitrogen use efficiency and crop quality in the Khorezm region, Uzbekistan Dissertation, ZEF/Rheinische Friedrich-Wilhelms-Universität Bonn
Kottek M, Grieser J, Beck C, Rudolf B and Rubel F (2006) World map of Köppen Geiger climate classification. http://koeppen-geigervu-wienacat/. Cited 22 Sept 2009
Kraatz DF and Mahajan JK (1975) Small hydraulic structures FAO irrigation and drainage paper 26/2 FAO, Rome, p 198

References
154
Krupnik TJ, Six J, Ladha JK, Paine MJ and van Kessel C (2004) An assessment of fertilizer nitrogen recovery efficiency by grain crops. In: Mosier AR, Syres JK and Freney JR (eds) Agriculture and nitrogen cycle Assessing the impact of fertilizer use on food production and the environment SCOPE, Island Press, Washington, Covelo, London, pp 193–207
Lal R, Reicosky DC and Hanson JD (2007) Evolution of the plow over 10,000 years and the rationale for no-till farming. Soil and Tillage Research 93 (1):1–12
Latiri-Souki K, Nortcliff S and DW Lawlor (1998) Nitrogen fertilizer can increase dry matter, grain production and radiation and water use efficiencies for durum wheat under semi-arid conditions. European Journal of Agronomy 9:21–34
Li X and Zhang Z (1999) Effect of straw mulching on soil water and salt movement. Chinese Journal of Soil Science 30:257–258
Li X, Zhang Z, Liu X and Li Y (2000) Effect of straw mulching on soil water and salt moving. Journal of Shandong Agricultural University 31 (1):38–40
Limon-Ortega A, Sayre KD and Francis CA (2000) Wheat and maize yields in response to straw management and nitrogen under a bed planting system. Agron J 92:295–302
Limon-Ortega A, Sayre KD and Francis CA (2000) Wheat nitrogen use efficiency in a bed planting system in Northwest Mexico. Agron J 92:303–308
Liu X, Ju X, Zhang F, Pan J and Christie P (2003) Nitrogen dynamics and budgets in a winter wheat–maize cropping system in the North China Plain. Field Crops Research 83:111–124
Lopez MV, Sabre M, Gracia R, Arrue JL and Gomes L (1998) Tillage effects on soil surface conditions and dust emission by wind erosion in semiarid Aragon NE Spain. Soil and Tillage Research 45:91–105
Lopez-Bellido L, Fuentes M, Castillo J E, Lopez-Garrido FJ and Fernandez EJ (1996) Long-term tillage, crop rotation, and nitrogen fertilizer effects on wheat yield under rainfed Mediterranean conditions. Agron J 88:783–791
Lopez-Bellido RJ and Lopez-Bellido L (2001) Efficiency of nitrogen in wheat under Mediterranen conditions: effect of tillage, crop rotation and N fertilization. Field Crop Research 71:31–46
Maas EV and Grattan SR (1999) Crop yields as affected by salinity. In: Skaggs RW and van Schilfgaarde J (eds) Agricultural Drainage. Agron Monograph 38 ASA, CSSA, SSA, Madison, pp 55–108
Mahmood T, Ali R, Iqbal J and Robab U (2008) Nitrous oxide emission from an irrigated cotton field under semiarid subtropical conditions. Biology and Fertility of Soils 44 (5):773–781
Mallik RK, Yadav A and Singh S (2005) Resource conservation technologies in rice-wheat cropping system of Indo-Gangetic plains. In: Abrol IP, Gupta RK and Malik RK (eds) Conservation agriculture: Status and prospects Centre for advancement of sustainable agriculture, New Delhi, pp 13–23

References
155
Malpassi RN, Kaspar TC, Parkin TB, Cambardella CA and Nubel NA (2000) Oat and rye root decomposition effects on nitrogen mineralization. Soil Sci Soc Am J 64:208–215
Mann RA, Ramzan M and Munir A (2008) Improving the sustainability of wheat production in irrigated areas of Punjab, Pakistan through conservation tillage technology. International Journal of Agriculture and Biology 10 (3):249–254
MAWR (2000) Agrotechnology of cereal production in irrigated and non-irrigated areas (in Russian). HAYOT, Andijan, Uzbekistan, p 46
McConkey BG, Curtin D, Campbell CA, Brandt SA and Selles F (2002) Crop and soil nitrogen status of tilled and no-tillage systems in semi-arid regions of Saskatchewan. Canadian Journal of Soil Science 82:489-498
McFarland ML, Hons FM and Saladino VA (1991) Effects of furrow diking and tillage on corn grain yield and nitrogen accumulation. Agron J 83:382–386
Meiri A and Plaut Z (1985) Crop production and management under saline conditions. Plant and Soil 89:253–271
Metha SL and Bandyopadnyay A (2004) Sustainable agriculture farming system and natural resources. In: Sundaram KV, Moni M, and Jha M (eds) Natural resource management and livelihood security survival strategies and sustainable polices Bhoovigyan Vikas Foundation Ashok Kumar Mittal, concept publishing company, A/15-16, commercial Block Mohan Garden, p 210
Minhas PS (1996) Saline water management for irrigation in India. Agricultural Water Management 30:1–2
Minhas PS (1998) Crop production in saline soils. In: Tyagi NK and Minhas PS (eds) Agricultural Salinity Management in India. Central Soil Salinity Research Institute (CSSRI), Karnal, India, pp 325–350
Müller M (2006) A general equilibrium approach to modeling water and land use reforms in Uzbekistan. Dissertation, ZEF/Rheinische Friedrich-Wilhelms-Universität Bonn
Mulumba LN and Lal R (2008) Mulching effects on selected soil physical properties. Soil and Tillage Research 98:106–111
Nakaseko K, Gotoh K and Sato H (1978) Physiological studies on prolificacy in maize III. The relationships between expression of second ear and some physio-ecological characteristics. Japanese Journal of Crop Science 47 (2):212–220
Nelson DW and Sommers LE (1982) Total carbon, organic carbon and organic matter. In: Page AL (ed) Methods of soil analysis: Part 2 Chemical and microbiological properties. Agron Monograph No 9, ASA and SSSA, Madison, WI, p539–579
Norton ER and Silvertooth JC (2007) Evaluation of added nitrogen interaction effects on recovery efficiency in irrigated cotton. Soil Science 172 (12):983–991
Novoa R and Loomis RS (1981) Nitrogen and plant production. Plant and Soil 58:177–204
Nyakatawa EZ and Reddy KC (2000) Tillage, cover cropping, and poultry litter effects on cotton: germination and seedling growth. Agron J 92:992–999

References
156
Nyakatawa EZ, Reddy KC and Mays DA (2000) Tillage, cover cropping, and poultry litter effects on cotton II Growth and yield parameters. Agron J 92: 1000–1007
Ochs WJ and Smedema LK (1996) Planning for drainage development in the Aral Sea basin. In: Bos MG (ed) The inter-relationship between irrigation, drainage and the environment in the Aral Sea Basin. Proceedings of the NATO advanced research workshop on drainage and development in arid zones. Kluwer Academic Publisher, the Netherlands, pp 28-29
Olsen SR and Sommers LE (1982) Phosphorus. In: Page AL (ed) Methods of soil analysis: Part 2 Chemical and microbiological properties. 2nd edition, Agron Monograph Number 9, ASA and SSSA, Madison, WI, p 403–430
Omonode RA, Gal A, Stott DE, Abney TS and Vyn TJ (2006) Short-term versus continuous chisel and no-till effects on soil carbon and nitrogen. Soil Sci Soc Am J 70:419–425
Palta JA and Fillery RP (1995) N application enhances remobilization and reduces losses of pre-anthesis N in wheat grown on a duplex soil. Australian Journal of Agricultural Research 46:519–531
Pang H (1999) The effect of straw mulching on the soil environment and wheat yield traits. Chinese Journal of Soil Science 30:174–175
Pang H and Xu F (1998) Study on the tillage methods under straw mulching in Weibei Arid Area. Res Agric Mod 19:249–251
Pang HC, Li YY, Yang JS and Liang YS (2009) Effect of brackish water irrigation and straw mulching on soil salinity and crop yields under monsoonal climatic conditions. Agricultural Water Management 97 (12-15):1971–1977
Patni NK, Masse L and Jui PY (1998) Groundwater quality under conventional and no-tillage: I Nitrate, electrical conductivity, and pH. J Environ Qual 27:869–877
Paxton KW, Boquet DJ and Hutchinson RL (2001) An economic analysis of best management practice adoption by Louisiana cotton producers. In: Proceedings of the Beltwide Cotton Conference, Anaheim, CA, January 9–13 National Cotton Council, Memphis, TN, pp 193–195
Peng S and Cassman KG (1998) Upper tresholds of nitrogen uptake rates and associated N fertilizer efficiencies in irrigated rice. Agron J 90:178–185
Pettigrew WT and Jones MA (2001) Cotton growth under no-till production in the lower Mississippi River Valley alluvial flood plain. Agron J 93:1398–1404
Power JF and Peterson GA (1998) Nitrogen transformations, utilization, and conservation as affected by fallow tillage method. Soil and Tillage Research 49:37–47
Qiao H, Liu X, Li W, Huang W, Li C and Li Z (2006) Effect of deep straw mulching on soil water and salt movement and wheat growth. Chinese Journal of Soil Science 37 (5):885–889
Randall GW and Bandel VA (1991) Overview of nitrogen management for conservation tillage systems: An overview. In: Logan et al (ed) Effects of conservation tillage on groundwater quality, nitrogen and pesticides. Lewis Publication Chelsea, MI, pp 39–63

References
157
Raun WR and Johnson GV (1999) Improving nitrogen use efficiency for cereal production. Agron J 91 (3):357–363
Rautaray SK (2005) Machinery for conservation agriculture: Progress and Needs. In: Abrol IP, Gupta RK and Malik RK (eds) Conservation agriculture: Status and prospects Centre for Advancement of Sustainable Agriculture, New Delhi, p 43
Rawson, HM and Macpherson H G (2000). Irrigated Wheat: Managing your crop. Rome: FAO
Razzouk S and Whittington WJ (1991) Effects of salinity on cotton yield and quality. Field Crops Research 26(3-4):305–314
Reeves DW, Wood CW and Touchton JT (1993) Timing nitrogen applications for corn in a winter legume conservation-tillage system. Agron J 85:98–106
Reiter MS, Reeves DW, Burmester CH and Torbert HA (2008) Cotton nitrogen management in a high-residue conservation system: cover crop fertilization. Soil Sci Soc Am J 72:1321–1329
Rhoades JD (1999) Use of saline drainage water for irrigation. In: Skaggs RW and van Schilfgaarde J (eds) Agricultural Drainage American Society of Agronomy (ASA)–Crop Science Society of America (CSSA)–Soil Science Society of America (SSSA), Madison, Wisconsin, USA, pp 615–657
Rhoades JD, Chanduvi F and Lesch S (1999) Soil salinity assessment: Methods and interpretation of electrical conductivity measurements. FAO, Irrigation and Drainage Paper 57 FAO, Rome
Rhoades JD, Kandiah A, Mashali AM (1992) The use of saline waters for crop production. In: FAO Irrigation and Drainage Paper No 48 FAO, Rome
Rice CW and Smith MS (1982) Denitrification in no-till and plowed soils. Soil Sci Soc Am J 46:1168-1173
Rochester IJ, Constable GA and Saffigna PG (1997) Retention of cotton stubble enhances N fertilizer recovery and lint yield of irrigated cotton. Soil and Tillage Research 41:75-86
Rochester IJ, Peoples MB, Hulugalle NR, Gault RR and Constable GA (2001) Using legumes to enhance nitrogen fertility and improve soil condition in cotton cropping systems. Field Crops Research 70:27–41
Rudenko I, Lamer JPA (2006) The comparative advantages of the present and future payment structure for agricultural producers in Uzbekistan. Central Asian Journal of Management, Economics and Social Research 2(1-2):106-125
Sainju UM, Lenssen AW, Caesar-TonThat T and Evans RG (2009) Dryland crop yields and soil organic matter as Influenced by long-term tillage and cropping sequence. Agron J 101(2):243–251
Sainju UM, Schomberg HH, Singh BP, Whitehead WF, Tillman PG and Lachnicht-Weyers SL (2007) Cover crop effect on soil carbon fractions under conservation tillage cotton. Soil and Tillage Research 96:205–218

References
158
Sainju UM, Singh BP and Whitehead WF (2005) Tillage, cover crops, and nitrogen fertilization effects on cotton and sorghum root biomass, carbon, and nitrogen. Agron J 97:1279–1290
Sainju UM, Singh BP, Whitehead WF and Wang S (2006) Carbon supply and storage in tilled and non-tilled soils as influenced by cover crops and nitrogen fertilization. J Environ Qual 35:1507–1517
Salinas-Garcia JR, Baez-Gonzalez AD, Tiscareno-Lopem M and Rosales-Robles C (2001) Residue removal and tillage interaction effects on soil properties under rain-fed corn production in Central Mexico. Soil and Tillage Research 59:67-79
Sauer TJ, Hatfield JL and Prueger JH (1996) Corn residue age and placement effects on evaporation and thermal regime. Soil Sci Soc Am J 60:1558–1564
Sayre K (2007) Conservation agriculture for irrigated agriculture in Asia. In: Lal et al. (eds) Climate change and terrestrial carbon sequestration in central Asia. Taylor and Francis/Balkema, the Netherlands pp 211-242
Sayre K and Hobbs P (2004) The raised-bed system of cultivation for irrigated production conditions. In: Lal R, Hobbs P, Uphoff N and Hansen DO (eds) Sustainable agriculture and the Rice-Wheat system. Ohio State University, Columbia, Ohio, USA, pp 337-355
Sayre KD (2004) Raised-bed cultivation. In: Lal R (ed) Encyclopedia of Soil Science. Marcel Dekker Inc, (eBook Site Online publication). Cited 03 March 2008
Scheer C (2008) Biosphere-atmosphere-exchange of C and N trace gases and microbial N turnover processes in irrigated agricultural systems of the Aral Sea Basin, Uzbekistan. Dissertation, ZEF/Rheinische Friedrich-Wilhelms-Universität Bonn
Scheer C, Wassmann R, Kinzler K, Ibragimov N and Eschanov R (2008) Nitrous oxide emissions from fertilized, irrigated cotton (Gossypium hirsutum L.) in the Aral Sea Basin, Uzbekistan: Influence of nitrogen applications and irrigation practices. Soil Biology and Biochemistry 40:290–301
Scheer C, Wassmann R, Butterbach-Bahl K, Lamers JPA and Martius C (2009) The relationship between N2O, NO, and N2 fluxes from fertilized and irrigated dryland soils of the Aral Sea basin, Uzbekistan. Plant and Soil 324:273–283
Schertz D L and Kemper WD (1994) Report on field review of no-till cotton. Huntsville, AL, 22–23 Sept, USDA/ARS/NRCS/Auburn University/Alabama A and M University, Normal, AL
Schwab EB, Reeves DW, Burmester CH and Raper RL (2002) Conservation tillage systems for cotton in the Tennessee Valley. Soil Sci Soc Am J 66:569–577
Scotter DR (1978) Preferential solute movement through larger soil voids I Some computations using simple theory. Australian Journal of Soil Research 16:257–267
Shennan C (1992) Cover crops, N cycling and soil properties in semi-irrigated vegetable production systems. Hort Science 27:749–754
Shipley PR, Meisinger JJ and Decker AM (1992) Conserving residual corn fertilizer nitrogen with winter cover crops. Agron J 84:869–876

References
159
Silber J (1913) Die kolorimetrische Bestimmung der Salpetersäure in Wasser. Zeitschr. f.Untersuchung d. Nahr.-u. Genußmittel: 282-286
Smart JR and Bradford JM (1999) Conservation tillage with roundup can decrease cotton production costs. In: Proceedings of the Beltwide Cotton Conference, Orlando, FL, and January 3–7 National Cotton Council, Memphis, TN, pp 735–738
Staver KW and Brinsfield RB (1998) Using cereal grain winter cover crops to reduce groundwater nitrate contamination in the mid-Atlantic coastal plain. Journal of Soil and Water Conservation 53(3):230–240
Tian K and Lei Y (1994) Integrated effect of water, fertilize and salinity on the wheat yield in desalinized fluvo-aquic soil in Heilonggang Region. Res Agric Mod 15:364–368
Timsina J, Singh U, Badaruddin M, Meisner C and Amin MR (2001) Cultivar, nitrogen, and water effects on productivity, and nitrogen use efficiency and balance for rice-wheat sequences of Bangladesh. Field Crops Research 72:143–161
Toderich K, Ismail S, Massino I, Wilhelm M, Yusupov S, Kuliev T and Ruziev S (2009). Extent of salt-affected land in Central Asia: Biosaline agriculture and utilization of the salt-affected resources. In: Advances in assessment and monitoring of salinization and status of biosaline agriculture. Reports of expert consultation held in Dubai, United Arab Emirates, 26-29 Nov. 2007. World Soil Resources Reports No. 104, FAO, Rome, pp 315–342
Torbert HA and Reeves DW (1994) Fertilizer nitrogen requirements for cotton production as affected by tillage and traffic. Soil Sci Soc Am J 58:1416–1423
Torbert HA, Potter KN and Morrison JE (2001) Tillage system, fertilizer nitrogen rate, and timing effect on corn yields in the Texas Blackland Prairie. Agron J 93:1119–1124
Touchton JT, Reeves DW and Wood CW (1995) Fertilizer management In GW Langdale and WC Moldenhauer (eds) Crop residue management to reduce erosion and improve soil quality. USDA Conservation Research Report 39:13–15
Triplett G B, Dabney SM and Siefker JH (1996) Tillage systems for cotton on silty upland soils. Agron J 88:507–512
Tursunov M (2009) Potential of conservation agriculture for irrigated cotton and winter wheat production in Khorezm, Aral Sea Basin. Dissertation, ZEF/Rheinische Friedrich-Wilhelms-Universität Bonn
Tyagi N K (1984) Effect of land surface uniformity on irrigation quality and economic parameters in sodic soils under reclamation. Irrigation Sci 5:151-166
Unger PW, Stewart BA, Parr JF and Singh RP (1991) Crop residue management and tillage methods for conserving soil and water in semi-arid regions. Soil and Tillage Research 20:219-240
Uri N D (1999) Factors affecting the use of conservation tillage in the United States. Water, Air and Soil Pollution 116:621–638
Verachtert E, Govaerts B, Lichter K, Sayre K, Ceballos-Ramirez J, Luna-Guido M, Deckers J and Dendooven L (2009) Short term changes in dynamics of C and N

References
160
in soil when crops are cultivated on permanent raised beds. Plant and Soil 320 (1):281–293
Verhulst N, Govaerts B, Nelissen V, Sayre KD, Crossa J, Raes D and Deckers J (2011) The effect of tillage, crop rotation and residue management on maize and wheat growth and development evaluated with an optical sensor. Field Crops Research, 120 (1):58-67
Vinogradov S and Langford VPE (2001) Managing trans-boundary water resources in the Aral Sea Basin: In search of a solution. International Journal of Global Environmental Issues 1(3-4):345–362
Vita P De, Di Paolo E, Fecondo G, Di Fonzo N and Pisante M (2007) No-tillage and conventional tillage effects on durum wheat yield, grain quality and soil moisture content in Southern Italy. Soil and Tillage Research 92:69–78
Vlek PLG and Byrnes BH (1986) The Efficacy and Loss of Fertilizer N in Lowland Rice. In: De Datta SK and Patrick WH (eds), Nitrogen Economy in Flooded Rice Soils Martinus Nijhoff Publishers, Dordrecht, the Netherlands, pp 131–148
Vlek PLG and Uzo Mokwunye A (1989) Soil Fertility Problems in the Semiarid Tropics of Africa. In: Christianson CB (ed) Soil Technology and Fertilizer Management in Semi-Arid Tropical India. IFDC Special Publication - 11 Muscle Shoals, Al 35662, USA
Vlek PLG, Fillery IRP and Burford JR (1981) Accession, transformation, and loss of nitrogen in soils of the arid region. Plant and Soil 58 (1-3):133–175
Vlek PLG, Martius C, Wehrheim P, Schoeller-Schletter A and Lamers JPA (2001) Economic restructuring of land and water use in the Region Khorezm (Uzbekistan) (Project Proposal for Phase I). ZEF Work Papers for Sustainable Development in Central Asia, 1 [Online] http://www.khorezm.unibonn.de/downloads/WPs/ZEF-UZ-WP01_proposal.pdf 75 pp
Walter H and Leith H (1967) Klimadiagramm-Weltatlas. 3rd edition Jena, VEB Gustav-Fischer-Verlag
Wang FH, Wang XQ and Sayre KD (2004) Comparison of conventional, flood irrigated, flat planting with furrow irrigated, raised bed planting for winter wheat in China. Field Crops Research 87:35–42
Wang X (2006) Conservation tillage and nutrient management in dryland farming in China. Dissertation, Wageningen University
Wang XB, Cai DX, Hoogmoed WB, Oenema O and Perdok UD (2007) Developments in conservation tillage in rainfed regions of North China. Soil and Tillage Research 93:239–250
Wehrheim P and Martius C (2008) Farmers, cotton, water, and models Introduction and overview. In: Wehrheim P, Schoeller-Schletter A and Martius C (eds) Continuity and change: Land and water use reforms in rural Uzbekistan Socio-economic and legal analyses for the region Khorezm. IAMO, Halle/Saale pp 1-16

References
161
Weinert TL, Pan WL, Moneymaker MR, Santo GS, and Stevens RG (2002) Nitrogen recycling by non-leguminous winter cover crops to reduce leaching in potato rotations. Agron J 94:365–372
Weston LA and Zandstra BH (1989) Transplant age and N and P nutrition effects on growth and yield of tomatoes. Hort Science 24:88–90
Wiatrak PJ, Wright DL, Marois JJ, Koziara W and Pudelko JA (2005) Tillage and nitrogen application impact on cotton following wheat lysimeter results. Agron J 97:288–293
Wright DL, Reed S, Roads FM, and Wiatrak P (1998) Fate of nitrogen on cotton following winter fallow, small grains and legumes in conventional and conservation tillage systems. NFREC Res Rep 98–11 Univ of Florida, Gainesville, FL
Yau SK, Sidahmed M and Haidar M (2010) Conservation versus conventional tillage on performance of three different crops. Agron J 102:269–276
Yuen SH and Pollard AG (1952) The determination of nitrogen in agricultural materials by the Nessler reagent. I: Preparation of the reagent. Journal of the Science of Food and Agriculture 3:441-447
Yuen SH and Pollard AG (1954) Determination of nitrogen in agricultural materials by the Nessler reagent.II: Micro-determinations in plant tissue and in soil extracts. Journal of the Science of Food and Agriculture 5:364-396
Yusuf AA, Iwuafor ENO, Abaidoo RC, Olufajo OO, and Sanginga N (2009) Effect of crop rotation and nitrogen fertilization on yield and nitrogen efficiency in maize in the northern Guinea savanna of Nigeria. African Journal of Agricultural Research 4 (10):913–921
Zadoks JC, Chang TT and CF Zonzak (1974) A decimal code for the growth stages of cereals. Weed Research 56:309-314
ZEF (2001) Project proposal Economic and ecological restructuring of land- and water use in the region Khorezm (Uzbekistan): A pilot project in development research Bonn, Germany, Center for Development Research (ZEF)
Zhang HJ, Dong HZ, Shi YJ, Chen SY and Zhu YH (2007) Transformation of cotton (Gossypium hirsutum) with AbCMO gene and the expression of salinity tolerance. Acta Agronomica Sinica 33:1073–1078
Zhu JK (2001) Over expression of a delta-pyrroline-5-carboxylate synthetase gene and analysis of tolerance to water and salt stress in transgenic rice. Trends in Plant Science 6:66–72

Appendices
162
9 APPENDICES
Appendix 9.1: Field layout cotton/wheat/maize system showing the sampling points for salinity dynamics under conventional and conservation agriculture practices with replication.
11 m 6m Plot broder
50
m RH N-0 2 m
RR N-250
RR N-125
RH N-250
RR N-0RH N-
125RH N-0
RH N-125
RR N-250
RH N-250
RR N-0 RR N-
125 Rep
- I
4m (Distance between replication)
RR N-125
RH N-125
RR N-250
RR N-0
RH N-0
RH N-250
RR N-125
RR N-250
RH N-0
RH N-250
RH N-125
RR N-0
Rep
- I
I
4m (Distance between replication)
RH N-125
RR N-125
RH N-0
RH N-250
RR N-0
RR N-250
RH N-250
RR N-0
RH N-0
RR N-125
RH N-125
RR N-250
Rep
- I
II
4m (Distance between replication)
50
m RR N-0
RH N-0
RH N-125
RR N-250
RH N-250
RR N-125
RH N-125
RR N-0
RR N-125
RH N-0
RR N-250
RH N-250
Rep
- I
V
11 m 6m Plot broder
R5
R1
R2
R5
R6
R3
R4
R1
R2
R6
R5
R4
R3
R6
R4
R3
R1
R2
Note: Shaded area represents the bed planting area. RR-Residue retention, RH-residue harvest, shaded area represents bed planting. Bed planting with RR (▼), bed planting with RH (□) and conventional practice (○)
Appendix 9.2: Irrigation treatments allocated in each replication in raised beds. The arrows denote the bed where soil samples were taken and also the dotted furrow denotes the irrigated furrow.
Every-furrow irrigation Permanent skip furrow Alternate skip furrow
. . .. .. .. .. . .
.. . .
...... .
.. .. .
.
. . .. .. .. .. . .
.. . .
...... .
.. .. .
.
. . .. .. .. .. . .
.. . .
...... .
.. .. .
.
. . .. .. .. .. . .
.. . .
...... .
.. .. .
.
. . .. .. .. .. . .
.. . .
...... .
.. .. .
.
. . .. .. .. .. . .
.. . .
...... .
.. .. .
.
. . .. .. .. .. . .
.. . .
...... .
.. .. .
.

Appendices
163
Appendix 9.3: Analysis of variance of soil salinity distribution before leaching as affected by irrigation method, position of the beds during 2008 and 2009.
Source of variation df 15 cm 30 cm 45 cm 60 cm 75 cm 90 cm 2008Treatment 2 <.001 0.2 <.001 <.001 <.001 <.001 position 6 0.01 0.1 0.008 0.2 0.004 0.4 Position x treatment 12 <.001 0.5 0.6 0.5 0.4 0.5 2009 Treatment 2 <.001 0.3 <.001 <.001 <.001 <.001 position 6 0.01 0.3 0.008 0.2 0.004 0.7 Position x treatment 12 <.001 0.7 0.9 0.9 0.6 0.8
Appendix 9.4: Analysis of variance of soil salinity distribution after leaching as affected by irrigation method, position of the beds during 2008 and 2009.
Source of variation df 15 cm 30 cm 45 cm 60 cm 75 cm 90 cm 2008
Treatment 2 0.04 0.9 0.5 0.5 0.03 0.4 position 6 0.003 0.5 0.2 0.2 0.5 0.9 Position x treatment 12 0.01 0.3 0.7 0.8 0.9 0.8 2009 Treatment 2 0.01 0.04 0.7 0.1 0.2 0.01 position 6 0.1 0.7 0.3 0.09 0.03 0.1 Position x treatment 12 0.1 0.7 0.03 0.5 0.3 0.6

ACKNOWLEDGEMENTS
I would like to express my greatest gratitude to all those who have contributed directly and indirectly to this study. My sincere gratitude goes to my first supervisor PD Dr. Christopher Martius for his guidance, valuable advice and continued encouragement and support throughout the entire study, and his detailed review of my thesis. I would also like to thank Prof. Dr. Paul Vlek for his critical and constructive comments and suggestions and advice through out the various stages of my research work and write-up. Further, my sincere thanks go to Dr. John P.A. Lamers for his valuable advice, continued support and encouragement during the field research as well as for his detailed review of my thesis.
I wish to thank the ZEF doctoral program administration, especially Dr. Günter Manske, for the administrative and technical support during my stay in Germany. Special thanks go to Mrs. Rosemarie Zabel for her invaluable support, which made my stay in Germany very pleasant. I wish to thank the ZEFc and Khorezm project team in Bonn for providing the good working environment and technical support. I would also like to thank Guido Lüchters for his guidance in the statistical analysis. The ZEF staff and PhD students in all departments are thanked for their valuable discussions and warm friendship and support.
Special thanks go to Dr. Oybek Egamberdiev, Prof. Dr. Nazar Ibragimov, and the conservation agriculture team for the setup of the experiment and for their guidance and help during field work. My warmest thanks go to Dr. Ken D. Sayre and Dr. Raj Gupta for their invaluable suggestions and encouragement during the field experiments. I would like to express my special thanks to a team of student assistants from the Urgench State University, and a farmer’s family especially Gulbakhar who helped me with the field management, sampling and measurements and laboratory work. I would also like to thank the drivers in the Khorezm project, especially Maksud Yusupov, for their patience. My warmest thanks go to Dr. Kirsten Kienzler who helped me during proposal writing and with other technical suggestions and constant encouragement. I am also deeply thankful to all Khorezm project staff, who provided great help and often wonderful company. Special thanks to Liliana Sin and Natasha Shermetova for their good management of my stay in Uzbekistan and help with the visa process. Many thanks go to Tjotij Galya for the good food in Urgench.
I am also very grateful to Dr. Ahmad Manschadi, Dr. Bernhard Tischbein, Dr. Akmal Akramkhanov, Prof. Dr. Asia Khamzina, Dr. Hayot Ibrakhimov, Dr. Jumanazar Ruzimov, and Dr. Anna-Katharina Hornidge for their support and suggestions. I would like to thank Ms. Guzal Matniyazova for translating the abstract in to Russian.
I would like to thank the Cotton Research Station staff for providing the research site, office space and technical suggestions.
This work would not have been possible without the PhD grand from DAAD (German Academic Exchange Service) and research funds from the German Ministry for Education and Research (BMBF). I thank them for their financial support. Last but not least, my greatest gratitude goes to my parents, brother Bharat Wasti, parents-in-law and all family members for their continued support, and to my husband Krishna Devkota for his invaluable support and encouragement during the

entire study period. Special thanks go to my beloved daughter Arminda Devkota and son Aabiskar Devkota for their patience and understanding.