Embed Size (px)
Citation preview

Deep-Sea Research, Vol. 35, No. 7, pp. 1127-1142, 1988. 0198-0149/88 $3.00 + 0,00 Printed in Great Britain. © 1988 Pergamon Press plc.
Nitrification and nitric oxide in the oxygen minimum of the eastern tropical North Pacific
B. B. WARD* and O. C. ZAFIRIOUt
(Received 30 April 1987; in revised form 20 November 1987; accepted 3 February 1988)
Abstract--Ammonium oxidation rates (VNH), nitric oxide concentrations [NO], and NO formation rates (VNo) were measured below t~e euphoric zone off Baja California. Vertically integrated nitrification rates were 1.1-2.7 mmol N m -2 d -I, compared with VERTEX estimates (in a less productive nearby region) of 0.56 mmol m -2 cl 1 for the loss of sinking organic N between 100 and 2000 m. Integrated ammonium oxidation rates thus may provide valid indepen- dent estimates of organic N recycling.
NO was detected at picomolar levels in the water column at oxygen concentrations between 0 and 100 pM. Many samples actively generated NO, which required an in situ source, and yielded flux estimates. A crude estimate of the vertically integrated NO flux for the region, 0.19 mmol N m -2 d -1, is 13% of the average integrated nitrification flux, suggesting the NO plays a significant role as an intermediate product in the nitrogen cycle.
Most NO and NO production were found in the region of active nitrification outside the zone of active denitrification. However, VNH4 and VNo are interrelated in a complex way that suggests, but does not prove, a link between the two. NO may arise in part from an intermediate compound that is filterable through 0.2 Ixm filters, possibly a soluble byproduct of nitrification such as hydroxylamine.
I N T R O D U C T I O N
NITRIFICATION is an essential step in the mar ine ni t rogen cycle, resulting in the net accumulat ion of nitrate in the deep ocean. In addit ion to the principal n i t rogen c o m p o u n d s involved in the sequential oxidat ion of a m m o n i u m to nitrite and of nitrite to nitrate, the t race gases ni trous oxide and nitric oxide (NO) also have been de tec ted as side products or impor tan t in termedia tes of a m m o n i u m oxidat ion in culture studies (GOREAU et al., 1980; LIPSCHULTZ et al., 1981); oxygen concent ra t ion is an impor tan t variable in determining the relative yields of these gaseous products . In aquat ic envi ronments , N O previously has only been repor ted in f jord sediments (SORENSEN, 1978), but recent ly also has been found th roughou t the oxygen min imum zone off Peru (ZAFIRIOU et al., 1980 and in prepara t ion) .
W e repor t here an env i ronmenta l s tudy of the relat ionships a m o n g oxygen concen- t rat ion, nitrification rates, N O concent ra t ion and N O tu rnover rates. Our studies on ni t rogen cycle t ransformat ions were conduc ted in N o v e m b e r - D e c e m b e r 1983 on the R .V. W e c o m a cruise 8311A, at a series o f intensively sampled nearshore stations within the oxygen min i m um region of the eastern tropical N o r t h Pacific Ocean (Fig. 1). These
* Institute of Marine Resources, A-018, Scripps Institution of Oceanography, University of California, San Diego, La Jolla, CA 92093, U.S.A.
t Woods Hole Oceanographic Institution, Woods Hole, MA 02543, U.S.A.
1127

1128 B . B . WARD and O. C. ZAFmlOU
I
Cos Angeles
~ San D/ego
I =
50 ° N
,,,8,1 • /3 7 Moza/Ion
20 °
Ve/-/ex 1T +
~vado/a/dro
Fig. 1.
~ r ~ x +
J contours in meters
i0 o I I I 120°W ILO ° I00 °
Station locations. Stations 5, 9, 10, 11, 13, this study, November 1983; V E R T E X I I and I I I , sites of sampling in November 1981 and October 1982, respectively.
are the first vertically integrated nitrification rate estimates from the deep ocean, and also the first reported NO fluxes and NO data coupled with micro-oxygen data.
The particular objectives of this work were (1) to study nitrification rates as a function of depth and oxygen concentration below the 1% light level, under carefully controlled simulated in situ conditions of light, oxygen and temperature; (2) to detect and characterize further the distribution and possible turnover of the trace gas, NO; (3) to obtain a joint data set on nitrification rates, NO distributions and NO fluxes in order to seek correlations bearing on the hypothesis that nitrification is a major source of NO in the water column, as it appears to be for nitrous oxide (YosHrNAm, 1976; ELKINS et al. , 1978; COHEN and GORDON, 1978, 1979; GOREAU et al. , 1980).
M E T H O D S
Experiments were conducted at a series of stations along the coast of Baja California. Most water column work was done at five stations in the region of 21-25°N (Fig. 1). Nutrient analyses (including ammonium, nitrite and nitrate) on subsamples from Niskin
Nitrification of the North Pacific 1129
casts were performed by autoanalyzer (PAVLOU, 1972) shortly after sample collection. High-precision on-board nitrite analyses were performed manually using the method of BENDSCHNEIDER and RoB~sor~ (1952). Chemical concentrations are presented in terms of molarity (e.g. M or I~M) while rates are reported as mol 1-1 d -1.
Dissolved oxygen subsamples always were taken immediately upon arrival of samples on deck. Oxygen (percent saturation) was measured using an Extech portable oxygen meter (reproducibility about 0.5%) with internal temperature correction. The electrode was mounted in a well-flushed flow cell with stirrer. The 100% value on the electrode was reset occasionally to 100% using air-saturated seawater. The more critical, non-reset- table 0% value was checked using nitrogen-flushed seawater from the NO stripping apparatus (see below); the lowest reading obtained with the electrode under these conditions was about 1.5% saturation. Electrode percent saturation values were con- vetted to oxygen concentration using oxygen solubilities given by RILEY (1975), taking the reversing-thermometer temperature as the sample temperature. Additionally, at low oxygen concentrations (below 15% saturation), we used the colorimetric method of BROENKOW and CLINE (1969) without azide addition or correction for nitrite interference. Where overlap existed, the electrode and chemical values were in reasonably good agreement. Since for our purposes, oxygen vs property correlations are more important than absolute oxygen concentration, we maximized consistency by normalizing the response curve of the oxygen electrode to the chemical results at the low end of the calibration curve. This relatively small adjustment minimized artifacts due to the slight differences between data from the two methods.
15N Tracer experiments
Samples for 15N tracer experiments were collected in 30-1 Niskin bottles equipped with silicone O-rings and Teflon-coated springs maintained in a non-leaking condition. Reversing thermometers were used for depth correction. Incubation experiments were carried out in 4-1 Pyrex bottles covered with light-tight black plastic; the volume of each bottle was known to within 10 ml. In order to preserve as closely as possible the in situ oxygen concentration, incubation bottles were filled and overflowed directly from the Niskins using plastic tubing. The standard tracer addition was designed to increase ambient substrate levels (measured by autoanalyzer; see above) by 0.2 ~tMN [(15NH4)2SO4 or Na15NO2, both 99 atom-%]. In samples where the initial concentration of the product (either NO~ or NO~) was less than 0.2 ~tM, an amount of carrier solution, resulting in an increase of 0.25 laM 14N-product, was added prior to the incubation. After addition of label solution (<1.0 ml, cooled below sample temperature so that it sank and was not displaced by the capping procedure), the bottles were sealed with plastic stoppers and electrical tape and mixed vigorously before being placed in the appropriate incubator (see below). This filling method maintained initial oxygen concentrations inside the bottles (as measured with the oxygen electrode; see above) for more than 24 h. Bottles covered with plastic screening and calibrated with a spherical probe light meter (BiD- spherical Instruments) were used for experiments under simulated in situ light intensity. Surface depths were not sampled at most stations because we were not concerned with the effect of light on nitrification; the inhibition of nitrification in the photic zone is well supported by previous evidence (OLSEN, 1981b; HORRIGAN et al., 1981; WARD et al., 1984; WARD, 1987). It was not possible to incubate all samples at the in situ temperature. Instead, incubators were maintained at two different temperatures between 7 and 14°C,
1130 B.B . WARD and O. C. ZAFIRIOU
and samples were incubated in the one closest to the original ambient temperatures. Shallow samples were usually incubated in running seawater incubators at surface seawater temperature.
Depth profiles. Depth profiles of nitrification rates and NO concentration were obtained by sampling one depth at a time. Incubation samples were obtained from 30-1 Niskins, and NO samples from 10-1 Niskins suspended 7 m above the 30-1 bottle. All 15N incubations were carried out in replicate at in situ oxygen concentration as described above. Incubations were terminated after 24 h by filtration through baked GF/F filters. Filters were dried and stored over desiccant. Filtrates for 15NO~ determination were extracted at sea by procedures described previously (OLSON, 1981a; WARD, 1985). Nitrogen isotope ratios of the extracted compounds and of particulate material on the filters were determined on a JASCO emission spectrometer after combustion using a modified micro-Dumas procedure (BARSDATE and DUGDALE, 1965). The equations of DUGDALE and GOERING (1967) were used for the rate calculations.
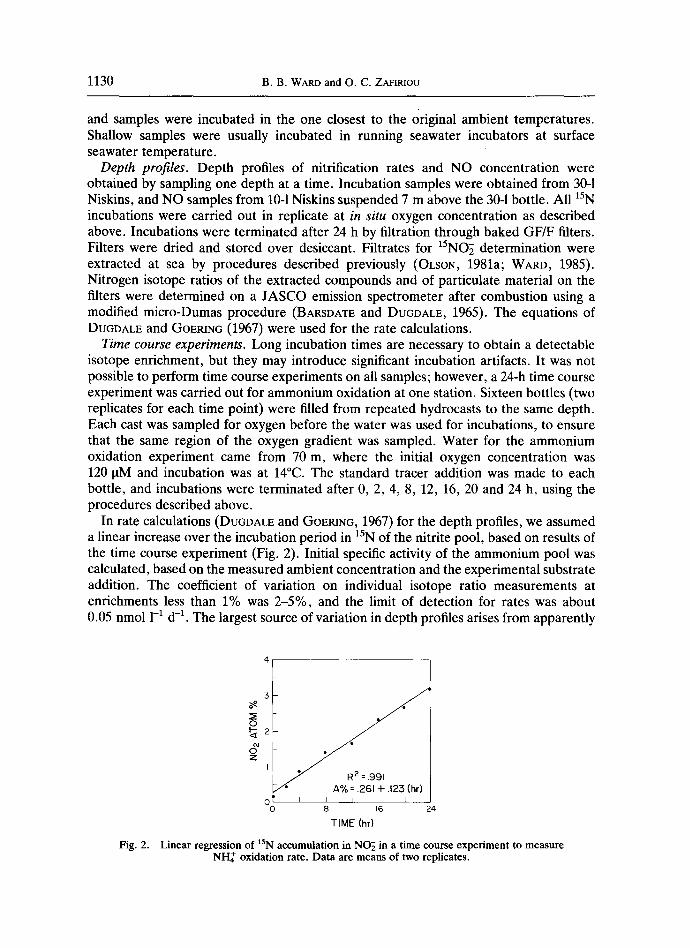
Time course experiments. Long incubation times are necessary to obtain a detectable isotope enrichment, but they may introduce significant incubation artifacts. It was not possible to perform time course experiments on all samples; however, a 24-h time course experiment was carried out for ammonium oxidation at one station. Sixteen bottles (two replicates for each time point) were filled from repeated hydrocasts to the same depth. Each cast was sampled for oxygen before the water was used for incubations, to ensure that the same region of the oxygen gradient was sampled. Water for the ammonium oxidation experiment came from 70 m, where the initial oxygen concentration was 120 oM and incubation was at 14°C. The standard tracer addition was made to each bottle, and incubations were terminated after 0, 2, 4, 8, 12, 16, 20 and 24 h, using the procedures described above.
In rate calculations (DUGDALE and GOERING, 1967) for the depth profiles, we assumed a linear increase over the incubation period in t5N of the nitrite pool, based on results of the time course experiment (Fig. 2). Initial specific activity of the ammonium pool was calculated, based on the measured ambient concentration and the experimental substrate addition. The coefficient of variation on individual isotope ratio measurements at enrichments less than 1% was 2-5%, and the limit of detection for rates was about 0.05 nmol 1-1 d -1. The largest source of variation in depth profiles arises from apparently
Fig. 2.
o ~ 2
I R 2 = .991
A% = .261 + .123 (hr) 0 I I I I I I _ _
0 8 16 24
T IME (hr)
Linear regression of lSN accumulation in NO~ in a time course experiment to measure NI-I2 oxidation rate. Data a r e m e a n s of two replicates.

Nitrification of the North Pacific 1131
random variation between replicate incubation bottles; rates determined from pairs of replicates varied by up to 50% (examples shown in Fig. 5).
NO Sampling. Because all samplers aboard consumed NO, after Sta. 5, NO samples were collected from the three "best" 10-1 Niskin bottles (equipped with Teflon-coated springs) deployed 7 m above the 30-1 samplers to maximize NO-15N data intercompara- bility. Samplers were rinsed with ethanol and soaked with 1 mM "Ultrex" HC1 or 1 mM EDTA in Milli-Q water. Before Sta. 9 and after Sta. 13, these bottles, filled with unreactive aerated "Milli-Q" water, consumed less than 50% per hour of added NO.
To minimize NO loss in bottles and perturbations of NO and oxygen concentrations by atmospheric contact and gas exchange during stripping, samples were transferred as rapidly as possible (for z < 500 m, 7-35 min from closure; average 16 min). Real-time oxygen concentration estimates (see above) were used to determine sample pO2. A gas mixture of this p02 was prepared from high-purity N2 and air by a mass flow controller/ manifold system and used to blanket and strip samples, pO2 changed by no more than 30% relative. A darkened low-permeability 3/8 in. Teflon line transferred water by gravity for rinsing flushes and for analysis into a 1-1 all-glass stripper prefilled with the gas mixture. The stripper (ZAFIRIOU and MCFARLAND, 1980), has an added dip tube for emptying by displacement with gas. Although deck air replaces the water withdrawn from the bottle, the system is closed and positively pressurized from bottle spigot to detector.
NO Analysis and incubations. The sample, surrounded by a gas blanket at ambient pO2, was stripped and the NO was measured with a chemiluminescence-type NO detector (ZAFIRIOU and MCFARLAND, 1980) modified for testing NO selectivity (ZAFIRIOU and TRUE, 1986). After a 3-min strip at 0.5 1 (STP) min -1 (>99% NO removal), the sample was incubated for 7-20 min before restripping to determine NO production by rate of reappearance of NO in the sample. Since grow-in [NO] rarely exceeded 30% of the initial [NO], we report the mean net rate of NO production during the incubation period, VNo.
A few longer incubations showed that samples eventually regenerate [NO] within a factor of two of that found initially, showing that both production and loss processes were operative. The initial strip of very active samples showed a post-peak NO signal that levelled out above baseline, corresponding to the production-removal balance. Flux estimates calculated from these signal magnitudes agreed within 30% with the VNO of the same samples. Successive incubations or incubations of a second aliquot from the same bottle almost always showed 10-50% lower activity after 0.5-1 h. Very active samples, monitored continuously, declined similarly in NO output with time.
NO Calibration, selectivity, blanks, sensitivity, and recovery. The NO detector was calibrated using 1.92 ppmv "Scott" NO/N2 standard dynamically diluted with a mass flow controller system. This calibration is accurate to +20% at trace levels over long time periods. Aqueous standard for spike experiments were prepared by equilibrating 100 ppmv Scott NO/N2 with degasseu Milli-Q water.
All NO peaks were checked by ihe "peak shape test", and about 30% of the samples were evaluated by the kinetic titration method (ZAFIRIOU and TRUE, 1986). None of these tests indicated any interferences by non-NO components.
The system's sensitivity is about 0.5 pM NO (signal-to-noise ratio of 3). A stripper cleaned before each station showed no detectable blank for prestripped Milli-Q water for time delays of up to 1 h. Stripper-induced loss of added NO spikes (400 pM in aerated
1132 B.B. WARD and O. C. ZAFIRIOU
water) was ~<15% per hour. The loss was measured in aerated water (oxygen accelerates losses: ZAFmIOU and MCFARLAND, 1980); stipper blanks were measured in N2-degassed water, favoring sensitivity to artifactual NO sources. Post-station tests, however, twice showed that the stripper became both more reactive and capable of making NO, probably due to surface-active materials and bacterial films. The worst post-station test showed production in deaerated surface water equivalent to VNO = 0.3 nmol 1-1 d -1, and loss of NO spikes (large with respect to the peaks in VNO measurements) of 250% per hour in aerated water. The VNO sensitivity is thus limited by the uncertainty in the closed stripper-blank value, which should not exceed 0.3 nmol 1-1 d -1.
The [NO] error includes loss/contamination effects of sampling/transfer, though it is minimally affected by in-stripper processes due to the short time, about 4 min, from fill to mid-peak. The net effect of bottle storage is loss, as was shown on this and a previous cruise by taking replicate samples from the same or a "twin" bottle, as well as by the spiking experiments. Replicate samples drawn 30-45 min after the first sample showed 0-50% (usually <35%) lower [NO]. Hence 50% loss in the second sample relative to the first is an upper bound on the worst likely loss, because the time difference is similar to the bottle-closure to sample-analysis delay, and air-exchange-induced pO2 rise in the sampler contributes to loss in the second aliquot but not to initial samples.
"Dirty air" NO could add significantly to [NO], especially when stack gases contami- nate deck air. In the stripper these effects are negligible. The amount of NO entering with samples due to bottle outgassing, diffusion through tubing, and bubble inclusion during sample transfer is harder to evaluate. However, we believe that surface waters always are essentially devoid of NO; the highest surface water [NO] we found was 1.5 pM, suggesting that this problem is minor and that the practical sensitivity to NO is 1.5 pM, the maximum blank.
Since the NO analysis is complicated by the near-certainty of losses and the possibility of contamination, we also have examined the data for correlations with likely artifact- related variables. Among samples of similar pO2, there are no trends associated with sample age, bottle used, diesel odor on deck, or time since last stripper cleaning. While some of these factors must contribute to the variability in the parameters measured, they never dominate sufficiently to be detected.
Formation of NO by filtrates. A few of the stronger NO-generating samples were transferred from the stripper to nitrogen-filled bottles and filtered through 0.2 ~tm Nuclepore filters in a nitrogen-filled glovebox in the dark at less than 5 psi pressure differential taking care not to let the filter go to dryness. The filtrate was stripped, then incubated and restripped to measure NO production. Filters were then susper/ded in the pre-stripped filtrate and the mixture stripped, then incubated and restripped.
RESULTS
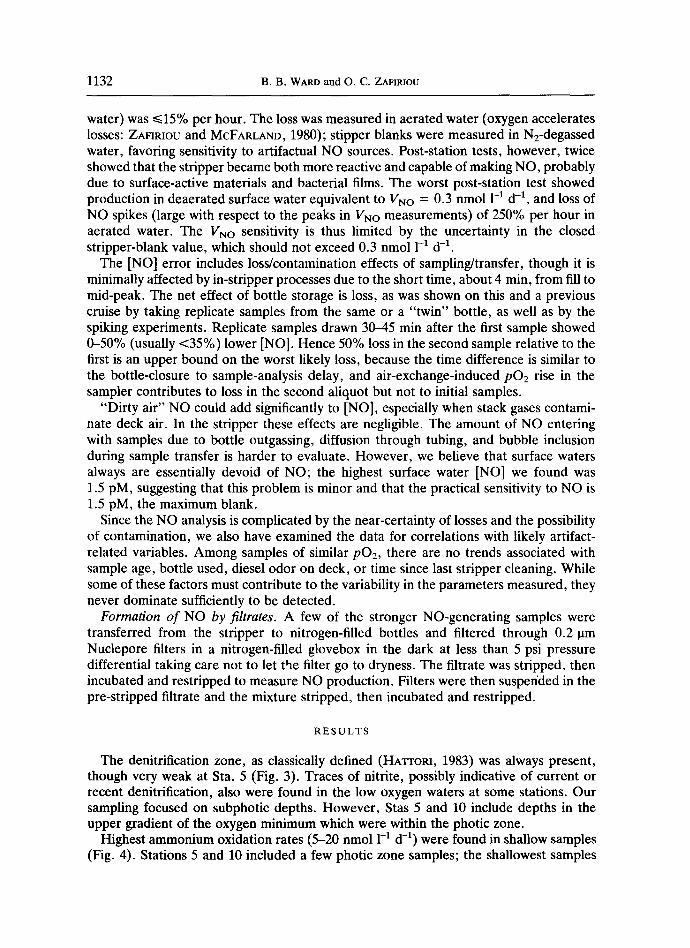
The denitrification zone, as classically defined (HATrORI, 1983) was always present, though very weak at Sta. 5 (Fig. 3). Traces of nitrite, possibly indicative of current or recent denitrification, also were found in the low oxygen waters at some stations. Our sampling focused on subphotic depths. However, Stas 5 and 10 include depths in the upper gradient of the oxygen minimum which were within the photic zone.
Highest ammonium oxidation rates (5-20 nmol 1-1 d -1) were found in shallow samples (Fig. 4). Stations 5 and 10 included a few photic zone samples; the shallowest samples
Nitrification of the North Pacific 1133
500
0 .I .2 .5 .4 .5 i i i 1 i q
O 0 50 IOO 150
4oo L .7"-.
800 Ill
i200 L
1600 20O0
50 i
I000
200 250
~' 5i STA
N O 2 (/xM)
0 .2 .4 .6 i t i
0 z (p.M)
0 (, 50 I00
i O 0 0 - O ~ 2000 ,
5000
1500
2000
2500
I F- (3_
I00 150 200
STA I
.8 1.0 0 .2 .4 .6 .8 1.0 J ~ r - T I --1
Lso _zoo _o 50 ,oo ,5o 20o
°I , ' ' S A,o -
I 0 0 ~ 02
ooLl NO z (,u.M)
o_ .2 ,4 .6 .8 Lo i i
Oz (/xM)
oO 50 I00 150 200
' ~ = ~ ~ 'STA 13
8OO
1200 I I ~
Fig. 3. Depth profiles of NO~ and oxygen concentrations at five stations (see Fig. 1 for station locations). Brackets indicate classical "denitrification" region, i.e. [02] < 10 pro.
were incubated at simulated in situ light intensities. Below the maximum close to the bottom of the photic zone, the ammonium oxidation rate decreased rapidly with depth. This decrease can be approximated best by an exponential curve at some stations and by a power curve at others (Fig. 5a,b). This pattern is consistent with a rapid decrease in ammonium supply with depth, as a result of the rapid decrease in degradable organic material. The analytical fit of the data implies that the distribution of nitrification is predictable and largely dependent upon parameters originating in the surface layer. These profiles include the first data reported from depths below 1000 m. Nitrification was detected as deep as 2500 m at Sta. 11 but was undeteetable (<0.05 nmol 1-1 d -1) at 3500 m at Sta, 9.
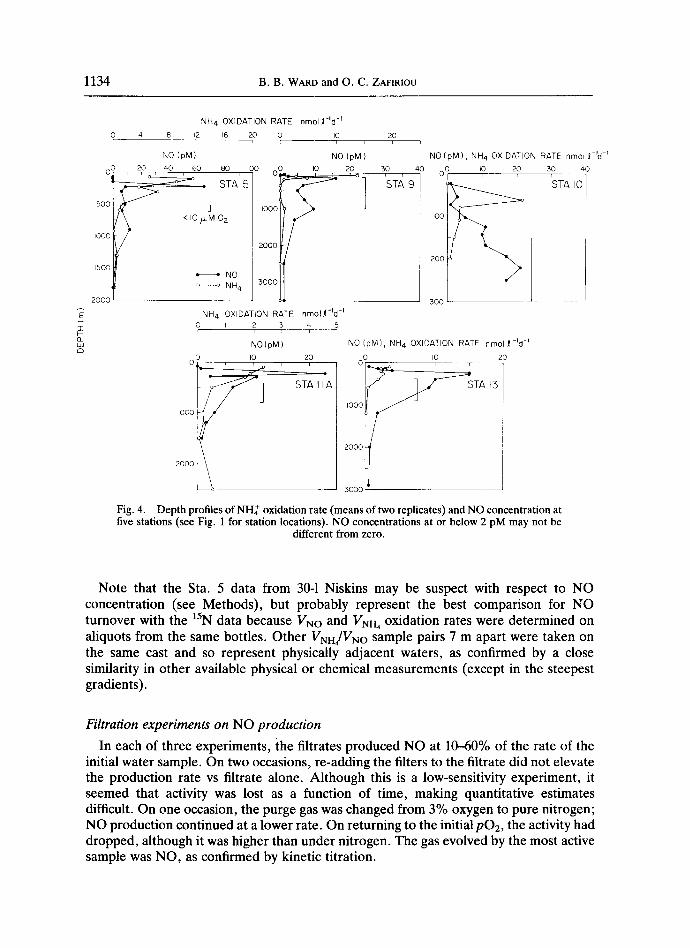
NO concentrations, like ammonium oxidation rates, were generally highest in relati- vely shallow samples (Fig. 4). Although the NO concentration data are considerably less smooth than ammonium oxidation rates, multipoint features occurred consistently and were well above the blanks. In all profiles, the highest NO concentrations were above 500 m and below the ammonium oxidation rate maximum. NO flux, VNo (Fig. 6) showed similar narrow, sharp maxima. MaximumVNo coincided with the depth of maximum NO concentration at three of the five stations, and NO concentration and VNO were well correlated at Stas 10 and 11 for [02] ~ 11 pM (Fig. 7). The ratio VNolVmi, was maximal at the depth of maximum NO concentration at four of the five stations.
1134 B . B . WARD and O. C. ZAFIR1OU
NH4 OXIDATION RATE nmol . l ' ld -r
0 4 8 12 L6 20 0 i
NO (pM l
0 20 40 60 80 I00
STA 5
500 ] I000
<lOcxM 0 2
1000 ~ 2000
1500 ~- -" NO o o NH 4 5000
2000
I0 i
N O ( p M )
I0 20
20
30 40
'ST/~ 9
NH 4 OXIDATION RATE nmol , l - ld -I 0 2 3
NO(pM)
0 I0
iii
4 5 i
2O
STA IIA
N O ( p M ) , NH 4 OXIDATION RATE nmol J~-fd -p
O~ I0 20 50 40
' 'STA I0
200
500
NO (pM) , NH 4 OXIDATION RATE nmol ,~ -~d -r
0 IO 20 o
TAE
I000
2000
3000
Fig. 4. Depth profiles of NH4 ~ oxidation rate (means of two replicates) and NO concentration at five stations (see Fig. 1 for station locations). NO concentrations at or below 2 pM may not be
different from zero.
Note that the Sta. 5 data from 30-1 Niskins may be suspect with respect to NO concentration (see Methods), but probably represent the best comparison for NO turnover with the 15N data because VNO and VNH, oxidation rates were determined on aliquots from the same bottles. Other VNH,/VNO sample pairs 7 m apart were taken on the same cast and so represent physically adjacent waters, as confirmed by a close similarity in other available physical or chemical measurements (except in the steepest gradients).
Filtration experiments on NO production
In each of three experiments, the filtrates produced NO at 10-60% of the rate of the initial water sample. On two occasions, re-adding the filters to the filtrate did not elevate the production rate vs filtrate alone. Although this is a low-sensitivity experiment, it seemed that activity was lost as a function of time, making quantitative estimates difficult. On one occasion, the purge gas was changed from 3% oxygen to pure nitrogen; NO production continued at a lower rate. On returning to the initial pO2, the activity had dropped, although it was higher than under nitrogen. The gas evolved by the most active sample was NO, as confirmed by kinetic titration.

Nitrification of the North Pacific 1135
-r i- n LIJ
(a) NH + OXIDATION RATE nmol.t- ld -I
0 0
500
I000
1500
2000
2500d
3 0 0 0
3500
:3.0 6.0
i /~" EXPO N ENTI AL
m
STA 9
9.0 12.0 15.0 1,51
(b)
o (
250
5OO
750
~_ I000
C21 1250
1500
1750
2000
NH~ OXIDATION RATE nmol ~-Id-I
.5 1.0 1.5 210 2.5 ~.0 3.5 [ i i i [ [ I
POW ,~ ~
/// / / & E X P O N E N T I A L
STA liB
Fig . 5. Analytical curve fitting for NH~ oxidation rate (replicates shown) at two stations. (a ) S ta . 9: e x p o n e n t i a l : V N H 4 = 1 .20 e 1.6oz r = - 0 . 7 6 ; p o w e r = V N H = 208 z ~ ' 85 r = - 0 . 8 5 . (b ) S ta .
- 3 49z 4 l l B : e x p o n e n t i a l : V N H 4 = 5 .35 e " r = - 0 . 9 8 ; p o w e r = V N H 4 = 1 .98 x 1 0 5 z 209
r = - 0 . 9 0 .
D I S C U S S I O N
This study was undertaken to examine ammonium oxidation rates and NO concen- trations and formation rates in an oxygen minimum zone. In particular, we wished to evaluate the hypothesis that nitrification is, or is closely linked to, the source of NO. First, we review the major features of the property distributions, then we present a qualitative conceptual model of their interrelationships, and finally we summarize their implications for the source and significance of NO in the water column.

1136 B.B. WARD and O. C. ZAFnUOU
T I-- Q. W r~
oi
4 0 0
8OO
1200
1600
2 0 0 0
( nmol ,[ - Id - I )
I 2 3 i i i i i i
"] < lOp.M 0 2
4 l i i
STA 5
0 ( I i i i Y'] IOOO
> 1500,
20(90
2 5 0 0
Fig. 6.
C
° I o
I 000
2 0 0 0 I
4
I 1.5
4 i i
STA II
o!
4 0 0
8OO
1200
1600
2 2.5 n i , I 0 ~ I I
I °!i IO0
150
2OO
STA 9 25O
I 3 4 i i i I i i i l
STA 1.5 2OOO
Depth profiles of NO turnover rate (see Fig. 1 for station locations).
2 5 4 i i i i i i i
STA I0
1.0
.8
T
.6
E
o ,4 z
>
.2
o
0 0
0 0
O • STA 10 o STA II •
I I o I o 1 o I 0 20
N O ( p M )
Fig. 7. Scatter plot of NO turnover rate vs NO concentration at two stations. All points except those within the NO concentration maximum are described by the line VNo = 0.068[NO] +
0.0014, r = 0.85.
A m m o n i u m oxidation rates
Although ammonium oxidation rates at relatively shallow depths have been studied fairly intensively (IVhYAZAKI et al. , 1975; OLSON, 1981a; WARD et al. , 1984), few previous workers reported ammonium oxidation in strong oxygen minima (HAsHIMOTO et al., 1983) or covered a sufficient depth range to permit realistic vertical integration. As Fig. 8

Nitrification of the North Pacific 1137
25
T
T
E c
Z o
123
o
Z
2 0 -
1 5 -
I 0 -
5 -
0
< IO~M 02
x 5 O0 o
. I o n ,:7 I ° ~ I 5 0 IOO 150 2 0 0
02 (p.m)
Fig. 8. Scatter plot of NH2 oxidation rate vs oxygen concentration. Region A: photic zone. Region B: values from depths between photic zone and core of oxygen minimum. Region C: depths below the core of the oxygen minimum zone. Station symbols: 5 = n; 9 = X; 10 = +; llA = ©; l lB= ~7; 13 = ~ . The vertical line encloses all samples from the "denitrification"
zone, ~<10 gM 02.
shows, V~-I, decreased with decreasing [02] in the region above the oxygen minimum and below the euphotic zone. Nitrification was detected at low [O2] and continued at a significant rate into the "denitrification zone" ([O2] < 10 ~tM) (HArrORI, 1983) SO long as oxygen was present. Photic zone samples clustered together at high [02] and lower V~H,, compared to samples just below the photic zone (Fig. 8, A). Samples from below the oxygen minimum generally had very low or zero Vsn, (Fig. 8, C). Since little ammonia accumulates in anoxic water, vertical integration of the nitrification rate to depths where it becomes negligible approximates the areal water column nitrification rate. There is some indication that nitrification rates increase again below the denitrifi- cation zone (Fig. 5a), but this must depend on nitrogen supply (ammonium regene- ration).
In Table 1, we present ammonium oxidation rates integrated over depth (below the photic zone, generally beginning at 100 m) for four stations (one replicated) off Baja California. Although more detail, especially near the base of the euphotic zone, would increase the accuracy of the estimates, the results average 1507 Ixmol m -2 d-l; four of the values are extremely similar (1195 _+ 57 lamol m -2 d - l ) . The highest value (2756 ~tmol m -2 d -1) was found at Sta. 5, the station with the weakest oxygen minimum (Fig. 3).
At steady state, integrated nitrification rate represents the net oxidation of organic matter supplied by sinking from the photic zone. The current paradigm of the nitrogen cycle implies that in sufficiently deep water essentially all sinking organic nitrogen will be reoxidized to nitrate within the water column. Nitrogen fluxes were measured during the Vertex II and III experiments (G. A. KNAUER, unpublished data) a few degrees south of

1138 B.B. WARD and O. C. ZAFIRIOU
Table 1. Comparison of rates and fluxes
Depth Organic N interval flux VNH4 VNO
Cruise/Stations* (m) 0tmol m ~ d -1)
5/W8311A 100-1772 9/W8311A 75-3471 11A/W8311A 100-2467 llB/W8311A 130-1774 13/W8311A 95-1181 VERTEX II 100-1950 VERTEX III 100-2000 Average flux
514 609 561
2756 1258 1162 1225 1134
1507 188t
* See Fig. 1 for station locations. t See text for method of calculation.
our study site. Loss of particulate nitrogen in each depth interval between particle interceptor traps below 100 m, attributed to heterotrophic decomposition of sinking material, was calculated from the flux data, and summed over the water column to estimate the organic nitrogen available for ammonification and eventual nitrification (Table 1). The average nitrogen loss for the two Vertex sites was 561 ~tmol m -2 d -1, approximately half the integrated nitrification rate at the group of four similar stations. The most likely reason for the difference between integrated nitrification rates and nitrogen loss estimated from fluxes is that the Vertex stations were less productive; they were several degrees farther from the coast than our stations. In addition, in situ rate measurements and trap fluxes may integrate over a different time scale. Although the number of data suites is limited, the internal consistency of both the flux data and the integrated nitrification values suggests that both measures may be valid estimates of total nitrogen flux and supply below the photic zone.
NO Concentrations
Nitric oxide concentrations were low, always below 10 -1° M, but showed consistent general trends. As found previously off Peru (ZAFIRIOU, personal communication), where [NO] ranged from 0 to 400 x 10 -12 M, NO was never present in fully oxygenated water either at the surface or beneath the oxygen minimum. Its distribution in the oxygen minimum, while not uniform, showed highest values and highest variability at inter- mediate oxygen concentrations and in the upper water column (Figs 6 and 9). NO was also present in some samples with very low oxygen concentrations. Since NO almost certainly undergoes rapid (minutes-hours) turnover in some regions of the water column, its distribution would be expected to be highly variable in space and time, reflecting variations in localized sources and sinks. Although the existing data and methodology are sufficient to show this general picture, further improvements in controlling NO losses or in situ analysis would be required to elucidate the detailed cycle of NO in these waters. As discussed below, the presumably more accurate flux data suggest that NO has a biogeochemical significance commensurate with such efforts, despite its low concentrations.
Although further observations are needed in weaker oxygen minima, NO has not yet been found at [02] > 100 ~tM, suggesting that it is probably undetectable in the more typical oxygen minimum regions of the world ocean (i.e. where [02] is rarely <100 laM).

Nitrification o f the North Pacific 1139
too STA 5 I-i STA 9 [ STA I0
o - ?""..-- ~ ~ o %,,. I00 2"00 I00 200 iO0 ~00
I STA I IA STA L5
2 0 ~- 20 20
I 0 ~ " 0 7 I0 I0
0 L- 0 0 o
O2(t~M)
Fig. 9. [NO] (---0"--) and NO turnover (---~---) vs oxygen concentration for each station (see Fig. 1 for station locations).
NO Fluxes
On this cruise we modified methods to strip NO without perturbing [02] greatly, thus obtaining the first estimates of NO fluxes in short-term incubations. The flux measure- ments, which vary widely but tend to occur at similar maximum levels throughout the upper oxycline, establish important points about the NO cycle. First, they demonstrate an in situ source. The strength of the source has a distribution in relation to oxygen concentration similar to the distribution of NO concentration (Fig. 9). Second, by dividing [NO] by Vyo, we can derive a turnover time. This time varies for the total data set from zero to immeasurably long, but the median value is 20 min, and most are in the range 1-300 min. This fast turnover demands an in situ source (as found). The very short timescale is consistent with the high variability of the NO data. In some sample suites, there was a close relationship between NO flux and concentration, implying a constant turnover time and hence (assuming steady state) that the first-order rate constant for NO loss within that suite was invariant (Fig. 7, [02] < 11 ~tM). Third, the flux data imply that despite its low concentration, NO is associated with biogeochemically significant fluxes. For samples at intermediate oxygen levels, 10-100 I~M [O2], (where for the moment we ignore the possibility of a denitrification source), three of 12 NO/nitrite production ratios were above unity. For the remaining nine values, X = 0.139 + 0.17.
These data also can be averaged and vertically integrated to show that the NO flux is large enough to be a significant portion of the local nitrogen cycle. As the data are too sparse and variable to warrant estimates for each station, we have averaged the data from Stas 5, 7, 9, 10 and 11 as follows. Individual VNo values were averaged as a function of oxygen concentration ranges (0-6, 6-12, 12-24, 24-48, 48-96 ~tM), and water mass depth intervals corresponding to these oxygen ranges (above 1200 m) also were made. Then

1140 B . B . WARD and O. C. Z a _ ~ o u
the average rates were multiplied by the corresponding average depth intervals and summed. The result, 188 lxmol N m -2 d -1 (Table 1), is about one-eighth of the integrated ammonium oxidation rate. VNn, vS [NO] and VNO.
Although nitrification and NO formation both occur and are most intense in the same general region of the water column, efforts to generate tighter relationships between the two, which quantitatively might demonstrate a close linkage, failed because peaks in the measured quantities differed in depth.
The features common to all stations are best explained as a qualitative relationship between nitrification and NO production in an oxygen minimum environment. The generalized depth distributions of the model features are shown in Fig. 10. The main regions of the model are described as depth layers, beginning at the surface. The important factors controlling distributions are thought to be light, availability of oxidi- zable organic nitrogen, and oxygen concentration.
Photic zone. Nitrification is inhibited by light, resulting in very low nitrification rates that are not a measureable source of NO; NO and VNO are undetectable.
Base of the photic zone. Light inhibition of nitrifying bacteria is no longer effective and remineralization of organic matter is rapid, fed by the nearby source of organic production in the photic zone. Highest ammonium oxidation rates are found here, but NO production and concentrations are low due to relatively high oxygen concentrations (DPSCHULTZ et al., 1981), and perhaps to rapid chemical loss of any NO formed.
Upper gradient of the oxygen minimum. Nitrification begins to decrease in this region, largely due to increasing distance from the photic zone. As oxygen decreases, NO production is enhanced, starting at oxygen concentrations ~<100 ~tM, resulting in highest NO concentrations and highest ratios of NO to NO~ production. Maximum NO and VNO occur in this region, at slightly greater depths and lower oxygen concentrations than the maximum ammonium oxidation rates.
Core of the oxygen minimum. Nitrification rates are low, sometimes unmeasureable if oxygen is low enough to allow denitrification to occur here. The turnover of NO is high, possibly due to denitrification.
0
200
400
600
800
I000
[NO],VNO, NH + OXIDATION
I~DATION / / ~ V N O
/ / ' I I
~i--[NO] I I !
/ !
J
LPHOTIC ZONE
0 2
MINIMUM ZONE
Fig. 10. Summary of depth distributions of NI4~ oxidation rate, NO concentration and NO t u r n o v e r ra te s h o w i n g relative position to each other and the oxygen minimum zone. Nitrification
. . . . e-OZ rate distribution approximated by VNI~ = a
Nitrification of the North Pacific 1141
Below the oxygen minimum. Due to its great depth, this region supports very low ammonium oxidation rates, although slightly enhanced rates may be found at interme- diate oxygen concentrations. NO concentrations and VNo are very low; if nitrification is the main source of NO in oxygenated waters, low absolute nitrification rates mean low NO production, even if the ratio of NO to NO~ is relatively high.
Sources of NO
The source of NO remains unidentified. If we presume either a direct or indirect biological source, as seems most likely, then in intense oxygen minima, nitrification (LIPSrlULTZ et al., 1981) and denitrification (Sox~NsoN, 1978; PAVNE, 1981) are the obvious sources, because as demonstrated in culture, both nitrifying and denitrifying bacteria produce NO. On this cruise, small amounts and fluxes of NO were produced at nearly zero oxygen, in the absence of detectable ammonia oxidation. We presume that these arise from denitrification. However, most NO and NO production occurred fairly uniformly in the region of the oxycline at [O2] 10-100 laM. Classical denitrification does not occur in this zone (I-IArrogi, 1983), although "aerobic" denitrification (RoBERTSON and KUENEN, 1984) or microsite anoxia (ALLDREDOE and COHEN, 1987) cannot be definitively excluded. However, nitrification is a far more plausible source there, because it occurs at higher flux rates (9 of 12 data pairs) than that required to produce the NO (as a major side-product).
The filtration experiments, suggesting a soluble intermediate compound, are difficult to evaluate with respect to artifacts. However, an intermediate form would further complicate the relationship between nitrification and NO production. Hydroxylamine, one possible intermediate product, is produced by nitrification, is present in the sea (yon BRE~OJN et al., 1982), and is capable of decomposing chemically to NO in the presence of oxygen (Z~-mIOV, unpublished data). Regardless of the source, the fundamental issue raised by the NO data is whether the NO fluxes are accurate estimates of in situ rates. Although we have no reason to suspect their validity, the magnitudes are large, quite variable, and imperfectly correlated with other observed properties. They imply that NO pathways may be important in the ocean water column at intermediate oxygen levels, and raise the question of the fate of N O N in terms of future biological availability. Is NO itself assimilated or recycled into assimilable nitrogen pools (such as nitrite), or is it essentially "denitrified" by further reductive dimerization?
Acknowledgements--We thank Jim Murray, Chief Scientist, and the captain and crew of the R.V. Wecoma. G. Snyder and J. Newman provided expert technical assistance. Nutrient analyses were provided by K. K. Krogslund. G. A. Knauer supplied the VERTEX flux data. This work was funded by NSF grants to OCZ and BBW.
R E F E R E N C E S
ALLDREDGE A. L. and Y. COHEt~ (1987) Can microscale chemical patches persist in the sea? Science, 235, 689-691.
BARSDATE R. J. and R. C. DUGDALE (1965) Rapid conversion of organic nitrogen to N 2 for mass spectrometry: an automated Dumas procedure. Analytical Biochemistry, 13, 1-5.
BENDSCHNEIDER K. and R. J. RoBIr~SOt~ (1952) A new spectrophotometric method for the determination of nitrite in seawater. Journal of Marine Research, 11, 87-96.
BROENKOW W. W. and J. C. CLIr,rE (1969) Colorimetric determination of dissolved oxygen at low concen- trations. Limnology and Oceanography, 13, 450-454.

1142 B.B. WARD and O. C. ZAFIRIOU
COHEN Y. and L. I. GORDON (1978) Nitrous oxide in the oxygen minimum of the eastern tropical North Pacific: evidence for its consumption during denitrification and possible mechanisms for its production. Deep-Sea Research, 25, 509-524.
COHEN Y. and L. I. GORDON (1979) Nitrous oxide production in the ocean. Journal of Geophysical Research, 84, 347-353.
DUGDALE R. L. and J. J. GOERING (1967) Uptake of new and regenerated forms of nitrogen in primary productivity. Limnology and Oceanography, 12, 196-206.
ELKINS J. W., S. C. WOFSY, M. B. MCELROY, C. E. KOLB and W. A. KAPLAN (1978) Aquatic sources and sinks for nitrous oxide. Nature, 275, 602-606.
GOREAU T. J., W. A. KAPLAN, S. C. WOFSY, M. B. MCELROY, F. W. VALOIS and S. W. WATSON (1980) Production of NO~ and N20 by nitrifying bacteria at reduced concentrations of oxygen. Applied and Environmental Microbiology, 40, 526-532.
HASHIMOTO L. K., W. A. KAPLAN, S. C. WOFSY and M. B. MCELROY (1983) Transformations of fixed nitrogen and N20 in the Cariaco Trench. Deep-Sea Research, 30, 575-590.
HATrORI A. (1983) Denitrification and dissimilatory nitrate reduction. In: Nitrogen in the marine environment, E. J. CARPENTER and D. G. CAPONE, editors, Academic Press, New York, pp. 191-232.
HORRIGAN S. G., A. F. CARLUCCI and P. M. WILLIAMS (1981) Light inhibition of nitrification in sea-surface films. Journal of Marine Research, 39, 557-565.
LIPSCHULTZ F., O. C. ZAFIRIOU, S. C. WOFSY, M. B. MCELROY, F. W. VALOIS and S. W. WATSON (1981) Production of NO and N20 by soil nitrifying bacteria. Nature, 294, 641-643.
MIYAZAKI T., E. WADA and A. HATrORI (1975) Nitrite production from ammonia and nitrate in the euphotic layer of the western North Pacific Ocean. Marine Science Communications, 20, 571-577.
OLSON R. J. (1981a) lSN tracer studies of the primary nitrite maximum. Journal of Marine Research, 39, 203-226.
OLSON R. J. (1981b) Differential photoinhibition of marine nitrifying bacteria: a possible mechanism for the formation of the primary nitrite maximum. Journal of Marine Research, 39, 227-238.
PAVLOU S. P. (1972) Phytoplankton growth dynamics. Tech. Series 1: Chemostat methodology and chemical analyses. Special Rept. No. 52, Department of Oceanography, University of Washington, Seattle, 130 pp.
PAYNE W. J. (1981) The status of nitric oxide and nitrous oxide as intermediates in denitrification; In: Denitrification, nitrification, and atmospheric nitrous oxide, C. C. DELWICHE, editor, Wiley, New Yor?~, pp. 85-103.
RILEY J. P. (1975) Appendix. In: Chemical oceanography, 2rid edn., Vol. 1, J. P. RILEY and G. SKIRROW, editors, Academic Press, New York, pp. 548-589.
ROBERTSON W. A. and J. G. KUENEN (1984) Aerobic denitrification: A controversy revived. Archives of Microbiology, 139, 351-354.
SORENSEN J. (1978) Occurrence of nitric and nitrous oxides in a coastal marine sediment. Applied and Environmental Microbiology, 36, 809-813.
VON BREYMANN M. T., M. A. DE ANGELIS and L. F. GORDON (1982) Gas chromatography with electron capture detection for determination of hydroxylamine in seawater. Analytical Chemistry, 54, 1209-1210.
WARD B. B. (1985) Light and substrate concentration relationships with marine ammonium assimilation and oxidation rates. Marine Chemistry, 16, 301-316.
WARD B. B. (1987) Nitrogen transformations in the Southern California Bight. Deep-Sea Research, 785-805. WARD B. B., M. C. TALBOT and M. J. PERRY (1984) Contributions of phytoplankton and nitrifying bacteria to
ammonium and nitrite dynamics in coastal waters. Continental Shelf Research, 3, 383-398. ZAFIRIOU O. C. and M. MCFARLAND (1980) Determination of trace levels of nitric oxide in aqueous solution.
Analytical Chemistry, 52, 1662-1667. ZAFIRIOU O. C. and M. B. TRUE (1986) Interferences in environmental analysis of NO by NO plus O3
detectors: A rapid screening technique. Environmental Science and Technology, 20, 694-596. ZAFIRIOU O. C., M. MCFARLAND and R. H. BROMUND (1980) Nitric oxide in seawater. Science, 207,637-639. YOSHINARI Z. (1976) Nitrous oxide in the sea. Marine Chemistry, 4, 189-202.


