Embed Size (px)
Citation preview

University of Kentucky University of Kentucky
UKnowledge UKnowledge
Theses and Dissertations--Plant and Soil Sciences Plant and Soil Sciences
2013
NITRATE REDUCTION COUPLED TO IRON(II) AND NITRATE REDUCTION COUPLED TO IRON(II) AND
MANGANESE(II) OXIDATION IN AN AGRICULTURAL SOIL MANGANESE(II) OXIDATION IN AN AGRICULTURAL SOIL
Stephanie Pyzola University of Kentucky, [email protected]
Right click to open a feedback form in a new tab to let us know how this document benefits you. Right click to open a feedback form in a new tab to let us know how this document benefits you.
Recommended Citation Recommended Citation Pyzola, Stephanie, "NITRATE REDUCTION COUPLED TO IRON(II) AND MANGANESE(II) OXIDATION IN AN AGRICULTURAL SOIL" (2013). Theses and Dissertations--Plant and Soil Sciences. 20. https://uknowledge.uky.edu/pss_etds/20
This Master's Thesis is brought to you for free and open access by the Plant and Soil Sciences at UKnowledge. It has been accepted for inclusion in Theses and Dissertations--Plant and Soil Sciences by an authorized administrator of UKnowledge. For more information, please contact [email protected].

STUDENT AGREEMENT: STUDENT AGREEMENT:
I represent that my thesis or dissertation and abstract are my original work. Proper attribution
has been given to all outside sources. I understand that I am solely responsible for obtaining
any needed copyright permissions. I have obtained and attached hereto needed written
permission statements(s) from the owner(s) of each third-party copyrighted matter to be
included in my work, allowing electronic distribution (if such use is not permitted by the fair use
doctrine).
I hereby grant to The University of Kentucky and its agents the non-exclusive license to archive
and make accessible my work in whole or in part in all forms of media, now or hereafter known.
I agree that the document mentioned above may be made available immediately for worldwide
access unless a preapproved embargo applies.
I retain all other ownership rights to the copyright of my work. I also retain the right to use in
future works (such as articles or books) all or part of my work. I understand that I am free to
register the copyright to my work.
REVIEW, APPROVAL AND ACCEPTANCE REVIEW, APPROVAL AND ACCEPTANCE
The document mentioned above has been reviewed and accepted by the student’s advisor, on
behalf of the advisory committee, and by the Director of Graduate Studies (DGS), on behalf of
the program; we verify that this is the final, approved version of the student’s dissertation
including all changes required by the advisory committee. The undersigned agree to abide by
the statements above.
Stephanie Pyzola, Student
Dr. Chris Matocha, Major Professor
Dr. Mark Coyne, Director of Graduate Studies

NITRATE REDUCTION COUPLED TO IRON(II) AND MANGANESE(II)
OXIDATION IN AN AGRICULTURAL SOIL
_____________________________________
THESIS
_____________________________________
A thesis submitted in partial fulfillment of the requirements for the degree of Master of Science in
Plant and Soil Science in the College of Agriculture at the University of Kentucky
By
Stephanie Marie Pyzola
Lexington, Kentucky
Director: Dr. Chris J. Matocha, Associate Professor of Plant and Soil Science
Lexington, Kentucky
2013
Copyright © Stephanie Marie Pyzola 2013

ABSTRACT OF THESIS
NITRATE REDUCTION COUPLED TO IRON(II) AND MANGANESE(II)
OXIDATION IN AN AGRICULTURAL SOIL
New evidence shows iron(II) oxidation is strongly coupled to nitrate reduction under anaerobic conditions in freshwater sediments and agricultural soils. However, the contribution of iron(II) oxidation to nitrate reduction is unknown. Furthermore, oxidation of manganese(II) by nitrate has been largely overlooked. This study investigated nitrate-dependent iron(II) and manganese(II) oxidation in an agricultural soil (Sadler silt loam) using stirred-batch kinetic techniques with native soil organic carbon (SOC) as the electron donor and included addition of amendments (hydrogen gas and wheat residue). In the presence of native SOC, nitrate-dependent Fe(II) and Mn(II) oxidation occurred at early stages of the reaction while organic carbon participated at longer times. Contributions of iron(II) and manganese(II) oxidation to nitrate reduction were 19% and 25%, respectively. This is significant in light of excess SOC relative to total Fe and Mn in the Sadler soil. Addition of hydrogen gas lowered the contribution of iron(II) oxidation to nitrate reduction to 10%, while addition of plant residue raised this value to approximately 55%. Manganese(II) oxidation contributed 50% to nitrate reduction under hydrogen amended conditions. These coupled processes involving Fe(II) and Mn(II) oxidation are an underappreciated aspect of the nitrogen cycle and merit consideration in future studies. Keywords: Nitrate Reduction, Iron(II) Oxidation, Manganese(II) Oxidation, Anaerobic Cycling, Redox Potential
Stephanie Marie Pyzola _ Signature
March 06, 2013 _
Date

NITRATE REDUCTION COUPLED TO IRON(II) AND MANGANESE(II)
OXIDATION IN AN AGRICULTURAL SOIL
By
Stephanie Marie Pyzola
Director of Thesis
Director of Graduate Studies
Date
Dennis Egli
Chris J. Matocha
March 06, 2013

For my Granny, Emma Gene Capps

iii
ACKNOWLEDGEMENTS
Writing this thesis has been a significantly challenging experience and was not possible
without the help and encouragement of many. First, I owe a great deal of gratitude to my
advisor, Dr. Chris Matocha, whose expertise, approachability, and excited personality made
him an outstanding advisor and confidant. Secondly, I would like to thank Dr. Coyne and
Dr. Grove for being members on my committee. Learning from them in and out of the
classroom has truly been an exceptional privilege. Also, I want to thank Martin Vandiviere
for all his patience with my frequent questions, as well as his help, great music, and good
conversation in the lab. I also owe thanks to everyone in the labs of Dr. Coyne, Dr.
McCulley, Dr. McNear, and Dr. Grove. I have appreciated all of their kind assistance and the
ability to use their equipment.
I would also like to give my love and appreciation to my family: Mom, Dad, Sarah, and
Tanner. Their love, support, and motivation were unwavering throughout this whole
process. It will never go unnoticed and I cherish it deeply. Furthermore, I thank my closest
friends and colleagues and UK Basketball for making the stress of Graduate School more
bearable. Finally, I’d like to thank God for helping me get through Graduate School.
Without Him, none of this would have been possible: “If God brings you to it, He will bring
you through it”.
iv
TABLE OF CONTENTS
Acknowledgements ............................................................................................................................. iii
List of Tables ....................................................................................................................................... vi
List of Figures ..................................................................................................................................... vii
Chapter 1: Introduction ....................................................................................................................... 1
Nitrogen Cycle ...................................................................................................................................... 1
Nitrate Reduction ........................................................................................................................ 2
Coupling Nitrogen and Carbon ................................................................................................ 3
Iron Chemistry ...................................................................................................................................... 4
Redox Chemistry Effects on Iron Oxidation State ................................................................ 4
Iron Solubility .............................................................................................................................. 5
Manganese Chemistry .......................................................................................................................... 5
Redox Effects on Manganese Oxidation State ....................................................................... 5
Redox Effects on Manganese Solubility .................................................................................. 6
Coupling Nitrate Reduction with Iron(II) Oxidation ..................................................................... 6
Coupling the Nitrogen Cycle with Manganese ................................................................................ 8
Coupling Iron(II) Oxidation with Manganese (III, IV) Reduction .............................................. 9
Objectives .............................................................................................................................................. 9
Organization of Thesis ...................................................................................................................... 10
Chapter 2: Nitrate Dependent Iron(II) and Manganese(II) Oxidation ...................................... 11
Materials and Methods ...................................................................................................................... 13
Iron(II) Oxidation Contribution to Nitrate Reduction ....................................................... 13
Manganese(II) Oxidation Contribution to Nitrate Reduction ........................................... 14
Results and Discussion ...................................................................................................................... 15
Iron(II) Oxidation Coupled to Nitrate Reduction ............................................................... 16
Manganese(II) Oxidation Contribution to Nitrate Reduction ........................................... 30
Conclusions ......................................................................................................................................... 39
Chapter 3: Impact of Hydrogen Gas and Plant Residue Amendments on Nitrate Dependent
Iron(II) and Manganese(II) Oxidation ............................................................................................ 41
Materials and Methods ...................................................................................................................... 43
Hydrogen Amendment ............................................................................................................. 43
v
Plant Residue Amendment ...................................................................................................... 44
Results and Discussion ...................................................................................................................... 44
Hydrogen Amendment ............................................................................................................. 44
Plant Residue Amendment ...................................................................................................... 55
Conclusions ......................................................................................................................................... 70
Chapter 4: Thesis Conclusions ......................................................................................................... 72
References ........................................................................................................................................... 74
VITA .................................................................................................................................................... 84

vi
LIST OF TABLES
Table 2.1: Iron and Mn content of the unreduced Sadler silt loam; whole soil and clay
fraction†. ............................................................................................................................................... 16

vii
LIST OF FIGURES
Figure 1.1: General overview of the nitrogen cycle. ....................................................................... 1
Figure 2.1: Soil pH and Eh during preincubation of the control experiment (error is standard
deviation of mean data point). .......................................................................................................... 17
Figure 2.2: Water and acid extractable Mn(II) concentrations during the anaerobic
preincubation (error is standard deviation of mean data point). ................................................. 18
Figure 2.3: Water and acid extractable Fe(II) concentrations during anaerobic preincubation
(error is standard deviation of mean data point). .......................................................................... 19
Figure 2.4: Sulfate concentration during anaerobic preincubation (error is standard deviation
of mean data point). ........................................................................................................................... 20
Figure 2.5: Concentration of acetate during anaerobic preincubation (error is standard
deviation of mean data point). .......................................................................................................... 21
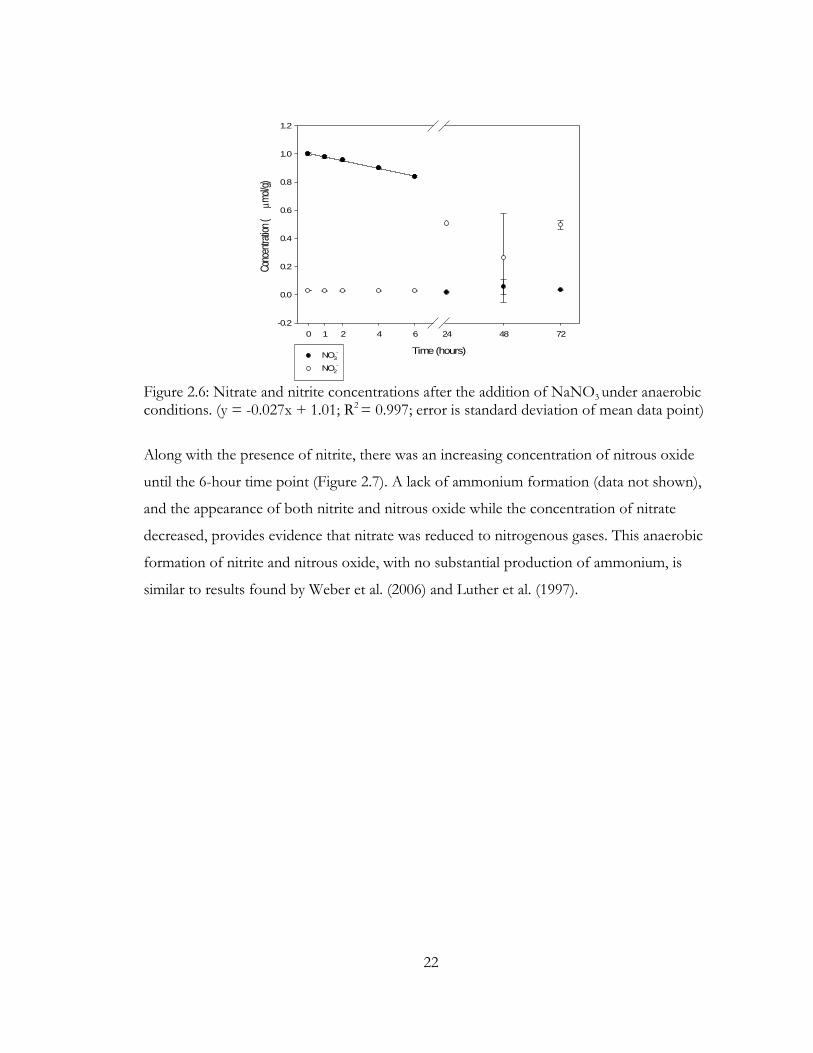
Figure 2.6: Nitrate and nitrite concentrations after the addition of NaNO3 under anaerobic
conditions. (y = -0.027x + 1.01; R2 = 0.997; error is standard deviation of mean data point)
............................................................................................................................................................... 22
Figure 2.7: Nitrous oxide concentrations after the addition of NaNO3 under anaerobic
conditions (error is standard deviation of mean data point). ....................................................... 23
Figure 2.8: Soil slurry pH and Eh under anoxic conditions after NaNO3 addition (error is
standard deviation of mean data point). ......................................................................................... 24
Figure 2.9: Water and acid extractable Mn(II) immediately following NaNO3 addition. (Water
extractable Mn(II) = -0.178x + 1.88; R2 = 0.994 and acid extractable Mn(II) = -0.730x +
18.05; R2 = 0.847; error is standard deviation of mean data point) ............................................ 24
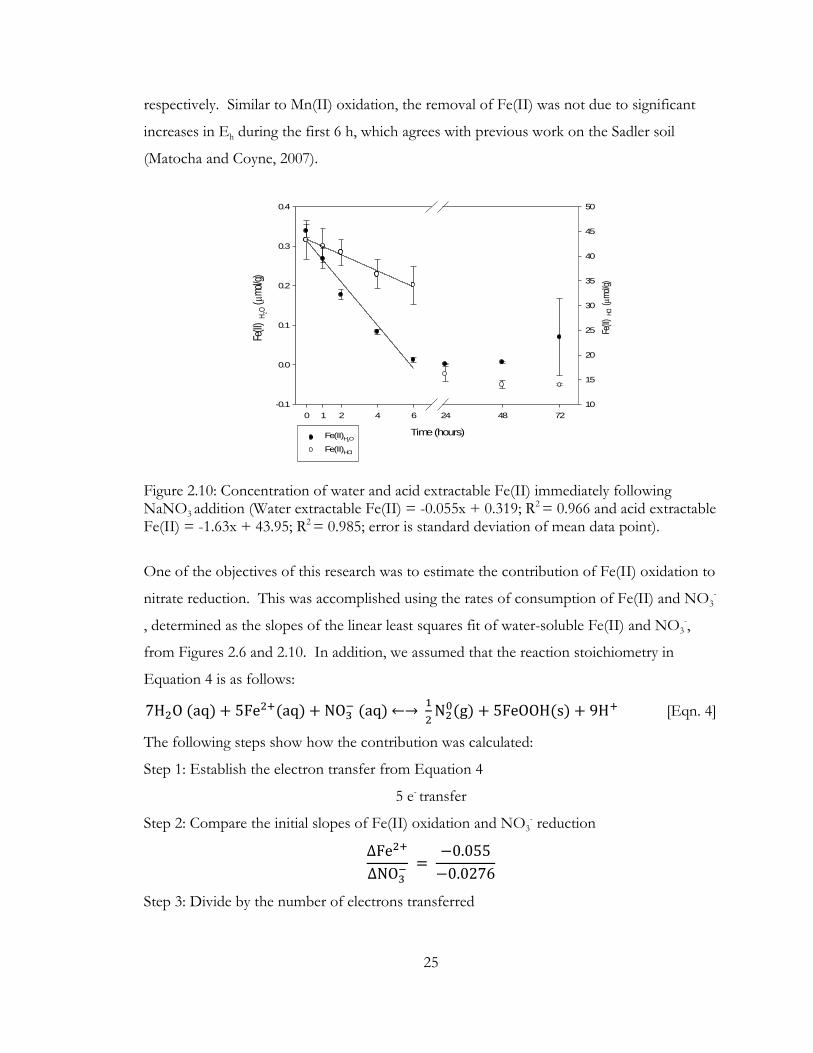
Figure 2.10: Concentration of water and acid extractable Fe(II) immediately following
NaNO3 addition (Water extractable Fe(II) = -0.055x + 0.319; R2 = 0.966 and acid extractable
Fe(II) = -1.63x + 43.95; R2 = 0.985; error is standard deviation of mean data point). ............ 25
Figure 2.11: A. Water-soluble Fe2+ values predicted using [Eqn. 8] and a k1 value of 1140
L/mol h as compared with observed values from the Sadler soil. B. Corrected concentration
values of oxidized Fe2+ as compared with concentrations of reduced nitrate (Water
extractable Fe2+= 2.618E-06x + 9.912E-06, R2 = 0.89; NO3- Reduced = 2.759E-06x + 3.651E-07,
R2 = 0.98)............................................................................................................................................. 28

viii
Figure 2.12: Concentration of acetate after the addition of NaNO3 (error is standard
deviation of mean data point). .......................................................................................................... 29
Figure 2.13: Cumulative total dissolved inorganic carbon (DIC) after the addition of NaNO3
under anoxic conditions (error is standard deviation of mean data point). ............................... 30
Figure 2.14: Ferrozine amended soil pH and Eh (a); sulfate concentration (b); water and HCl
extractable Fe(II) concentrations (c); water and HCl extractable Mn(II) concentrations (d);
and acetate concentration (e) during anaerobic preincubation (error is standard deviation of
mean data point). ................................................................................................................................ 31
Figure 2.15: Ferrozine amended soil nitrate and nitrite concentrations after NaNO3 addition
(y = -0.057x + 1.45; R2 = 0.999; error is standard deviation of mean data point). ................... 32
Figure 2.16: Nitrous oxide concentration after nitrate addition to ferrozine-amended soil
slurries (error is standard deviation of mean data point). ............................................................. 33
Figure 2.17: Ferrozine amended soil water and HCl extractable Mn(II) concentrations post
nitrate addition (Water extractable Mn(II) = -0.036x + 1.638; R2 = 0.966 and acid extractable
Mn(II) = 0.1647x + 15.98; R2 = 0.464; error is standard deviation of mean data point) ........ 34
Figure 2.18: Ferrozine amended soil water and HCl extractable Fe(II) concentrations post
nitrate addition. (Water extractable Fe(II) = -0.0069x + 2.499; R2 = 0.950 and acid
extractable Fe(II) = -0.0334x + 0.743; R2 = 0.913; error is standard deviation of mean data
point) .................................................................................................................................................... 36
Figure 2.19: Ferrozine amended soil slurry pH and Eh after nitrate addition (error is standard
deviation of mean data point). .......................................................................................................... 37
Figure 2.20: Acetate concentration post nitrate addition to ferrozine-amended soil (error is
standard deviation of mean data point). ......................................................................................... 38
Figure 2.21: Ferrozine amended soil total cumulative dissolved inorganic carbon (DIC) post
nitrate addition (error is standard deviation of mean data point). .............................................. 39
Figure 3.1: Soil pH and Eh under hydrogen amended anoxic conditions during
preincubation (error is standard deviation of mean data point). ................................................. 45
Figure 3.2: Water and HCl extractable Mn(II) concentrations under hydrogen amended
anoxic conditions during preincubation (error is standard deviation of mean data point). .... 46
Figure 3.3: Water and HCl extractable iron(II) concentrations under hydrogen amended
anoxic conditions during preincubation (error is standard deviation of mean data point). .... 47

ix
Figure 3.4: Sulfate concentration under hydrogen amended conditions during preincubation
(error is standard deviation of mean data point). .......................................................................... 47
Figure 3.5: Acetate concentration under hydrogen amended anoxic conditions during
preincubation (error is standard deviation of mean data point). ................................................. 48
Figure 3.6: Hydrogen amended soil nitrate and nitrite concentrations after nitrate addition
under anoxic conditions. (y = -0.051x + 0.9521; R2 = 0.999; error is standard deviation of
mean data point). ................................................................................................................................ 49
Figure 3.7: Hydrogen amended soil nitrous oxide concentration after nitrate addition under
anoxic conditions (error is standard deviation of mean data point). .......................................... 50
Figure 3.8: Hydrogen amended soil water and HCl extractable Mn(II) concentrations post
nitrate addition (Water extractable Mn(II) = -0.0623x + 1.42; R2 = 0.9831; error is standard
deviation of mean data point). .......................................................................................................... 51
Figure 3.9: Hydrogen amended soil water and HCl extractable Fe(II) concentrations post
nitrate addition (Water extractable Fe(II) = -0.025x + 0.366; R2 = 0.995 and HCl extractable
Fe(II) = -0.06x + 44.99; R2 = 0.032; error is standard deviation of mean data point). ............ 52
Figure 3.10: Sulfate concentration after nitrate addition under hydrogen amended conditions
(error is standard deviation of mean data point). .......................................................................... 52
Figure 3.11: Acetate concentration after nitrate addition under hydrogen amended anoxic
conditions (error is standard deviation of mean data point). ....................................................... 53
Figure 3.12: Total cumulative dissolved inorganic carbon (DIC) after nitrate addition under
hydrogen amended anoxic conditions (error is standard deviation of mean data point). ....... 54
Figure 3.13: Soil pH and Eh, after nitrate addition, under hydrogen amended anoxic
conditions (error is standard deviation of mean data point). ....................................................... 55
Figure 3.14: pH and Eh during preincubation of high nitrogen (HN) (a) and low nitrogen
(LN) (b) residue amended soil slurries (error is standard deviation of mean data point). ....... 56
Figure 3.15: Water and acid extractable Mn(II) concentrations during preincubation of high
nitrogen (HN) (a) and low nitrogen (LN) (b) residue amended soil slurries (error is standard
deviation of mean data point). .......................................................................................................... 57
Figure 3.16: Water and HCl extractable Fe(II) concentrations during preincubation of high
nitrogen (HN) (a) and low nitrogen (LN) (b) residue amended soil slurries (error is standard
deviation of mean data point). .......................................................................................................... 58
x
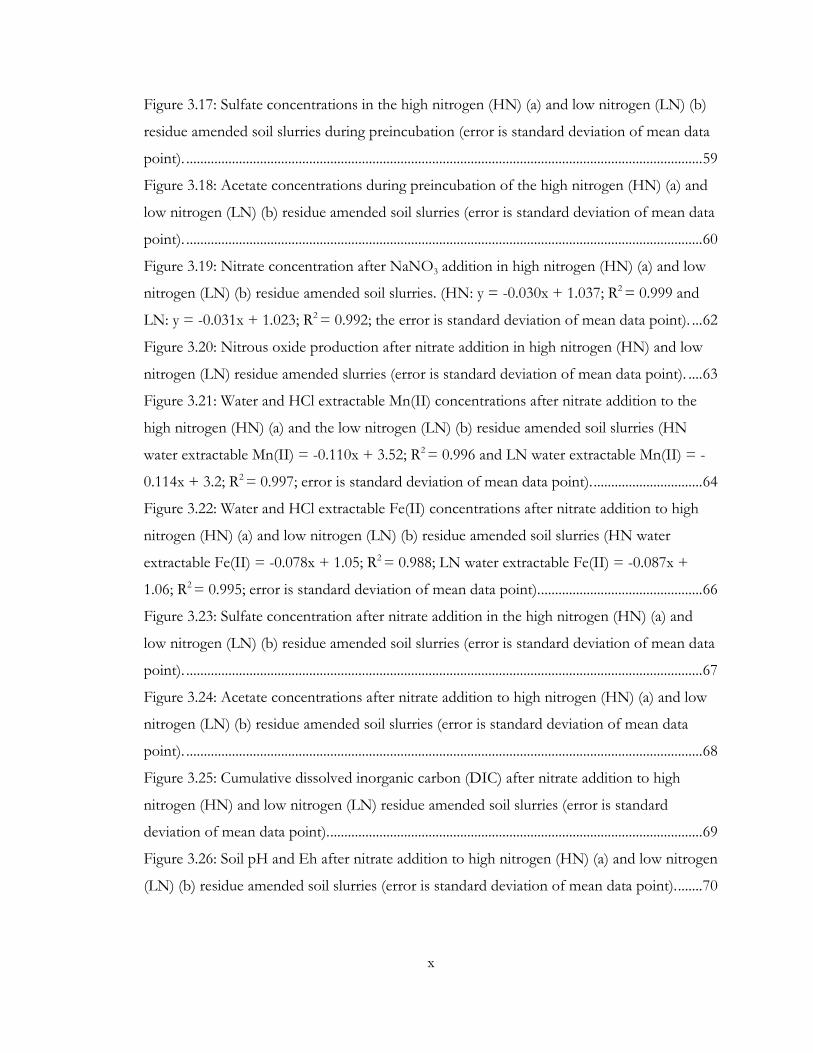
Figure 3.17: Sulfate concentrations in the high nitrogen (HN) (a) and low nitrogen (LN) (b)
residue amended soil slurries during preincubation (error is standard deviation of mean data
point). ................................................................................................................................................... 59
Figure 3.18: Acetate concentrations during preincubation of the high nitrogen (HN) (a) and
low nitrogen (LN) (b) residue amended soil slurries (error is standard deviation of mean data
point). ................................................................................................................................................... 60
Figure 3.19: Nitrate concentration after NaNO3 addition in high nitrogen (HN) (a) and low
nitrogen (LN) (b) residue amended soil slurries. (HN: y = -0.030x + 1.037; R2 = 0.999 and
LN: y = -0.031x + 1.023; R2 = 0.992; the error is standard deviation of mean data point). ... 62
Figure 3.20: Nitrous oxide production after nitrate addition in high nitrogen (HN) and low
nitrogen (LN) residue amended slurries (error is standard deviation of mean data point). .... 63
Figure 3.21: Water and HCl extractable Mn(II) concentrations after nitrate addition to the
high nitrogen (HN) (a) and the low nitrogen (LN) (b) residue amended soil slurries (HN
water extractable Mn(II) = -0.110x + 3.52; R2 = 0.996 and LN water extractable Mn(II) = -
0.114x + 3.2; R2 = 0.997; error is standard deviation of mean data point). ............................... 64
Figure 3.22: Water and HCl extractable Fe(II) concentrations after nitrate addition to high
nitrogen (HN) (a) and low nitrogen (LN) (b) residue amended soil slurries (HN water
extractable Fe(II) = -0.078x + 1.05; R2 = 0.988; LN water extractable Fe(II) = -0.087x +
1.06; R2 = 0.995; error is standard deviation of mean data point). .............................................. 66
Figure 3.23: Sulfate concentration after nitrate addition in the high nitrogen (HN) (a) and
low nitrogen (LN) (b) residue amended soil slurries (error is standard deviation of mean data
point). ................................................................................................................................................... 67
Figure 3.24: Acetate concentrations after nitrate addition to high nitrogen (HN) (a) and low
nitrogen (LN) (b) residue amended soil slurries (error is standard deviation of mean data
point). ................................................................................................................................................... 68
Figure 3.25: Cumulative dissolved inorganic carbon (DIC) after nitrate addition to high
nitrogen (HN) and low nitrogen (LN) residue amended soil slurries (error is standard
deviation of mean data point). .......................................................................................................... 69
Figure 3.26: Soil pH and Eh after nitrate addition to high nitrogen (HN) (a) and low nitrogen
(LN) (b) residue amended soil slurries (error is standard deviation of mean data point). ....... 70
1
CHAPTER 1: INTRODUCTION
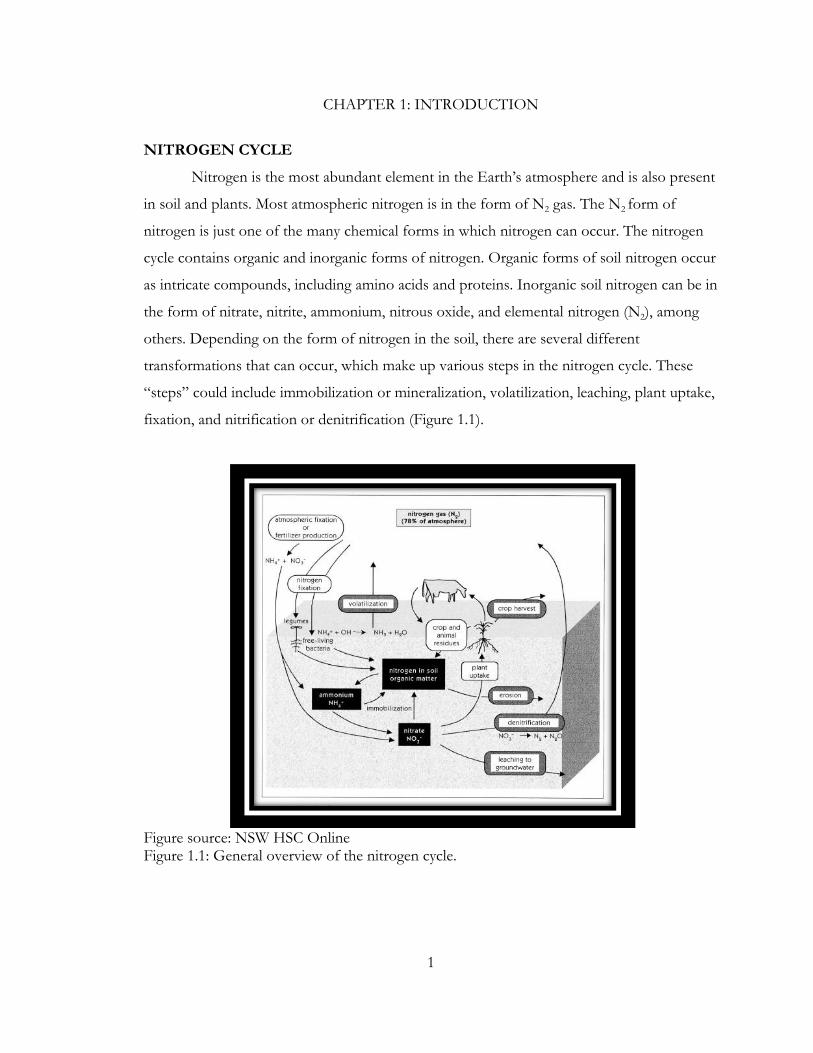
NITROGEN CYCLE
Nitrogen is the most abundant element in the Earth’s atmosphere and is also present
in soil and plants. Most atmospheric nitrogen is in the form of N2 gas. The N2 form of
nitrogen is just one of the many chemical forms in which nitrogen can occur. The nitrogen
cycle contains organic and inorganic forms of nitrogen. Organic forms of soil nitrogen occur
as intricate compounds, including amino acids and proteins. Inorganic soil nitrogen can be in
the form of nitrate, nitrite, ammonium, nitrous oxide, and elemental nitrogen (N2), among
others. Depending on the form of nitrogen in the soil, there are several different
transformations that can occur, which make up various steps in the nitrogen cycle. These
“steps” could include immobilization or mineralization, volatilization, leaching, plant uptake,
fixation, and nitrification or denitrification (Figure 1.1).
Figure source: NSW HSC Online Figure 1.1: General overview of the nitrogen cycle.

2
The nitrogen cycle plays an important role in the soil environment, causing
conversions of non-plant available nitrogen to plant available forms of nitrogen. Nitrogen
cycling is also important to the soil environment because cycling allows inorganic forms of
nitrogen to be transformed into organic forms and vice versa. Two important processes in
the nitrogen cycle are nitrification and denitrification. Nitrification allows
ammonia/ammonium to be oxidized to nitrate with nitrite as an intermediate. Oxygenated
environments are important to this process. Denitrification is the process by which nitrate is
reduced to dinitrogen, with possible intermediates being nitrite, nitric oxide, and nitrous
oxide. This process generally occurs in wet, anaerobic environments in which available
oxygen is not present and organisms use available nitrate and nitrite as electron acceptors,
which results in the release of nitrous oxide and/or dinitrogen.
Nitrate Reduction
In the United States, excess and continual agricultural nitrogen fertilizer inputs have
led to nitrate contamination of many ground and surface waters. High levels of nitrate result
in negative environmental inputs such as eutrophication and human health issues such as
Methemoglobinemia (blue baby syndrome) (Santamaria, 2006). Therefore, the removal of
excess nitrate from soil and water is of great interest. One form of nitrate removal from soil
and water is via the reduction of nitrate to gaseous nitrogen compounds. Nitrate reduction
has been largely attributed to microbial activity although abiotic nitrate reduction has also
been documented (Hansen, et al., 1996). Heterotrophic and autotrophic bacterial
denitrification reduces nitrate in the following progression:
NO3- (aq) NO2
- (aq) NO (g) N2O (g) N2 (g)
This process is associated with water saturated or near-saturated anaerobic soil
conditions in which oxygen has been depleted from the environment (Smith and Tiedje,
1979). Abiotically, solution studies have shown that inorganic reduction of nitrate can occur
with ferrous iron (Buresh and Moraghan, 1976), Fe(II) silicate minerals (Postma, 1990),
Fe(II)-Fe(III) hydroxides known as green rusts (Hansen et al., 1996), and the Fe(II) mineral
wüstite (Rakshit et al., 2005).
The oxidized form of nitrogen is nitrate, in which the charge on the oxidized N is
+5. As nitrate is transformed during denitrification, the oxidation state of the N atom is
reduced. Nitrate is especially prone to transformation because it is an extremely mobile

3
monovalent anion (Vitousek et al., 2002). During denitrification, nitrate (+5 oxidation state)
can be progressively reduced to nitrite (+3), nitric oxide (+2), nitrous oxide (+1) and finally
dinitrogen gas (0). The form that nitrogen takes in soil environments is greatly influenced by
the redox potential of the system. In more oxidized or aerobic environments, nitrate is one
of the dominant species present. For denitrification to become active, redox potential values
below 420 mV must be achieved (Nikolaeva and Eremina, 2005). However, between 340-
480 mV, nitrate and nitrite can coexist (Nikolaeva and Eremina, 2005). Gaseous nitrogen
(NO, N2O, N2) tends to predominate at Eh values less than 200 mV (Nikolaeva and
Eremina, 2005). Because pH also influences redox potential, the pH of a system can
contribute to the Eh ranges in which transformations of nitrate occur. According to research
by Patrick and Jugsujinda (1992), at pH 6.5 the redox potential at which nitrate fully
disappears from soil solution due to reduction is 200-250 mV.
Coupling Nitrogen and Carbon
Historically, denitrification has been strongly associated with soil carbon, with
various soil carbon sources serving as the electron donors under anaerobic conditions; more
specifically dissolved organic and soil organic carbon (Burford and Bremner, 1975).
Equation 1 shows this association:
4(CH2O) + 4NO3- + 4H+ 4CO2 + 2N2O + 6H2O [Eqn. 1]
Burford and Bremner’s research showed that nitrate reduction in soils under anaerobic
conditions is controlled by the presence of readily decomposable organic matter. More
specifically, they showed that increases in mineralizable and water- soluble organic carbon
are the organic carbon sources most strongly associated with increased denitrification
capacity.
Heterotrophic denitrifying microorganisms are assumed to be responsible for these
processes because they obtain energy via coupling with organic carbon oxidation (Brady and
Weil, 2008) as nitrate is reduced. The available carbon sources that denitrifying bacteria can
utilize are vast and include acetate, ethanol, and glucose (Beauchamp et al., 1989; Muehe et
al., 2009). Glucose, one of the main carbon sources for denitrifying bacteria, can reduce the
redox potential to less than -300mV when added to anaerobic soil (Beauchamp et al., 1989).
Manure has also been studied as a carbon source for denitrification but no substantial
conclusions have been made regarding its ability to act as a readily available source of carbon

4
(Beauchamp et al., 1989). Plant residue was also noted as having potential to be an important
stimulant of denitrification (Beauchamp et al., 1989), via increased available carbon levels for
denitrifying organisms.
IRON CHEMISTRY
Iron is the fourth most abundant element on the Earth’s surface (Havlin et al., 2005)
and can have a range of oxidation states with the most common being Fe+2 and Fe+3. Iron is
present in many forms, including primary/secondary minerals such as hematite (Fe2O3),
goethite (FeOOH), and magnetite (Fe3O4) (Havlin et al., 2005). Iron(III) can also be present
in phyllosilicate minerals (Thamdrup, 2000). Iron (II) is most reactive as a reductant in
complexed forms, such as solid Fe(II) minerals or adsorbed Fe(II) surface species (Rakshit
et. al., 2005; Matocha, 2005). Water-soluble (dissolved) Fe(II) is generally less reactive, but
microorganisms can readily utilize it as an electron donor (Straub et al., 1996). Ferrous iron
tends to be more stable and resist oxidation by molecular oxygen or microbes when pH is
acidic (Temple and Colmer, 1951).
Redox Chemistry Effects on Iron Oxidation State
Oxygen is the first species to act as prominent electron acceptor during organic
matter decomposition, followed by nitrate, manganese (III, IV) minerals, iron (III) minerals,
then sulfate, and finally carbon dioxide (Patrick and Jugsujinda, 1992). There is an Eh range
in which each species is known to reduce. These Eh values, measured using a platinum
electrode, serve as a guide, illustrating Eh conditions where transitions will occur. Redox
potential changes in response to electron donors being consumed and electron acceptors
being reduced. Redox potentials for the Fe oxides are variable and have been shown to vary
between -300 and 0mV (Thamdrup, 2000) or at levels around 100mV (Patrick and
Jugsujinda, 1992). Under aerobic or more positive redox potential conditions, iron is present
in its oxidized state, Fe(III), while lower redox potentials are conditions in which the
reduced form of iron, Fe(II), is present. Iron(III) will not be reduced when nitrate is present
in soil (Patrick and Jugsujinda, 1992). An interesting component to iron redox chemistry is
that the reduction potentials of the Fe(III) oxides increase by 59mV per unit decrease in pH
allowing more energy to be available from iron reduction at greater pH (Thamdrup, 2000).
5
Iron Solubility
Microbial Fe(III) reduction in soil environments produces dissolved Fe(II), which is
more soluble and plant available (Brady and Weil, 2008). At a redox potential of 100mV,
Fe(II) begins to appear in solution (Patrick and Jugsujinda, 1992), however, this value only
serves as a guide and is dependent on levels of poorly crystalline and well-crystalline Fe(III)
minerals (Thamdrup, 2000). In addition, under anaerobic or reducing conditions, Fe(II) is
much more soluble than its oxidized counterpart (Brady and Weil, 2008). For extracting
soluble Fe(II) from a heterogeneous mixture such as soil, both water and acid extractions are
valuable for distinctions between water soluble and sorbed species.
MANGANESE CHEMISTRY
Manganese is the twelfth most abundant element in the Earth’s crust (Armstrong,
2008; Gerber et al., 2002). Manganese chemistry is complex, with oxidation states of Mn2+,
Mn 3+, or Mn4+. Mn(II) is the dominant species in soil solutions, while all three oxidation
states of manganese are present in soil minerals (Essington, 2004). Manganese(III) and
Mn(IV) are found in assorted secondary minerals including pyrolusite (MnO2), hausmannite
(Mn3O4), manganite (MnOOH) (Havlin et al., 2005), and poorly crystalline minerals such as
birnessite (δ-MnO2) (Essington, 2004). Solid-phase Mn(III, IV) oxides serve as good
electron acceptors of diphenolic organic compounds and inorganic reductants as well
(Matocha et al., 2001; Matocha, 2005) and are involved in processes such as anaerobic
respiration (Learman et al., 2011), and have strong sorptive and oxidative capacity for
various species (Learman et al., 2011).
Redox Effects on Manganese Oxidation State
The oxidized forms of manganese are Mn(III) and Mn(IV) present as oxide minerals
whereas the reduced state is Mn(II). Mn-oxides are stable at higher Eh than Fe-oxides
(Postma, 1985). These manganese oxides are readily reduced at fairly high redox potentials
(~400mV) (Nikolaeva and Eremina, 2005). Redox potentials for the Mn oxides have been
shown to range between 500-600mV (Thamdrup, 2000). However, reduction predominates
in a pH 6.5 solution, at an Eh value of approximately 200 mV, after all nitrate in the solution
has been reduced, although overlap in the reduction of both Mn(III, IV) and nitrate has
been reported (Patrick and Jugsujinda, 1992). Progression of redox potential on the

6
generalized redox ladder places manganese reduction after reduction of nitrate and preceding
reduction of iron (Patrick and Jugsujinda, 1992). Nikolaeva and Eremina (2005) reported
that wide ranges in Eh values corresponding with Mn(III, IV) reduction are due to the great
diversity of Mn(III, IV) compounds in soil.
Redox Effects on Manganese Solubility
Oxidized forms of manganese have low solubility (Thamdrup, 2000) while the
reduced species (Mn2+) has high solubility (Sposito, 1989). The oxidized manganese species
tend to precipitate as oxides, hydroxides, and oxyhydroxide minerals (Sposito, 1989).
Manganese becomes increasingly soluble as the pH of soil solution drops (Brady and Weil,
2008). Reducing conditions will also increase manganese solubility (Havlin et al., 2005). At
low pH and low Eh, approximately 100mV when manganese reduction has finished and iron
reduction is beginning, Mn(II) is the dominant species present (Johansson, 2005) and is
considered soluble (Patrick and Jugsujinda, 1992). When the pH and Eh are high, Mn(IV) is
the dominant species present (Johansson, 2005). Mn(III) is readily oxidized to Mn(IV) when
pH is low and there is a low concentration of Mn(II) present (Johansson, 2005). Although
Mn(III) and Mn(IV) are particularly insoluble in water at neutral pH, solubility can be
increased with chelation by organic ligands (Thamdrup, 2000). Under anoxic acidic and
anoxic neutral environments, Mn(IV) oxides can chemically oxidize Fe(II) (Ratering and
Schnell, 2001). Both water and acid extractions of soil mixtures demonstrate effectiveness in
removing water soluble and sorbed manganese.
COUPLING NITRATE REDUCTION WITH IRON(II) OXIDATION
Early research on nitrate and iron showed that Fe(II) would result in the reduction of
nitrate in the presence and absence of Cu(II), although greater denitrification occurred at
higher levels of Cu(II) (Buresh and Moraghan, 1976). Buresh and Moraghan’s research
found that Cu(II) acted as a catalyst for Fe(II) reduction of nitrate to nitrite. Mineral forms
of Fe(II) are more reactive towards nitrate than dissolved Fe(II). The mixed Fe(II)-Fe(III)
mineral “green rust” can reduce nitrate to ammonium at significant rates while itself
concurrently transforms to magnetite (Fe3O4(s)) (Hansen et al., 1996). Reduction of nitrate
has been shown to occur via the iron(II) oxide mineral wüstite (Rakshit et al., 2005). In this
experiment, nitrate was added to iron(II) oxide, which rapidly consumed nitrate while

7
producing ammonium as the final nitrogen product of the reaction (Rakshit et al., 2005).
Nitrite was present only as a transient intermediate and there was only negligible N2O
production (Rakshit et al., 2005). Nitrate reduction by detrital Fe(II) silicates has also been
shown to occur, which resulted in small amounts of intermediate nitrite production,
suggesting that the nitrate reduced to gaseous products (Postma, 1990). More recent research
has demonstrated that nitrate reduction is strongly coupled with iron(II) oxidation (Weber et
al., 2006; Matocha and Coyne, 2007; Muehe et al., 2009; Samarkin et al., 2010).
Chemical oxidation of iron by nitrate, nitrite, and nitrous oxide under anaerobic
conditions, as well as biological oxidation by lithoautotrophs that use nitrate as the electron
acceptor in the absence of oxygen, has been shown in many laboratory experiments (Straub
et al., 1996). Biotically, various nitrate-reducing bacteria oxidize iron in freshwater sediments
(Hauck et al., 2001). When nitrate is used as the electron acceptor in the absence of oxygen
to oxidize iron(II), the process is called nitrate-dependent iron(II) oxidation. Under
autotrophic growth conditions, nitrate dependent Fe(II) oxidation by a lithoautotrophic
betaproteobacterium, Strain 2002, occurred and produced gaseous nitrogen products, N2O
and N2 (Weber et al., 2006). Strains of denitrifying bacteria (LP-1, AR-1, and ToN1) have
been enriched and grown anaerobically with nitrate and FeSO4,which resulted in the
oxidation of Fe(II) (Straub et al., 1996). In the absence of nitrate in the media, Fe(II) was not
oxidized, providing further evidence of nitrate-dependent iron(II) oxidation (Straub et al.,
1996).
Addition of nitrate to flooded paddy soil where oxygen was not present resulted in
iron(II) oxidation to iron(III) with concomitant nitrate reduction (Ratering and Schnell,
2001). This study was conducted in situ at varying soil depths, which confirms that this
process is happening in natural agroecosystems (Ratering and Schnell, 2001). Furthermore,
this research determined that mixotrophic nitrate-dependent iron(II) oxidizers were present
at soil depths where nitrite existed as a nitrate reduction intermediate in concurrence with
Fe(III), indicating microbes play an important role in nitrate dependent iron(II) oxidation in
the soil environment (Ratering and Schnell, 2001). Nitrate-dependent iron(II) oxidation has
also been reported in freshwater and marine sediments (Benz et al., 1998; Weber et al.,
2006). This process has also been demonstrated in a moderately well drained agricultural soil
(Matocha and Coyne 2007). In this latter study, native soil Fe(III) was not allowed to reduce

8
to Fe(II), so competitive processes (microbial Fe(III) reduction to Fe(II)) were operative
during the reduction of nitrate (Matocha and Coyne, 2007). It is suspected that both biotic
and abiotic activity play roles in nitrate-dependent iron(II) oxidation. While we know nitrate
dependent iron(II) oxidation is occurring, the specific contribution of Fe(II) oxidation to
nitrate reduction has not been clearly established, therefore more research in this area is
needed.
COUPLING THE NITROGEN CYCLE WITH MANGANESE
Denitrification by microorganisms has long been considered the main method of
nitrate transformation to reduced species. However, the possibility of nitrate reduction with
the aid of Mn(II) has been documented (Aller, 1990; Luther et al., 1997). Aller (1990)
documented NO3- and Mn(II) patterns in Panama Basin sediment pore water at increasing
depths. This data showed that after depletion of nitrate, there was an accumulation of Mn(II)
which decreased when nitrate levels began to accumulate after depths of 12cm. From this,
Aller (1990) suggested an idealized pore water reaction in which nitrate reduction to N2, and
manganese oxidation take place concurrently, shown by Equation 2 below:
5Mn2+(aq) + 2NO3
-(aq) +4H2O 5MnO2(s) + N2(g)+ 8H+ [Eqn. 2]
Similar findings were found in South Atlantic sediments in which the reoxidation rate of
Mn(II) significantly affected nitrate reduction rates (Schulz et al., 1994). Schulz et al. (1994)
determined that this is evidence of reoxidation of Mn(II) by nitrate, which could indicate
manganese plays a potentially important role in nitrogen reduction. More recently, in
research in anaerobic conditions in sedimentary zones, NO3- was reduced to N2 by Mn(II)
(Luther et al., 1997). Tebo (1991) monitored manganese (II) oxidation in anoxic conditions
in the Black Sea where he saw a disappearance of manganese, purportedly due to Mn(II)
adsorption or possibly Mn(II) oxidation by nitrate via the involvement of microbes (Luther
et al., 1997). Work in pore water of deep-sea sediments has also shown that nitrate may act
as a model oxidant for Mn(II) when oxygen is not present (Luther et al., 1997). The trend
for nitrate acting as a oxidant of Mn(II) when oxygen is not present has been suggested in
many studies (Aller, 1990; Luther et al., 1997; Schulz et al., 1994). Unfortunately,
contributions of Mn(II) oxidation to nitrate reduction have not been established.

9
COUPLING IRON(II) OXIDATION WITH MANGANESE (III, IV)
REDUCTION
As mentioned in the previous section, nitrate reduction has been closely associated
with Fe(II) oxidation. Another potential sink for Fe(II) removal is oxidation by Mn(III, IV)
oxide minerals (Thamdrup, 2000). Anoxic reactions between the Mn-oxide mineral
birnessite and Fe(II) resulted in the production of Mn(II) via Fe(II) oxidation to Fe(III)
(Postma, 1985). In Postma’s (1985) experiment, if the pH was below 4, the reduction of
birnessite was very quick; however, when pH was at or greater than 4, the birnessite and
Fe(II) reaction was slower. The release of the Mn(II) was slowed at higher pH, changing the
reaction to release Fe(III) and subsequently precipitate FeOOH (Postma, 1985).
Furthermore, the slower release of Mn(II) was expected to be due to FeOOH precipitation
directly on the birnessite surface, therefore blocking the reactive sites, indicating that the
surface reactions determine the reaction rate (Postma, 1985). Similar findings were found by
Postma and Appelo (2000) in a column flow system. Because Mn(II) and Fe(II) have the
affinity to readsorb to their own oxides (Thamdrup, 2000), it is possible that Fe(II) could
sorb to Mn-oxide surfaces, resulting in electron transfer and ultimately in the oxidation of
Fe(II). This secondary reaction might be important where there are unreduced Mn(III, IV)
oxide minerals that oxidize released Fe(II) (Lovley and Phillips, 1988), or where Mn(II) is
oxidized by nitrate, and the resulting Mn(III, IV)-oxides could oxidize Fe(II). This latter
scenario is occurring in our experiments (see chapter 2) and could interfere with the analysis
of Fe(II) oxidation’s contribution to nitrate reduction. Therefore, use of an Fe(II) binding
agent (i.e. ferrozine) may inhibit this secondary reaction to examine the contribution of only
Mn(II) oxidation to nitrate reduction. Research evaluating the contribution of Mn(II)
oxidation to nitrate reduction is lacking, therefore continued work in this area, and in soil
media as opposed to water or sediment, is merited.
OBJECTIVES
The objectives of this thesis are to:
1. Determine the contribution of Fe(II) and Mn(II) oxidation to nitrate reduction in
agricultural soil slurries of the Sadler silt loam by a comprehensive wet chemical
analysis (Chapter 2).

10
2. Evaluate the effect of an electron donor (H2) and winter wheat residue on nitrate-
dependent Fe(II) and Mn(II) oxidation (Chapter 3).
ORGANIZATION OF THESIS
Chapter 1 provides background information, an overview of the research problem, and
objectives. Chapters 2 and 3 provide a detailed description of work done to satisfy the
objectives of the thesis. Chapter 4 discusses conclusions of the research.

11
CHAPTER 2: NITRATE DEPENDENT IRON(II) AND MANGANESE(II)
OXIDATION
Historically, carbon has been considered the most important electron donor for nitrate
reduction (Burford and Bremner, 1975). Nitrate reducers can utilize various carbon sources
for the reduction process. Experiments have shown nitrate reduction with the addition of
plant residues (Paul and Beauchamp, 1989), while others show nitrate reduction with the
addition of lower molecular weight carbon sources (Burford and Bremner, 1975). Some of
these low molecular weight carbon sources include glucose, mannitol, sucrose (Burford and
Bremner, 1975), and acetate (Chidthaisong and Conrad, 2000). Nitrate reducers were shown
to utilize acetate in the presence of nitrate in a rice field soil, resulting in production of
carbon dioxide (Chidthaisong and Conrad, 2000). In pure culture studies, the rate of nitrate
reduction was greatest where acetate was utilized as an electron donor and carbon source
(Van Rijn et al., 1996). A recent comparison of growth yield determinations using pure
cultures of denitrifying bacteria showed that acetate resulted in greater yields when compared
with formate (Strohm et al., 2007).
Other elements have also been shown to play a role in nitrate reduction. Recently,
Fe(II) has been shown to serve as the electron donor for nitrate reduction. Nitrate-
dependent iron oxidation has been reported in sediments, agricultural soils, deep-water
zones, and in flooded paddy soil (Ratering and Schnell, 2001; Weber et al., 2006; Matocha
and Coyne, 2007; Muehe et al., 2009; Samarkin et al., 2010). This process is important in
subsurface environments as the first step in nitrate reduction is primarily biological (Roden,
2012) unless Fe(II) minerals such as green rust or wüstite are present, which can abiotically
reduce nitrate (Matocha et al., 2012). Most of the microorganisms involved are considered
mixotrophs, oxidizing Fe(II) to gain energy but requiring the presence of an organic co-
substrate such as acetate (Muehe et al., 2009; Pantke et al., 2012). There are a few instances
where pure lithotrophic microorganisms have been identified (Roden, 2012). In fact, a pure
lithotrophic culture originally described by Straub et al. (1996) can couple nitrate reduction
to water-soluble Fe(II) and mineral Fe(II) oxidation (Weber et al., 2001; Shelobolina et al.,
2012) utilizing only inorganic carbon as a C source.
While nitrate-dependent Fe(II) oxidation has been shown, the contribution of Fe(II)
oxidation to nitrate reduction has not been well documented. This is due in part to previous

12
studies in which Fe(II) oxidation occurred during the transition period between anaerobic
and aerobic stages (Matocha and Coyne, 2007). If microbial Fe(III) reduction is still
occurring at the time of nitrate addition, it confounds the calculation of moles of Fe(II)
oxidized compared with nitrate reduced because Fe(II) is being produced concomitantly.
Manganese is often overlooked in association with nitrate reduction because of its lack
of abundance in the Earth’s crust. However, Mn(II) may be an additional electron donor for
nitrate reduction. In deep-sea sediments, Luther et al. (1997) speculated that Mn2+ oxidation
was coupled to nitrate reduction. This process might account for patterns in Mn(II)
oxidation in two other studies (Tebo, 1991; Oguz et al., 2001). Upon closer inspection of
the literature, it has been reported that NO3- immediately inhibited Mn(IV) reduction to
Mn(II) by 50% when added to a pure culture of Shewanella, a well-known Mn(IV)-reducing
microorganism (Myers and Nealson, 1988). In soil slurries where both iron and manganese
are present, if Mn(II) is oxidized by NO3- to form Mn(III, IV)-oxide minerals, Fe(II) has the
potential to adsorb to Mn(III, IV)-oxides (Canfield et al., 1993), so oxidation of Fe(II) by
Mn(III, IV)-oxides could occur and act as a secondary reaction competing with the oxidation
of Fe(II) by nitrate. If this secondary reaction occurs, the contribution of Fe(II) oxidation to
nitrate reduction would be unknown. Therefore, the contribution of Mn(II) oxidation to
nitrate reduction would need to be accounted for in order to establish an accurate
contribution of Fe(II) oxidation to nitrate reduction. To account for only the contributions
of Mn(II) oxidation to nitrate reduction, ferrozine can be used as an Fe(II) complexing agent
to eliminate the secondary reaction of Mn-oxide induced Fe(II) oxidation. Elimination of
this secondary reaction using ferrozine has been used in other studies to assess contributions
of organic carbon oxidation to various terminal electron acceptors such as Mn(IV) and
Fe(III) oxides (Canfield et al., 1993). Ferrozine is a good ligand for chelation and has been
shown in many studies to not interfere or complex with manganese (Chapin et al., 2002;
Sarradin et al., 2005; Stookey, 1970), making it an excellent binding agent for this study.
Interference studies by Chapin et al. (2002) showed ferrozine effectiveness was not
compromised by Mn(II) concentrations, up to 1000μM levels.
The objective of these experiments is to determine the contribution of both Fe(II) and
Mn(II) oxidation to nitrate reduction in agricultural soil slurries of the Sadler silt loam via
comprehensive wet chemical analysis.

13
MATERIALS AND METHODS
Iron(II) Oxidation Contribution to Nitrate Reduction
This method is similar to the chemical analysis of stirred-batch method of Matocha and
Coyne (2007) with the use of hydrochloric acid extraction, rather than oxalate extraction, to
follow changes in Fe and Mn chemistry. Another difference was soil slurries were allowed to
reduce all microbially reducible Fe(III) to Fe(II) prior to nitrate addition. Anaerobic
conditions were important in this experiment to prevent oxygen from reacting with Fe(II).
All sampling and reactive work for these experiments was done in an Argon purged
anaerobic chamber (Coy Laboratory Products, Grass Lake, MI). All solutions used in the
experiments were prepared in the glovebox with deionized water, which was deoxygenated
with Ar gas for 3 hours before transferring into the glovebox. A Clark-type polarographic
electrode (Warner Instruments, Hamden, CT) was used to measure oxygen content in the
deionized water to ensure deoxygenation.
To begin, 14 grams of <2mm sieved Sadler soil (Oxyaquic Fraglossudalf, moderately
well drained, silt loam soil) was placed into a 160mL glass serum bottle with a stir bar in
duplicate. These bottles were transferred into the glovebox where a volume of 140mL of
deoxygenated water was added. The time at which water was added to the soil was recorded
as time zero. These bottles were sealed with a rubber septum and aluminum cap using a
crimper. Both bottles were removed from the glovebox and placed on a shaker at low speed.
At the following time points: 24 hours, 48 hours, 72 hours, 7 days, 14 days, 21 days, and 28
days following initial water addition, the bottle containing 140mL-deoxygenated water was
taken back into the glovebox for sampling. Inside the glovebox, the bottle was uncapped
and placed on a magnetic stir plate set at 300 rpm to allow for uniform mixing of the
suspension. At the chosen time points previously described, soil pH and Eh were recorded,
0.5mL soil solution was removed and treated with 0.67M HCl for 1 hour using a rotisserie,
and 7mL of the soil solution was extracted and filtered using 0.2 μm Fisherbrand filter
paper. One milliliter of the filtrate was complexed with 0.01M ferrozine [3-(2-pyridyl)-5,6-
diphenyl-1,2,4-triazine-4], 0.1M MES buffer, pH 6, and deoxygenated water. After the HCl
treated soil slurry finished its one-hour incubation, the solution was filtered and complexed
with 0.1M MES buffer pH 6 and .01M ferrozine. This solution received a one-hour period
to allow for color development before analyzing the sample via ultraviolet-visible

14
spectroscopy (UV-VIS). Both the complexed samples (water and HCl treated) were analyzed
on the UV-VIS (double beam Shimadzu UV-3101PC spectrophotometer) at 562nm to
determine absorbance of the Fe(II)-ferrozine complex (Stookey, 1970). To determine anion
concentrations using ion chromatography, filtrates were run on a Metrohm 800 series
modular IC with a Metrosep 250/4.0 and MetroSep RP guard disc holder and 3.6mM
Na2CO3 eluent (Metrohm, Houston, TX). Additional tests performed on the complexed,
water and acid extracted samples, were total Mn and total Fe absorption using flame atomic
absorption spectroscopy (FAAS) (Shimadzu AA-6800, Kyoto, Japan). Ammonium
concentrations in water filtrates were analyzed colorimetrically (modified indophenol-blue
(Ngo et al., 1982)) using a plate-reader. Water filtrates were also subjected to total organic
carbon analysis (Shimadzu, Kyoto, Japan).
Parallel 160mL glass serum bottles were prepared in the same manner at identical
solid:solution ratios (10 grams soil:100mL water) to follow headspace gas characteristics via
gas chromatography (GC). Nitrous oxide was measured using a Shimadzu GC-8A gas
chromatograph fitted with a 63Ni electron capture detector at 270°C and a Porapak Q
column (Alltech Associates, Inc., USA) (40°C) using nitrogen as the carrier gas (30 mL min-
1). Carbon dioxide was measured using a Shimadzu GC-8A gas chromatograph fitted with a
thermal conductivity detector operated at 100°C and a Porapak Q column (Alltech
Company) (50°C) using helium as the carrier gas (30 mL min-1). Analysis of the gases was
complete within five minutes of injection.
On day 28 of sampling, 0.1mM nitrate was added to both serum bottles in anoxic
conditions. This was taken as the new time 0 and following that, sample times were at 5
minutes, 1 hour, 2 hours, 4 hours, 6 hours, 24 hours, 48 hours, and 72 hours. For each post-
nitrate addition sample, the filtration, complexation and analysis, and the headspace gas
analysis, was the same as the incubation sampling and analysis outlined above.
Treatments were duplicated.
Manganese(II) Oxidation Contribution to Nitrate Reduction
Methods are similar to those in the previous section. The only difference was on day 28
of sampling, 1mM ferrozine was added to each stirred-batch experiment. Ferrozine was
allowed to react with the soil slurries for 10 minutes. Given that the reaction of ferrozine
with Fe(II) is very rapid in pure solutions (Thompsen and Mottola, 1984), this was deemed

15
sufficient time for all the Fe(II) to be chelated in the Sadler soil solutions. After this point,
0.1mM nitrate was added to both serum bottles. This was taken as the new time 0 and
following that, sample times were at 5 minutes, 1 hour, 2 hours, 4 hours, 6 hours, 24 hours,
48 hours, and 72 hours. For each post-nitrate addition sample, the filtration, complexation
and analysis, as well as the headspace gas analysis, were the same as the incubation sampling
and analysis outlined previously. Treatments were duplicated.
RESULTS AND DISCUSSION
The Sadler soil is a silt loam that is moderately well drained with an initial pH of 7.1
and is composed of 22% sand, 67% silt, and 11% clay. Table 2.1 shows the chemical
characteristics of the Sadler silt loam soil. Various fractions of extractable iron and
manganese are presented in Table 2.1 for unreduced Sadler, whole soil and the clay fraction.
Oxalate- to dithionite-extractable Fe ratios were 0.39 and 0.38 for the whole soil and clay
fraction, which suggests the presence of well-crystalline Fe oxide minerals (Schwertmann
and Cornell, 1991). Past studies note that phyllosilicate Fe(III) is also present (Matocha and
Coyne, 2007; Matocha et al., 2012). Total Fe was roughly 20-fold greater than total Mn in
the Sadler whole soil (Table 2.1). Despite its lower total abundance relative to Fe, a greater
fraction of manganese was extractable, relative to total Mn, than when compared with Fe.
Dithionite extracted approximately 55% of the total Fe whereas 90% of the total Mn was
extracted. Mineralogy of the clay fraction determined using x-ray diffraction showed the
presence of hydroxyl-interlayered vermiculite, kaolinite, mica, and a trace of vermiculite.
Total organic carbon (TOC) measured 13 g kg-1 and total nitrogen measured 1.2 g kg-1.

16
Table 2.1: Iron and Mn content of the unreduced Sadler silt loam; whole soil and clay
fraction†.
Iron(II) Oxidation Coupled to Nitrate Reduction
Preincubation
A preincubation was conducted to reduce native Fe(III) to Fe(II). In soil slurries,
there are other naturally occurring terminal electron acceptors present, (nitrate, Mn(III, IV),
and sulfate) and we followed these changes. Preincubation lasted twenty-eight days, during
which the pH of the soil slurry rose slightly from 7.37 to an average of 7.55 while the Eh

17
dropped into reducing conditions (Figure 2.1). The redox potential dropped rapidly over the
first 14 days, from almost 150mV to about -50mV, where it remained level for the remaining
incubation period (Figure 2.1). The rise in pH may have been due to the reduction of native
Mn(III, IV) and Fe(III) minerals, which has been documented to increase alkalinity in
correlation with organic carbon degradation (Vile and Wieder, 1993).
Figure 2.1: Soil pH and Eh during preincubation of the control experiment (error is standard deviation of mean data point).
The thermodynamic reduction sequence, based on decreasing redox potential, begins
with O2, then NO3-, Mn(III, IV), Fe(III), SO4
2-, and finally CO2 (Achtnich et al., 1995). As
Eh dropped in the anaerobic incubation, this is roughly the order in which reduction of the
native species was predicted. Dissolved O2 was not measured. However, the anaerobic
preparation and incubation resulted in minimal O2 within the soil slurries, which was
probably consumed rapidly. Native nitrate concentrations were extremely low initially and
then dropped to even lower concentrations, almost below detection limit, over the 28-day
incubation. This early reduction of nitrate corresponds with the slurry’s Eh being below
250mV, the redox potential previously mentioned as ideal for reduction or disappearance of
nitrate, and the formation of gaseous nitrogen products (Patrick and Jugsujinda, 1992;
Nikolaeva and Eremina, 2005).
After native nitrate was reduced, Mn(III, IV) reduction began. As the Eh became
more negative, Mn(II) concentrations increased over the 28-day incubation (Figure 2.2),
indicating that native Mn(III, IV) was being reduced. Reduction began quickly and was most
TIme (days)
0 5 10 15 20 25 30
pH
7.1
7.2
7.3
7.4
7.5
7.6
7.7
7.8
7.9
Eh (
mV
)
-150
-100
-50
0
50
100
150
200
Soil pH
Eh

18
rapid between 24 hours and 7 days. Acid extractable Mn(II) concentration was initially much
greater than the water extractable Mn(II) concentration, with water extractable Mn(II)
leveling off at 2 μmol g-1, an approximately 1.75μmol g-1 change in concentration. Acid
extractable Mn(II) reached a plateau after 7 d, corresponding to the MnT (Table 2.1). This
shows that all of the soil Mn is reducible under our experimental conditions, where native
soil organic carbon is the sole electron donor.
Time (days)
0 5 10 15 20 25 30
Mn
H2O
(m
ol/g
)
0.0
0.5
1.0
1.5
2.0
2.5
3.0
Mn
HC
l (
mo
l/g)
10
12
14
16
18
20
22
24
26
Mn(II)H2O
Mn(II)HCl
Figure 2.2: Water and acid extractable Mn(II) concentrations during the anaerobic preincubation (error is standard deviation of mean data point).
As the Eh dropped, there was an increase in both the water and HCl extractable
Fe(II) concentration, indicating reduction of native Fe(III) to Fe(II) (Figure 2.3). This
increase was rapid between 3 and 20 days, after which the Fe(II) concentration leveled off,
suggesting the reduction of all native Fe(III) in the soil slurry. Full reduction of Fe(III) took
place between day 21 and day 28, when the Eh was approximately -50mV, a redox potential
lower than the 100mV previously documented for full Fe(III) reduction (Nikolaeva and
Eremina, 2005). Fe(III) reduction is influenced by the presence of reactive organic matter
(Thamdrup, 2000). Because native soil was used, and no OM was removed before
incubation, the OM could be contributing to Fe(III) reduction during preincubation. A
noteworthy feature of Figure 2.3 is the much greater concentration of HCl extractable Fe(II),
shown on the secondary y-axis, than the water extractable Fe(II) concentration. The acid
extractable Fe(II) concentration is 100x greater than the water extractable Fe(II)

19
concentration suggesting a greater amount of sorbed and precipitated Fe(II) as opposed to
water-soluble Fe(II) in the native soil. This trend in extractable Fe(II) is consistent with past
studies (Fredrickson et al., 1998; Matocha and Coyne, 2007).
In contrast to Mn, the plateau in acid extractable Fe(II) corresponded to
approximately 12% of the total Fe (40/335.5=0.119). This indicates that a smaller fraction
of Fe is microbially reducible. This is probably related to the crystalline nature of much of
the Fe pool in the Sadler soil (Feoxalate/Fedithionite =0.39, Table 2.1) which is not as available to
microorganisms as is poorly crystalline Fe (Thamdrup, 2000).
Figure 2.3: Water and acid extractable Fe(II) concentrations during anaerobic preincubation (error is standard deviation of mean data point).
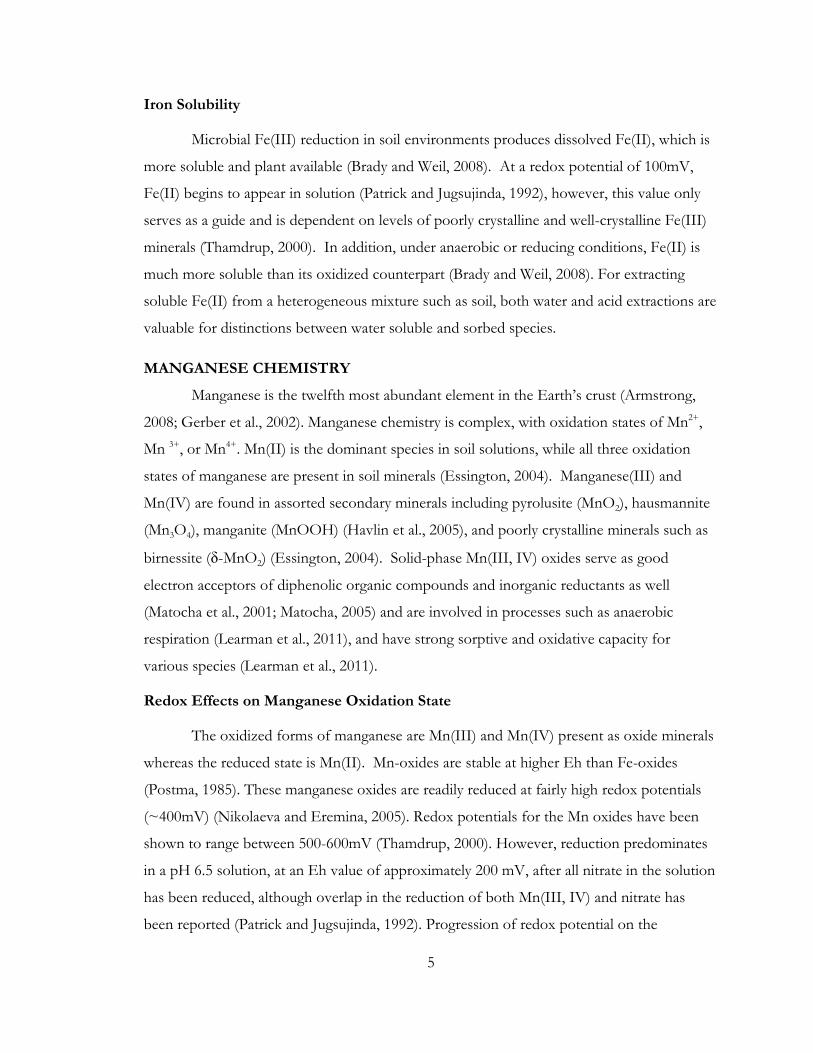
Sulfate concentration increased slightly over the first week of incubation, but
between day 7 and 14, there was a drastic drop in sulfate concentration in the slurry (Figure
2.4). This drop in sulfate concentration suggests that sulfate was reduced, most likely to
sulfide. Other studies have noted a slight increase in sulfate levels followed by a decrease
due to reduction (Achtnich et al., 1995).
Time (days)
0 5 10 15 20 25 30
Fe(I
I)H
2O
(m
ol/g)
-0.1
0.0
0.1
0.2
0.3
0.4
0.5
Fe(I
I)H
Cl (
mol/g)
0
10
20
30
40
50
60
Fe(II)H2O
Fe(II)HCl
20
Figure 2.4: Sulfate concentration during anaerobic preincubation (error is standard deviation of mean data point).
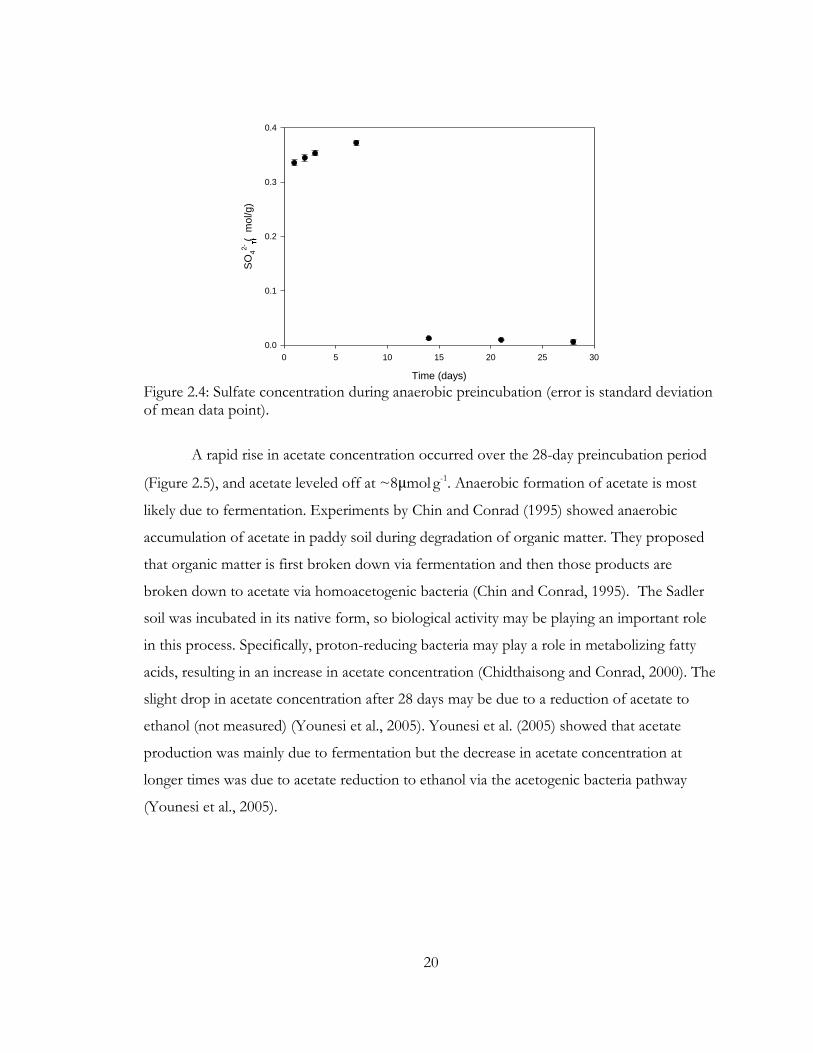
A rapid rise in acetate concentration occurred over the 28-day preincubation period
(Figure 2.5), and acetate leveled off at ~8μmol g-1. Anaerobic formation of acetate is most
likely due to fermentation. Experiments by Chin and Conrad (1995) showed anaerobic
accumulation of acetate in paddy soil during degradation of organic matter. They proposed
that organic matter is first broken down via fermentation and then those products are
broken down to acetate via homoacetogenic bacteria (Chin and Conrad, 1995). The Sadler
soil was incubated in its native form, so biological activity may be playing an important role
in this process. Specifically, proton-reducing bacteria may play a role in metabolizing fatty
acids, resulting in an increase in acetate concentration (Chidthaisong and Conrad, 2000). The
slight drop in acetate concentration after 28 days may be due to a reduction of acetate to
ethanol (not measured) (Younesi et al., 2005). Younesi et al. (2005) showed that acetate
production was mainly due to fermentation but the decrease in acetate concentration at
longer times was due to acetate reduction to ethanol via the acetogenic bacteria pathway
(Younesi et al., 2005).
Time (days)
0 5 10 15 20 25 30
SO
4
2- (
mol/g)
0.0
0.1
0.2
0.3
0.4
21
Figure 2.5: Concentration of acetate during anaerobic preincubation (error is standard deviation of mean data point).
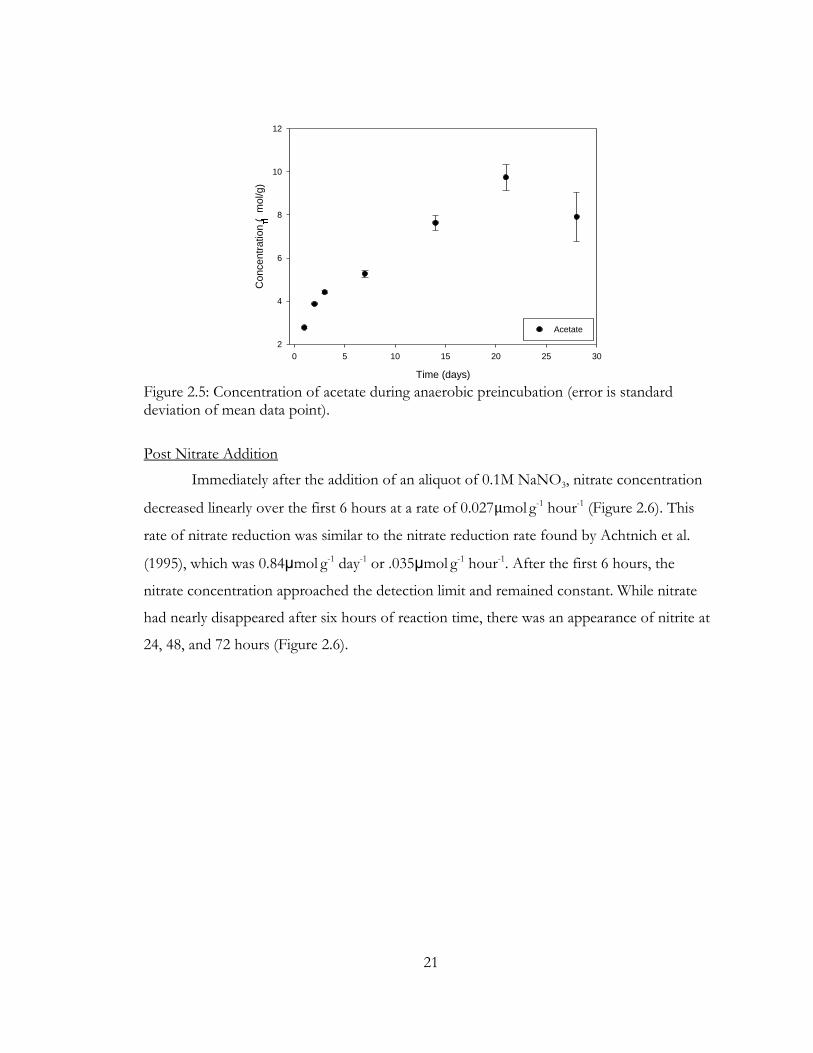
Post Nitrate Addition
Immediately after the addition of an aliquot of 0.1M NaNO3, nitrate concentration
decreased linearly over the first 6 hours at a rate of 0.027μmol g-1 hour-1 (Figure 2.6). This
rate of nitrate reduction was similar to the nitrate reduction rate found by Achtnich et al.
(1995), which was 0.84μmol g-1 day-1 or .035μmol g-1 hour-1. After the first 6 hours, the
nitrate concentration approached the detection limit and remained constant. While nitrate
had nearly disappeared after six hours of reaction time, there was an appearance of nitrite at
24, 48, and 72 hours (Figure 2.6).
Time (days)
0 5 10 15 20 25 30
Co
nce
ntr
atio
n (
mol/g)
2
4
6
8
10
12
Acetate
22
Figure 2.6: Nitrate and nitrite concentrations after the addition of NaNO3
under anaerobic conditions. (y = -0.027x + 1.01; R2 = 0.997; error is standard deviation of mean data point)
Along with the presence of nitrite, there was an increasing concentration of nitrous oxide
until the 6-hour time point (Figure 2.7). A lack of ammonium formation (data not shown),
and the appearance of both nitrite and nitrous oxide while the concentration of nitrate
decreased, provides evidence that nitrate was reduced to nitrogenous gases. This anaerobic
formation of nitrite and nitrous oxide, with no substantial production of ammonium, is
similar to results found by Weber et al. (2006) and Luther et al. (1997).
Time (hours)
0 1 2 4 6 24 48 72
Con
cent
ratio
n (
m
ol/g
)
-0.2
0.0
0.2
0.4
0.6
0.8
1.0
1.2
NO3
-
NO2
-

23
Figure 2.7: Nitrous oxide concentrations after the addition of NaNO3
under anaerobic conditions (error is standard deviation of mean data point).
Post nitrate addition, a gradual increase in Eh occurred, rising to the original Eh of
almost 150mV (Figure 2.8) while the pH increased from 7.6 to 7.9. This rise in Eh provides
evidence that the addition of nitrate stimulated reestablishment of oxidative conditions in
the soil slurry. Furthermore, there is a small rise in pH (Figure 2.8). Although the error over
the first six hours is sizeable, if this increase in pH is real, it may have been caused by
reduction of nitrate, which decreases the concentration of hydrogen ions in the slurry
according to Equation 3 shown below.
10e- + 2NO3- + 12H+ N2 + 6H2O [Eqn. 3]
There was an immediate drop in water-soluble and HCl extractable Mn(II) when
nitrate was added during the first 6 hours of reaction (Figure 2.9). The Eh values (-50 to 0
mV) during this time frame (Figure 2.8) were well below the Eh levels associated with NO3-,
Mn(IV), and Fe(III) reduction, as reported by Patrick and Jugsujinda (1992). This indicates
that the Mn(II) oxidation coupled to nitrate reduction was not due to changes in Eh brought
about by nitrate addition. The water and HCl extractable Mn(II) concentrations
disappeared at rates of 0.178μmol g-1 hour-1 and 0.630μmol g-1 hour-1, respectively during the
first 6 hours. At longer times (24 h and beyond), Mn(II) oxidation decreased, commensurate
with nitrate depletion and higher Eh values (Figures 2.6 and 2.8).
Time (hours)
0 1 2 4 6 24 48 72
N2O
(m
ol/g)
0
1e-5
2e-5
3e-5
4e-5
5e-5
6e-5

24
Figure 2.8: Soil slurry pH and Eh under anoxic conditions after NaNO3 addition (error is
standard deviation of mean data point).
Time (hours)
0 40 60 80
Mn
H2O
(m
ol/g
)
0.2
0.4
0.6
0.8
1.0
1.2
1.4
1.6
1.8
2.0
2.2
2.4
Mn
HC
l (
mo
l/g)
10
12
14
16
18
20
Mn(II)H2O
Mn(II)HCl
Figure 2.9: Water and acid extractable Mn(II) immediately following NaNO3
addition. (Water extractable Mn(II) = -0.178x + 1.88; R2 = 0.994 and acid extractable Mn(II) = -0.730x + 18.05; R2 = 0.847; error is standard deviation of mean data point)
The concentration of Fe(II), both water and acid extractable, also dropped during
the first 6 hours post nitrate addition (Figure 2.10). The rates of Fe(II) disappearance in the
water and HCl extractable fractions were 0.055μmol g-1 hour-1 and 1.63μmol g-1 hour-1,
Time (hours)
0 1 2 4 6 24 48 72
pH
7.2
7.4
7.6
7.8
8.0
8.2
8.4
Eh (m
V)
-100
-50
0
50
100
150
200
Soil pH
Eh
25
respectively. Similar to Mn(II) oxidation, the removal of Fe(II) was not due to significant
increases in Eh during the first 6 h, which agrees with previous work on the Sadler soil
(Matocha and Coyne, 2007).
Figure 2.10: Concentration of water and acid extractable Fe(II) immediately following NaNO3
addition (Water extractable Fe(II) = -0.055x + 0.319; R2 = 0.966 and acid extractable Fe(II) = -1.63x + 43.95; R2 = 0.985; error is standard deviation of mean data point).
One of the objectives of this research was to estimate the contribution of Fe(II) oxidation to
nitrate reduction. This was accomplished using the rates of consumption of Fe(II) and NO3-
, determined as the slopes of the linear least squares fit of water-soluble Fe(II) and NO3-,
from Figures 2.6 and 2.10. In addition, we assumed that the reaction stoichiometry in
Equation 4 is as follows:
[Eqn. 4]
The following steps show how the contribution was calculated:
Step 1: Establish the electron transfer from Equation 4
5 e- transfer
Step 2: Compare the initial slopes of Fe(II) oxidation and NO3- reduction
Step 3: Divide by the number of electrons transferred
Time (hours)
0 1 2 4 6 24 48 72
Fe(II
)H
2O (m
ol/g
)
-0.1
0.0
0.1
0.2
0.3
0.4
Fe(II
)HC
l (
mol
/g)
10
15
20
25
30
35
40
45
50
Fe(II)H2O
Fe(II)HCl
26
Step 4: Multiply by 100 to establish a percentage
From these steps, it was determined that the contribution of Fe(II) oxidation to the
reduction of NO3- was 39.8%.
Half reactions describing nitrate reduction to nitrite were coupled to iron(II) oxidation,
assuming goethite as the reaction product, results in the following equation [Eqn. 5]
NO3- (aq) + 2Fe2+ (aq) + 3H2O NO2
- (aq) + 2FeOOH (s) + 4H+ E°=0.066 [Eqn. 5]
With the pH, nitrate, nitrite, and Fe2+ concentrations from this experiment, the Nernst
equation was used to establish the Ecell of the reaction. Then, the Gibbs free energy was
calculated to be ΔG=-168.3 kJ/mol, indicating that the oxidation of Fe(II) was highly
favorable under these control conditions.
The greater Mn(II) oxidation rates, compared with Fe(II) oxidation (compare Figures
2.9 and 2.10) during nitrate reduction, suggests that the secondary reaction involving
dissolved Fe(II) and freshly precipitated Mn(III, IV) oxides might be operative. This might
account for a portion of the dissolved Fe(II) removed from solution, that is currently
attributed to NO3- alone. This overall reaction has been described by the following equation
(Postma, 1985):
2Fe2+(aq) +MnO2(s) +2H2O
↔ 2FeOOH(s) + Mn2+
(aq) + 2H+ [Eqn. 6]
where MnO2(s) is a representative Mn oxide mineral assumed to be freshly precipitating in
our slurries, and FeOOH(s) is goethite. This reaction has been shown to follow a second
order kinetic rate expression (Postma, 1985; Edwards, 2007):
[ ]
[
] [ ]
[Eqn. 7]
where [
]
is the rate of disappearance of dissolved Fe(II), [
] is the initial Fe(II)
concentration, [ ] is the Mn oxide concentration, is the second order rate
coefficient (L mol-1 h-1), and the factor 2 reflects the stoichiometry in Eqn. 6. Equation 7
can be integrated to solve for dissolved Fe(II) as a function of time:

27
[Eqn. 8]
where was taken as the value obtained at the end of the preincubation (see Figure
2.3) and values were utilized from studies performed by Postma (1985) and Edwards
(2007), respectively. A plot of over time for a value of 1140 L/mol h (from
Edwards, 2007) is shown in Figure 2.11A, along with observed values from the
Sadler control experiments. It is clear that this secondary reaction is relevant in the time
scales of our experiments. Using the rates determined in Figure 2.11B, with corrected values
of Fe2+, the contribution of Fe2+ oxidation to nitrate reduction was reduced to 19%. We
regard this correction as only an estimate, but it serves to illustrate the importance of the
secondary reaction described in Eqn. 6. The value of from Postma’s (1985) study was
2283 L/mol h, which would further lower the contribution of Fe2+ oxidation to nitrate
reduction (data not shown).

28
Time (h)
0 20 40 60 80
Dis
solv
ed F
e2+
(M
)
0
1e-5
2e-5
3e-5
4e-5
5e-5
Fe2+
Observed
Fe2+
Predicted
Time (h)
0 1 2 3 4 5 6 7
Fe
2+ O
xid
ize
d (
M)
5e-6
1e-5
2e-5
2e-5
3e-5
3e-5
NO
3 - R
ed
uce
d (
M)
0
2e-6
4e-6
6e-6
8e-6
1e-5
1e-5
1e-5
2e-5
2e-5
2e-5
Fe2+
NO3 -
A
B
Figure 2.11: A. Water-soluble Fe2+ values predicted using [Eqn. 8] and a k1 value of 1140 L/mol h as compared with observed values from the Sadler soil. B. Corrected concentration values of oxidized Fe2+ as compared with concentrations of reduced nitrate (Water extractable Fe2+= 2.618E-06x + 9.912E-06, R2 = 0.89; NO3
- Reduced = 2.759E-06x + 3.651E-07, R2 = 0.98).
Following the concentrations of acetate and carbon dioxide during the reaction
allowed us to explore the role of carbon during nitrate-dependent Fe(II) oxidation. Despite
the initial excess of acetate over nitrate, acetate concentration remained constant after nitrate
addition during the first six hours (Figure 2.12). This constant concentration, over the first
six hours post nitrate addition, suggests that acetate was not used as a primary electron

29
donor or carbon source early in the reaction. This is surprising, given that acetate is reported
to serve as a good substrate for nitrate reduction (Van Rijn et al., 1996; Chidthaisong and
Conrad, 2000; André et al., 2011). Other dissolved organic carbon phases that were not
measured may have been utilized, as opposed to acetate, during the first six hours of
reaction.
The drop in acetate concentrations commensurate with complete depletion of nitrate
after 6 h and beyond could be due to participation of heterotrophic denitrifying bacteria.
Heterotrophic denitrifiers can experience a lag phase, requiring time to produce enzymes
necessary for denitrification (Smith and Tiedje, 1979). It is also possible that mixotrophic
Fe(II) oxidizing bacteria were consuming acetate concurrent with nitrate reduction. Muehe
et al. (2009) reported that maximum growth of a mixotrophic Fe(II) oxidizing nitrate
reducing microorganism occurred with an Fe(II) plus acetate treatment, when compared
with acetate alone.
Figure 2.12: Concentration of acetate after the addition of NaNO3 (error is standard deviation of mean data point).
Carbon dioxide was also followed after the addition of nitrate. The cumulative CO2 data is
shown as total dissolved inorganic carbon (DIC) in Figure 2.13, below.
Time (hours)
0 1 2 4 6 24 48 72
Conc
entra
tion
(m
ol/g)
-2
0
2
4
6
8
10

30
Figure 2.13: Cumulative total dissolved inorganic carbon (DIC) after the addition of NaNO3
under anoxic conditions (error is standard deviation of mean data point).
Carbon dioxide evolution for the first two hours after nitrate addition was minimal.
However, after 24 hours, greater evolution of gas was found. The increase in CO2
production corresponds with the disappearance of acetate. It has been shown that acetate
can be oxidized to CO2, providing evidence that acetate may have been used as an electron
donor at later times in the reaction (Chidthaisong and Conrad, 2000).
Manganese(II) Oxidation Contribution to Nitrate Reduction
Preincubation
Because soil was treated identically during the preincubation stage of ferrozine-
treated experiment, the preincubation trends were very similar to the preincubation trends
found in the control experiment. These trends are shown in Figure 2.14 (a-e), below.
Time (hours)
0 1 2 4 6 24 48 72
Tota
l DIC
(m
ol/g
)
2
4
6
8
10
12
14
16

31
Figure 2.14: Ferrozine amended soil pH and Eh (a); sulfate concentration (b); water and HCl extractable Fe(II) concentrations (c); water and HCl extractable Mn(II) concentrations (d); and acetate concentration (e) during anaerobic preincubation (error is standard deviation of mean data point).
Post Nitrate Addition
Before the addition of 0.1mM NaNO3 to the soil slurry, 1mM Ferrozine was added
to the slurry to ensure that the native Fe(II) was complexed, essentially eliminating Fe(II)
from the reaction. Once nitrate was added, there was an immediate drop in nitrate
Time (days)
0 5 10 15 20 25 30
So
il p
H
7.4
7.5
7.6
7.7
7.8
7.9
Eh
(m
V)
-100
-50
0
50
100
150
200
Soil pH
Eh
a)
b) c)
d) e)

32
concentration over the first 6 hours (Figure 2.15). Nitrate disappearance occurred at a rate of
0.057µmol g-1 hour-1 over the first 6 hours and then went to nearly the detection limit after
24 hours. This rate of nitrate reduction was two-fold faster than in the control experiment
(0.028µmol g-1 hour-1). Nitrite concentration was negligible, with no appearance after the
addition of nitrate (Figure 2.15).
Figure 2.15: Ferrozine amended soil nitrate and nitrite concentrations after NaNO3 addition (y = -0.057x + 1.45; R2 = 0.999; error is standard deviation of mean data point).
There was an appearance of nitrous oxide, increasing up to almost 3µmol g-1, during the first
6 hours post nitrate addition, after which this gas dropped back down to nearly the detection
limit (Figure 2.16).
Time (hours)
0 1 2 4 6 24 48 72
Con
cent
ratio
n (
m
ol/g
)
0.0
0.2
0.4
0.6
0.8
1.0
1.2
1.4
1.6
NO3
-
NO2
-

33
Figure 2.16: Nitrous oxide concentration after nitrate addition to ferrozine-amended soil slurries (error is standard deviation of mean data point).
The drop in nitrate concentration with the transient appearance of nitrous oxide indicates
that nitrate reduction is proceeding all the way to N2. As in the control, no ammonium was
detected (data not shown).
While the nitrate concentration was rapidly decreasing, there was a decrease in the
concentration of water extractable Mn(II) at a rate of 0.036µmol g-1 hour-1, whereas HCl
extractable Mn(II) remained almost constant (Figure 2.17). The rate of water-soluble Mn(II)
oxidation in the ferrozine-amended soil was much less than the control (see Figure 2.9, 0.178
µmol g-1 hour-1). Apparently, complexing Fe(II) and preventing precipitation to poorly
crystalline Fe(III) minerals during nitrate reduction as that described in Eqn. 4 might have
removed a sink for Mn(II). Mn(II) is known to adsorb to Fe(III) oxide minerals (Junta and
Hochella, 1994) and this might explain the greater rate of Mn(II) removal in the control,
where Fe(II) was actively oxidizing.
Time (hours)
0 1 2 4 6 8 10 12 24 48 72
N2O
(m
ol/g)
-0.5
0.0
0.5
1.0
1.5
2.0
2.5
3.0
3.5

34
Figure 2.17: Ferrozine amended soil water and HCl extractable Mn(II) concentrations post nitrate addition (Water extractable Mn(II) = -0.036x + 1.638; R2 = 0.966 and acid extractable Mn(II) = 0.1647x + 15.98; R2 = 0.464; error is standard deviation of mean data point)
Using the ferrozine-amended Mn(II) oxidation rates, the nitrate reduction rates, and
assuming that Equation 9, below, holds, the contribution of Mn(II) oxidation to nitrate
reduction was 25.2%.
⇔
[Eqn. 9]
Furthermore, from the half-cell reactions of nitrate reduction to nitrite and manganese
oxidation to manganese(II) oxide, Equation 10 below was used to establish a ΔG for our
reaction conditions.
NO3- (aq) + Mn2+(aq) + H2O NO2
- (aq) + MnO2 (s)+ 2H+ E°=-0.395 [Eqn. 10]
Under our stirred batch conditions, the ΔG = -15.75 kJ/mol. This indicates that this
reaction was favorable under our anaerobic stirred batch conditions. Our ΔG is very similar
to that obtained by Luther et al. (1997), in which the same reaction was postulated, over a
range of pH values, to have a ΔGf=-14.20 kJ mole-1. The Mn(II) reaction had a less
spontaneous ΔG than the Fe(II) reaction, ΔG=-168.3 kJ/mol, shown previously (Equation
5).
To our knowledge, this is the first time nitrate-dependent Mn(II) oxidation has been
confirmed in soil. Thermodynamic evidence suggests some abiotic driving force, but
another proposed explanation is metal-reducing bacteria of the genus Shewanella utilizing
Time (hours)
0 1 2 4 6 24 48 72
Mn(
II)H
2O (m
ol/g
)
1.0
1.1
1.2
1.3
1.4
1.5
1.6
1.7
1.8
Mn(
II)HC
l (
mol
/g)
12
13
14
15
16
17
18
19
20
Mn(II)H2O
Mn(II)HCl
35
Mn(II) as an electron donor and coupling this to NO3- reduction. Previous studies have
reported that NO3- immediately inhibited Mn(IV) reduction to Mn(II) by 50% when added
to a pure culture of Shewanella (Myers and Nealson, 1988). One might infer that this was due
to Mn(II) oxidation coupled to NO3- reduction and this has been proposed elsewhere
(Luther et al., 1997). This process was speculated to account for patterns in Mn(II)
oxidation in two other studies (Tebo, 1991; Oguz et al., 2001). Field evidence points to the
possibility of Shewanella sp. playing an active role in reoxidizing end products of their
respiration (namely, Mn(II)) (Staudigel et al., 2006; Bräuer et al., 2011). Bräuer et al. (2011)
further speculate that the ability of Shewanella to oxidize Mn(II) might be a way of storing
electron acceptors (oxidized Mn(IV) oxides) to cope with fluctuating redox conditions. It is
possible that Shewanella species are present, as they have been identified in diverse soil
environments with fluctuating redox status (DiChristina et al., 2005; DeAngelis et al., 2010).
The next logical step would be to characterize the microorganisms present in the Sadler soil,
given that these patterns in Mn(II) and nitrate behavior are present. Studies such as these
warrant further investigation.
The concentration of water extractable Fe(II) remained fairly constant at almost
2.5µmol g-1 while the acid extractable Fe(II) decreased in concentration from 0.75µmol g-1 to
approximately 0.55μmol g-1 over the first 6 hours after nitrate addition (Figure 2.18). These
constant concentrations of Fe(II) were expected with the addition of ferrozine, which was
supposed to block the reaction of iron(II) with other species after the addition of nitrate.
The greater concentration of water extractable Fe(II) than acid extractable Fe(II) differs
from the trends seen in the control experiments. Higher levels of water extractable Fe(II)
may be explained by the addition of ferrozine. Ferrozine is a strong binding agent for iron.
Consequently, when ferrozine was added to the soil slurry, it may have pulled iron from
sorbed sites to form a complex. When an excess of ferrozine is added to solution, complete
Fe(II) complexation has been observed (Sarradin et al., 2005). As a result, the concentration
of water extractable Fe(II) would be greater than that of the acid extractable Fe(II) because
the sorbed Fe(II) that is usually extracted by HCl would mostly be complexed by the
ferrozine.

36
Figure 2.18: Ferrozine amended soil water and HCl extractable Fe(II) concentrations post nitrate addition. (Water extractable Fe(II) = -0.0069x + 2.499; R2 = 0.950 and acid extractable Fe(II) = -0.0334x + 0.743; R2 = 0.913; error is standard deviation of mean data point) As shown previously, the pH of the soil slurry on the 28th day of preincubation was
7.52. However, five minutes after the addition of nitrate, the pH was 7.3, shown in Figure
2.19. This sharp initial drop in pH may have been due to the addition of ferrozine before the
addition of nitrate. Because ferrozine has a pKa=3.13 (Thompsen and Mottola, 1984), this
may have induced a sudden drop in pH. But, after the addition of nitrate, the pH increased
consistently over the remaining time of the experiment, to about pH 7.8 (Figure 2.19). This
is consistent with Equation 3, in which a reduction of nitrate would promote an increase in
pH. The Eh also had an immediate change in the first 5 minutes post nitrate addition. The
Eh jumped from -68mV to almost 0mV where it remained constant until 24 hours after
nitrate addition (Figure 2.19). After 48 and 72 hours, the Eh dropped slightly, to
approximately -30mV. This post nitrate addition Eh trend varies from that of the control
experiment. In the control experiment, Eh increased gradually after nitrate addition, whereas
in this ferrozine-amended experiment, Eh remained constant and even declined slightly.
With ferrozine binding Fe(II) to eliminate Fe(II) reactions, a less dramatic change in redox
potential occurred, indicating that iron oxidation may be a significant factor in increasing
redox potential.
Time (hours)
0 1 2 4 6 24 48 72
Fe
(II)
H2O
(m
ol/g
)
0.0
0.5
1.0
1.5
2.0
2.5
3.0
Fe
(II)
HC
l (
mo
l/g
)
0.3
0.4
0.5
0.6
0.7
0.8
0.9
1.0
1.1
Fe(II)H2O
Fe(II)HCl

37
Figure 2.19: Ferrozine amended soil slurry pH and Eh after nitrate addition (error is standard deviation of mean data point).
The concentration of acetate on day 28 of preincubation was almost 8µmol g-1 and
after the addition of nitrate, the acetate concentration dropped slightly, to about 7µmol g-1,
remaining constant until 24 hours post nitrate addition (Figure 2.20). After 48 hours, the
concentration of acetate increased slightly, to a little over 9µmol g-1 (Figure 2.20). As in the
control experiment, there was little utilization of acetate as an electron donor in the first 24
hours after nitrate addition. This may indicate preferential use of manganese as the electron
donor.
TIme (hours)
0 2 4 6 40 60
pH
7.2
7.3
7.4
7.5
7.6
7.7
7.8
7.9
Eh (
mV
)
-160
-140
-120
-100
-80
-60
-40
-20
0
20
40
Soil pH
Eh

38
Figure 2.20: Acetate concentration post nitrate addition to ferrozine-amended soil (error is standard deviation of mean data point).
Furthermore, the increase in acetate concentration after 24 hours post nitrate addition may
be due to fermentation, as described in Conrad and Klose (2011).
Though acetate was constant over the first 24 hours post nitrate addition, there was
an increasing concentration of total DIC, from 1.5µmol g-1, to almost 2.6µmol g-1, followed
by a small decrease over the next two days (Figure 2.21). Because acetate was not utilized as
an electron donor post nitrate addition, this rise in DIC may be due to consumption of a low
molecular weight organic acids other than acetate by heterotrophic denitrifiers. If so, this
suggests that there may be some competition between Fe(II) oxidizers and heterotrophic
microorganisms for available nitrate, because the rate of nitrate reduction was faster and
DIC consistently increased where Fe(II) is prevented from reacting (in ferrozine amended
slurries), as compared with the control, where minimal changes in DIC occurred.
Time (hours)
0 1 2 4 6 24 48 72
Co
nce
ntr
atio
n (
mol/g)
6
7
8
9
10
11
12
Acetate

39
Figure 2.21: Ferrozine amended soil total cumulative dissolved inorganic carbon (DIC) post nitrate addition (error is standard deviation of mean data point).
CONCLUSIONS
By allowing all of the native soil Fe(III) to reduce to Fe(II), followed by nitrate
addition, we were able to quantify the contribution of Fe(II) oxidation to nitrate reduction in
the Sadler silt loam. Iron oxidation via nitrate addition under anoxic conditions was rapid
and thermodynamically favorable over the first six hours after nitrate addition in the control
experiments. Oxidation of Fe(II) contributed 40% to the reduction of nitrate. Correcting
the water-soluble Fe(II) values for the abiotic secondary reaction involving MnO2 lowered
the value to 19%. Where these contributions were calculated during the first 6 h, there was
no evidence that acetate was utilized as either an electron donor or a carbon source. It is
possible that a combination of biological processes and abiotic processes are involved in this
coupled process. Lithotrophic and mixotrophic microorganisms have been identified that
can couple Fe(II) oxidation to nitrate reduction (Roden, 2012). Assuming that reactive
Fe(II) minerals such as green rust are absent in our systems (the only abiotic pathway to
reduce nitrate at measureable rates), another possibility is a coupled biological-abiotic
process. This might involve nitrate reduction to nitrite by lithotrophic microorganisms
followed by abiotic Fe(II) oxidation coupled to nitrite reduction (Roden, 2012; Matocha et
al., 2012). Nitrite is much more reactive towards Fe(II) in abiotic systems than is nitrate.
Time (hours)
0 1 2 4 6 8 10 24 48 72
DIC
(m
ol/g
)
1.2
1.4
1.6
1.8
2.0
2.2
2.4
2.6
2.8
3.0
3.2

40
At longer reaction times in the Sadler control slurries (>6 h), acetate was removed
from solution and there was a general pattern of increasing carbon dioxide production,
based on measured increases in dissolved inorganic carbon. It is possible that heterotrophic
denitrifiers were active in nitrate reduction, as well as mixotrophic microorganisms, because
Fe(II) continued to decline.
For the first time, it was documented that Mn(II) oxidation was coupled to nitrate
reduction. This was assessed by the addition of ferrozine after 28 days of preincubation.
Ferrozine successfully bound native Fe(II) to eliminate it from being oxidized by Mn(III,
IV)-oxides. This allowed the calculation of the contribution of Mn(II) oxidation to nitrate
reduction to be more accurate. Results indicated that the oxidation of Mn(II) contributed
25.2% to the reduction of nitrate in these stirred-batch reactions.
The sum of the contributions of Fe(II) and Mn(II) oxidation to nitrate reduction was
44%. Although initial soil organic carbon in the Sadler soil was in a three-fold excess over
total Fe (1083.3 mol g-1/333.5 mol g-1) and a 68-fold excess over total Mn (1083.3 mol g-
1/15.9 mol g-1), these inorganic elements account for nearly one-half of the nitrate reduced.
The remainder might be attributed to heterotrophic denitrification. These results
demonstrate that native soil Fe(II) and Mn(II) can serve as electron donors for nitrate
reduction and merit further consideration in denitrification studies, where soil organic
carbon has long been held as the primary electron donor in this process.

41
CHAPTER 3: IMPACT OF HYDROGEN GAS AND PLANT RESIDUE
AMENDMENTS ON NITRATE DEPENDENT IRON(II) AND MANGANESE(II)
OXIDATION
Results from Chapter 2 were obtained with the Sadler’s native terminal electron
acceptors (TEAs) and donors. Nitrate was added under anoxic conditions as a TEA to
simulate a fertilizer addition and it was found that nitrate was reduced concomitantly with
Fe(II) and Mn(II) oxidation. Many studies that have explored how various amendments that
supply electron donors and electron acceptors alter anaerobic processes (Lovley and
Goodwin, 1988; Chidthaisong and Conrad, 2000; Liptzin and Silver, 2009; Salas et al., 2009;
Conrad and Klose, 2011). However, insight into specific changes for both manganese and
iron pools, with the addition of certain amendments, are still not well known.
While nitrate acts as the main electron acceptor in nitrate-dependent Fe(II)
oxidation, effects of the presence of another electron donor in conjunction with nitrate are
worthy of research to explore potential changes in Fe(II) and Mn(II) oxidation contributions
to nitrate reduction. The results of Iannotti et al. (1973) confirmed that H2-utilizing
organisms could cause electrons to be shifted away from production of a typical
fermentation product in favor of the more oxidized product. These findings, in combination
with others, resulted in the establishment of what they deemed “interspecies electron
transfer”, mediated by H2 gas, which is proposed to affect which products are formed under
anaerobic conditions (Iannotti et al., 1973). Under anaerobic conditions, bacterially
mediated organic matter fermentation results in CO2 and H2 products (Dolfing, 1988). Once
present, H2 can reduce inorganic electron acceptors via bacteria (Zinder, 1993). The H2 also
acts as a couple for oxidative and reductive processes in general (Hoehler et al., 1998). In
addition, varying H2 concentrations under laboratory conditions showed significant effects
on the flow of electrons during organic matter decomposition (Hoehler et al., 1998).
Hydrogen production and consumption in sediments where Fe(III) reduction is the terminal
electron accepting process has also been shown (Lovley and Phillips, 1987). Rates of
sediment Fe(III) reduction under anaerobic atmospheres with hydrogen were faster than
when hydrogen was not present in the reaction atmosphere (Lovley and Goodwin, 1988).
Furthermore, there has also been evidence that hydrogen oxidation can be coupled to nitrate

42
and Mn(IV) reduction in sediments (Lovley and Goodwin, 1988), due to hydrogen
disappearance when Mn(IV) and nitrate were added to sediment. However, these potential
couplings have not been well explored. In a heterogeneous mixture such as a soil slurry,
where organic matter is likely present, H2 would act as an ideal electron donor because H2
can act as an effective substrate in the reduction of inorganic electron acceptors.
No-tillage (NT) is the agricultural practice of leaving residue from the previous crop
on the soil surface to prevent erosion, increase yields, and promote water capture, among
other benefits (Havlin et al., 2005). No-tillage is widely used in Kentucky in the production
of corn, soybeans, and small grains. The practice of leaving plant residue on the soil surface
has become increasingly adopted over the past 50 years, especially because of its influence
on nitrogen in the soil. Therefore, effects of plant residue addition on nitrate-dependent
Fe(II) and Mn(II) oxidation were worth exploring.
Denitrification has been historically associated with soil carbon. Organic carbon not
only acts as an energy source for microbial activity, but also acts as an electron donor
(Lescure et al., 1992). Greater reducing conditions have been shown to be induced when
citrate and malate are added to soil (Lescure et al., 1992). Glucose and acetate also promote
reducing conditions, but are not as reducing as citrate and malate (Lescure et al., 1992).
Nitrate reduction in these experiments was attributed more to the carbon than the lowering
of the Eh (Lescure et al., 1992). Research by Paul et al. (1989) determined that adding the
carbon sources acetate, propionate, and butyrate resulted in a positive correlation between
denitrification with respect to the available electrons per mole of carbon. Furthermore,
adding glucose and sucrose lacked correlation with denitrification capacity, possibly because
of competition between fermentative microbes and denitrifiers (Paul et al., 1989).
Nonetheless, mineralizable and water-soluble organic carbon are strongly associated with
increasing denitrification capacity (Burford and Bremner, 1975). Increased denitrification
capacity, in this case, was determined by the amount of (N2O + N2)-N evolved (Burford and
Bremner, 1975). Furthermore, readily decomposable organic matter is a reflection of the
amount of mineralizable carbon present. So, it could be proposed that plant residue, acting
as the readily decomposable organic matter, would increase the denitrification capacity in
stirred batch experiments, in turn effecting the various contributions and rates of nitrate-
dependent Fe(II) and/or Mn(II) oxidation.
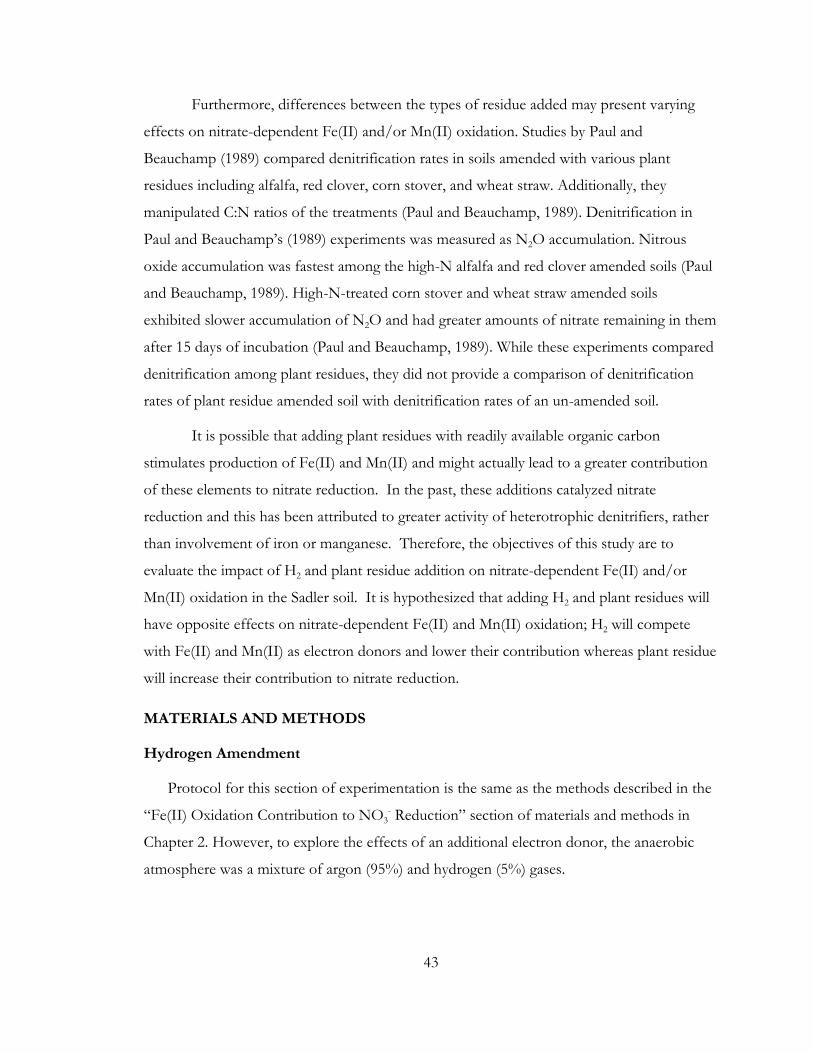
43
Furthermore, differences between the types of residue added may present varying
effects on nitrate-dependent Fe(II) and/or Mn(II) oxidation. Studies by Paul and
Beauchamp (1989) compared denitrification rates in soils amended with various plant
residues including alfalfa, red clover, corn stover, and wheat straw. Additionally, they
manipulated C:N ratios of the treatments (Paul and Beauchamp, 1989). Denitrification in
Paul and Beauchamp’s (1989) experiments was measured as N2O accumulation. Nitrous
oxide accumulation was fastest among the high-N alfalfa and red clover amended soils (Paul
and Beauchamp, 1989). High-N-treated corn stover and wheat straw amended soils
exhibited slower accumulation of N2O and had greater amounts of nitrate remaining in them
after 15 days of incubation (Paul and Beauchamp, 1989). While these experiments compared
denitrification among plant residues, they did not provide a comparison of denitrification
rates of plant residue amended soil with denitrification rates of an un-amended soil.
It is possible that adding plant residues with readily available organic carbon
stimulates production of Fe(II) and Mn(II) and might actually lead to a greater contribution
of these elements to nitrate reduction. In the past, these additions catalyzed nitrate
reduction and this has been attributed to greater activity of heterotrophic denitrifiers, rather
than involvement of iron or manganese. Therefore, the objectives of this study are to
evaluate the impact of H2 and plant residue addition on nitrate-dependent Fe(II) and/or
Mn(II) oxidation in the Sadler soil. It is hypothesized that adding H2 and plant residues will
have opposite effects on nitrate-dependent Fe(II) and Mn(II) oxidation; H2 will compete
with Fe(II) and Mn(II) as electron donors and lower their contribution whereas plant residue
will increase their contribution to nitrate reduction.
MATERIALS AND METHODS
Hydrogen Amendment
Protocol for this section of experimentation is the same as the methods described in the
“Fe(II) Oxidation Contribution to NO3- Reduction” section of materials and methods in
Chapter 2. However, to explore the effects of an additional electron donor, the anaerobic
atmosphere was a mixture of argon (95%) and hydrogen (5%) gases.
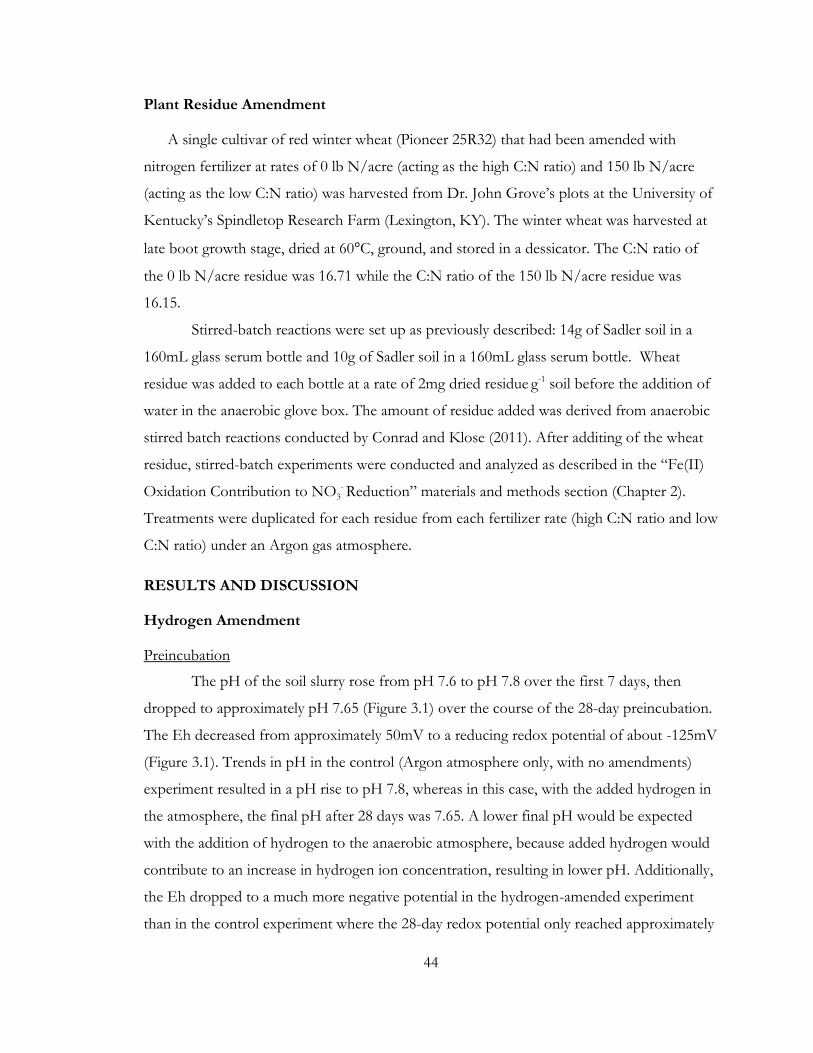
44
Plant Residue Amendment
A single cultivar of red winter wheat (Pioneer 25R32) that had been amended with
nitrogen fertilizer at rates of 0 lb N/acre (acting as the high C:N ratio) and 150 lb N/acre
(acting as the low C:N ratio) was harvested from Dr. John Grove’s plots at the University of
Kentucky’s Spindletop Research Farm (Lexington, KY). The winter wheat was harvested at
late boot growth stage, dried at 60°C, ground, and stored in a dessicator. The C:N ratio of
the 0 lb N/acre residue was 16.71 while the C:N ratio of the 150 lb N/acre residue was
16.15.
Stirred-batch reactions were set up as previously described: 14g of Sadler soil in a
160mL glass serum bottle and 10g of Sadler soil in a 160mL glass serum bottle. Wheat
residue was added to each bottle at a rate of 2mg dried residue g-1 soil before the addition of
water in the anaerobic glove box. The amount of residue added was derived from anaerobic
stirred batch reactions conducted by Conrad and Klose (2011). After additing of the wheat
residue, stirred-batch experiments were conducted and analyzed as described in the “Fe(II)
Oxidation Contribution to NO3- Reduction” materials and methods section (Chapter 2).
Treatments were duplicated for each residue from each fertilizer rate (high C:N ratio and low
C:N ratio) under an Argon gas atmosphere.
RESULTS AND DISCUSSION
Hydrogen Amendment
Preincubation
The pH of the soil slurry rose from pH 7.6 to pH 7.8 over the first 7 days, then
dropped to approximately pH 7.65 (Figure 3.1) over the course of the 28-day preincubation.
The Eh decreased from approximately 50mV to a reducing redox potential of about -125mV
(Figure 3.1). Trends in pH in the control (Argon atmosphere only, with no amendments)
experiment resulted in a pH rise to pH 7.8, whereas in this case, with the added hydrogen in
the atmosphere, the final pH after 28 days was 7.65. A lower final pH would be expected
with the addition of hydrogen to the anaerobic atmosphere, because added hydrogen would
contribute to an increase in hydrogen ion concentration, resulting in lower pH. Additionally,
the Eh dropped to a much more negative potential in the hydrogen-amended experiment
than in the control experiment where the 28-day redox potential only reached approximately

45
50mV. The redox potential could be more negative in this case due to activity of Fe(III) and
Mn(III, IV) reducing bacteria utilizing hydrogen (Lovley and Goodwin, 1988).
Figure 3.1: Soil pH and Eh under hydrogen amended anoxic conditions during preincubation (error is standard deviation of mean data point).
Manganese(II) concentrations, both water and acid extractable, increased rapidly
over the first 14 days of preincubation (Figure 3.2). Manganese(II) concentrations peaked at
14 days, whereas peak Mn(II) production was reached at 21 days in the control experiment
(Figure 2.2). This indicates that native manganese was reduced to manganese(II) fairly early
in the incubation, likely due to the more negative redox potential achieved during this
preincubation. Furthermore, because all other species had reduced, Mn(III, IV) was the next
species to reduce, which occurred by day fourteen. Adding hydrogen has been shown to
couple with Mn(IV) reduction in sediments, so a greater rate of reduction would be expected
(Lovley and Goodwin, 1988). This reduction of Mn(IV) has been attributed to the activity of
microorganisms (Lovley and Goodwin, 1988). Therefore, the drop in Mn(II) concentration
after 14 days, may have been due to a lack of hydrogen-consuming, Mn(III, IV)-reducing
microbes remaining active in the native soil.
Time (days)
0 5 10 15 20 25 30
pH
7.55
7.60
7.65
7.70
7.75
7.80
7.85
Eh (
mV
)
-300
-250
-200
-150
-100
-50
0
50
100
Soil pH
Eh

46
Figure 3.2: Water and HCl extractable Mn(II) concentrations under hydrogen amended anoxic conditions during preincubation (error is standard deviation of mean data point).
During preincubation, water and acid extractable Fe(II) concentrations increased. As
in the previous experiment (Figure 2.3), the acid extractable Fe(II) concentration was 100x
greater than the water extractable Fe(II) concentration. Iron(III) reduction was completed by
day 28 of preincubation. Because there was rapid reduction of manganese during the first
part of preincubation, this may have induced a lag in the reduction of native iron(III). The
lag in total Fe(III) reduction is to be expected because Fe(III) follows Mn(III, IV) in the
redox sequence. The initial and final values of Fe(II) were very similar to those of the
control, increasing from nearly 0μmol g-1 to 0.4μmol g-1 (Figure 3.3). However, the rate of
reduction, to allow all native Fe(III) to reduce to Fe(II), was slower in the hydrogen-
amended experiments than in the control. This slower rate of reduction was not expected as
results, previously mentioned (Lovley and Goodwin, 1988; Achtnich et al., 1995)
demonstrated that adding hydrogen would result in a faster rate of Fe(III) reduction. A
slower reduction rate in this experiment may have been due to the presence of other
terminal electron acceptors also utilizing electrons from the added hydrogen.
Time (days)
0 5 10 15 20 25 30
Mn
H2O
(m
ol/g)
0.2
0.4
0.6
0.8
1.0
1.2
1.4
Mn
HC
l (
mol/g)
6
8
10
12
14
16
18
20
22
Mn(II)H
2O
Mn(II)HCl

47
Figure 3.3: Water and HCl extractable iron(II) concentrations under hydrogen amended anoxic conditions during preincubation (error is standard deviation of mean data point).
Sulfate concentration was initially high, then decreased by 7 days and remained very
low through the remainder of the preincubation (Figure 3.4). Sulfate reduction occurred
fairly quickly. The control and ferrozine amended experiments reached very low
concentrations after approximately 14 days, but this faster reduction of sulfate may be due to
the presence of hydrogen. Hydrogen is acting as an additional electron donor, causing faster
reduction of electron acceptors present in the slurry.
Figure 3.4: Sulfate concentration under hydrogen amended conditions during preincubation (error is standard deviation of mean data point).
Time (days)
0 5 10 15 20 25 30
Fe(I
I)H
2O
(m
ol/g)
-0.1
0.0
0.1
0.2
0.3
0.4
0.5
Fe(I
I)H
Cl (
mol/g)
0
10
20
30
40
50
Fe(II)H
2O
Fe(II)HCl
Time (days)
0 5 10 15 20 25 30
SO
4
2- (
mol/g)
0.0
0.1
0.2
0.3
0.4
0.5

48
In the previous experiments, acetate concentrations would reach ~12μmol g-1 after
21 days, and then drop off to ~8μmol g-1 by the 28th day. However, in this hydrogen-
amended experiment, acetate rose consistently during preincubation, from approximately
3μmol g-1 to about 13μmol g-1 (Figure 3.5). Where methanogens may have been utilizing
acetate at later times during preincubation in the control and ferrozine experiments, resulting
in the drop in acetate concentration at 28 days, it appears that fermentation was continuously
occurring during preincubation, as the acetate concentration never dropped. Some
fermentations result in the production of acetate (Paul and Beauchamp, 1989).
Figure 3.5: Acetate concentration under hydrogen amended anoxic conditions during preincubation (error is standard deviation of mean data point).
Post Nitrate Addition
After adding NaNO3, nitrate concentration fell over the first 6 hours at a rate of
0.05μmol g-1 h-1 (Figure 3.6). This is a higher rate of reduction than in the control experiment
(Figure 2.6). A higher rate of reduction could be due to competition among nitrate-reducing
bacteria, either heterotrophs or lithotrophs, for hydrogen. Nitrate reducers have been
shown to efficiently utilize H2, which would explain the faster nitrate reduction in the
hydrogen-amended experiments (Chidthaisong and Conrad, 2000). In fact, the presence of
nitrate lowers H2 concentrations more than any other TEA (Hoehler et al., 1998). Nitrite
concentration remained consistent near the detection limit over the first 6 hours following
nitrate addition (Figure 3.6). After 24 hours, there was a very slight increase in the
Time (days)
0 5 10 15 20 25 30
Concentr
ation (
mol/g)
2
4
6
8
10
12
14
Acetate
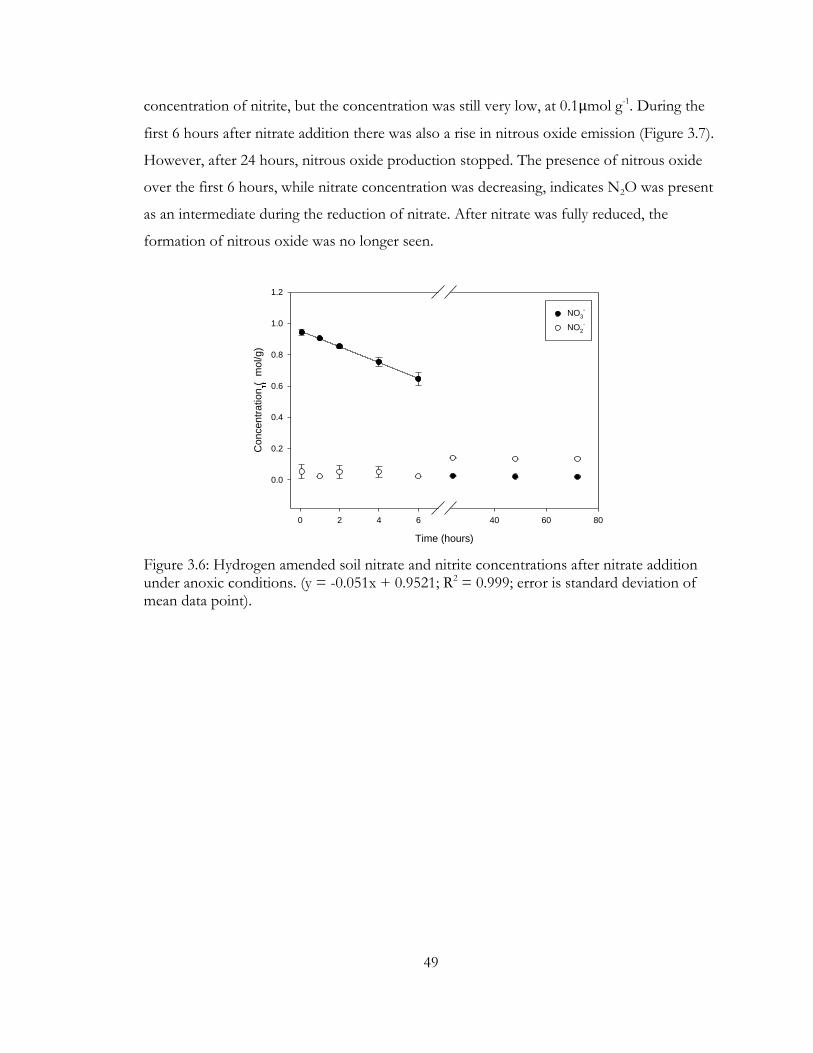
49
concentration of nitrite, but the concentration was still very low, at 0.1μmol g-1. During the
first 6 hours after nitrate addition there was also a rise in nitrous oxide emission (Figure 3.7).
However, after 24 hours, nitrous oxide production stopped. The presence of nitrous oxide
over the first 6 hours, while nitrate concentration was decreasing, indicates N2O was present
as an intermediate during the reduction of nitrate. After nitrate was fully reduced, the
formation of nitrous oxide was no longer seen.
Figure 3.6: Hydrogen amended soil nitrate and nitrite concentrations after nitrate addition under anoxic conditions. (y = -0.051x + 0.9521; R2 = 0.999; error is standard deviation of mean data point).
Time (hours)
0 2 4 6 40 60 80
Concentr
ation (
mol/g)
0.0
0.2
0.4
0.6
0.8
1.0
1.2
NO3
-
NO2
-

50
Figure 3.7: Hydrogen amended soil nitrous oxide concentration after nitrate addition under anoxic conditions (error is standard deviation of mean data point).
Water extractable manganese(II) oxidized rapidly after the nitrate addition (Figure
3.8). The concentration dropped from ~1.4μmol g-1 to ~0.7μmol g-1 over the 72 h period.
The initial rate of Mn(II) oxidation during the first 6 h was 0.062μmol g-1 hour-1. The
concentration of acid extractable manganese(II) varied with time and showed no clear
pattern. While the rate of nitrate reduction was faster with the addition of hydrogen, the rate
of oxidation of Mn(II) after nitrate addition was slower than in the control experiment
(Figure 2.9, -0.178μmol g-1 hour-1 ). This might be explained by competition between H2 and
Mn(II) as electron donors. Hydrogen may have acted as the predominant nitrate reductant,
causing a slower rate of Mn(II) oxidation (Lovley and Goodwin, 1988). Hydrogen is a good
substrate for nitrate-reducers (Chidthaisong and Conrad, 2000; Strohm et al., 2007).
Another explanation might be that the high rate of Mn(II) oxidation in the control was due
to a combination of nitrate reduction and adsorption reactions with freshly formed Fe(III)
oxide minerals (Junta and Hochella, 1994). Addition of ferrozine allowed isolation of the
Mn(II) contribution to nitrate reduction by complexing Fe(II) in the control. In the
hydrogen-amended experiments, we did not add ferrozine to isolate the impact of Mn(II).
Nonetheless, an estimate of the contribution of Mn(II) to nitrate reduction using rates in
Figures 3.6 and 3.8 showed that Mn(II) oxidation accounted for 50% of the reduced nitrate
Time (hours)
0 2 4 6 40 60
N2O
(m
ol/g)
-0.1
0.0
0.1
0.2
0.3
0.4
0.5
51
(0.0248/0.050=0.496). This is roughly double that of the control and should be regarded as
an overestimate pending additional experiments with ferrozine.
Figure 3.8: Hydrogen amended soil water and HCl extractable Mn(II) concentrations post nitrate addition (Water extractable Mn(II) = -0.0623x + 1.42; R2 = 0.9831; error is standard deviation of mean data point). Water extractable iron(II) exhibited a trend similar to that of the water extractable
manganese(II). After adding nitrate, there was a rapid drop in the concentration of water
extractable Fe(II) at a rate of -0.025μmol g-1 hour-1(Figure 3.9). This rate of Fe(II) oxidation
is slower than in the control (Figure 2.10, -0.055μmol g-1 hour-1). As with the oxidation of
Mn(II), the slower rate could be due to preferential reduction of nitrate with hydrogen as the
electron donor (Achtnich et al., 1995). Acid extractable Fe(II) remained constant after the
addition of nitrate (Figure 3.9). Fe(II) oxidation accounted for 10% of the nitrate reduced
(.005/.05=.10).
Time (hours)
0 2 4 6 40 60
Mn
H2O
(m
ol/g)
0.6
0.8
1.0
1.2
1.4
1.6
Mn
HC
l (
mo
l/g)
16.0
16.5
17.0
17.5
18.0
18.5
19.0
19.5
Mn(II)H
2O
Mn(II)HCl

52
Figure 3.9: Hydrogen amended soil water and HCl extractable Fe(II) concentrations post nitrate addition (Water extractable Fe(II) = -0.025x + 0.366; R2 = 0.995 and HCl extractable Fe(II) = -0.06x + 44.99; R2 = 0.032; error is standard deviation of mean data point).
Sulfate concentration was variable after nitrate was added under the hydrogen-
amended conditions (Figure 3.10). Concentration of sulfate remained low and only showed a
distinct increase at 72 hours after the addition of nitrate.
Figure 3.10: Sulfate concentration after nitrate addition under hydrogen amended conditions (error is standard deviation of mean data point).
Time (hours)
0 2 4 6 40 60
Fe
(II)
H2O
(m
ol/g)
0.05
0.10
0.15
0.20
0.25
0.30
0.35
0.40
0.45
Fe
(II)
HC
l (
mo
l/g)
38
40
42
44
46
48
50
52
54
56
Fe(II)H
2O
Fe(II)HCl
Time (hours)
0 40 60 80
SO
4
2- (
mol/g)
0.00
0.02
0.04
0.06
0.08
0.10
0.12

53
The concentration of acetate remained fairly constant over the 72 hours after nitrate
was added to the soil slurries (Figure 3.11). This lack of change in acetate concentration
could be explained by inhibition of processes like methanogenesis via toxic intermediates of
denitrification as described in Chidthaisong and Conrad (2000). While acetate remained
constant, total DIC increased over the 72 hours after nitrate addition (Figure 3.12). Total
cumulative DIC rose from ~8μmol g-1 to ~21μmol g-1. Increase in CO2 has been attributed
to the conversion of acetate and H2 to CO2 when inorganic electron acceptors are available
(Chidthaisong and Conrad, 2000). However, because there is a rise in DIC after nitrate
addition, but no decrease in acetate concentration, this may indicate that microorganisms are
utilizing a different carbon source or hydrogen itself in the increased production of DIC.
Time (hours)
0 2 4 6 40 60
Co
nce
ntr
atio
n (
mo
l/g)
0
2
4
6
8
10
12
14
Acetate
Figure 3.11: Acetate concentration after nitrate addition under hydrogen amended anoxic conditions (error is standard deviation of mean data point).
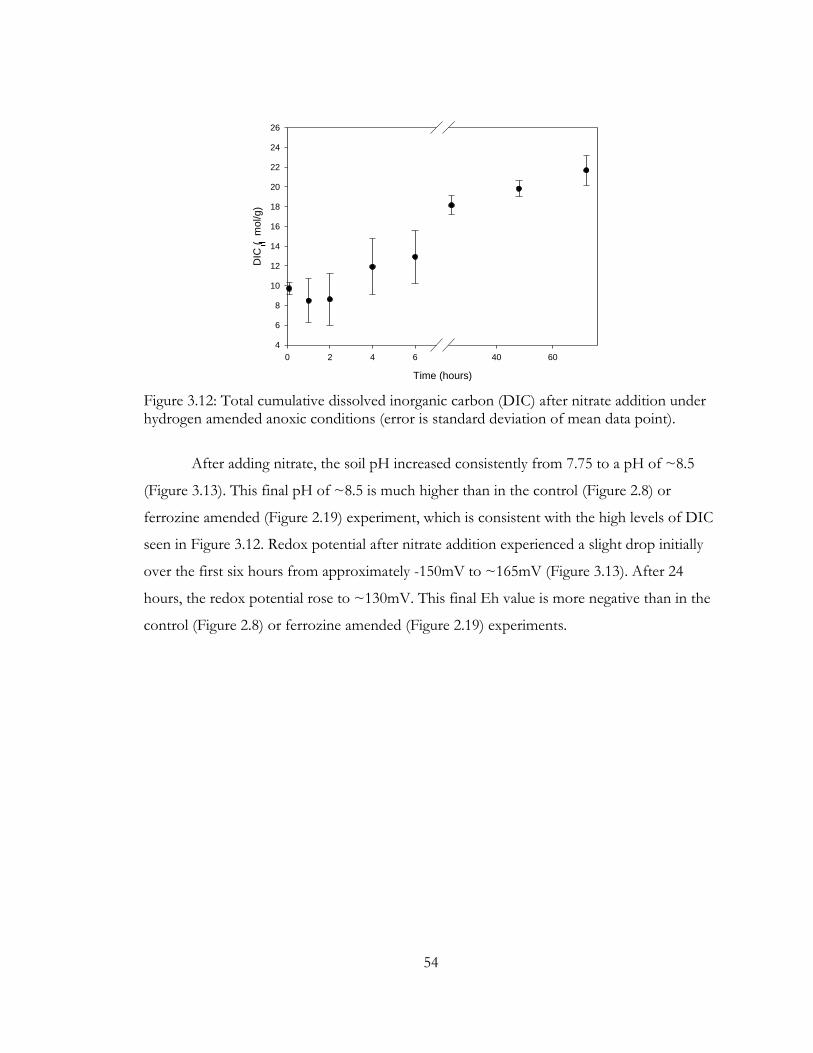
54
Figure 3.12: Total cumulative dissolved inorganic carbon (DIC) after nitrate addition under hydrogen amended anoxic conditions (error is standard deviation of mean data point).
After adding nitrate, the soil pH increased consistently from 7.75 to a pH of ~8.5
(Figure 3.13). This final pH of ~8.5 is much higher than in the control (Figure 2.8) or
ferrozine amended (Figure 2.19) experiment, which is consistent with the high levels of DIC
seen in Figure 3.12. Redox potential after nitrate addition experienced a slight drop initially
over the first six hours from approximately -150mV to ~165mV (Figure 3.13). After 24
hours, the redox potential rose to ~130mV. This final Eh value is more negative than in the
control (Figure 2.8) or ferrozine amended (Figure 2.19) experiments.
Time (hours)
0 2 4 6 40 60
DIC
(m
ol/g)
4
6
8
10
12
14
16
18
20
22
24
26

55
Figure 3.13: Soil pH and Eh, after nitrate addition, under hydrogen amended anoxic conditions (error is standard deviation of mean data point).
Plant Residue Amendment
Preincubation
During preincubation both the high C:N ( low nitrogen - LN) amended and the low
C:N (high nitrogen - HN) amended slurries had similar trends. In both the LN and HN
amended slurries, the soil pH started at ~7.35, rose over the first 3 days to between pH7.4
and 7.45, then dropped to approximately 7.38 for the remainder of the incubation (Figure
3.14). There were also similar trends in the redox potential of LN and HN treated soil
slurries. The Eh for the HN treatment started at ~0mV while the LN treatment started at
approximately -10mV (Figure 3.14). Both treatments saw a drop in Eh to -100mV over the
first 7 days, then an increase and plateau at approximately -50mV for the remainder of the
preincubation (Figure 3.14). Initial pH was lower than the control’s initial pH (Figure 2.1)
because of the addition of the plant residue. Decomposing organic matter, such as the added
wheat residue, produces hydrogen ions, which would result in a lower initial pH (Havlin et
al., 2005). However, the gradual increase in pH may be due to oxidation of additional low
molecular weight organic acids, like formate, present via the residue amendment, in
coordination with iron reduction resulting in a consumption of protons (Salas et al., 2009).
Time (hours)
0 2 4 6 40 60
pH
7.7
7.8
7.9
8.0
8.1
8.2
Eh (
mV
)
-200
-180
-160
-140
-120
-100
Soil pH
Eh

56
Time (days)
0 5 10 15 20 25 30
pH
7.30
7.32
7.34
7.36
7.38
7.40
7.42
7.44
7.46
7.48
7.50
Eh (
mV
)
-140
-120
-100
-80
-60
-40
-20
0
20
Soil pH
Eh
Figure 3.14: pH and Eh during preincubation of high nitrogen (HN) (a) and low nitrogen (LN) (b) residue amended soil slurries (error is standard deviation of mean data point).
During preincubation native manganese was reduced to Mn(II). This process was
more rapid in the HN and LN treated experiments than in the control (Figure 2.2). The
plateau in water extractable Mn(II) occurs at day 21 in both the HN and LN treatments
(Figure 3.15 a,b). In addition, the rate of reduction was faster than in all other treatments.
This faster rate was expected because when plant residues are added to the soil slurry, the
time it takes for reduction of oxidant decreases drastically due to the ratio of electron donors
to electron acceptors (Kumaraswamy et al., 2001).
Time (days)
0 5 10 15 20 25 30
So
il p
H
7.32
7.34
7.36
7.38
7.40
7.42
7.44
Eh
(m
V)
-120
-100
-80
-60
-40
-20
0
20
pH
Eh
a)
b)

57
Figure 3.15: Water and acid extractable Mn(II) concentrations during preincubation of high nitrogen (HN) (a) and low nitrogen (LN) (b) residue amended soil slurries (error is standard deviation of mean data point). Both HN and LN residue amended slurries showed the same trend in the reduction
of iron(III) during preincubation (Figure 3.16). Water extractable Fe(II) concentration rose
from almost 0μmol g-1 to 1.1μmol g-1 while the concentration of acid extractable Fe(II) rose
from 0μmol g-1 to 50μmol g-1 in both the HN and LN treatments (Figure 3.16 a,b).
Reduction of Fe(III) in the water extractable fraction was more rapid than in any other
treatment. This is supported by the results of Liptzin and Silver (2009), which gave evidence
that rates of Fe(III) reduction increased with the amount of carbon added to the soil.
Time (days)
0 5 10 15 20 25 30
Mn
H2O
(m
ol/g)
0.5
1.0
1.5
2.0
2.5
3.0
3.5
4.0
4.5
Mn(I
I)H
Cl (
mo
l/g)
10
12
14
16
18
20
22
24
26
Mn(II)H2O
Mn(II)HCl
Time (days)
0 5 10 15 20 25 30
Mn
H2O (
mol/g)
0.0
0.5
1.0
1.5
2.0
2.5
3.0
3.5
4.0
Mn
HC
l (m
ol/g)
8
10
12
14
16
18
20
22
Mn(II)H2O
Mn(II)HCl
b)
a)

58
Figure 3.16: Water and HCl extractable Fe(II) concentrations during preincubation of high nitrogen (HN) (a) and low nitrogen (LN) (b) residue amended soil slurries (error is standard deviation of mean data point).
Concentrations of sulfate in both HN and LN residue amended slurries were very
similar. The sulfate concentration started high and then dropped after 7 days (Figure 3.17
a,b).
Time (days)
0 5 10 15 20 25 30
Fe(I
I)H
2O
(m
ol/g)
-0.2
0.0
0.2
0.4
0.6
0.8
1.0
1.2
1.4
Fe(I
I)H
Cl (
mol/g)
0
10
20
30
40
50
60
Fe(II)H2O
Fe(II)HCl
Time (days)
0 5 10 15 20 25 30
Fe(I
I)H
2O
(m
ol/g)
-0.2
0.0
0.2
0.4
0.6
0.8
1.0
1.2
1.4
Fe(I
I)H
Cl (
mol/g)
0
10
20
30
40
50
60
Fe(II)H2O
Fe(II)HCl
b)
a)
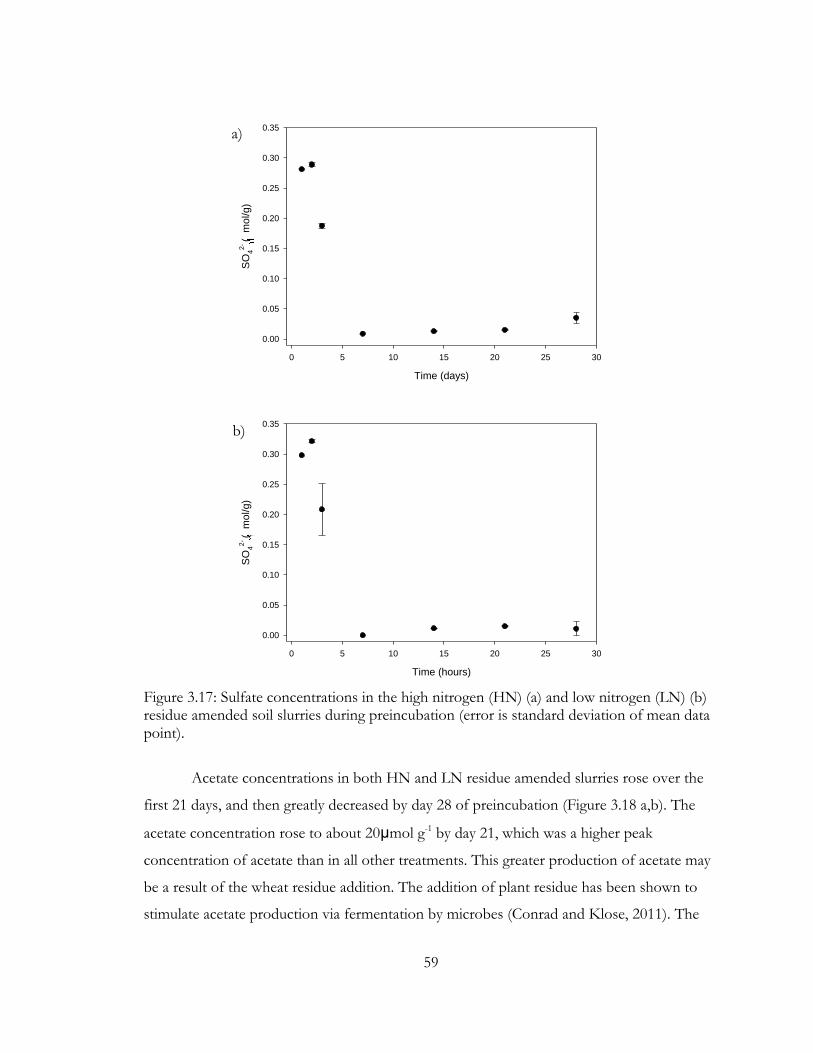
59
Figure 3.17: Sulfate concentrations in the high nitrogen (HN) (a) and low nitrogen (LN) (b) residue amended soil slurries during preincubation (error is standard deviation of mean data point).
Acetate concentrations in both HN and LN residue amended slurries rose over the
first 21 days, and then greatly decreased by day 28 of preincubation (Figure 3.18 a,b). The
acetate concentration rose to about 20μmol g-1 by day 21, which was a higher peak
concentration of acetate than in all other treatments. This greater production of acetate may
be a result of the wheat residue addition. The addition of plant residue has been shown to
stimulate acetate production via fermentation by microbes (Conrad and Klose, 2011). The
Time (days)
0 5 10 15 20 25 30
SO
4
2- (
mo
l/g)
0.00
0.05
0.10
0.15
0.20
0.25
0.30
0.35
Time (hours)
0 5 10 15 20 25 30
SO
4
2- (
mol/g)
0.00
0.05
0.10
0.15
0.20
0.25
0.30
0.35b)
a)

60
drastic drop in acetate concentration at day 28 may be due to the end of fermentation as
consumption of acetate begins via acetoclastic methanogenesis (Conrad and Klose, 2011).
Figure 3.18: Acetate concentrations during preincubation of the high nitrogen (HN) (a) and low nitrogen (LN) (b) residue amended soil slurries (error is standard deviation of mean data point).
Post Nitrate Addition
Nitrate reduced over the first six hours after NaNO3- addition at a rate of 0.030μmol
g-1 h-1 for the HN treated slurries and a rate of 0.031μmol g-1 h-1 for the LN treated slurries
(Figure 3.19 a,b). These rates are similar to the rate of nitrate reduction in the control
Time (days)
0 5 10 15 20 25 30
Concentr
ation (
mol/g)
0
5
10
15
20
25
Acetate
Time (days)
0 5 10 15 20 25 30
Concentr
ation (
mol/g)
0
5
10
15
20
25
Acetate b)
a)

61
experiment, which was 0.027μmol g-1 h-1. From this, it appears that the addition of HN and
LN plant residue had a minimal effect on the rate of nitrate reduction under anaerobic
conditions. This contradicts studies that have shown the denitrification capacity is increased
with an increase in total organic carbon and water-soluble organic carbon or additions of
plant residues (Burford and Bremner, 1975; Beauchamp et al., 1989). There was almost no
N2O production after nitrate addition (Figure 3.20). This is an interesting result because the
nitrate concentration is falling, but there was no intermediate production of nitrous oxide, a
result that was different from all the other treatments. However, nitrite is present as an
intermediate in both HN and LN treated soil slurries (Figure 3.19 a,b). There was a much
greater level of nitrite in the LN treated soil slurry. A lack of nitrous oxide production may
indicate that nitrate is transforming quickly to N2 because ammonium was not produced and
immobilization is unlikely.

62
Figure 3.19: Nitrate concentration after NaNO3 addition in high nitrogen (HN) (a) and low nitrogen (LN) (b) residue amended soil slurries. (HN: y = -0.030x + 1.037; R2 = 0.999 and LN: y = -0.031x + 1.023; R2 = 0.992; the error is standard deviation of mean data point).
Time (hours)
0 2 4 6 40 60
Co
nce
ntr
atio
n (
mol/g)
0.0
0.6
0.8
1.0
1.2
NO3
-
NO2
-
Time (hours)
0 2 4 6 40 60
Concentr
ation (
mol/g)
0.0
0.2
0.4
0.6
0.8
1.0
1.2
1.4
1.6
1.8
2.0
NO3
-
NO2
-
a)
b)
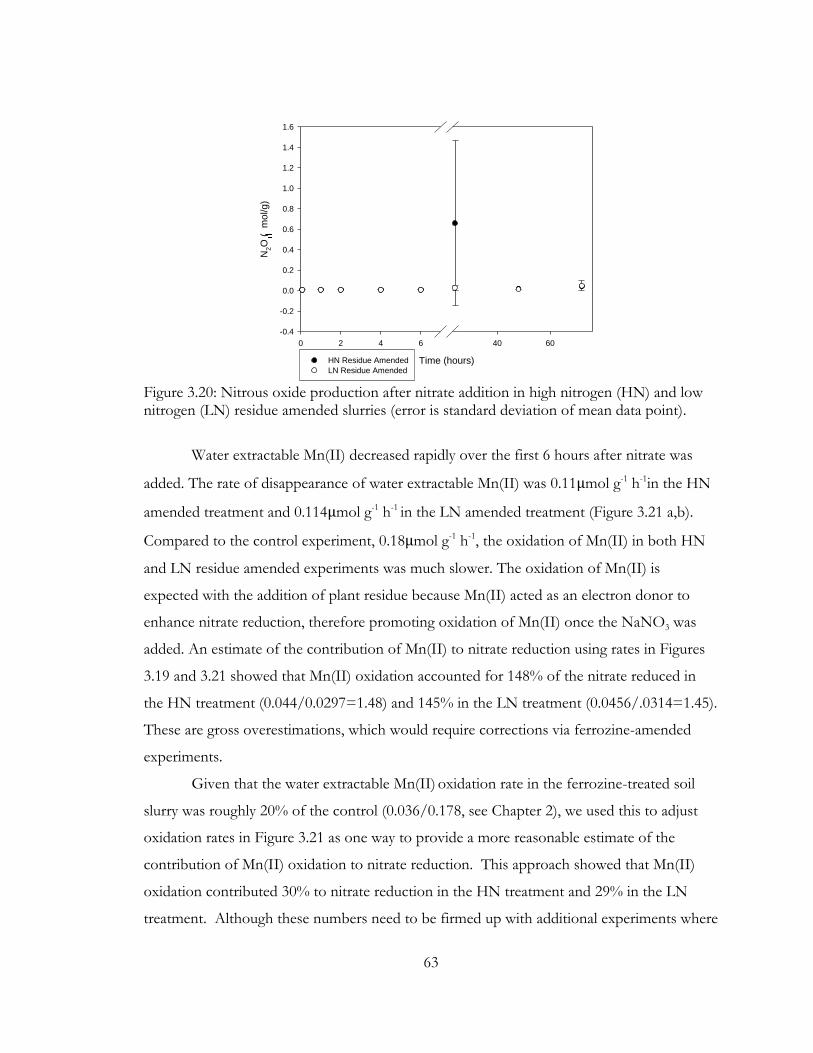
63
Figure 3.20: Nitrous oxide production after nitrate addition in high nitrogen (HN) and low nitrogen (LN) residue amended slurries (error is standard deviation of mean data point).
Water extractable Mn(II) decreased rapidly over the first 6 hours after nitrate was
added. The rate of disappearance of water extractable Mn(II) was 0.11μmol g-1 h-1in the HN
amended treatment and 0.114μmol g-1 h-1 in the LN amended treatment (Figure 3.21 a,b).
Compared to the control experiment, 0.18μmol g-1 h-1, the oxidation of Mn(II) in both HN
and LN residue amended experiments was much slower. The oxidation of Mn(II) is
expected with the addition of plant residue because Mn(II) acted as an electron donor to
enhance nitrate reduction, therefore promoting oxidation of Mn(II) once the NaNO3 was
added. An estimate of the contribution of Mn(II) to nitrate reduction using rates in Figures
3.19 and 3.21 showed that Mn(II) oxidation accounted for 148% of the nitrate reduced in
the HN treatment (0.044/0.0297=1.48) and 145% in the LN treatment (0.0456/.0314=1.45).
These are gross overestimations, which would require corrections via ferrozine-amended
experiments.
Given that the water extractable Mn(II) oxidation rate in the ferrozine-treated soil
slurry was roughly 20% of the control (0.036/0.178, see Chapter 2), we used this to adjust
oxidation rates in Figure 3.21 as one way to provide a more reasonable estimate of the
contribution of Mn(II) oxidation to nitrate reduction. This approach showed that Mn(II)
oxidation contributed 30% to nitrate reduction in the HN treatment and 29% in the LN
treatment. Although these numbers need to be firmed up with additional experiments where
Time (hours)
0 2 4 6 40 60
N2O
(m
ol/g)
-0.4
-0.2
0.0
0.2
0.4
0.6
0.8
1.0
1.2
1.4
1.6
HN Residue Amended
LN Residue Amended
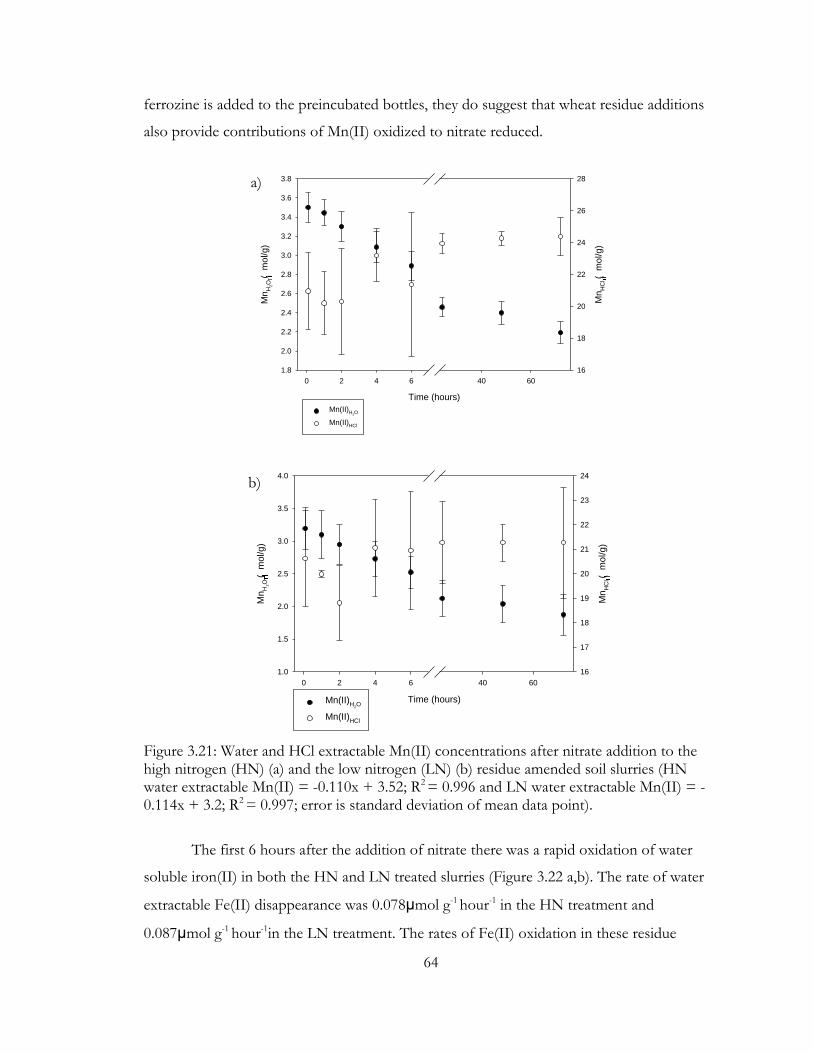
64
ferrozine is added to the preincubated bottles, they do suggest that wheat residue additions
also provide contributions of Mn(II) oxidized to nitrate reduced.
Figure 3.21: Water and HCl extractable Mn(II) concentrations after nitrate addition to the high nitrogen (HN) (a) and the low nitrogen (LN) (b) residue amended soil slurries (HN water extractable Mn(II) = -0.110x + 3.52; R2 = 0.996 and LN water extractable Mn(II) = -0.114x + 3.2; R2 = 0.997; error is standard deviation of mean data point).
The first 6 hours after the addition of nitrate there was a rapid oxidation of water
soluble iron(II) in both the HN and LN treated slurries (Figure 3.22 a,b). The rate of water
extractable Fe(II) disappearance was 0.078μmol g-1 hour-1 in the HN treatment and
0.087μmol g-1 hour-1in the LN treatment. The rates of Fe(II) oxidation in these residue
Time (hours)
0 2 4 6 40 60
Mn
H2O
(m
ol/g)
1.8
2.0
2.2
2.4
2.6
2.8
3.0
3.2
3.4
3.6
3.8
Mn
HC
l (
mo
l/g)
16
18
20
22
24
26
28
Mn(II)H2O
Mn(II)HCl
Time (hours)
0 2 4 6 40 60
Mn
H2O
(m
ol/g)
1.0
1.5
2.0
2.5
3.0
3.5
4.0
Mn
HC
l (
mol/g)
16
17
18
19
20
21
22
23
24
Mn(II)H
2O
Mn(II)HCl
a)
b)

65
amended experiments are faster than the rate of Fe(II) oxidation in the control experiment.
In addition, the contribution of Fe(II) oxidation to nitrate reduction in the HN treatment
was 53% (0.0158/.0297=.532) and 55% in the LN treatment (0.0174/.0297=.554).
Adjusting these contributions, to account for Fe(II) oxidation by MnO2, results in a value of
26% and 27% in the HN and LN treatments. These contributions are higher than in the
control and hydrogen treated experiments and support our hypothesis.

66
Figure 3.22: Water and HCl extractable Fe(II) concentrations after nitrate addition to high nitrogen (HN) (a) and low nitrogen (LN) (b) residue amended soil slurries (HN water extractable Fe(II) = -0.078x + 1.05; R2 = 0.988; LN water extractable Fe(II) = -0.087x + 1.06; R2 = 0.995; error is standard deviation of mean data point).
Sulfate concentration varied and had no distinct pattern after the addition of nitrate
to either the HN or LN residue amended slurries (Figure 3.23 a,b). However, the
concentration of sulfate in the LN amended slurry (Figure 3.23b) is approximately 100-fold
higher than in the HN amended slurry (Figure 3.23a).
Time (hours)
0 2 4 6 40 60
Fe(I
I)H
2O
(m
ol/g)
0.0
0.2
0.4
0.6
0.8
1.0
1.2
Fe(I
I)H
Cl (
mol/g)
30
32
34
36
38
40
42
44
46
48
50
52
Fe(II)H2O
Fe(II)HCl
Time (hours)
0 2 4 6 40 60
Fe(I
I)H
2O
(m
ol/g)
0.0
0.2
0.4
0.6
0.8
1.0
1.2
Fe(I
I)H
Cl (
mol/g)
32
34
36
38
40
42
44
46
48
50
52
Fe(II)H2O
Fe(II)Hcl
a)
b)

67
Figure 3.23: Sulfate concentration after nitrate addition in the high nitrogen (HN) (a) and low nitrogen (LN) (b) residue amended soil slurries (error is standard deviation of mean data point).
Levels of acetate, which started very low due to depletion during the preincubation
(Figure 3.18), increased continuously over the next 72 hours in the HN residue treated soil
slurries after nitrate addition (Figure 3.24a). Acetate concentrations were much lower than
in the control and hydrogen amended experiments, but there was still a general increase in
acetate concentrations. The increased presence of organic acids from the plant residue could
be utilized by denitrifiers, which provides more energy to fermentative bacteria, resulting in
increased production of acetate (Beauchamp et al., 1989). The preferred products of
Time (hours)
0 40 60 80
SO
4
2- (
mol/g)
0.00
0.02
0.04
0.06
0.08
0.10
0.12
0.14
Time (hours)
0 40 60 80
SO
4
2- (
mo
l/g)
0
2
4
6
8
10
12
14b)
a)

68
fermentative bacteria are acetate and H2 (Beauchamp et al., 1989; Paul and Beauchamp,
1989). Extremely high levels of acetate were attained in the LN residue treated soil slurries
after nitrate addition (Figure 3.24b). High levels of acetate in the LN treatment suggest the
presence of biochemical properties in the residue that were not accounted for, which may
have influenced acetate concentrations in this specific treatment.
Time (hours)
0 2 4 6 40 60
Co
nce
ntr
atio
n (
mo
l/g)
0.0
0.2
0.4
0.6
0.8
1.0
1.2
1.4
1.6
1.8
2.0
Acetate
Figure 3.24: Acetate concentrations after nitrate addition to high nitrogen (HN) (a) and low nitrogen (LN) (b) residue amended soil slurries (error is standard deviation of mean data point). There were slight increases in DIC in the first six hours after nitrate addition to both
HN and LN residue amended soil slurries (Figure 3.35). Given that there is still some nitrate
Time (hours)
0 2 4 6 40 60
Concentr
ation (
mol/g)
115
120
125
130
135
140
145
150
Acetate
a)
b)

69
reduction that is unaccounted for (the sum of Mn(II) and Fe(II) oxidation accounted for
approximately 56% of the nitrate reduced in these treatments), this increase in DIC might be
due to the involvement of heterotrophic denitrifiers (Figure 3.25). However, the large error
bars precluded any discussion of treatment differences between HN and LN.
Figure 3.25: Cumulative dissolved inorganic carbon (DIC) after nitrate addition to high nitrogen (HN) and low nitrogen (LN) residue amended soil slurries (error is standard deviation of mean data point). After nitrate addition, the pH of HN amended slurry rose rapidly over the first six
hours, from 7.40 to 7.63 (Figure 3.26 a,b). A similar trend was seen in the LN amended
slurry, in which pH rose from 7.44 to 7.66 over the first six hours after nitrate addition
(Figure 3.26 a,b). After 24 hours, there was a lower pH plateau in both HN and LN
amended slurries, to pH 7.45 and 7.55, respectively. The Eh of both HN and LN amended
slurries also showed similar trends. Soil Eh showed an initial drop to -60mV (HN) and -
70mV (LN) and then rose gradually over the remaining incubation time, to a final Eh of
20mV (Figure 3.26 a,b).
Time (hours)
0 2 4 6 40 60
To
tal D
IC (
mo
l/g)
1.5
2.0
2.5
3.0
3.5
4.0
4.5
5.0
5.5
HN Residue Amended
LN Residue Amended

70
Figure 3.26: Soil pH and Eh after nitrate addition to high nitrogen (HN) (a) and low nitrogen (LN) (b) residue amended soil slurries (error is standard deviation of mean data point).
CONCLUSIONS
The addition of hydrogen gas to the argon atmosphere resulted in an increased
reduction of nitrate after the addition of NaNO3, faster than the rate of nitrate reduction in
the control. The rate of oxidation of Fe(II) and Mn(II) after nitrate addition was slower than
in the control experiments. During preincubation, the addition of hydrogen resulted in
greater quantities and faster rates of reduction for Fe(III) and Mn(III, IV). The hydrogen
Time (hours)
0 2 4 6 40 60
pH
7.30
7.35
7.40
7.45
7.50
7.55
7.60
7.65
Eh (
mV
)
-80
-60
-40
-20
0
20
40
Soil pH
Eh
Time (hours)
0 2 4 6 40 60
Soil
pH
7.40
7.45
7.50
7.55
7.60
7.65
7.70
Eh (
mV
)
-100
-80
-60
-40
-20
0
20
40
pH
EH
b)
a)

71
amendment had the greatest effect on species during preincubation, but encouraged a faster
rate of nitrate reduction after the addition of nitrate.
Wheat residue amendments to the Sadler soil slurries resulted in a similar rate of
nitrate reduction as in the control after the addition of NaNO3. Even with the addition of
wheat residue before preincubation, nitrate reduction happened concurrently with both
Mn(II) and Fe(II) oxidation. The oxidation of Mn(II) and Fe(II) occurred at faster rates than
in both the control and hydrogen amended experiments. When plant residue is left on the
soil surface, as in no-till agriculture, the addition of nitrate under water-logged conditions
could help promote faster oxidation of Mn(II) and Fe(II).

72
CHAPTER 4: THESIS CONCLUSIONS
Nitrate is an important component of the soil environment. It is quickly
transformed, depending on soil conditions. Quick transformation of nitrate can result in the
loss of fertilizer nitrate additions via leaching or, under anaerobic conditions, reduction to
gaseous products that pose threats to the atmosphere. Furthermore, abundant iron
concentrations in the Earth’s crust have been shown to interact with nitrate in the soil. Some
literature has also presented a connection between manganese, a less abundant element, and
nitrate in soil environments.
The first objective of this study was to establish the contribution of Fe(II) oxidation
and Mn(II) oxidation to nitrate reduction. The respective contributions were 39.8% and
25.3% for the first six hours of the reaction. The Fe(II) contribution was lowered to 19%
when accounting for the Fe(II)-MnO2 secondary reaction. These findings are significant in
light of the excess of native soil organic carbon over total Fe and Mn, yet, these latter two
elements are intimately associated with nitrate reduction. Organic carbon becomes involved
in nitrate reduction at longer time periods (>6h) based on the relative increases in dissolved
inorganic carbon coupled with acetate depletion. Furthermore, although manganese was 20-
fold less abundant than iron in the Sadler soil, its oxidation accounted for a significant
portion of nitrate reduction.
The second objective of this study was to examine the effects of hydrogen gas and
wheat residue additives as electron donors on the process of nitrate-dependent Fe(II) and
Mn(II) oxidation. The addition of hydrogen resulted in the acceleration of nitrate reduction,
but decreased the rate of Fe(II) and Mn(II) oxidation. With hydrogen addition, the
contribution of Fe(II) oxidation to nitrate reduction was 10%, while the contribution of
Mn(II) oxidation to nitrate reduction measured 50%, a much higher value than found in the
control experiment, although the Mn(II) oxidation contribution was not corrected. Wheat
residue addition had minimal effect on nitrate reduction (post NaNO3 addition), compared
to the control. However, residue addition did result in a significantly faster reduction of
Fe(III) during preincubation. Iron(II) oxidation accounted for 53% of nitrate reduction in
the HN residue amended experiment and 55% in the LN residue amended experiment.
Contributions of Mn(II) oxidation to nitrate reduction were calculated and found to be

73
overestimations, 148% and 145% in the HN and LN treatments respectively. In the future,
experiments adding ferrozine (as in Chapter 2) for hydrogen gas and wheat residue amended
experiments would provide more accurate estimates of the contributions of both Fe(II) and
Mn(II) oxidation to nitrate reduction.
With the results of these experiments, it has been shown that adding nitrate induces
Fe(II) and Mn(II) oxidation. The contributions of Fe(II) and Mn(II) oxidation to nitrate
reduction could be implemented in water-logged soil environments where anoxic conditions
are prominent, such as rice paddies. When nitrate is added to these flooded soils, it would
promote oxidative conditions within the soil to allow for uptake of nutrients. This has
potential to reduce the necessity of draining paddy fields.
Future experiments could characterize the active microbes in the processes of nitrate
dependent iron(II) and manganese(II) oxidation. More specifically, a focus should be placed
on manganese. As mentioned previously, manganese plays a role in the reduction of nitrate
under the anaerobic conditions, as demonstrated by the ferrozine treated experiment in
chapter 2. Because Mn provides a contribution to nitrate reduction, while being 20-fold less
abundant in the soil than Fe, Mn should not be overlooked in future experiments. The use
of manganese by active microbes such as Geobacter and Shewanella may be the mechanism by
which these contributions are made (Thamdrup, 2000). Using microbiology techniques such
as enumeration, characterization, and protein assays of bacteria involved may provide
insights into biological contributions to nitrate reduction via manganese oxidation.
Contributions such as these would provide insight regarding Mn reaction mechanisms and
could also be done for iron.
While soil organic carbon has been the historic index for nitrate reduction in soil,
this research has shown that both iron and manganese should be considered. This is
especially important given the negative environmental consequences associated with nitrate
reduction, and merits further research.

74
REFERENCES
Achtnich, C, F. Bak, and R. Conrad. 1995. Competition for electron donors among nitrate
reducers, ferric iron reducers, sulfate reducers, and methanogens in anoxic paddy soil.
Biological Ferility of Soils 19:65-72.
Aller, R. C. 1990. Bioturbation and manganese cycling in hemipelagic sediments.
Philisophical Transactions of the Royal Society of London 331: 51-68.
André, L., H. Pauwels, M.C. Dictor, M. Parmentier, and M. Azaroual. 2011. Experiments
and numerical modeling of microbially-catalyzed denitrification reactions. Chemical
Geology 287:171-181.
Armstrong, F. A. 2008. Why did nature choose manganese to make oxygen? Philosophical
Transactions of the Royal Society: Biological Sciences 363(1494): 1263-1270.
Beauchamp, E. G., J. T. Trevors, and J. W. Paul. 1989. Carbon sources for bacterial
denitrification. Advances in Soil Sciences 10: 113-134.
Benz, M., A. Brune, and B. Schink. 1998. Anaerobic and aerobic oxidation of ferrous iron at
neutral pH by chemoheterotrophic nitrate-reducing bacteria. Archives of Microbiology
169(2): 159-165.
Bernas, B. 1968. A new method for decomposition and comprehensive analysis of silicates
by atomic absorption spectrometry. Analytical Chemistry 40:1682-1686.
Brady, N. and R. Weil. 2008. The nature and properties of soils. 14 ed. Prentice Hall, Upper
Saddle River, NJ.
Bräuer, S.L., 2011. Culturable Rhodobacter and Shewanella species are abundant in estuarine
turbidity maxima of the Columbia River. Environ. Microbiol. 13:589-603.
75
Buresh, R. and J. Moraghan. 1976. Chemical reduction of nitrate by ferrous iron. Journal of
Environmental Quality 5(3): 320-325.
Burford, J. and J. Bremner. 1975. Relationships between the denitrification capacities of soils
and total, water-soluble and readily decomposable soil organic matter. Soil Biology and
Biochemistry 7(6): 389-394.
Canfield, D.E., B. Thamdrup, and J.W. Hansen. 1993. The anaerobic degradation of organic
matter in Danish coastal sediments: Iron reduction, manganese reduction, and sulfate
reduction. Geochemica st Cosmochimica Acta 57: 3867-3883.
Chapin, T. P., H. W. Jannasch, and K. S. Johnson. 2002. In situ osmotic analyzer for the
year-long continuous determination of Fe in hydrothermal systems. Analytica Chimica Acta
463(2): 265-274.
Chidthaisong, A. and R. Conrad. 2000. Turnover of glucose and acetate coupled to reduction
of nitrate, ferric iron and sulfate and to methanogenesis in anoxic rice field soil. FEMS
Microbiology Ecology 31: 73-86.
Chin, K.J. and R. Conrad. 1995. Intermediary metabolism in methanogenic paddy soil and
the influence of temperature. FEMS Microbiology Ecology 18: 85-102.
Conrad, R. and M. Klose. 2011. Stable carbon isotope discrimination in rice field soil during
acetate turnover by syntrophic acetate oxidation or acetoclastic methanogenesis. Geochimica
et Cosmochimica Acta 75(6): 1531-1539.
DeAngelis, K. M., W. L. Silver, A. W. Thompson, and M. K. Firestone. 2010. Microbial
communities acclimate to recurring changes in soil redox potential status. Environmental
Microbiology 12(12): 3137-3149.

76
DiChristina, T.J., J. K. Fredrickson, and J. M. Zachara. 2005. Enzymology of electron
transport: Energy generation with geochemical consequences. Reviews in Mineralogy and
Geochemistry 59: 27-52.
Dolfing, J. 1988. Acetogenesis. Biology of Anaerobic Microorganisms. A. J. B. Zahnder,
Wiley-Interscience: 417-468.
Edwards, J. 2007. Reduction of birnessite by dissolved and organic-complexed Fe(II).
Unpublished thesis, University of Kentucky.
Essington, M. E. 2004. Soil and Water Chemistry: An Integrative Approach. Boca Raton,
Florida, CRC Press LLC.
Fredrickson, J.K, J.M. Zachara, D.W. Kennedy, H. Dong, T.C. Onstott, N.W. Hinman,
and S Li. 1998. Biogenic iron mineralization accompanying the dissimilatory reduction of
hydrous ferric oxide by a groundwater bacterium. Geochimica et Cosmochimica Acta
62:3239-3257.
Gerber, G., A. Léonard, and P. Hantson. 2002. Carcinogenicity, mutagenicity and
teratogenicity of manganese compounds. Critical Reviews in Oncology/Hematology 42(1):
25-34.
Hansen, H. B., C. B. Koch, H. Nancke-Krogh, O. K. Borggaard, and J. Sørensen. 1996.
Abiotic nitrate reduction to ammonium: Key role of green rust. Environmental Science &
Technology 30(6): 2053-2056.
Hauck, S., M. Benz, A. Brune, and B.Schink. 2001. Ferrous iron oxidation by denitrifying
bacteria in profundal sediments of a deep lake (Lake Constance). FEMS Microbiology
Ecology 37(2): 127-134.
Havlin, J. L., S. L. Tisdale, W. L. Nelson, and J. D. Beaton. 2005. Soil fertility and fertilizers:
77
An introduction to nutrient management. 7ed. New Jersey: Prentice Hall.
Hoehler, T. M., M. J. Alperin, D. B. Albert, and C. S. Martens. 1998. Thermodynamic
control on hydrogen concentrations in anoxic sediments. Geochimica et Cosmochimica Acta
62(10): 1745-1756.
Iannotti, E., D. Kafkewitz, M. J. Wolin, and M. P. Bryant. 1973. Glucose fermentation
products of Ruminococcus albus grown in continuous culture with Vibrio succinogenes: changes
caused by interspecies transfer of H2. Journal of Bacteriology 114(3): 1231-1240.
Johansson, J. 2005. Manganese solubility due to compaction in soils under corn and soybean.
Dissertation, Lantbruks Universitet Sveriges 2-20. http://ex-
epsilon.slu.se:8080/archive/00000658/01/Exarbete_J_Johansson.slutl.pdf
Junta, J., and M.F. Hochella. 1994. Manganese(II) Oxidation at mineral surfaces-A
microscopic and spectroscopic study. Geochimica et Cosmochimica Acta 58:4985-4999.
Kumaraswamy, S., B. Ramakrishnan, and N. Sethunathan. 2001. Methane production and
oxidation in an anoxic rice soil as influenced by inorganic redox species. Journal of
Environmental Quality. 30(6): 2195-2201.
Learman, D. R., S.D. Wankel, S.M. Webb, N. Martinez, A.S. Madden, and C.M. Hansel
2011. Coupled biotic-abiotic Mn(II) oxidation pathway mediates the formation and
structural evolution of biogenic Mn oxides. Geochimica et Cosmochimica Acta 75: 6048-
6063.
Lescure, C., L. Menendez, R. Lensi, A. Chalamet, and A. Pidello. 1992. Effect of addition of
various carbon substrates on denitrification in a vertic Mollisol. Biology and Fertility of Soils
13(3): 125-129.
Liptzin, D. and W.L. Silver. 2009. Effects of carbon additions on iron reduction and
78
phosphorus availability in a humid tropical forest soil. Soil Biology and Biochemistry 41:
1696-1702.
Lovley, D. R. and S. Goodwin. 1988. Hydrogen concentrations as an indicator of the
predominant terminal electron accepting process in aquatic sediments. Geochimica et
Cosmochimica Acta 52: 11-18.
Lovley, D. R. and E. J. P. Phillips. 1986. Organic matter mineralization with reduction of
ferric iron in anaerobic sediments. Applied and Environmental Microbiology 51: 683-689.
Lovley, D. R. and E. J. P. Phillips. 1987. Competitive mechanisms for inhibition of sulfate
reduction and methane production in the zone of ferric iron reduction in sediments. Applied
and Environmental Microbiology 53(11): 2636-2641.
Lovley, D.R. and E. J. P. Phillips. 1988. Manganese inhibition of microbial iron reduction in
anaerobic sediments. Geomicrobiology Journal 6: 145-155.
Luther, G. W., B. Sundby, B. L. Lewis, P. J. Brendel, and N. Silverberg. 1997. Interactions of
manganese with the nitrogen cycle: Alternative pathways to dinitrogen. Geochimica et
Cosmochimica Acta 61(19): 4043-4052.
Matocha, C. J., D. L. Sparks, J. E. Amonette, and R.K. Kukkadapu. 2001. Kinetics and
mechanisms of birnessite reduction by catechol. Soil Science Society of America Journal
65(1): 58-66.
Matocha, C. J. 2005. Soil chemistry and mineralogy: oxidation-reduction of contaminants.
Encyclopedia of Soils in the Environment. Academic Press, London: 133-140.
Matocha, C. J. and M. S. Coyne. 2007. Short-term response of soil iron to nitrate addition.
Soil Science Society of America Journal 71(1): 108-117.
79
Matocha, C.J., P. Dhakal, and S.M. Pyzola. 2012. The role of abiotic and coupled
biotic/abiotic mineral controlled redox processes in nitrate reduction. Advances in
Agronomy 115: 181-214.
Mehra, O.P., and M.L. Jackson. 1960. Iron oxide removal from soils and clays by a
dithionite-citrate system buffered with sodium bicarbonate. Clays Clay Minerals 7:317-327.
Muehe, E. M., S. Gerhardt, B. Schink, and A. Kappler. 2009. Ecophysiology and the
energetic benefit of mixotrophic Fe (II) oxidation by various strains of nitrate‐reducing
bacteria. FEMS Microbiology Ecology 70(3): 335-343.
Myers, C.R., and K.H. Nealson. 1988. Microbial reduction of manganese oxides: Interactions
with iron and sulfur. Geochimica et Cosmochimica Acta 52: 2727-2732.
Ngo, T. T., A.P.H Pan, C.F. Yam, and H.M. Lenhoff. 1982. Interference in determination of
ammonia with the hypochlorite-alkaline phenol method of Berthelot. Analytical Chemistry
54: 46-49.
Nikolaeva, S. A. and A. M. Eremina. 2005. The oxidaton-reduction status of periodically
waterlogged chernozemic soils. Eurasian Soil Science 38(3): 289-296.
NSW HSC Online. “Nitrogen Cycle.” The role of nitrogen in agricultural production systems. Web.
30 Oct 2012. http://hsc.csu.edu.au/agriculture/production/3363/nitrogen.htm
Oguz, T., J. W. Murray, and A. E. Callahan. 2001. Modeling redox cycling across the
suboxic-anoxic interface zone in the Black Sea. Deep-Sea Research I 48: 761-787.
Pantke, C., M. Obst, K. Benzerara, G. Morin, G. O-Nguema, U. Dippon, and A. Kappler.
2012. Green rust formation during Fe(II) oxidation by the nitrate-reducing Acidovorax sp.
strain BoFeN1. Environmental Science and Technology 46:1439-1446.

80
Patrick, W. and A. Jugsujinda. 1992. Sequential reduction and oxidation of inorganic
nitrogen, manganese, and iron in flooded soil. Soil Science Society of America Journal 56(4):
1071-1073.
Paul, J. W. and E. G. Beauchamp. 1989. Denitrification and fermentation in plant-residue-
amended soil. Biology and Fertility of Soils 7(4): 303-309.
Paul, J. W., E. G. Beauchamp, and J. T. Trevors. 1989. Acetate, propionate, butyrate,
glucose, and sucrose as carbon sources for denitrifying bacteria in soil. Canadian Journal of
Microbiology 35(8): 754-759.
Postma, D. 1985. Concentration of Mn and separation from Fe in sediments--I. Kinetics and
stoichiometry of the reaction between birnessite and dissolved Fe (II) at 10° C. Geochimica
et Cosmochimica Acta 49(4): 1023-1033.
Postma, D. 1990. Kinetics of nitrate reduction by detrital Fe (II)-silicates. Geochimica et
Cosmochimica Acta 54(3): 903-908.
Postma, D. and C. A. J. Appelo. 2000. Reduction of Mn-oxides by ferrous iron in a flow
system: column experiment and reactive transport modeling. Geochimica et Cosmochimica
Acta 64(7): 1237-1247.
Rakshit, S., C. J. Matocha, and G. R. Haszler. 2005. Nitrate reduction in the presence of
wüstite. Journal of Environmental Quality 34(4): 1286-1292.
Ratering, S. and S. Schnell. 2001. Nitrate‐dependent iron (II) oxidation in paddy soil.
Environmental Microbiology 3(2): 100-109.
Roden, E.E. 2012. Microbial iron-redox cycling in subsurface environments. Biochemical
Society Transactions 40:1249-1256.

81
Salas, E.C., W.M. Berelson, D.E. Hammond, A.R. Kampf, and K.H. Nealson. 2009. The
influence of carbon source on the products of dissimilatory iron reduction. Geomicrbiology
Journal 26: 451-462.
Samarkin, V. A., M. T. Madigan, M. W. Bowles, K. L. Casciotti, J. C. Priscu, C. P. McKay,
and S. B. Joye. 2010. Abiotic nitrous oxide emission from the hypersaline Don Juan Pond in
Antarctica. Nature Geoscience 3(5): 341-344.
Santamaria, P. 2006. Nitrate in vegetables: Toxicity, content, intake and EC regulation.
Journal of the Science of Food and Agriculture 86: 10-17.
Sarradin, P. M., N. Le Bris, C. Le Gall, and P. Rodier. 2005. Fe analysis by the ferrozine
method: adaptation to FIA towards in situ analysis in hydrothermal environment. Talanta
66(5): 1131-1138.
Schulz, H. D., A. Dahmke, U. Schinzel, K. Wallmann, and M. Zabel. 1994. Early diagenetic
processes, fluxes, and reaction rates in sediments of the South Atlantic. Geochimica et
Cosmochimica Acta 58(9): 2041-2060.
Schwertmann, U., and R.M. Cornell. 1991. Iron oxides in the laboratory: Preparation and
characterization. VEH, New York.
Shelobolina, E., H. Xu, H. Konishi, R. Kukkadapu, T. Wu, M. Blöthe, and E. Roden. 2012.
Microbial lithotrophic oxidation of structural Fe(II) in biotite. Applied Environmental
Microbiology 78:5746-5752.
Smith, M. S. and J. M. Tiedje. 1979. Phases of denitrification following oxygen depletion in
soil. Soil Biology and Biochemistry 11(3): 261-267.
Sposito, G. 1989. The Chemistry of Soils. USA, Oxford University Press.

82
Staudigel, H., S. R. Hart, A. Pile. B. E. Bailey, E. T. Baker, S. Brooke, D. P. Connelly, L.
Haucke, C. R. German, I. Hudson, D. Jones, A. A. P. Koppers, J. Konter, R. Lee, T. W.
Pietsch, B. M. Tebo, A. S. Templeton, R. Zierenberg, and C. M. Young. 2006. Vailulu’u
Seamong, Samoa: Life and death on an active submarine volcano. Proceedings of the
National Academy of Sciences 103: 6448-6453.
Stookey, L. L. 1970. Ferrozine---a new spectrophotometric reagent for iron. Analytical
Chemistry 42(7): 779-781.
Straub, K. L., M. Benz, B. Schink and F. Widdel. 1996. Anaerobic, nitrate-dependent
microbial oxidation of ferrous iron. Applied and Environmental Microbiology 62(4): 1458-
1460.
Strohm, T.O., B. Griffin, W.G. Zumft, and B. Schink. 2007. Growth yields in bacterial
denitrification and nitrate ammonification. Applied Environmental Microbiology 73:1420-
1424.
Tebo, B. M. 1991. Manganese(II) oxidation in the suboxic zone of the Black Sea. Deep Sea
Research Part A. Oceanographic Research Papers 38, Supplement 2(0): S883-S905.
Temple, K. L. and A. R. Colmer. 1951. The autotrophic oxidation of iron by a new
bacterium: Thiobacillus ferrooxidans. Journal of Bacteriology 62: 605-611.
Thamdrup, B. 2000. Bacterial manganese and iron reduction in aquatic sediments. Advances
in Microbial Ecology. B. Schink. New York, New York, Kluwer Academic/Plenum
Publishers: 41-84.
Thompsen, J.C. and H.A. Mottola. 1984. Kinetics of the complexation of iron(II) with
ferrozine. Analytical Chemistry 56: 755-757.
Van Rijn, J., Tal, Y., and Barak, Y. 1996. Influence of volatile fatty acids on nitrite
83
accumulation by a Pseudomonas stutzeri strain isolated from a denitrifying fluidized bed reactor.
Applied Environmental Microbiology 62: 2615-2620.
Vile, M. A. and K. Wieder. 1993. Alkalinity generation by Fe(III) reduction versus sulfate
reduction in wetlands constructed for acid mine drainage treatment. Water, Air, and Soil
Pollution 69: 425-441
Vitousek, P. M., S. Hättenschwiler, L. Olander, and S. Allison. 2002. Nitrogen and nature.
AMBIO: A Journal of the Human Environment 31(2): 97-101.
Weber, K. A., F. Picardal, and E. Roden. 2001. Microbially catalyzed nitrate-dependent
oxidation of biogenic solid phase Fe(II) compounds. Environmental Science and
Technology 35:1644-1650.
Weber, K. A., J. Pollock, K. A. Cole, S. M. O’Connor, L. A. Achenbach, and J. D. Coates.
2006. Anaerobic nitrate-dependent iron (II) bio-oxidation by a novel lithoautotrophic
betaproteobacterium, strain 2002. Applied and Environmental Microbiology 72(1): 686-694.
Younesi, H., G. Najafpour, and A.R. Mohamed. 2005. Ethanol and acetate production from
synthesis gas via fermentation processes using anaerobic bacterium, Clostridium ljungdahlii.
Biochemical Engineering Journal 27: 110-119.
Zinder, S. H. 1993. Physiological Ecology of Methanogens. p. 128-206 Methanogenesis. J. G.
Ferry. Chapman & Hall: New York, NY.
84
VITA
AUTHOR’S NAME Stephanie Pyzola DATE AND PLACE OF BIRTH May 20, 1987; Midland, Texas EDUCATION B.S. Agricultural Biotechnology, University of Kentucky, Lexington, Kentucky, May 2010 PROFESSIONAL EXPERIENCE Graduate Research Assistant, Department of Plant and Soil Science, University of Kentucky, Lexington, Kentucky. May 2010 – Present. Advisor: Dr. Chris Matocha. Lab Technician, Environmental Soil Chemistry Lab, University of Kentucky, Lexington, Kentucky. October 2008-July 2010. Supervisor: Martin Vandiviere and Dr. Chris Matocha Lab Technician, Department of Physiology, University of Kentucky, Lexington, Kentucky. 2007-2008. Supervisor: Dr. Melinda Wilson SCHOLASTIC HONORS Dean’s List, University of Kentucky 2009-2010 PROFESSIONAL SOCIETIES Soil Science Society of America American Society of Agronomy Crop Science Society of America PUBLICATIONS AND TEACHING
Matocha, C. J., P. Dhakal, and S. M. Pyzola. 2012. The role of abiotich and coupled biotic/abiotic mineral controlled redox processes in nitrate reduction. Advances in Agronomy 115: 181-214. Teaching Assistant, University of Kentucky, Lexington, Kentucky. Lab instructor for PLS 366: Introduction to Soil Science. Spring 2011.