Embed Size (px)
Citation preview

This is an electronic reprint of the original article.This reprint may differ from the original in pagination and typographic detail.
Powered by TCPDF (www.tcpdf.org)
This material is protected by copyright and other intellectual property rights, and duplication or sale of all or part of any of the repository collections is not permitted, except that material may be duplicated by you for your research use or educational purposes in electronic or print form. You must obtain permission for any other use. Electronic or print copies may not be offered, whether for sale or otherwise to anyone who is not an authorised user.
Nishiyama, Yoshiharu; Asaadi, Shirin; Ahvenainen, Patrik; Sixta, HerbertWater-induced crystallization and nano-scale spinodal decomposition of cellulose in NMMOand ionic liquid dope
Published in:Cellulose
DOI:10.1007/s10570-018-2148-x
Published: 15/01/2019
Document VersionPeer reviewed version
Published under the following license:Unspecified
Please cite the original version:Nishiyama, Y., Asaadi, S., Ahvenainen, P., & Sixta, H. (2019). Water-induced crystallization and nano-scalespinodal decomposition of cellulose in NMMO and ionic liquid dope. Cellulose, 26(1), 281-289.https://doi.org/10.1007/s10570-018-2148-x

1
Water-induced crystallization and nano-phase
decomposition of cellulose in NMMO and
ionic liquid dope
Yoshiharu Nishiyama1*, Shirin Asaadi2, Patrik Ahvenainen3, and Herbert Sixta2
1 Univ. Grenoble Alpes, CNRS, CERMAV, 38000 Grenoble, France
2 Department of Forest Products Technology, Aalto University, P.O. Box 16300,
Vuorimiehentie 1, Espoo, FI-00076, Finland
3 Department of Physics, University of Helsinki , FI-00014, Finland
Phone: +33 (0) 476 03 76 05
E-mail: [email protected]
We followed the cellulose structuration induced by water diffusion into Lyocell and Ioncell dope
based on N-Methylmorpholine N-oxide (NMMO) and 1,5-diazabicyclo[4.3.0]non-5-ene acetate
([DBNH][OAc] by using scanning simultaneous small- and wide angle scattering (SAXS-WAXS)
experiment along the diffusion gradient. The water content at each point was estimated from the
wide angle scattering profile, giving a binary diffusion constant of the order of 5×10⁻¹⁰ m2/sec. In
the case of Lyocell dope, diffraction peaks corresponding to cellulose II appeared concomitantly
with the increase in small angle scattering features indicative of nanofibril formation. In the case
of Ioncell dope, increase in small angle scattering intensity with the progression of water content
appeared at scattering vector q = 0.015 Å-1 corresponding to a correlation length of about 40 nm,
indicative of nanometric phase decomposition preceding the coagulation process, though no
crystalline peak appeared in the wide angle scattering.
SAXS-WAXS, dissolution, regeneration, coagulation, diffusion, ionic liquid
2
Introduction
Structure formation during the processing from highly concentrated solution dope is a crucial step
to control the final material properties in solution processing, including fiber spinning, membrane
generation or fabrication of other functional materials. One of the reasons of the success of viscose
process for cellulose, despite its environmental concerns, is the versatility to generate different
types of structure and properties in the operation conditions. For other potential solvent systems
that can be more environmentally benign to be deployed more massively, the control of the
structural formation is a key. However, little is known on the structure formation process at the
nanometric length scale.
NMMO is a solvent used in the industrial production of cellulose fibers called Lyocell while
[DBNH][OAc] is a new ionic solvent that has promising characteristics as next generation solvent
for cellulose processing. Both are miscible with water but loose their cellulose dissolution capacity
with excess water. Thus water is used as non-solvent to regenerate cellulose. In the spinning
process, the humidity in the air gap is known to be important an important parameter 1, but its role
remains hypothetical in the absence of experimental data on the structure modification.
The regeneration of process by non-solvent, in this case water, is a complex process involving
diffusion of non-solvent into the dope, diffusion of different solvent molecules into coagulation
bath and the structure formation and swelling or contraction of the regenerating gel. Thus there is a
huge difference of estimated diffusion coefficients depending on experimental approach and
diffusion model employed.
A critical review of the literature data is available in recent report by Hedlund et al (2017). The
reported value of diffusion coefficient of water and NMMO in NMMO/cellulose dope measured
by visual inspection of diffusion front (Biganska2005), after correction of equation as pointed out
by Hedlund et al (multiplication by factor of 4), was 4.4×10⁻⁹ m2/s, which is higher than the self-
diffusion coefficient of water at ambient conditions (2.57×10⁻⁹ m2/s). The self diffusion of NMMO
out of to the coagulation bath was estimated about one order of magnitude lower, and further
decreasing with in presence of cellulose (Biganska2005).
By using NMR diffusometry, Laity et al (2012) gave diffusion constant of NMMO/cellulose
solution to be of the order of 4×10-12 m2/s, which increases to the order of 1.5×10⁻⁹ m2/s in the
course of coagulation with water, while global effective diffusion during coagulation as estimated
from composition change was 1.4 ×10⁻¹⁰ m2/s (Laity2002). Similar NMR studies on ionic liquid
systems show the diffusion coefficient of pure ionic liquid (1‑ethyl-3-methyl-imidazolium
acetate) to be 10-11 m2/s that can go down by two decades in presence of carbohydrates due to the
association with hydroxyl groups (Ries 2014). In the ionic liquid-water system, the diffusion
constant of ionic liquid increases under the presence of water, while that of water is slowed down
by the presence of ionic liquid (Hall2012).
The diffusion of solvents and non-solvents during regeneration of cellulose depend also on the
structure of regenerating cellulose. Gavillon and Budtova (2007) measured decreased diffusion
coefficients of NaOH and NMMO in the presence of coagulating cellulose that would indicate
homogeneous gel formation where individual chains would interact with the solvent, whereas
3
Hedlund (2017) observe little effect of cellulose in [C2min][OAc] system indicative of
heterogeneous gel formation in which most of cellulose chains would be excluded from the solvent
system. However, diffusion is affected by many factors, and the structure of coagulating cellulose,
which can also depend on cellulose concentration, cannot directly determined from diffusion data.
X-ray scattering is a powerful tool to probe spatial arrangement, from sub-nanometric to sub-
micrometric length scale inside a sample. In this study, we measured simultaneous small- and wide
angle X-ray scattering on regenerating cellulose near water (coagulant) solution interface to follow
the structural formation.
Experimental
Materials
Enocell birch pre-hydrolyzed kraft pulp (PHK) with DP 1007, Mw = 274.3 kg mol−1 , Mn = 68.2
kg mol−1 and PDI = 4 from Stora Enso, Finland was used as a cellulose solute. 1,5-
Diazabicyclo[4.3.0]non-5-ene (DBN) (99%, Fluorochem, UK) and glacial acetic acid (Merck,
Germany) were used as received. [DBNH][OAc] ionic liquid was synthesized by slowly adding
equimolar amounts of acetic acid to DBN under cooling (Michud, Hummel et al. 2015 -should be
Michud et al 2015 (Text Res J)). The cellulose solutions were prepared in a 200 ml vertical
kneader rotating at 30 rpm, under vacuum of 3 to 5 mbar. The temperature was regulated to 90 °C
for the NMMO system and 80˚C for [DBNH][OAc] system. It took 90 minutes to prepare 10 %.
For the NMMO system, 0.15 to 0.28 gr of propyl gallate was added to the dopes as stabilizer.
The samples were put in a glass tube with an outer diameter of 3 mm and a wall thickness of 200
µm. The [DBNH][OAc] cellulose solution was viscoelastic at room temperature, and thus a hot
solution was centrifuged at 3000 rpm for 1 min to fill in the bottom of the tube. The cellulose-
NMMO dopes were solid at room temperature, and could be easily loaded into the tubes.
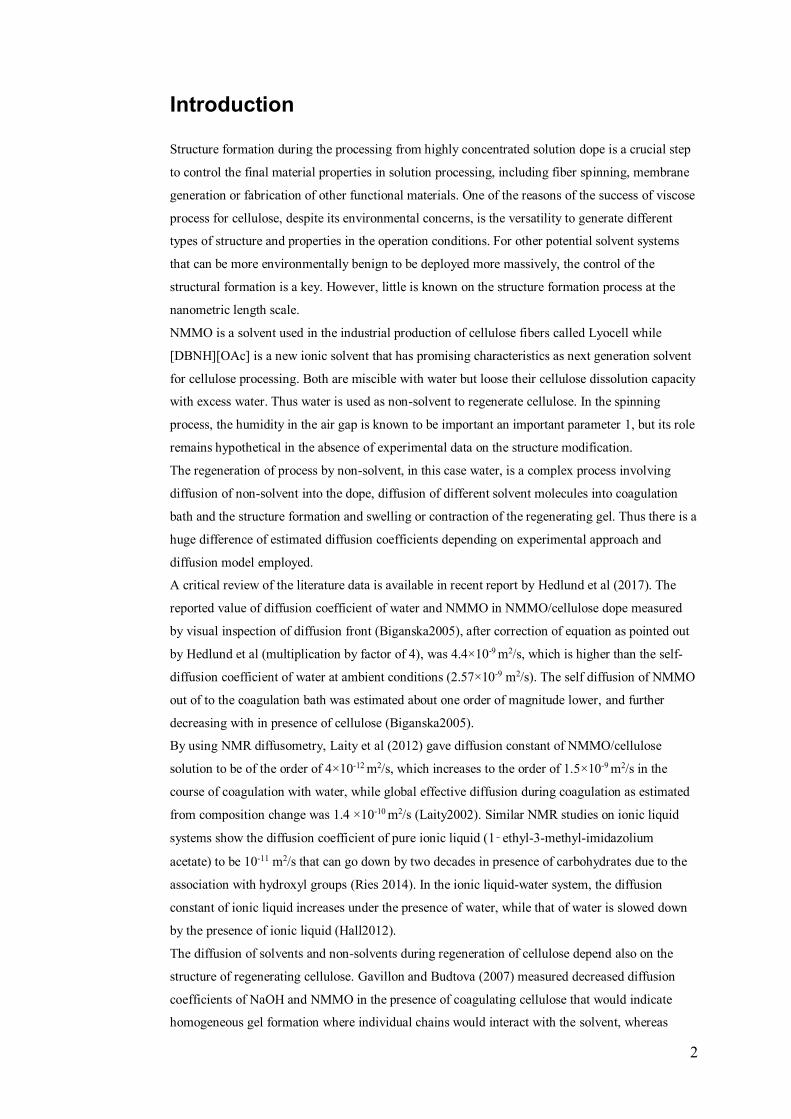
X-ray scattering
The X-ray scattering experiment was carried out at the D2AM beamline of the ESRF. Two silicon
pixel detectors were used simultaneously. A WOS detector with central hole was placed at about 7
cm from the sample and a rectangular detector D5 was placed at 1.5 m from the sample. The

4
sample tubes were mounted on a temperature controlled sample exchanger with 3 mm diameter
holes mounted on a motorized sample stage. X-ray energy of 18 keV (λ = 0.689 Å) was chosen to
limit the attenuation by the glass tube. The exposure time was 10 seconds for each frame. The
incident and the transmitted beam intensities were monitored by scintillation counters placed
before and behind the sample respectively. The scattered intensity was normalized with respect to
the transmitted intensity, and the scattering signal from the empty glass tube was subtracted. The
intensities were circularly averaged after Lorentz-polarization correction using an inhouse
software, and converted to differential scattering cross sections [cm-1] by calibrating with water
scattering intensity (Dreiss2006). The scattering are presented as a function of the magnitude of
scattering vector
𝑞 =4𝜋 sin 𝜃
𝜆(Å−1)
where 2θ is the angle between the incident beam and the scattering direction.
Wide angle scattering of solvent and water content
Figure 2. Wide angle scattering of solvent-water mixture of (a) NMMO monohydrate at 90˚ and
(b) [DBNH][OAc] at 80 ˚C as a function of water content (not taking into account the initial
hydration of NMMO). c: Relationship between water conten and the scattering cross section at 1.2
Å-1 for NMMO monohydrate and 1.4 Å-1 for [DBNH][OAc].
A series of X-ray scattering profiles of solvent-water mixtures measured at 80 ˚C for
[DBNH][OAc] and 90˚ C for NMMO monohydrate are presented in figure 2. The scattering of
neat [DBNH][OAc] and NMMO monohydrate has maximum intensity at q = 1.4 and 1.2 Å-1
respectively whereas water scattering peaks at around 2 Å-1. With increasing water content, the
scattering profile continuously changes and each mixture has a unique profile. The relation
between water content and intensity at these peak positions are plotted in figure 2c, where

5
reasonable estimate of water content can be obtained from the single intensity value. An Akima
spline (Akima1970) was used to relate the intensity to the water content.
In-situ monitoring of coagulation
To follow the coagulation process with contact to water, the sample was filled to approximately 5
mm from the bottom of the tube, and a water drop was put from the top to allow diffusion into the
solution. The sample was vertically scanned before and after addition of water and with regular
interval to monitor the structural evolution.
Results and discussions
Water diffusion from wide angle scattering
When water is added the wide-angle scattering feature reproduces the scattering features of water-
NMMO mixture and water-[DBNH][OAc] mixture with increasing concentration of water towards
the top of the tube. The water content estimated from the scattering intensity at q = 1.2Å-1 and at q
= 1.4 Å-1 according to Fig 2c as a function of vertical position is plotted in figure 3d. For a Fickian
diffusion with a constant diffusion constant D, the water content C at position x from the interface,
after time t since the contact with water can be expressed as (Crank1975)
𝐶(𝑥, 𝑡) = erfc (𝑥/(4𝑡𝐷)1/2)
This prediction of concentration distribution is overlapped as solid line on the concentration
evaluated from the scattering intensity. Here, in both cases, a mutual diffusion constant of 5×10⁻⁹
m2/s was used. Since the volume beneath the vertical reference position is fixed due to the tube

6
wall, the influx of water into the solution is the same as the solvent and cellulose diffusion out
from vertical position 0. The self-diffusion coefficient of water at 80˚C is 6.25×10⁻⁹ m2/s
(Yoshida2008) so the apparent diffusion coefficient is not far from the pure water, contrary to
what was estimated from NMR diffusometry. In some places the water diffusion seems to be even
faster (arrows in fig. 3) which might be due to the presence of microcavities.
Regeneration from NMMO solution
Figure 4 a-d: Small- and wide-angle X-ray scattering profiles of 10% cellulose dope in NMMO
monohydrate as a function of vertical position along the tube (color code) at 90˚C before addition
of water (a) and 5 min (b), 15 min (c) and 25 min (d) after addition of water. The left figures are
double logarithmic plots of data covering both wide- and small angle scattering data, and the right
7
figures are linear plot after subtraction of solvent/water mixture profile obtained by interpolation
of experimental data in Figure 2, with water content estimated from the scattering intensity at q =
1.2 (Å-1) according to figure 2c. The profiles at the transition when the peak appears at q=1.4 and
and 1.5 Å-1 are drawn with thicker lines for clarity.
Before the addition of water, the small-angle scattering of cellulose solution in NMMO
monohydrate at 90˚C followed a power law with an exponent of -3 below q = 0.08 Å-1, steeper
than what would be expected for an extended polymer chain segments. This excess scattering
intensity below q = 0.08 Å-1 indicates heterogeneity of the solution structure or density fluctuations
at least at a nanometric length scale. In the wide angle, depending on the position of the beam,
sharp crystalline peaks can be seen (figure 4 right). On the other hand the feature in the small angle
region below q = 0.04Å-1 is independent of position, and thus should not be related to the
crystallization seen in the wide angle that is more heterogeneous and localized. One possibility
would be micro cavities with irregular surface or polydisperse nanobubbles created during the
crystallization of NMMO when the solution was cooled down. A reviewer was not in favor of this
explanation since the high surface tension would lead to rapid Oswald ripening, but the kinetics
also depends on the volume fraction of bubble and solubility which would be small. The intensity
increase at low q can also be due to the aggregation of cellulose chains as this reviewer suggests,
but there is no sign of cellulose crystallinity in the wide angle, so it would be loose association of
cellulose chains in this case. Some positions show a shoulder appearing at around q = 0.1 Å-1,
which again does not correlate with crystalline peak intensity. For the moment we do not have any
explanation for this feature.
In the small-angle region, about five minutes after the addition of water (Fig. 4b), the scattering
intensity in the q-range of 0.01 - 0.02 Å-1 increases at positions close to the water interface, up to
vertical position of 2 mm, due to a coarse structuring (thick line in fig 4b). On the other hand, the
intensity decreased in lower positions with diffusion of water. This decrease can be explained if
the scattering from the dope originated from microcavities that are now filled with water in the
first place, thus reducing the electron density contrast between the cavity and the bulk.
The first increase in intensity from the original profile can be seen between q = 0.03- 0.1 Å-1 at a
position 2 mm from the top, corresponding to about 10 % water content. The exact peak position
of the new signal cannot be determined due to the uncertainty of the high scattering coming from
the coarse structure that exist already before addition of water.
In the wide angle, the sharp diffraction disappears at water content of about 5% (vertical position =
2.5 mm), and the crystalline peak typical of polymer crystals starts to appear at vertical position of
2 mm, corresponding to a water content of 10%, first at q = 1.4 Å-1 followed by another peak at q
= 1.5 Å-1 further closer to the interface (v. p. = 1.8 mm, water content =15%, drawn with thick line
in fig. 4b). These peaks corresponds to a d-spacings of 4.5 and 4.2 Å respectively which is close to
the strongest reflections of cellulose II, 1 1 0 and 0 2 0 (d = 4.4 and 4.0 Å), and is probably due to
the crystallization of cellulose essentially in the direction perpendicular to the pyranose plane, and
not completely in form of celluloes II, as the peak positions are slightly different and 1-10 cannot

8
be seen. The two peaks are also quite similar to Na-cellulose complex (Nishiyama2000), and
might be due to a similar loose complex structure involving NMMO molecules.
The scans at 15 and 25 minutes after the introduction of water (Fig. 3c, d) capture the progression
of water diffusion and the accompanying structure formation. In both cases, the change in small
angle scattering features coincided with the appearance of first diffraction peak at q = 1.4 Å-1,
indicating that the structuration is essentially due to crystallization, or stacking of chains in one
direction occurring at relatively low water content of 10%.
Some aspects seem to be governed by timescale accessible in this experiment ~ minutes. For
example, a small peak at 0.97 Å-1 corresponding to d = 6.5 Å first appears after 5 min in the zone
where water content is 30-40%, but disappears from this zone in the later stages, reappearing in the
zone closer to the water interface. The current data do not allow a clear molecular view of the
structure formation, but the distance would be compatible with molecular distances in the plane
parallel to pyranose plane.
The slope of the small angle scattering between q = 0.1 and 0.2 Å-1 is close to -4 and is compatible
with formation of nanometric crystalline fibrils that makes clear boundary between the solvent,
while between q=0.01 and 0.06Å-1, the slope is close to -2 typical of flat object. The diffraction
features suggested that the crystallization to be very directional perpendicular to the pyranose
plane, which agrees with the vision of flat ribbon to be formed. For comparison, figure 5 shows a
simulated scattering profile for cuboid 200 nm long, 40 nm wide and with thickness ranging from
4 to 8 nm, which show general agreement with the scattering profile. A thickness of 4 nm could
correspond to about four layers of cellulose sheets intercalating NMMO and water molecules. At q
above 0.1Å-1, the simulation deviates from the observation, as the coagulated object cannot be
considered as homogeneous cuboid at this length scale giving rise to excess scattering in the real
world. Of course this is not the only model that can explain the small angle scattering profile, and
should be considered as one of the plausible models.

9
Figure 5. Simulated scattering profile (left) of cuboid presented on the right with different
thicknesses (4, 6, 8 nm).

10
Regeneration from [DBNH][OAc] solution
Figure 6. Small- and wide-angle X-ray scattering profiles of 10% cellulose dope in [DBNH][OAc]
as a function of vertical position along the tube (color code) at 80˚C before addition of water (a)
and 5 min (b), 10 min (c) 15 min (d) and 18 min (e) after the addition of water

11
X-ray scattering profiles of 10% cellulose solution in [DBNH][OAc] at 80˚C is shown in figure 6a.
Contrary to NMMO solution, there is no indication of coarse structure or density fluctuation
except for slight excess intensity at lowest q ~ 0.01 Å-1 in some part of the sample. The intensity
follows I~q-1 with a prefactor similar to the case of cellulose solution in NMMO monohydrate,
typical or rod-like scattering object.
When water is added, the intensity drastically rise below q = 0.1 Å-1 forming concave upward
profiles, even with the slightest modification in the wide-angle scattering. Throughout the
experiment no crystalline peak appeared in the wide-angle scattering. The first event of
regeneration is the density fluctuation, probably induced by the spinodal decomposition.
The increase in small angle intensity occurs at water content of about 5% and completes below
15% water content, the transition corresponding to a depth being about 500 µm as judged from the
wide angle scattering according to figure 2.
The spinned fibers from [DNBH][OAc] is known to be crystalline, similar to Lyocell. In this
simple experiment, no extentional flow or shear that would force the alignment of cellulose chains,
which would facilitate the crystallization. Also, the water content at the interface was only 50%,
and still the cations can be strongly bound to cellulose chains impeding the crystallization. The
crystallization in the process might be occuring during the washing stage. These points will be
investigated in the future by analyzing further the washing stage, and the effect of different strain
conditions on the sample during the regeneration.
Conclusion
A simultaneous wide- and small-angle X-ray scattering allowed us to follow the water diffusion
during regeneration, crystallization behavior and nano-structure formation of cellulose during
regeneration process. Unidirectional crystallization was the first step of coagulation in the NMMO
dope /water regeneration, while no crystallization were observed in the regeneration process of
[DNBH][OAc].
Acknowledgements
We thank Dr. Isabelle Morfin, Dr. Nathalie Boudet and Dr. Nils Blanc for assistance at the D2AM
beamline, and ESRF for providing beamtimes. The WOS detector was funded by the French
National Research Agency (ANR) under the “Investissements d’avenir” program with the grant
number: ANR-11-EQPX-0010 PA has received funding from Kone Foundation
References
Akima H (1970) A new method of interpolation and smooth curve fitting based on local
procedures. J.ACM 17, 589-602.
Biganska O, Navard P (2005) Kinetics of precipitation of cellulose from cellulose – NMMO –
water solutions. Biomacromol. 6, 1948-1953.

12
Crank J (1975) The mathematics of diffusion. second ed. Clarendon Press, Oxford p.14
Dreiss CA, Jack KS, Parker AP. (2006) On the absolute calibration of bench-top small-angel X-ray
scattering instruments: a comparison of different standard methods. J. Appl. Cryst. 39, 32-39.
Hall CA, Le KA, Rudaz C, Radhi A, Lovell CS., Damion RA., Budtova T, and Ries ME (2012)
Macroscopic and microscopic study of 1‑ethyl-3-methyl-imidazolium acetate−water mixtures. J.
Phys. Chem B 116, 12810−12818.
Hedlund A, Könke T, Theliander H (2017) Diffusion of ionic liquid – cellulose solutions during
coagulation in water: mass transport and coagulation rate measurements. Macromolecules 50,
8707–8719.
Laity PR, Glover PM, Hay JN (2002) Composition and phase changes observed by magnetic
resonance imaging during non-solvent induced coagulation of cellulose. Polymer 43, 5827-5837.
Liu R and Hu X (2006) Precipication kinetics of cellulose in the Lyocell Spinning Process. Ind.
Eng. Chem. Res. 45, 2840-2844.
Maia, E, Peguy A, Pérez S(1981). Cellulose organic solvents. I. The structure of anhydrous N-
Methylmorpholine N-Oxide and N-Methylmorpholine N-Oxide monohydrate. Acta Cryst. B37,
1858 – 1862.
Maia E, Pérez S (1982) Cellulose organic solvents. II The structure of N-Methylmorpholine N-
Oxide 2.5N2O, Actra Cryst. B38, 849-852.
Michud A, Tanttu M, Asaadi S, Ma Y, Netti E, Käärlainen P, Persson A, Berntsson A, Hummel M
Sixta H (2015) Ioncell-F: ionic liquid-based cellulosic textile fibers as an alternative to viscose and
Lyocell. Textile Res. J. 86, 543-552
Nishiyama Y, Kuga S, Okano T (2000) Mechanism of mercerization revealed by X-ray diffraction.
J. Wood Sci. 46, 452-457.
Yoshida K, Matubayasi N, Nakahara M (2008) Self-diffusion coefficiens of water and organic
solvents at high temperatures along the coexistence curve J. Chem. Phys. 129, 214501


![[PPT]A Dynamic Mobility Histogram Construction Method …dbgroup/public_papers/2006... · Web viewA Dynamic Mobility Histogram Construction Method Based on Markov Chains Yoshiharu](https://img.dokumen.tips/doc/110x75/5ab6b5ea7f8b9ab47e8e2235/ppta-dynamic-mobility-histogram-construction-method-dbgrouppublicpapers2006web.jpg)