Embed Size (px)
Citation preview

NIPPON THOMPSON CO., LTD.
Corporate Headquarters: Tokyo
Lis ted Code: 6480
Listed Stock Exchange: Tokyo
(URL: https://www.ikont.co.jp/eg/)
May 14, 2019
Consolidated Financial Report
for the Fiscal Year ended March 31, 2019
<Japanese GAAP>
Representative: Shigeki Miyachi, President and Representative Director
For further information contact: Kesaaki Ushikoshi, General Manager of Accounting Department
Telephone: +81-3-3448-5824
Figures have been rounded off to eliminate amounts less than one million yen.
1. Consolidated Operating Performance for the Fiscal Year Ended March 31, 2019
(From April 1, 2018 to March 31, 2019)
(1) Results of Consolidated Operations
Years ended March 31, 2019 and 2018 (Millions of yen)
Net sales Percentage
change
Operating
profit
Percentage
change
Ordinary
profit
Percentage
change
Profit
attributable
to owners
of parent
Percentage
change
2019 57,570 4.2 4,883 84.4 5,325 122.2 3,718 121.5
2018 55,228 25.1 2,649 131.2 2,397 164.7 1,678 -
Notes: Comprehensive income
Fiscal year ended March 31, 2019: 1,695 million yen ((26.8))%
Fiscal year ended March 31, 2018: 2,317 million yen (71.9)%
: Percentage change for net sales, operating profit, ordinary profit, and profit attributable to owners of parent indicate
percentage increase/decrease compared to the same period in the previous year.
Earnings
per share
(Yen)
Diluted earnings per
share
(Yen)
Return on equity
(%)
Ordinary profit to
total assets
(%)
Operating profit to
net sales
(%)
2019 51.95 51.81 6.2 5.3 8.5
2018 23.35 23.30 2.9 2.4 4.8
Reference: Equity in earnings of affiliates
Fiscal year ended March 31, 2019: - million yen
Fiscal year ended March 31, 2018: - million yen
Scheduled Date of Ordinary General Meeting of Shareholders: June 27, 2019
Scheduled Date to Submit Annual Securities Report: June 27, 2019
Scheduled Date to Begin Dividend Payments: June 28, 2019
Preparation of Supplementary Explanation Material for Financial Results: Yes
Holding of Presentation Meeting for Financial Results: Yes (Targeted at institutional investors and analysts)
The fiscal year 2019
2
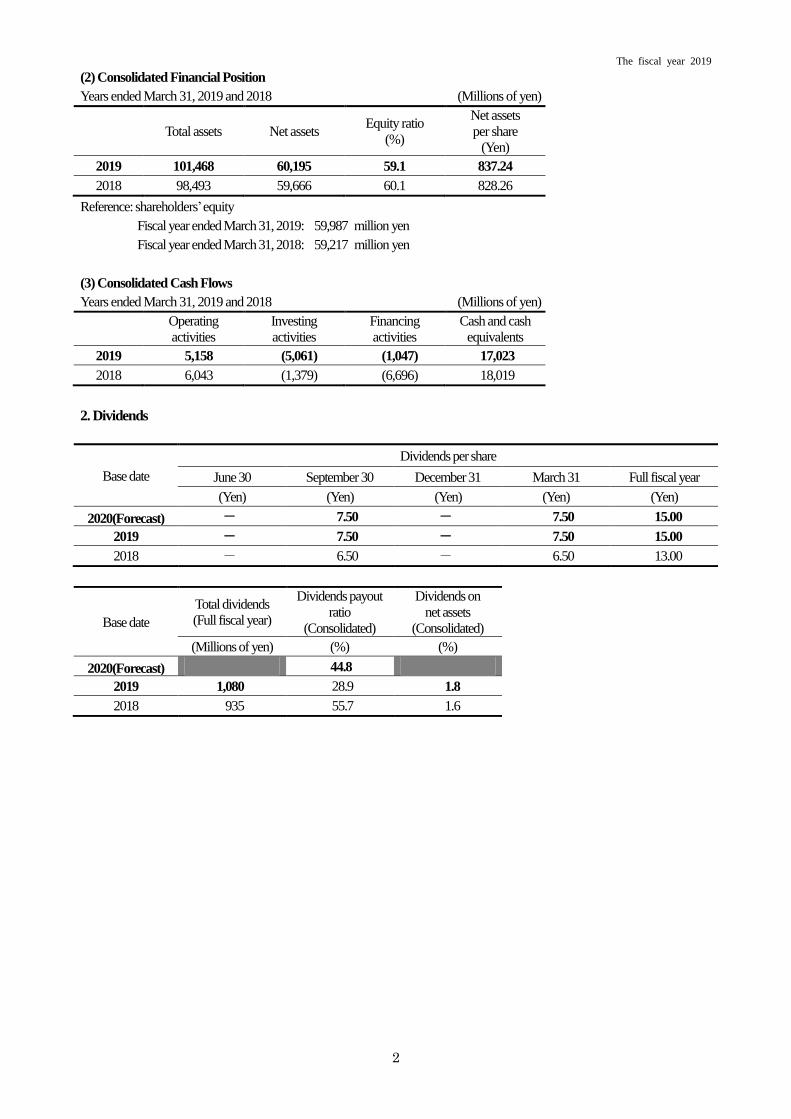
(2) Consolidated Financial Position
Years ended March 31, 2019 and 2018 (Millions of yen)
Total assets Net assets Equity ratio
(%)
Net assets
per share
(Yen)
2019 101,468 60,195 59.1 837.24
2018 98,493 59,666 60.1 828.26
Reference: shareholders’ equity
Fiscal year ended March 31, 2019: 59,987 million yen
Fiscal year ended March 31, 2018: 59,217 million yen
(3) Consolidated Cash Flows
Years ended March 31, 2019 and 2018 (Millions of yen)
Operating
activities
Investing
activities
Financing
activities
Cash and cash
equivalents
2019 5,158 (5,061) (1,047) 17,023
2018 (6,043 (1,379) (6,696) 18,019
2. Dividends
Base date
Dividends per share
June 30 September 30 December 31 March 31 Full fiscal year
(Yen) (Yen) (Yen) (Yen) (Yen)
2020(Forecast) - 7.50 - 7.50 15.00
2019 - 7.50 - 7.50 15.00
2018 - 6.50 - 6.50 13.00
Base date
Total dividends
(Full fiscal year)
Dividends payout
ratio
(Consolidated)
Dividends on
net assets
(Consolidated)
(Millions of yen) (%) (%)
2020(Forecast) 44.8
2019 1,080 28.9 1.8
2018 935 55.7 1.6
The fiscal year 2019
3
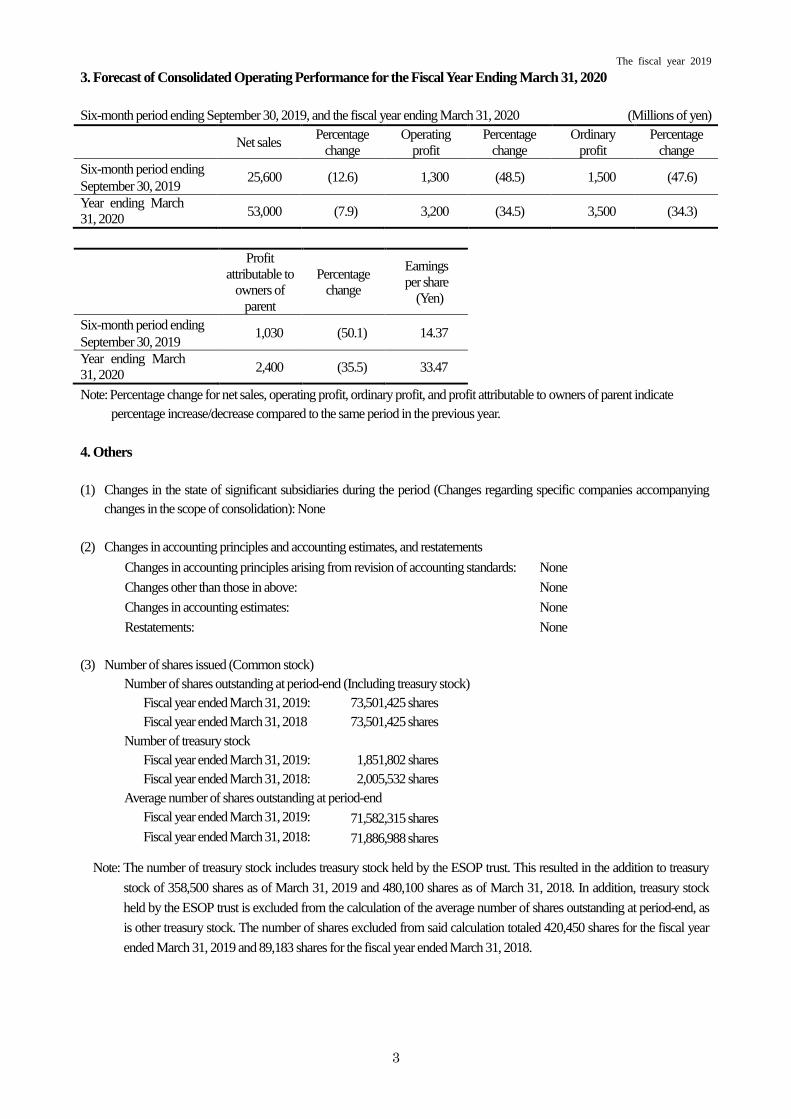
3. Forecast of Consolidated Operating Performance for the Fiscal Year Ending March 31, 2020
Six-month period ending September 30, 2019, and the fiscal year ending March 31, 2020 (Millions of yen)
Net sales Percentage
change
Operating
profit
Percentage
change
Ordinary
profit
Percentage
change
Six-month period ending
September 30, 2019 25,600 (12.6) 1,300 (48.5) 1,500 (47.6)
Year ending March
31, 2020 53,000 (7.9) 3,200 (34.5) 3,500 (34.3)
Profit
attributable to
owners of
parent
Percentage
change
Earnings
per share
(Yen)
Six-month period ending
September 30, 2019 1,030 (50.1) 14.37
Year ending March
31, 2020 2,400 (35.5) 33.47
Note: Percentage change for net sales, operating profit, ordinary profit, and profit attributable to owners of parent indicate
percentage increase/decrease compared to the same period in the previous year.
4. Others
(1) Changes in the state of significant subsidiaries during the period (Changes regarding specific companies accompanying
changes in the scope of consolidation): None
(2) Changes in accounting principles and accounting estimates, and restatements
Changes in accounting principles arising from revision of accounting standards: None
Changes other than those in above: None
Changes in accounting estimates: None
Restatements: None
(3) Number of shares issued (Common stock)
Number of shares outstanding at period-end (Including treasury stock)
Fiscal year ended March 31, 2019: 73,501,425 shares
Fiscal year ended March 31, 2018 73,501,425 shares
Number of treasury stock
Fiscal year ended March 31, 2019: 1,851,802 shares
Fiscal year ended March 31, 2018: 2,005,532 shares
Average number of shares outstanding at period-end
Fiscal year ended March 31, 2019: 71,582,315 shares
Fiscal year ended March 31, 2018: 71,886,988 shares
Note: The number of treasury stock includes treasury stock held by the ESOP trust. This resulted in the addition to treasury
stock of 358,500 shares as of March 31, 2019 and 480,100 shares as of March 31, 2018. In addition, treasury stock
held by the ESOP trust is excluded from the calculation of the average number of shares outstanding at period-end, as
is other treasury stock. The number of shares excluded from said calculation totaled 420,450 shares for the fiscal year
ended March 31, 2019 and 89,183 shares for the fiscal year ended March 31, 2018.

The fiscal year 2019
4
Reference: Non-consolidated Operating Performance for the Fiscal Year Ended March 31, 2019
(From April 1, 2018 to March 31, 2019)
(1) Results of Non-consolidated Operations
Years ended March 31, 2019 and 2018 (Millions of yen)
Net sales Percentage
change
Operating
profit
Percentage
change
Ordinary
profit
Percentage
change Profit
Percentage
change
2019 51,075 11.3 4,487 365.2 4,978 305.4 3,373 316.3
2018 45,874 19.8 964 - 1,227 - 810 -
Note: Percentage change for net sales, operating profit, ordinary profit, and profit indicate percentage increase/decrease
compared to the same period in the previous year.
Earnings
per share
(Yen)
Diluted earnings
per share
(Yen)
2019 47.13 47.01
2018 11.27 11.25
(2) Non-consolidated Financial Position
Years ended March 31, 2019 and 2018 (Millions of yen)
Total assets Net assets Equity ratio
(%)
Net assets
per share
(Yen)
2019 92,936 53,693 57.7 747.80
2018 89,821 53,013 58.9 740.42
Reference: shareholders’ equity
Fiscal year ended March 31, 2019: 53,579 million yen
Fiscal year ended March 31, 2018: 52,937 million yen
These consolidated financial statements are not subject to quarterly review by auditors
Explanations or Other Items Pertaining to Appropriate use of Operating Performance Forecasts
Performance forecasts presented herein are based on information available to the Nippon Thompson Group (the “Group”)
as of the date of this document, May 14, 2019. Accordingly, for a wide variety of reasons, there remains the possibility that
actual performance results may differ from projections. For performance forecasts, please refer to “Overview of Operating
Results (4) Outlook” on page 7.

The fiscal year 2019
5
5. Operating Results and Financial Position
(1) Analysis of Operating Results
In the consolidated fiscal year ended March 31, 2019, the Japanese economy continued to gradually improve overall against a
backdrop of increased private capital investment and corporate profits in addition to a recovery in personal consumption
sustained by improving employment figures and income levels. Overseas, the U.S. economy remained strong, but the outlook
grew more uncertain owing mainly to U.S.-China trade tensions and Brexit issues.
Under these circumstances, in April 2018, the Group launched “IKO Medium-term business plan 2020 CHANGE
& CHALLENGE ~Next Stage –ACCOMPLISH–.” With the aims of realizing sustainable growth and establishing a highly
profitable organization, the Group has been implementing a range of measures to solve priority issues through
inter-departmental efforts and improve efficiency in all operations.
From a sales perspective, the Group worked to further cultivate business ties with existing customers in Japan and
overseas and develop new growth markets while focusing on expanding sales of strategic products and reinforcing customer
management using a new system. Moreover, the Group executed a massive overhaul of its corporate website to improve
customer convenience as part of its efforts to enhance the market presence of the IKO brand through web-based stakeholder
communication.
In terms of product development, the Group worked to expand its lineup of products that provide high added value
from the customer perspective. To this end, the Group developed the long stroke Precision Positioning Table TE series,
designed to help make machinery lighter and more compact, and added variation to Double Hex Hole Cam Follower series. In
addition, the Group took a proactive stance toward R&D aimed at reducing environmental burdens. For example, the Group
engaged in an industry-academia collaboration project involving the co-development of a liquid crystal lubricant that does not
evaporate while delivering novel lubricating functions that enhance the durability of machinery and bearings.
From a production standpoint, the Group worked to expand its production capacity by expanding facilities at its
domestic factories and the production subsidiary IKO Thompson Vietnam Co., Ltd. At the same time, the Group strove to
create an even more efficient production system and, to this end, promoted on-site improvement activities aimed at realizing
ideal production processes.
Turning to the Group’s operational results, the balance of orders received remained high despite some markets
seeing more restrained private capital investment. In the domestic market, net sales increased due mainly to demand for
electronics-related devices and precision machinery. In North America, net sales rose as demand for general industrial
machinery remained firm. In Europe, although demand for electronics-related devices was steady, demand for precision
machinery stagnated, and net sales remained unchanged from the previous fiscal year. In China, due to proactive sales efforts
through local sales subsidiaries and sales agencies, net sales increased. In other regions, net sales declined due partly to
economic sanctions on Iran despite strong demand in India and ASEAN countries.
As a result, consolidated net sales for the fiscal year under review totaled ¥57,570 million, up 4.2% year on year. On
the earnings front, due mainly to increased revenue and production, operating profit came to ¥4,883 million, up 84.4% year on
year, and ordinary profit came to ¥5,325 million, up 122.2% year on year. Profit attributable to owners of the parent amounted
The fiscal year 2019
6
to ¥3,718 million, up 121.5% year on year.
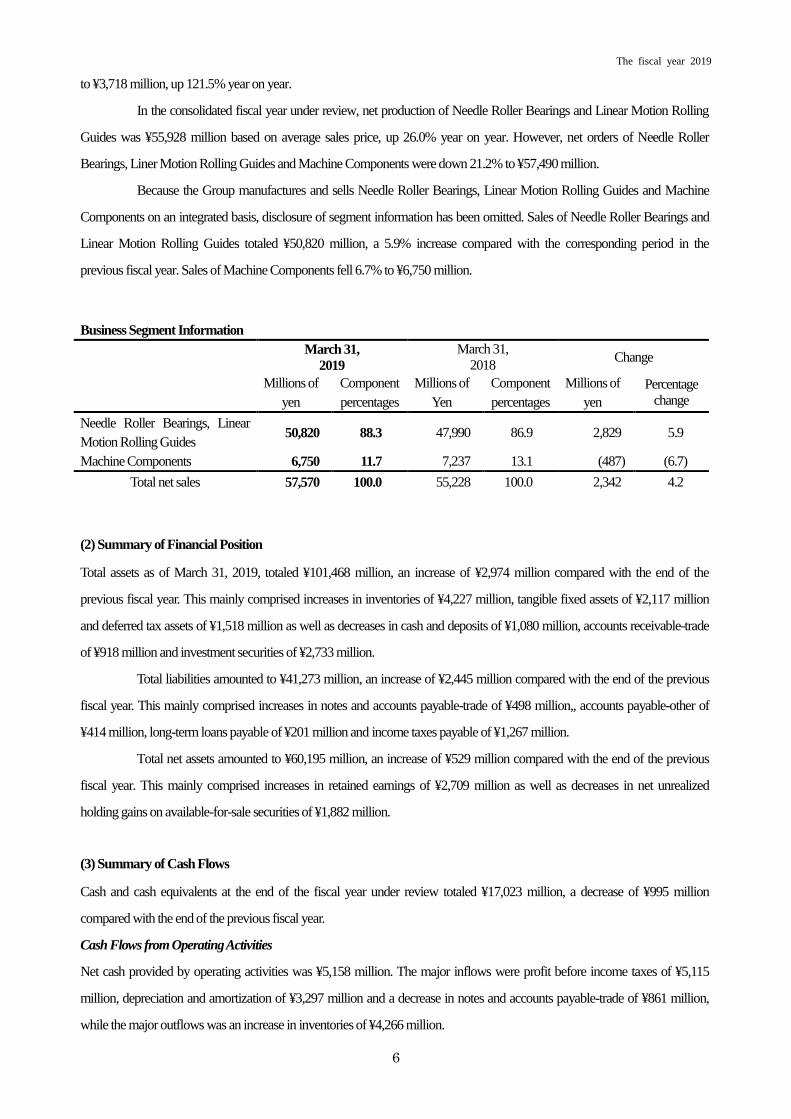
In the consolidated fiscal year under review, net production of Needle Roller Bearings and Linear Motion Rolling
Guides was ¥55,928 million based on average sales price, up 26.0% year on year. However, net orders of Needle Roller
Bearings, Liner Motion Rolling Guides and Machine Components were down 21.2% to ¥57,490 million.
Because the Group manufactures and sells Needle Roller Bearings, Linear Motion Rolling Guides and Machine
Components on an integrated basis, disclosure of segment information has been omitted. Sales of Needle Roller Bearings and
Linear Motion Rolling Guides totaled ¥50,820 million, a 5.9% increase compared with the corresponding period in the
previous fiscal year. Sales of Machine Components fell 6.7% to ¥6,750 million.
Business Segment Information
March 31,
2019
March 31,
2018 Change
Millions of
yen
Component
percentages
Millions of
Yen
Component
percentages
Millions of
yen
Percentage
change
Needle Roller Bearings, Linear
Motion Rolling Guides 50,820 88.3 47,990 86.9 2,829 5.9
Machine Components 6,750 11.7 7,237 13.1 (487) (6.7)
Total net sales 57,570 100.0 55,228 100.0 2,342 4.2
(2) Summary of Financial Position
Total assets as of March 31, 2019, totaled ¥101,468 million, an increase of ¥2,974 million compared with the end of the
previous fiscal year. This mainly comprised increases in inventories of ¥4,227 million, tangible fixed assets of ¥2,117 million
and deferred tax assets of ¥1,518 million as well as decreases in cash and deposits of ¥1,080 million, accounts receivable-trade
of ¥918 million and investment securities of ¥2,733 million.
Total liabilities amounted to ¥41,273 million, an increase of ¥2,445 million compared with the end of the previous
fiscal year. This mainly comprised increases in notes and accounts payable-trade of ¥498 million,, accounts payable-other of
¥414 million, long-term loans payable of ¥201 million and income taxes payable of ¥1,267 million.
Total net assets amounted to ¥60,195 million, an increase of ¥529 million compared with the end of the previous
fiscal year. This mainly comprised increases in retained earnings of ¥2,709 million as well as decreases in net unrealized
holding gains on available-for-sale securities of ¥1,882 million.
(3) Summary of Cash Flows
Cash and cash equivalents at the end of the fiscal year under review totaled ¥17,023 million, a decrease of ¥995 million
compared with the end of the previous fiscal year.
Cash Flows from Operating Activities
Net cash provided by operating activities was ¥5,158 million. The major inflows were profit before income taxes of ¥5,115
million, depreciation and amortization of ¥3,297 million and a decrease in notes and accounts payable-trade of ¥861 million,
while the major outflows was an increase in inventories of ¥4,266 million.

The fiscal year 2019
7
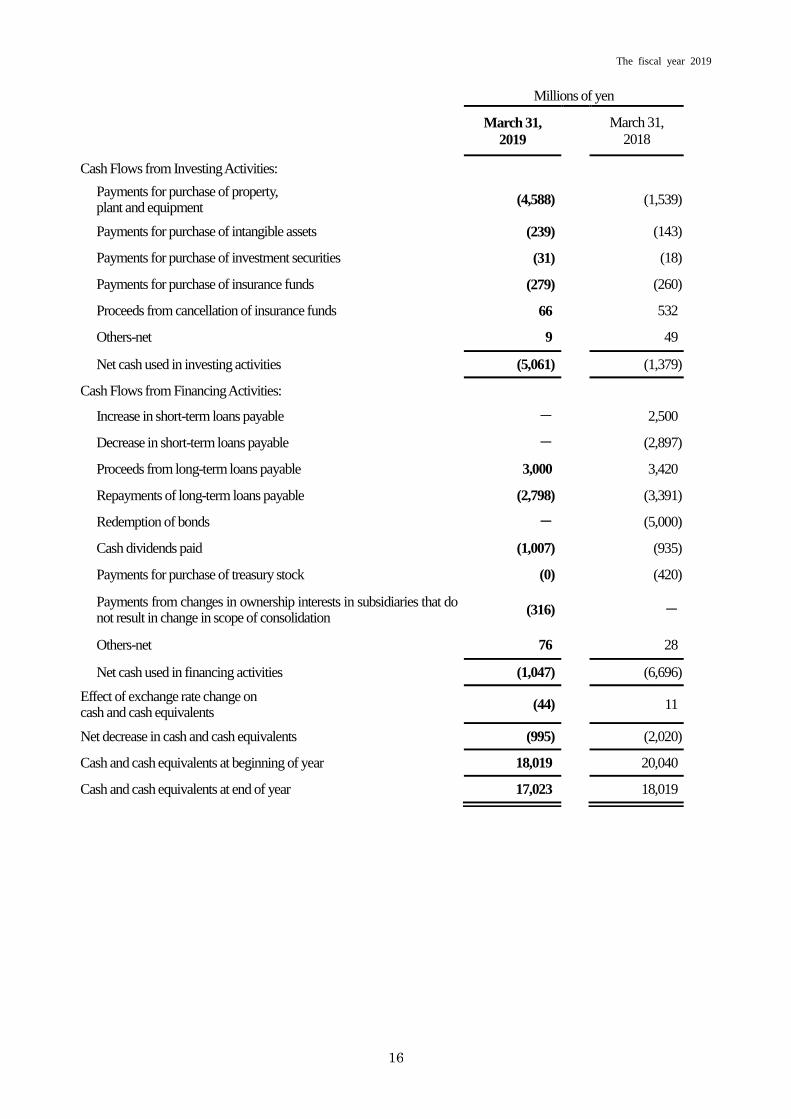
Cash Flows from Investing Activities
Net cash used in investing activities totaled ¥5,061 million. This was mainly due to payments for purchase of property, plant and
equipment of ¥4,588 million, payments for purchase of intangible assets of ¥239 million and payments for purchase of
insurance funds of ¥279 million.
Cash Flows from Financing Activities
Net cash used in financing activities totaled ¥1,047 million. The major inflows was proceeds from long-term loans payable of
¥3,000 million, while the major outflows were repayments of long-term loans payable of ¥2,798 million and cash dividends
paid of 1,007 million.
The trend of cash flow indices is as follows:
For the periods ended
March 31,
2016
March 31,
2017
March 31,
2018
March 31,
2019
Equity ratio (%) 65.0 58.4 60.1 59.1
Equity ratio on market value basis (%) 32.6 43.6 60.9 35.9
Debt repayment period (Years) 7.1 5.4 3.5 4.2
Interest coverage ratio (Times) 21.6 43.4 43.3 60.0
Notes:
Equity ratio: Total shareholders’ equity / total assets
Equity ratio on market value basis: Aggregate market value of common stock / total assets
Debt repayment period: Interest-bearing liabilities / cash flows from operating activities
Interest coverage ratio: Cash flows from operating activities / interest payments
1. All indices based on consolidated financial figures.
2. Aggregate market value of common stock:
Market price at the period-end x number of shares outstanding at the period-end (excluding treasury stock)
3. Cash flows from operating activities corresponds to the cash flow from operating activities in the consolidated statement of
cash flows. Interest-bearing liabilities include all liabilities reported on the consolidated balance sheet for which the Group is
paying interest. Interest payments correspond to the interest paid in the consolidated statement of cash flows.
(4) Outlook
Regarding the forecast for the current fiscal year, the Group forecasts that its business environment will remain
uncertain as private capital investment in China and elsewhere is expected to be adjusted in consideration of U.S.-China
trade tensions.
Amid this situation, the Group is working to establish a stable product supply system in preparation for
medium- to long-term growth. We will continue to implement “IKO Medium-term business plan 2020 CHANGE &
CHALLENGE ~Next Stage –ACCOMPLISH–” as we strive to achieve sustainable growth and strengthen our earnings
base.
In light of these economic conditions, the Group is forecasting consolidated net sales of ¥53.0 billion, operating
profit of ¥3.2 billion, ordinary profit of ¥3.5 billion and profit attributable to owners of parent of ¥2.4 billion for the year
ending March 31, 2020.

The fiscal year 2019
8
(5) Fundamental Earnings Distribution Policy and Dividends for the Current and Next Fiscal Periods
With regard to the distribution of profits, Nippon Thompson Co., Ltd. (the “Company”) positions the return of profits to
shareholders as one of its major management issues, having as its basic policy continuing stable dividends while taking
performance levels into overall consideration.
In addition, while giving heed to such factors as the future business environment, the Group intends to retain
sufficient internal reserves. Specifically in this regard, the Group works to strengthen its management base and improve
earnings power to maximize corporate value. Simultaneously, it reviews production systems that respond to rapid technological
innovation and fluctuating demand and makes such investments as new product development.
In keeping with the basic policy and as a result of a general review of, for example, the level of performance over the
fiscal year and internal reserves, the Company plans a year-end dividend of ¥7.5 per share. Including the interim dividend of
¥7.5 per share, the planned full-year dividend payment ¥15 per share.
The Company is forecasting a dividend of ¥15 per share (including an interim dividend of ¥7.5 per share) for the
fiscal year ending March 31, 2020.
6. Basic Stance on Selection of Accounting Methods
The Group applies “Japanese GAAP” to facilitate the comparison of consolidated financial statements with different reporting
periods.
As for the adoption of “International Financial Reporting Standards (IFRS)”, the Group maintains a policy of
continuing to appropriately respond to the situation going forward.
The fiscal year 2019
9
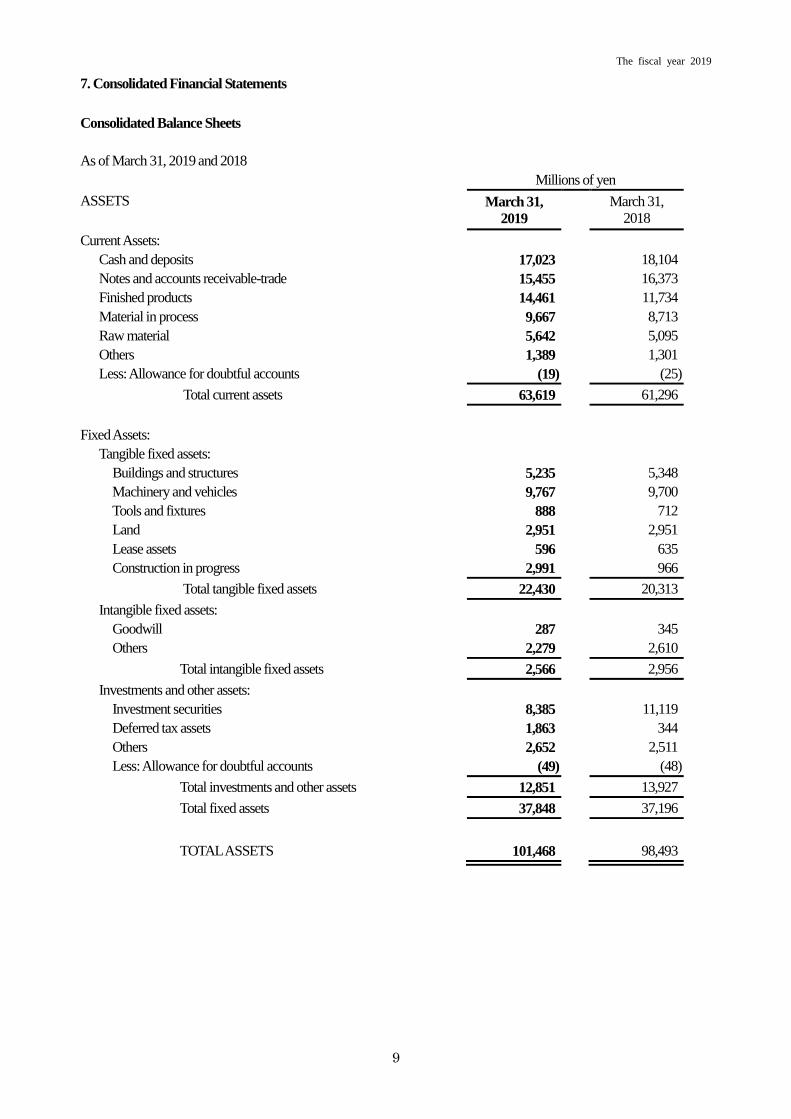
7. Consolidated Financial Statements
Consolidated Balance Sheets
As of March 31, 2019 and 2018
Millions of yen
ASSETS March 31,
2019
March 31,
2018
Current Assets:
Cash and deposits 17,023 18,104
Notes and accounts receivable-trade 15,455 16,373
Finished products 14,461 11,734
Material in process 9,667 8,713
Raw material 5,642 5,095
Others 1,389 1,301
Less: Allowance for doubtful accounts (19) (25)
Total current assets 63,619 61,296
Fixed Assets:
Tangible fixed assets:
Buildings and structures 5,235 5,348
Machinery and vehicles 9,767 9,700
Tools and fixtures 888 712
Land 2,951 2,951
Lease assets 596 635
Construction in progress 2,991 966
Total tangible fixed assets 22,430 20,313
Intangible fixed assets:
Goodwill 287 345
Others 2,279 2,610
Total intangible fixed assets 2,566 2,956
Investments and other assets:
Investment securities 8,385 11,119
Deferred tax assets 1,863 344
Others 2,652 2,511
Less: Allowance for doubtful accounts (49) (48)
Total investments and other assets 12,851 13,927
Total fixed assets 37,848 37,196
TOTAL ASSETS 101,468 98,493

The fiscal year 2019
10
Corporate bonds 10,000 10,000
Millions of yen
LIABILITIES March 31,
2019
March 31,
2018
Current Liabilities:
Notes and accounts payable-trade 11,438 10,939
Current portion of long-term loans payable 3,179 2,778
Lease obligations 69 68
Accrued expenses 2,691 2,767
Income taxes payable 1,747 479
Allowance for directors’ and corporate auditors’ bonuses 60 60
Others 2,952 2,484
Total current liabilities 22,138 19,577
Long-Term Liabilities:
Long-term loans payable 8,317 8,516
Lease obligations 435 498
Deferred tax liabilities 279 113
Net defined benefit liabilities 13 15
Others 87 104
Total long-term liabilities 19,134 19,249
TOTAL LIABILITIES
41,273
38,827
NET ASSETS
Shareholders’ Equity:
Common stock 9,533 9,533
Capital surplus 12,875 12,887
Retained earnings 36,253 33,544
Treasury stock (1,048) (1,169)
Total shareholders’ equity 57,614 54,795
Accumulated Other Comprehensive Income:
Net unrealized holding gains on available-for-sale securities 2,568 4,450
Deferred gains or losses on hedges (0) 0
Foreign currency translation adjustments (162) (154)
Remeasurements of defined benefit plans (32) 125
Total accumulated other comprehensive income 2,373 4,422
Subscription rights to shares 114 76
Non-controlling interests 93 372
TOTAL NET ASSETS 60,195
59,666
TOTAL LIABILITIES AND NET ASSETS 101,468
98,493

The fiscal year 2019
11
Consolidated Statements of Income
Years ended March 31, 2019 and 2018
Millions of yen
March 31,
2019
March 31,
2018
Net Sales 57,570 55,228
Cost of Sales 39,333 39,401
Gross Profit 18,237 15,826
Selling, General and Administrative Expenses 13,353 13,177
Operating Profit 4,883 2,649
Non-Operating Income:
Interest income 19 14
Dividend income 256 199
Insurance income 53 75
Others 364 162
694 452
Non-Operating Expenses:
Interest expenses 87 129
Sales discounts 77 233
Loss on retirement of fixed assets 25 44
Foreign exchange losses - 239
Others 61 57
252 704
Ordinary Profit 5,325 2,397
Extraordinary income:
Gain on sales of fixed assets 1 39
Compensation for transfer - 250
1 289
Extraordinary Losses:
Impairment loss 141 -
Dismantlement expenses - 197
Loss on valuation of investment securities 69 -
211 197
Profit Before Income Taxes 5,115 2,489
Income Taxes:
Current 1,816 597
Deferred (442) 217
1,373 815
Profit 3,742 1,674
Profit (loss) attributable to non-controlling interests 23 (4)
Profit attributable to owners of parent 3,718 1,678
The fiscal year 2019
12
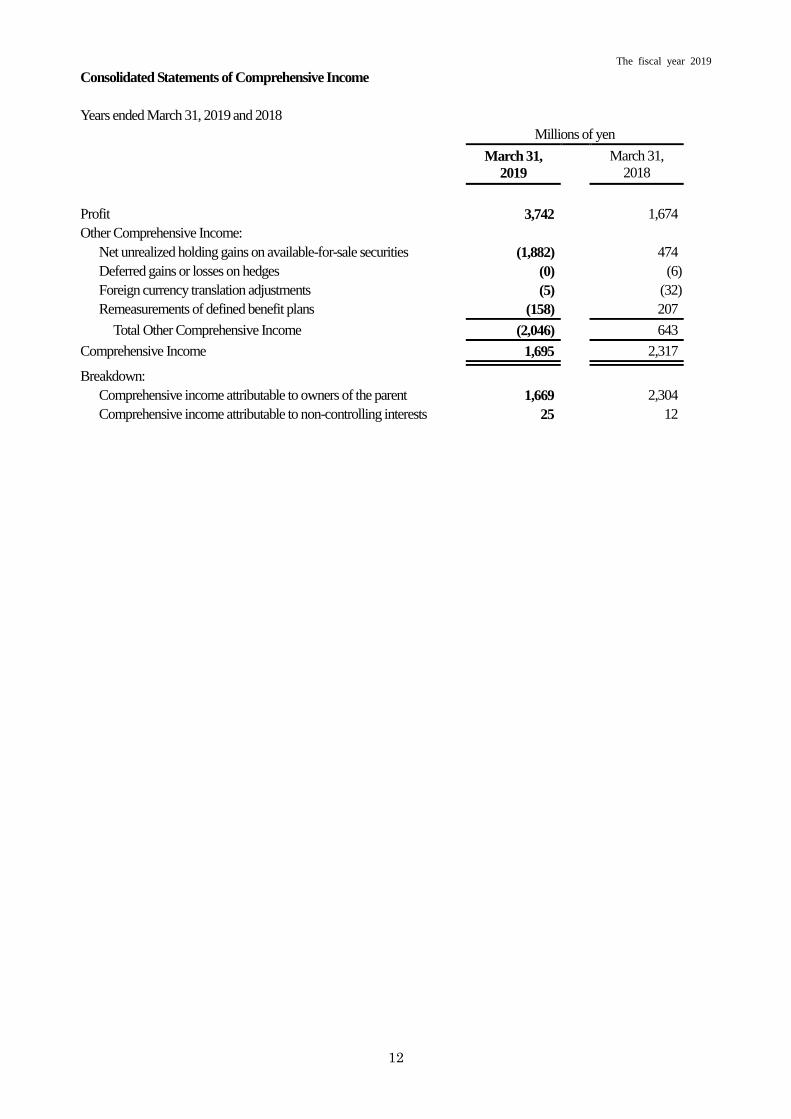
Consolidated Statements of Comprehensive Income
Years ended March 31, 2019 and 2018
Millions of yen
March 31,
2019
March 31,
2018
Profit 3,742 1,674
Other Comprehensive Income:
Net unrealized holding gains on available-for-sale securities (1,882) 474
Deferred gains or losses on hedges (0) (6)
Foreign currency translation adjustments (5) (32)
Remeasurements of defined benefit plans (158) 207
Total Other Comprehensive Income (2,046) 643
Comprehensive Income 1,695 2,317
Breakdown:
Comprehensive income attributable to owners of the parent 1,669 2,304
Comprehensive income attributable to non-controlling interests 25 12
The fiscal year 2019
13
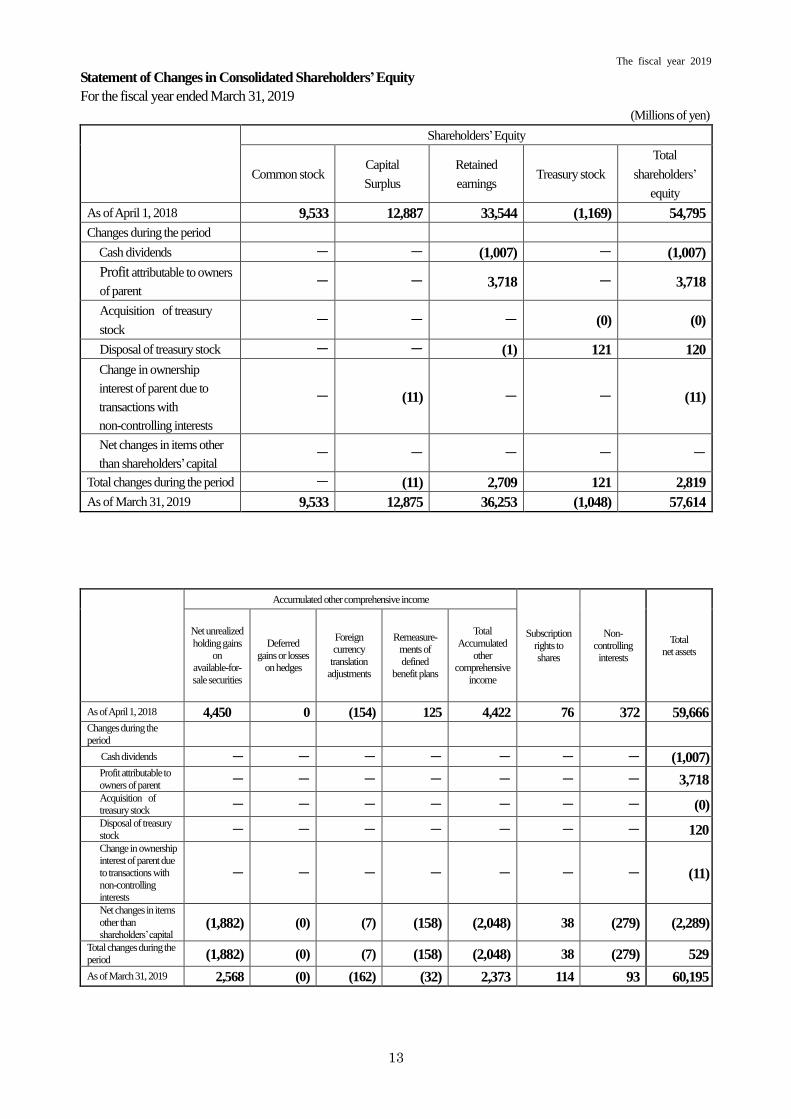
Statement of Changes in Consolidated Shareholders’ Equity
For the fiscal year ended March 31, 2019
(Millions of yen)
Shareholders’ Equity
Common stock Capital
Surplus
Retained
earnings Treasury stock
Total
shareholders’
equity
As of April 1, 2018 9,533 12,887 33,544 (1,169) 54,795
Changes during the period
Cash dividends - - (1,007) - (1,007)
Profit attributable to owners
of parent - - 3,718 - 3,718
Acquisition of treasury
stock - - - (0) (0)
Disposal of treasury stock - - (1) 121 120
Change in ownership
interest of parent due to
transactions with
non-controlling interests
- (11) - - (11)
Net changes in items other
than shareholders’ capital - - - - -
Total changes during the period - (11) 2,709 121 2,819
As of March 31, 2019 9,533 12,875 36,253 (1,048) 57,614
Accumulated other comprehensive income
Subscription
rights to shares
Non-
controlling interests
Total net assets
Net unrealized
holding gains
on available-for-
sale securities
Deferred
gains or losses on hedges
Foreign currency
translation adjustments
Remeasure- ments of
defined benefit plans
Total
Accumulated
other comprehensive
income
As of April 1, 2018 4,450 0 (154) 125 4,422 76 372 59,666 Changes during the
period
Cash dividends - - - - - - - (1,007) Profit attributable to
owners of parent - - - - - - - 3,718
Acquisition of treasury stock - - - - - - - (0)
Disposal of treasury
stock - - - - - - - 120
Change in ownership interest of parent due
to transactions with
non-controlling interests
- - - - - - - (11)
Net changes in items
other than shareholders’ capital
(1,882) (0) (7) (158) (2,048) 38 (279) (2,289)
Total changes during the
period (1,882) (0) (7) (158) (2,048) 38 (279) 529
As of March 31, 2019 2,568 (0) (162) (32) 2,373 114 93 60,195

The fiscal year 2019
14
For the fiscal year ended March 31, 2018
(Millions of yen)
Shareholders’ Equity
Common stock Capital
Surplus
Retained
earnings Treasury stock
Total
shareholders’
equity
As of April 1, 2017 9,533 12,887 32,801 (801) 54,420
Changes during the period
Cash dividends - - (935) - (935)
Loss attributable to owners
of parent - - 1,678 - 1,678
Acquisition of treasury
stock - - - (420) (420)
Disposal of treasury stock - - - 51 51
Net changes in items other
than shareholders’ capital - - - - -
Total changes during the period - - 742 (368) 374
As of March 31, 2018 9,533 12,887 33,544 (1,169) 54,795
Accumulated other comprehensive income
Subscription
rights to shares
Non-
controlling interests
Total
net assets
Net unrealized
holding gains
on available-for-
sale securities
Deferred
gains or losses on hedges
Foreign
currency
translation adjustments
Remeasure-
ments of
defined benefit plans
Total
Accumulated
other comprehensive
income
As of April 1, 2017 3,975 6 (104) (82) 3,795 30 359 58,605 Changes during the
period
Cash dividends - - - - - - - (935) Loss attributable to
owners of parent - - - - - - - 1,678
Acquisition of treasury stock - - - - - - - (420)
Disposal of treasury
stock - - - - - - - 51
Net changes in items other than
shareholders’ capital 474 (6) (49) 207 626 46 12 685
Total changes during the period 474 (6) (49) 207 626 46 12 1,060
As of March 31, 2018 4,450 0 (154) 125 4,422 76 372 59,666

The fiscal year 2019
15
Consolidated Statements of Cash Flows Years ended March 31, 2019 and 2018
Millions of yen
March 31,
2019
March 31,
2018
Cash Flows from Operating Activities:
Profit before income taxes 5,115 2,489
Depreciation and amortization 3,297 3,094
Increase (Decrease) in allowance for doubtful accounts (5) 18
Impairment loss 141 -
Decrease in net defined benefit liabilities (45) (184)
Interest and dividend income (276) (214)
Interest expenses 87 129
Loss on retirement of fixed assets 25 44
Compensation for transfer - (250)
Dismantlement expenses - 197
Loss (gain) on valuation of investment securities 69 -
Decrease (Increase) in notes and accounts receivable-trade
861 (3,196)
Decrease (Increase) in inventories (4,266) 410
Decrease (Increase) in other accounts receivable (175) (107)
Increase (Decrease) in notes and accounts payable-trade
587 2,704
Increase (Decrease) in accrued expenses 111 326
Others-net 264 228
Subtotal 5,794 5,688
Interest and dividend income received 276 214
Interest expenses paid (85) (139)
Proceeds from compensation for transfer - 250
Dismantlement expenses paid (197) -
Income taxes refund(paid) (628) 29
Net cash provided by operating activities 5,158 6,043
The fiscal year 2019
16
Millions of yen
March 31,
2019
March 31,
2018
Cash Flows from Investing Activities:
Payments for purchase of property, plant and equipment
(4,588) (1,539)
Payments for purchase of intangible assets (239) (143)
Payments for purchase of investment securities (31) (18)
Payments for purchase of insurance funds (279) (260)
Proceeds from cancellation of insurance funds 66 532
Others-net 9 49
Net cash used in investing activities (5,061) (1,379)
Cash Flows from Financing Activities:
Increase in short-term loans payable - 2,500
Decrease in short-term loans payable - (2,897)
Proceeds from long-term loans payable 3,000 3,420
Repayments of long-term loans payable (2,798) (3,391)
Redemption of bonds - (5,000)
Cash dividends paid (1,007) (935)
Payments for purchase of treasury stock (0) (420)
Payments from changes in ownership interests in subsidiaries that do not result in change in scope of consolidation
(316) -
Others-net 76 28
Net cash used in financing activities (1,047) (6,696)
Effect of exchange rate change on cash and cash equivalents
(44)
11
Net decrease in cash and cash equivalents (995) (2,020)
Cash and cash equivalents at beginning of year 18,019 20,040
Cash and cash equivalents at end of year 17,023 18,019

The fiscal year 2019
17
7. Notes
(Notes on the Premise of a Going Concern)
There are no applicable articles.
(Additional Information)
(Accounting procedures for the ESOP trust)
With the aim of ensuring employee benefits, the Company provides shares of the Company to the Nippon-Thompson
Employee Stock Ownership Association (hereafter referred to as the Company’s Stock Ownership Association) through the
ESOP Trust.
(1) Outline of Trades
The ESOP trust (hereafter referred to as the Trust Account) was established by the Company to cover employees enrolled
in the Company’s Stock Ownership Association who fulfill certain criteria for becoming beneficiaries. Within a
predetermined acquisition period, the Trust Account acquires shares of treasury stock in a number equivalent to that which
the Company’s Stock Ownership Association expects to acquire over the five years, and then sells on said stock to the
Company’s Stock Ownership Association on a set day every subsequent month. At the end of the term of the trust, if the
Trust Account records a profit due to higher share prices, this profit shall be distributed to the beneficiaries in proportion to
their individual contributions. If the Trust Account records a loss on transfer due to lower share prices and debt is incurred
on trust assets, no additional burden will be imposed on employees as the Company will repay the bank in one lump sum
in accordance with the warranty of the loan agreement.
(2) Treasury Shares Remaining in the Trust
Shares of the Company remaining in the trust are recorded as treasury shares under net assets at carrying value (net of
associated costs) . The carrying value and number of such treasury shares were ¥416 million and 480,000 shares
respectively at March 31, 2018 and ¥310 million and 358,000 shares respectively at March 31, 2019.
(3) Carrying Value of Loans Recorded through Application of the Gross Price Method
As of March 31, 2018: ¥420 million; As of March 31, 2019: ¥336 million
(Change in presentation)
(Change Following the Application of Partial Amendments to Accounting Standard for Tax Effect Accounting)
The Group applies Partial Amendments to Accounting Standard for Tax Effect Accounting (ASBJ Statement No. 28, February
16, 2018) from April 1, 2019. Deferred tax assets will now be presented under investments and other assets, and deferred tax
liabilities will now be presented under long-term liabilities.
As a result, in the consolidated balance sheet for the previous fiscal year, ¥1,687 million in deferred tax assets under
current assets and ¥1,342 million out of the total deferred tax liabilities under long-term liabilities are now included in the ¥344

The fiscal year 2019
18
million in deferred tax assets under investments and other assets, and deferred tax liabilities under long-term liabilities are now
presented as ¥113 million.
(Consolidated Cash Flow Statements)
In the previous fiscal year, payments into time deposits and proceeds from time deposits under cash flows from investing
activities are now included in others-net from the current fiscal year forward due to their diminished importance. The
consolidated financial statements of the previous fiscal year have been re-presented to reflect this change in the presentation
method.
As a result, compared with the consolidated cash flow statements of the previous fiscal year, ¥83 million in
payments into time deposits, ¥201 million in proceeds from time deposits, and outflows of ¥68 million in others-net were
re-presented as ¥49 million in others-net.
(Statement of Changes in Consolidated Shareholders’ Equity)
For the fiscal Year ended March 31, 2019
1. Class and Number of Shares Issued
As of April 1, 2018
(Shares)
Increased shares
during the fiscal year
(Shares)
Decreased shares
during the fiscal year
(Shares)
As of March 31, 2019
(Shares)
Common stock 73,501,425 - - 73,501,425
2. Class and Number of Treasury stock
As of April 1, 2018
(Shares)
Increased shares
during the fiscal year
(Shares)
Decreased shares
during the fiscal year
(Shares)
As of March 31, 2019
(Shares)
Common stock 2,005,532 1,030 154,760 1,851,802
Notes: 1. The 358,500 shares held by the ESOP trust are included in treasury stock at March 31, 2019
Notes: 2. The increase of 1,030 shares of treasury stock is due to purchase of odd lot shares of less than one trading unit.
Notes: 3. The decrease of 60 shares of treasury stock is due to sales claims of odd lot shares of less than one trading unit.
Notes: 4. The decrease of 33,100 shares of treasury stock is due to exercise of the share option rights.
Notes: 5. The decrease of 121,600 shares of treasury stock is due to sales of shares by the ESOP trust to the Employee
Stock Ownership Association.
3.Subscription rights
Breakdown of
subscription rights
Type of
shares
subject to
subscription
rights
Number of shares subject to subscription rights (Shares) Balance as of
March
31,2019
(Millions of
yen)
As of
April 1, 2018
Increased
shares
during the
fiscal year
Decreased
shares
during the
fiscal year
As of March
31, 2019
The
Company
Stock Options as
Subscription
Rights
- - - - - 114
Total - - - - 114

The fiscal year 2019
19
4. Dividend
(1) Dividend Paid
Resolution Class of
Stock
Total Dividend
(Millions of yen)
Dividend per
share
(Yen)
Record
date
Effective
Date
Ordinary general meeting
of shareholders on
June 28, 2018
Common stock 467 6.50 March 31,
2018
June 29,
2018
Board of directors on
November 12, 2018 Common stock 540 7.50 September 30,
2018
December 12,
2018
Notes: 1. Total dividends, based on a resolution at the ordinary general meeting of shareholders held on June 28, 2018, include
¥3 million to be paid as dividends on the 480,100 shares of treasury stock held to date by the ESOP trust.
Notes: 2. Total dividends, based on a resolution at a meeting of Board of Directors held on November 12, 2018, include
¥3 million to be paid as dividends on the 431,900 shares of treasury stock held to date by the ESOP trust.
(2) Dividend with a record date that falls within the current fiscal period under review and an effective date in the following
fiscal period
Resolution Class of
stock
Resource
of dividend
Total Dividend
(Millions of yen)
Dividend per
share
(Yen)
Record
date
Effective
Date
Ordinary general meeting
of shareholders on
June 27, 2019
Common
stock
Retained
earnings 540 7.50
March 31,
2019
June 28,
2019
Note: Total dividends include ¥2 million to be paid as dividends on the 358,500 shares of treasury stock held to date by
the ESOP trust.
For the fiscal Year ended March 31, 2018
1. Class and Number of Shares Issued
As of April 1, 2017
(Shares)
Increased shares
during the fiscal year
(Shares)
Decreased shares
during the fiscal year
(Shares)
As of March 31, 2018
(Shares)
Common stock 73,501,425 - - 73,501,425
2. Class and Number of Treasury stock
As of April 1, 2017
(Shares)
Increased shares
during the fiscal year
(Shares)
Decreased shares
during the fiscal year
(Shares)
As of March 31, 2018
(Shares)
Common stock 1,638,790 484,842 118,100 2,005,532
Notes: 1. The 480,100 shares held by the ESOP trust are included in treasury stock at March 31, 2018.
Notes: 2. The increase of 342 shares of treasury stock is due to purchase of odd lot shares of less than one trading unit.
Notes: 3. The increase of 484,500 shares of treasury stock is due to purchase of treasury stock by the ESOP trust.
Notes: 4. The decrease of 118,100 shares of treasury stock is due to sales of shares by the ESOP trust to the Employee
Stock Ownership Association.

The fiscal year 2019
20
3.Subscription rights
Breakdown of
subscription rights
Type of
shares
subject to
subscription
rights
Number of shares subject to subscription rights (Shares) Balance as of
March
31,2018
(Millions of
yen)
As of
April 1, 2017
Increased
shares
during the
fiscal year
Decreased
shares
during the
fiscal year
As of March
31, 2018
The
Company
Stock Options as
Subscription
Rights
- - - - - 76
Total - - - - 76
4. Dividend
(1) Dividend Paid
Resolution Class of
Stock
Total Dividend
(Millions of yen)
Dividend per
share
(Yen)
Record
date
Effective
Date
Ordinary general meeting
of shareholders on
June 29, 2017
Common stock 467 6.50 March 31,
2017
June 30,
2017
Board of directors on
November 6, 2017 Common stock 467 6.50 September 30,
2017
December 6,
2017
Notes: 1. Total dividends, based on a resolution at the ordinary general meeting of shareholders held on June 29, 2017, include
Notes: ¥0 million to be paid as dividends on the 113,700 shares of treasury stock held to date by the ESOP trust.
Notes: 2. Total dividends, based on a resolution at a meeting of Board of Directors held on November 6, 2017, include
Notes: ¥0 million to be paid as dividends on the 43,000 shares of treasury stock held to date by the ESOP trust.
(2) Dividend with a record date that falls within the current fiscal period under review and an effective date in the following
fiscal period
Resolution Class of
stock
Resource
of dividend
Total Dividend
(Millions of yen)
Dividend per
share
(Yen)
Record
date
Effective
Date
Ordinary general meeting
of shareholders on
June 28, 2018
Common
stock
Retained
earnings 467 6.50
March 31,
2018
June 29,
2018
Note: Total dividends include ¥3 million to be paid as dividends on the 480,100 shares of treasury stock held to date by
the ESOP trust.
The fiscal year 2019
21
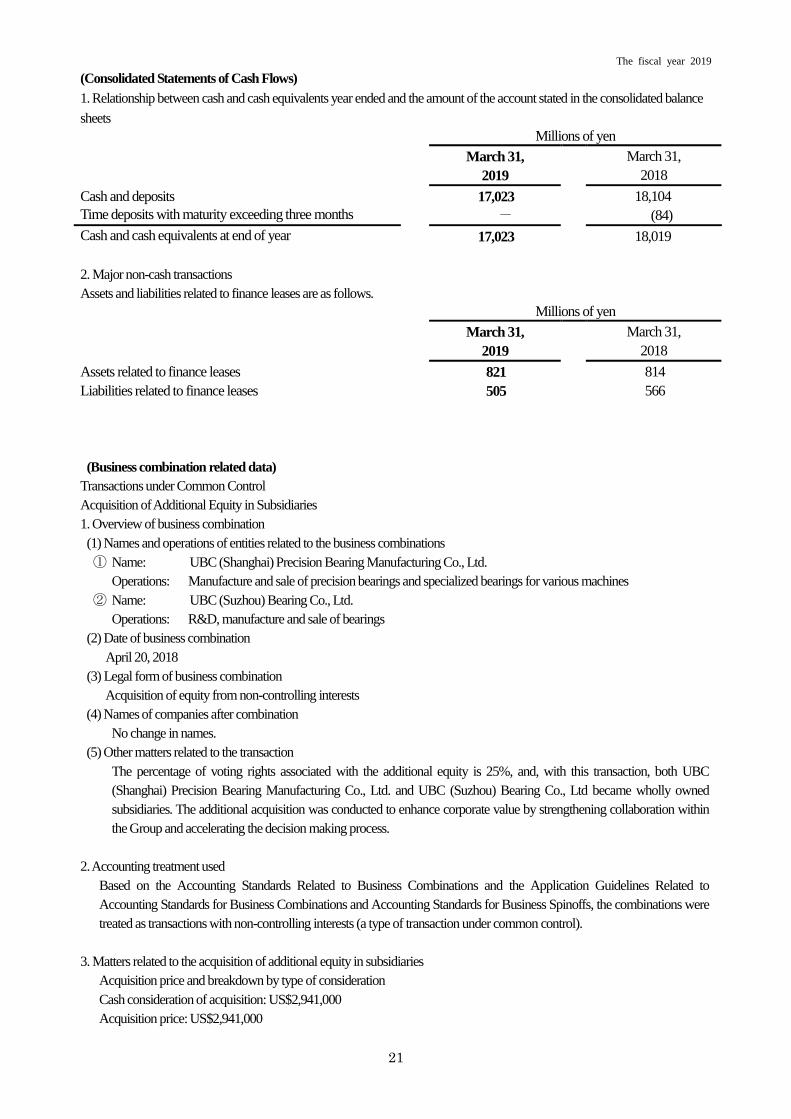
(Consolidated Statements of Cash Flows)
1. Relationship between cash and cash equivalents year ended and the amount of the account stated in the consolidated balance
sheets
Millions of yen
March 31,
2019
March 31,
2018
Cash and deposits 17,023 18,104
Time deposits with maturity exceeding three months - (84)
Cash and cash equivalents at end of year 17,023 18,019
2. Major non-cash transactions
Assets and liabilities related to finance leases are as follows.
Millions of yen
March 31,
2019
March 31,
2018
Assets related to finance leases 821 814
Liabilities related to finance leases 505 566
(Business combination related data)
Transactions under Common Control
Acquisition of Additional Equity in Subsidiaries
1. Overview of business combination
(1) Names and operations of entities related to the business combinations
① Name: UBC (Shanghai) Precision Bearing Manufacturing Co., Ltd.
Operations: Manufacture and sale of precision bearings and specialized bearings for various machines
② Name: UBC (Suzhou) Bearing Co., Ltd.
Operations: R&D, manufacture and sale of bearings
(2) Date of business combination
April 20, 2018
(3) Legal form of business combination
Acquisition of equity from non-controlling interests
(4) Names of companies after combination
No change in names.
(5) Other matters related to the transaction
The percentage of voting rights associated with the additional equity is 25%, and, with this transaction, both UBC
(Shanghai) Precision Bearing Manufacturing Co., Ltd. and UBC (Suzhou) Bearing Co., Ltd became wholly owned
subsidiaries. The additional acquisition was conducted to enhance corporate value by strengthening collaboration within
the Group and accelerating the decision making process.
2. Accounting treatment used
Based on the Accounting Standards Related to Business Combinations and the Application Guidelines Related to
Accounting Standards for Business Combinations and Accounting Standards for Business Spinoffs, the combinations were
treated as transactions with non-controlling interests (a type of transaction under common control).
3. Matters related to the acquisition of additional equity in subsidiaries
Acquisition price and breakdown by type of consideration
Cash consideration of acquisition: US$2,941,000
Acquisition price: US$2,941,000

The fiscal year 2019
22
4. Matters related to change in Nippon Thompson’s equity due to transactions with non-controlling interests
(1) Main factor behind the change in capital surplus
Acquisition of additional equity in subsidiaries
(2) Amount by which capital surplus declined due to transactions with non-controlling interests
¥11 million
(Segment Information)
Because the Group manufactures and sells Needle Roller Bearings, Linear Motion Rolling Guides and Machine
Components on an integrated basis, the disclosure of segment information has been omitted.
(Per Share Information)
Yen
March 31,
2019
March 31,
2018
Net assets per share 837.24 828.26
Earnings per share 51.95 23.35
Diluted earnings per share 51.81 23.30
Notes: 1. Basis for calculations of earnings per share and diluted earnings per share is as follows.
Millions of yen
March 31,
2019
March 31,
2018
Earnings per share
Profit (loss) attributable to owners of parent 3,718 1,678
Value not attributed to common stock - -
Profit (loss) attributable to owners of parent pertaining to
common stock 3,718
1,678
Average number of shares outstanding at period-end 71,582,315shares 71,886,988shares
Diluted earnings per share
Adjustment value of profit attributable to owners of parent - -
Increase in number of shares outstanding 189,563 144,828
(of which subscription rights to shares) (189,563) (144,828)
Residual shares not included in the calculation of diluted net
income per share because they have no dilutive effect -
-
Notes: 2. With regard to the computation of the number of shares outstanding at period-end, which is used to determine net
assets per share, and the average number of shares outstanding at period-end, which is used to determine earnings
per share for the period , the shares held by the ESOP trust are included in treasury stock.
(Important Subsequent Events)
There are no applicable articles.