Embed Size (px)
Citation preview

Cartelization
Continuation of War by Other Means?


Something New in HistoryThe Oil Firm-State
extracts de facto tax on foreigners
core OPEC WT2007 = $(53)22m/d(365d)= $425b/y
Firm-state is akin to tribute economies, but…
taxes flow without empire, force, or occupation

WORTH FIGHTING FOR? Microeconomics of Oil Market Power
In units/barrel let: Pm = market price, i.e. $60 Pc = price if market were competitive, i.e. $7 Q = quantity produced Qe = quantity exported R = revenue WT = wealth transfer (or monopoly rent) Pm - Pc = WT $(60 - 7) = WT = $53
relevant functions: producer revenue P Q = R core-OPEC revenue P Qe = R core-OPEC wealth transfer (Pm - Pc)Qe = WT Iran WT, 2007
(Pm - Pc)Qe iran= WT $(53)2.4 m/d (365 d) = $46.5 billion
$46.5 b = 0.7 Irani state revenue core OPEC WT, 2007 $(53)22 m/d (365 d) = $425 billion/yr
compare to US aid to Israel, Egypt = $2.5 billion each

Monopoly Rents and Instability The Quest for Wealth Transfer $
Instability
Contestants
Between states
War Within states
Civil War
Extra-legal siezure Contests for revenues of state oil firm
Iran-Iraq; Iran-Kuwait Iraq; Angola; Sudan; Chad Nigeria; Russia; Venezuela Iran: NIOC vs. state; Mexico: PEMEX vs. state; Nigeria: provinces, bandits, rebels, national government

Within the Firm-StateShort-Run Political Return on Oil Investment = $ 0

Islamic Republic of Iran Revenue and Expense
-
100,000
200,000
300,000
400,000
500,000
600,000
2000 2001 2002 2003 2004 2005 2006
Irani
an R
ials
(nom
inal
)
RevenueExpense

State Revenue Composition, Islamic Republic of Iran
-
100,000
200,000
300,000
400,000
500,000
600,000
2001 2002 2003 2004 2005
Irani
an R
ials
(nom
inal
)
Other Oil Revenue
Taxes & Tariffs
Oil Revenue toBudget

Selected Balance of Payments Data, IRI
05
1015202530354045
2000 2001 2002 2003 2004 2005 2006
billi
ons
$ (n
omin
al)
foreign direct investment inNIOC buybackstotal implied IRI + buybackinvestmentnet currency reserves
Disinvestment like Mexico, but Cash-Rich Just the Same
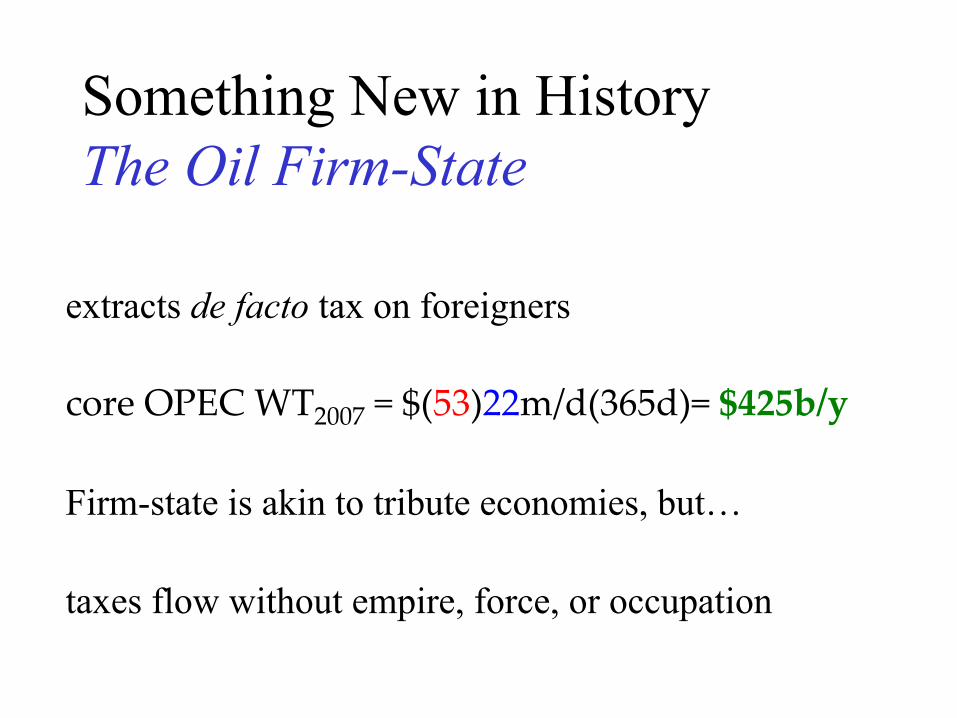
Iran Energy Balance, 1980-2004
yellow – domestic demand blue - exports


0
20,000
40,000
60,000
80,000
100,000
120,000
140,000
160,000pr
oduc
tion
in 1
06 m
3
2000 2001 2002 2003 2004
year
shrinkage
flaring
exports
reinjection
domestic consumptionof domestic product

Selected Balance of Payments Data, IRI
05
1015202530354045
2000 2001 2002 2003 2004 2005 2006
billi
ons
$ (n
omin
al)
foreign direct investment inNIOC buybackstotal implied IRI + buybackinvestmentnet currency reserves
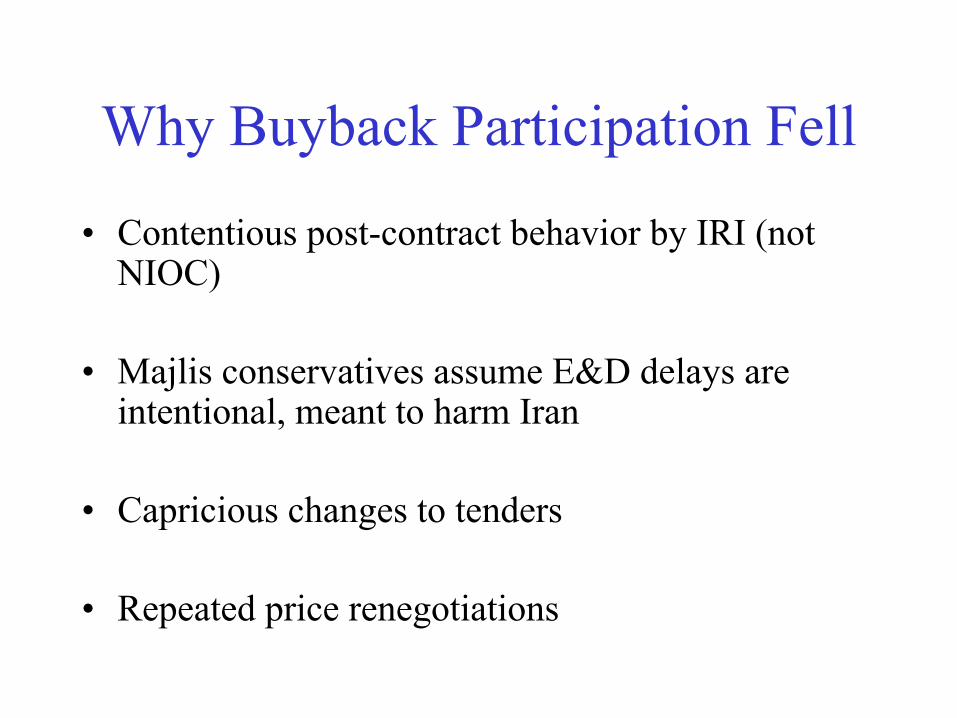
Why Buyback Participation Fell
• Contentious post-contract behavior by IRI (not NIOC)
• Majlis conservatives assume E&D delays are intentional, meant to harm Iran
• Capricious changes to tenders
• Repeated price renegotiations

Non-economic Dimensions of Iranian FDI Policy
• IRI seeks to emulate Iraq’s fiscal policy of I-I War
• i.e: transform former adversaries into creditors
• re Asia IRI reserves largest, least-cost fields for Asian firms
• Results mixed: – Success with France, China– Failure with Japan, India (on oil)

Paradoxes of Irani PetroleumRefinery leaks = 6% of crude supplied
Refinery disinvesment compels gasoline imports
Automobile import tariffs approach 100%, insuring survival of ancient gas-guzzlers
Fleet relies on subsidies that price gasoline at $0.35/gallon (new two tier price scheme)
Where is the gas?

Paradoxes of IRI Fiscal Policy
Net reserves triple to $42b in 4 years, yet
Russia stonewalled over $300m reactor payment
Popular infrastructure projects abandoned after capital budget triples in 4 years
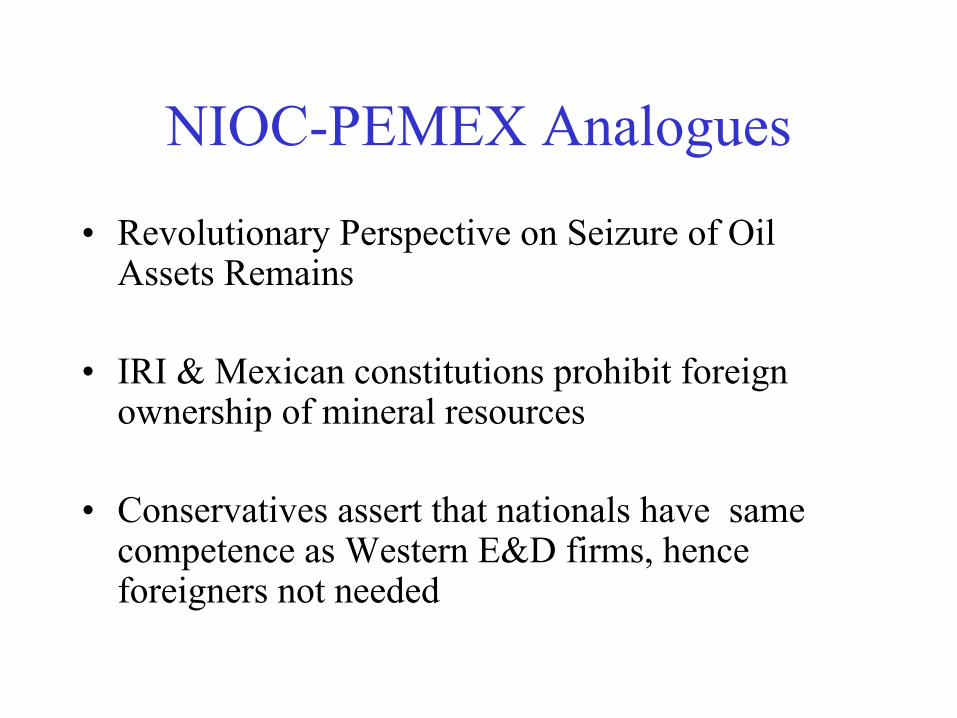
NIOC-PEMEX Analogues
• Revolutionary Perspective on Seizure of Oil Assets Remains
• IRI & Mexican constitutions prohibit foreign ownership of mineral resources
• Conservatives assert that nationals have same competence as Western E&D firms, hence foreigners not needed

NIOC-PEMEX Analogues
Parallel workarounds (buybacks & PIRIDEGAS) to disguise foreign participation
Focus on short-run revenue for govt. operations
Potentially severe consequences if price declines (Iran planning price = $40; PEMEX debt = $100b
State ignores management’s risk-awareness

NIOC-PEMEX Analogues
• Refinery base suffers most neglect
• Upstream engineering & technology capacities inadequate
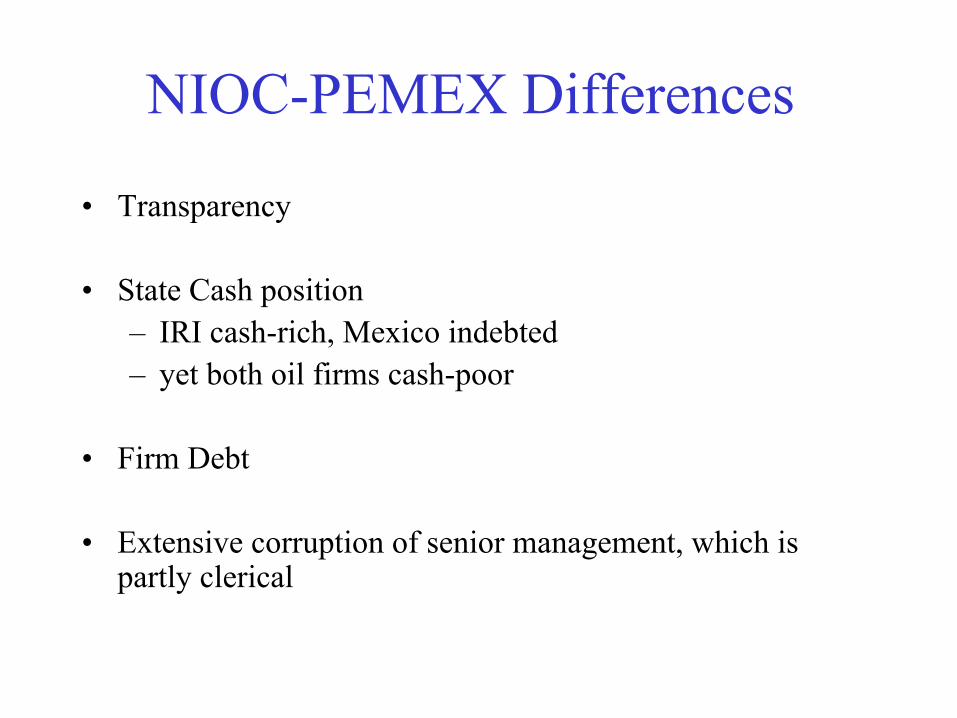
NIOC-PEMEX Differences
• Transparency
• State Cash position– IRI cash-rich, Mexico indebted– yet both oil firms cash-poor
• Firm Debt
• Extensive corruption of senior management, which is partly clerical

NIOC-PEMEX Differences
• US Relations (Iran-Libya Sanctions Act) Imposes Costs
• Parent state not trying to build nuclear weapon