Embed Size (px)
Citation preview
NINE STANDARDIZED SCALES FOR EVALUATING TREATMENT OUTCOME IN A MENTAL HEALTH CLINIC'
AUSTEN CLARK AND MATTHEW J . FRIEDMAN
Veterans Adminisrraiion Hospital Whiie River Juncrion. Vermont
and Darimourh Medical School
Analyzed psychometrics of a package of standardized scales used to assess mental health treatment outcomes in a VA cost-effectiveness study (N = 45 I ). Nine scales were derived: Family involvement, involvement with friends, labor market participation, symptomatology (both self-reported and therapist rated), substance abuse (alcohol and drugs), client satisfaction, and client goal attainment. Scales were drawn from several existing instruments, including the Denver Community Mental Health Questionnaire (CMHQ), the Symptom Checklist 90 (SCL-90), the Global Assessment scale, and others. Item-item and item-total correlations showed each scale to have high internal consistency. Principal components analysis demonstrated distinct factors for each scale and good clustering of items within scales. All scale items are discrete choice and have excellent interrater reliability. Validity was corroborated by multiple regression, which showed different scales to be sensitive to different predictors of follow-up status.
Spurred by necessity, the technology of mental health outcome measurement has made much progress in the past decade. Partly this is a function of the increased account- ability of social service agencies, which find themselves called upon to show that treatments deliver as promised. The need is accentuated by cost-effectiveness studies, in which program outcomes must be quantified. Finally, public managers interested in max- imizing the effectiveness of dollars spent have pressed for valid measurement of program effects.
The Veterans Administration recently completed a cost-effectiveness study of the feasibility of referring veterans from a centralized hospital-based clinic in White River Junction, Vermont to VA-employed psychiatric social workers based in local community mental health centers. In order to evaluate adequately the relative impact of the hospital- based and community-based programs, the important effects of treatment must be measured. Reduction of symptomatology is of course of prime concern, but in addition the effect of treatment on other aspects of client functioning must be considered. For ex- ample, clients may show increased involvement with family or friends. Treatment may enhance the ability of the client to be a self-supporting member of the labor market, leading to decreased use of public services. Abuse of alcohol and drugs should be assessed. Finally, the degree to which clients are satisfied with services and achieve their goals is an important consideration.
An outcome instrument should meet rigorous psychometric demands for reliable and valid measurement. Given its use in a general clinic, its items must have face validity and must be unambiguous and acceptable to the average client. In addition, the instru- ment should minimize bias and observer error by employing a structured format, in which questions are presented literally, and client responses are discrete-choice. The need for observer inference should be minimized because it typically results in poor interrater
'Supported by the Veterans Administration. The authors gratefully acknowledge the work of Marie Man- ning, Mike Ryan, Sarah Daniels, and Janet Griffin, who performed the interviews in the study. Dr. Clark is currently at the Department of Philosophy, University of Tulsa, Tulsa, Oklahoma. Address reprint rqucsts to Matthew J. Friedman, M.D., Ph.D., Chief, Department of Psychiatry, Veterans Administration Hospital, White River Junction, Vermont 05001.
939

940 Journal of Clinical Psychology, November, 1983, Vol. 39, No. 6
reliability. With literal questions and discrete responses, the overall score is derived from specific respondent behaviors in the interview. Such structured interviews can be per- formed by trained technicians rather than professionals. To maximize client acceptance the interview should be brief, and it should be possible to perform it both in the home and in the clinic.
The first such multi-dimensional evaluation instrument was the Psychiatric Status Schedule, developed by Spitzer, Endicott, Fleiss, and Cohen (1970). It addressed a broad range of outcome dimensions and covered psychiatric signs and symptoms, social func- tioning, role performance, and substance abuse. However, it did not prove appropriate for the VA cost-effectiveness study. The schedule is not a structured interview, in which a particular question is asked and one of a number of particular answers chosen; rather, it is an interview guide, in which the topical areas for the interview are given .and sample questions provided, but particular questions are not prescribed. While the schedule avoids global ratings, it does not use discrete-category responses, but rather requires the interviewer to assess whether the respondent stated, mentioned, or indicated certain facts. Supplementary questions and general probes are optional, and because inter- vieweis may differ in the care with which they pursue such optional items, the reliability of data may vary from interviewer to interviewer. Because of these characteristics, inter- views were reported to last 30 to 50 minutes, yet (for the VA study) additonal questions would be needed to assess public system dependency, client satisfaction, and goal attain- ment, as well as to assess numerous control variables such as medical history and client demographics. It was felt that the resulting interview would be too lengthy, particularly since an intake interview and three followups were to be performed.
Other inventories cover many of the same content areas, but were felt to be inap- propriate for other reasons. For example, the Personal Adjustment and Role Skills scale (Ellsworth, 1975) is used to assess psychiatric and social functioning, with factors for Agitation-depression, Anxiety, Confusion, Alcohol Abuse, Interpersonal Relations, Parenting, Social Involvement, Employment, and Household Skills. However, the PARS is administered by mail to patient collaterals, who rate the functioning of the patient. This was not a practical means of collecting outcome data in this population, for many veterans are either isolated or highly mobile. Follow-up rates for mailed inven- tories are also unacceptably low (cf. Schainblatt & Hatry, 1979, p. 34). Other in- struments such as the Psychiatric Evaluation Form (Endicott & Spitzer, 1972), Brief Psychiatric Rating Scale (Overall & Gorham, 1962), Problem Appraisal Scales, Periodic Evaluation Record, and Mental Status Examination Record (Spitzer & Endicott, 197 I ) all employ global ratings with no specification of question content.
The work of Ciarlo and others in the Denver Mental Health Systems Evaluation project provided another model for evaluating the effects of treatment, and in many ways formed the basis of the interview reported here (cf. Ciarlo & Reihman, 1977). The instru- ment that they developed is a structured interview with discrete-choice response categories. Ten scales are derived: Psychological distress, isolation from family, isolation from friends, hostility, productivity, legal difficulties, public dependency, alcohol abuse, drug abuse, and client satisfaction. In addition, a long-form questionnaire assesses fre- quency of use of illicit drugs. The interview can be administered by trained technicians in client homes. Finally, the questionnaire was the subject of several psychometric studies and promised to attract further research interest.
Unfortunately, pretests with 24 veterans revealed several problems with the Denver interview. It relegates consideration of symptomatology to 10 questions, which did not provide adequate detail. Questions that concerned legal difficulties and alcohol abuse were found offensive by many veterans (e.g., “How many times in the last month have you been arrested on intoxication-related charges?”) Questions that concerned hobbies and other aspects of productivity at home were judged to consume an inordinate propor- tion of interview time compared to symptomatology and self-support issues. The client

Scales for Evaluaring Trearmenr Outcome 94 I
satisfaction scale consisted of six items that seemed to be leading questions peripheral to the issue of satisfaction with therapy.
Because the main faults found with the Denver questionnaire concerned its emphasis and the adequacy of particular scales rather than its overall approach, the decision was made to drop particular scales and find substitutes elsewhere.
Recently, work based in part on the Denver study has resulted in the “Quality of Life” interview of Bigelow, Brodsky, Stewart, Olson, and Howard (1980) in the Oregon program impact monitoring system. Unfortunately, this instrument was not available at the beginning of the VA study. Like the Denver interview, it employs a structured format that ranges over many dimensions of interest. The instrument is administered by trained nonprofessional interviewers and has four groups of scales. The first group is Personal Adjustment, which contains the scales generally used in assessment of psychiatric signs and symptoms: Psychological distress, well-being, satisfaction, independence, and basic needs satisfaction. Like the Denver questionnaire, there is no detailed exploration of symptom clusters such as anxiety, depression, grandiosity, suspiciousness, and so on. The second group consists of Interpersonal Adjustment scales, which assess social func- tioning in terms of social support, isolation, and role involvement with family and friends. A third category of scales concern productivity and adjustment to the labor market: Housekeeping, work at the job, work at school, and use of leisure time. Finally, Civic Adjustment scales assess legal difficulties, alcohol and drug abuse, public dependency, and community participation.
In short, mental health treatment evaluation should if possible assess six dimensions of outcome. Physical functioning comprises scales for somatic concern, activities of daily life, and functional health status. Syrnptomatology scales can range from single psy- chological distress indices to a multidimensional symptom construct approach. Other Psychological funcrioning scales sometimes are included, such as memory, orientation, alertness, and speech. Many aspects of Social funcrioning are important, including family and friends’ roles, productivity, employment, and community adjustment. Substance abuse scales for alcohol and drugs are important in mental health settings. Finally, CIienr satisfacrion should be assessed both in terms of satisfaction with services and goal attainment. Many schedules cover some or all of these dimensions, but at the time the VA study began, no instrument was available that covered all the dimen- sions in a structured interview format. There was still a need to pick and choose among scales so as to obtain an optimal mix.
METHOD Interview scales and items were drawn from several different instruments. Along
with the structured interview, two further modes of data collection were included: Global therapist ratings (the Global Assessment Scale) and a self-report questionnaire (the SCL-90). The latter was used in order to obtain more information than typically is gathered concerning psychiatric signs and symptoms.
Interviewers all had bachelor’s degrees in behavioral or natural science. Ap- proximately I00 pages of training materials were prepared, including a handbook on structured interviewing technique and an interview codebook that provided definitions and elaborations of items. A 1-day training session reviewed structured interviewing methods and provided role-playing practice. Thereafter, interviewers sat in on one another’s interviews for the next 2 to 3 weeks.
The interview schedule was developed by combining the various items and scales with demographic and historical items and then rearranging the schedule until a natural and easy flow of questions was achieved. Role-playing helped in this work, and the schedule was pretested on 24 veterans before the final version was achieved.
The intake interview schedule is 24 pages long and takes from 30 to 50 minutes to administer. Along with seven outcome scales, it includes a survey of client demographics and a review of past use of psychiatric services.

TAB
LE 1
Out
com
e Sc
ales
Nam
e C
onte
nt
Sour
ce
# Ite
ms
Rel
iabi
lity
Fam
ily In
volv
emen
t A
mou
nt o
f per
sona
l con
tact
with
D
enve
rCM
HQ
(1)
fam
ily
Frie
nds
Self
Supp
ort
Sym
ptom
atol
ogy
Am
ount
of p
erso
nal c
onta
ct w
ith
Den
ver C
MH
Q (I
) fr
iend
s A
bilit
y to
be s
elf-
supp
ortin
g m
embe
r of l
abor
mar
ket
4 .6
1
4 .6
3
Soci
al A
djus
tmen
t Sca
le (2
). 10
.9
I Ps
ychi
atric
Sta
tus S
ched
ule (
3).
Den
ver C
MH
Q (I
) Se
lf-re
porte
d dis
tress
ove
r sym
ptom
- Sy
mpt
om C
heck
list 90 (
4)
atic
feel
ings
and
thou
ghts
G
loba
l Ass
essm
ent
Ther
apis
t rat
ing
of c
lient
fu
nctio
ning
90
.95
Glo
bal A
sses
smen
t Sca
le (5
) I
.77
Alc
ohol
Use
A
mou
nt a
nd fr
eque
ncy
of a
lcoh
ol
NIA
AA
Int
ake
(6)
cons
umpt
ion
6 .9
6
Dru
g A
buse
Fr
eque
ncy o
f use
of n
ine i
llici
t dru
gs
Den
ver C
MH
Q (I
) 9
.73
Goa
l Atta
inm
ent
Clie
nt ra
ted
prog
ress
tow
ard
treat
men
t G
oal A
ttain
men
t Sca
ling
(7)
goal
s 3
.64
Clie
nt S
atis
fact
ion
Satis
fact
ion
with
site
and
ther
apis
ts
Satis
fact
ion
Inve
ntor
ies (
8)
I2
.88
Not
es.-
(l)
Cia
rlo &
Rei
hman
, 197
7. (2
) Wei
ssm
an &
Pay
kel,
1974
. (3)
Spi
tzer
, End
icot
t, Fl
eiss
. & C
ohen
. 197
0. (4
) Der
ogat
is, L
ipm
an, &
Cov
i, 19
73; D
erog
atis
& C
lear
y, 1
977.
(5)
Endi
cott,
Spi
tzer
, Fle
iss, &
Coh
en,
1976
. (6)
Nob
le,
1978
. (7)
Kire
suk
& S
herm
an,
1968
. (8)
Hul
ka, Z
yzan
ski,
Cas
sel.
& T
hom
pson
, 19
70.
3 f e B

Scales for Evaluaring Trearmenr Outcome 943
Subjects All veterans who requested service from the Psychiatry Department and were
residing in certain regions in the states of New Hampshire and Vermont were a p proached to participate in the study. Data on 45 1 veterans are reported. Their mean age was 44 years (SD = l 3 . l ) , and on the average they had completed 11.7 years of educa- tion, which corresponds to the fifty-second percentile of 1970 U. S. census data for the Northeastern United States (Green, 1970). The average gross family income was $10,- 500, which is at the fiftieth 1970 census percentile. Diagnostic information was extracted from patient charts, and multiple diagnoses were recorded. Because there was no reliable method for determining the primary diagnosis, they all were used and hence sum to more than 100%. Of 451 veterans, 29.9% were diagnosed depressed (DSM-I1 296 0-296.8 or 298.0); 24.6% with anxiety neuroses (DSM-I1 300.0-300.8); 22.1% with alcoholism or drug dependence (303.0-304.8); 12.9% schizophrenic (295.0-295.99, 297.0-297.9); 15.8% with a personality disorder (301.0-301.89); and 21.0% with a marital or situational dis- order (307.0-308.9, 3 16.0-316.9).
Scale Analysis ' Item-item and item-total correlation matrices for each scale were examined. Some
items failed to correlate as expected, and the initial scale assignment for such items was revised. Scale-scale correlations also were investigated, and on that basis some dimen- sions were combined. This was an iterative process that continued until each scale had an acceptable internal consistency and low correlation with other scales. Scale analysis con- cluded with a confirmatory factor analysis of items. Principal components analysis was used with iterative estimation of communalities.
Interrater reliability data were gathered during interviewer training. One technician administered and scored the interview, and the other merely scored it. Scorers and ad- ministrators alternated.
Although all the outcome items came from previously developed scales, their use in this evaluation provided further information on the validity of the scales. Multiple regression techniques were used to examine the sensitivity of the scales to diagnostic and treatment differences among the respondents.
RESULTS Scale Composilion
From the originally hypothesized 20 scales, analysis narrowed the list to 9, as reported in Table 1 . The loss of I 1 scales came about because three domains-work im- pairment, employment status, and public dependency-were so highly related as to form one scale; and, secondly, because the 10 symptom subscales of the SCL-90 were SO highly intercorrelated in this patient population that they are in essence but one scale. (Findings on the SCL-90 are reported in Clark and Friedman, 1983).
The first two scales-Family Involvement and Friends Involvement-assess the amount of involvement or contact that the veteran has with family members and friends. The source for both was the Denver CMHQ. All of the Denver conventions that concern item coding, definitions, missing value replacement, and so on were observed. Internal consistency for these scales was somewhat disappointing. Ciarlo and Reihman (1977) report internal consistencies of these scales of .72 and .73, respectively. In the VA sample the average interitem correlation is for some reason lower, and hence the scales have alphas of .61 and .63, respectively. However, the two groups of items clearly form two scales; when an attempt was made to combine all the items as one scale it was found that several of the Family items have negative correlations with Friends items, that item-total correlations dropped, and that alpha hence fell to .58.

944 Journal of Clinical Psychology, November, 1983, Vol. 39. No. 6
The third scale-Self Support-combines items from what were thought to be three distinct domains: Employment status, work impairment, and public dependency. The resulting scale assesses the respondent’s ability to be a self-supporting member of the labor market, with one extreme the individual who is out of the labor market because of psychiatric disturbance and living primarily on public support, and the other an in- dividual who is self-supporting and not work impaired. The justification for combining these domains is provided by the high item-item and item-total correlations among them, as shown in Table 2. Items are coded so that higher scores represent increased dysfunc- tion. The public dependency item is identical with the Denver CMHQ scale of the same name, which is a series of yes-no questions that concern use of four different sources of public support. The welfare item is a list of income maintenance agencies, weighted in terms of the magnitude of the assistance they typically provide; the four items are averaged. Work impairment items are derived from the Psychiatric Status Schedule (Spitzer et al., 1970) and from the Social Adjustment Scale (Weissman & Paykel, 1974). Eight such items receive different weights, and their average is computed. The resulting scale has a reliability (alpha) of .9 I .
TABLE 2
Item Characteristics of Sey-support Scale
Item Average r with Item-total Alpha if
other items correlation item deleted
Current employment status (census
Lknver CMHQ public dependency scale Main source of income-employment, other
sclf-support, family, or public Weeks unemployed since last interview
(or past year) Cluster of work impairment items
(problems or complaints at work) Usc of Seven welfare agencies Do psychiatric problems keep you from
Are difficulties at work due to moods or
How much do those feelings interfere with
How often do you have problems working?
definitions)
working at all?
feelings you have?
work?
.626
,372
S48
3 7
,627
.434
,247
.603
3 9
.59 I
.839
.453
,686
.784
.873
.542
.317
3 5 6
.822
.830
.892
.914
.902
.902
388
.91 I
.918
.a97
.a93
.892
N = 435. a = .911.
An attempt was made to measure symptom reduction at a finer level of detail than that provided by a single Psychological Distress scale. The 90-item Symptom Checklist (Derogatis, Lipman, & Covi, 1973) was used to provide an inventory of symptomatic behaviors and thoughts, summarized in nine symptom factors: Somatization, Obsessive- compulsive, Interpersonal Sensitivity, Depression, Anxiety, Hostility, Phobic Anxiety, Paranoia, and Psychoticism. However, as reported elsewhere (Clark & Friedman, 1983), psychometric analysis of the inventory with this sample did nor substantiate the claim that nine different symptom factors can be derived in this sample, and in fact their intercorrelations are so high that the instrument essentially measures a single psy- chological distress factor. Interestingly, in both the Denver CMHQ and the Quality of
Scales for Evaluating Treatment Outcome 945
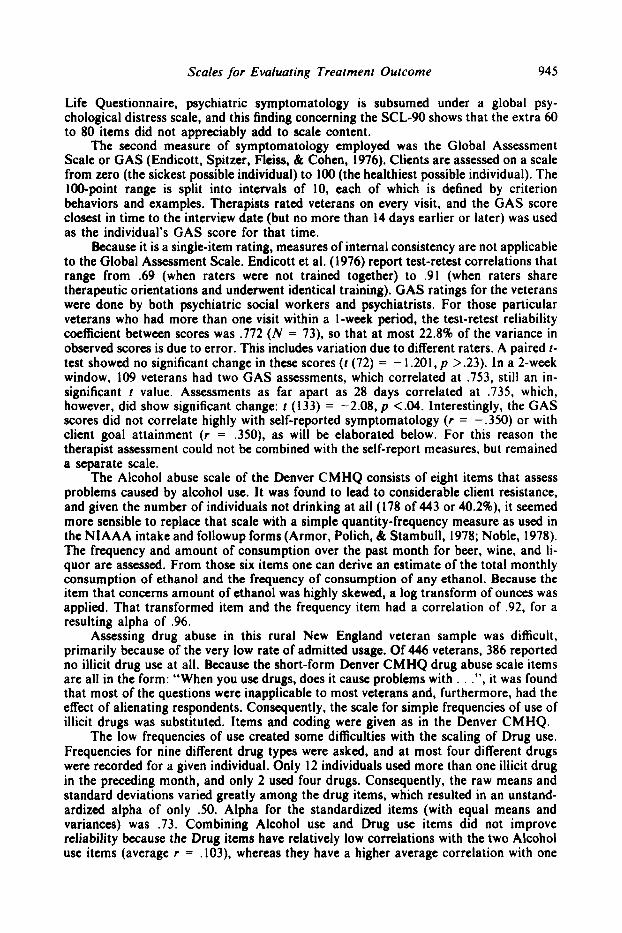
Life Questionnaire, psychiatric symptomatology is subsumed under a global psy- chological distress scale, and this finding concerning the SCL-90 shows that the extra 60 to 80 items did not appreciably add to scale content.
The second measure of symptomatology employed was the Global Assessment Scale or GAS (Endicott, Spitzer, Fleiss, & Cohen, 1976). Clients are assessed on a scale from zero (the sickest possible individual) to 100 (the healthiest possible individual). The IWpoint range is split into intervals of 10, each of which is defined by criterion behaviors and examples. Therapists rated veterans on every visit, and the GAS score closest in time to the interview date (but no more than 14 days earlier or later) was used as the individual’s GAS score for that time.
&cause it is a single-item rating, measures of internal consistency are not applicable to the Global Assessment Scale. Endicott et al. (1976) report test-retest correlations that range from .69 (when raters were not trained together) to .91 (when raters share therapeutic orientations and underwent identical training). GAS ratings for the veterans were done by both psychiatric social workers and psychiatrists. For those particular veterans who had more than one visit within a I-week period, the test-retest reliability coefficient between scores was .772 (N = 73), so that at most 22.8% of the variance in observed scores is due to error. This includes variation due to different raters. A paired 1- test showed no significant change in these scores ( I (72) = - 1.201, p >.23). In a 2-week window, 109 veterans had two GAS assessments, which correlated at .753, still an in- significant r value. Assessments as far apart as 28 days correlated at .735, which, however, did show significant change: t (133) = -2.08, p <.a. Interestingly, the GAS scores did not correlate highly with self-reported symptomatology ( r = -.350) or with client goal attainment ( r = .350), as will be elaborated below. For this reason the therapist assessment could not be combined with the self-report measures, but remained a separate scale.
The Alcohol abuse scale of the Denver CMHQ consists of eight items that assess problems caused by alcohol use. It was found to lead to considerable client resistance, and given the number of individuals not drinking at all (I78 of 443 or 40.2%), it seemed more sensible to replace that scale with a simple quantity-frequency measure as used in the NIAAA intake and followup forms (Armor, Polich, & Stambull, 1978; Noble, 1978). The frequency and amount of consumption over the past month for beer, wine, and li- quor are assessed. From those six items one can derive an estimate of the total monthly consumption of ethanol and the frequency of consumption of any ethanol. Because the item that concerns amount of ethanol was highly skewed, a log transform of ounces was applied. That transformed item and the frequency item had a correlation of .92, for a resulting alpha of .96.
Assessing drug abuse in this rural New England veteran sample was difficult, primarily because of the very low rate of admitted usage. Of 446 veterans, 386 reported no illicit drug use at all. Because the short-form Denver CMHQ drug abuse scale items are all in the form: “When you use drugs, does it cause problems with . . .”, it was found that most of the questions were inapplicable to most veterans and, furthermore, had the effect of alienating respondents. Consequently, the scale for simple frequencies of use of illicit drugs was substituted. Items and coding were given as in the Denver CMHQ.
The low frequencies of use created some difficulties with the scaling of Drug use. Frequencies for nine different drug types were asked, and at most four different drugs were recorded for a given individual. Only 12 individuals used more than one illicit drug in the preceding month, and only 2 used four drugs. Consequently, the raw means and standard deviations varied greatly among the drug items, which resulted in an unstand- ardized alpha of only S O . Alpha for the standardized items (with equal means and variances) was .73. Combining Alcohol use and Drug use items did not improve reliability because the Drug items have relatively low correlations with the two Alcohol use items (average r = .103), whereas they have a higher average correlation with one

946 Journal of Clinical Psychology, November, 1983, Vol. 39, No. 6
another (average r = .405). The combined scale would have an alpha of .61. Hence Drug use and Alcohol use form separate scales.
Client satisfaction was assessed with 12 items that concern travel time to the clinic, waiting time, clinic receptionists, and various traits of the therapist: Listening skills, competence and ability, interest in helping, and likability. All items were answered on a 5-point scale, from “Very Unsatisfied” to “Very satisfied.” Item analykis revealed low frequencies of response in the range from “Very Unsatisfied” to “Unsatisfied,” which resulted in unacceptably high skew in both scale items and the total score. Therefore, items were recoded to range on a 3-point scale from “not satisfied” to “very satisfied.” The internal consistency of the resulting scale was .88.
Items that were expected to correlate with the client satisfaction items, but did not were those that assess client goal attainment, as described by Kiresuk (Kiresuk, 1973; Kiresuk & Sherman, 1968). In the initial interview clients were asked an open-ended question that concerned the problem areas that they hoped mental health treatment would help them resolve. Each problem is defined behaviorally by the client, who is pressed to describe some typical behaviors or behavior changes associated with the problem. Descriptions are recorded verbatim. At subsequent interviews the problem areas and descriptions are read to the veteran, who is asked to rate how he or she feels about that problem now-whether worse, the same, or better than at intake. Answers are given in a range from 1 to 5 .
While some variants of goal attainment scaling have complicated scoring routines, requiring a client assessment of the relative importance of each goal and behaviorally defined gradients of .relative success or failure, in the current sample only 26% of respondents described more than one problem area at intake, and only 15% had as many as three problem areas. For this reason client weighting of the relative importance of goals was superfluous, and for those with more than one goal, a simple average of achievement scores was used instead of a weighted average.
Given the small number of individuals who specified three problems, scale analysis could only include the first two. Those scores had a correlation of only .47, which resulted in an internal consistency of .64. The goal attainment items did not correlate well with other client satisfaction measures. For example, the average correlation of the first goal attainment score with the 12 satisfaction items was only .135, and the correlation between the satisfaction scale and the goal attainment scale was .168. Clearly, respondents were satisfied with services even though they did not attain their treatment goals or rate themselves as appreciably improved in problem areas of concern.
TABLE 3 Intercorrelorion of Outcome Soles
Family Friends Self SCL-90 Global Alcohol Drugs Goals
Friends Self-support SCL-90 Global Assessment Alcohol Drugs Goal Attainment Client Satisfaction
.175*
.017 -.I59* - -.019
.03 I ,087, .047 .165*
- ,104. -
..292* -.261* - .OI2 .255* -.I44 .012 -.132* -.021 - ,114’ -.021 -.160*
.177* .288* -.417*
.169* .035 -.150*
- .loo - .017 .069 - .350* ,044 ,047 -
.I43 .015 .052 .168*
*p <.05. Note.-All scales are from the 3-month follow-up in order to include goals and satisfaction. Negative cor-
relations occur when two scales are coded in reverse direction.

Scales for Evaluating Treatment Outcome 947
Relationships Among Scales Table 3 presents the intercorrelations among scale totals. They are all sufficiently
low to support the claim that the items constitute nine separate scales. Some of the low correlations are surprising, such as that between client-reported distress on the SCL-90 and clinician-rated functional status on the Global Assessment Scale ( r = -.144). Various pairs of scales that were thought to be related had very low correlations, such as Family Involvement and Involvement with Friends ( r = .175), Drug Use and Alcohol Use ( r = .069), or Client Satisfaction and Goal Attainment ( r = .168). It is reassuring to note that scores on dimensions that are clearly different in content do not correlate highly. For example, Self Support does not correlate highly with Goal Attainment ( r = .288) or the Therapist’s Global Assessment ( r = .255). Similarly, Psychological distress as measured on the SCL-90 does not predict Alcohol ( r = -.021) or Drug use ( r = -.160). The highest correlation among scales is that between Goal attainment and the
As a check on the scale composition of the items, principal components factor analysis was performed on scale items. Twelve factors initially were extracted as having eigenvalues greater than one. Varimax rotations were performed with from 4 to 12 fac- tors, and the factor loading patterns examined to find the most easily interpretable fac- tors. Nine factors were selected as providing the most meaningful solution, accounting for 61.9% of the total variance in all items and 94.1% of the variance explained by the full 12-factor solution. Details on the item loadings and factor composition are available from the authors.
The first main result of the factor analysis was that items from different scales generally formed separate factors. The 10 SCL symptom scores all loaded on one factor, as did all items from the Friends, Alcohol use, Drug use, and Goal attainment scales. Three Self Support items that have to do with use of public welfare split from the main Self Support factor to form a minor public dependency dimension, but its eigenvalue was so low and the internal consistency of three items would be so low that it could not form a separate scale. One client satisfaction item that concerned satisfaction with help received for problems loaded on the same factor as the Goal Attainment items; otherwise, all the client satisfaction items loaded on one factor.
The second main finding from the factor analysis was that with just a few excep- tions, every factor was composed of items from just one scale. GAS scores loaded on the same factor as Self Support items. One family item loaded on the Friends factor, and as mentioned above, one Satisfaction item loaded on the Goal Attainment factor. Hence, with few exceptions, items within each scale intercorrelated highly enough to form fac- tors, and correlations across scales were low enough so that each scale formed a separate factor.
SCL-90 ( r = -.417).
T A B L E 4
Interrarer Reliabiliry OJ Scales
Scale N Pcarson R
Family 36 ,895
Friends 35 ,815
Self Support 36 ,958
Alcohol Use 36 ,893 Drug Use 35 I .Ooo
Goal Attainment 22 ,905

948 Journal of Clinical Psychology, November, 1983, Vol. 39. No. 6
Interrater Reliability Table 4 presents the correlations found between scoring of different interviewers for
each of six scales. The Symptom Checklist is not included because it is self-administered, and neither are GAS scores because they are administered by the therapist. Too few 3- month follow-ups were doubly scored to get an adequate sample for assessing Client Satisfaction, so that is also missing from the table. Because Goal attainment was only assessed in follow-ups, its N was smaller than that of the other scales. The six scales shown have excellent interrater reliability. (The perfect correlation for Drug use is probably an artifact of the low rate of positive answers in such a small sample.) The data show high reliability in recording respondent answers and forming scales; note that it does not include any variation in the way different interviewers may ask the questions or in the way that respondents may react to different interviewers.
Validity Studies Because all the items used in the scales derive from previously existing instruments,
validity studies were not planned. However, some results relevant to validity were ob- tained in the process of examining predictors of follow-up status among respondents. The evaluation used follow-up interviews at 3, 9, and 18 months after intake and employed exactly the same outcome items as used at intake. Multivariate regression was used to examine predictors of follow-up status, and the relationships of predictors to different follow-up scores provide some evidence of the validity of the scales. Briefly, the scales are correlated with the sorts of predictors that one would expect, and different scales are associated with different predictors.
Predictor variables were entered in a hierarchical regression in the following order: ( I ) five variables that summarize psychiatric history and amount of past use of services; (2) nine demographic indicators found to affect outcome, such as gross family income, years of education, and number of household family members; (3) three diagnostic variables; (4) five indices of VA status as of intake, such as service connection and receipt of benefits; ( 5 ) the intake score for the given scale and, finally, (6) the amounts of eight kinds of services received between intake and follow-up. Table 5 presents the increments in R squared found at each step (which are ascribed to the given domain) and the final proportion of variance explained for three scales at the 3-month follow-up.
The three scales were clearly sensitive to different predictor domains in the an- ticipated directions. For example, demographic variables explained much more of the variance in Self support than in either of the other scales. Demographics did not explain a significant proportion of variance in the Symptom checklist or Alcohol use scales, in
TABLE 5 Variance in Outcome Explained by Diflerent Domains
Domain Self-Support SCL Alcohol
History Demographics Diagnoses VA Status Intake Services
. 125. ,122. .024
,409. .03 I .065
.oo I .075* ,017
.038* ,027 .oo5 ,117. ,256. ,274.
,009 ,026 ,027
Final R squared ,699. .537* .4 12. ~~ ~ ~
*p <.05. Note .4-month outcomes. N = 374.

Scales for Evaluating Treatment Outcome 949
which one would expect low correlations with demographic variables. VA status in- dicators also made a significant contribution to explaining variance in Self-support, but to neither of the other scales. Of the three, the Self-support scale was the most sensitive to demographic and VA status variables and the least sensitive to psychiatric diagnoses and services received. The Symptom checklist scale was the only one of the three that had significant variance explained by psychiatric diagnoses; in the others diagnosis did not improve prediction of outcome. Finally, the Alcohol use scale measured the most tran- sient state because it was not predicted significantly by any of the background domains of history, demographics, diagnosis, or VA status and was the scale in which intake status made the largest contribution to variance explained.
At best, the evidence in Table 5 is suggestive. It does not establish construct validity for the scales. The model that links the outcome scales to particular indices is not ar- ticulated sufficiently, and one always can doubt the validity of measurement of those in- dices themselves. However, the overall pattern of results suggest that validity findings es- tablished for the scales in other samples can be extended to this one. The factor analysis suggests that the items measure different domains and that the items within a domain correlate well. The multivariate regressions suggest that scales and predictors converge (and diverge) appropriately and that different scales show different patterns of predic- tors.
CONCLUSION Research in the psychometrics of outcome scales is necessarily a piecemeal effort.
Items that correlate well and have high internal consistency in one sample (such as Denver CMHC outpatients) may behave differently in another sample (such as New England veterans). Factors found in an item pool in one group may disappear in another, and new constellations may be apparent. Validity findings may be specific to a sample.
Our approach has been to employ existing scales for which reliability and validity data already exist and to test how well the scales perform in this new sample. This work is not sufficient to establish reliability or validity per se; at best, it can give one confidence that the scales can be used in a new group. It is confirmatory rather than exploratory. But each application to a new sample is a further test for the item pool. If those items measure nine domains, those domains should emerge in a new sample. Internal con- sistency, factor analysis, and correlations with predictors all test that hypothesis. Confidence in an outcome scale can be achieved only when it repeatedly passes such tests.
REFERENCES ARMOR, D.. POLICH, J . M., & STAMBULL, H. 9. Alcoholism and treatment. New York: John Wiley, 1978. BlGeLow, D. A.. BRODSKY. G., STEWART, L.. OLSON. M.. & HOWARD, M. The concept and measurement of
quality of lijC a a dependent wioble in the planning and evaluation of mental health services. Salem: Oregon Mental Health Division. 1980.
CIARLO, J . A., & RelHMAN, J . 'The Denver community mental health qucationnaire: Development of a mul- tidimensional program evaluation instrument. In R. Coumy (Ed.). Program evoluation for mental healrh: Methods. strategies. and participants. New York: Grune & Stratton, 1977.
CLARK, A., & FRIEDMAN. M. J. Factor structure and discriminant validity of the SCL-90 in a veteran psy- chiatric population. Journal of Personality Assessment. 1983, 47, 396-404.
DEROGATIS, L. R., & CLeAru, P. A. Confirmation of the dimensional structure of the SCL-90: A study in construct validation. Journal of Clinical Psychology, 1977, 33. 981-989.
DEROGATIS, L. R., LIPMAN, R. S., & COW, L. The SCL-90: An outpatient psychiatric rating scale-preliminary report. Psychopharmacology Bulletin. 1973, 9. 13-28.
ELLSWORTH. R. Personal Adjustment and Roles Skills Scale Manual. Roanoke, Va.: Institute for Program Evaluation. 1975.
ENDICOTT, J., & Spazer. R. L. What! Another rating scale: The psychiatric evaluation form. Journal of Nervous and Mental Disease. 1912, 154, 88-104.

950 Journal of Clinical Psychology, November, 1983, Vol. 39, No. 6
ENDICOIT, J., SPITZER, R. L., FLEISS, J. L., & COHEN, J. The Global assessment scale: A p r d u r e for measuring overall severity of psychiatric disturbance. Archives o/ General Psychiatry, 1976,33,766-77 I .
GREEN, L. W. Manual for scoring socio-economic status for research on health behavior. Public Health Reports. 1970, 85, 815-827.
HULKA, B. S.. ZYZANSKI, S. J., CASSEL. J. C., & THOMPSON, S. J. Scale for the measurement of attitudes toward physicians and primary medical care. Medical Care, 1970, 8. 429-436.
KIRESUK, T. J. Goal attainment scaling at a county mental health service. Ewluation. 1973, I , 12-18. KIRESUK, T. J., & SHERMAN, R. E. Goal attainment scaling: A general method for evaluating comprehensive
community mental health programs. Community Mental Health Journal, 1968, 1, 443-453. NOBLE, E. P. Alcohol and health: Third special report to the U. S. Congress. (U. S . Department of Health,
Education, and Welfare, National Institute on Alcohol Abuse and Alcoholism, Publication No. ADM 79- 832) Washington: Government Printing Office, 1978.
OVERALL, J. E.. & GORHAM. D. R. The brief psychiatric rating scale. Psychological Reports. 1962,lO. 799- 812.
SCHAINBLAIT, A. H., & HATRY, H. P. Mental health services: What happens to the clients? Washington: Ur- ban Institute, 1979.
SPITZER, R. L., & ENDICOIT, J. An integrated group of forms for automated psychiatric case records. Archives o/ General Psychiatry. 1971, 24, 540-547.
SPITZER, R. L., ENDICOIT, J., FLEISS, J. L., & COHEN, J. The psychiatric status schedule: A technique for evaluating psychopathology and impairment in role functioning. Archives o/General Psychiatry. 1970,23, 41-55.
WEISSMAN, M. M.. & PAYKEL. E. The depressed woman. Chicago: University of Chicago Press, 1974.