Embed Size (px)
Citation preview
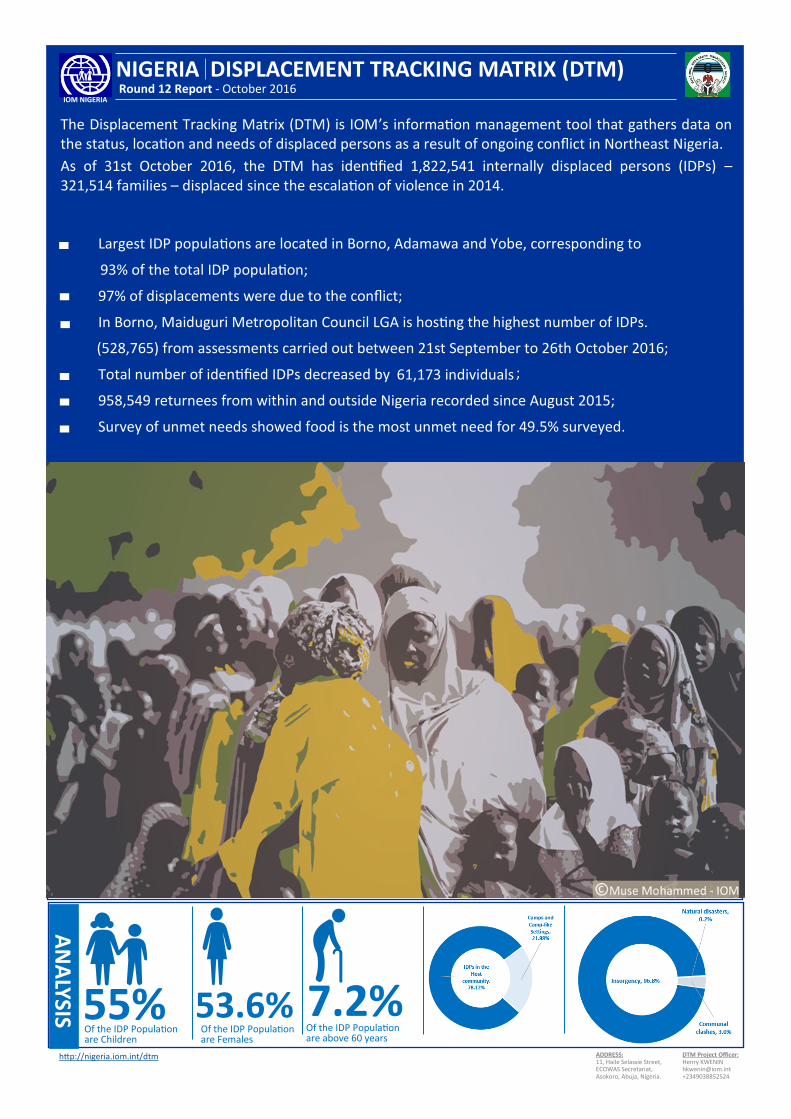
55% 7.2% 53.6%
NIGERIA DISPLACEMENT TRACKING MATRIX (DTM) Round 12 Report - October 2016
IOM NIGERIA
The Displacement Tracking Matrix (DTM) is IOM’ –
321,514 families –
97% of displacements were due to the conflict;
(528,765) from assessments carried out between 21st September to 26th October 2016;
958,549 returnees from within and outside Nigeria recorded since August 2015;
Survey of unmet needs showed food is the most unmet need for 49.5% surveyed.
are Children are Females are above 60 years
SISY
LANA
DTM Project Officer: Henry KWENIN [email protected] +2349038852524
ADDRESS: 11, Haile Selassie Street, ECOWAS Secretariat, Asokoro, Abuja, Nigeria.
1
OVERVIEW
In response to the need for reliable information on internally displaced persons (IDPs) in conflict‐affected parts of Nigeria, the International Organization for Migration (IOM) began implementing its Displacement Tracking Matrix (DTM) programme in July 2014. The DTM supports the Government of Nigeria and other humanitarian response partners, and allows them to assess the needs of IDPs in a systematic way in the field. It also provides a profile of the internally displaced populations. The DTM programme in Nigeria works in close collaboration with the National Emergency Management Agency (NEMA) and State Emergency Management Agencies (SEMAs) to highlight the needs of IDPs in accessible areas. It also gathers reliable information on the caseload of IDPs. The DTM teams include representatives from NEMA, SEMAs, the Nigerian Red Cross and IOM. They gather baseline information at Local Government Area (LGA) and ward‐level and conduct detailed surveys in camps and camp‐like sites. IOM’s pioneering programme is funded by the United States Agency for International Development (USAID) and the European Commission's Humanitarian Aid and Civil Protection Office (ECHO). NEMA also provides financial support.
Key points from DTM Round XII
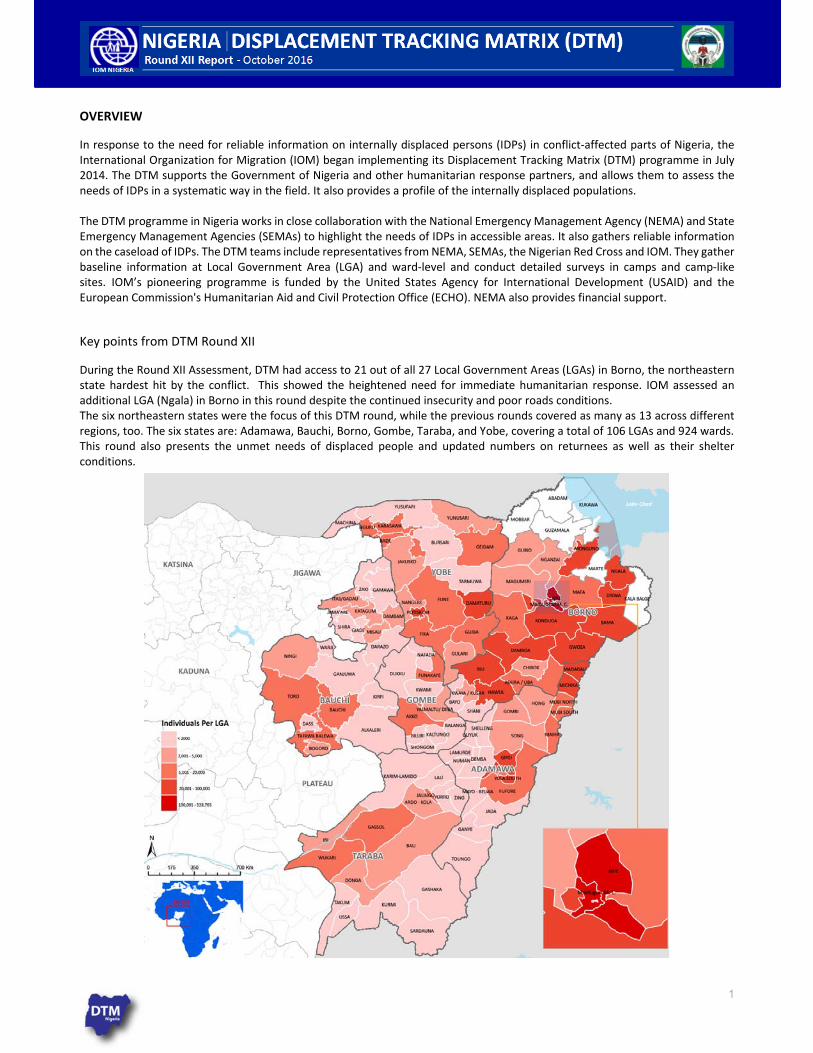
During the Round XII Assessment, DTM had access to 21 out of all 27 Local Government Areas (LGAs) in Borno, the northeastern state hardest hit by the conflict. This showed the heightened need for immediate humanitarian response. IOM assessed an additional LGA (Ngala) in Borno in this round despite the continued insecurity and poor roads conditions. The six northeastern states were the focus of this DTM round, while the previous rounds covered as many as 13 across different regions, too. The six states are: Adamawa, Bauchi, Borno, Gombe, Taraba, and Yobe, covering a total of 106 LGAs and 924 wards. This round also presents the unmet needs of displaced people and updated numbers on returnees as well as their shelter conditions.
2
1. POPULATION PROFILE 1A: LOCATION OF DISPLACEMENT
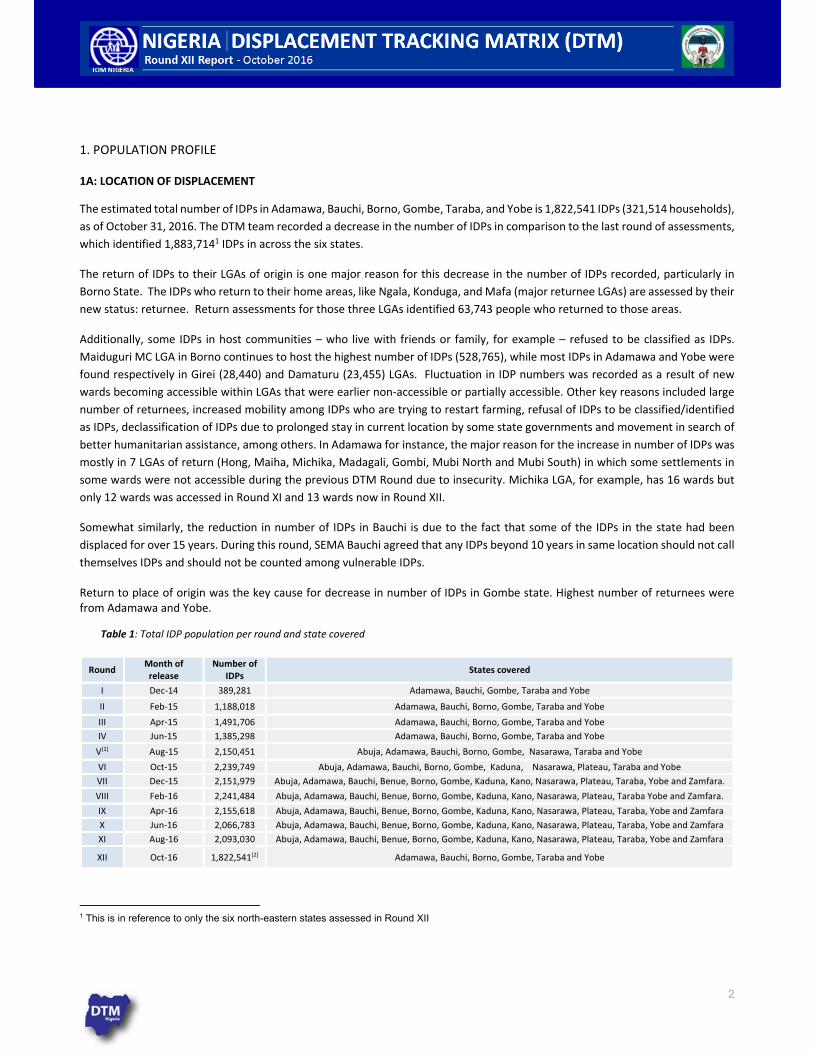
The estimated total number of IDPs in Adamawa, Bauchi, Borno, Gombe, Taraba, and Yobe is 1,822,541 IDPs (321,514 households),
as of October 31, 2016. The DTM team recorded a decrease in the number of IDPs in comparison to the last round of assessments,
which identified 1,883,7141 IDPs in across the six states.
The return of IDPs to their LGAs of origin is one major reason for this decrease in the number of IDPs recorded, particularly in
Borno State. The IDPs who return to their home areas, like Ngala, Konduga, and Mafa (major returnee LGAs) are assessed by their
new status: returnee. Return assessments for those three LGAs identified 63,743 people who returned to those areas.
Additionally, some IDPs in host communities – who live with friends or family, for example – refused to be classified as IDPs.
Maiduguri MC LGA in Borno continues to host the highest number of IDPs (528,765), while most IDPs in Adamawa and Yobe were
found respectively in Girei (28,440) and Damaturu (23,455) LGAs. Fluctuation in IDP numbers was recorded as a result of new
wards becoming accessible within LGAs that were earlier non‐accessible or partially accessible. Other key reasons included large
number of returnees, increased mobility among IDPs who are trying to restart farming, refusal of IDPs to be classified/identified
as IDPs, declassification of IDPs due to prolonged stay in current location by some state governments and movement in search of
better humanitarian assistance, among others. In Adamawa for instance, the major reason for the increase in number of IDPs was
mostly in 7 LGAs of return (Hong, Maiha, Michika, Madagali, Gombi, Mubi North and Mubi South) in which some settlements in
some wards were not accessible during the previous DTM Round due to insecurity. Michika LGA, for example, has 16 wards but
only 12 wards was accessed in Round XI and 13 wards now in Round XII.
Somewhat similarly, the reduction in number of IDPs in Bauchi is due to the fact that some of the IDPs in the state had been
displaced for over 15 years. During this round, SEMA Bauchi agreed that any IDPs beyond 10 years in same location should not call
themselves IDPs and should not be counted among vulnerable IDPs.
Return to place of origin was the key cause for decrease in number of IDPs in Gombe state. Highest number of returnees were from Adamawa and Yobe.
Round Month of release
Number of IDPs
States covered
I Dec‐14 389,281 Adamawa, Bauchi, Gombe, Taraba and Yobe
II Feb‐15 1,188,018 Adamawa, Bauchi, Borno, Gombe, Taraba and Yobe
III Apr‐15 1,491,706 Adamawa, Bauchi, Borno, Gombe, Taraba and Yobe
IV Jun‐15 1,385,298 Adamawa, Bauchi, Borno, Gombe, Taraba and Yobe
V[1] Aug‐15 2,150,451 Abuja, Adamawa, Bauchi, Borno, Gombe, Nasarawa, Taraba and Yobe
VI Oct‐15 2,239,749 Abuja, Adamawa, Bauchi, Borno, Gombe, Kaduna, Nasarawa, Plateau, Taraba and Yobe
VII Dec‐15 2,151,979 Abuja, Adamawa, Bauchi, Benue, Borno, Gombe, Kaduna, Kano, Nasarawa, Plateau, Taraba, Yobe and Zamfara.
VIII Feb‐16 2,241,484 Abuja, Adamawa, Bauchi, Benue, Borno, Gombe, Kaduna, Kano, Nasarawa, Plateau, Taraba Yobe and Zamfara.
IX Apr‐16 2,155,618 Abuja, Adamawa, Bauchi, Benue, Borno, Gombe, Kaduna, Kano, Nasarawa, Plateau, Taraba, Yobe and Zamfara
X Jun‐16 2,066,783 Abuja, Adamawa, Bauchi, Benue, Borno, Gombe, Kaduna, Kano, Nasarawa, Plateau, Taraba, Yobe and Zamfara
XI Aug‐16 2,093,030 Abuja, Adamawa, Bauchi, Benue, Borno, Gombe, Kaduna, Kano, Nasarawa, Plateau, Taraba, Yobe and Zamfara
XII Oct‐16 1,822,541[2] Adamawa, Bauchi, Borno, Gombe, Taraba and Yobe
1 This is in reference to only the six north-eastern states assessed in Round XII
Table 1: Total IDP population per round and state covered

3
In Taraba, the reason for increase was a result of previous communal clashes around Ardo‐Kola. Affected people did not feel secure, resulting in movement. In Yobe, increased access to Gujba and Gulani led to increase in number of IDPs recorded.
Table 2: Fluctuation in numbers
State Round 11 Summary (August
2016) Round 12 Summary (October 2016) Status Difference
ADAMAWA 163,559 170,070 Increment 6,511
BAUCHI 61,717 58,955 Decrement ‐2,762
BORNO 1,446,829 1,392,927 Decrement ‐53,902
GOMBE 28,972 28,296 Decrement ‐676
TARABA 47,195 47,587 Increment 392
YOBE 135,442 124,706 Decrement ‐10,736
Grand Total 1,883,714 1,822,541 Decrement ‐61,173
State Households Individuals Avg HH Size Percentage
ADAMAWA 32,794 170,070 5.19 9.33%
BAUCHI 9,998 58,955 5.90 3.23%
BORNO 245,630 1,392,927 5.67 76.43%
GOMBE 5,020 28,296 5.64 1.55%
TARABA 8,485 47,587 5.61 2.61%
YOBE 19,587 124,706 6.37 6.84%
Grand Total 321,514 1,822,541 5.67 100.00%
Table 3: Average HH Size and percentage of displacement per state

4
Figure 1: Demographic profile of displaced people
1B: DEMOGRAPHIC DATA
In total 81,529 people were interviewed to obtain a detailed age and gender breakdown and vulnerability profile. This sample represents 7% of the identified IDP population. The results show that 53.5% of the IDP population are female and 46.4% are male. Children under 18 constitute 55% of the IDP population and 48% of them are under five years old. In terms of vulnerability, 9% of displaced persons in the sites were lactating mothers, followed by 5% elderly persons, 2.5% pregnant women, 2% single women‐headed households, 1% single male‐headed households and 1.5% orphaned children.
Figure 2: IDP Population by major age groups and sex breakdown
1C: REASONS OF DISPLACEMENT
Figure 3: Reasons for displacement
Most IDPs identified through the DTM assessments were displaced
because of the conflict. 97% of displacements were due to the
conflict, followed by 3% who were displaced due to communal
clashes in the areas assessed. Adamawa, Borno and Yobe states
accounted for majority of people displaced due to the conflict
(1,764,214 IDPs).
Female, 53.6%
Male, 46.4%
0.0%
10.0%
20.0%
30.0%
40.0%
50.0%
ADAMAWA BAUCHI BORNO GOMBE TARABA YOBE
Demographics : Age Breakdown
less than 1 1‐5 6‐17 18‐59 60+
Communal clashes, 3.0%
Insurgency, 96.8%
Natural disasters, 0.2%
5
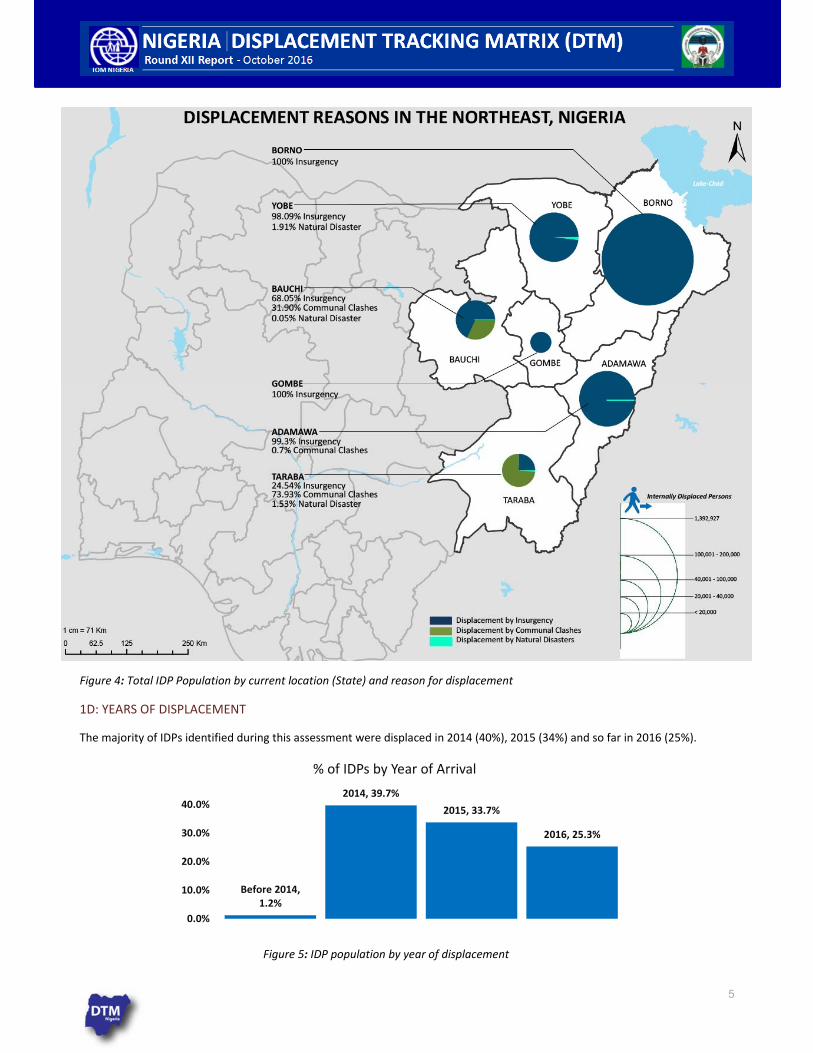
Figure 4: Total IDP Population by current location (State) and reason for displacement
1D: YEARS OF DISPLACEMENT
The majority of IDPs identified during this assessment were displaced in 2014 (40%), 2015 (34%) and so far in 2016 (25%).
Figure 5: IDP population by year of displacement
Before 2014, 1.2%
2014, 39.7%
2015, 33.7%
2016, 25.3%
0.0%
10.0%
20.0%
30.0%
40.0%
% of IDPs by Year of Arrival
6
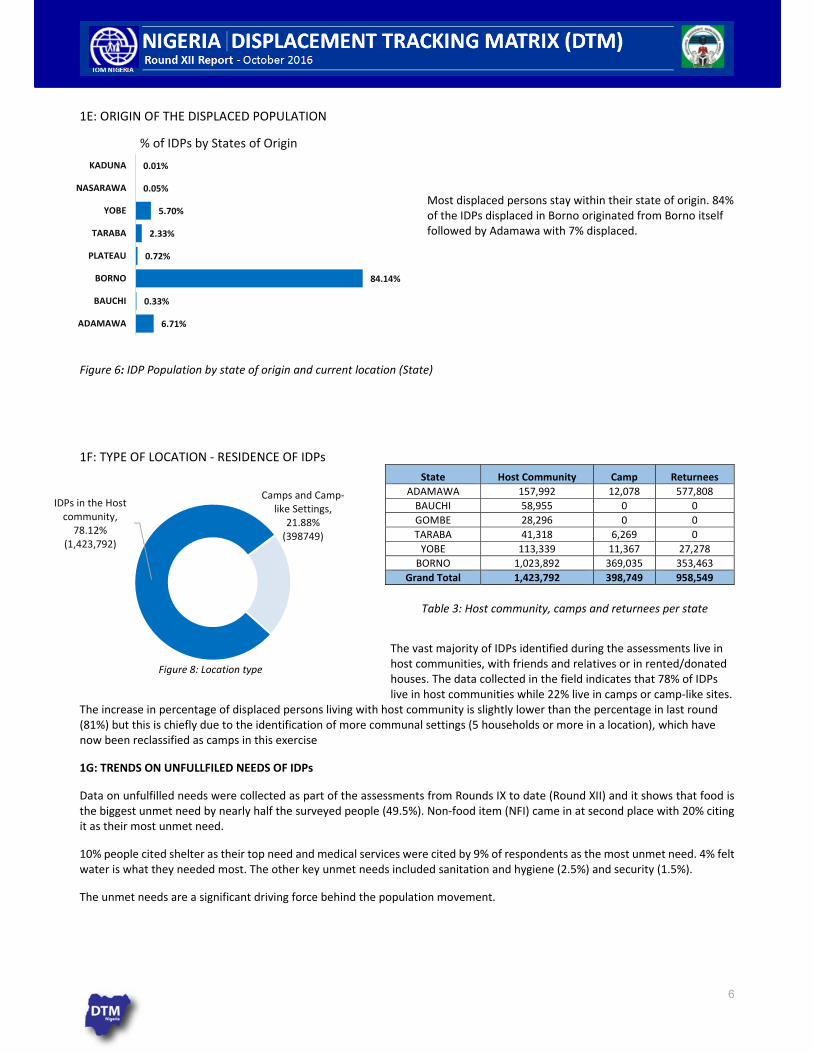
1E: ORIGIN OF THE DISPLACED POPULATION
Most displaced persons stay within their state of origin. 84% of the IDPs displaced in Borno originated from Borno itself followed by Adamawa with 7% displaced.
Figure 6: IDP Population by state of origin and current location (State)
1F: TYPE OF LOCATION ‐ RESIDENCE OF IDPs
The vast majority of IDPs identified during the assessments live in host communities, with friends and relatives or in rented/donated houses. The data collected in the field indicates that 78% of IDPs live in host communities while 22% live in camps or camp‐like sites.
The increase in percentage of displaced persons living with host community is slightly lower than the percentage in last round (81%) but this is chiefly due to the identification of more communal settings (5 households or more in a location), which have now been reclassified as camps in this exercise
1G: TRENDS ON UNFULLFILED NEEDS OF IDPs
Data on unfulfilled needs were collected as part of the assessments from Rounds IX to date (Round XII) and it shows that food is the biggest unmet need by nearly half the surveyed people (49.5%). Non‐food item (NFI) came in at second place with 20% citing it as their most unmet need.
10% people cited shelter as their top need and medical services were cited by 9% of respondents as the most unmet need. 4% felt water is what they needed most. The other key unmet needs included sanitation and hygiene (2.5%) and security (1.5%).
The unmet needs are a significant driving force behind the population movement.
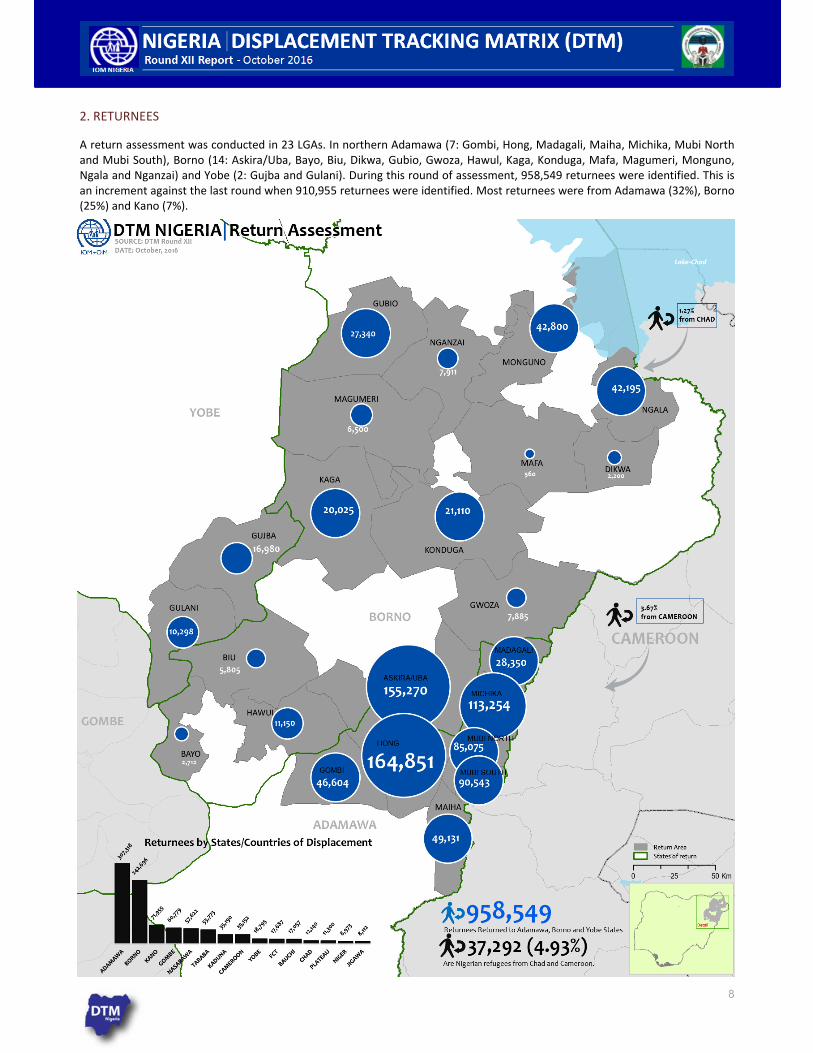
State Host Community Camp Returnees
ADAMAWA 157,992 12,078 577,808
BAUCHI 58,955 0 0
GOMBE 28,296 0 0
TARABA 41,318 6,269 0
YOBE 113,339 11,367 27,278
BORNO 1,023,892 369,035 353,463
Grand Total 1,423,792 398,749 958,549
Figure 8: Location type
Table 3: Host community, camps and returnees per state
6.71%
0.33%
84.14%
0.72%
2.33%
5.70%
0.05%
0.01%
ADAMAWA
BAUCHI
BORNO
PLATEAU
TARABA
YOBE
NASARAWA
KADUNA
% of IDPs by States of Origin
Camps and Camp‐like Settings,
21.88% (398749)
IDPs in the Host community, 78.12%
(1,423,792)
7
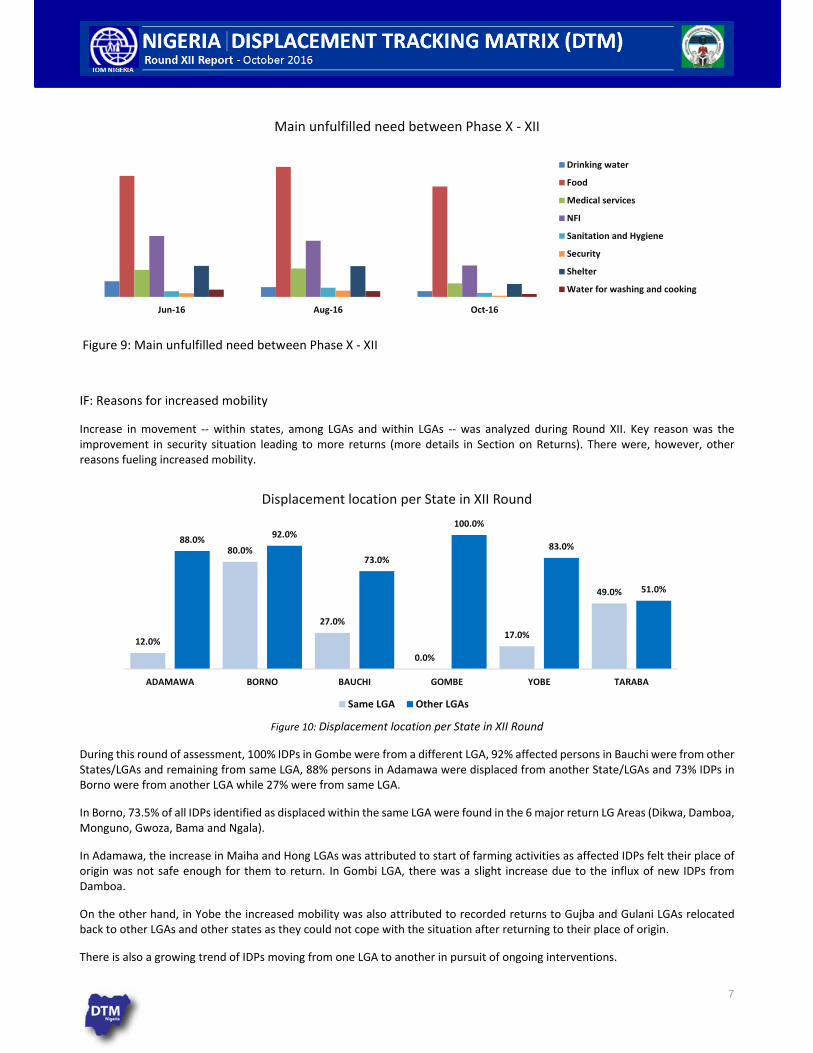
Figure 9: Main unfulfilled need between Phase X ‐ XII
IF: Reasons for increased mobility
Increase in movement ‐‐ within states, among LGAs and within LGAs ‐‐ was analyzed during Round XII. Key reason was the improvement in security situation leading to more returns (more details in Section on Returns). There were, however, other reasons fueling increased mobility.
Figure 10: Displacement location per State in XII Round
During this round of assessment, 100% IDPs in Gombe were from a different LGA, 92% affected persons in Bauchi were from other States/LGAs and remaining from same LGA, 88% persons in Adamawa were displaced from another State/LGAs and 73% IDPs in Borno were from another LGA while 27% were from same LGA.
In Borno, 73.5% of all IDPs identified as displaced within the same LGA were found in the 6 major return LG Areas (Dikwa, Damboa, Monguno, Gwoza, Bama and Ngala).
In Adamawa, the increase in Maiha and Hong LGAs was attributed to start of farming activities as affected IDPs felt their place of origin was not safe enough for them to return. In Gombi LGA, there was a slight increase due to the influx of new IDPs from Damboa.
On the other hand, in Yobe the increased mobility was also attributed to recorded returns to Gujba and Gulani LGAs relocated back to other LGAs and other states as they could not cope with the situation after returning to their place of origin.
There is also a growing trend of IDPs moving from one LGA to another in pursuit of ongoing interventions.
Jun‐16 Aug‐16 Oct‐16
Main unfulfilled need between Phase X ‐ XII
Drinking water
Food
Medical services
NFI
Sanitation and Hygiene
Security
Shelter
Water for washing and cooking
12.0%
80.0%
27.0%
0.0%
17.0%
49.0%
88.0%92.0%
73.0%
100.0%
83.0%
51.0%
ADAMAWA BORNO BAUCHI GOMBE YOBE TARABA
Displacement location per State in XII Round
Same LGA Other LGAs
8
2. RETURNEES
A return assessment was conducted in 23 LGAs. In northern Adamawa (7: Gombi, Hong, Madagali, Maiha, Michika, Mubi North and Mubi South), Borno (14: Askira/Uba, Bayo, Biu, Dikwa, Gubio, Gwoza, Hawul, Kaga, Konduga, Mafa, Magumeri, Monguno, Ngala and Nganzai) and Yobe (2: Gujba and Gulani). During this round of assessment, 958,549 returnees were identified. This is an increment against the last round when 910,955 returnees were identified. Most returnees were from Adamawa (32%), Borno (25%) and Kano (7%).
9
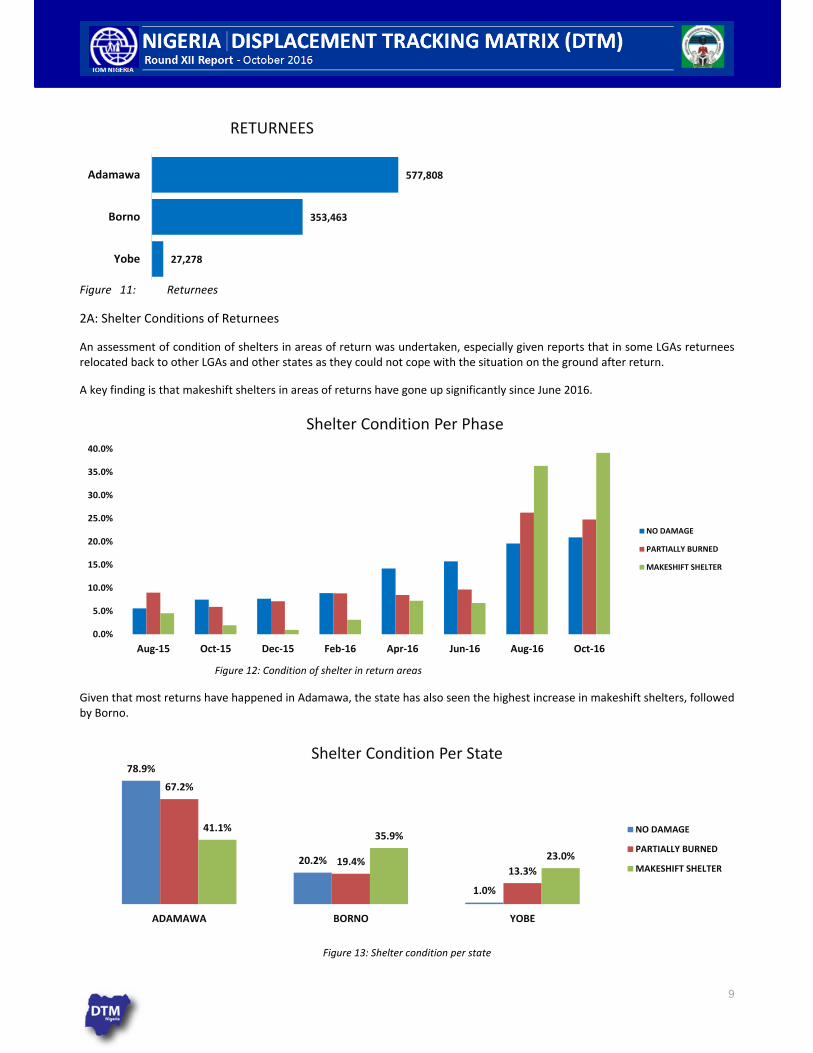
Figure 11: Returnees
2A: Shelter Conditions of Returnees
An assessment of condition of shelters in areas of return was undertaken, especially given reports that in some LGAs returnees relocated back to other LGAs and other states as they could not cope with the situation on the ground after return.
A key finding is that makeshift shelters in areas of returns have gone up significantly since June 2016.
Figure 12: Condition of shelter in return areas
Given that most returns have happened in Adamawa, the state has also seen the highest increase in makeshift shelters, followed by Borno.
Figure 13: Shelter condition per state
78.9%
20.2%
1.0%
67.2%
19.4%13.3%
41.1%35.9%
23.0%
ADAMAWA BORNO YOBE
Shelter Condition Per State
NO DAMAGE
PARTIALLY BURNED
MAKESHIFT SHELTER
27,278
353,463
577,808
Yobe
Borno
Adamawa
RETURNEES
0.0%
5.0%
10.0%
15.0%
20.0%
25.0%
30.0%
35.0%
40.0%
Aug‐15 Oct‐15 Dec‐15 Feb‐16 Apr‐16 Jun‐16 Aug‐16 Oct‐16
Shelter Condition Per Phase
NO DAMAGE
PARTIALLY BURNED
MAKESHIFT SHELTER

10
3 SITES ASSESSMENT
3.1. A: LOCATION AND NUMBER OF IDPs IN 161 SITES
In comparison with the last round, more camp and camp‐like sites (161) were visited during this round of assessment in four states of Adamawa, Borno, Taraba and Yobe as compared to 155 sites that were visited during the last round. Highest number of camps were identified in Borno (122), followed by Adamawa (22) and Taraba (5) with 398,749 individuals or 74,915 households. The sites assessed during this exercise have been classified in three categories:
Camp: open‐air settlements, usually made‐up of tents, where IDPs find accommodation;
Collective center: pre‐existing buildings and structures used for collective and communal settlements of the displaced population;
Transitional center: centers which provide short term/temporary accommodation for the displaced population.
The majority of sites are categorized as collective settlements (139), an increase since last round when the figure was 118 sites, and of which most are self‐made tents (36 sites), Government buildings (32 sites) and schools (30 sites).
Most of the sites were classified as spontaneous (155), followed by only 5 that were planned and one that was pre‐identified.
Site type Number Households Number of
Percentage of individuals Of sites (HH) individuals
Camp 20 11,564 48,777 12.20%
Collective Settlement 139 63,088 348,528 87.40%
Transitional Centre 2 263 1,444 0.40%
Total 161 74,915 398,749 100%
Figure 14: Number of sites ‐ State
11
3.1. B: SECTOR ANALYSIS
SHELTER
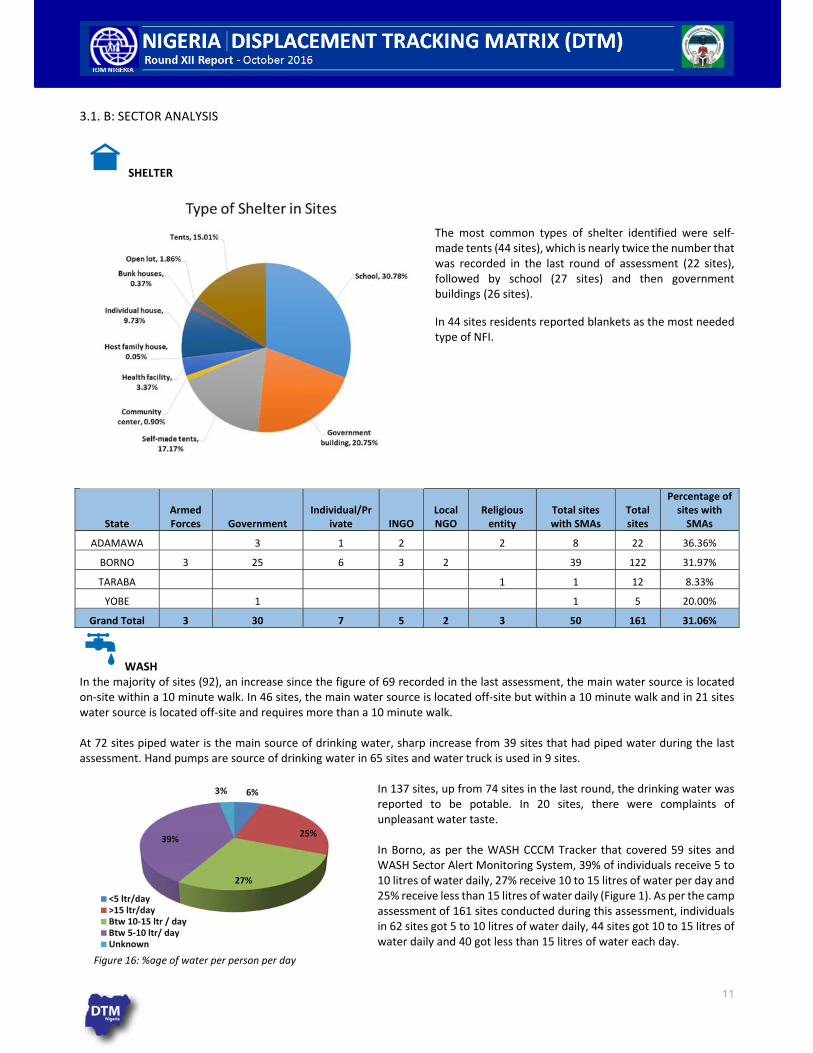
The most common types of shelter identified were self‐made tents (44 sites), which is nearly twice the number that was recorded in the last round of assessment (22 sites), followed by school (27 sites) and then government buildings (26 sites).
In 44 sites residents reported blankets as the most needed type of NFI.
State Armed Forces Government
Individual/Private INGO
Local NGO
Religious entity
Total sites with SMAs
Total sites
Percentage of sites with SMAs
ADAMAWA 3 1 2 2 8 22 36.36%
BORNO 3 25 6 3 2 39 122 31.97%
TARABA 1 1 12 8.33%
YOBE 1 1 5 20.00%
Grand Total 3 30 7 5 2 3 50 161 31.06%
WASH In the majority of sites (92), an increase since the figure of 69 recorded in the last assessment, the main water source is located on‐site within a 10 minute walk. In 46 sites, the main water source is located off‐site but within a 10 minute walk and in 21 sites water source is located off‐site and requires more than a 10 minute walk. At 72 sites piped water is the main source of drinking water, sharp increase from 39 sites that had piped water during the last assessment. Hand pumps are source of drinking water in 65 sites and water truck is used in 9 sites.
In 137 sites, up from 74 sites in the last round, the drinking water was reported to be potable. In 20 sites, there were complaints of unpleasant water taste. In Borno, as per the WASH CCCM Tracker that covered 59 sites and WASH Sector Alert Monitoring System, 39% of individuals receive 5 to 10 litres of water daily, 27% receive 10 to 15 litres of water per day and 25% receive less than 15 litres of water daily (Figure 1). As per the camp assessment of 161 sites conducted during this assessment, individuals in 62 sites got 5 to 10 litres of water daily, 44 sites got 10 to 15 litres of water daily and 40 got less than 15 litres of water each day.
6%
25%
27%
39%
3%
<5 ltr/day>15 ltr/dayBtw 10‐15 ltr / dayBtw 5‐10 ltr/ dayUnknown
Figure 16: %age of water per person per day
12
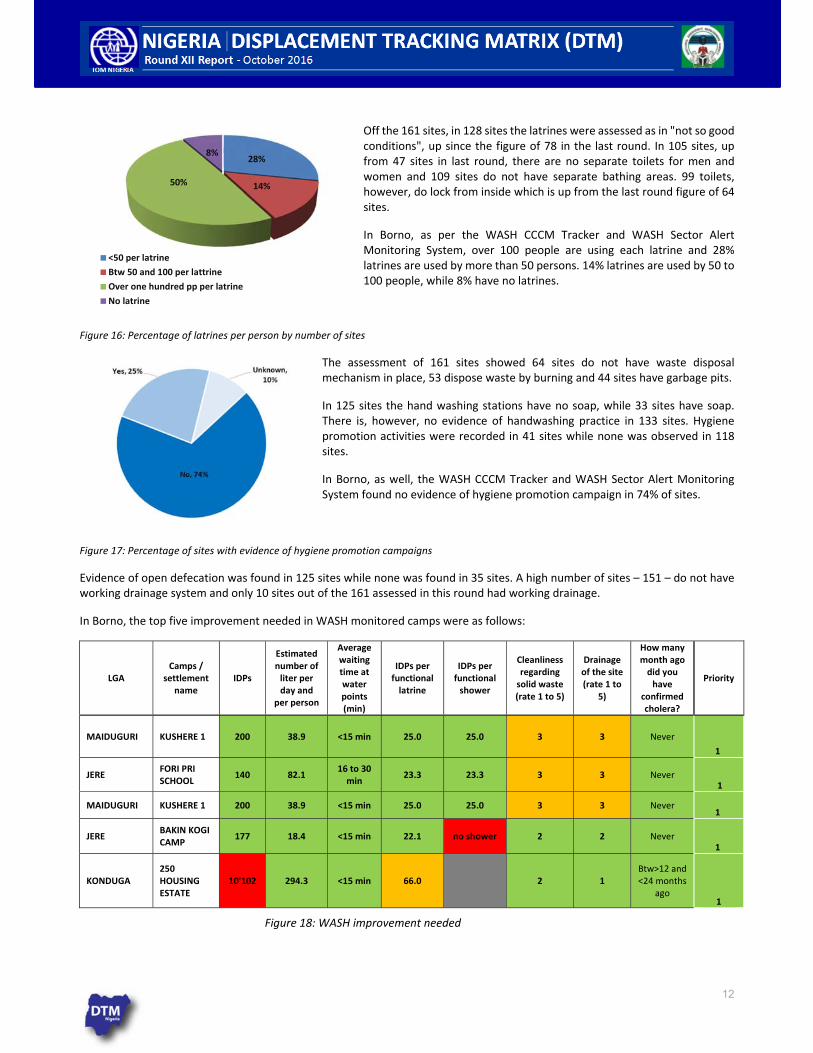
Off the 161 sites, in 128 sites the latrines were assessed as in "not so good conditions", up since the figure of 78 in the last round. In 105 sites, up from 47 sites in last round, there are no separate toilets for men and women and 109 sites do not have separate bathing areas. 99 toilets, however, do lock from inside which is up from the last round figure of 64 sites.
In Borno, as per the WASH CCCM Tracker and WASH Sector Alert Monitoring System, over 100 people are using each latrine and 28% latrines are used by more than 50 persons. 14% latrines are used by 50 to 100 people, while 8% have no latrines.
Figure 16: Percentage of latrines per person by number of sites
The assessment of 161 sites showed 64 sites do not have waste disposal mechanism in place, 53 dispose waste by burning and 44 sites have garbage pits.
In 125 sites the hand washing stations have no soap, while 33 sites have soap. There is, however, no evidence of handwashing practice in 133 sites. Hygiene promotion activities were recorded in 41 sites while none was observed in 118 sites.
In Borno, as well, the WASH CCCM Tracker and WASH Sector Alert Monitoring System found no evidence of hygiene promotion campaign in 74% of sites.
Figure 17: Percentage of sites with evidence of hygiene promotion campaigns
Evidence of open defecation was found in 125 sites while none was found in 35 sites. A high number of sites – 151 – do not have working drainage system and only 10 sites out of the 161 assessed in this round had working drainage.
In Borno, the top five improvement needed in WASH monitored camps were as follows:
LGA Camps /
settlement name
IDPs
Estimated number of liter per day and
per person
Average waiting time at water points (min)
IDPs per functional latrine
IDPs per functional shower
Cleanliness regarding solid waste (rate 1 to 5)
Drainage of the site (rate 1 to
5)
How many month ago did you have
confirmed cholera?
Priority
MAIDUGURI KUSHERE 1 200 38.9 <15 min 25.0 25.0 3 3 Never
1
JERE FORI PRI SCHOOL
140 82.1 16 to 30 min
23.3 23.3 3 3 Never 1
MAIDUGURI KUSHERE 1 200 38.9 <15 min 25.0 25.0 3 3 Never 1
JERE BAKIN KOGI CAMP
177 18.4 <15 min 22.1 no shower 2 2 Never 1
KONDUGA 250 HOUSING ESTATE
10'102 294.3 <15 min 66.0 2 1 Btw>12 and <24 months
ago 1
Figure 18: WASH improvement needed
28%
14%50%
8%
<50 per latrine
Btw 50 and 100 per lattrine
Over one hundred pp per latrine
No latrine
13
FOOD AND NUTRITION
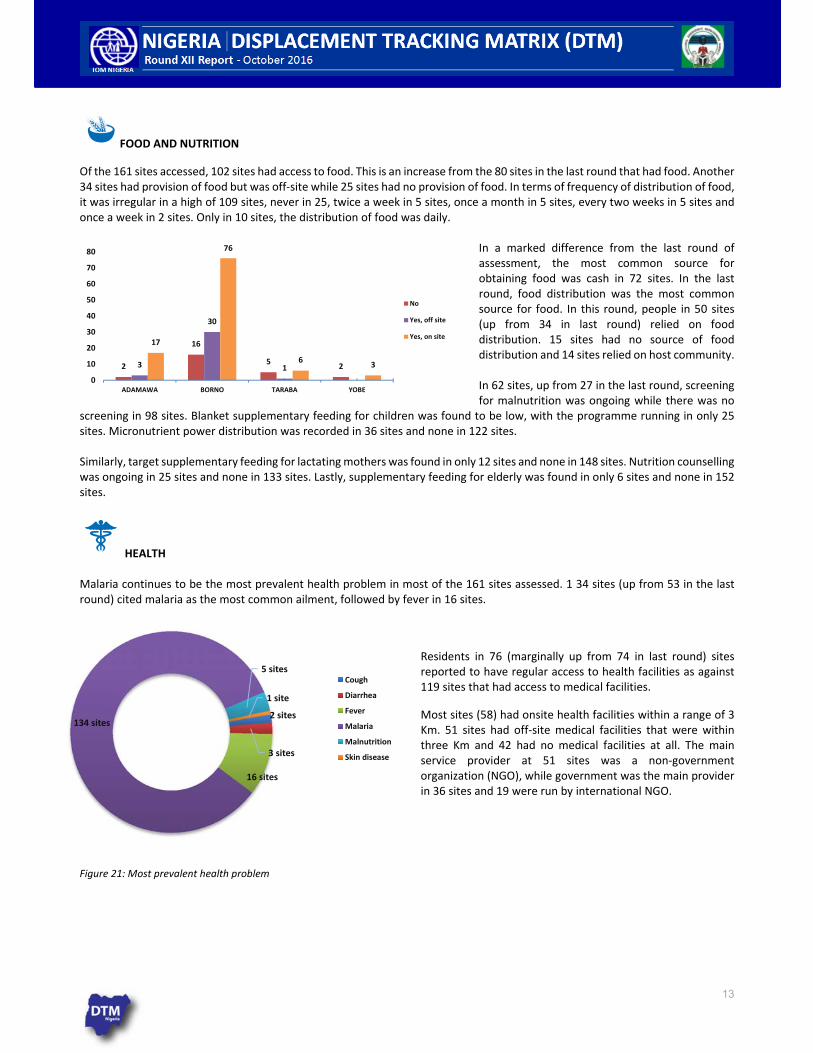
Of the 161 sites accessed, 102 sites had access to food. This is an increase from the 80 sites in the last round that had food. Another 34 sites had provision of food but was off‐site while 25 sites had no provision of food. In terms of frequency of distribution of food, it was irregular in a high of 109 sites, never in 25, twice a week in 5 sites, once a month in 5 sites, every two weeks in 5 sites and once a week in 2 sites. Only in 10 sites, the distribution of food was daily.
In a marked difference from the last round of assessment, the most common source for obtaining food was cash in 72 sites. In the last round, food distribution was the most common source for food. In this round, people in 50 sites (up from 34 in last round) relied on food distribution. 15 sites had no source of food distribution and 14 sites relied on host community. In 62 sites, up from 27 in the last round, screening for malnutrition was ongoing while there was no
screening in 98 sites. Blanket supplementary feeding for children was found to be low, with the programme running in only 25 sites. Micronutrient power distribution was recorded in 36 sites and none in 122 sites. Similarly, target supplementary feeding for lactating mothers was found in only 12 sites and none in 148 sites. Nutrition counselling was ongoing in 25 sites and none in 133 sites. Lastly, supplementary feeding for elderly was found in only 6 sites and none in 152 sites.
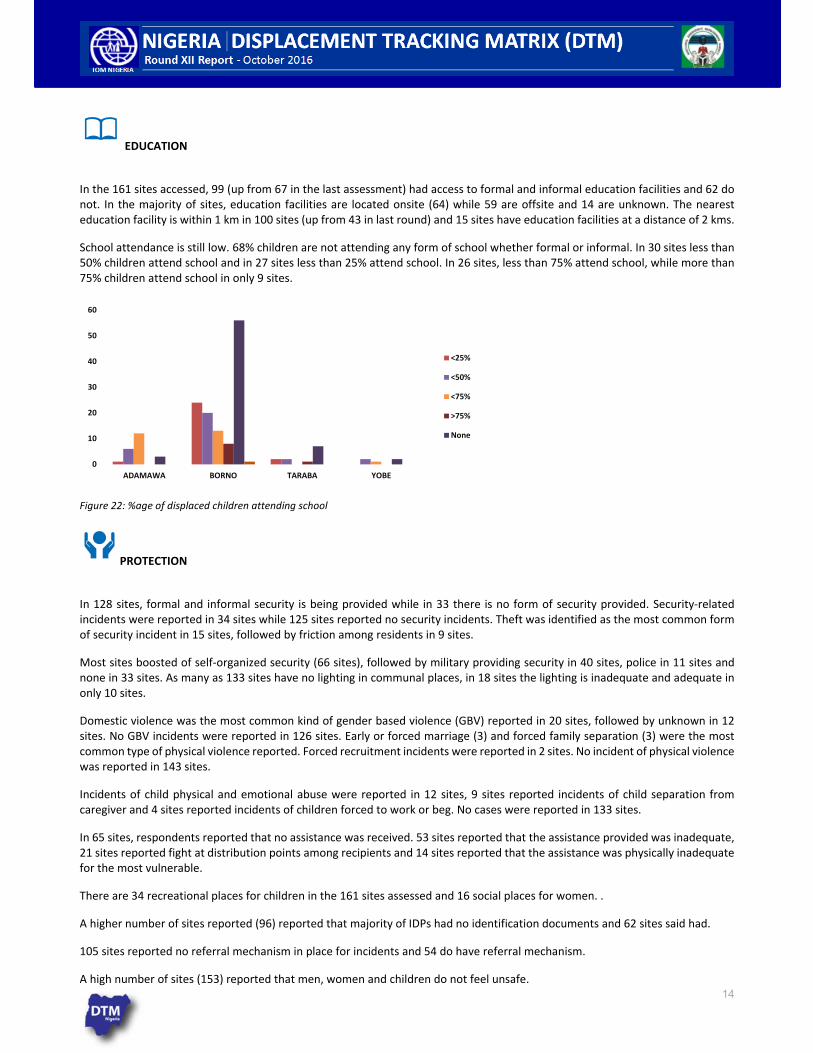
HEALTH Malaria continues to be the most prevalent health problem in most of the 161 sites assessed. 1 34 sites (up from 53 in the last round) cited malaria as the most common ailment, followed by fever in 16 sites.
Residents in 76 (marginally up from 74 in last round) sites reported to have regular access to health facilities as against 119 sites that had access to medical facilities.
Most sites (58) had onsite health facilities within a range of 3 Km. 51 sites had off‐site medical facilities that were within three Km and 42 had no medical facilities at all. The main service provider at 51 sites was a non‐government organization (NGO), while government was the main provider in 36 sites and 19 were run by international NGO.
Figure 21: Most prevalent health problem
2
16
523
30
1
17
76
63
0
10
20
30
40
50
60
70
80
ADAMAWA BORNO TARABA YOBE
No
Yes, off site
Yes, on site
2 sites
3 sites
16 sites
134 sites
5 sites
1 site
Cough
Diarrhea
Fever
Malaria
Malnutrition
Skin disease
14
EDUCATION
In the 161 sites accessed, 99 (up from 67 in the last assessment) had access to formal and informal education facilities and 62 do not. In the majority of sites, education facilities are located onsite (64) while 59 are offsite and 14 are unknown. The nearest education facility is within 1 km in 100 sites (up from 43 in last round) and 15 sites have education facilities at a distance of 2 kms.
School attendance is still low. 68% children are not attending any form of school whether formal or informal. In 30 sites less than 50% children attend school and in 27 sites less than 25% attend school. In 26 sites, less than 75% attend school, while more than 75% children attend school in only 9 sites.
Figure 22: %age of displaced children attending school
PROTECTION
In 128 sites, formal and informal security is being provided while in 33 there is no form of security provided. Security‐related incidents were reported in 34 sites while 125 sites reported no security incidents. Theft was identified as the most common form of security incident in 15 sites, followed by friction among residents in 9 sites.
Most sites boosted of self‐organized security (66 sites), followed by military providing security in 40 sites, police in 11 sites and none in 33 sites. As many as 133 sites have no lighting in communal places, in 18 sites the lighting is inadequate and adequate in only 10 sites.
Domestic violence was the most common kind of gender based violence (GBV) reported in 20 sites, followed by unknown in 12 sites. No GBV incidents were reported in 126 sites. Early or forced marriage (3) and forced family separation (3) were the most common type of physical violence reported. Forced recruitment incidents were reported in 2 sites. No incident of physical violence was reported in 143 sites.
Incidents of child physical and emotional abuse were reported in 12 sites, 9 sites reported incidents of child separation from caregiver and 4 sites reported incidents of children forced to work or beg. No cases were reported in 133 sites.
In 65 sites, respondents reported that no assistance was received. 53 sites reported that the assistance provided was inadequate, 21 sites reported fight at distribution points among recipients and 14 sites reported that the assistance was physically inadequate for the most vulnerable.
There are 34 recreational places for children in the 161 sites assessed and 16 social places for women. .
A higher number of sites reported (96) reported that majority of IDPs had no identification documents and 62 sites said had.
105 sites reported no referral mechanism in place for incidents and 54 do have referral mechanism.
A high number of sites (153) reported that men, women and children do not feel unsafe.
0
10
20
30
40
50
60
ADAMAWA BORNO TARABA YOBE
<25%
<50%
<75%
>75%
None
15
Overall, all sites reported well to excellent relationships between IDPs and only 4 sites described the relationship between IDPs and host community as poor.
Only 16 sites reported availability of transport facilities, and most of these were for Niger (15).
COMMUNICATION
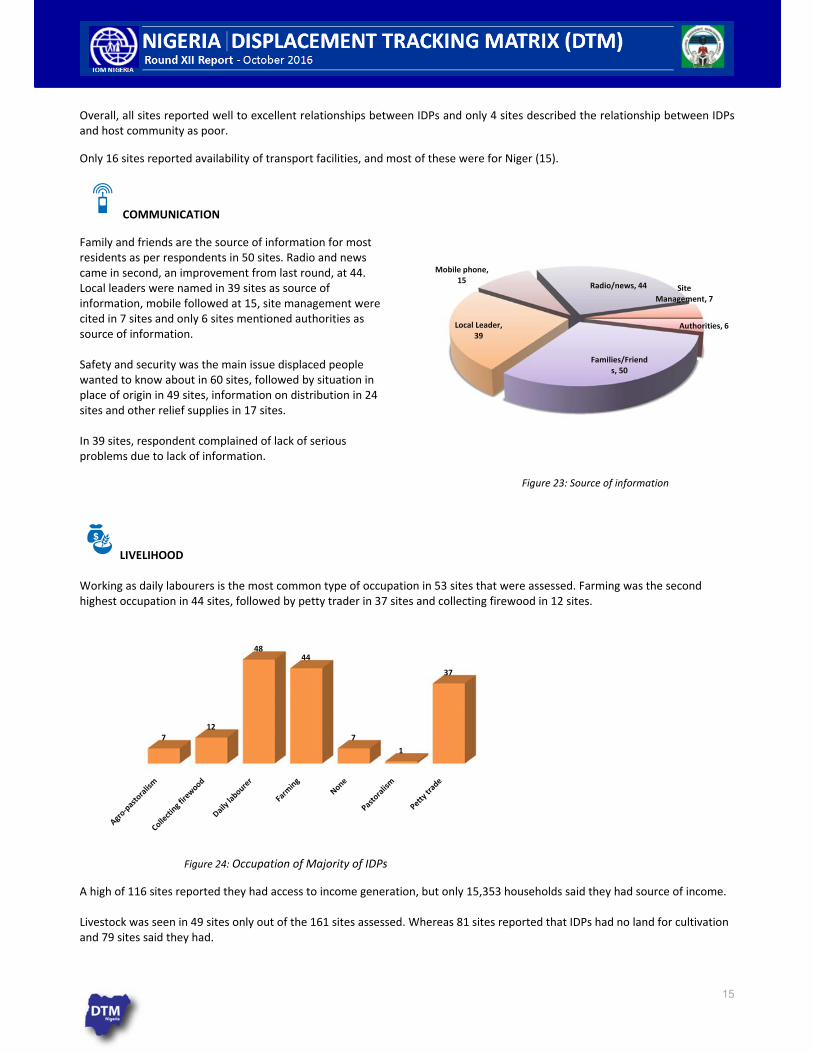
Family and friends are the source of information for most residents as per respondents in 50 sites. Radio and news came in second, an improvement from last round, at 44. Local leaders were named in 39 sites as source of information, mobile followed at 15, site management were cited in 7 sites and only 6 sites mentioned authorities as source of information. Safety and security was the main issue displaced people wanted to know about in 60 sites, followed by situation in place of origin in 49 sites, information on distribution in 24 sites and other relief supplies in 17 sites. In 39 sites, respondent complained of lack of serious problems due to lack of information.
Figure 23: Source of information
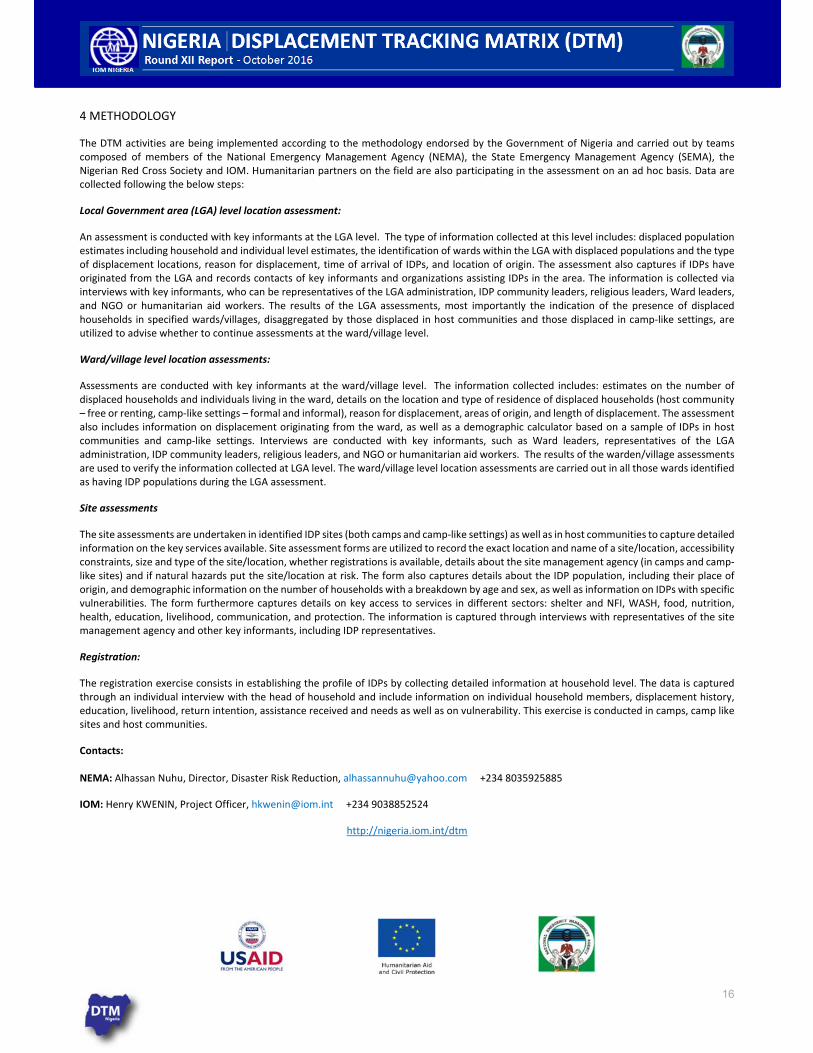
LIVELIHOOD Working as daily labourers is the most common type of occupation in 53 sites that were assessed. Farming was the second highest occupation in 44 sites, followed by petty trader in 37 sites and collecting firewood in 12 sites.
Figure 24: Occupation of Majority of IDPs
A high of 116 sites reported they had access to income generation, but only 15,353 households said they had source of income. Livestock was seen in 49 sites only out of the 161 sites assessed. Whereas 81 sites reported that IDPs had no land for cultivation and 79 sites said they had.
712
4844
7
1
37
Authorities, 6
Families/Friends, 50
Local Leader, 39
Mobile phone, 15
Radio/news, 44 Site Management, 7
16
4 METHODOLOGY
The DTM activities are being implemented according to the methodology endorsed by the Government of Nigeria and carried out by teams composed of members of the National Emergency Management Agency (NEMA), the State Emergency Management Agency (SEMA), the Nigerian Red Cross Society and IOM. Humanitarian partners on the field are also participating in the assessment on an ad hoc basis. Data are collected following the below steps:
Local Government area (LGA) level location assessment:
An assessment is conducted with key informants at the LGA level. The type of information collected at this level includes: displaced population estimates including household and individual level estimates, the identification of wards within the LGA with displaced populations and the type of displacement locations, reason for displacement, time of arrival of IDPs, and location of origin. The assessment also captures if IDPs have originated from the LGA and records contacts of key informants and organizations assisting IDPs in the area. The information is collected via interviews with key informants, who can be representatives of the LGA administration, IDP community leaders, religious leaders, Ward leaders, and NGO or humanitarian aid workers. The results of the LGA assessments, most importantly the indication of the presence of displaced households in specified wards/villages, disaggregated by those displaced in host communities and those displaced in camp‐like settings, are utilized to advise whether to continue assessments at the ward/village level.
Ward/village level location assessments:
Assessments are conducted with key informants at the ward/village level. The information collected includes: estimates on the number of displaced households and individuals living in the ward, details on the location and type of residence of displaced households (host community – free or renting, camp‐like settings – formal and informal), reason for displacement, areas of origin, and length of displacement. The assessment also includes information on displacement originating from the ward, as well as a demographic calculator based on a sample of IDPs in host communities and camp‐like settings. Interviews are conducted with key informants, such as Ward leaders, representatives of the LGA administration, IDP community leaders, religious leaders, and NGO or humanitarian aid workers. The results of the warden/village assessments are used to verify the information collected at LGA level. The ward/village level location assessments are carried out in all those wards identified as having IDP populations during the LGA assessment.
Site assessments
The site assessments are undertaken in identified IDP sites (both camps and camp‐like settings) as well as in host communities to capture detailed information on the key services available. Site assessment forms are utilized to record the exact location and name of a site/location, accessibility constraints, size and type of the site/location, whether registrations is available, details about the site management agency (in camps and camp‐like sites) and if natural hazards put the site/location at risk. The form also captures details about the IDP population, including their place of origin, and demographic information on the number of households with a breakdown by age and sex, as well as information on IDPs with specific vulnerabilities. The form furthermore captures details on key access to services in different sectors: shelter and NFI, WASH, food, nutrition, health, education, livelihood, communication, and protection. The information is captured through interviews with representatives of the site management agency and other key informants, including IDP representatives.
Registration:
The registration exercise consists in establishing the profile of IDPs by collecting detailed information at household level. The data is captured through an individual interview with the head of household and include information on individual household members, displacement history, education, livelihood, return intention, assistance received and needs as well as on vulnerability. This exercise is conducted in camps, camp like sites and host communities.
Contacts: NEMA: Alhassan Nuhu, Director, Disaster Risk Reduction, [email protected] +234 8035925885
IOM: Henry KWENIN, Project Officer, [email protected] +234 9038852524
http://nigeria.iom.int/dtm