Embed Size (px)
Citation preview

8/8/2019 Nifty 50 Reports for the Week (20th - 24th December - 2010)
http://slidepdf.com/reader/full/nifty-50-reports-for-the-week-20th-24th-december-2010 1/52 w w w . c a p i t a l v i a . c
o m
WEEKLY
G L O B A L R E S E A R C H L T D .
WEEKLY
STOCKS REPORTS20th Dec - 25th Dec 2010

8/8/2019 Nifty 50 Reports for the Week (20th - 24th December - 2010)
http://slidepdf.com/reader/full/nifty-50-reports-for-the-week-20th-24th-december-2010 2/52
Technical Picture
Figure: 1 : Nifty50 Graph
WEEKLY
20th Dec to 25th Dec 2010
www.capitalvia.com
R E S E A R C H
2
TECHNICAL OVERVIEW
ACC W E E K A H E A D
Weekly Pivots
A C C
The stock consolidated throughout this week. One could go for buy on dips for this stock. It
faces next resistance at 1103; crossing of this level may take the stock further up. RESISTANCE 1103
SUPPORT 968
STOCK R2 R1 PP S1 S2
ACC 1104.93 1090.07 1065.03 1050.17 1025.13

8/8/2019 Nifty 50 Reports for the Week (20th - 24th December - 2010)
http://slidepdf.com/reader/full/nifty-50-reports-for-the-week-20th-24th-december-2010 3/52
Technical Picture
Figure: 2 : Nifty50 Graph
WEEKLY
20th Dec to 25th Dec 2010
www.capitalvia.com
R E S E A R C H
3
TECHNICAL OVERVIEW
AMBUJA CEMENT W E E K A H E A D
Weekly Pivots
A M B H U J A
C E M E N T
The stock is consolidating from last many trading sessions. It now faces resistance at 145;
crossing of this level may take the stock further up till the levels of 148-150 in near run. One
could adopt buy on dip strategy in this stock.
RESISTANCE 145
SUPPORT 127
STOCK R2 R1 PP S1 S2
AMBUJACEM 142.58 140.57 136.93 134.92 131.28

8/8/2019 Nifty 50 Reports for the Week (20th - 24th December - 2010)
http://slidepdf.com/reader/full/nifty-50-reports-for-the-week-20th-24th-december-2010 4/52
Technical Picture
Figure: 3 : Nifty50 Graph
WEEKLY
20th Dec to 25th Dec 2010
www.capitalvia.com
R E S E A R C H
4
TECHNICAL OVERVIEW
AXIS W E E K A H E A D
Weekly Pivots
A X I S
The stock had an up rally in today's trading session and gained up to 6.25%. it now faces
resistance at 1345, crossing of this level may take up the stock till the levels of 1385-1390 in
coming trading sessions while it has support at 1215.
RESISTANCE 1385
SUPPORT 1215
STOCK R2 R1 PP S1 S2
AXISBANK 1339.32 1324.33 1304.72 1289.73 1270.12

8/8/2019 Nifty 50 Reports for the Week (20th - 24th December - 2010)
http://slidepdf.com/reader/full/nifty-50-reports-for-the-week-20th-24th-december-2010 5/52
Technical Picture
Figure: 4 : Nifty50 Graph
WEEKLY
20th Dec to 25th Dec 2010
www.capitalvia.com
R E S E A R C H
5
TECHNICAL OVERVIEW
BAJAJ AUTO W E E K A H E A D
Weekly Pivots
B A J A J A U T O
The stock moved with negative sentiments in today's trading session. It now has support at
1427, breach of this level may take the stock further down till the levels of 1410-1400 in
coming trading sessions else it may also bounce back from lower support levels. One could
go for sell on rise strategy in this stock.
RESISTANCE 1515
SUPPORT 1427
STOCK R2 R1 PP S1 S2
BAJAJ-AUTO 1498.12 1476.23 1453.12 1431.23 1408.12

8/8/2019 Nifty 50 Reports for the Week (20th - 24th December - 2010)
http://slidepdf.com/reader/full/nifty-50-reports-for-the-week-20th-24th-december-2010 6/52
Technical Picture
Figure: 5 : Nifty50 Graph
WEEKLY
20th Dec to 25th Dec 2010
www.capitalvia.com
R E S E A R C H
6
TECHNICAL OVERVIEW
BHEL W E E K A H E A D
Weekly Pivots
B H E L
The stock had either side movement in this week. One could go for buy on dips strategy as it
is expected to continue holding bullish trend until it breaches the level of 2140 in downside. RESISTANCE 2380
SUPPORT 2140
STOCK R2 R1 PP S1 S2
BHEL 2381.53 2345.22 2292.68 2256.37 2203.83

8/8/2019 Nifty 50 Reports for the Week (20th - 24th December - 2010)
http://slidepdf.com/reader/full/nifty-50-reports-for-the-week-20th-24th-december-2010 7/52
Technical Picture
Figure: 6 : Nifty50 Graph
WEEKLY
20th Dec to 25th Dec 2010
www.capitalvia.com
R E S E A R C H
7
TECHNICAL OVERVIEW
BPCL W E E K A H E A D
Weekly Pivots
B P C L
The stock is facing range bound movement currently. It faces next resistance at 725, crossing
of which may bring some northward movement while it has support at 655. RESISTANCE 725
SUPPORT 655
STOCK R2 R1 PP S1 S2
BPCL 722.03 710.77 698.63 687.37 675.23
8/8/2019 Nifty 50 Reports for the Week (20th - 24th December - 2010)
http://slidepdf.com/reader/full/nifty-50-reports-for-the-week-20th-24th-december-2010 8/52
Technical Picture
Figure: 7 : Nifty50 Graph
WEEKLY
20th Dec to 25th Dec 2010
www.capitalvia.com
R E S E A R C H
8
TECHNICAL OVERVIEW
BHARTI AIRTEL W E E K A H E A D
Weekly Pivots
B H A R T
I A I R T E L
The stock has tried to take support at lower levels and is positively biased. One could go for
buy on dip strategy in this stock until it breaches level of 320 in downside. RESISTANCE 355
SUPPORT 320
STOCK R2 R1 PP S1 S2
BHARTIARTL 350.07 347.18 343.62 340.73 337.17

8/8/2019 Nifty 50 Reports for the Week (20th - 24th December - 2010)
http://slidepdf.com/reader/full/nifty-50-reports-for-the-week-20th-24th-december-2010 9/52
Technical Picture
Figure: 8 : Nifty50 Graph
WEEKLY
20th Dec to 25th Dec 2010
www.capitalvia.com
R E S E A R C H
9
TECHNICAL OVERVIEW
CIPLA W E E K A H E A D
Weekly Pivots
C I P L A
The stock has moved in a sideways trend this week. It now has next support at 335; breach of
this level may take the stock further down. RESISTANCE 374
SUPPORT 335
STOCK R2 R1 PP S1 S2
CIPLA 364.47 360.58 354.92 351.03 345.37

8/8/2019 Nifty 50 Reports for the Week (20th - 24th December - 2010)
http://slidepdf.com/reader/full/nifty-50-reports-for-the-week-20th-24th-december-2010 10/52
Technical Picture
Figure: 9 : Nifty50 Graph
www.capitalvia.com
R E S E A R C H
10
TECHNICAL OVERVIEW
CAIRN W E E K A H E A D
Weekly Pivots
C A I R N
The stock is positively biased from last many trading sessions. One could go for buying on dip
strategy in this stock till it breaches 307 in downside. It faces resistance at 336; crossing of
this level may take up the stock 340-345 in coming trading sessions.
RESISTANCE 336
SUPPORT 307
STOCK R2 R1 PP S1 S2
WEEKLY
20th Dec to 25th Dec 2010
CAIRN 334.45 331.8 330.05 327.4 325.65

8/8/2019 Nifty 50 Reports for the Week (20th - 24th December - 2010)
http://slidepdf.com/reader/full/nifty-50-reports-for-the-week-20th-24th-december-2010 11/52
Technical Picture
Figure: 10 : Nifty50 Graph
www.capitalvia.com
R E S E A R C H
11
TECHNICAL OVERVIEW
DLF W E E K A H E A D
Weekly Pivots D L F
The stock had either side movement this week. It has support at 270; breach of this level may
take the stock down till the levels of 260 in near term. One could go for sell on rise strategy in
this stock.
RESISTANCE 304
SUPPORT 270
STOCK R2 R1 PP S1 S2
WEEKLY
20th Dec to 25th Dec 2010
DLF 289.2 285.5 280.3 276.6 271.4
8/8/2019 Nifty 50 Reports for the Week (20th - 24th December - 2010)
http://slidepdf.com/reader/full/nifty-50-reports-for-the-week-20th-24th-december-2010 12/52
Technical Picture
Figure: 11 : Nifty50 Graph
R E S E A R C H
TECHNICAL OVERVIEW
DR REDDY W E E K A H E A D
Weekly Pivots
D R R E D D Y
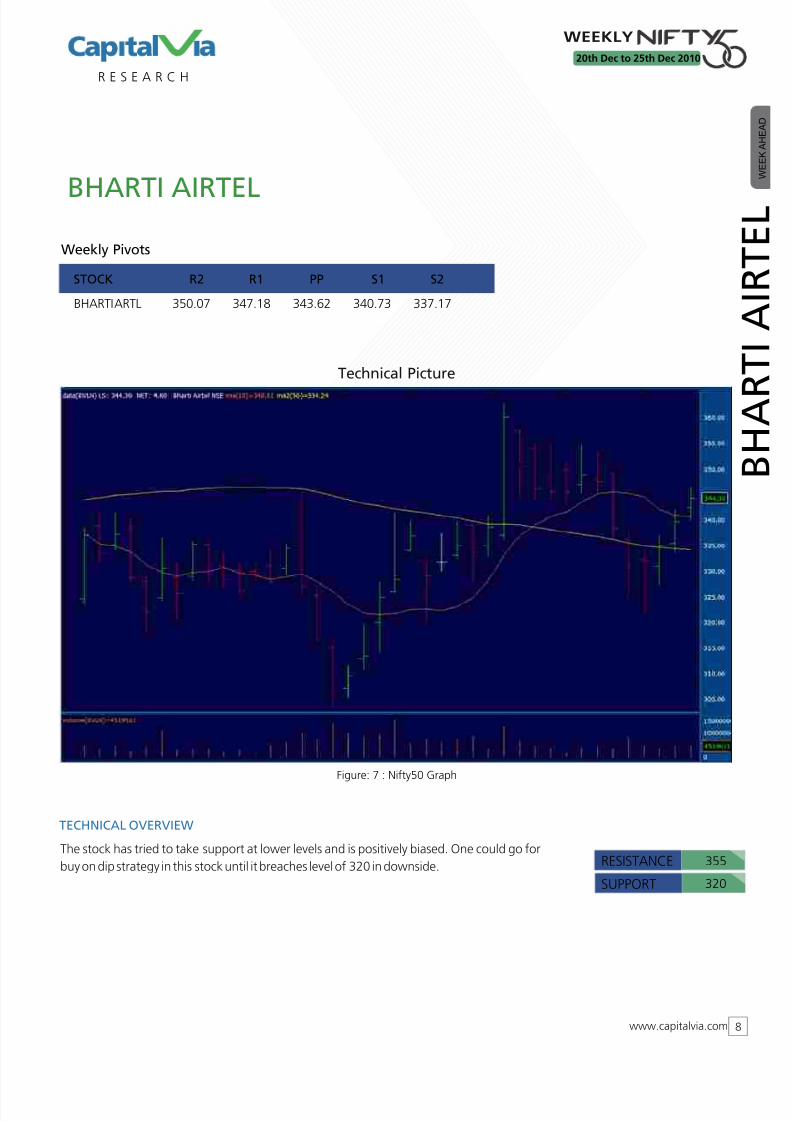
Dr.Reddy has Bullish trend. The stock trading in sideways trend has important support level
at 1740 above which if the stock price sustains then it may continue to trade in uptrend. The
stock is looking risky below the support level.
RESISTANCE 1830
SUPPORT 1765
STOCK R2 R1 PP S1 S2
www.capitalvia.com 12
WEEKLY
20th Dec to 25th Dec 2010
DRREDDY 1816.1 1802.45 1791.25 1777.6 1766.4

8/8/2019 Nifty 50 Reports for the Week (20th - 24th December - 2010)
http://slidepdf.com/reader/full/nifty-50-reports-for-the-week-20th-24th-december-2010 13/52
Technical Picture
Figure: 12 : Nifty50 Graph
R E S E A R C H
TECHNICAL OVERVIEW
GAIL INDIA W E E K A H E A D
Weekly Pivots
D R R E D D Y
GAIL India is in consolidation state. The stock is not lucrative in the short term and wait for
proper breakout in it RESISTANCE 515
SUPPORT 490
STOCK R2 R1 PP S1 S2
www.capitalvia.com 13
WEEKLY
20th Dec to 25th Dec 2010
GAIL 506.2 503.1 499.3 496.2 492.4

8/8/2019 Nifty 50 Reports for the Week (20th - 24th December - 2010)
http://slidepdf.com/reader/full/nifty-50-reports-for-the-week-20th-24th-december-2010 14/52
Technical Picture
Figure: 13 : Nifty50 Graph
R E S E A R C H
TECHNICAL OVERVIEW
HCL W E E K A H E A D
Weekly Pivots
H C L
HCL has bullish trend. The stock is trading in uptrend and above the resistance level of 456
the stock may further continue the trend in the short run. RESISTANCE 456
SUPPORT 440
STOCK R2 R1 PP S1 S2
www.capitalvia.com 14
WEEKLY
20th Dec to 25th Dec 2010
HCLTECH 455.97 452.48 448.02 444.53 440.07

8/8/2019 Nifty 50 Reports for the Week (20th - 24th December - 2010)
http://slidepdf.com/reader/full/nifty-50-reports-for-the-week-20th-24th-december-2010 15/52
Technical Picture
Figure: 14 : Nifty50 Graph
R E S E A R C H
TECHNICAL OVERVIEW
HDFC BANK W E E K A H E A D
Weekly Pivots
H D F C B A N K
HDFC Bank has bounced back sharply from the support level and sustaining above it. So this
will act as a crucial support level moving forward. RESISTANCE 2250
SUPPORT 2150
STOCK R2 R1 PP S1 S2
www.capitalvia.com 15
WEEKLY
20th Dec to 25th Dec 2010
HDFCBANK 2259.73 2230.27 2190.13 2160.67 2120.53
8/8/2019 Nifty 50 Reports for the Week (20th - 24th December - 2010)
http://slidepdf.com/reader/full/nifty-50-reports-for-the-week-20th-24th-december-2010 16/52
Technical Picture
Figure: 15 : Nifty50 Graph
R E S E A R C H
TECHNICAL OVERVIEW
HOUSING DEVELOPMENT FINANCE W E E K A H E A D
Weekly Pivots
H O U S
I N G D E V E L O P M E N T F I N A N C E
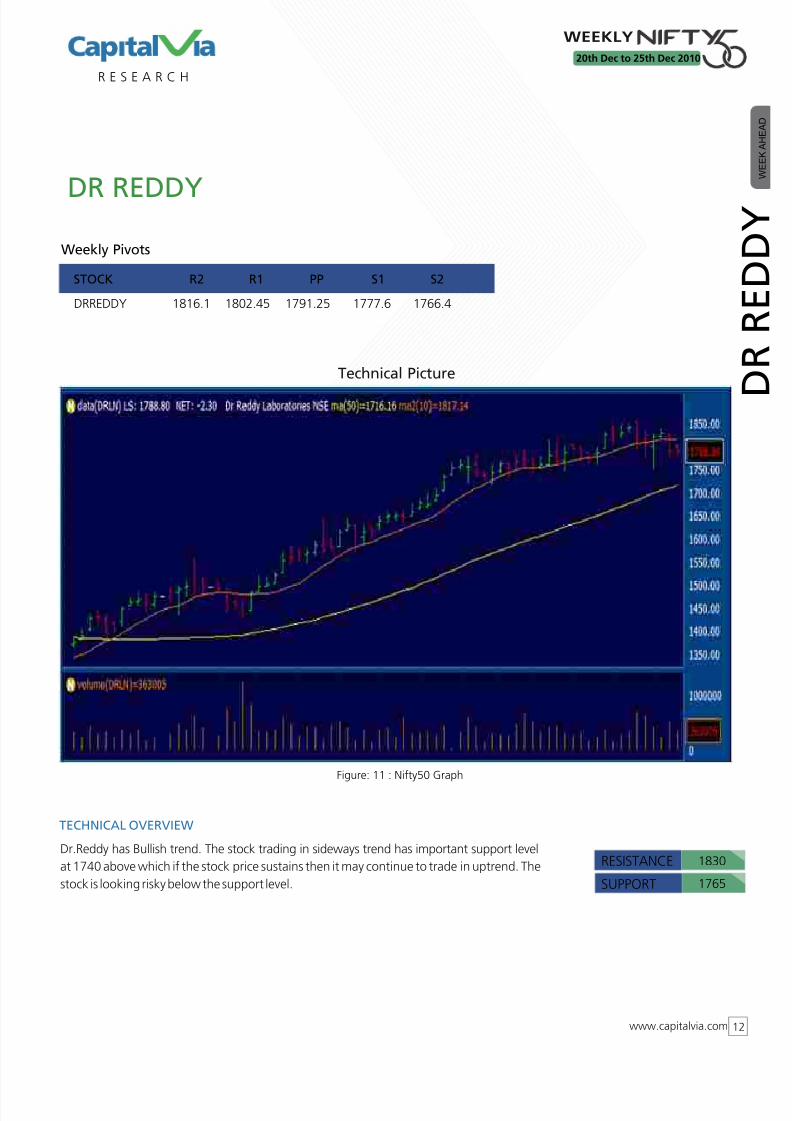
Housing Development Finance trading in sideways trend with the negative bias. The stock
has important support level of 675 in the short run below which it may show some more
correction in the coming time.
RESISTANCE 695
SUPPORT 675
STOCK R2 R1 PP S1 S2
www.capitalvia.com 16
WEEKLY
20th Dec to 25th Dec 2010
HDFC 705.57 697.03 684.27 675.73 662.97

8/8/2019 Nifty 50 Reports for the Week (20th - 24th December - 2010)
http://slidepdf.com/reader/full/nifty-50-reports-for-the-week-20th-24th-december-2010 17/52
Technical Picture
Figure: 16 : Nifty50 Graph
R E S E A R C H
TECHNICAL OVERVIEW
HERO HONDA W E E K A H E A D
Weekly Pivots
H E R O
H O N D A
Hero Honda is in bearish trend. The stock has bounced back from the support level and has
strong closing. So the level of 1560 will be crucial support level moving forward and the
stock has important resistance at 1710 in the short run.
RESISTANCE 1710
SUPPORT 1620
STOCK R2 R1 PP S1 S2
www.capitalvia.com 17
WEEKLY
20th Dec to 25th Dec 2010
HEROHONDA 1771.57 1726.63 1657.57 1612.63 1543.57

8/8/2019 Nifty 50 Reports for the Week (20th - 24th December - 2010)
http://slidepdf.com/reader/full/nifty-50-reports-for-the-week-20th-24th-december-2010 18/52
Technical Picture
Figure: 17 : Nifty50 Graph
R E S E A R C H
TECHNICAL OVERVIEW
HINDALCO W E E K A H E A D
Weekly Pivots
H I
N D A L C O
Hindalco has shown an explosive rally in the today session. The stock is looking bullish and a
decisive breakout above the level of 228 will continue the uptrend in the coming time. RESISTANCE 228
SUPPORT 215
STOCK R2 R1 PP S1 S2
www.capitalvia.com 18
WEEKLY
20th Dec to 25th Dec 2010
HINDALCO 230.68 227.42 221.83 218.57 212.98

8/8/2019 Nifty 50 Reports for the Week (20th - 24th December - 2010)
http://slidepdf.com/reader/full/nifty-50-reports-for-the-week-20th-24th-december-2010 19/52
Technical Picture
Figure: 18 : Nifty50 Graph
R E S E A R C H
TECHNICAL OVERVIEW
HUL W E E K A H E A D
Weekly Pivots
H U L
HUL is trading in sideways trend with the negative bias. The stock has crucial support level of
288 in the short run below which the stock may show some more correction in the coming
time
RESISTANCE 300
SUPPORT 288
STOCK R2 R1 PP S1 S2
www.capitalvia.com 19
WEEKLY
20th Dec to 25th Dec 2010
HINDUNILVR 303.4 298.7 295.75 291.05 288.1

8/8/2019 Nifty 50 Reports for the Week (20th - 24th December - 2010)
http://slidepdf.com/reader/full/nifty-50-reports-for-the-week-20th-24th-december-2010 20/52
Technical Picture
Figure: 19 : Nifty50 Graph
R E S E A R C H
TECHNICAL OVERVIEW
ICICI BANK W E E K A H E A D
Weekly Pivots
I C I C I B A N K
ICICI Bank is trading in sideways trend with the negative bias. The stock is sustaining above
the short term support level of 1065 and has good closing. So above the resistance level it
may show some more upside in the coming time
RESISTANCE 1135
SUPPORT 1165
STOCK R2 R1 PP S1 S2
www.capitalvia.com 20
WEEKLY
20th Dec to 25th Dec 2010
ICICIBANK 1139.38 1122.57 1095.33 1078.52 1051.28
8/8/2019 Nifty 50 Reports for the Week (20th - 24th December - 2010)
http://slidepdf.com/reader/full/nifty-50-reports-for-the-week-20th-24th-december-2010 21/52
Technical Picture
Figure: 20 : Nifty50 Graph
R E S E A R C H
TECHNICAL OVERVIEW
IDFC W E E K A H E A D
Weekly Pivots
I D F C
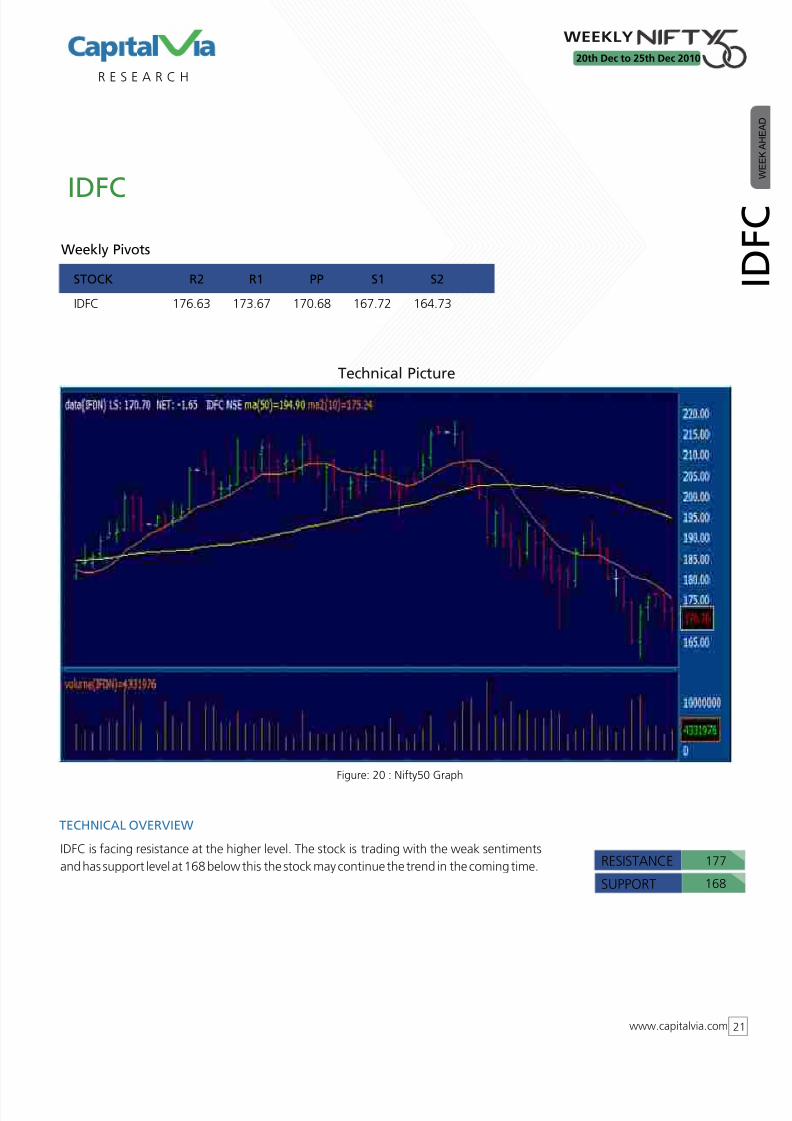
IDFC is facing resistance at the higher level. The stock is trading with the weak sentiments
and has support level at 168 below this the stock may continue the trend in the coming time. RESISTANCE 177
SUPPORT 168
STOCK R2 R1 PP S1 S2
www.capitalvia.com 21
WEEKLY
20th Dec to 25th Dec 2010
IDFC 176.63 173.67 170.68 167.72 164.73

8/8/2019 Nifty 50 Reports for the Week (20th - 24th December - 2010)
http://slidepdf.com/reader/full/nifty-50-reports-for-the-week-20th-24th-december-2010 22/52
Technical Picture
Figure: 21 : Nifty50 Graph
R E S E A R C H
TECHNICAL OVERVIEW
INFOSYS TECHNOLOGIES W E E K A H E A D
Weekly Pivots
I N F O S
Y S T E C H N O L O G I E S
Infosys Technologies in today's trading session moving in an uptrend and it was up by 2.80
%.It is now taking resistance at 3300 and support at 3210. It is looking bullish in the coming
trading session if it manages to trade below the resistance level of 3300 else it has support at
3210 below this level it would might be in a downtrend.
RESISTANCE 3300
SUPPORT 3210
STOCK R2 R1 PP S1 S2
www.capitalvia.com 22
WEEKLY
20th Dec to 25th Dec 2010
INFOSYSTCH 3357.77 3325.53 3267.77 3235.53 3177.77

8/8/2019 Nifty 50 Reports for the Week (20th - 24th December - 2010)
http://slidepdf.com/reader/full/nifty-50-reports-for-the-week-20th-24th-december-2010 23/52
Technical Picture
Figure: 22 : Nifty50 Graph
R E S E A R C H
TECHNICAL OVERVIEW
ITC W E E K A H E A D
Weekly Pivots I T C
In today's trading session it was moving below the 10 days and 50 days moving averages it
was up by 0.63% from this level either side of movement would be expected. In order to be
in an uptrend it has to trade and consolidate above the 10 days and 50 days moving
averages. It is looking bearish in the coming trading session one can go for short position in it
at 161 else above 174 it would be in an uptrend.
RESISTANCE 174
SUPPORT 161
STOCK R2 R1 PP S1 S2
www.capitalvia.com 23
WEEKLY
20th Dec to 25th Dec 2010
ITC 171.18 169.62 166.88 165.32 162.58

8/8/2019 Nifty 50 Reports for the Week (20th - 24th December - 2010)
http://slidepdf.com/reader/full/nifty-50-reports-for-the-week-20th-24th-december-2010 24/52
Technical Picture
Figure: 23 : Nifty50 Graph
R E S E A R C H
TECHNICAL OVERVIEW
JAIPRAKASH ASSOCIATES W E E K A H E A D
Weekly Pivots
J A I P R A
K A S H A S S
O C I A T E S
Jaiprakash Associates form the last few trading session was moving sideways. In today's
trading session it was down by 0.48 % and closed below the 10 days and 50 days moving
averages. It has resistance at 109 and support at 98. One can take a long position in it, above
109 it would be in an uptrend.
RESISTANCE 109
SUPPORT 98
STOCK R2 R1 PP S1 S2
www.capitalvia.com 24
WEEKLY
20th Dec to 25th Dec 2010
JPASSOCIAT 106.95 105.35 103.4 101.8 99.85

8/8/2019 Nifty 50 Reports for the Week (20th - 24th December - 2010)
http://slidepdf.com/reader/full/nifty-50-reports-for-the-week-20th-24th-december-2010 25/52
Technical Picture
Figure: 24 : Nifty50 Graph
R E S E A R C H
TECHNICAL OVERVIEW
JINDAL STEEL & POWER W E E K A H E A D
Weekly Pivots
J I N D A L S T E E L &
P O W E R
It is taking support at the level of 635, from the last few trading session it was moving
sideways in today's trading session it was up by 0.71 %.It is looking bearish in the coming
trading session, one can go for short position in it at 635 else it has resistance at 715 above
this level it would might be in an uptrend.
RESISTANCE 715
SUPPORT 635
STOCK R2 R1 PP S1 S2
www.capitalvia.com 25
WEEKLY
20th Dec to 25th Dec 2010
JINDALSTEL 689.92 680.43 665.37 655.88 640.82

8/8/2019 Nifty 50 Reports for the Week (20th - 24th December - 2010)
http://slidepdf.com/reader/full/nifty-50-reports-for-the-week-20th-24th-december-2010 26/52
Technical Picture
Figure: 25 : Nifty50 Graph
R E S E A R C H
TECHNICAL OVERVIEW
LARSEN AND TOUBRO W E E K A H E A D
Weekly Pivots
L A R
S E N A N D
T O U B R O
In today's trading session it was moving sideways and closed below the 10 days and 50 days
moving averages from this level either side of movement would be expected. It is looking
bullish in the coming trading session, one can go for long position in it at 2065 else it has
support at 1894 below this level it would be in a down trend.
RESISTANCE 2065
SUPPORT 1894
STOCK R2 R1 PP S1 S2
www.capitalvia.com 26
WEEKLY
20th Dec to 25th Dec 2010
LT 2019.7 2001.5 1986.8 1968.6 1953.9

8/8/2019 Nifty 50 Reports for the Week (20th - 24th December - 2010)
http://slidepdf.com/reader/full/nifty-50-reports-for-the-week-20th-24th-december-2010 27/52
Technical Picture
Figure: 26 : Nifty50 Graph
R E S E A R C H
TECHNICAL OVERVIEW
KOTAK MAHINDRA BANK W E E K A H E A D
Weekly Pivots
K O T A K
M A H I N D R
A B A N K
Kotak Mahindra Bank from the last few trading moving in a down trend in today's trading
session it was down by 3.20 % and closed below the 10 days and 50 days moving averages.
It is looking bearish in the coming trading session one can go for short position in it at 435. It
has resistance at 497 above this level it would be in an uptrend else below 435 it would
might face more selling pressure.
RESISTANCE 497
SUPPORT 435
STOCK R2 R1 PP S1 S2
www.capitalvia.com 27
WEEKLY
20th Dec to 25th Dec 2010
KOTAKBANK 478.62 471.43 459.27 452.08 439.92

8/8/2019 Nifty 50 Reports for the Week (20th - 24th December - 2010)
http://slidepdf.com/reader/full/nifty-50-reports-for-the-week-20th-24th-december-2010 28/52
Technical Picture
Figure: 27 : Nifty50 Graph
R E S E A R C H
TECHNICAL OVERVIEW
MAHINDRA & MAHINDRA W E E K A H E A D
Weekly Pivots
M A H I N
D R A & M A
H I N D R A
In today's trading session it manages to close below the 10 days and 50 days moving
averages and it has very strong support at 682. It is looking bearish in the coming trading
session if it manages to trade below the support level of 682 else above 815 it would be in an
uptrend.
RESISTANCE 815
SUPPORT 682
STOCK R2 R1 PP S1 S2
www.capitalvia.com 28
WEEKLY
20th Dec to 25th Dec 2010
M&M 766.32 749.63 735.32 718.63 704.32

8/8/2019 Nifty 50 Reports for the Week (20th - 24th December - 2010)
http://slidepdf.com/reader/full/nifty-50-reports-for-the-week-20th-24th-december-2010 29/52
Technical Picture
Figure: 28 : Nifty50 Graph
R E S E A R C H
TECHNICAL OVERVIEW
MARUTI SUZUKI INDIA W E E K A H E A D
Weekly Pivots
M A R U T I S U Z U
K I I N D I A
It is taking support at 1330 and resistance at 1446. It is now trading at 1378 from the last
few trading session it was moving sideways form this level either side of movement would be
expected. It is looking bullish in the coming trading session if it manages to trade above the
resistance level of 1446 else it has support level of 1330 below this level it would might face
more selling pressure.
RESISTANCE 1446
SUPPORT 1330
STOCK R2 R1 PP S1 S2
www.capitalvia.com 29
WEEKLY
20th Dec to 25th Dec 2010
MARUTI 1414.5 1396.25 1380.75 1362.5 1347

8/8/2019 Nifty 50 Reports for the Week (20th - 24th December - 2010)
http://slidepdf.com/reader/full/nifty-50-reports-for-the-week-20th-24th-december-2010 30/52

8/8/2019 Nifty 50 Reports for the Week (20th - 24th December - 2010)
http://slidepdf.com/reader/full/nifty-50-reports-for-the-week-20th-24th-december-2010 31/52
Technical Picture
Figure: 30 : Nifty50 Graph
R E S E A R C H
TECHNICAL OVERVIEW
ONGC W E E K A H E A D
Weekly Pivots
O N G C
ONGC from the last few trading session moving sideways in today's trading session it was up
by 0.47 %. It has resistance at 1365 and support at 1246. It is looking positive in the coming
trading session if it manages to trade above the resistance level of 1365 else it has support at
1246 below this level it would might face more selling pressure.
RESISTANCE 1365
SUPPORT 1246
STOCK R2 R1 PP S1 S2
www.capitalvia.com 31
WEEKLY
20th Dec to 25th Dec 2010
ONGC 1357.98 1343.97 1323.98 1309.97 1289.98
8/8/2019 Nifty 50 Reports for the Week (20th - 24th December - 2010)
http://slidepdf.com/reader/full/nifty-50-reports-for-the-week-20th-24th-december-2010 32/52
Technical Picture
Figure: 31 : Nifty50 Graph
R E S E A R C H
TECHNICAL OVERVIEW
POWER GRID CORPORATION OF INDIA W E E K A H E A D
Weekly Pivots
P O W E
R G R I D C O R
P O R A T I O N O F I N D I A
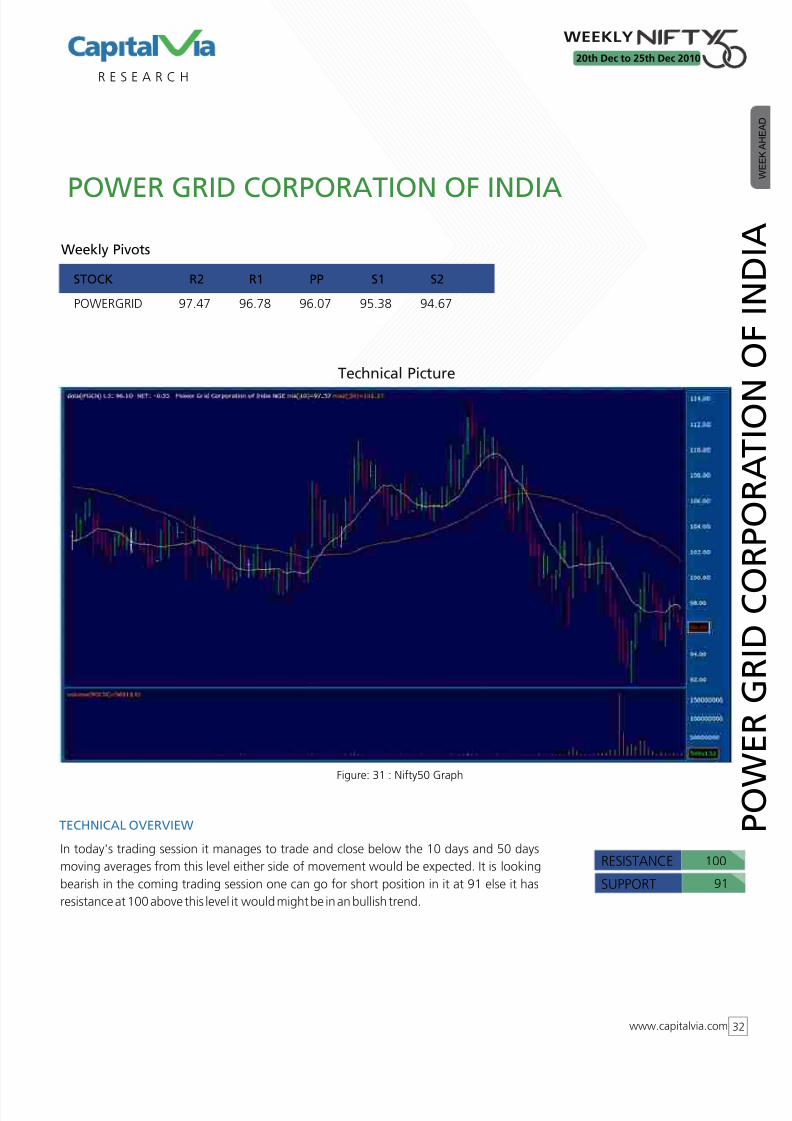
In today's trading session it manages to trade and close below the 10 days and 50 days
moving averages from this level either side of movement would be expected. It is looking
bearish in the coming trading session one can go for short position in it at 91 else it has
resistance at 100 above this level it would might be in an bullish trend.
RESISTANCE 100
SUPPORT 91
STOCK R2 R1 PP S1 S2
www.capitalvia.com 32
WEEKLY
20th Dec to 25th Dec 2010
POWERGRID 97.47 96.78 96.07 95.38 94.67

8/8/2019 Nifty 50 Reports for the Week (20th - 24th December - 2010)
http://slidepdf.com/reader/full/nifty-50-reports-for-the-week-20th-24th-december-2010 33/52
Technical Picture
Figure: 32 : Nifty50 Graph
R E S E A R C H
TECHNICAL OVERVIEW
PUNJAB NATIONAL BANK W E E K A H E A D
Weekly Pivots
P U N J A B N A T I O N A L B A N K
PNB from the last few trading session moving sideways and it manages to trade below the
10 days and 50 days moving averages. It is taking support at 1152 and resistance at 1289. It
is looking bullish in the coming trading session if it manages to trade above the resistance
level of 1289 else below 1152 it would might face more selling pressure.
RESISTANCE 1289
SUPPORT 1152
STOCK R2 R1 PP S1 S2
www.capitalvia.com 33
WEEKLY
20th Dec to 25th Dec 2010
PNB 1240.52 1226.03 1206.12 1191.63 1171.72

8/8/2019 Nifty 50 Reports for the Week (20th - 24th December - 2010)
http://slidepdf.com/reader/full/nifty-50-reports-for-the-week-20th-24th-december-2010 34/52
Technical Picture
Figure: 33 : Nifty50 Graph
R E S E A R C H
TECHNICAL OVERVIEW
RANBAXY W E E K A H E A D
Weekly Pivots
R
A N B A X Y
Ranbaxy was moving in a downward trend and closed below the 10 days and 50 days
moving averages. It is now taking support at 530 and resistance at 590. In order to be in an
uptrend it has to trade and consolidate above the 10 days and 50 days moving averages. It is
looking bearish in the coming trading session one can go for short position in it at 530 else it
has resistance at 590 above this level it would be in an uptrend.
RESISTANCE 590
SUPPORT 530
STOCK R2 R1 PP S1 S2
www.capitalvia.com 34
WEEKLY
20th Dec to 25th Dec 2010
RANBAXY 556.53 551.77 545.98 541.22 535.43

8/8/2019 Nifty 50 Reports for the Week (20th - 24th December - 2010)
http://slidepdf.com/reader/full/nifty-50-reports-for-the-week-20th-24th-december-2010 35/52
Technical Picture
Figure: 34 : Nifty50 Graph
R E S E A R C H
TECHNICAL OVERVIEW
RELIANCE CAPITAL W E E K A H E A D
Weekly Pivots
R E L I A N C E
C A P I T A L
Reliance Capital from the last few trading session moving sideways and it was up by 1.24 %.
It is now taking resistance at 725 and support at 615 from this level either side of movement
would be expected. It is looking bearish in the coming trading session if it manages to trade
and consolidate below the support level of 615 else it has resistance at 725 above this level it
would be in an uptrend.
RESISTANCE 725
SUPPORT 615
STOCK R2 R1 PP S1 S2
www.capitalvia.com 35
WEEKLY
20th Dec to 25th Dec 2010
RELCAPITAL 662.5 656.2 647.6 641.3 632.7

8/8/2019 Nifty 50 Reports for the Week (20th - 24th December - 2010)
http://slidepdf.com/reader/full/nifty-50-reports-for-the-week-20th-24th-december-2010 36/52
Technical Picture
Figure: 35 : Nifty50 Graph
R E S E A R C H
TECHNICAL OVERVIEW
RELIANCE COMMUNICATION W E E K A H E A D
Weekly Pivots
R E L I A N C
E C O M M U N
I C A T I O N
In today's trading session it was down by 0.31 % now it is taking support at 119 and
resistance at 144. It is looking bearish in the coming trading one can go for short position in it
at 119 else it has resistance at the level of 144 above this it would might be in a bullish trend.
RESISTANCE 144
SUPPORT 119
STOCK R2 R1 PP S1 S2
www.capitalvia.com 36
WEEKLY
20th Dec to 25th Dec 2010
RCOM 132.65 130.8 128.55 126.7 124.45

8/8/2019 Nifty 50 Reports for the Week (20th - 24th December - 2010)
http://slidepdf.com/reader/full/nifty-50-reports-for-the-week-20th-24th-december-2010 37/52
Technical Picture
Figure: 36 : Nifty50 Graph
R E S E A R C H
TECHNICAL OVERVIEW
RELIANCE INDUSTRIES W E E K A H E A D
Weekly Pivots
R
E L I A N C E I N D U S T R I E S
It is taking resistance at 1088 and support at 978.It is looking positive in the coming trading
session one can go for long position in at 1088 else below 978 it would might face more
selling pressure.
RESISTANCE 1088
SUPPORT 978
STOCK R2 R1 PP S1 S2
www.capitalvia.com 37
WEEKLY
20th Dec to 25th Dec 2010
RELIANCE 1072.25 1064.55 1052.3 1044.6 1032.35

8/8/2019 Nifty 50 Reports for the Week (20th - 24th December - 2010)
http://slidepdf.com/reader/full/nifty-50-reports-for-the-week-20th-24th-december-2010 38/52
Technical Picture
Figure: 37 : Nifty50 Graph
R E S E A R C H
TECHNICAL OVERVIEW
RELIANCE INFRAUSTRUCTURE W E E K A H E A D
Weekly Pivots
R E L I A N C E I N F R A U S T R U C T U R E
Reliance Infra from the last few trading session it was moving sideways and its was by 0.56
%. It is looking bullish in the coming trading session one can go for long position it at 892
above this level it would might be in an upward trend else it has support at 750 below this
level it would be in a bearish trend.
RESISTANCE 892
SUPPORT 750
STOCK R2 R1 PP S1 S2
www.capitalvia.com 38
WEEKLY
20th Dec to 25th Dec 2010
RELINFRA 846.2 837.75 824.45 816 802.7

8/8/2019 Nifty 50 Reports for the Week (20th - 24th December - 2010)
http://slidepdf.com/reader/full/nifty-50-reports-for-the-week-20th-24th-december-2010 39/52
Technical Picture
Figure: 38 : Nifty50 Graph
R E S E A R C H
TECHNICAL OVERVIEW
RELIANCE POWER W E E K A H E A D
Weekly Pivots
R E L I A N C E P O W E R
The stock has been consolidating from last many trading sessions. It now faces support level
at 147.50, breach of this level may bring some more selling pressure in the stock else it may
also bounce back from lower support levels.
RESISTANCE 165
SUPPORT 147.50
STOCK R2 R1 PP S1 S2
www.capitalvia.com 39
WEEKLY
20th Dec to 25th Dec 2010
RPOWER 158.72 155.53 153.27 150.08 147.82

8/8/2019 Nifty 50 Reports for the Week (20th - 24th December - 2010)
http://slidepdf.com/reader/full/nifty-50-reports-for-the-week-20th-24th-december-2010 40/52
Technical Picture
Figure: 39 : Nifty50 Graph
R E S E A R C H
TECHNICAL OVERVIEW
SIEMENS W E E K A H E A D
Weekly Pivots
S I E M E N S
The stock tried to take support at lower levels and is consolidating from last a few trading
sessions. It faces resistance at 805 while major support is seen at 730. One has to wait for
crossing of levels on either side.
RESISTANCE 805
SUPPORT 730
STOCK R2 R1 PP S1 S2
www.capitalvia.com 40
WEEKLY
20th Dec to 25th Dec 2010
SIEMENS 797.65 787.2 772.55 762.1 747.45

8/8/2019 Nifty 50 Reports for the Week (20th - 24th December - 2010)
http://slidepdf.com/reader/full/nifty-50-reports-for-the-week-20th-24th-december-2010 41/52
Technical Picture
Figure: 40 : Nifty50 Graph
R E S E A R C H
TECHNICAL OVERVIEW
STERLITE W E E K A H E A D
Weekly Pivots
S T E R L I T E
The stock now faces resistance at 175; crossing of this level may bring some more northward
movement in the stock. So one could go for buying on dip strategy in the stock as it has tried
to take support at lower levels and recovered.
RESISTANCE 175
SUPPORT 157
STOCK R2 R1 PP S1 S2
www.capitalvia.com 41
WEEKLY
20th Dec to 25th Dec 2010
STER 179.08 175.82 170.93 167.67 162.78

8/8/2019 Nifty 50 Reports for the Week (20th - 24th December - 2010)
http://slidepdf.com/reader/full/nifty-50-reports-for-the-week-20th-24th-december-2010 42/52
Technical Picture
Figure: 41 : Nifty50 Graph
R E S E A R C H
TECHNICAL OVERVIEW
STATE BANK OF INDIA W E E K A H E A D
Weekly Pivots
S T A T E B A N K O F I N D I A
The stock had a very tight range bound movement throughout this week as important credit
policy of RBI was scheduled to come this week. One has to wait for crossing of levels on
either side before taking any positions in the stock.
RESISTANCE 2817
SUPPORT 2650
STOCK R2 R1 PP S1 S2
www.capitalvia.com 42
WEEKLY
20th Dec to 25th Dec 2010
SBIN 2841.38 2802.17 2739.78 2700.57 2638.18

8/8/2019 Nifty 50 Reports for the Week (20th - 24th December - 2010)
http://slidepdf.com/reader/full/nifty-50-reports-for-the-week-20th-24th-december-2010 43/52
Technical Picture
Figure: 42 : Nifty50 Graph
R E S E A R C H
TECHNICAL OVERVIEW
SAIL W E E K A H E A D
Weekly Pivots
S A I L
The stock had either side movement this week. It now faces resistance at 192; crossing of
this level may bring some more northward movement in the stock while it faces support at
170, breach of this level may bring some southward movement. One has to wait crossing of
levels on either side.
RESISTANCE 192
SUPPORT 170
STOCK R2 R1 PP S1 S2
www.capitalvia.com 43
WEEKLY
20th Dec to 25th Dec 2010
SAIL 196.48 192.37 184.83 180.72 173.18

8/8/2019 Nifty 50 Reports for the Week (20th - 24th December - 2010)
http://slidepdf.com/reader/full/nifty-50-reports-for-the-week-20th-24th-december-2010 44/52
Technical Picture
Figure: 43 : Nifty50 Graph
R E S E A R C H
TECHNICAL OVERVIEW
SUN PHARMACEUTICAL W E E K A H E A D
Weekly Pivots
S U N P H A R M A C
E U T I C A L
Sun Pharma is in consolidation state. The stock is not looking lucrative in the short term. So
wait for proper breakout in it. RESISTANCE 460
SUPPORT 435
STOCK R2 R1 PP S1 S2
www.capitalvia.com 44
WEEKLY
20th Dec to 25th Dec 2010
SUNPHARMA 458.37 454.18 447.72 443.53 437.07
8/8/2019 Nifty 50 Reports for the Week (20th - 24th December - 2010)
http://slidepdf.com/reader/full/nifty-50-reports-for-the-week-20th-24th-december-2010 45/52
Technical Picture
Figure: 44 : Nifty50 Graph
R E S E A R C H
TECHNICAL OVERVIEW
SUZLON W E E K A H E A D
Weekly Pivots
S U Z L O N
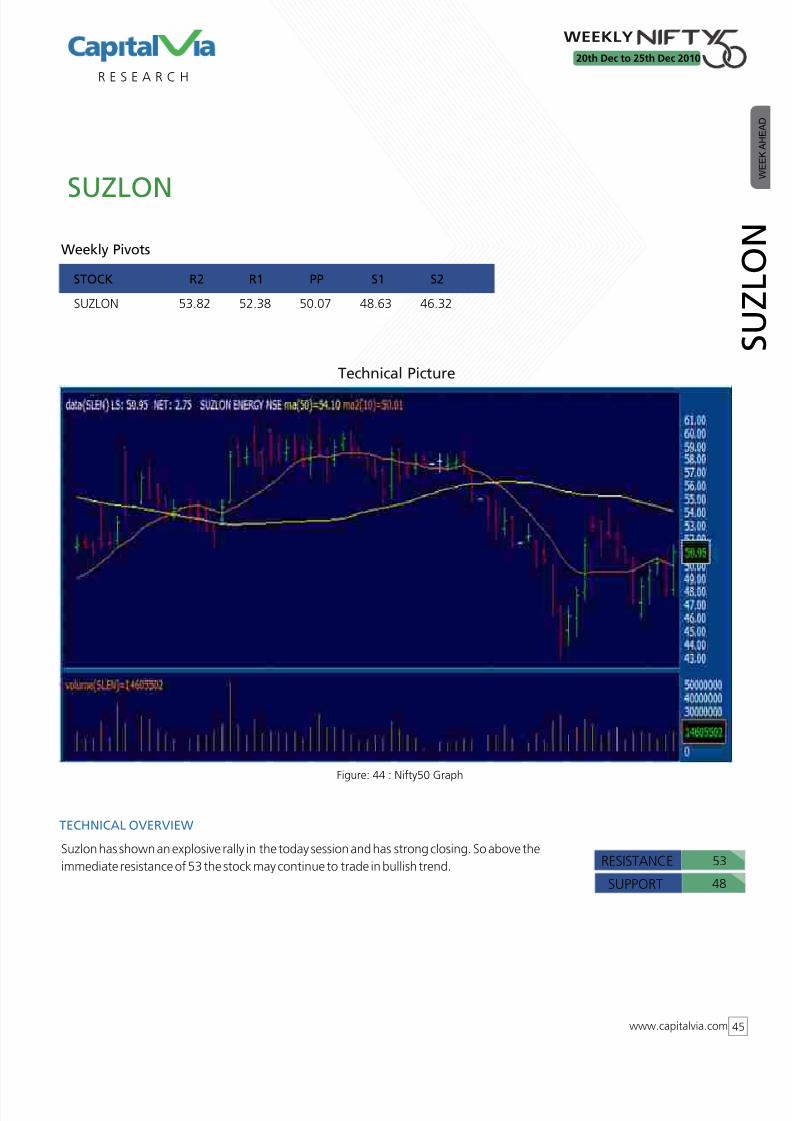
Suzlon has shown an explosive rally in the today session and has strong closing. So above the
immediate resistance of 53 the stock may continue to trade in bullish trend. RESISTANCE 53
SUPPORT 48
STOCK R2 R1 PP S1 S2
www.capitalvia.com 45
WEEKLY
20th Dec to 25th Dec 2010
SUZLON 53.82 52.38 50.07 48.63 46.32
8/8/2019 Nifty 50 Reports for the Week (20th - 24th December - 2010)
http://slidepdf.com/reader/full/nifty-50-reports-for-the-week-20th-24th-december-2010 46/52
Technical Picture
Figure: 45 : Nifty50 Graph
R E S E A R C H
TECHNICAL OVERVIEW
TCS W E E K A H E A D
Weekly Pivots
T C S
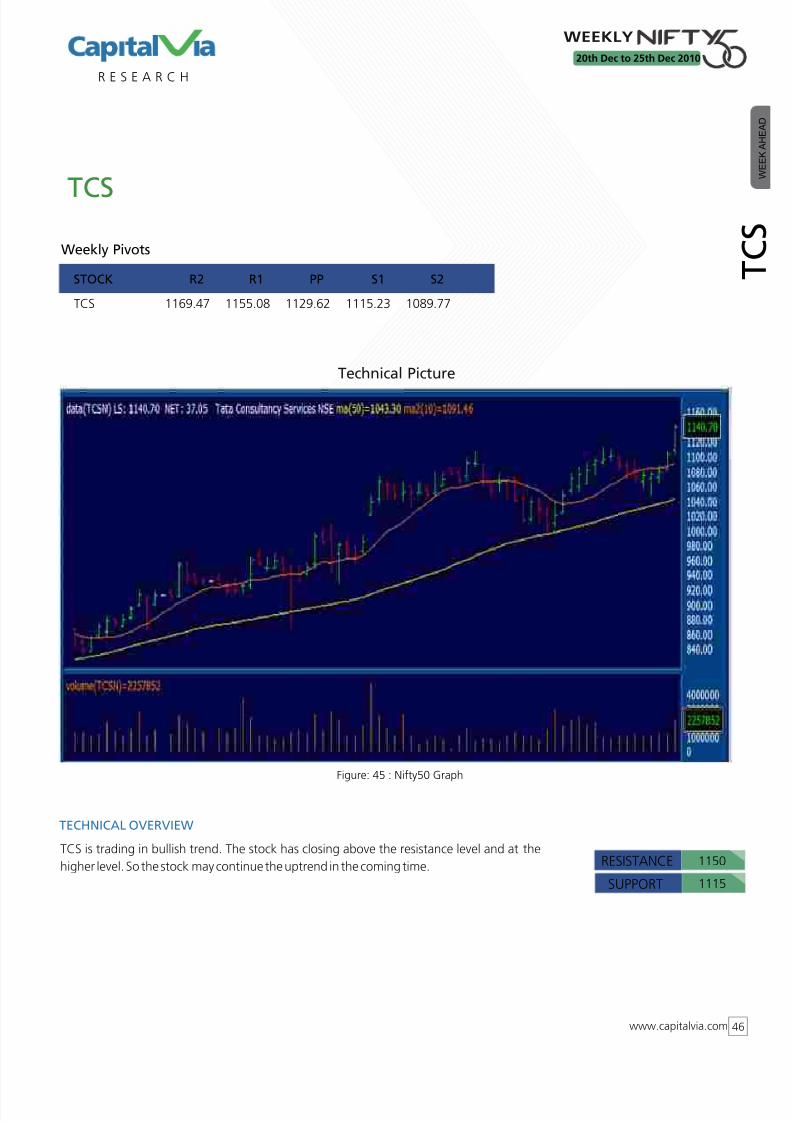
TCS is trading in bullish trend. The stock has closing above the resistance level and at the
higher level. So the stock may continue the uptrend in the coming time. RESISTANCE 1150
SUPPORT 1115
STOCK R2 R1 PP S1 S2
www.capitalvia.com 46
WEEKLY
20th Dec to 25th Dec 2010
TCS 1169.47 1155.08 1129.62 1115.23 1089.77
8/8/2019 Nifty 50 Reports for the Week (20th - 24th December - 2010)
http://slidepdf.com/reader/full/nifty-50-reports-for-the-week-20th-24th-december-2010 47/52
Technical Picture
Figure: 46 : Nifty50 Graph
R E S E A R C H
TECHNICAL OVERVIEW
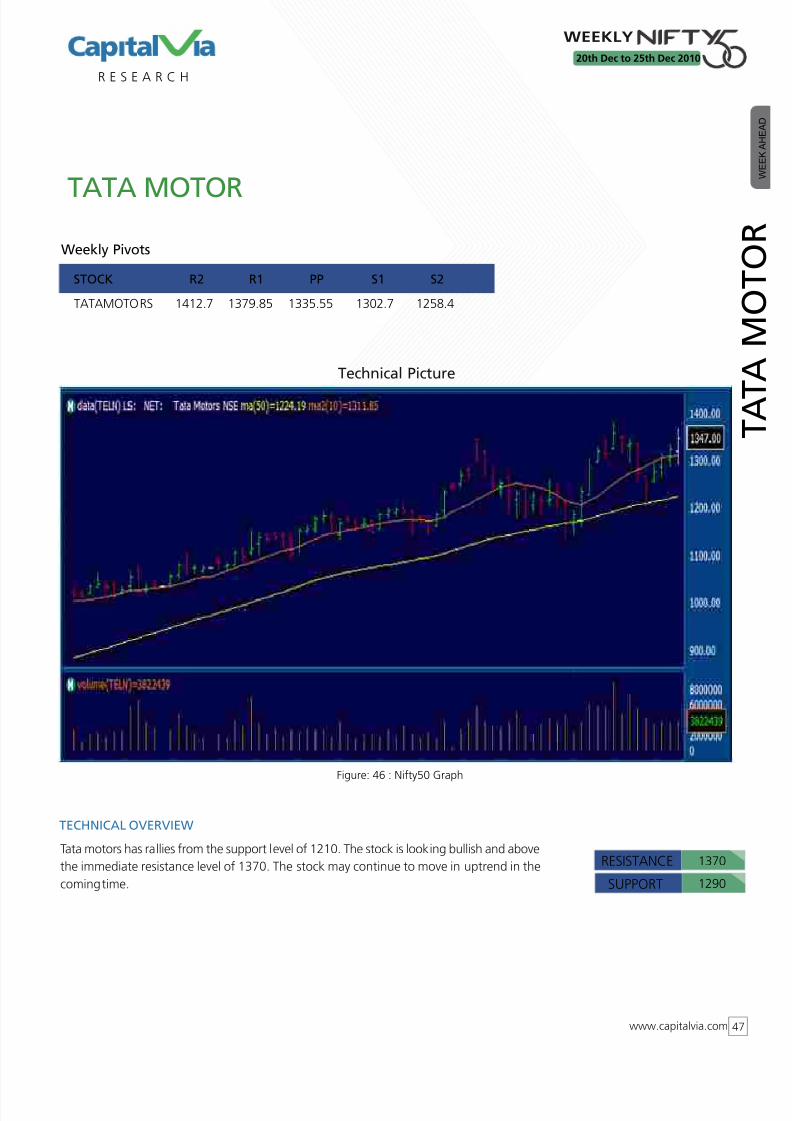
TATA MOTOR W E E K A H E A D
Weekly Pivots
T A T A
M O T O R
Tata motors has rallies from the support level of 1210. The stock is looking bullish and above
the immediate resistance level of 1370. The stock may continue to move in uptrend in the
coming time.
RESISTANCE 1370
SUPPORT 1290
STOCK R2 R1 PP S1 S2
www.capitalvia.com 47
WEEKLY
20th Dec to 25th Dec 2010
TATAMOTORS 1412.7 1379.85 1335.55 1302.7 1258.4

8/8/2019 Nifty 50 Reports for the Week (20th - 24th December - 2010)
http://slidepdf.com/reader/full/nifty-50-reports-for-the-week-20th-24th-december-2010 48/52
Technical Picture
Figure: 47 : Nifty50 Graph
R E S E A R C H
TECHNICAL OVERVIEW
TATA STEEL W E E K A H E A D
Weekly Pivots
T A
T A S T E E L
Tata steel has rallies from the support level of 575. The stock is looking bullish and may
continue the uptrend in the coming time to the level of 675 in the short run. RESISTANCE 675
SUPPORT 640
STOCK R2 R1 PP S1 S2
www.capitalvia.com 48
WEEKLY
20th Dec to 25th Dec 2010
TATASTEEL 675.8 668.1 654.95 647.25 634.1

8/8/2019 Nifty 50 Reports for the Week (20th - 24th December - 2010)
http://slidepdf.com/reader/full/nifty-50-reports-for-the-week-20th-24th-december-2010 49/52
Technical Picture
Figure: 48 : Nifty50 Graph
R E S E A R C H
TECHNICAL OVERVIEW
TATA POWER W E E K A H E A D
Weekly Pivots
T A T A
P O W E R
Tata power has bearish trend. The stock is now in a consolidation state and not looking
lucrative in the short term. So wait for proper breakout in it. RESISTANCE 1330
SUPPORT 1280
STOCK R2 R1 PP S1 S2
www.capitalvia.com 49
WEEKLY
20th Dec to 25th Dec 2010
TATAPOWER 1326.07 1311.73 1292.67 1278.33 1259.27

8/8/2019 Nifty 50 Reports for the Week (20th - 24th December - 2010)
http://slidepdf.com/reader/full/nifty-50-reports-for-the-week-20th-24th-december-2010 50/52

8/8/2019 Nifty 50 Reports for the Week (20th - 24th December - 2010)
http://slidepdf.com/reader/full/nifty-50-reports-for-the-week-20th-24th-december-2010 51/52
Technical Picture
Figure: 50 : Nifty50 Graph
R E S E A R C H
TECHNICAL OVERVIEW
WIPRO W E E K A H E A D
Weekly Pivots
W I P R O
Wipro has bullish trend. The stock has continued to trade in uptrend and above the
resistance level of 482 the stock may further continue the trend in the coming time. RESISTANCE 482
SUPPORT 460
STOCK R2 R1 PP S1 S2
www.capitalvia.com 51
WEEKLY
20th Dec to 25th Dec 2010
WIPRO 485.92 477.98 467.57 459.63 449.22

8/8/2019 Nifty 50 Reports for the Week (20th - 24th December - 2010)
http://slidepdf.com/reader/full/nifty-50-reports-for-the-week-20th-24th-december-2010 52/52
R E S E A R C H
Disclaimer
The information and views in this report, our website & all the service we provide are believed to be reliable, but we do
not accept any responsibility (or liability) for errors of fact or opinion. Users have the right to choose the product/s that
suits them the most.
Sincere efforts have been made to present the right investment perspective. The
information contained herein is based on Ahead and up on sources that we consider reliable.This material is for personal information and
based upon it & take no responsibility
The stock price projections shown are not necessarily indicative of future price performance. The information herein,
together with all estimates and forecasts, can change without notice.
Analyst or any person related to CapitalVia might be holding positions in the stocks recommended.
It is understood that anyone who is browsing through the site has done so at his free will and does not read any views
expressed as a recommendation for which either the site or its owners or anyone can be held responsible for.
Any surfing and reading of the information is the acceptance of this disclaimer.
All Rights Reserved.
Investment in Stocks has its own risks.
We, however, do notvouch for the accuracy or the completeness thereof. we are not
responsible for any loss incurred whatsoever for any financial profits or loss which
may arise from the recommendations above.
CapitalVia does not purport to be an invitation or an offer to buy or sell any financial instrument.
Our Clients (Paid Or Unpaid), Any third party or anyone else have no rights to forward or share our calls or SMS or Report
or Any Information Provided by us to/with anyone which is received directly or indirectly by them. If found so then
Serious Legal Actions can be taken.
WEEKLY
20th Dec to 25th Dec 2010