Embed Size (px)
Citation preview
RESEARCH ARTICLE Open Access
Molecular diversity, population structure, andlinkage disequilibrium in a worldwide collectionof tobacco (Nicotiana tabacum L.) germplasmAgostino Fricano1,3, Nicolas Bakaher2, Marcello Del Corvo1, Pietro Piffanelli1, Paolo Donini2, Alessandra Stella1,Nikolai V Ivanov2* and Carlo Pozzi2,4
Abstract
Background: The goals of our study were to assess the phylogeny and the population structure of tobaccoaccessions representing a wide range of genetic diversity; identify a subset of accessions as a core collectioncapturing most of the existing genetic diversity; and estimate, in the tobacco core collection, the extent of linkagedisequilibrium (LD) in seven genomic regions using simple sequence repeat (SSR) markers. To this end, a collectionof accessions were genotyped with SSR markers. Molecular diversity was evaluated and LD was analyzed acrossseven regions of the genome.
Results: A genotyping database for 312 tobacco accessions was profiled with 49 SSR markers. Principal CoordinateAnalysis (PCoA) and Bayesian cluster analysis revealed structuring of the tobacco population with regard tocommercial classes and six main clades were identified, which correspond to “Oriental”, Flue-Cured”, “Burley”,“Dark”, “Primitive”, and “Other” classes. Pairwise kinship was calculated between accessions, and an overall low levelof co-ancestry was observed. A set of 89 genotypes was identified that captured the whole genetic diversitydetected at the 49 loci. LD was evaluated on these genotypes, using 422 SSR markers mapping on seven linkagegroups. LD was estimated as squared correlation of allele frequencies (r2). The pattern of intrachromosomal LDrevealed that in tobacco LD extended up to distances as great as 75 cM with r2 > 0.05 or up to 1 cM with r2 > 0.2.The pattern of LD was clearly dependent on the population structure.
Conclusions: A global population of tobacco is highly structured. Clustering highlights the accessions with thesame market class. LD in tobacco extends up to 75 cM and is strongly dependent on the population structure.
BackgroundNicotiana tabacum is a non-obligatory, selfing amphidi-ploid species derived from a hybridization event betweenNicotiana sylvestris and Nicotiana tomentosiformis (sum-marized in [1]). As with other crops, breeding historyand yield management have contributed to its geneticerosion [2].Most of the existing variability is maintained at the
ex-situ U.S. Nicotiana Germplasm Collection [3],which contains around 1,900 accessions of N. tabacum,including 656 cultivars and 1,244 tobacco introduc-tions (TIs). The TIs probably capture most of the
genetic variability that existed before modern agricul-tural intensification [2]. Before modern breeding [4],main tobacco classes were distinguished, based onmethod of curing and biochemical characteristics, intoFlue-cured, Burley, Oriental, Cigar, Dark (air/firecured), and Primitive. Burley tobaccos are believed toderive from a mutation identified in 1864 in a strain ofMaryland tobacco, and Flue-cured are closely relatedto Dark fire-cured tobaccos [2].To capture most of the genetic diversity with the least
number of genotypes, subgroups out of larger popula-tions of unrelated lines (core collections) are conveni-ently set up. Core collections have been assembledbased on several algorithms [5-8] in several crops,including durum and bread wheats [5,6], barley [7],potato [8], maize [9], peanut [10], and rice [11]. The
* Correspondence: [email protected] Morris International R&D, Philip Morris Products SA, Quai Jeanrenaud5, 2000 Neuchâtel, SwitzerlandFull list of author information is available at the end of the article
Fricano et al. BMC Genetics 2012, 13:18http://www.biomedcentral.com/1471-2156/13/18
© 2012 Fricano et al; licensee BioMed Central Ltd. This is an Open Access article distributed under the terms of the Creative CommonsAttribution License (http://creativecommons.org/licenses/by/2.0), which permits unrestricted use, distribution, and reproduction inany medium, provided the original work is properly cited.
usage of molecular markers as descriptors of populationstructure provides the most reliable criteria whenassembling core collections [12].Linkage disequilibrium (LD) is defined as the non-ran-
dom association of alleles at two or more loci. In culti-vated plants, its extent is influenced by mating system,mutation rate, genetic drift, selection, recombinationrate, gene conversion, and population size and structure[13]. Recently, LD has been used in association mapping[14] and to locate quantitative trait loci (QTLs) ormajor genes, based on the co-segregation of specificmarker alleles and traits [15]. LD mapping has thepotential to outperform traditional mapping because ina random-mating population over several generations,only close linkage between markers and traits remains,thus facilitating fine mapping. High-density genome fin-gerprinting could unveil long- and short-range LD. Inthe first case, in species with large genomes, a lowernumber of molecular markers can be tested [16],although this will result in a lower mapping resolution.Conversely, short-range LD enables the fine mapping ofcausal polymorphisms, if large panels of markers areavailable [17].Data on the existence and extension of LD in different
plant species are not exhaustive and point to a diversi-fied picture, with decays of 1-2 kb in maize, up to 50cM in Arabidopsis, and more than 50 cM in barley cul-tivars [18] although lower extent of LD have beenreported in this species in collections of wild barley [19].Most of the studies have been carried out in Arabidopsisand maize (summarized in [20] and [21], respectively),but data are available also for rice [18], aspen [22],loblolly pine [23], barley [24], wheat [25], grape [26],sugar beet [27], and soybean [28]. For the Solanaceaefamily, studies have been conducted in tomato [29] andpotato [30].The development of simple sequence repeat (SSR)
markers has improved the characterization and use ofgenetic variation in N. tabacum [31]. SSRs have beenadopted to evaluate genetic diversity in a tobacco collec-tion by Moon et al. [3] and to study, in a collection of“Flue-cured” tobaccos, the changes in genetic diversityoccurring over the last 70 years [32]. These studiesprove the feasibility of using molecular markers toreconstruct the population structure in tobacco andrepresent the conceptual starting point for our study.The aims of this study were to:
1) Assess the phylogeny and the population structureof 312 tobacco accessions representing a wide rangeof genetic diversity2) Identify a subset of accessions as a core collectioncapturing most of the existing genetic diversity
3) Estimate, in the tobacco core collection, theextent of LD in seven genomic regions using SSRmarkers.
Results and discussionClustering of tobacco accessions based on SSR markerslargely reflects their typological classificationA set of 312 pure lines derived from worldwide acces-sions of N. tabacum (Table 1) was investigated to detectthe allelic variants at 49 SSR loci (Table 2). This panelof SSRs was selected based on technical reliability,uniqueness, and even distribution in the tobacco gen-ome, as described in two papers by Bindler et al.[31,33], and was used to infer phylogeny and geneticdiversity in the set of accessions, eventually leading tothe assembly of a core collection.The total number of alleles amplified at the 49 SSR
loci was 335, with an average call rate of 99%. The highlevel of polymorphism revealed for the 49 SSR sup-ported their usefulness for applications in diversityanalysis.The mean number of alleles detected for each locus
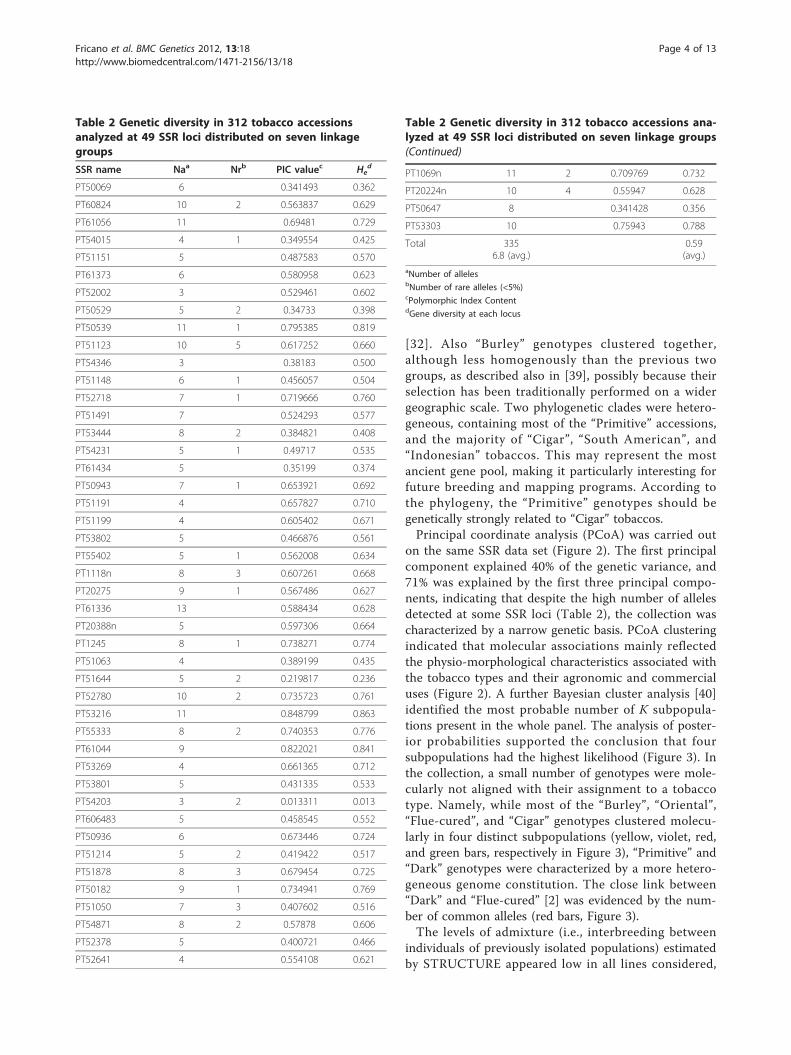
was 6.84 (s.d. = 2.57), ranging from 13 alleles for markerPT61336 to three alleles for PT54203 and PT52002(Table 2). This value is about half that recorded in pre-vious studies [3,32]. The difference may be due to thechoice of the marker loci as well as to the set of acces-sions analyzed. All tobacco accessions were genotypedas homozygous at the 49 SSR loci (Ho = 0 at all loci,Table 2), with a gene diversity (He) per locus spanningfrom 0.013 to 0.841 (average 0.59), a value lower thanthose reported in similar investigations carried out onTI accessions of tobacco [3]. The relatively low levels ofHd revealed by molecular markers in tobacco [34] canbe due to relatively recent evolutionary and breedingbottlenecks, through which only a small proportion ofthe variability of the gene pools of the progenitor spe-cies was funneled through [2]. The polymorphic indexcontents (PIC) was > 0.4 at almost all loci, withPT53216 and PT54203 having the highest and lowestvalues, respectively (Table 2).
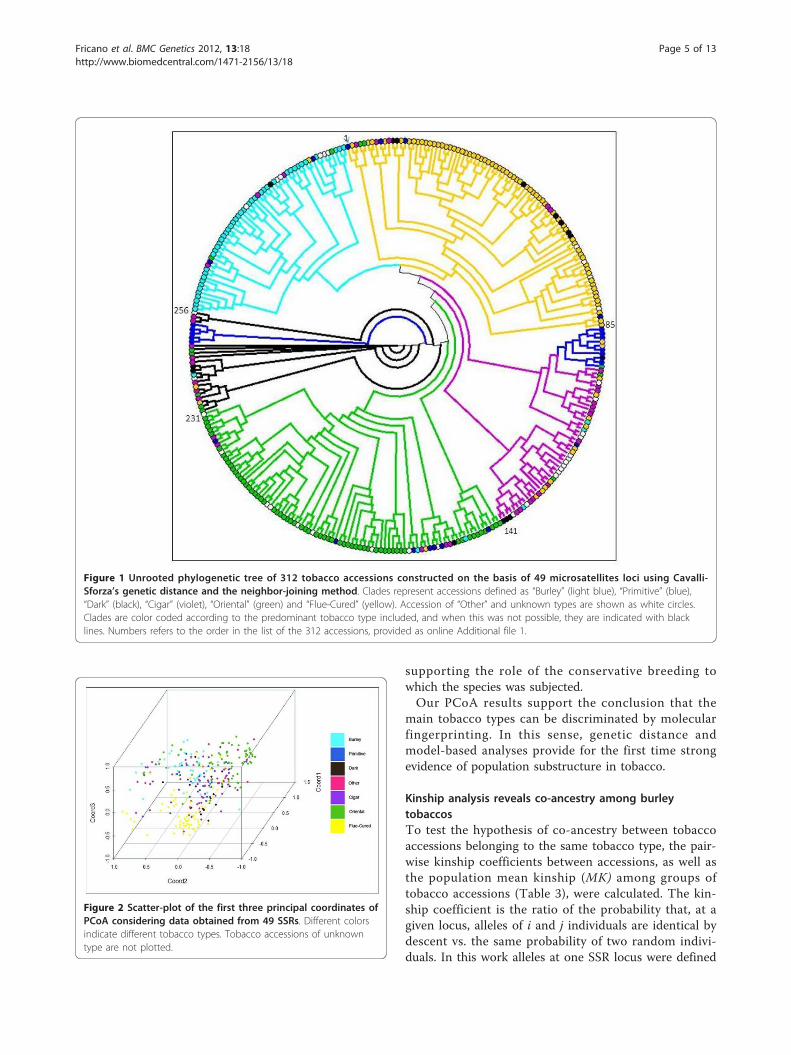
Tobacco structured populationsClustering of the 312 genotypes (Figure 1) revealed therelationships among accessions were distributed over sixmain clades. Accessions of “Oriental” clustered mainlyin two different clades encompassing 88 accessions(green clades in Figure 1). Only 14 of the accessionswere members of the heterogeneous group of tobaccoaccessions defined as “Other”, whereas another 10 wereclassified as different tobacco types. “Flue-Cured” linesclustered mainly in one clade (yellow clade in Figure 1),although this also contained two, seven, four, and eight
Fricano et al. BMC Genetics 2012, 13:18http://www.biomedcentral.com/1471-2156/13/18
Page 2 of 13
genotypes classified as “Oriental”, “Dark”, “Primitive”,and “Other”, respectively. Excluding six genotypesassigned to different clades, “Burley” accessions clus-tered in one clade (light-blue clade in Figure 1), whichalso contained nine members of the “Other” tobaccotype and six lines classified as “Primitive”, “Dark”,“Oriental”, and “Flue-cured”. Non-group associated gen-otypes ("Other” in Table 1) clustered in two differentclades (violet clades in Figure 1), one of which alsoincluded lines containing a large sub-set of the “Primi-tive” accessions (blue clade in Figure 1).Different tobacco types originated as the early
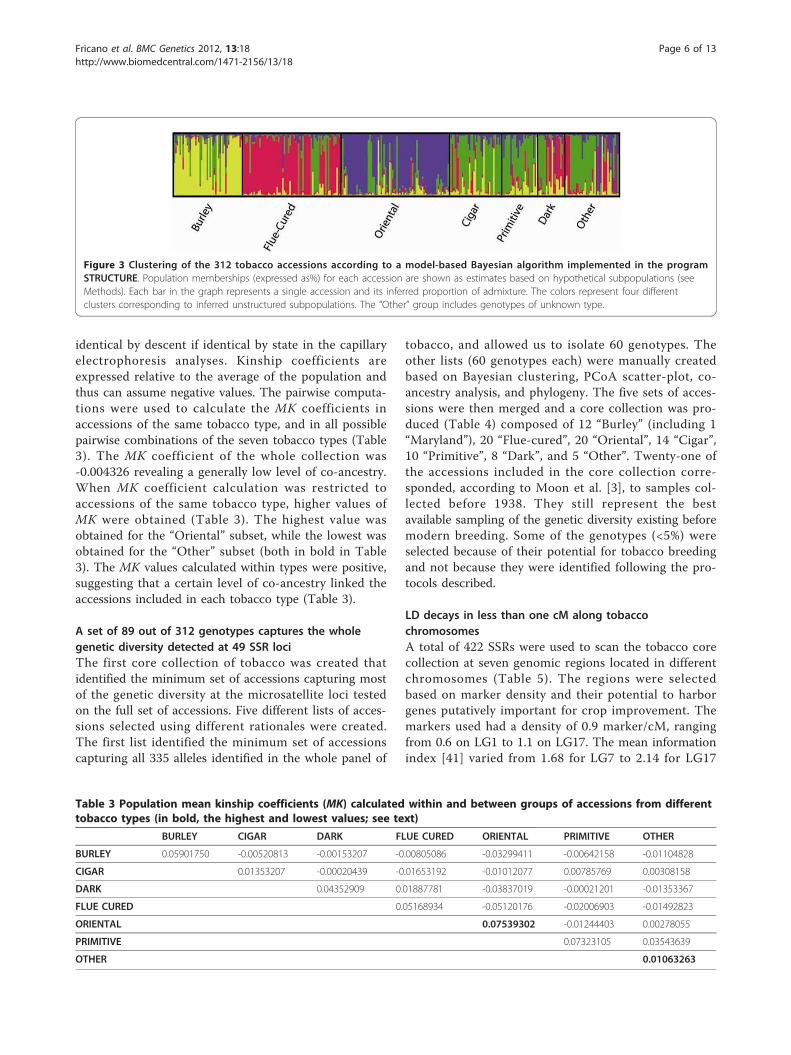
growers saved seeds for subsequent planting, beforethe initiation of science-based breeding [3]. Tobaccogrowers selected plants for cultivation in differentenvironments, for their agronomic performance usingdifferent agronomic practices, for the smoking charac-teristics of the leaf, and for adapting the leaf type todifferent leaf curing methods (i.e., the way the leaf isdried in a controlled way). The tobacco accessions weinvestigated clustered, based on molecular markers,according to their type, thus supporting the effective-ness of the breeding programs which have restrictedthe original breeding pool when selecting specificallyfor each market destination. The results are in agree-ment with previous data [31] supporting the correla-tion between type classifications and genetic distances[35]. The accessions that were found “contaminating”the homogeneity of groups (for example, “Cigar” vari-eties interspersed among “Oriental” varieties, in Figure2), may be the result of misclassifications, as reportedfor the TI accessions [36]. In addition, inaccurate sam-pling procedures carried out during tobacco cultiva-tion, or errors during varietal reproduction andconservation, can be the origin of the observed hetero-geneity of major phylogenetic clades.The distinct and homogeneous clustering of “Oriental”
and “Flue-cured” tobaccos, the most outstandingtobacco types, is most likely due to the ~400 years ofdivergent selection in Europe/Middle East for the“Oriental” types [37], and to the adoption of a stringentconservative breeding strategy for “Flue-cured” tobaccos[38]. In “Flue-cured” tobaccos, genetic variabilitydecreased significantly with the adoption of an“advanced cycle pedigree breeding”, i.e., the exclusiveusage of elite materials to produce breeding crosses
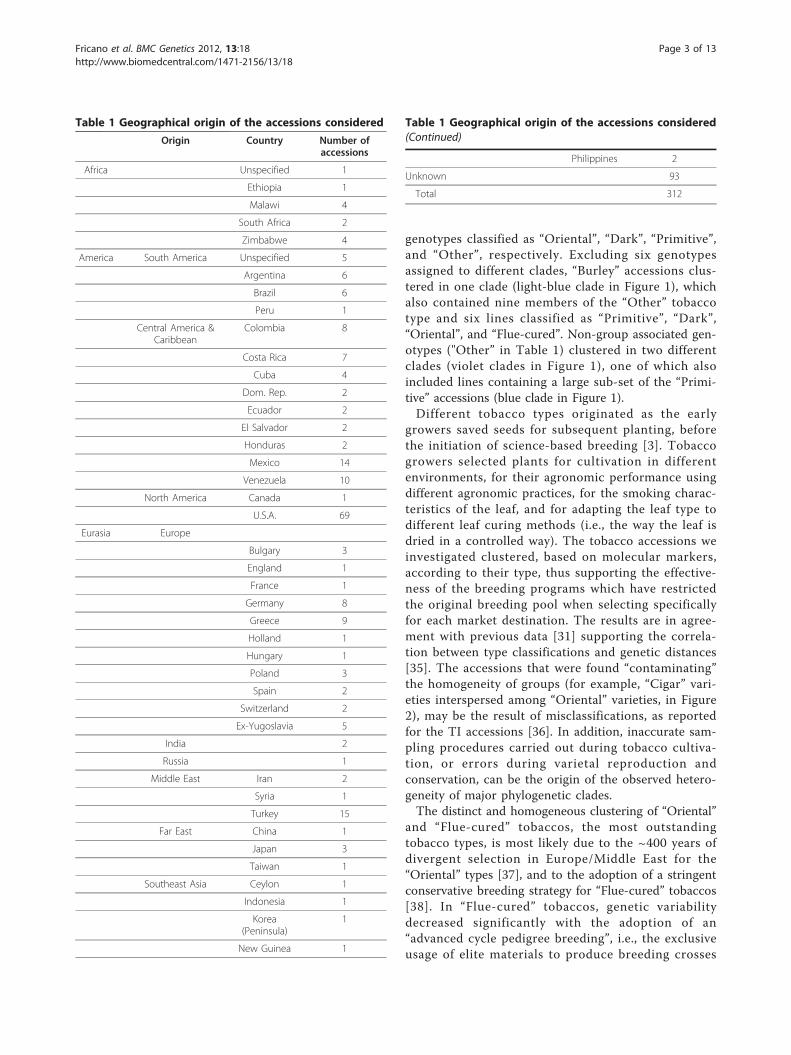
Table 1 Geographical origin of the accessions considered
Origin Country Number ofaccessions
Africa Unspecified 1
Ethiopia 1
Malawi 4
South Africa 2
Zimbabwe 4
America South America Unspecified 5
Argentina 6
Brazil 6
Peru 1
Central America &Caribbean
Colombia 8
Costa Rica 7
Cuba 4
Dom. Rep. 2
Ecuador 2
El Salvador 2
Honduras 2
Mexico 14
Venezuela 10
North America Canada 1
U.S.A. 69
Eurasia Europe
Bulgary 3
England 1
France 1
Germany 8
Greece 9
Holland 1
Hungary 1
Poland 3
Spain 2
Switzerland 2
Ex-Yugoslavia 5
India 2
Russia 1
Middle East Iran 2
Syria 1
Turkey 15
Far East China 1
Japan 3
Taiwan 1
Southeast Asia Ceylon 1
Indonesia 1
Korea(Peninsula)
1
New Guinea 1
Table 1 Geographical origin of the accessions considered(Continued)
Philippines 2
Unknown 93
Total 312
Fricano et al. BMC Genetics 2012, 13:18http://www.biomedcentral.com/1471-2156/13/18
Page 3 of 13
[32]. Also “Burley” genotypes clustered together,although less homogenously than the previous twogroups, as described also in [39], possibly because theirselection has been traditionally performed on a widergeographic scale. Two phylogenetic clades were hetero-geneous, containing most of the “Primitive” accessions,and the majority of “Cigar”, “South American”, and“Indonesian” tobaccos. This may represent the mostancient gene pool, making it particularly interesting forfuture breeding and mapping programs. According tothe phylogeny, the “Primitive” genotypes should begenetically strongly related to “Cigar” tobaccos.Principal coordinate analysis (PCoA) was carried out
on the same SSR data set (Figure 2). The first principalcomponent explained 40% of the genetic variance, and71% was explained by the first three principal compo-nents, indicating that despite the high number of allelesdetected at some SSR loci (Table 2), the collection wascharacterized by a narrow genetic basis. PCoA clusteringindicated that molecular associations mainly reflectedthe physio-morphological characteristics associated withthe tobacco types and their agronomic and commercialuses (Figure 2). A further Bayesian cluster analysis [40]identified the most probable number of K subpopula-tions present in the whole panel. The analysis of poster-ior probabilities supported the conclusion that foursubpopulations had the highest likelihood (Figure 3). Inthe collection, a small number of genotypes were mole-cularly not aligned with their assignment to a tobaccotype. Namely, while most of the “Burley”, “Oriental”,“Flue-cured”, and “Cigar” genotypes clustered molecu-larly in four distinct subpopulations (yellow, violet, red,and green bars, respectively in Figure 3), “Primitive” and“Dark” genotypes were characterized by a more hetero-geneous genome constitution. The close link between“Dark” and “Flue-cured” [2] was evidenced by the num-ber of common alleles (red bars, Figure 3).The levels of admixture (i.e., interbreeding between
individuals of previously isolated populations) estimatedby STRUCTURE appeared low in all lines considered,
Table 2 Genetic diversity in 312 tobacco accessionsanalyzed at 49 SSR loci distributed on seven linkagegroups
SSR name Naa Nrb PIC valuec Hed
PT50069 6 0.341493 0.362
PT60824 10 2 0.563837 0.629
PT61056 11 0.69481 0.729
PT54015 4 1 0.349554 0.425
PT51151 5 0.487583 0.570
PT61373 6 0.580958 0.623
PT52002 3 0.529461 0.602
PT50529 5 2 0.34733 0.398
PT50539 11 1 0.795385 0.819
PT51123 10 5 0.617252 0.660
PT54346 3 0.38183 0.500
PT51148 6 1 0.456057 0.504
PT52718 7 1 0.719666 0.760
PT51491 7 0.524293 0.577
PT53444 8 2 0.384821 0.408
PT54231 5 1 0.49717 0.535
PT61434 5 0.35199 0.374
PT50943 7 1 0.653921 0.692
PT51191 4 0.657827 0.710
PT51199 4 0.605402 0.671
PT53802 5 0.466876 0.561
PT55402 5 1 0.562008 0.634
PT1118n 8 3 0.607261 0.668
PT20275 9 1 0.567486 0.627
PT61336 13 0.588434 0.628
PT20388n 5 0.597306 0.664
PT1245 8 1 0.738271 0.774
PT51063 4 0.389199 0.435
PT51644 5 2 0.219817 0.236
PT52780 10 2 0.735723 0.761
PT53216 11 0.848799 0.863
PT55333 8 2 0.740353 0.776
PT61044 9 0.822021 0.841
PT53269 4 0.661365 0.712
PT53801 5 0.431335 0.533
PT54203 3 2 0.013311 0.013
PT606483 5 0.458545 0.552
PT50936 6 0.673446 0.724
PT51214 5 2 0.419422 0.517
PT51878 8 3 0.679454 0.725
PT50182 9 1 0.734941 0.769
PT51050 7 3 0.407602 0.516
PT54871 8 2 0.57878 0.606
PT52378 5 0.400721 0.466
PT52641 4 0.554108 0.621
Table 2 Genetic diversity in 312 tobacco accessions ana-lyzed at 49 SSR loci distributed on seven linkage groups(Continued)
PT1069n 11 2 0.709769 0.732
PT20224n 10 4 0.55947 0.628
PT50647 8 0.341428 0.356
PT53303 10 0.75943 0.788
Total 3356.8 (avg.)
0.59(avg.)
aNumber of allelesbNumber of rare alleles (<5%)cPolymorphic Index ContentdGene diversity at each locus
Fricano et al. BMC Genetics 2012, 13:18http://www.biomedcentral.com/1471-2156/13/18
Page 4 of 13
supporting the role of the conservative breeding towhich the species was subjected.Our PCoA results support the conclusion that the
main tobacco types can be discriminated by molecularfingerprinting. In this sense, genetic distance andmodel-based analyses provide for the first time strongevidence of population substructure in tobacco.
Kinship analysis reveals co-ancestry among burleytobaccosTo test the hypothesis of co-ancestry between tobaccoaccessions belonging to the same tobacco type, the pair-wise kinship coefficients between accessions, as well asthe population mean kinship (MK) among groups oftobacco accessions (Table 3), were calculated. The kin-ship coefficient is the ratio of the probability that, at agiven locus, alleles of i and j individuals are identical bydescent vs. the same probability of two random indivi-duals. In this work alleles at one SSR locus were defined
Figure 2 Scatter-plot of the first three principal coordinates ofPCoA considering data obtained from 49 SSRs. Different colorsindicate different tobacco types. Tobacco accessions of unknowntype are not plotted.
Figure 1 Unrooted phylogenetic tree of 312 tobacco accessions constructed on the basis of 49 microsatellites loci using Cavalli-Sforza’s genetic distance and the neighbor-joining method. Clades represent accessions defined as “Burley” (light blue), “Primitive” (blue),“Dark” (black), “Cigar” (violet), “Oriental” (green) and “Flue-Cured” (yellow). Accession of “Other” and unknown types are shown as white circles.Clades are color coded according to the predominant tobacco type included, and when this was not possible, they are indicated with blacklines. Numbers refers to the order in the list of the 312 accessions, provided as online Additional file 1.
Fricano et al. BMC Genetics 2012, 13:18http://www.biomedcentral.com/1471-2156/13/18
Page 5 of 13
identical by descent if identical by state in the capillaryelectrophoresis analyses. Kinship coefficients areexpressed relative to the average of the population andthus can assume negative values. The pairwise computa-tions were used to calculate the MK coefficients inaccessions of the same tobacco type, and in all possiblepairwise combinations of the seven tobacco types (Table3). The MK coefficient of the whole collection was-0.004326 revealing a generally low level of co-ancestry.When MK coefficient calculation was restricted toaccessions of the same tobacco type, higher values ofMK were obtained (Table 3). The highest value wasobtained for the “Oriental” subset, while the lowest wasobtained for the “Other” subset (both in bold in Table3). The MK values calculated within types were positive,suggesting that a certain level of co-ancestry linked theaccessions included in each tobacco type (Table 3).
A set of 89 out of 312 genotypes captures the wholegenetic diversity detected at 49 SSR lociThe first core collection of tobacco was created thatidentified the minimum set of accessions capturing mostof the genetic diversity at the microsatellite loci testedon the full set of accessions. Five different lists of acces-sions selected using different rationales were created.The first list identified the minimum set of accessionscapturing all 335 alleles identified in the whole panel of
tobacco, and allowed us to isolate 60 genotypes. Theother lists (60 genotypes each) were manually createdbased on Bayesian clustering, PCoA scatter-plot, co-ancestry analysis, and phylogeny. The five sets of acces-sions were then merged and a core collection was pro-duced (Table 4) composed of 12 “Burley” (including 1“Maryland”), 20 “Flue-cured”, 20 “Oriental”, 14 “Cigar”,10 “Primitive”, 8 “Dark”, and 5 “Other”. Twenty-one ofthe accessions included in the core collection corre-sponded, according to Moon et al. [3], to samples col-lected before 1938. They still represent the bestavailable sampling of the genetic diversity existing beforemodern breeding. Some of the genotypes (<5%) wereselected because of their potential for tobacco breedingand not because they were identified following the pro-tocols described.
LD decays in less than one cM along tobaccochromosomesA total of 422 SSRs were used to scan the tobacco corecollection at seven genomic regions located in differentchromosomes (Table 5). The regions were selectedbased on marker density and their potential to harborgenes putatively important for crop improvement. Themarkers used had a density of 0.9 marker/cM, rangingfrom 0.6 on LG1 to 1.1 on LG17. The mean informationindex [41] varied from 1.68 for LG7 to 2.14 for LG17
Figure 3 Clustering of the 312 tobacco accessions according to a model-based Bayesian algorithm implemented in the programSTRUCTURE. Population memberships (expressed as%) for each accession are shown as estimates based on hypothetical subpopulations (seeMethods). Each bar in the graph represents a single accession and its inferred proportion of admixture. The colors represent four differentclusters corresponding to inferred unstructured subpopulations. The “Other” group includes genotypes of unknown type.
Table 3 Population mean kinship coefficients (MK) calculated within and between groups of accessions from differenttobacco types (in bold, the highest and lowest values; see text)
BURLEY CIGAR DARK FLUE CURED ORIENTAL PRIMITIVE OTHER
BURLEY 0.05901750 -0.00520813 -0.00153207 -0.00805086 -0.03299411 -0.00642158 -0.01104828
CIGAR 0.01353207 -0.00020439 -0.01653192 -0.01012077 0.00785769 0.00308158
DARK 0.04352909 0.01887781 -0.03837019 -0.00021201 -0.01353367
FLUE CURED 0.05168934 -0.05120176 -0.02006903 -0.01492823
ORIENTAL 0.07539302 -0.01244403 0.00278055
PRIMITIVE 0.07323105 0.03543639
OTHER 0.01063263
Fricano et al. BMC Genetics 2012, 13:18http://www.biomedcentral.com/1471-2156/13/18
Page 6 of 13
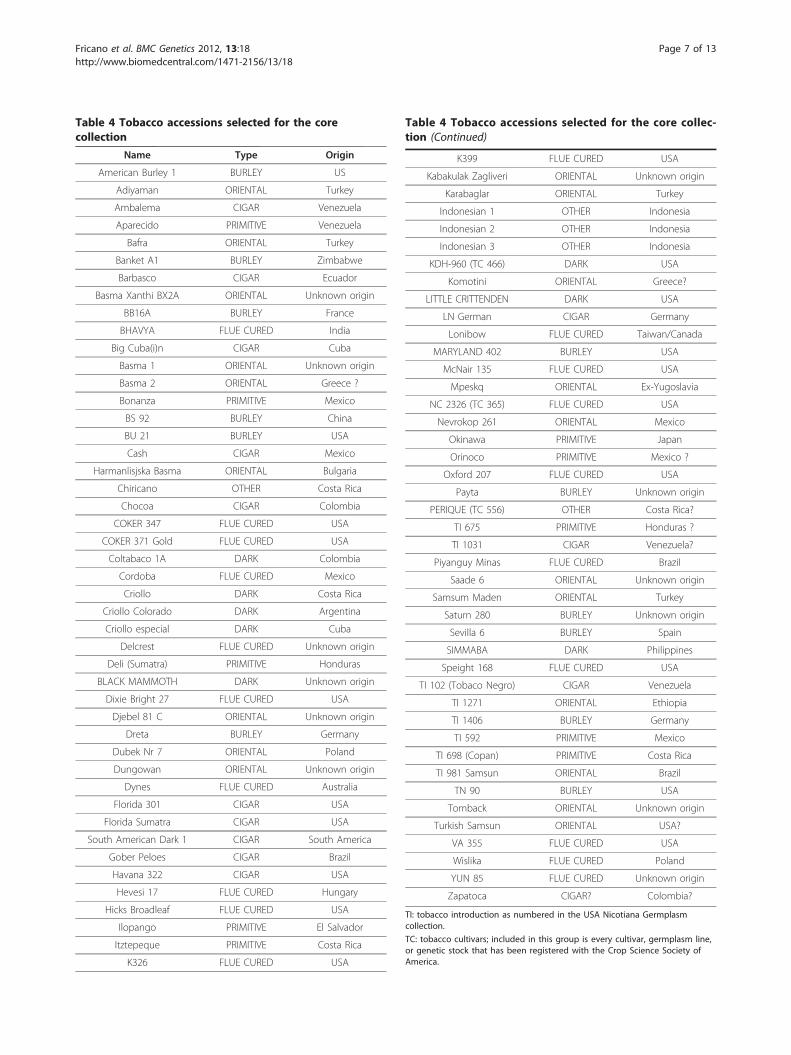
Table 4 Tobacco accessions selected for the corecollection
Name Type Origin
American Burley 1 BURLEY US
Adiyaman ORIENTAL Turkey
Ambalema CIGAR Venezuela
Aparecido PRIMITIVE Venezuela
Bafra ORIENTAL Turkey
Banket A1 BURLEY Zimbabwe
Barbasco CIGAR Ecuador
Basma Xanthi BX2A ORIENTAL Unknown origin
BB16A BURLEY France
BHAVYA FLUE CURED India
Big Cuba(i)n CIGAR Cuba
Basma 1 ORIENTAL Unknown origin
Basma 2 ORIENTAL Greece ?
Bonanza PRIMITIVE Mexico
BS 92 BURLEY China
BU 21 BURLEY USA
Cash CIGAR Mexico
Harmanlisjska Basma ORIENTAL Bulgaria
Chiricano OTHER Costa Rica
Chocoa CIGAR Colombia
COKER 347 FLUE CURED USA
COKER 371 Gold FLUE CURED USA
Coltabaco 1A DARK Colombia
Cordoba FLUE CURED Mexico
Criollo DARK Costa Rica
Criollo Colorado DARK Argentina
Criollo especial DARK Cuba
Delcrest FLUE CURED Unknown origin
Deli (Sumatra) PRIMITIVE Honduras
BLACK MAMMOTH DARK Unknown origin
Dixie Bright 27 FLUE CURED USA
Djebel 81 C ORIENTAL Unknown origin
Dreta BURLEY Germany
Dubek Nr 7 ORIENTAL Poland
Dungowan ORIENTAL Unknown origin
Dynes FLUE CURED Australia
Florida 301 CIGAR USA
Florida Sumatra CIGAR USA
South American Dark 1 CIGAR South America
Gober Peloes CIGAR Brazil
Havana 322 CIGAR USA
Hevesi 17 FLUE CURED Hungary
Hicks Broadleaf FLUE CURED USA
Ilopango PRIMITIVE El Salvador
Itztepeque PRIMITIVE Costa Rica
K326 FLUE CURED USA
Table 4 Tobacco accessions selected for the core collec-tion (Continued)
K399 FLUE CURED USA
Kabakulak Zagliveri ORIENTAL Unknown origin
Karabaglar ORIENTAL Turkey
Indonesian 1 OTHER Indonesia
Indonesian 2 OTHER Indonesia
Indonesian 3 OTHER Indonesia
KDH-960 (TC 466) DARK USA
Komotini ORIENTAL Greece?
LITTLE CRITTENDEN DARK USA
LN German CIGAR Germany
Lonibow FLUE CURED Taiwan/Canada
MARYLAND 402 BURLEY USA
McNair 135 FLUE CURED USA
Mpeskq ORIENTAL Ex-Yugoslavia
NC 2326 (TC 365) FLUE CURED USA
Nevrokop 261 ORIENTAL Mexico
Okinawa PRIMITIVE Japan
Orinoco PRIMITIVE Mexico ?
Oxford 207 FLUE CURED USA
Payta BURLEY Unknown origin
PERIQUE (TC 556) OTHER Costa Rica?
TI 675 PRIMITIVE Honduras ?
TI 1031 CIGAR Venezuela?
Piyanguy Minas FLUE CURED Brazil
Saade 6 ORIENTAL Unknown origin
Samsum Maden ORIENTAL Turkey
Saturn 280 BURLEY Unknown origin
Sevilla 6 BURLEY Spain
SIMMABA DARK Philippines
Speight 168 FLUE CURED USA
TI 102 (Tobaco Negro) CIGAR Venezuela
TI 1271 ORIENTAL Ethiopia
TI 1406 BURLEY Germany
TI 592 PRIMITIVE Mexico
TI 698 (Copan) PRIMITIVE Costa Rica
TI 981 Samsun ORIENTAL Brazil
TN 90 BURLEY USA
Tomback ORIENTAL Unknown origin
Turkish Samsun ORIENTAL USA?
VA 355 FLUE CURED USA
Wislika FLUE CURED Poland
YUN 85 FLUE CURED Unknown origin
Zapatoca CIGAR? Colombia?
TI: tobacco introduction as numbered in the USA Nicotiana Germplasmcollection.
TC: tobacco cultivars; included in this group is every cultivar, germplasm line,or genetic stock that has been registered with the Crop Science Society ofAmerica.
Fricano et al. BMC Genetics 2012, 13:18http://www.biomedcentral.com/1471-2156/13/18
Page 7 of 13

(Table 5). Only 6.45%, 1.92%, and 6.06% of SSR markers,on LG1, LG7, and LG22, respectively, were found to bemonomorphic. The lowest average number of alleles perlocus was on LG7 (4.57 alleles per SSR), and the highestwas on LG22 (7.8 per SSR; Table 5).The square root-transformed distribution of pairwise
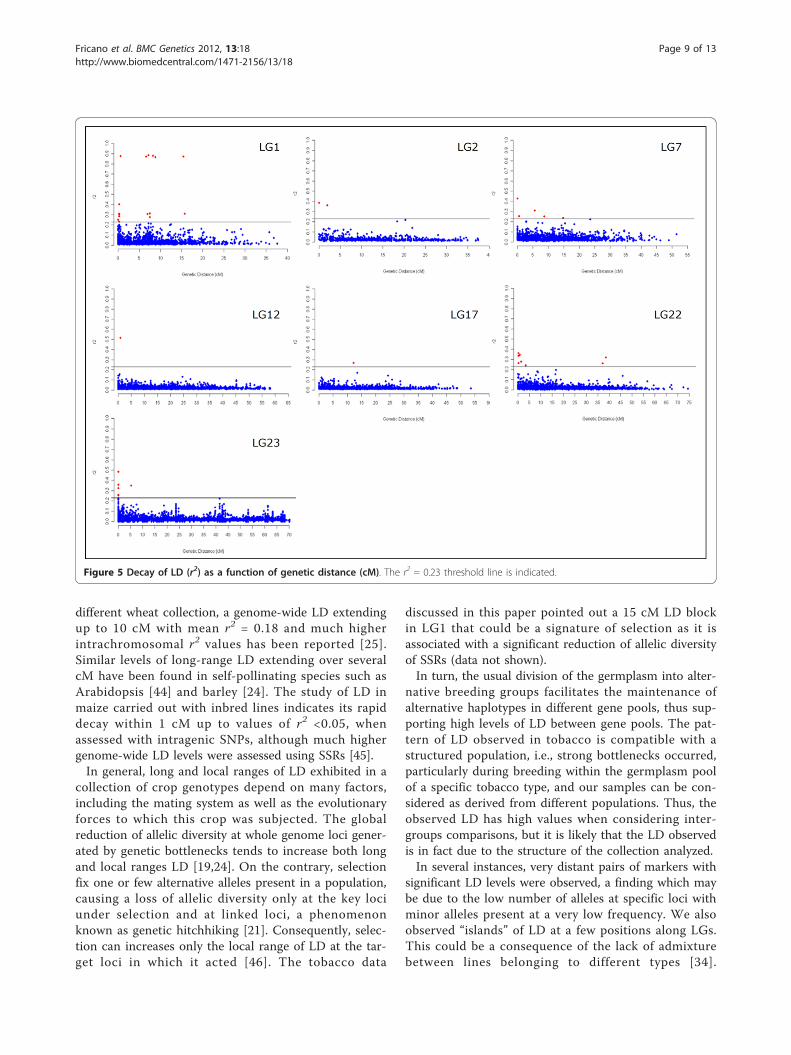
r2 values of SSR loci mapping on different chromosomes(unlinked r2 values) allowed us to set an appropriatethreshold at a value of 0.23 beyond which LD valueswere considered significant. The value of 0.23 calculatedfor this LD threshold excluded most of the r2 values ofSSRs mapping to the same chromosomal region (linkedr2 values). Most of the marker pairs showing r2 valuesabove the threshold (on average 0.25% of the total pair-wise values) were from loci mapping within a few cM(Figure 4), although outliers were also observed (Figure5). On LG1, the pattern of LD rapidly decayed withinless than 1 cM, although a total of 15 pairwise r2 valuesof SSR loci mapping within 15 cM showed significantLD values (Figure 5). This block of significant LDencompasses 15 SSRs (PT20234n, PT50467, PT50754,PT50862, PT51015, PT51174, PT51438, PT51479,PT51966, PT54092, PT54727, PT54759, PT54767,
PT54916 and PT61209) [33], 4 of which (PT51438,PT51479, PT51966 and PT54916) have an expected het-erozygosity close to zero, while the remaining 11showed an expected heterozygosity significantly lowerthan the mean expected heterozygosity of the SSRs ofLG1 (data not shown). Taken together these data couldpoint out that the 15 cM LD block revealed on LG1 wasgenerated owing to a loss of allele diversity occurred inSSRs of this interval map. As expected, the trend wasthat LD decreased with genetic distance. On LG2, threepairs of markers had r2 values exceeding 0.36. Along thesame LG, a second region of r2 values close to thethreshold was observed in comparisons involving mar-kers at a distance around 20 cM. On LG7, pairs of lociwith significant LD were observed within 15 cMbetween markers, and close to the threshold at 25 cM.On both LG12 and LG17, only one pair of SSR loci hadsignificant r2 values. On LG12, the two loci were within5 cM, while on LG17, the distance was around 12 cM.On LG22, eight pairwise r2 values were above thethreshold, two of which mapped within 35 cM. OnLG23, five pairwise r2 values were found between locimapping within 5 cM.The seven regions where the extent of LD was investi-
gated encompass a significant sample of the totaltobacco genome (12%; Gregor Bindler, personal commu-nication). The extent (inter-marker distance in cM) ofLD turned out to be limited to one cM or less, which isa very limited value, especially considering that in highlystructured collections LD is expected to be overesti-mated [42]. Similar results were obtained for the sub-populations of tobacco based on tobacco type and iden-tified with the clustering analysis, although, owing to thelow number of genotypes, the significance of P valuesdecreased with the exception of the “Flue-cured” sub-population (data not shown).In tomato, the extent of LD was comparable to that of
tobacco, but its magnitude was much higher [29]. Inwheat, LD has a behavior similar to that of tobacco [43],with a low magnitude of LD detected over long seg-ments of chromosomes. In a report concerning a
Table 5 Markers distribution and statistics concerning the selected genomic regions (standard errors in brackets)
Linkage Group No. of SSRs Interval spanned (cM) Mean Information index Mean Number. of alleles % Polymorphic loci
1 62 40 1.70 (0.11) 6.1 (0.57) 93.55
2 38 40 2.00 (0.08) 5.7 (0.48) 100.00
7 50 52 1.68 (0.10) 4.57 (0.38) 98.00
12 71 65 1.99 (0.07) 6.28 (0,41) 100.00
17 55 57 2.14 (0.09) 7.6 (0.63) 100.00
22 66 74 1.98 (0.06) 7.8 (0.56) 98.00
23 80 70 1.74 (0.80) 5.24 (0.42) 100.00
Total 422 398 Avg. 6.18
Figure 4 Average long-range LD between SSR loci. Pair-wisemarkers have been classified based on independently intermarkergenetic distance. LD analysis was performed for each LG. For eachclass, the average r2 value is reported.
Fricano et al. BMC Genetics 2012, 13:18http://www.biomedcentral.com/1471-2156/13/18
Page 8 of 13
different wheat collection, a genome-wide LD extendingup to 10 cM with mean r2 = 0.18 and much higherintrachromosomal r2 values has been reported [25].Similar levels of long-range LD extending over severalcM have been found in self-pollinating species such asArabidopsis [44] and barley [24]. The study of LD inmaize carried out with inbred lines indicates its rapiddecay within 1 cM up to values of r2 <0.05, whenassessed with intragenic SNPs, although much highergenome-wide LD levels were assessed using SSRs [45].In general, long and local ranges of LD exhibited in a
collection of crop genotypes depend on many factors,including the mating system as well as the evolutionaryforces to which this crop was subjected. The globalreduction of allelic diversity at whole genome loci gener-ated by genetic bottlenecks tends to increase both longand local ranges LD [19,24]. On the contrary, selectionfix one or few alternative alleles present in a population,causing a loss of allelic diversity only at the key lociunder selection and at linked loci, a phenomenonknown as genetic hitchhiking [21]. Consequently, selec-tion can increases only the local range of LD at the tar-get loci in which it acted [46]. The tobacco data
discussed in this paper pointed out a 15 cM LD blockin LG1 that could be a signature of selection as it isassociated with a significant reduction of allelic diversityof SSRs (data not shown).In turn, the usual division of the germplasm into alter-
native breeding groups facilitates the maintenance ofalternative haplotypes in different gene pools, thus sup-porting high levels of LD between gene pools. The pat-tern of LD observed in tobacco is compatible with astructured population, i.e., strong bottlenecks occurred,particularly during breeding within the germplasm poolof a specific tobacco type, and our samples can be con-sidered as derived from different populations. Thus, theobserved LD has high values when considering inter-groups comparisons, but it is likely that the LD observedis in fact due to the structure of the collection analyzed.In several instances, very distant pairs of markers with
significant LD levels were observed, a finding which maybe due to the low number of alleles at specific loci withminor alleles present at a very low frequency. We alsoobserved “islands” of LD at a few positions along LGs.This could be a consequence of the lack of admixturebetween lines belonging to different types [34].
Figure 5 Decay of LD (r2) as a function of genetic distance (cM). The r2 = 0.23 threshold line is indicated.
Fricano et al. BMC Genetics 2012, 13:18http://www.biomedcentral.com/1471-2156/13/18
Page 9 of 13
Alternatively, it could be the result of the presence ofchromosomal translocations and/or inversions [47], orof the presence in the germplasm of genotypes withregions hosting hemizygous DNA stretches opposed topairing and recombination [48].In summary, the values of LD reported here have a
similar pattern for all chromosomal regions tested, withfew exceptions. These could be due to inaccuracies inthe genetic distances reported in the linkage map, tomisplacement of genetic marker loci, or to the low fre-quencies of specific alleles. The extent of LD measuredin this work indicated that tobacco is not amenable togenome-wide association studies. Although it is truethat a few marker pairs showed LD exceeding thethreshold, the number of pairs was very low and did notexceed the number of false positive results expected forthe significance testing procedure applied. Therefore, weconcluded that the LD observed in the panel of tobaccoaccessions analyzed was insufficient to support theundertaking of subsequent long range association ana-lyses, although the r2 value detected are encouraging tocarry association mapping when more molecular mar-kers will become available.A higher density of markers would probably make it
possible to use LD to perform candidate-gene-based stu-dies. We cannot exclude the possibility that by re-evalu-ating the LD using a higher density of markers andconcentrating on shorter regions, we would observe adifferent situation, as LD has been shown to be popula-tion and locus specific [42].
ConclusionsOur study demonstrated a low level of genetic diversityand a fast decay of LD in the seven regions that havebeen analyzed in the tobacco genome. Relatively recentevolutionary and breeding bottlenecks could account forthe low levels of Hd revealed by molecular markers.Tobacco accessions were shown to cluster according totheir market type, which, combined with a low level ofadmixture, is a further proof of the effectiveness of theconservative breeding programs. In our study, we haveprovided evidence of population substructure in tobaccoand proposed, for the first time, a core collection. Thelevel of LD observed was influenced by the structure ofthe population and by the recombinational history ofthe population, and it decayed in within very shortintervals (less than 1 cM).
MethodsPlant materialA total of 312 tobacco accessions (Additional file 1)maintained at the Philip Morris International collection,Neuchatel (CH), were investigated in this study. Acces-sions were classified as described in Chaplin et al. [36]:
“Burley” & “Maryland": 45 entries; “Flue-cured": 70;“Orientals": 77; “Cigar tobaccos” (filler, wrapper, binder):36; “Primitives": 23; “Dark tobacco” & “Fire-cured": 22;“Other": 18 ("Perique”, 1; “South American”, 4; “Semi-oriental” 1; “Indonesian” and “other”, 12). Twenty-oneaccessions were of unknown type.The majority of accessions were originally obtained
from the U.S. Nicotiana Germplasm collection inOxford, NC (USA); the accessions used representtobacco collected from or cultivated in 45 differentcountries. Seeds were germinated and grown undergreenhouse conditions until plants reached a height ofapproximately 20 cm before DNA extraction.
DNA extraction and genotypingLeaves from 5 plants were pooled and genomic DNAwas isolated from 6 mg of lyophilized material in 96-well microtube plates using Macherey Nagel® NucleoS-pin Plant II kit and following manufacturer’s instruc-tions. The quality and the concentration of the genomicDNA were assessed using electrophoretic analysis andPicogreen® technology (Invitrogen, San Diego, CA),respectively. Genomic DNA was normalized at 20 ng/μLbefore genotyping.All SSR loci considered in this study were amplified
using a three-primer system for indirect labelling PCRfragments [49]. The amplification of SSR loci was car-ried out in 384-well plates (Applied Biosystems, FosterCity, USA) in Eppendorf Mastercycler EPgradient ther-malcyclers (Eppendorf, Hamburg, Germany). Each reac-tion was performed in 10 μl with the following mixturecomposition: 20 ng of DNA, 1.5 mM of MgCl2, 0.4 μMof the first primer, 0.2 μM of the second primer withM13 complementary tail, 0.2 μM of M13 fluorescentlabelled primer, and 0.25 U of Taq HotStart DNA poly-merase QIAGEN (Valencia, USA). The reactions weresubjected to the following thermal protocol: after aninitial denaturation step at 95 C for 15 min, amplifica-tion reactions were subjected to 11 cycles at 95 C for 30s, 58 C for 45 s and 72 C for 90 s, decreasing annealingtemperature by 0.7 C in each cycle. The reactions werefurther subjected to 29 cycles of 95 C for 30 s, 50 C for45 s, and 72 C for 90 s. A final elongation step of 10min was applied. 0.25 μL of amplification products, eachof which was labeled with the four ABI dyes, was mixedwith 10 μL of formamide, loaded in a ABI3730 DNAanalyzer (Applied Biosystems), and analyzed throughcapillary electrophoresis.Fragment analysis was carried out with GeneMapper®
4.0 software (Applied Biosystems, Foster City, USA)using stutter peaks of known sizes as internal controls.Automatic allele calls were subsequently assessedreviewing all electropherograms. Fragments of lengthsnot comparable to the control or with fluorescent
Fricano et al. BMC Genetics 2012, 13:18http://www.biomedcentral.com/1471-2156/13/18
Page 10 of 13
intensities lower than 75 percent of the peak assumed astrue allele were considered artefacts. Genotyping tableswere exported as tab-delimited files and formatted inMicrosoft Excel (Redmond, USA) to conduct phyloge-netic and statistical analysis.
Data analysisBasic statistics (number of alleles detected at each locus,allelic and genotypic frequencies, call rate, heterozygos-ity, and PIC) were calculated using the R [50] and Gen-AlEx packages [51].PHYLIP package gendist software [52] was used to
calculate pairwise Cavalli-Sforza’s genetic distancesamong the 312 tobacco accessions. Triangle matrix ofpairwise genetic distances was subsequently formattedin NEXUS file to cluster the tobacco accessions withNeighbor-Joining using the SplitsTree4 software [53].To better plot the resulting large clustering of tobaccoaccessions, a circular cladogram was generated withDendroscope software [54].To assess the population structure of the tobacco-
sample accessions, a multivariate analysis and a heuristicmethod based on Bayesian clustering algorithms wereutilized. Principal coordinate analysis (PCoA) was initi-ally performed on the SSR data using the “ape” packagein the R software. The clustering method based on theBayesian-model implemented in the software programSTRUCTURE [40] was used on the same data set tobetter detect population substructures. This clusteringmethod is based on an algorithm that assigns genotypesto homogeneous groups in such a way that departurefrom neutral equilibrium is minimized among genotypeswithin each group, but it is absent among groups. Thenumber of potential subpopulations varied from 2 to 10,and their contribution to the genotypes of the acces-sions was calculated based on 5x10⁵ iteration burn-insand 5x10⁵ iteration sampling periods. Eventually, themost probable number (K) of subpopulations was identi-fied following Evanno et al. [55].Pairwise coefficients of kinship (Fij), a measure of
relatedness between individuals i and j based on mole-cular markers, were calculated using SPAGeDi software[56]). Mean kinship (mk) coefficients were obtainedaveraging the pairwise kinship coefficients of each singleaccession with all other accessions of the whole collec-tion [40]. In addition, the computation of mean kinshipcoefficients was restricted to pairwise kinship coeffi-cients of accessions of the same tobacco type (mki), aswell as for all possible pairs of accessions of differenttobacco types (mkp). In order to assess the higher levelof relatedness of tobacco accessions of the same type,population kinship coefficients (MK) were calculatedarithmetically averaging the mki coefficients of tobacco
accessions sharing the same tobacco type. Similarly, thelevel of relatedness of accessions of two differenttobacco types was assessed averaging mkp coefficientscalculated for all possible pairs.
Core collection samplingAn algorithm was developed and implemented thatallowed us to identify the least number of accessions cap-turing all of the alleles that were unique in the set oftobacco accessions. A first screening with one SSR markerwas performed on a random sub-set of the accessions, fol-lowed by a pairwise comparison with the remaining acces-sions. Only accessions showing at least one unique allelewere used in the following iterative analysis, leading to alist of accessions that represented all of the alleles. Becausethe group and the number of accessions in the final listcan change, depending on the original order of the list, theaccessions were randomly re-ordered and this process wasrepeated 2 x10⁵ times. This method allowed for the selec-tion of 60 genotypes. Additional methods were used tocreate three more lists of accessions, each with 60 geno-types showing the most extreme values of PCA, mk coeffi-cients, and pairwise genetic distance. A fifth list of 60genotypes was created by picking individuals with thehighest values in the Q matrix of the STRUCTURE analy-sis. The five lists of genotypes were then merged and aconsensus list of 89 genotypes was compiled.
Analysis of linkage disequilibrium (LD)The squared allele-frequency correlation r2, was calcu-lated for all possible combinations of alleles to estimatethe extent of LD in the core collection of tobacco acces-sions, using the software package TASSEL 2.01 [57].The weighted average of r2 values was obtained byfurther weighting for the corresponding allele frequen-cies. The significance of pairwise LD (p-value) among allpossible pairs was also evaluated by TASSEL with therapid permutation test.To avoid the bias imposed by the usage of the
squared-allele-frequency correlation r2 in the presenceof rare alleles, only alleles having a frequency largerthan 0.1 were considered.The square root of each pairwise r² among allelic var-
iants of physically unlinked SSR loci was calculated. The95th percentile of this approximate normal distributionwas assumed as the threshold of the r² value to declarethe presence of LD among molecular markers [58].
AcknowledgementsWe wish to thank the personnel of the greenhouse atPMI and Gregor Bindler for their crucial help in provid-ing the plant material. We also wish to thank LyndaConroy for providing writing assistance.
Fricano et al. BMC Genetics 2012, 13:18http://www.biomedcentral.com/1471-2156/13/18
Page 11 of 13
Additional material
Additional file 1: List of the 312 varieties.
Author details1Parco Tecnologico Padano, via Einstein, Loc. C.na Codazza, 26900 Lodi, Italy.2Philip Morris International R&D, Philip Morris Products SA, Quai Jeanrenaud5, 2000 Neuchâtel, Switzerland. 3Bayer CropScience, Technologiepark 38,9052 Zwijnaarde, Belgium. 4Fondazione Edmund Mach, 38010 San Micheleall’Adige, TN, Italy.
Authors’ contributionsAF carried out the molecular genetics experiments, contributed to dataanalysis and drafted the manuscript. NB prepared plant material andcontributed to data analysis. MDC contributed to data analysis. PF managedthe high-throughput molecular markers platform. AS contributed to dataanalysis. PD drafted the manuscript. NVI contributed to data analysis anddrafted the manuscript. CP managed the project, contributed to dataanalysis and drafted the manuscript. All authors read and approved the finalmanuscript.
Received: 13 May 2011 Accepted: 21 March 2012Published: 21 March 2012
References1. Moon HS, Nicholson JS, Lewis RS: Use of transferable Nicotiana tabacum
L. microsatellite markers for investigating genetic diversity in the genusNicotiana. Genome 2008, 51:547-559.
2. Lewis RS, Nicholson JS: Aspects of the evolution of Nicotiana tabacum L.,and the status of the United States Nicotiana Germplasm Collection.Genet Res Crop Evol 2007, 54:727-740.
3. Moon HS, Nifong JM, Nicholson JS, Heineman A, Lion K, Van der Hoeven R,Hayes AJ, Lewis RS: Microsatellite-based analysis of tobacco (Nicotianatabacum L.) genetic resources. Crop Sci 2009, 49:2149-2159.
4. Legg PD, Smeeton BW: Breeding and genetics. In Tobacco: production,chemistry and technology. Edited by: Layten Davis D, Nielsen MT. Oxford, UK:Blackwell Science Ltd; 1999:.
5. Spagnoletti PL, Qualset CO: Evaluation of five strategies for obtaining acore subset from a large genetic resource collection of durum wheat.Theor Appl Genet 1993, 87:295-304.
6. Balfourier F, Roussel V, Strelchenko P, Exbrayat-Vinson F, Sourdille P,Boutet G, Koenig J, Ravel C, Mitrofanova O, Beckert M, Charmet G: Aworldwide bread wheat core collection arrayed in a 384-well plate.Theor Appl Genet 2007, 114:1265-1275.
7. van Hintum TJL: Comparison of marker systems and construction of acore collection in a pedigree of European spring barley. Theor Appl Genet1994, 89:991-997.
8. Huaman Z, Aguilar C, Ortiz R: Selecting a Peruvian sweet potato corecollection on the basis of morphological, ecogeographical, and diseaseand pest reaction data. Theor Appl Genet 1999, 98:840-844.
9. Malosetti M, Abadie T: Sampling strategy to develop a core collection ofUruguayan maize landraces based on morphological traits. Genet ResCrop Evol 2001, 48:381-390.
10. Upadhyaya HD, Bramel PJ, Ortiz R, Sing S: Developing a mini core ofpeanut for utilisation of genetic resources. Crop Sci 2002, 42:2150-2156.
11. Li Z, Zhang H, Zeng Y, Yang Z, Shen S, Sun C, Wang X: Studies onsampling schemes for establishment of core collection of rice landracesin Yunnan, China. Genet Res Crop Evol 2002, 49:67-74.
12. Schoen DJ, Brown AHD: Conservation of allelic richness in wild croprelatives is aided by the assessment of genetic markers. PNAS 1993,22:10623-10627.
13. Flint-Garcia SA, Thornsberry JM, Buckler ES: Structure of linkagedisequilibrium in plants. Annu Rev Plant BIol 2003, 54:357-374.
14. Zhu C, Gore M, Buckler ES, Yu J: Status and prospects of associationmapping in plants. The plant genome 2008, 1:1-20.
15. Rafalski JA: Association genetics in crop improvement. Curr Op Plant Biol2010, 13:174-180.
16. Waugh R, Jannik J-L, Muehlbauer GJ, Ramsay L: The emergence of wholegenome association scans in barley. Curr Op Plant Biol 2009, 12:218-222.
17. Myles S, Peiffer J, Brown PJ, Ersoz ES, Zhang Z, Costich DE, Buckler ES:Association mapping: critical considerations shift from genotyping toexperimental design. Plant Cell 2009, 21:2194-2202.
18. Mather KA, Caicedo AL, Polato NR, Olsen KM, McCouch S, Purugganan MD:The Extent of Linkage Disequilibrium in Rice (Oryza sativa L.). Genetics2003, 177:2223-2232.
19. Morrell PL, Toleno DM, Lundy KE, Clegg MT: Low levels of linkagedisequilibrium in wild barley (Hordeum vulgare ssp. spontaneum)despite high rates of self-fertilization. PNAS 2005, 102:2442-2447.
20. Kim S, Plagnol V, Hu TT, Toomajian C, Clark RM, Ossowski S, Ecker JR,Weigel D, Nordborg M: Recombination and linkage disequilibrium inArabidopsis thaliana. Nat Genet 2007, 39:1151-1155.
21. Veyrieras JB, Camus-Kulandaivelu L, Gouesnard B, Manicacci D,Charcosset A: Bridgning genomics and genetic diversity: linkagedisequilibrium structure and association mapping in maize and othercereals. Crop Sci 2007, 47:S60-S71.
22. Ingvarsson PK: Nucleotide Polymorphism and Linkage DisequilibriumWithin and Among Natural Populations of European Aspen (Populustremula L., Salicaceae). Genetics 2005, 169:2945-2953.
23. Brown GR, Gill GP, Kuntz RJ, Langly CH, Neale DB: Nucleotide diversity andlinkage disequilibrium in loblolly pine. PNAS 2004, 101:15255-15260.
24. Malysheva-Otto L, Ganal MW, Roder MS: Analysis of molecular diversity,population structure and linkage disequilibrium in worldwide suvery ofcultivated barley germplasm (H. vulgare L.). BMC Genet 2006, 7:6.
25. Maccaferri M, Sanguineti MC, Noli E, Tuberosa R: Population structure andlong-range linkage disequilibrium in a durum wheat elite collection. MolBreed 2005, 15:271-290.
26. Barnaud A, Laucou V, This P, Lacombe T, Doligez A: Linkage disequilibriumin wild french grapevine, Vitis vinifera L., subsp. silvestris. Heredity 2010,104:431-437.
27. Stich B, Melchinger AE, Heckenberger M, Mohring J, Schechert A, Piepho H-P: Association mapping in multiple segregating populations of sugarbeet (Beta vulgaris L.). Theor Appl Genet 2008, 117:1167-1179.
28. Hyten DL, Choi I-Y, Song Q, Shoemaker RC, Nelson RL, Costa JM, Specht JE,Cregan PB: Highly variable patterns of linkage disequilibrium in multiplesoybean populations. Genetics 2007, 175:1937-1944.
29. van Berloo R, Zhu A, Ursem R, Verbakel H, Gort G, Antonis F, vanEeuwijk FA: Diversity and linkate disequilibrium analysis within aselected set of cultivated tomatoes. Theor Appl Genet 2008, 117:89-101.
30. Simko I, Haynes K, Jones RW: Assessment of linkage disequilibrium inpotato genome with single nucleotide polymorphism markers. Genetics2006, 173:2237-2245.
31. Bindler G, van der Hoeven R, Gunduz I, Plieske J, Ganal M, Rossi L, Gadani F,Donini P: A microsatellite maker based linkage map of tobacco. TheorAppl Genet 2007, 114:341-349.
32. Moon HS, Nicholson JS, Heinemann A, Lion K, van der Hoeven R, Hayes AJ,Lewis RS: Changes in genetic diversity of U.S. flue-cured tobaccogermplasm over seven decades of cultivar development. Crop Sci 2009,49:498-508.
33. Bindler G, Plieske J, Bakaher N, Gunduz I, Ivanov N, van der Hoeven R,Ganal M, Donini P: A high density genetic map of tobacco (Nicotianatabacum L.) obtained from large scale microsatellite markerdevelopment. Theor Appl Genet 2011, 123:219-230.
34. Ren N, Timko MP: AFLP analysis of genetic polymorphism andevolutionary relationships among cultivared and wild Nicotiana species.Genome 2001, 44:559-571.
35. Julio E, Denoyes-Rothan B, Verrier JL, Dorlhac Borne F: Detection of QTLsLinked to Leaf and Smoke Properties in Nicotiana tabacum Based on aStudy of 114 Recombinant Inbred Lines. Mol Breed 2006, 18:69-91.
36. Chaplin JF, Stavely JR, Litton CC, Pittarelli GW, West WH: Catalog of thetobacco introductions in the U.S. department of agriculture’s tobaccogermplasm collection (Nicotiana tabacum). In Agricultural Reviews andManuals. Volume ARM-S-27. Agricultural Research Service. Washington, U.S.;1982.
37. Wolf A, Wolf FT: The origin of tobaccos of the oriental type. Bull TorreyBot Club 1948, 75:51-55.
38. Murphy JP, Cox TS, Rufty RC, Rodgers DM: A representation of thepedigree relationships among flue-cured tobacco cultivars. TobaccoScience 1987, 31:70-75.
Fricano et al. BMC Genetics 2012, 13:18http://www.biomedcentral.com/1471-2156/13/18
Page 12 of 13
39. Garner WW, Allard H, Clayton EE: Superior germplasm in tobacco.Yearbook of agriculture GPO. Washington DC: USDA; 1936, 785-830.
40. Pritchard JK, Stephens M, Donnelly P: Inference of population structureusing multilocus genotype data. Genetics 2000, 155:945-959.
41. Brown AHD, Weir BS: Measuring genetic variability in plant populations.In Isozymes in Plant genetic and breeding. Edited by: Tanksley SD, Orton TJ.Amsterdam: Elsevier Science; 1983:219-239.
42. Sorkheh K, Malysheva-Otto LV, Wirthehnsohn MG, Tarkesh-Esfahani S,Martinez-Gomez P: Linkage disequilibrium, genetic association mapping,and gene localization in crop plants. Gen Mol Biol 2008, 4:805-814.
43. Somers DJ, Banks T, De Pauw R, Fox S, Clarke J, Pozniak C, McCartney C:Genome-wide linkage disequilibrium analysis in bread wheat anddurum wheat. Genome 2007, 50:557-567.
44. Nordborg M, Borevitz JO, Bergelson J, Berry CC, Chory J, Hagenbald J,Kreitman M, Maloof JN, Noyes T, Oefner PJ, Stahl EA, Weigel D: The extentof linkage disequilibrium in Arabidopsis thaliana. Nat Genet 2002,30:190-193.
45. Remington DL, Thorsnberry JM, Matsuoka Y, Wilson LM, Whitt SR,Doebley J, Kresovich S, Goodman MM, Buckler ES: Structure of linkagedisequilibrium and phenotypic associations in the maize genome. ProcNatl Acad Sci 2001, 98:11479-11484.
46. Parsch J, Meiklejohn CD, Hartl DL: Patterns of DNA sequence variationsuggest the recent action of positive selection in the janus-ocnus regionof Drosophila simulans. Genetics 2001, 159:647-657.
47. Wu F, Eannetta NT, Xu Y, Plieske J, Ganal M, Pozzi C, Bakaher N,Tanksley SD: COSII genetic maps of two diploid Nicotiana speciesprovide a detailed picture of synteny with tomato and insights intochromosome evolution in tetraploid N. tabacum. Theor Appl Genet 2010,120:809-827.
48. Morgante M, Brunner S, Pea G, Fengler K, Zuccolo A, Rafalski A: Geneduplication and exon shuffling by helitron-like transposons generateintraspecies diversity in maize. Nat Genet 2005, 37:997-1002.
49. Shuelke M: An economic method for the fluorescent labeling of PCRfragments. Nat Biotechnol 2000, 18:233-234.
50. Siegmund D, Yakir B: The Statistics of Gene Mapping New York: Springer;2007.
51. Peakall R, Smouse PE: GENALEX 6: genetic analysis in Excel. Populationgenetic software for teaching and research. Molecular Ecology Notes 2006,6:288-295.
52. Felsenstein J: Evolutionary trees from DNA sequences: a maximumlikelihood approach. J Mol Evol 1981, 17:368-376.
53. Huson DH, Bryant D: Application of phylogenetic networks inevolutionary studies. Mol Biol Evol 2006, 23:254-267.
54. Huson DH, Richter DC, Rausch C, Dezulian T, Franz M, Rupp R:Dendroscope- An interactive viewer for large phylogenetic trees. BMCBioinforma 2007, 8:460.
55. Evanno G, Regnaut S, Goudet J: Detecting the number of clusters ofindividuals using the software STRUCTURE: a simulation study. Mol Ecol2005, 14:2611-2620.
56. Hardy OJ, Vekemans X: SPAGeDi: a versatile computer program toanalyse spatial genetic structure at the individual or population levels.Molecular Ecology Notes 2002, 2:618-620.
57. Bradbury PJ, Zhang Z, Kroon DE, Casstevens TM, Ramdoss Y, Buckler ES:TASSEL: software for association mapping of complex trait in diversesamples. Bioinformatics 2007, 23:2633-2635.
58. Breseghello F, Sorrells MS: Association mapping of kernel size and millingquality in wheat (Triticum aestivum L.) cultivars. Genetics 2006,172:1165-1177.
doi:10.1186/1471-2156-13-18Cite this article as: Fricano et al.: Molecular diversity, populationstructure, and linkage disequilibrium in a worldwide collection oftobacco (Nicotiana tabacum L.) germplasm. BMC Genetics 2012 13:18.
Submit your next manuscript to BioMed Centraland take full advantage of:
• Convenient online submission
• Thorough peer review
• No space constraints or color figure charges
• Immediate publication on acceptance
• Inclusion in PubMed, CAS, Scopus and Google Scholar
• Research which is freely available for redistribution
Submit your manuscript at www.biomedcentral.com/submit
Fricano et al. BMC Genetics 2012, 13:18http://www.biomedcentral.com/1471-2156/13/18
Page 13 of 13