Embed Size (px)
Citation preview

1
2014 ENERGY AND ECONOMIC VALUE OF MUNICIPAL SOLID
WASTE (MSW) AND NON-RECYCLED PLASTICS (NRP) CURRENTLY LANDFILLED IN THE FIFTY STATES
Nickolas J. Themelis and Charles Mussche
2014

2
2014 ENERGY AND ECONOMIC VALUE OF MUNICIPAL SOLID WASTE (MSW) AND NON-‐RECYCLED PLASTICS (NRP) CURRENTLY LANDFILLED IN
THE FIFTY STATES
EXECUTIVE SUMMARY This report provides an update of the 2011 Earth Engineering Center (EEC) Report to the Plastics Division of the American Chemistry Council (ACC) quantifying the energy and economic value of municipal solid wastes (MSW) and non-‐recycled plastics (NRP). This update is based on the data obtained in Columbia University’s 2013 Survey of Waste Management in the U.S. and from MSW characterization studies conducted by several states. The 2013 Survey uses waste numbers from 2011, while the 2011 study for ACC used waste numbers from 2008. Recycling of plastics has continued to grow in the U.S. and increased to 2.66 million tons. This includes increased recovery of used plastics from polyethylene terephthalate (PET) and high density polyethylene (HDPE) bottles, HDPE and polypropylene (PP) non-‐bottle rigid plastics, and HDPE and low density polyethylene (LDPE) films, bags, and wraps. However, despite the growth in both access to and types of plastics collected for recycling, some plastics cannot be economically recycled. For these plastics, conversion to energy is preferred over landfilling, which is consistent with the U.S. Environmental Protection Agency’s (EPA’s) waste management hierarchy. The main objective of this study was to determine the quantity of non-‐recycled plastics in the United States that is available to be converted into energy. To do this, EEC calculated – nationally and by state -‐ the amount of non-‐recycled MSW generated in the U.S. and the amounts recycled, composted, converted to energy, and landfilled. A second objective was to explore the potential for converting the landfilled NRP to electricity, heat, or fuel. Therefore, the quantities of MSW plastics recycled, combusted with energy recovery, and landfilled across the nation were estimated along with their energy and economic values. This study reported that the MSW generated in the U.S. in 2011 was 389 million tons in 2011. Plastics represented less than 11% (41.2 million tons) of the total MSW stream. Of this amount, 2.66 million tons were recycled, 3.9 million tons were converted to energy in waste-‐to-‐energy (WTE) plants, 0.27 million tons were used as alternative fuel in cement production, and 34.4 million tons were landfilled. In a key difference from the previous report to ACC, the scope of this report was expanded to include plastics not counted by the EPA as MSW but disposed at MSW landfills. This includes 0.5 million tons of plastics in construction and demolition debris (C&D) and an estimated 1.9 million tons of plastics contained in automotive shredder residue (ASR).

3
Key findings:
• Between 2008 and 2011, recycling of materials from the U.S. MSW increased by 18.5 million tons while tonnage to waste-‐to-‐energy plants increased by 3.8 million tons. For plastics, the total recovery rate (recycling + energy recovery) increased from 14.3% in 2008 to 16.7% in 2011.
• If all the MSW that was landfilled in 2011 were to be diverted to WTE power plants, they could generate enough electricity to supply 13.8 million households, i.e., 12% of the U.S. total. In addition, if the steam turbine exhaust of the WTE plants were to be used for district heating, as is done in Denmark and some other northern European countries, the “waste” steam would provide district heating for an additional 9.8 million homes.
• Every ton of MSW combusted in recently built WTE power plants replaces an estimated 0.4 ton of coal. Therefore, diversion of MSW from landfills to new WTE plants could reduce coal mining in the U.S. by about 100 million tons per year.
• If MSW were to be used as a fuel in WTE power plants, it could replace all the
coal imported by states such as New York, California, Idaho, New Jersey and Maine. Use of MSW fuel in place of coal could reduce the U.S. state-‐to-‐state transportation of coal by 22%.
• Diversion of all MSW from landfills to WTE plants could result in reducing
the greenhouse gas (GHG) emissions of waste management in the U.S. by at least 123 million tons of carbon dioxide equivalent (2.1% of U.S. total greenhouse gas emissions), comparable to the annual emissions of over 23 million cars.
• The current annual landfilling of MSW in the U.S. is estimated to require a
land surface of about 6,100 acres, equivalent to nearly 4,600 U.S. football fields, or seven New York City Central Parks; diversion of MSW to new energy recovery facilities would reduce the amount of land converted from greenfields to landfills every year.
• The average lower heating value of non-‐recycled plastics (NRP) was estimated at 30.7 million Btu/ton (35.7 MJ/kg). The amount of NRP landfilled in 2011 (34.4 million tons) contained a chemical energy content equivalent to:
-‐ 48 million tons of coal, or -‐ 180 million barrels of oil, or -‐ 1 trillion standard cubic feet of natural gas
• If the NRP were to be source-‐separated and converted through pyrolysis into
synthetic oil, this could produce 136 million barrels of oil per year, or 5.7

4
billion gallons of gasoline, enough to fuel an estimated 8.9 million cars.
• Alternatively, if the NRP were to be source-‐separated and used as fuel in dedicated WTE facilities, these plants could generate 61.9 million MWh of electricity, enough to supply an estimated 5.7 million households.

5
TABLE OF CONTENTS 2014 UPDATED ENERGY AND ECONOMIC VALUE OF MUNICIPAL SOLID WASTE (MSW) AND NON-‐RECYCLED PLASTICS (NRP) THAT ARE CURRENTLY LANDFILLED IN THE FIFTY STATES ........................................................................................................................ 2 EXECUTIVE SUMMARY .......................................................................................................................... 2
TABLE OF CONTENTS ................................................................................................... 5
LIST OF FIGURES .......................................................................................................... 6
LIST OF TABLES ............................................................................................................ 6
LIST OF ACRONYMS ..................................................................................................... 7
1. INTRODUCTION .................................................................................................... 8 1.1 Objective of this study ................................................................................................................................. 8 1.2 The Earth Engineering Center and the Hierarchy of Waste Management ............................ 8 1.3 The Columbia/BioCycle Survey of MSWmanagement in the U.S. ............................................. 9 2. MSW RECYCLED, COMBUSTED AND LANDFILLED IN EACH STATE ........................ 10 2.1 Comparison of EEC Survey of 2011 data and EPA 2011 Facts and Figures Report ....... 10 2.2 Results of Columbia’s Survey of 2011 national data ................................................................... 11
3. ESTIMATE OF U.S. GENERATION OF PLASTIC WASTES .......................................... 12 3.1 Plastics in the MSW stream ..................................................................................................................... 12 3.2 Concentration of plastics in MSW to WTE plants and landfills ............................................... 13 3.3 Tonnage of plastics to WTE plants and to landfills ...................................................................... 14 3.4 Amount of plastics recycled nationally in 2011 ............................................................................ 14 3.6 Plastics in C&D waste ................................................................................................................................ 14 3.7 Plastics in ASR waste ................................................................................................................................. 15 3.8 NRP used as alternative fuels (AF) in cement kilns ..................................................................... 17 3.9 Non-‐hazardous, small-‐company industrial wastes ...................................................................... 17
4. STATE BY STATE ESTIMATE OF PLASTICS RECYCLED, COMBUSTED WITH ENERGY RECOVERY, AND LANDFILLED ..................................................................................... 17 4.1 Summing up of plastic waste generation and disposition in 2011 ........................................ 17 4.2 Tons of plastic recycled in each state ................................................................................................. 18 4.3 Tons of plastic combusted with energy recovery in each state .............................................. 18

6
4.4 Estimate of plastic wastes landfilled .................................................................................................. 19 4.5 Recycling, energy recovery, landfilling, and generation of plastics in each state ........... 19 4.6 Discussion of results .................................................................................................................................. 20 4.7 Generation and disposition of plastic wastes in 2011 ................................................................ 20
5. POTENTIAL FOR ENERGY RECOVERY FROM NRP .................................................. 23 5.1 Energy value of plastic wastes .............................................................................................................. 23 5.2 Energy equivalence of NRP to coal, oil, and natural gas ............................................................ 25 5.3 Transforming NRP to oil by means of pyrolysis ............................................................................ 27 5.4 Transforming of NRP to methanol, ethanol or other chemicals ............................................. 28 5.5 Potential of using source-‐separated NRP in dedicated power plants .................................. 28 5.6 Increased utilization of NRP by means of increased U.S. waste-‐to-‐energy capacity ..... 29 5.7 Greenhouse gas (GHG) benefit of increasing WTE capacity ..................................................... 30 5.8 Landfill avoidance by dedicated usage of MSW and NRP plastics ......................................... 31
CONCLUSIONS ............................................................................................................ 31
REFERENCES ............................................................................................................... 33
APPENDIX 1. Potential for processing non-‐recycled plastics (NRP) to methanol ......... 36
REFERENCES TO APPENDIX 1: ..................................................................................... 40
LIST OF FIGURES Figure 1: Hierarchy of Sustainable Waste Management developed by the EEC (4) 9 Figure 2: Tons of MSW landfilled per state 12 Figure 3: State-‐by-‐state comparison of the fraction of plastics recovered as materials (recycling) or
energy (red). 21 Figure 4: Graphical representation of the energy content of the different fuel types mentioned in
Table 15 (lower heating value, Btu/lb) 26 Figure 5: Coal imported per state (grey) and the MSW coal equivalent produced per state (green) in
thousands of short tons (39). 30
LIST OF TABLES Table 1. Comparison of 2013 EEC Survey with EPA 2011 Facts and Figures Report 10 Table 2. U.S. recycling, WTE, and landfilling of MSW in 2011 (1) 11 Table 3. Comparison of the EPA 2008 and 2011 estimates of generation, recycling and disposal of
plastics (in 1000 tons; ref 8) 13 Table 4. Plastics composition in 14 state studies of non-‐recycled MSW 13 Table 5. Components of plastics stream (10, 11, 12, 13) 14 Table 6. Composition of C&D waste (16) 15 Table 7. Composition of materials in the automotive waste industry (18) 15 Table 8. Plastics composition in vehicles (21) and energy content of each type of plastic (22, 23, 24
and 25) 16 Table 9. Tons of plastics generated, recycled, combusted for energy and landfilled in each state 19 Table 10. Generation and disposition of plastic wastes in 2011 (in short tons)* 21 Table 11. Comparison of lower heating values (LHV) reported in literature for principal components
of plastics in the waste stream (ref. 22, 23, 24, 32, 33, 42) 24

7
Table 12. Plastics composition and lower heating value (LHV) of principal plastics in the U.S. generated plastic waste stream (ASR excluded) 24
Table 13. Amount of plastics that are landfilled, present in MSW and ASR 25 Table 14. Energy content of different types of fuels in Btu per pound 25 Table 15. Comparison of the heating value of landfilled NRP to other fuels 26
LIST OF ACRONYMS ABS Acrylonitrile butadiene styrene ACC American Chemistry Council AF Alternative fuel ASR Automotive shredder residue Btu British thermal unit CCNY City College of New York C&D Construction and demolition EEC Earth Engineering Center EF Engineered fuel EIA Energy Information Administration EPA Environmental Protection Agency GHG Green house gases HDPE High density polyethylene IPTF Integrated Processing and Transfer Facility LHV Lower heating value LDPE Low density polyethylene LLDPE Linear low density polyethylene MRF Materials recovery facility MSW Municipal solid waste MWh Megawatt hours NRP Non recycled plastics ORCR Office of Resource Conservation and Recovery of EPA PET Polyethylene terephthalate PP Polypropylene PS Polystyrene SOG State of Garbage WTE Waste to Energy WTERT Waste to Energy Research and Technology Council

8
1. INTRODUCTION
1.1 Objective of this study This report is an update of the 2011 Earth Engineering Center Report (1) to the Plastics Division of the American Chemistry Council (ACC) quantifying the energy and economic value of municipal solid waste (MSW) and non-‐recycled plastics (NRP). This update is based on the data obtained in Columbia University’s 2013 Survey of MSW Management in the U.S. (2) and in MSW characterization studies conducted by several states. It also includes estimates of the amounts of other combustible streams of waste that are landfilled in U.S. MSW landfills. One of the objectives of this study was to determine the quantities of non-‐recycled plastics (NRP) generated in the U.S. and how they are disposed nationally and by state. Another objective was to explore the potential for converting MSW, including, non-‐recycled plastics (NRP) that are currently landfilled, into energy or fuel. The quantities of MSW and plastics recycled, combusted with energy recovery, and landfilled across the nation were estimated along with their energy value. In addition, the current study included other waste streams that contain NRP, such as construction and demolition debris (C&D) and automotive shredder residue (ASR) that are currently landfilled, instead of being used as a source of energy.
1.2 The Earth Engineering Center and the Hierarchy of Waste Management The Earth Engineering Center of Columbia University (EEC; ref. 3) is an academic research group recognized internationally for its extensive research and publications on materials and energy recovery from solid wastes. EEC has a wide global presence through its Waste-‐to-‐Energy Research and Technology Council (WTERT, www.wtert.org), an academia-‐industry consortium established in 2003. Since publication of the EEC 2011 report to ACC, the Global WTERT Council (global.wtert.org) has expanded to thirteen sister national organizations, including in Brazil (www.wtert.br), China (www.wtert.cn), and India (www.wtert.in). The guiding principle of all EEC research is that responsible management of wastes must be based on science and the best available technology, and not on ideology and economics that exclude environmental costs. The Research Associates of EEC include Columbia University and City College of New York (CCNY) faculty, as well as specialists from other universities and organizations. The Hierarchy of Sustainable Waste Management (Figure 1, ref. 4) shows the generally preferred order of priority of various means for managing wastes; by now, it has been translated into ten languages.

9
Figure 1: Hierarchy of Sustainable Waste Management developed by the EEC (4)
1.3 The Columbia/BioCycle Survey of MSWmanagement in the U.S. In the years 2004-‐2010, the Earth Engineering Center collaborated with BioCycle journal on a bi-‐annual survey of MSW management in the U.S., called State of Garbage in America (SOG). The 2010 SOG Survey (5) was based on 2008 data and its results were used in the EEC 2011 study of non-‐recycled plastics (NRP), sponsored by the American Chemistry Council (1). Since 2009, the EPA has used the results of the Columbia/BioCycle Survey to calculate the greenhouse gas (GHG) effects of waste management. The 2013 Survey of Waste Management in the U.S. was carried out solely by EEC and was sponsored by several organizations including the American Chemistry Council (ACC); it was based on 2011 data submitted by each state. At the request of EEC, the draft of the 2013 Survey Questionnaire was first reviewed by EPA’s Office of Resource Conservation and Recovery (ORCR). Their comments were incorporated and the Questionnaire was then submitted in interactive form to the agencies responsible for waste management in the fifty states. Only eight states, representing 13% of the U.S. population, did not provide data. In these cases, data from the 2010 Columbia/BioCycle State of Garbage Survey was used, adjusted for population growth between 2008 and 2011.

10
2. MSW RECYCLED, COMBUSTED AND LANDFILLED IN EACH STATE
2.1 Comparison of EEC Survey of 2011 data and EPA 2011 Facts and Figures Report
The results of the Columbia 2013 Survey, using 2011 data, showed that the U.S. generated a total of 389 million tons of MSW, corresponding to a per capita generation of 1.3 short tons of MSW per year. Of the MSW generated, 22.6% was recycled, 6.3% composted, 7.6% was combusted with energy recovery at U.S. WTE plants, and 63.5% was landfilled. The 2013 Survey showed that, in comparison to the 2010 SOG Survey, landfilling decreased by about 20 million tons while recycling increased by nearly the same amount. The Columbia 2013 Survey showed that in 2011 a total of 247 million tons of MSW was disposed in U.S. landfills, while the EPA Facts and Figures (7) reported that only 134.3 million tons were landfilled in that year. A comparison of these two estimates is shown in Table 1.
Table 1. Comparison of 2013 EEC Survey with EPA 2011 Facts and Figures
Report
EEC 2011 EPA 2011 Difference (EEC minus EPA)
Total MSW generated Total MSW generated 388,959,390 250,420,000 138,539,390
Recycled materials Recycled materials 87,808,128 66,200,000 21,608,128
MSW Composted MSW composted 24,646,893 20,700,000 3,952,774 MSW to WTE MSW to WTE 29,746,223 29,260,000 486,223
MSW landfilled MSW landfilled 246,977,177 134,260,000 112,717,177
The landfilling difference of 112.7 million tons, between the two studies, is due in part to the fact that the EPA definition of MSW does not include materials that do end up in MSW landfills, such as automobile shredder residue, commercial C&D debris, packaging from imported goods, municipal wastewater sludge, construction and demolition debris, small-‐scale manufacture wastes that are not recycled, etc. In contrast, the 2013 Columbia Survey is based on the sum of materials recycled, composted, combusted with energy recovery, and landfilled in MSW-‐designated-‐landfills, as reported by the waste management agencies of the fifty states. The Columbia Survey considers that all recyclable, compostable, or combustible materials that are discarded in MSW landfills represent a loss of materials or energy and an unnecessary use of land; therefore, they should be included in the national

11
account of waste management.
2.2 Results of Columbia’s Survey of 2011 national data Table 2 shows the tonnages of MSW recycled, composted, combusted with energy recovery, and landfilled in the fifty states, according to the Columbia 2013 Survey of 2011 data (2). Figure 2 is a graphical representation of these data.
Table 2. U.S. recycling, WTE, and landfilling of MSW in 2011 (2)
State Recycled Combusted Landfilled Est. total % Recycled Alabama 486,260 178,690 4,730,330 5,435,579 9% Alaska 30,166 0 647,227 677,393 4% Arizona 382,645 0 6,609,376 7,057,796 5% Arkansas 2,404,464 0 3,272,797 5,766,850 42% California 27,746,174 856,121 30,047,841 66,299,346 42% Colorado 1,745,860 0 6,138,752 8,062,492 22% Connecticut 532,888 2,154,044 247,995 3,273,172 17% Delaware 152,919 0 672,761 1,022,328 15% District of Columbia 20,122 216,903 228,524 471,430 9% Florida 7,364,857 5,798,975 13,877,987 26,824,098 29% Georgia 691,386 0 9,869,000 10,600,921 7% Hawaii 612,907 545,830 2,452,165 3,881,007 16% Idaho 156,200 0 1,668,578 1,824,778 9% Illinois 1,000,877 0 12,132,946 13,629,998 7% Indiana 490,728 704,675 4,880,873 6,431,339 8% Iowa 942,760 38,814 2,696,788 3,930,755 24% Kansas 932,721 0 2,263,336 3,284,855 28% Kentucky 1,660,239 0 4,195,361 6,222,727 27% Louisiana 30,908 [1] 0 5,166,775 5,783,868 1% Maine 674,258 472,478 212,836 1,632,151 48% Maryland 1,572,200 1,389,632 2,352,939 6,096,061 26% Massachusetts 2,152,212 3,174,603 1,533,068 7,526,336 29% Michigan 833,589 993,990 11,952,636 13,783,782 6% Minnesota 2,556,996 1,145,487 1,784,719 5,578,298 45% Mississippi 131,602 2,729,305 2,866,104 5% Missouri 967,814 3,965,327 4,933,141 20% Montana 252,734 1,366,226 1,694,083 15% Nebraska 333,207 2,219,461 2,552,668 13% Nevada 1,150,601 2,809,979 4,046,301 28% New Hampshire 466,707 251,539 402,497 1,158,418 41% New Jersey 4,346,256 2,129,852 4,384,975 10,880,082 40% New Mexico 339,590 1,981,884 2,389,434 14% New York 2,246,064 3,686,097 10,263,710 17,525,006 13% North Carolina 790,686 7,702,232 9,137,435 9% North Dakota 90,000 675,000 935,000 10% Ohio 2,461,594 9,126,809 12,729,405 19% Oklahoma 176,961 204,633 4,397,372 4,776,799 4% Oregon 1,438,560 181,316 1,918,649 3,953,185 36% Pennsylvania 4,465,949 3,084,639 5,902,677 14,249,335 32% Rhode Island 64,480 793,000 922,480 7% South Carolina 954,748 3,295,771 4,425,431 22% South Dakota 157,306 646,561 864,702 18% Tennessee 1,531,310 6,036,132 7,642,442 20% Texas 2,780,213 23,720,134 31,101,890 9% Utah 56,474 126,522 2,059,152 2,533,390 2% Vermont 120,009 379,005 535,425 22% Virginia 2,830,702 2,037,401 10,095,859 15,345,008 18%

12
Washington 3,244,620 276,753 4,113,753 8,806,410 37% West Virginia 345,271 1,812,675 2,157,946 16% Wisconsin 843,934 76,000 4,181,867 5,661,515 15% Wyoming 46,400 610,080 729,335 6% Total 87,808,128 29,746,223 246,997,177 389,198,422 23%
Figure 2: Tons of MSW landfilled per state
3. ESTIMATE OF U.S. GENERATION OF PLASTIC WASTES
3.1 Plastics in the MSW stream The EPA Facts and Figures 2011 report (ref. 8, Table 1, p.9) estimated a total generation of post-‐consumer plastic wastes of 31.8 million tons. This was higher than the amount reported by EPA in 2008 (30 million tons). Also, EPA reported that 2.66 million tons of plastics were recycled in 2011 vs. 2.12 million tons in 2008. Table 3 compares the EPA numbers for generation, recycling and landfilling of U.S. NRP in 2008 and 2011 (8). It should be noted that both of the EPA reports combined the NRP that are combusted with energy recovery in WTE plants with those that were landfilled. This practice is not in accord with EPA’s own waste management hierarchy which shows that energy recovery is preferable to landfilling. Table 10, presented later in this report, does differentiate between these two quite different methods of managing NRP.
-‐
5,000,000
10,000,000
15,000,000
20,000,000
25,000,000
30,000,000
35,000,000
California
Texas
Florida
Illinois
Michigan
New York
Virginia
Georgia
Ohio
North Carolina
Arizona
Colorado
Tennessee
Pennsylvania
Louisiana
In/aiana
Alabam
a Oklahoma
New Jersey
Kentucky
Wisconsin
Washington
Missouri
South Carolina
Arkansas
Nevada
Mississippi
Iowa
Hawaii
Maryland
Kansas
Nebraska
Utah
New Mexico
Oregon
West Virginia
Minnesota
Idaho
Massachussetts
Montana
Rhode Island
North Dakota
Delaware
Alaska
South Dakota
Wyoming
New Ham
pshire
Vermont
Connecticut
District of Colum
bia
Maine
Tons landNilled in the Nifty states

13
Table 3. Comparison of the EPA 2008 and 2011 estimates of generation, recycling and disposal of plastics (in 1000 tons; ref 8)
(In 1000's of tons) Generated, 2008
Recycled, 2008
Landfilledplus WTE 2008
Generated, 2011
Recycled, 2011
Landfilled plus WTE, 2011
Total durable goods 10,520 390 10,130 11,420 740 10,680 Non durable Cups/plates 780 Negligible 780 1,030 Negligible 1,030 Trash/bags 930 Negligible 930 1,010 Negligible 1,010 Other non durables 4810 Negligible 4,810 4,480 110 4,370 Total non durables 6,520 0 6,520 6,520 110 6,410 Bottles/jars, PET 2,680 730 1,950 2,740 803 1,937 Bottles/jars. HDPE 750 220 530 770 230 562 Other containers 1,900 280 1,620 1,870 290 1,767 Bags, sacks, wraps 3,960 390 3,j570 3,880 430 3,683 Other packaging 3,720 110 3,610 4,640 60 3,460 Total Containers/packages 13,010 1,730 11,280 13,900 1,813 11,497 Total plastics 30,050 2,120 27,930 31,840 2,663 29,177 Total plastics (in %) 100% 7.1% 93% 100% 8.4% 91.6%
3.2 Concentration of plastics in MSW to WTE plants and landfills The EPA 2011 Facts and Figures estimated that the concentration of plastics in their definition of MSW (250.4 million tons) was 12.7% (8). In the present study, the concentration of NRP in MSW to WTE plants or landfills was based on the detailed MSW characterization studies of 14 states (Table 4), during 2003-‐2011. For example, the Indiana study, by Purdue University (9), included rigorous MSW analysis tests at landfills in five counties in which nearly sixty different types of materials were sorted out. As shown in Table 4, these fourteen states in total represented a population of 139 million people. The composition of NRP ranged from a low of 9.6% to a high of 17%, and the average weighted composition was 13.16%. In the following calculations, it is assumed that the non-‐recycled MSW that was converted to energy at WTE plants, or landfilled, contained 13.2% NRP.
Table 4. Plastics composition in 14 state studies of non-‐recycled MSW
State Year Plastics in MSW
Population Weighted % of Plastics
Tons of non-‐recycled MSW
California (a) 2008 9.60% 37,691,912 2.61% 30,047,841 Connecticut (b) 2010 14.70% 3,580,709 0.38% 247,995 Delaware (c) 2007 11.10% 907,135 0.07% 672,761 Georgia (d) 2005 15.80% 9,815,210 1.12% 9,869,000 Illinois (e) 2008 15.62% 12,869,257 1.45% 12,132,946 Indiana (f) 2011 16.10% 6,516,922 0.76% 4,880,873 Iowa (g) 2005 11.78% 3,062,309 0.26% 2,696,788 Minnesota (h) 2000 11.40% 5,344,861 0.44% 1,784,719 New York (i) 2010 17.00% 19,465,197 2.38% 10,263,710 Maryland (j) 2009 14.40% 4,574,836 0.47% 5,166,775 Ohio (k) 2004 15.62% 11,544,951 1.30% 9,126,809 Oregon (l) 2009 11.56% 3,871,859 0.32% 1,918,649 Pennsylvania (m) 2003 11.30% 12,742,886 1.04% 5,902,677 Washington (n) 2009 11.40% 6,830,038 0.56% 4,113,753 Total of 14 studies 138,818,082 13.16% 98,825,295

14
a) Cascadia Consulting Group. California 2008 Statewide Waste Characterization Study; 2009. b) DSM Environmental Services I, Cascadia Consulting Group undefined Mid-Atlantic Solid Waste Consultants. Connecticut
Statewide Solid Waste Composition and Characterization Study, Final Report; 2010. c) Cascadia Consulting Group. Delaware Solid Waste Authority Statewide Waste Characterization Study, 2006-2007;
2007:2006-2007. d) Beck RW, “Georgia Statewide Waste Characterization Study,” 2005. e) Illinois Recycling Association "Illinois Commodity/Waste Generation and Characterization Study," 2009. f) Abramowitz H. and Sun Y. "Municipal Solid Waste Characterization Study for Indiana," Purdue University, 2011. g) Beck RW, "Iowa Statewide Waste Characterization Study," 2006. h) Beck RW, “Final Report Statewide MSW Composition Study,” 2000. i) Department of Environmental Conservation, "Solid Waste Composition and Characterization-MSW Materials Composition
in New York State." Available at: http://www.dec.ny.gov/chemical/65541.html [Accessed February 2011] j) SCS Engineers, "Waste Composition Sampling & Analysis Study," 2009. k) Engineering Solutions & Design, Inc., "State of Ohio Waste Characterization Study," 2004. l) Oregon Department of Environmental Quality, "Oregon Statewide Waste Composition 2009 Field Data," 2009. m) Beck RW, "Statewide Waste Composition Study," 2003. n) Cascadia Consulting Group, "Washington Statewide Waste Characterization report," 2009.
3.3 Tonnage of plastics to WTE plants and to landfills Multiplying the 2013 national tonnage of post-‐recycling MSW to WTE plants (29.7 million tons – EEC estimate) by the average concentration of plastics from Table 4 (13.2%) yields the tonnage of NRP that were combusted with energy recovery nationally (3.9 million tons).
Similarly, multiplying the 2013 EEC estimate of tonnage of post-‐recycling MSW to landfills (247 million tons) by the average concentration of plastics (13.2%) yields the tons of plastics landfilled (i.e., 32.5 million tons).
3.4 Amount of plastics recycled nationally in 2011 The American Chemistry Council (10, 11) estimated that the recycling of non-‐durable plastics increased from 1.82 million tons in 2008 to 1.9 million tons in 2011. Adding to this number the 0.74 million tons of recycled durable plastics estimated by EPA (11) results in a total of 2.66 million tons of plastics recycled in 2011. This estimate is aligned with the EPA estimate of 2.65 million tons (Table 5).
Table 5. Components of plastics stream (10, 11, 12, 13)
Component of plastic stream Tons '08 % '08 Tons '11 % '11 PET bottle 722,000 32.6% 802,820 30.3% HDPE bottles 490,000 22.2% 229,961 8.7% PP bottles 13,500 0.6% 19,841 0.7% Bags/films 416,000 18.8% 430,000 16.3% Non-‐bottle rigid plastics 180,000 8.1% 423,102 16.0% ACC total of recycled non durable goods 1,821,500 82.4% 1,905,724 72.2% EPA estimate of recycling of durable goods 390,000 17.6% 740,000 27.8% Total tons of plastics recycled 2,211,500 100.0% 2,645,983 100.0%
3.6 Plastics in C&D waste The 1996 EPA report on C&D waste (14), estimated the amount of C&D waste at 136 million tons. Extrapolating this number to 2011 by considering population growth increases this amount to 157 million tons. However, the construction industry is more likely to be aligned with economic rather than population growth (15).

15
Therefore, prorating the 136 million tons generated in 1996 to 2011, on the basis of economic growth, puts the amount of C&D waste in 2011 to 189 million tons. According to the EPA report referred to above (14), 20-‐30% of the C&D waste is recovered for re-‐use, 35-‐45% is landfilled in C&D landfills, and another 30-‐40% is disposed in MSW landfills (i.e. about 65 million tons). The Cascadia Consulting Group analyzed the composition of C&D waste of California in 2006; the results are shown in Table 6 (16).
Table 6. Composition of C&D waste (16)
Composition of C&D waste % Paper 3.2% Glass 1.1% Metal 4.0% Electronics 0.2% Plastics 0.8% Organic 3.0% Household Hazardous Waste 0.4% Special Waste 0.6% Mixed Residue 0.1% Concrete, stones, bricks, asphalt, and wood
86.7%
According to the Cascadia study, plastics comprised only 0.8% of the C&D waste; assuming that the 2011 composition of C&D waste has not changed since 2006, the 2011 contribution of U.S. C&D waste to non-‐recycled plastics is estimated at about 0.5 million tons.
3.7 Plastics in ASR waste According to the U.S. Department of Transportation (17), 12.3 million vehicles were scrapped in 2011. An estimated 23 million tons of vehicles were shredded in industrial plants and the shredded materials were sorted mechanically to ferrous and non-‐ferrous metals that were sold to smelters. Of this amount, 4.5 million tons (19%) of “automobile shredder residue” (ASR) were landfilled (Table 7; ref. 18). The percentage of plastics and other combustible materials in the ASR is very high. Of the 4.5 million tons of ASR generated in 2011, an estimated 1.9 million tons (i.e., 42%) were plastics and 1.1 million tons (24%) rubber.
Table 7. Composition of materials in the automotive waste industry (18)
Shredded Automobile Material
Generation (1000's of tons)
Estimated % of shredder material
Estimated % of automotive shredder
residue Regular steel 9,484 40.3% Hi/Med Strength Steel 2,981 12.7% Stainless Steel 412 1.8% Other Steels 177 0.8% Iron castings 1,850 7.9%

16
Copper and brass 295 1.3% Aluminum 1,802 7.7% Total Recycled 17,000 72.2% Plastics and Composites 1,897 8.1% 42% Rubber 1,072 4.6% 24% Coatings 153 0.7% 3% Textiles 247 1.1% 5% Glass 601 2.6% 13% Other Materials 530 2.3% 12% Total Landfilled 4,500 19.1% 100% Magnesium Castings 58 0.2% Lead 295 1.3% Zinc Castings 236 1.0% Powder Metal Parts 51 0.2% Other Metals 247 1.1% Fluids and Lubricants 1,241 5.3% Total Partially Recycled 2,127 9.0% TOTAL 23,627 100%
As noted earlier, EPA’s definition of MSW “does not include wastes of other types, including ASR, wastewater treatment sludge, ash, light industry residues, etc. that are also disposed in municipal waste landfills” (19). On the other hand, the Columbia Survey considers that all recyclable, compostable, or combustible materials that are discarded in MSW landfills represent a loss of materials or energy, as well as unnecessary use of land, and therefore should be included in the national survey of waste management.
Table 8 shows the types of plastics used by the automotive industry. Because plastics and composites are used more and more in automobiles, the amount of plastics ending in ASR will most likely increase (20). Analysis by EPA has shown (52) that the separation, recycling and use of plastics from shredder residue is consistent with existing authorizations that allow the use and distribution in commerce of products that contain low levels of PCBs, including provisions for “excluded PCB products” and “excluded PCB manufacturing processes” (as defined in 40 CFR 761.3). Table 8 shows the plastic constituents of ASR, their concentration, heating value, and respective tonnages generated annually in the U.S. The average lower heating value (LHV) of ASR is estimated at about 32 million Btu/ton (37 MJ/kg).
Table 8. Plastics composition in vehicles (21) and energy content of each type of plastic (22, 23, 24 and 25)
Plastics composition in cars % MJ/kg Million BTU/ton PP 37.0% 44.3 38 Polyurethane 17.3% 27 23.2 ABS 12.3% 38.1 32.7 HDPE 10.8% 44.2 38

17
PC 6.8% 32.3 37.7 PMMA 4.4% 25.1 21.5 Composites 11.5% 30 25.7 Total 100% 37 32.0
3.8 NRP used as alternative fuels (AF) in cement kilns A 2013 study by Jiao Zhang of the EEC (30) examined the use of alternative fuels (AF) in the U.S. cement industry, which produced 68 million metric tons of cement in 2011. The use of AF increased two-‐fold from 1993, up to 58 million GJ in 2011, corresponding to 20.9% of the total energy consumption in cement production. One of the two principal alternative fuels is used rubber tires and in 2911 amounted to 320,000 metric tons. The other type of AF, sometimes called “engineered fuel” (EF), involves processing to remove metals, glass, and other contaminants leaving a mixture of NRP and paper residues that are shredded and homogenized. The EF feedstock can come from post-‐industrial waste, materials recovery facilities (MRF), or even MSW. In 2011, the use of EF amounted to 699,000 metric tons, i.e., about 770,000 tons short tons. Comparison of the LHV of EF (18 MJ/kg; ref. 40) to the LHV of plastic wastes (35.7 MJ/kg) and paper fiber (12 MJ/kg) leads to the conclusion that an approximate 35% of the EF (i.e., 270,000 short tons) is derived from NRP. The use of EF in the cement industry effectively increases the total waste-‐to-‐energy (WTE) transformation in the U.S. by 0.77 million tons, or about 2.7%. Energy recovery from NRP in WTE plants (3.9 million short tons; Section 4.5) is added to the energy recovery from NRP used in cement production (0.27 million short tons) in Table 11 (Section 4.7).
3.9 Non-‐hazardous, small-‐company industrial wastes Small industrial companies cannot recycle their residues easily and it is likely that many of these residues end up in MSW landfills or at WTE plants. As noted earlier, these unaccounted wastes add to the discrepancy between the EEC and EPA estimates of landfilled tons.
4. STATE BY STATE ESTIMATE OF PLASTICS RECYCLED, COMBUSTED WITH ENERGY RECOVERY, AND LANDFILLED
4.1 Summing up of plastic waste generation and disposition in 2011 As discussed in earlier sections, the total amount of plastic wastes in the MSW stream consisted of 2.66 million tons recycled, 3.9 million tons combusted in WTE plants, 0.27 million tons used as fuel in cement kilns, and 32.5 million tons landfilled. To the landfilled amount, EEC has added 1.9 million tons of plastics in the

18
ASR landfilled, since this material is not included in the MSW characterization studies carried out by the states. Therefore, the total amount of non-‐recycled plastics disposed in landfills in 2011 was estimated at 34.4 (32.5 +1.9) million tons. The methodology used in developing the state-‐by-‐state data was as follows:
a) As noted earlier, the total amount of plastics recycled in 2011 has been estimated by EPA, and confirmed by the American Chemistry Council, at 2.66 million tons. This amount was apportioned to each state in accordance to the fraction of national recycling (87.8 million tons of all materials in MSW stream), as reported by each state to the Columbia University 2013 Survey of Waste Management in the U.S.
b) The percentage of plastics present in post-‐recycling MSW was based on the very detailed characterization studies carried out by fourteen states, during the period of 2003-‐2011. In total, these states represented a population of 140 million people. The composition of post-‐recycling MSW ranged from a low of 9.6% to a high of 17%, and the average weighted composition was 13.2%.
c) The tonnages of MSW combusted with energy recovery in each state, as
reported by the states to the Columbia 2013 Survey, were multiplied by the average plastics composition of 13.2% to yield the amounts of NRP processed in WTE plants and converted to energy in each state.
d) The tonnages landfilled in each state, reported by the states to the Columbia 2013 Survey, were multiplied by the average plastics composition of 13.2% to yield the amount of NRP disposed at landfills, in each state.
The results are discussed in the following sections.
4.2 Tons of plastic recycled in each state In the 2011 EEC report to the American Chemistry Council (1), the estimate of tons of plastics recycled in a state (based on the percentage of national recycling reported by the state) was compared to the percentage of the national capacity of materials recovery facilities existing in the state. The results of this comparison were in good agreement, i.e., states that had more MRF capacity recycled more. In this study, the total amount of plastics recycled nationally (2.66 million tons) was distributed across the states on the basis of the ratio of reported tons of all materials recycled, divided by the national recycled tonnage (87.8 million tons). For example, the state of California reported recycling of 27.7 million tons; therefore, the plastics recycled in California were estimated to be 841,000 (2.66 x 27.7/87.8) tons.
4.3 Tons of plastic combusted with energy recovery in each state The amount of NRP sent to WTE plants in a state was estimated by multiplying the tons of MSW to state WTE plants by the 13.2% concentration of plastics in the MSW to WTE plants and landfills (Table 4). For example, Connecticut reported 2.15

19
million tons combusted in the state’s WTE facilities; therefore, the amount of NRP used for electricity production was 2.28 million x 13.2% = 292,000 tons.
4.4 Estimate of plastic wastes landfilled The amount of plastics landfilled in each state was obtained by multiplying the tons of MSW landfilled, as per the Columbia 2013 Survey, by the 13.2% average concentration of plastics in the MSW to landfills (Table 4). For example, Florida landfilled 13.9 million tons of MSW, which contained an estimated 1.83 million tons of NRP.
4.5 Recycling, energy recovery, landfilling, and generation of plastics in each state The results of the above calculations are shown in Table 9.
Table 9. Tons of plastics recycled, combusted for energy, landfilled and generated in each state
Population 2011
Plastics recycled
Plastics to energy recovery plants
Plastics to landfills
Total plastic wastes generated
Alabama 4,802,740 14,746 28,810 622,328 665,884 Alaska 722,718 915 0 85,150 86,065 Arizona 6,482,505 11,604 0 869,538 881,141 Arkansas 2,937,979 72,915 0 430,573 503,489 California 37,691,912 841,403 112,632 3,953,131 4,907,166 Colorado 5,116,796 52,943 0 807,622 860,565 Connecticut 3,580,709 16,160 291,862 32,627 340,648 Delaware 907,135 4,637 0 88,509 93,147 District of Columbia 617,996 610 28,536 30,065 59,211 Florida 19,057,542 223,339 734,277 1,825,805 2,783,421 Georgia 9,815,210 20,966 0 1,298,378 1,319,344 Hawaii 1,374,810 18,586 71,395 322,610 412,591 Idaho 1,584,985 4,737 -‐ 219,520 224,257 Illinois 12,869,257 30,352 -‐ 1,596,225 1,626,577 Indiana 6,516,922 14,881 91,471 642,134 748,486 Iowa 3,062,309 28,589 5,092 354,793 388,474 Kansas 2,871,238 28,285 -‐ 297,767 326,052 Kentucky 4,369,356 50,347 -‐ 551,947 602,294 Louisiana 4,574,836 937 -‐ 679,747 680,685 Maine 1,328,188 20,447 91,114 28,001 139,562 Maryland 5,828,289 47,677 174,915 309,556 532,147 Massachusetts 6,587,536 65,266 418,387 201,692 685,345 Michigan 9,876,187 25,279 131,240 1,572,504 1,729,022 Minnesota 5,344,861 77,541 133,335 234,800 445,676 Mississippi 2,978,512 3,991 -‐ 359,071 363,062 Missouri 6,010,688 29,349 -‐ 521,683 551,032 Montana 998,199 7,664 -‐ 179,742 187,407 Nebraska 1,842,641 10,105 -‐ 291,995 302,100 Nevada 2,723,322 34,892 -‐ 369,684 404,576 New Hampshire 1,318,194 14,153 34,915 52,953 102,021

20
New Jersey 8,821,155 131,800 282,705 576,893 991,398 New Mexico 2,082,224 10,298 -‐ 260,739 271,037 New York 19,465,197 68,112 507,991 1,350,306 1,926,409 North Carolina 9,656,401 23,978 -‐ 1,013,315 1,037,293 North Dakota 683,932 2,729 -‐ 88,804 91,533 Ohio 11,544,951 74,648 -‐ 1,200,734 1,275,382 Oklahoma 3,791,508 5,366 26,637 578,524 610,527 Oregon 3,871,859 43,624 24,919 252,420 320,963 Pennsylvania 12,742,886 135,430 420,769 776,563 1,332,762 Rhode Island 1,051,302 1,955 -‐ 104,328 106,283 South Carolina 4,679,230 28,953 -‐ 433,596 462,548 South Dakota 824,082 4,770 -‐ 85,062 89,833 Tennessee 6,403,353 46,437 -‐ 794,121 840,558 Texas 25,674,681 84,310 -‐ 3,120,650 3,204,960 Utah 2,817,222 1,713 16,361 270,905 288,978 Vermont 626,431 3,639 -‐ 49,862 53,502 Virginia 8,096,604 85,841 266,094 1,328,224 1,680,159 Washington 6,830,038 98,393 37,076 541,210 676,679 West Virginia 1,855,364 10,470 -‐ 238,478 248,948 Wisconsin 5,711,767 25,592 11,454 550,172 587,218 Wyoming 568,158 1,407 -‐ 80,263 81,670 Total 311,591,917 2,662,781 3,941,987 32,525,319 39,130.087 % of plastic wastes generated
6.8% 10.1% 83.1% 100.0%
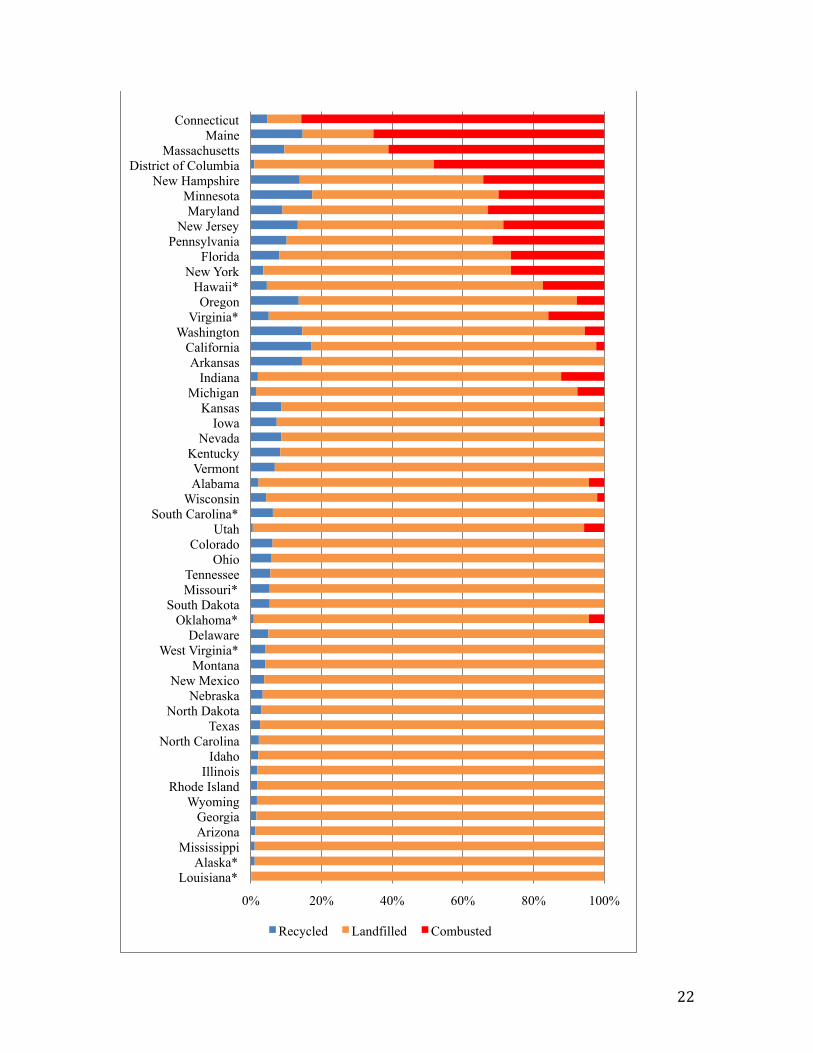
4.6 Discussion of results The present study showed that 6.5% of the plastics present in the MSW stream (2.66 million tons) were recycled, 9.7% (3.9 million tons) was combusted with energy recovery, and 0.7% (0.27 million tons) was used as alternative fuel in cement kilns. This represents an increase in the total recovery rate (recycling + energy recovery) of plastics from 14.3% in 2008 to 16.6% in 2011; most of the NRP (83.3% or 32.5 million tons) was landfilled. The percent distribution of recycling, energy recovery, and landfilling of plastics in the waste stream across the fifty states is shown in graphical form in Figure 3. The states near the top of this graph, i.e., higher up on the “ladder” of sustainable waste management, are Connecticut, Maine, Massachusetts, Minnesota and New Hampshire. These states combine a high rate of recycling with a high waste-‐to-‐energy capacity.
4.7 Generation and disposition of plastic wastes in 2011 Table 10 shows the generation and disposition of plastic in the waste stream in 2011. The amount of plastics in the MSW stream in 2011, as estimated by the EEC, is 39 million tons. The plastics in C&D debris (0.5 million tons) are considered to be accounted for in the MSW stream whereas the automotive shredder residue (1.9 million tons) that is landfilled in MSW landfills should be added, as is done in Table 10. Therefore, the total amount of plastic wastes generated in 2011 was estimated at 41.2 million tons. Of this amount, 2.66 million tons were recycled, in comparison to 2.2 million tons in 2008. The quantity of plastics combusted with energy recovery in WTE facilities was 3.9 million tons while cement kilns used 270,000 tons of NRP

21
as an alternative to conventional fuels such as coal and petroleum coke. Finally, 34.4 million tons of plastics were landfilled. Table 10 summarizes the generation and disposition of plastic wastes in 2011.
Table 10. Generation and disposition of plastic wastes in 2011 (in short tons)*
Generation Tons Percent of all plastic
waste Plastics in MSW 39,341,484 95.4%** Plastics landfilled as ASR 1,896,743 4.6% Total plastics generated 41,238,227 100.0%
Disposition Tons Percent of all plastic
waste Plastics recycled 2,662,781 6.5% Plastics as alternative fuel for cement kilns 270,000 0.7% NRP to WTE 3,941,987 9.5% NRP to landfills includes landfilled ASR) 34,363,459 83.4% Total plastics disposed 41,238,227 100.0%
* The generation of plastics looks at the quantities of plastics generated but not at the end destination while the disposition of plastic wastes is repartitioned according to its destination (where does it go to?), i.e. amount of plastics recycled, plastics used in cement kilns and plastics that were not recycled (NRP). ** This percentage does not indicate a presence of 95.4% of plastics in the MSW stream but applies to the ratio of 39,341,484 tons of plastics in MSW to the total amount of 41,238,227 tons of plastics generated, i.e. of all plastics that are present in the various waste streams, 95.4 % finds its origins in municipal solid waste. Figure 3 (on next page): State-‐by-‐state comparison of the fraction of plastics recovered as materials (i.e. recycling; blue bars), as electricity or heat (red bars), and landfilled (brown bars), in 2011. States with higher sum of materials and energy recovery from plastic wastes are placed higher up on the “ladder” of waste management.
22
0% 20% 40% 60% 80% 100%
Louisiana* Alaska*
Mississippi Arizona Georgia
Wyoming Rhode Island
Illinois Idaho
North Carolina Texas
North Dakota Nebraska
New Mexico Montana
West Virginia* Delaware
Oklahoma* South Dakota
Missouri* Tennessee
Ohio Colorado
Utah South Carolina*
Wisconsin Alabama Vermont
Kentucky Nevada
Iowa Kansas
Michigan Indiana
Arkansas California
Washington Virginia*
Oregon Hawaii*
New York Florida
Pennsylvania New Jersey
Maryland Minnesota
New Hampshire District of Columbia
Massachusetts Maine
Connecticut
Recycled Landfilled Combusted

23
5. POTENTIAL FOR ENERGY RECOVERY FROM NRP Energy is recovered from NRP at WTE facilities by combustion to generate steam and electricity; by partial combustion, to produce syngas; or by pyrolysis, to produce synthetic oil. In 2011, most of the energy recovery from non-‐recycled plastics was by combustion in the 84 waste-‐to-‐energy plants of the U.S. An estimated 3.9 million tons of plastics, mixed in the municipal solid waste stream to WTE plants, were processed in this way. As noted earlier, a certain amount of plastic and paper residues is used as an alternative to fossil fuels by the U.S. cement industry. This “engineered fuel” (EF) is co-‐combusted with petroleum coke, coal, or other fossil fuels to produce clinker in rotary kilns which is then ground to cement. The American Chemistry Council, in collaboration with the University of Texas, has reported that the use of EF for cement production has several environmental benefits (e.g., lower CO2, SO2 emissions, etc.) (49). The environmental benefits of using EF from non-‐recycled waste have also been studied by EEC (30) under the sponsorship of CEMEX cement company. Pyrolysis is a process that transforms the NRP to oil and some syngas by thermal or thermal/catalytic de-‐polymerization at moderate temperatures and in the absence of oxygen. An external heat source is needed and is usually provided by combustion of the syngas by-‐product in a separate combustion chamber and then by transferring the heat of combustion to the pyrolysis reactor across a metal interface. There are several pyrolysis processes under development, including Agilyx (43), Climax Global Energy (44), RES Polyflow (45), CYNAR (46), Vadxx (47), JBI (48) and others. Some of these processes are discussed in the EEC thesis of Demetra Tsiamis (33) and others will be discussed in the forthcoming EEC-‐Columbia thesis of Diane Ye. Since the chemical energy stored in one ton of NRP is equivalent to about 5 barrels of oil, these processes, operating at 80% thermal efficiency, are expected to produce, on average, four barrels of oil per ton of plastic wastes processed. Another way to increase diversion of NRP from landfills is by converting them to thermal energy in new WTE plants. In this way, energy would be recovered from plastics and also other combustible components in the MSW stream.
5.1 Energy value of plastic wastes In the 2011 Report of EEC to ACC, the LHV of plastic wastes was estimated at 28 million Btu (32 MJ/kg) per short ton. However, in the meantime, it came to the attention of EEC that the LHV of LDPE, provided in the 2007 report of the EIA (24.1 MJ/kg; ref. 32) and used in the 2011 EEC Report to ACC, was too low. Several sources were consulted (ref. 22, 23, 24, 32, 33, 42) and there is agreement as to the proper values of the principal resins in NRP, as shown in Table 11.

24
Table 11. Comparison of lower heating values (LHV) reported in literature for principal components of plastics in the waste stream (ref. 22, 23, 24, 32, 33,
42)
LHV, Plastic material EIA, 2008, Mbtu/ton
Stanford, MJ/kg
Polymer Handbook, MJ/kg
Franklin Associates,
MJ/kg
Phyllis database, MJ/kg
Used in this study MJ/kg
PET 20.5 23.2 -‐ 24.7 21.9 23.9 HDPE
38 44.6 43.6 46.5 43.6 44.3 Polyvinyl chloride (PVC) 16.5 -‐ 16.4 18.3 16.8 19.2 LDPE/LLDPE 24.1 42.2 -‐ 46.2 43.5 44.3 PP 38 42.7 43.4 46.4 44.2 44.3 Polystyrene (PS) 35.6 42.0 39.2 -‐ 44.2 41.5 Table 12 shows the recalculation of the average LHV of plastics in the waste stream to MRFs and WTE plants. It is estimated at 30.6 million Btu/ton (35.7 MJ/kg). Table 12. Plastics composition and lower heating value (LHV) of principal
plastics in the U.S. generated plastic waste stream (ASR excluded)
LHV, Materials NRP in thousands of tons
% in NRP
MJ/kg
Million Btu/ton
MJ/kg NRP
Million Btu/ton
PET 4,878 12.40% 24 21 3.0 2.5 HDPE 7,003 17.80% 44 38 7.8 6.7
PVC 2,164 5.50% 19 16.5 1.0 0.9 LDPE/LLDPE 7,711 19.60% 44 38 8.6 7.4 PP 5,468 13.90% 44 38 6.1 5.2 PS 3,423 8.70% 41 35.6 3.6 3.1 Other 8,655 22.00% 25 22 5.5 4.8 Total plastic wastes NRP 39,341 100% 35.7 30.6
An estimated 22% of the generated plastic wastes are categorized by EIA as “Other” and have a calorific value (LHV) of 22 million Btu/ton (25 MJ/kg). This is most likely due to the inclusion, in the “Other” category, of non-‐combustible and low calorific materials, such as inks, metals, paper, etc. It should be noted that the percent composition of plastics in the waste stream is the same as was presented in the 2011 EEC Report to ACC; the only difference is the corrected LHV of LDPE, i.e., 38 million Btu/ton (44 MJ/kg). As mentioned earlier, in contrast to WTE plants, the NRP landfilled also includes ASR and C&D debris deposited in MSW landfills. Table 13 uses the LHV of Tables 8 (ASR) and 12 (NRP), and their respective tonnages (Table 10), to calculate the energy content in all plastic-‐containing streams discarded in landfills. Very little is known about the composition and calorific value of plastics contained in C&D debris; therefore it was assumed that its LHV is the same as the NRP in the MSW

25
stream (i.e., 30.6 million Btu/ton). The composite heating value of the plastic wastes ending up in U.S. landfills was estimated at 30.7 Btu/ton.
Table 13. Amount of plastics that are landfilled, present in MSW and ASR
Tons Million BTU/ton Energy content (MBtu) Plastics in MSW landfilled 32,495,253 30.6 994,351,130 Plastics in ASR landfilled 1,896,743 32.0 60,666,146 Total tons of plastics landfilled 34,391,996 30.7 1,055,017,276
5.2 Energy equivalence of NRP to coal, oil, and natural gas The value of 30.6 million Btu/ton (35.7 MJ/kg; Table 13) was used in the following calculations. In comparison, the fossil fuels used in the U.S. have the heating values shown in Table 14 and Figure 4.
Table 14. Energy content of different types of fuels in Btu per pound
Fuel type Btu/lb MJ/Kg Natural gas 20,300 47.3 Crude Oil 18,400 42.9 Non-‐recycled plastics 15,338 35.7 Petroleum coke 12,700 29.6 U.S. coal 1 11,200 26.1 U.S. coal 2 9800 22.8 Wood 6,000 14.0
0 5,000 10,000 15,000 20,000 25,000
Wood
U.S. coal 2
U.S. coal 1
Petroleum coke
Non-‐Recycled Plastics
Crude Oil
Natural gas
Btu/lb

26
Figure 4: Graphical representation of the energy content of the different fuel types mentioned in Table 15 (lower heating value, Btu/lb)
The above chart contains two entries for the LHV of coal because different grades of coal contain different amounts of fixed carbon, volatiles, moisture and other non-‐combustible minerals. Thus, U.S. Coal 1 is an average of high grade coals, such as the Appalachian bituminous coal while U.S. Coal 2 is an average of low grade coals, such as coal from the Powder River Basin in Wyoming.
The following heating values were used in these calculations:
• 1 ton NRP: 30.7 million Btu • 1 ton coal: 22 million Btu • 1 barrel oil: 5.8 million Btu • 1000 standard cubic feet of natural gas: 1.03 million Btu
The above numbers correspond to 5.3 barrels of oil per ton of NRP and 1.4 tons of coal per ton of NRP. Hypothetically, if all the landfilled NRP in 2011 were to be used for energy recovery, the U.S. would avoid the extraction and use of:
• 48 million tons of coal, or • 180 million barrels of oil, or • 1 trillion standard cubic feet of natural gas.
Table 15 shows the amounts of NRP landfilled in each state and their energy equivalent lost to landfills. Subsequently, this energy loss is calculated to show equivalent tons of coal, barrels of oil, and cubic feet of natural gas.
Table 15. Comparison of the heating value of landfilled NRP to other fuels
State NRP not converted to energy (tons)
Million Btu of NRP lost (at 30.7 MBtu/ton)
Tons of coal equivalent to NRP heating value
Barrels of oil equivalent to NRP heating value
Natural gas eq. to NRP Heating value (in 1000 standard cubic ft.)
Alabama 622,328 19,082,798 867,400 3,290,138 18,526,989 Alaska 85,150 2,611,002 118,682 450,173 2,534,954 Arizona 869,538 26,663,127 1,211,960 4,597,091 25,886,531 Arkansas 430,573 13,202,911 600,132 2,276,364 12,818,360 California 3,953,131 121,217,102 5,509,868 20,899,500 117,686,507 Colorado 807,622 24,764,565 1,125,662 4,269,753 24,043,267 Connecticut 32,627 1,000,446 45,475 172,491 971,307 Delaware 88,509 2,714,010 123,364 467,933 2,634,961 Washington DC 30,065 921,897 41,904 158,948 895,046 Florida 1,825,805 55,985,698 2,544,804 9,652,707 54,355,047 Georgia 1,298,378 39,812,896 1,809,677 6,864,292 38,653,297 Hawaii 322,610 9,892,369 449,653 1,705,581 9,604,242 Idaho 219,520 6,731,272 305,967 1,160,564 6,535,215 Illinois 1,596,225 48,945,964 2,224,817 8,438,959 47,520,354 Indiana 642,134 19,690,109 895,005 3,394,846 19,116,611

27
Iowa 354,793 10,879,211 494,510 1,875,726 10,562,341 Kansas 297,767 9,130,607 415,028 1,574,243 8,864,667 Kentucky 551,947 16,924,660 769,303 2,918,045 16,431,709 Louisiana 679,747 20,843,477 947,431 3,593,703 20,236,386 Maine 28,001 858,610 39,028 148,036 833,601 Maryland 309,556 9,492,078 431,458 1,636,565 9,215,610 Massachusetts 201,692 6,184,606 281,118 1,066,311 6,004,472 Michigan 1,572,504 48,218,569 2,191,753 8,313,546 46,814,145 Minnesota 234,800 7,199,801 327,264 1,241,345 6,990,098 Mississippi 359,071 11,010,390 500,472 1,898,343 10,689,699 Missouri 521,683 15,996,672 727,121 2,758,047 15,530,749 Montana 179,742 5,511,543 250,525 950,266 5,351,012 Nebraska 291,995 8,953,609 406,982 1,543,726 8,692,825 Nevada 369,684 11,335,840 515,265 1,954,455 11,005,670 New Hampshire 52,953 1,623,728 73,806 279,953 1,576,435 New Jersey 576,893 17,689,589 804,072 3,049,929 17,174,358 New Mexico 260,739 7,995,191 363,418 1,378,481 7,762,322 New York 1,350,306 41,405,210 1,882,055 7,138,829 40,199,233 North Carolina 1,013,315 31,071,858 1,412,357 5,357,217 30,166,852 North Dakota 88,804 2,723,042 123,775 469,490 2,643,730 Ohio 1,200,734 36,818,796 1,673,582 6,348,068 35,746,404 Oklahoma 578,524 17,739,600 806,345 3,058,552 17,222,913 Oregon 252,420 7,740,093 351,822 1,334,499 7,514,653 Pennsylvania 776,563 23,812,205 1,082,373 4,105,553 23,118,646 Rhode Island 104,328 3,199,070 145,412 551,564 3,105,894 South Carolina 433,596 13,295,591 604,345 2,292,343 12,908,341 South Dakota 85,062 2,608,316 118,560 449,710 2,532,345 Tennessee 794,121 24,350,582 1,106,845 4,198,376 23,641,342 Texas 3,120,650 95,690,265.93 4,349,558 16,498,322 92,903,171 Utah 270,905 8,306,901 377,586 1,432,224 8,064,952 Vermont 49,862 1,528,958 69,498 263,613 1,484,425 Virginia 1,328,224 40,728,077 1,851,276 7,022,082 39,541,822 Washington 541,210 16,595,442 754,338 2,861,283 16,112,080 West Virginia 238,478 7,312,579 332,390 1,260,789 7,099,591 Wisconsin 550,172 16,870,224 766,828 2,908,659 16,378,858 Wyoming 80,263 2,461,146 111,870 424,336 2,389,462 ASR* 1,896,743 58,160,905 2,643,677 10,027,742 56,466,898 Total 34,391,996 1,055,017,276 47,955,331 181,899,530 1,024,288,618 * The quantity of ASR has been estimated, however, its disposition has not been determined. As a result, this ASR quantity has not been appointed to any state in specific, but has been accounted for separately as it does contribute to the NRP tonnage not converted to energy.
5.3 Transforming NRP to oil by means of pyrolysis At present, many U.S. communities source separate the types of plastics that can be sold as feedstock for plastic recycling. As illustrated in the EEC Hierarchy of Sustainable Waste Management (Figure 1), reuse and recycling are the preferred waste management, but it is not practical to collect and recycle all plastic wastes. However, NRP can also be source-‐separated and converted into oil by means of a thermal treatment called pyrolysis. As noted earlier, the heating value of one ton of NRP corresponds to the heating value of 5.3 barrels of oil. In the 2011 EEC Report to ACC, the efficiency of conversion had been estimated very conservatively at 3

28
barrels per ton of NRP. Over the last three years, EEC analysis and research on pyrolysis processes tested on a large pilot scale (34), along with other information, have shown that a more realistic estimate is 4 barrels per ton of oil, i.e., at a thermal efficiency of 4/5.3= 75%. Therefore, a conversion factor of 4 barrels per ton of NRP has been used in this study, as it is more in-‐line with processes under development.
If, hypothetically, the NRP that are currently landfilled were to be converted into oil, a total of 136 million barrels of oil would be produced, corresponding to about 5.7 billion gallons of transportation fuel. Light vehicles and trucks have an average mileage of 21.5 miles per gallon at an average yearly driving distance of 12,000 miles, thus yielding an average consumption of 535 gallons of diesel per year (36). However, it has been shown (35) that oil derived from plastics contains about 20% less energy than diesel oil; therefore, consumption of plastics oil will be 20% higher than diesel oil, i.e., 641 gallons per year. On the basis of these estimates, about 8.9 million cars could be driven on NRP-‐derived fuel. The economic value of this amount of NRP converted into gasoline, assuming an average price of $3.5 per gallon in 2011 (37) would be about $20 billion dollars.
It should be noted that the above numbers are based on the current amount of MSW landfilled. Based on recent trends, EEC expects that some of the current landfilling will likely be replaced by increased recycling and composting. For example, the American Chemistry Council has reported a trend towards increased recycling of non-‐container rigid plastics and plastic bags, wraps, and film (50).
5.4 Transforming of NRP to methanol, ethanol or other chemicals Plastics can be partially oxidized to synthetic gas (CO+H2), which can then be synthesized chemically to methanol (CH4OH) (38). However, as discussed in detail in Appendix 1 to this report, the thermal efficiency of this combination of processes is relatively low and is not justified by the price of methanol at this time (about $50 per barrel) and the fact that the LHV of methanol (20 MJ/kg) is about one half that of synthetic oil. Converting the green and food wastes contained in MSW into ethanol has been reported to have a conversion efficiency of about 70 gallons of ethanol per ton of MSW (38; 1 barrel =42 U.S. gallons). Mixed MSW is a very heterogeneous material and so far there has not been an industrial application of such a process. However, Enerkem has built the first commercial scale facility for converting MSW to fuels and chemicals in Edmonton, Alberta. This plant is expected to produce 10 million gallons of ethanol per year from pre-‐processed and sorted MSW, at Edmonton’s Integrated Processing and Transfer Facility (IPTF).
5.5 Potential of using source-‐separated NRP in dedicated power plants A hypothetical alternative to pyrolysis of NRP to fuel oil is the combustion of source-‐separated NRP in dedicated WTE plants. On average, the electricity generated in a

29
U.S. WTE plants fueled with MSW is 0.6 MWh/ton of MSW. However, the LHV of non-‐recycled plastics is about three times higher than that of MSW. Therefore, combustion of NRP in a dedicated WTE power plant could be expected to generate 1.8 MWh/ton of energy. If all NRP that are currently landfilled were to be source-‐separated and combusted in NRP-‐fueled WTE facilities, the amount of energy produced could amount to 61.9 million MWh. The average amount of electricity a U.S. household uses on a yearly basis is 10.8 MWh (36). Therefore, the use of all landfilled NRPs in dedicated WTE facilities could create sufficient amounts of energy for 5.7 million such households (a typical house hold consists of four persons).
5.6 Increased utilization of NRP by means of increased U.S. waste-‐to-‐energy capacity
Waste-‐to-‐energy facilities built in recent years generate about 0.6 MWh/ton, up from 0.5 MWh/ton for older WTE plants. This higher efficiency corresponds to the use of 0.4 ton of coal in utility power plants. If it were possible to divert all tonnage landfilled in the US in 2011 (247 million tons) to new WTE facilities, the electricity generated could be about 150 million MWh, enough to power 13.8 million homes, about 12% of the U.S. total, at an assumed average household consumption of 10.8 MWh per year. Using MSW as a fuel instead of importing coal from other states is particularly interesting for states that import large quantities of coal and export large amounts of MSW to other states for landfilling. Figure 5 gives an overview of the amount of coal imported and the MSW coal equivalent produced per state. If the MSW were used as a fuel instead of coal, it is possible that states such as New York, California, Indiana, New Jersey and Michigan would not need to import coal anymore and the transportation of coal from state to state would be reduced by 22%. It is also interesting to point out that the state of California could even stop importing coal if only the NRP coal equivalents were used. California imports on a yearly basis 1.9 million tons of coal. If California were to divert about 15% of its MSW (or 4.7M tons to WTE plants), the state would no longer need to import coal. Diverting all MSW to WTE plants would result in an energy production that equals about 6.5 times the coal energy equivalent of what the state currently imports.

30
Figure 5: Coal imported per state (grey) and the MSW coal equivalent produced per state (green) in thousands of short tons (39).
Further, in some European nations, the low pressure steam produced by turbines at the WTE facilities heats water that is used for district heating or industrial purposes. For example, 30% of the district heating of Denmark is provided by 28 waste-‐to-‐energy plants (41). If the same practice were to be followed in the U.S., the energy recovered from WTE plants could increase by an estimated 1 MWh of thermal energy per ton of MSW combusted. A household typically uses about 70% of its total energy for heating and cooling purposes and the average amount of energy needed per U.S. household is 25 MWh per year. On the basis of these numbers, the thermal energy from WTE low-‐pressure steam could be 247 million MWh, enough to supply heating and cooling to an additional 9.8 million homes.
5.7 Greenhouse gas (GHG) benefit of increasing WTE capacity Increasing the WTE capacity of the U.S. would also result in a significant reduction of the emission of greenhouse gases (GHG). It has been estimated that diverting one ton of MSW from landfilling to WTE reduces GHG emissions by 0.5 to 1 ton of carbon dioxide equivalent, depending on the degree of landfill gas capture (51). Therefore, diverting the 247 million tons of MSW that are landfilled could reduce the U.S. GHG emissions by 123-‐247 million tons of CO2 equivalent, depending on the average methane collection efficiency of U.S. landfills.
0
10000
20000
30000
40000
50000
60000
Coal imported
MSW Coal Equivalent

31
5.8 Landfill avoidance by dedicated usage of MSW and NRP plastics Landfills stock on average about 10 tons of garbage per square meter. Knowing that the amount of MSW landfilled in 2011 was 247 million tons, 24.7 km2 of land is being lost each year, or an equivalent of about 4,600 American football fields.. Comparing this with the size of Central Park in Manhattan, about 7.3 Central Parks are needed for the U.S. MSW landfilled each year. Another useful comparison is that about 28% of the surface area of the island of Manhattan is used for landfilling the entire U.S. MSW.
CONCLUSIONS While the U.S. continues to make improvements in reducing waste generation per capita and increasing recycling rates, there remains a large fraction of municipal solid waste (MSW) that cannot be recycled economically. Some of this waste is converted to energy at WTE plants, but the U.S. remains behind much of Europe and Japan in using this technology. The main objective of this study was to determine the quantity of non-‐recycled plastics in the United States that are now landfilled but could be converted into energy. The study included municipal solid waste (MSW) and, also, other waste streams that contain plastics, such as construction and demolition (C&D) debris, and automotive shredder residue (ASR), which are now disposed in MSW landfills. The MSW generated in the U.S. in 2011 was 389 million tons, with plastics representing about 11% (41.2 million tons) of the total. Of this amount, 2.66 million tons were recycled, 3.9 million tons were converted to energy in waste-‐to-‐energy plants, 0.27 million tons were used as alternative fuel in cement production, and 34.4 million tons were landfilled. This study also included other waste streams that are disposed in MSW landfills. These included 0.5 million tons of plastics in construction and demolition debris (C&D) and an estimated 1.9 million tons of plastics contained in automotive shredder residue (ASR). Key findings of this study were:
• Between 2008 and 2011, recycling of materials from the U.S. MSW increased by 18.5 million tons while tonnage to waste-‐to-‐energy plants increased by 3.8 million tons. For plastics, the total recovery rate (recycling + energy recovery) increased from 14.3% in 2008 to 16.7% in 2011.
• If all the MSW that was landfilled in 2011 were to be diverted to WTE power plants, they could generate enough electricity to supply 13.8 million households, i.e., 12% of the U.S. total. In addition, if the steam turbine exhaust of the WTE plants were to be used for district heating, as is done in Denmark

32
and some other northern European countries, the “waste” steam would provide district heating for an additional 9.8 million homes.
• Every ton of MSW combusted for electricity generation in recently built WTE plants replaces an estimated 0.4 tons of coal. Therefore, diversion of MSW from landfills to new WTE plants could reduce coal mining in the U.S. by about 100 million tons per year.
• If MSW were to be used as a fuel in WTE power plants, it could replace all the
coal imported by states such as New York, California, Idaho, New Jersey and Maine. Use of MSW fuel in place of coal could reduce the U.S. state-‐to-‐state transportation of coal by 22%.
• Diversion of all MSW from landfills to WTE plants could result in reducing
the greenhouse gas (GHG) emissions of waste management in the U.S. by at least 123 million tons of carbon dioxide equivalent (2.1% of U.S. total greenhouse gas emissions), comparable to the annual emissions of over 23 million cars.
• The current annual landfilling of MSW in the U.S. was estimated to require a
land surface of about 6,100 acres, equivalent to nearly 4,600 U.S. football fields, or seven New York City Central Parks.
• The average lower heating value of non-‐recycled plastics (NRP) was
estimated at 30.7 million Btu/ton (35.7 MJ/kg). The amount of NRP landfilled in 2011 (34.4 million tons) contained a chemical energy content equivalent to:
-‐ 48 million tons of coal, or -‐ 180 million barrels of oil, or -‐ 1 trillion standard cubic feet of natural gas
• If the landfilled NRP were to be source-‐separated and converted through
pyrolysis into synthetic oil, this could produce 136 million barrels of oil per year, or 5.7 billion gallons of gasoline, enough to fuel an estimated 8.9 million cars.
• Alternatively, if the NRP were to be source-‐separated and used as fuel in dedicated WTE facilities, these plants would generate 61.9 million MWh of electricity, enough to supply an estimated 5.7 million households.

33
REFERENCES
1. Themelis N. J., Castaldi M. and Arsova L. “Energetic and Economic value of Non-‐Recycled Plastics (NRP) and Municipal Solid Waste (MSW) that are currently landfilled in the 50 States,” 2011
2. Shin D. and Themelis N.J. “Generation and Disposition of Municipal Solid Waste in the United States – A National Survey,” 2013.
3. Earth Engineering Center of Columbia University (accessed 12/2013). Available from: http://www.seas.columbia.edu/earth/
4. Kaufman S.M., and N. J. Themelis, “Using a Direct Method to Characterize and Measure Flows of Municipal Solid Waste in the United States,” J. Air and Waste Management Association, Volume 59, p.1386-‐1390, December 2009.
5. Van Haaren R., Themelis N.J., Goldstein, “State of Garbage in America,” 2010. 6. Detailed Characterization of Construction and Demolition Waste, Cascadia
Consulting Group, 2006. 7. EPA, Municipal Solid Waste Generation, Recycling, and Disposal in the United
States: 2011 Facts and Figures, 2011 (accessed 12/2013). Available from: http://www.epa.gov/osw/nonhaz/municipal/pubs/MSWcharacterization_508_053113_fs.pdf
8. EPA, Facts and Figures, Plastics 2011 (accessed 12/2013). Available from: http://www.epa.gov/osw/nonhaz/municipal/pubs/MSWcharacterization_508_053113_fs.pdf
9. Abramowitz and Sun, Indiana Waste Characterization Report, 2012. 10. Municipal Solid Waste in the United States, 2011 Fact and Figures, United
States Environmental Protection Agency (accessed 12/2013). Available from: http://www.epa.gov/epawaste/nonhaz/municipal/pubs/MSWcharacterization_fnl_060713_2_rpt.pdf
11. American Chemistry Council: 2011 United States National Post-‐Consumer Plastics Bottle Recycling Report, 2011 (accessed 12/2013). Available from: http://www.plasticsrecycling.org/images/pdf/resources/reports/Rate-‐Reports/National-‐Postconsumer-‐Plastics-‐Bottle-‐Recycling-‐Rate-‐
12. EPA, Municipal Solid Waste in the United States: 2009 Facts and Figures, 2009 (accessed 12/2013). Available from: http://www.epa.gov/wastes/nonhaz/municipal/pubs/msw2009rpt.pdf
13. 2011 National Postconsumer Non-‐Bottle Rigid Plastic Recycling Report, Moore Recycling Associates Inc., 2011 (accessed 12/2013). Available from: http://www.moorerecycling.com/2011Non-‐Bottle%20Rigid%20Rpt_FINAL.pdf
14. EPA, Characterization of Building-‐related Construction & Demolition Debris in the United States, Franklin Associates, 1998.
15. European Environment Agency, Eurostat: “Waste Generated in Europe” Luxembourg 2000 and ETC/W enquiry on specific waste streams.
16. Detailed Characterization of Construction and Demolition Waste, Cascadia Consulting Group, 2006.
17. United Stated Department of Transportation, Bureau of Transportation

34
Statistics (accessed 12/2013). Available from: http://www.rita.dot.gov/bts/sites/rita.dot.gov.bts/files/publications/national_transportation_statistics/html/table_04_58.html
18. Jody, B.J. et al. “End of Life Vehicle Recycling: State of the Art Resource Recovery from Shredder Residue,” Energy Systems Division, Argonne National Laboratory, 2011.
19. EPA, “Municipal Solid Waste in The United States: 2011 Facts and Figures,” p. 20.
20. “Plastics: A material of choice for the automotive industry. Insight into consumption and recovery in Western Europe,” 1999.
21. From report buyer (chemicals, plastics): Automotive Plastics Market for Passenger Cars, By Type (Polypropylene, Polyurethane, HDPE, ABS, Polycarbonate & Composites), Application (Interior, Exterior & Under Bonnet) & Geography.
22. Franklin Associates: Fire, Frank L. Combustibility of Plastics. Van Nostrand. 1991 Thermodynamic Data for Biomass Materials and Waste Components. The American Society of Mechanical Engineers. 1987.
23. Polymer Handbook (CRC Press): Tewarson A. and Babrauskas, V., in SFPE Handbook of Fire Protection Engineering, 2nd ed., National Fire Protection Association, Quincy, MA, 1995.
24. Heats of combustion of high temperature polymers. Richard N. Walters, Stacey M. Hackett and Richard E. Lyon. Federal Aviation Administration, William J. Hughes Technical Center, Fire Safety Section AAR-‐422 (accessed 12/2013). Available from: http://large.stanford.edu/publications/coal/references/docs/hoc.pdf
25. Wittbecker, Daems and Werther, “Performance of Polyurethane (PUR) in building products in fires,” 2001.
26. Lee B. et al. “Alternatives for treatment and disposal cost reduction of regulated medical waste,” 2003.
27. Medical Waste Committee (MWC), “Medical waste disposal.” J. Air & Waste Manage. Assoc. 44, 1176–1179, 1994.
28. Pruess A. et al. “Safe management of wastes from health-‐care activities,” World Health Organization, 1999.
29. American Hospital Association Annual Survey of Hospitals, Hospital Statistics, 1976, 1981, 1991-‐2011.
30. Zhang J. and Themelis N.J., “Energy, Environmental and greenhouse gas effects of using alternative fuels in cement production,” 2013.
31. N.J. Themelis and L. Arsova “Identification and assessment of available technologies for materials and energy recovery from flexible packaging waste (FWP),” 2010 (accessed 12/2013). Available from: http://www.seas.columbia.edu/earth/wtert/sofos/FPW_Recycling_May2011.pdf
32. Methodology for Allocating Municipal Solid Waste to Biogenic and Non-‐Biogenic Energy (2007) (accessed 12/2013). Available from: http://www.eia.gov/totalenergy/data/monthly/pdf/historical/msw.pdf
33. Phyllis database for biomass and waste (accessed 12/2013). Available from:

35
https://www.ecn.nl/phyllis2/ 34. Tsiamis D. and Themelis N.J., “Transforming the Non-‐Recycled Plastics of
New York City to Synthetic Oil,” 2013. 35. C. Cleetus, S. Thomas and S. Varghese, “Synthesis of Petroleum-‐Based Fuel
from Waste Plastics and Performance Analysis in a CI Engine,” Journal of Energy, Volume 2013, 2013.
36. EIA and EPA, calculations and references (accessed 12/2013). Available from: http://www.epa.gov/cleanenergy/energy-‐resources/refs.html and http://www.eia.gov/tools/faqs/faq.cfm?id=97&t=3
37. Gasoline and Diesel Fuel Update (accessed 12/2013). Available from: http://www.eia.gov/petroleum/gasdiesel/
38. “Gasification of Non-‐Recycled Plastics from MSW in the United States,” Gershman, Brickner and Batton Inc., 2013 (accessed 12/2013). Available from: http://plastics.americanchemistry.com/Sustainability-‐Recycling/Energy-‐Recovery/Gasification-‐of-‐Non-‐Recycled-‐Plastics-‐from-‐Municipal-‐Solid-‐Waste-‐in-‐the-‐United-‐States.pdf
39. Production of bio-‐methanol – Technology Brief. International Renewable Energy Agency, International Energy Agency, 2013 (accessed 12/2013). Available from: http://www.irena.org/DocumentDownloads/Publications/IRENA-‐ETSAP%20Tech%20Brief%20I08%20Production_of_Bio-‐methanol.pdf
40. Data from National Mining Association (accessed 12/2013). Available from: http://www.nma.org/pdf/c_use_state.pdfg
41. Ulloa P. and Themelis N.J., “Potential for Combined Heat and Power and District Heating and Cooling from Waste-‐to-‐Energy Facilities in the U.S. – Learning from the Danish Experience,” 2007.
42. Phyllis international database, (accessed 1/2014) www.ecn.nl/phyllis2/Browse/Standard/ECN-‐Phyllis.
43. www.agilyx.com 44. www.climaxglobalenergy.com/ 45. www.respolyflow.com 46. http://Cynarplc.com 47. http://www.vadxx.com/ 48. www.plastics2oil.com 49. Fyffe, J. et al., “Residue-‐Derived Solid Recovery Fuel for Use in Cement Kilns,”
2012 (accessed 1/2014). Available from: http://plastics.americanchemistry.com/Sustainability-‐Recycling/Energy-‐Recovery/Residue-‐Derived-‐Solid-‐Recovered-‐Fuel-‐for-‐Use-‐in-‐Cement-‐Kilns.pdf
50. 2011 National Postconsumer Non-‐Bottle Rigid Plastic Recycling Report, Moore Recycling Associates Inc., 2011 (accessed 12/2013). Available from: http://plastics.americanchemistry.com/Education-‐Resources/Publications/2012-‐National-‐Report-‐on-‐Post-‐Consumer-‐Non-‐Bottle-‐Rigid-‐Plastic-‐Recycling.pdf
51. Matthews E. and N.J. Themelis, “Potential for Reducing Global Methane Emissions From Landfills, “ 2007 (accessed 1/2014). Available from:

36
http://www.seas.columbia.edu/earth/wtert/sofos/Matthews_Themelis_Sardinia2007.pdf
52. EPA, Polychlorinated Biphenyls: Recycling Plastics from Shredder Residue, 2012 (accessed 3/2014). Available from: http://www.epa.gov/wastes/hazard/tsd/pcbs/pdf/prepubl_notice_isri_frn_signed_032913.pdf
APPENDIX 1. Potential for processing non-‐recycled plastics (NRP) to methanol by Prof. Marco J. Castaldi, Earth Engineering Center, City College of New York (CUNY)
Gasification of relatively high heating value solid wastes is becoming more prevalent as it can produce carbon monoxide (CO) and hydrogen (H2), commonly referred to as a synthesis gas. This gas can be used as a building block for other chemicals and this provides options downstream of the gasifier. Those options range from combustion of the syngas in a boiler to synthesis of chemicals, such as alcohols and fuels. A considerable amount of work has been completed regarding gasification options using various plastic types as starting materials. The more fundamental studies have been conducted on high-‐density polyethylene (HDPE) to determine the parameters that affect product distribution from gasification and pyrolysis systems. Because HDPE is well characterized, it is possible to develop a complete understanding of the reaction sequences and how operating conditions influence these sequences. For example, gasification experiments have shown that reactor temperatures near 730°C increase the yield of ethylene (1). In addition, the total yield of gaseous products increases as the temperature is increased. This is similar for pyrolysis processes that operate without any oxygen reactant. At the same time, a decrease in the amount of heavy hydrocarbons, such as oil and wax, is observed. The ethylene/ethane (C2H4/C2H6) ratio increases with temperature and is generally higher for gasification as compared to pyrolysis. The presence of oxygen appears to result in a more effective cracking of the HDPE with C3 and C4 compounds exhibiting a maximum concentration near 730°C. In terms of utilization of the syngas resulting from the gasification of solid material, methanol (CH3OH) production is considered one of the more promising chemicals. This is due to the large market and the development of specialty catalysts that provide very high selectivity toward methanol production compared to other processes such as the Fischer-‐Tropsh (F-‐T) method for more complex chemicals and fuels. The primary theoretical pathway to synthesize methanol is shown below in the following two equations. First the plastic must be gasified in the presence of an oxygen co-‐reactant to form the necessary CO.

37
The syngas is then routed to a high pressure catalytic reactor to make methanol. CO + 2H2 à CH3OH
It should be recognized that these are ideal stoichiometric reactions that are rarely achieved in practice. In practice, the conversion of plastic waste to synthesis gas usually results in formation of the by-‐products CO2, H2O and carbonaceous particulate matter (soot). These by-‐products lower the overall efficiency and may cause operating problems in the downstream methanol reactor. Therefore, there must be gas cleaning equipment installed to remove water and soot as well as other hydrocarbons and impurities that can foul or damage the methanol synthesis catalyst. This gas cleaning equipment is similar to air pollution control systems installed for combustion processes (see Figure 1 below). In addition the syngas leaves the gasifier at elevated temperature (700°C or greater) and must be cooled, typically to about 250°C or less, before entering the gas cleaning train. If the enthalpy from that temperature change is not utilized, it will significantly reduce the process efficiency. The production of methanol is one of the simplest chemicals to make from syngas yet it is a reaction that is constrained by thermodynamic equilibrium, whichlimits the process to low conversion through the reactor and therefore requires recycling of unconverted syngas. To minimize energy usage and capital equipment costs, any by-‐products and inert gases that are in the syngas stream -‐ such as CO2, N2 -‐ need to be minimized. The reaction is also strongly exothermic requiring significant cooling during the process, otherwise the methanol can further react to produce different alcohols (such as ethanol and propanol) and methane. These recycle and cooling systems are largely responsible for the investment costs associated with the syngas conversion to methanol. Importantly, the relevant stoichiometry is not the molar ratio of H2 to CO2, which should in principle equal 2 as shown by the reaction above. Instead a molar ratio of (H2-‐CO2)/(CO+CO2) = 2 is more applicable. CO2 appears in the stoichiometric number because it is present when synthesis gas is produced and consumes hydrogen during the methanol synthesis. There have been many attempts to make syngas from waste plastics, but only a couple of processes have been demonstrated to actually make methanol. A patent that describes a process via gasification for converting solid waste with the chemical composition to methanol is shown in Table 12. This system produced 2809 kg/hr of methanol from a 5 ton/hr solid feed rate, i.e., about 0.6 tons methanol per ton of plastic waste. Because the density of methanol is 0.79 kg/liter and there are 119 liters in a fluid barrel, the methanol yield, according to this patent, was 6.4 barrels of methanol per ton of plastic wastes (e.g., 0.6 ton MeOH per ton plastic × 1000 kg/ton
222222 )()()( HmxCOlOmHOHC y
steamairfromoxygen
mx
plasticyx ++→+−+

38
÷ (0.79 kg/l ×119 l/barrel) instead of the estimated 4 barrels of oil obtained by pyrolysis of the plastic wastes. The heating value from NRP is 35.7 MJ/kg, therefore it is theoretically possible to produce approximately 12.9 barrels of methanol per ton of NRP. The patented process yields approximately 6.4 barrels of methanol per ton, resulting in an overall process efficiency of 49.6%. However this could have a significant impact on the methanol industry. Currently, there is approximately 2.6 billion gallons of methanol produced each year in the U.S, mostly from natural gas. Taking the 6.4 barrels and multiplying by the 34.1 million tons of NRP sent to landfills yields 218 million barrels of methanol or 7 billion gallons of methanol, about 2.5 times the total U.S. methanol production per year. The example provided in this patent shows that 68% by volume of the syngas consists of H2 and CO. The syngas mixture was brought to a temperature and pressure of about 300°C and 1400 psi, as required to synthesize the methanol. The reactor is fed with a high purity O2 gas stream as the oxidizing environment to form the syngas components with some CH4, CO2 and some higher hydrocarbons. The gasifier produced the products shown in Table 2. Table 1. Ultimate Analysis of Waste2 Table 2. Gasifier Exit Stream
This gas stream was separated using a cryogenic system to separate the CH4 and CO2 from the higher hydrocarbons. The higher hydrocarbons were further reacted to produce more H2 for the methanol synthesis process. The reactions yielded an approximate 60% conversion rate per run through the reactor, yielding methanol and by-‐products such as higher alcohols. These by-‐products and unreacted CO, CO2 and H2 need to be separated to enable the CO, CO2 and H2 to be recycled back to the methanol synthesis reactor. A 5 ton/day demonstration was conducted by Nippon Steel in 2002 using primarily polyethylene (PE) obtained from electrical wire insulation and about 10% PVC.4 The figure below, taken from the technical report, shows an overall process flow diagram from waste feeding to final methanol separation and output.

39
Figure 1. Demonstration test equipment for conversion of waste plastic to methanol (from 4)
Figure 1 demonstrates that the process to convert the syngas to methanol is almost two-‐thirds of the entire system. The gasification system has a feed rate of 250 kg/hr operating at approximately 1350°C. The carbon conversion rate (i.e., carbon from plastic to carbon in the syngas) was 92%, with an overall thermal efficiency of 51%. The optimum configuration would produce a 96% carbon conversion and 63% efficiency. This low thermal efficiency was due to the fact that there was about 8% of carbon remaining in a solid phase exiting the gasifier, which had to be removed, and about 49% of the energy that was in the plastic feed was not captured. The resulting syngas composition is shown in the table below and is similar to the composition from the patented process described above. Table 3. Syngas Composition for Nippon Steel Demonstration4
It can be seen from Table 3 that the H2/CO = 0.9 and the (H2-‐CO2)/(CO+CO2) = 0.16, which is significantly below the optimal value of 2.0. This is because of the high amount of CO2 that is produced due to the partial oxidation process (i.e., the use of oxygen). These two examples show that it is technically possible to convert waste plastics to syngas followed by methanol synthesis. However, they are complicated processes that require significant engineering and operating expertise. To efficiently gasify

40
the plastic is a complex process that requires a significant input of heat energy. If the goal of the gasification of plastic is to produce syngas, then an oxygen source must be provided. The obvious source is air, which can be metered in properly to partially oxidize the solid plastic producing heat for the reaction and the syngas mixture. But air brings 3.76 times more nitrogen than oxygen, and nitrogen is an inert that must be removed prior to entering any downstream synthesis reactor system. The nitrogen can be removed prior to the gasification system, but that requires cryogenic separation technologies and is expensive. Another method of getting oxygen as a co-‐reactant is from steam. The advantages of using steam over oxygen include no dilution due to nitrogen, additional hydrogen and production of very little CO2. However, a heat source must be added because the steam gasification reaction is endothermic. Some processes mix oxygen and steam, such as that applied in the Nippon steel demonstration, to achieve autothermal operation. The oxygen initiates the exothermic partial oxidation process which then activates the endothermic steam gasification. The oxygen/steam mixture is typically considered the best mode of operation because it balances the thermal requirements while minimizing the amount of steam that must be generated and the amount of CO2 that will be produced. Based on the above information the concept of converting waste plastics to chemicals, such as methanol, is technically viable. Yet there are two complex systems, gasification to form syngas and chemical production from syngas, that need to interface efficiently. Usually it is easier to optimize a process that yields a single output, such as gasification which produces a large amount of CO and H2 at the proper ratio with small amounts of inert and other by-‐products. The high quality syngas stream can then be transported (or sold) to a process that is optimized to convert syngas to a chosen chemical. This model is currently used by Agylix to produce a crude oil from waste plastics that it sells to a local refiner to further process into fuel. Agylix concentrates on producing consistent oil with high efficiency and low cost and the refiner buys the oil incorporating it into existing streams.
REFERENCES TO APPENDIX 1: 1. Mastral, F.; Esperanza, E.; Berrueco, C.; Juste, M.; Ceamanos, J., Fluidized bed
thermal degradation products of HDPE in an inert atmosphere and in air–nitrogen mixtures. Journal of Analytical and Applied Pyrolysis 2003, 70 (1), 1-‐17.
2. Funk, H. F. Solid waste refining and conversion to methanol. 1992. 3. Boundy, R. G.; Diegel, S. W.; Wright, L. L.; Davis, S. C., Biomass energy data book.
2011. 4. IKEDA, Y.; UENOYAMA, K.; SAMPE, H.; KOSUGE, K., Development of chemical
recycle technology to methanol by partial oxidation of waste plastics. Nippon Steel Technical Report2002, 86 (0).