Embed Size (px)
Citation preview
Forecasting School Districts’ Revenues
and Expenditures
Nick Warner
November 5, 2015

Forecasting Overview
Forecasting Districts’ Revenues and Expenditures2

What is forecasting?
• Predicting the future as accurately as possible, given all of the information available, including historical data and knowledge of any future events that might impact the forecasts
• Many methods ‐ Forecasters use the one that best fits the known data.
Forecasting Districts’ Revenues and Expenditures3
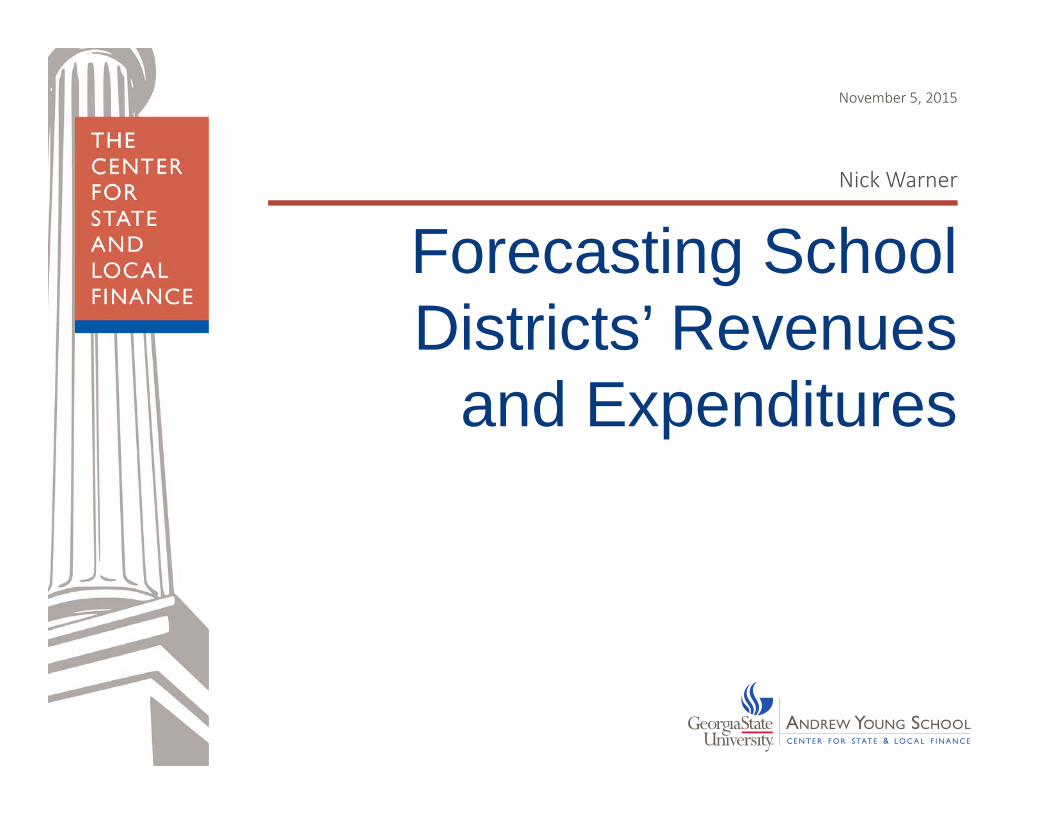
Why is forecasting challenging?
Forecasting Districts’ Revenues and Expenditures4

Why is forecasting challenging?
• A forecast must be based on what we know at the time, and things could change.
• Some data is predictably variable or volatile, so any forecast includes a range of possible amounts.
Forecasting Districts’ Revenues and Expenditures5

Why would a school district use forecasting?
Forecasting Districts’ Revenues and Expenditures6

Why would a school district use forecasting?• Inform long‐ and short‐term budget, capital, and staffing plans– Are expected revenues sufficient to cover expected expenditures under current conditions?
– Are expected revenues sufficient to implement new improvement initiatives?
– Is the district positioned to handle changes in student population?
– And more...
Forecasting Districts’ Revenues and Expenditures7
How can we forecast data important to school districts?
Forecasting Districts’ Revenues and Expenditures8

How would a school district forecast?
• Do it yourself, based on known data sources and info about your district– Methods range from very basic to extremely advanced, but all will provide very useful insights and help inform decisions and planning.
• Get help from experts
Warning: A forecast should be used to inform decisions, not dictate budget planning or decisions. Budget planning and forecasting should remain separate.
Forecasting Districts’ Revenues and Expenditures9
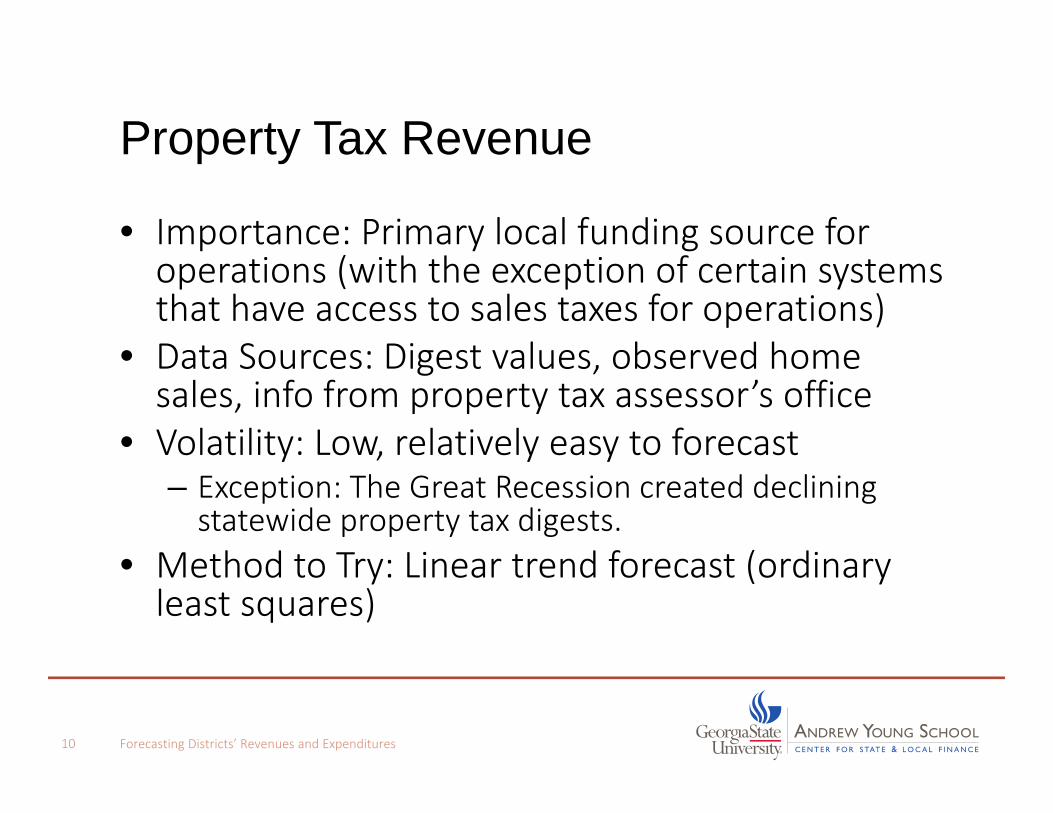
Property Tax Revenue
• Importance: Primary local funding source for operations (with the exception of certain systems that have access to sales taxes for operations)
• Data Sources: Digest values, observed home sales, info from property tax assessor’s office
• Volatility: Low, relatively easy to forecast– Exception: The Great Recession created declining statewide property tax digests.
• Method to Try: Linear trend forecast (ordinary least squares)
Forecasting Districts’ Revenues and Expenditures10

Property Tax Revenue
Forecasting Districts’ Revenues and Expenditures11
$500
$700
$900
$1,100
$1,300
$1,500
$1,700
$1,900
$2,100
2001 2002 2003 2004 2005 2006 2007 2008 2009 2010 2011 2012 2013 2014
Net
M&
O D
iges
t in
$ M
Illio
ns
Tax Year
District A Linear trend line
Property Tax Revenue
Forecasting Districts’ Revenues and Expenditures12
$500
$700
$900
$1,100
$1,300
$1,500
$1,700
$1,900
$2,100
2001 2002 2003 2004 2005 2006 2007 2008 2009 2010 2011 2012 2013 2014 2015
Net
M&
O D
iges
t in
$ M
Illio
ns
Tax Year
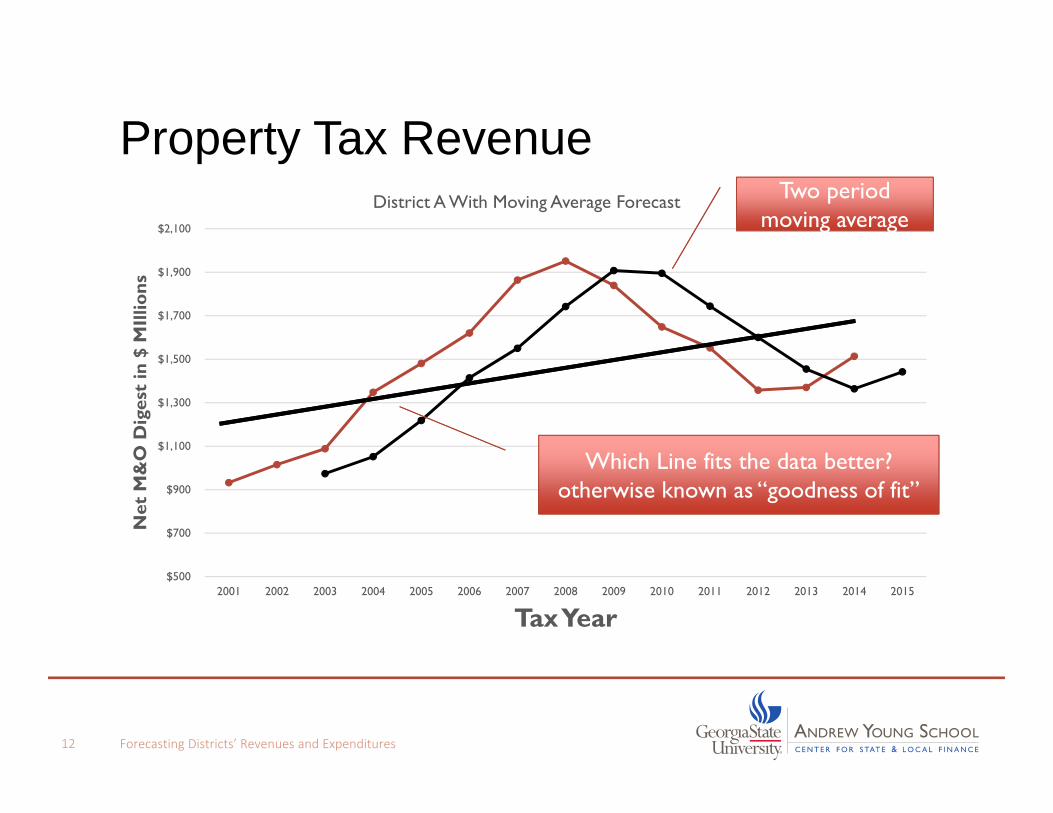
District A With Moving Average Forecastg g
Two period moving average
Which Line fits the data better? otherwise known as “goodness of fit”
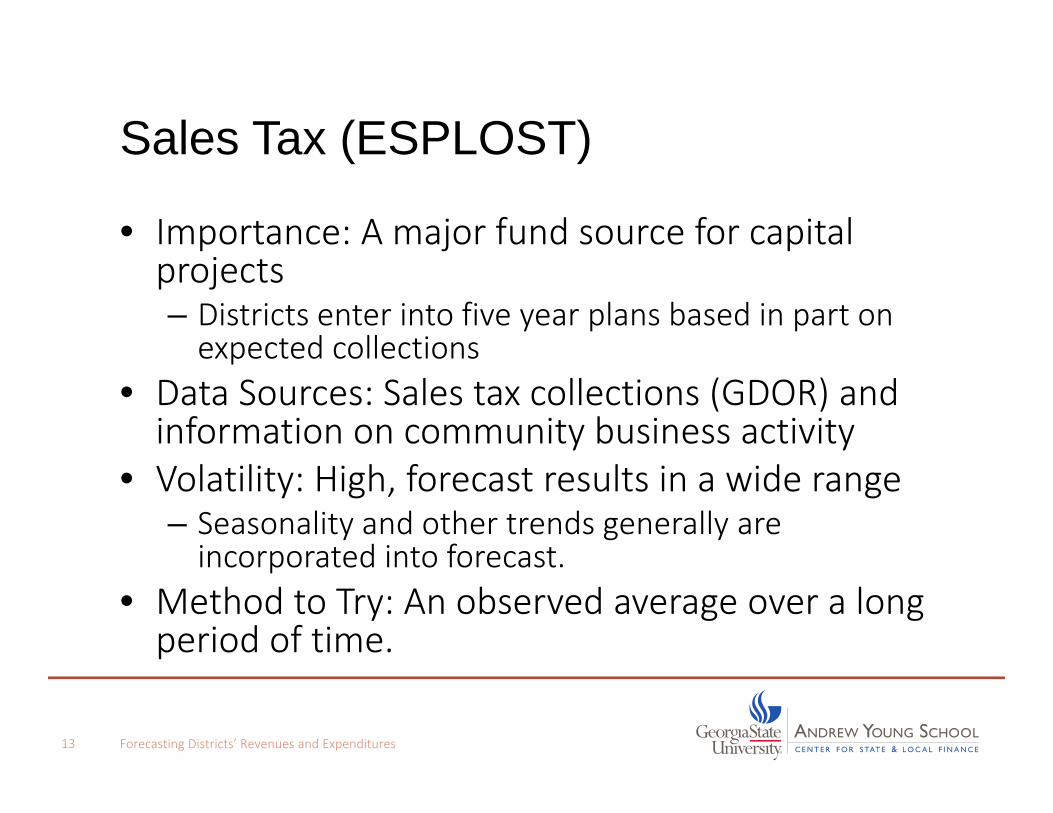
Sales Tax (ESPLOST)
• Importance: A major fund source for capital projects– Districts enter into five year plans based in part on expected collections
• Data Sources: Sales tax collections (GDOR) and information on community business activity
• Volatility: High, forecast results in a wide range– Seasonality and other trends generally are incorporated into forecast.
• Method to Try: An observed average over a long period of time.
Forecasting Districts’ Revenues and Expenditures13
Sales Tax (ESPLOST)
Forecasting Districts’ Revenues and Expenditures14
40
50
60
70
80
90
100
110
ESP
LOST
Rev
enue
$ in
Tho
usan
ds
Month -Year
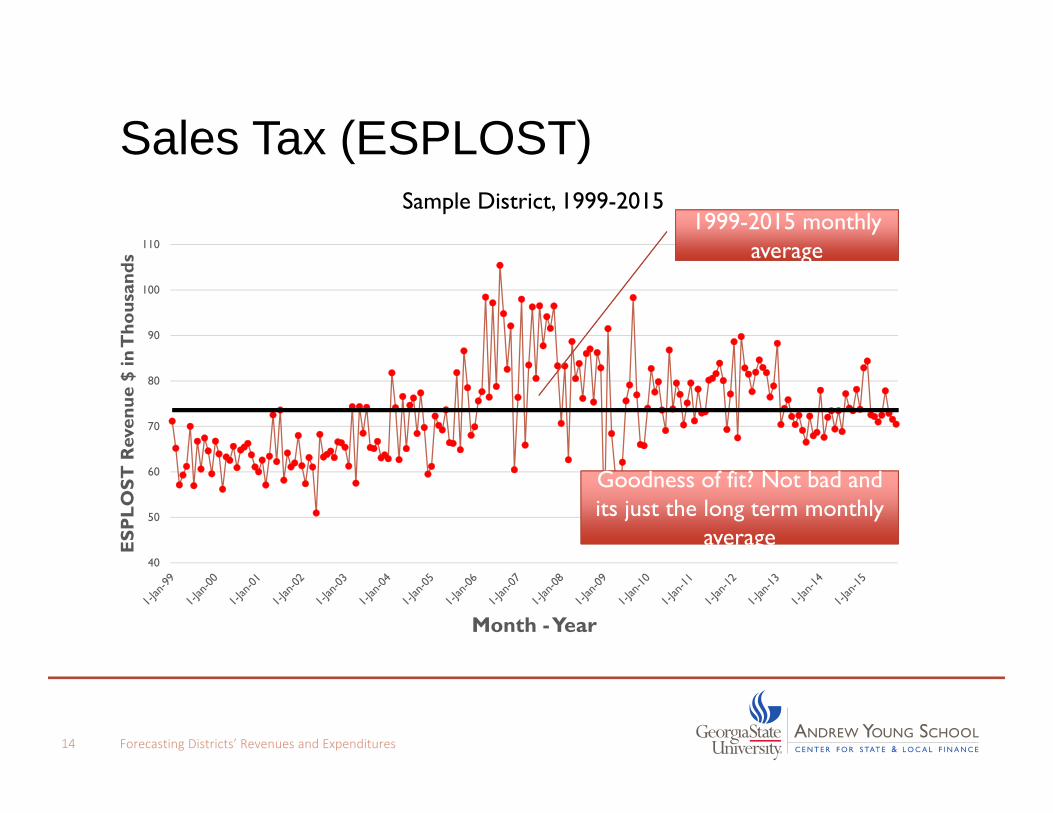
Sample District, 1999-2015
g1999-2015 monthly
average
G d f f ? N b d d
average
Goodness of fit? Not bad and its just the long term monthly
average

Sales Tax (ESPLOST)
Forecasting Districts’ Revenues and Expenditures15
40
50
60
70
80
90
100
110
1-Ja
n-99
1-Ju
n-99
1-N
ov-9
9
1-A
pr-0
0
1-Se
p-00
1-Fe
b-01
1-Ju
l-01
1-D
ec-0
1
1-M
ay-0
2
1-O
ct-0
2
1-M
ar-0
3
1-A
ug-0
3
1-Ja
n-04
1-Ju
n-04
1-N
ov-0
4
1-A
pr-0
5
1-Se
p-05
1-Fe
b-06
1-Ju
l-06
1-D
ec-0
6
1-M
ay-0
7
1-O
ct-0
7
1-M
ar-0
8
1-A
ug-0
8
1-Ja
n-09
1-Ju
n-09
1-N
ov-0
9
1-A
pr-1
0
1-Se
p-10
1-Fe
b-11
1-Ju
l-11
1-D
ec-1
1
1-M
ay-1
2
1-O
ct-1
2
1-M
ar-1
3
1-A
ug-1
3
1-Ja
n-14
1-Ju
n-14
1-N
ov-1
4
1-A
pr-1
5
1-Se
p-15
ESPL
OST
Rev
enue
in $
Tho
usan
ds
Month Year
Sample District 1999-2015
gOne Year Moving
Average
Sales Tax (ESPLOST) – Helpful Data
• Counties governments might be producing sales tax forecasts, even within their budget documents, which can help districts predict their portion of the sales tax revenues.
• Speak to local business owners and parents. • Georgia budget documents forecasts state sales tax revenues into the future. Check and see how well state sales tax collections track with your counties.
Forecasting Districts’ Revenues and Expenditures16

Number of Students
• Importance: Drives state funding (QBE), expenditures, staffing decisions...
• Data Sources: Previous student counts, data on <5 y.o. children in your area, and historic drop out and migration info
• Volatility: Low– Based on steady drop outs, in and out migration
• Method to Try: Linear trend (OLS) to start – move to age specific calculations improve forecast
Forecasting Districts’ Revenues and Expenditures17

Number of Students
Forecasting Districts’ Revenues and Expenditures18
8,600
8,800
9,000
9,200
9,400
9,600
9,800
10,000
fall 2006 fall 2007 fall 2008 fall 2009 fall 2010 fall 2011 fall 2012 fall 2013 fall 2014 fall 2015
Fall
FTE
Cou
nt
School Year
District A
Looks like a good fit and would forecast steadily declining student
counts
Maybe we could dig a little deeper?

Number of Students
Forecasting Districts’ Revenues and Expenditures19
600
650
700
750
800
fall 2006 fall 2007 fall 2008 fall 2009 fall 2010 fall 2011 fall 2012 fall 2013 fall 2014 fall 2015
DISTRICT A
First Grade Second Grade Third Grade Forth Grade
gIncreasing early
gradesFollowed by Increasing
older Grades
Should we expect steadily declining student counts?

Number of Students – Helpful Data
• Georgia Office of Planning and Budget provides population by age group forecasts for all of the counties in Georgia
• Other publicly available datasets do the same by race.
Forecasting Districts’ Revenues and Expenditures20

Forecasting State Funding – QBE
• Predicating future student population, knowledge of proposed funding formula changes, and awareness of state budget shortfalls are the ways to forecast future QBE/State funding.
Forecasting Districts’ Revenues and Expenditures21

State Funding – QBE
Forecasting Districts’ Revenues and Expenditures22
$6.75
$7.25
$7.75
$8.25
$8.75
$9.25
$9.75
$10.25
$10.75
$11.25
2001 2002 2003 2004 2005 2006 2007 2008 2009 2010 2011 2012 2013 2014
QB
E F
orm
ula
Ear
ning
s $
in M
illio
ns
Schoolyear

What about expenditures?
• Forecasting expenditures – Based on revenue and student population forecasts
• Other changes would be based on district decisions on curriculum and improvement efforts.
Forecasting Districts’ Revenues and Expenditures23

Questions?
Contact InformationNick [email protected]
Forecasting Districts’ Revenues and Expenditures24


![Forecasting the Flashpoints - Harvard Law Review · 2012] FORECASTING THE FLASHPOINTS 247 Next, I calculated spatial diversity scores for all of the newly drawn congressional districts.7](https://img.dokumen.tips/doc/110x75/5f49bcc19f474c4819390a79/forecasting-the-flashpoints-harvard-law-review-2012-forecasting-the-flashpoints.jpg)