Embed Size (px)
Citation preview

WWW.NICHOLASFUNDS.COM
NICHOLASLIMITED EDITION, INC.
ANNUAL REPORTDecember 31, 2020
Beginning on January 1, 2021, as permitted by regulations adopted by the Securities and ExchangeCommission, paper copies of the Fund’s shareholder reports will no longer be sent by mail, unless youspecifically request paper copies of the reports from the Fund or from your financial intermediary, suchas a broker-dealer or bank. Instead, the reports will be made available on the Fund’s website,www.nicholasfunds.com, and you will be notified by mail each time a report is posted and providedwith a website link to access the report.
If you already elected to receive shareholder reports electronically, you will not be affected by thischange and you need not take any action. You may elect to receive shareholder reports and othercommunications from the Fund or your financial intermediary electronically by contacting your financialintermediary (such as a broker-dealer or bank); direct shareholders may call the Fund at 1-800-544-6547.
You may elect to receive all future reports in paper free of charge. You can inform the Fund or yourfinancial intermediary that you wish to continue receiving paper copies of your shareholder reports bycontacting your financial intermediary (such as a broker-dealer or bank); direct shareholders may callthe Fund at 1-800-544-6547. Your election to receive reports in paper will apply to all funds held withthe Fund complex or your financial intermediary.

NICHOLAS LIMITED EDITION, INC.February 2021
Dear Fellow Shareholders:
Nicholas Limited Edition – Class I returned 22.73% in 2020 compared to 19.96%for the Russell 2000 Index, 34.63% for the Russell 2000 Growth Index and 18.40% forthe S&P 500. Small company stocks performed extremely well during the second halfof the year after the Federal Reserve instituted a strong response to the coronaviruspandemic. The year was one of the most volatile years in stock market history with theclosing of the world’s economy to control the virus, subsequent governmental reaction,and the hope of a vaccine. The quickest bear market during March and April 2020 wasfollowed by the quickest recovery during the second half of the year.
Growth stocks outperformed value stocks significantly for the year as thepandemic changed consumer behavior and corporate actions, driving demand fortechnology development. Other sectors that benefited from the pandemic were thebiotech sector and supporting health care industries.
For the year ended December 31, 2020, returns for the Fund and selected indicesare provided in the chart below for the periods ended December 31, 2020.
Average Annual Total Return_____________________________1 Year 3 Year 5 Year 10 Year______ ______ ______ ______
Nicholas Limited Edition, Inc. – Class I . . . . . . . . 22.73% 15.67% 15.84% 12.54%Nicholas Limited Edition, Inc. – Class N . . . . . . . 22.48% 15.38% 15.51% 12.18%Russell 2000 Growth Index . . . . . . . . . . . . . . . . . 34.63% 16.20% 16.36% 13.48%Russell 2000 Index . . . . . . . . . . . . . . . . . . . . . . . . 19.96% 10.25% 13.26% 11.20%Morningstar Small-Cap Growth Fund Category . . 38.68% 18.75% 17.76% 13.69%Standard & Poor’s 500 Index . . . . . . . . . . . . . . . . 18.40% 14.18% 15.22% 13.88%Ending value of $10,000 invested in Nicholas Limited Edition, Inc. – Class I . . . . . . . $12,273 $15,476 $20,855 $32,584
Ending value of $10,000 invested in Nicholas Limited Edition, Inc. – Class N . . . . . . $12,248 $15,359 $20,567 $31,565
Fund’s Class I Expense Ratio (from 04/29/20 Prospectus): 0.86%Fund’s Class N Expense Ratio (from 01/29/21 Prospectus): 1.07%
The Fund’s expense ratios for the period ended December 31, 2020 can be found in thefinancial highlights included within this report.
Performance data quoted represents past performance and is no guarantee offuture results. The investment return and principal value of an investment willfluctuate so that an investor’s shares, when redeemed, may be worth more or lessthan their original cost. Current performance of the Fund may be lower or higherthan the performance quoted. Performance data current to the most recentmonth-end may be obtained by visiting www.nicholasfunds.com/returns.html.
The Fund’s returns are reduced by expenses, while the market indices are not. Theending values above illustrate the performance of a hypothetical $10,000 investmentmade in the Fund over the timeframes listed. Assumes reinvestment of dividends andcapital gains. Returns shown do not reflect the deduction of taxes that a shareholder

would pay on Fund distributions or the redemption of Fund shares. These figures donot imply any future performance.
Class N of the Fund commenced operations on February 28, 2005. Class I shares andClass N shares are invested in the same portfolio of securities. Annual returns willgenerally differ only to the extent that the classes do not have the same expenses.Please see the respective prospectus for details.
The Fund’s relative underperformance versus the Russell 2000 Growth Index forthe year ended December 31, 2020 was primarily the result of unfavorable stockselection due largely to Nicholas’ philosophical valuation discipline. Investorsgravitated to more speculative areas of the market during the year, includingnon-earning companies which were among the top performing group of stocks.The combined result of the excess liquidity and increased speculative behavior was amarket whose valuation was pushed to excessive levels. As of December 31, 2020, theFund’s holdings consisted of 65 stocks and approximately 4% cash. We believe theFund is well diversified with sector weightings of approximately 33% informationtechnology, 18% health care, 16% industrials, 15% consumer related, 7% financial, 3%materials, 2% real estate and 2% other. For the year, stocks of defensively positionedcompanies, such as technology, health care, and work-from-home beneficiariesoutperformed. The Fund lagged the benchmark due to underperformance within healthcare and industrials, while its information technology positions offered positivecontribution to overall performance. Lattice Semiconductor, BlackLine and RepayHoldings contributed positively to the Fund’s return, while EVO Payments, SP Plusand Interface detracted from performance.
2020 was a very tumultuous year in many ways. The pandemic changed the wayeveryone lived. This change in behavior has had a significant impact on so manydifferent businesses. During the initial phase of the pandemic, the market collapsed;however, fiscal and monetary stimulus had the effect of activating a strong market,sending most indices to record highs. Growth (technology) stocks led the market aswell as a slew of new companies positioned to take advantage of the changingeconomy. Looking forward, we are cautious as valuations have reached very highlevels and there is a great deal of speculation in the market due to the FederalReserve’s very easy monetary policy. We believe future returns might be more limitedfrom these high levels.
Management will be cautious going forward and will stay consistent with ourefforts to hold what we believe are quality growth companies that produce profits,good returns on investment and sell at reasonable valuations.
Thank you for your continued support.
Sincerely,
David O. Nicholas Ryan P. BushmanLead Portfolio Manager Co-Portfolio Manager

The information above represents the opinions of the Fund manager, is subject to change, and anyforecasts made cannot be guaranteed.
Mutual fund investing involves risk. Principal loss is possible. The Fund may invest insmall- and mid-cap companies, which involve additional risks such as limited liquidity andgreater volatility.
Diversification does not assure a profit nor protect against loss in a declining market.
Return on investment (ROI) is a performance measure used to evaluate the amount of return ona particular investment relative to the investment’s cost.
Earnings growth is not representative of the Fund’s future performance.
Please refer to the schedule of investments in the report for complete Fund holdings information.Fund holdings and sector allocations are subject to change and should not be considered arecommendation to buy or sell any security.
The Russell 2000 Index measures the performance of the 2000 smallest companies in theRussell 3000 Index, which represents approximately 10% of the total market capitalization of theRussell 3000 Index. The Russell 2000 Growth Index measures the performance of thoseRussell 2000 companies with higher price-to-book ratios and higher forecasted growth values.The S&P 500 Index is a broad-based unmanaged index of 500 stocks, which is widely recognizedas representative of the equity market in general. One cannot invest directly in an index. EachMorningstar Category average represents a universe of funds with similar investment objectives.
Must be preceded or accompanied by a prospectus.
The Nicholas Funds are distributed by Quasar Distributors, LLC.

COMPARISON OF CHANGE IN VALUE OF $100,000 INVESTMENT INNICHOLAS LIMITED EDITION, INC. – CLASS I,
RUSSELL 2000 INDEX AND RUSSELL 2000 GROWTH INDEX
The line graph, which follows, compares the initial account value andsubsequent account values at the end of each of the most recently completed tenfiscal years of the Fund’s Class I, to the same investment over the same period intwo peer group indices. The graph assumes a $100,000 investment in the Fund’sClass I and the indices at the beginning of the first fiscal year. The peer group inthe graph includes the Russell 2000 Index and the Russell 2000 Growth Index. TheAdviser believes the Russell 2000 Index and the Russell 2000 Growth Index arerepresentative of the performance of small- and medium-capitalization growthcompanies in which the Fund primarily invests and provide a meaningful andrepresentative basis of comparison for Fund investors.
The Fund’s Class I average annual total returns for the one-, five- and ten-yearperiods ended on the last day of the most recent fiscal year are as follows:
One Year Ended Five Years Ended Ten Years EndedDecember 31, December 31, December 31,
2020 2020 2020______________ _______________ ______________
Average Annual Total Return 22.73% 15.84% 12.54%
Past performance is not predictive of future performance, and the abovegraph and table do not reflect deduction of taxes that a shareholder would pay onFund distributions or the redemption of Fund shares.
– 4 –
$25,000
$100,000
$175,000
$250,000
$325,000
$400,000
$325,840$354,236
12/31/16 12/31/17 12/31/2012/31/10 12/31/11 12/31/12 12/31/13 12/31/14
$289,195
12/31/15 12/31/18 12/31/19
Nicholas Limited Edition, Inc. – Class I Russell 2000 Index Russell 2000 Growth Index

– 5 –
Financial Highlights Class I (NCLEX)For a share outstanding throughout each period
Years Ended December 31,_______________________________2020 2019 2018 2017 2016____ ____ ____ ____ ____
NET ASSET VALUE, BEGINNING OF PERIOD . . . . . $28.33 $23.50 $26.32 $23.69 $23.31INCOME (LOSS) FROMINVESTMENT OPERATIONS
Net investment income (loss)(1) . . . . . . . . . . . . (.08) .06 .01 (.04) .01Net gain (loss) on securities (realized and unrealized) . . . . . . . . . . . . . . . . 6.51 6.37 (.31) 4.77 2.90______ ______ ______ ______ ______
Total from investment operations . . . . . . . 6.43 6.43 (.30) 4.73 2.91______ ______ ______ ______ ______LESS DISTRIBUTIONSFrom net investment income . . . . . . . . . . . . . . — (.06) (.01) — (.00)(2)From net capital gain . . . . . . . . . . . . . . . . . . . . (1.69) (1.54) (2.51) (2.10) (2.53)______ ______ ______ ______ ______
Total distributions . . . . . . . . . . . . . . . . . . . (1.69) (1.60) (2.52) (2.10) (2.53)______ ______ ______ ______ ______NET ASSET VALUE, END OF PERIOD . . . . . . . . . . . $33.07 $28.33 $23.50 $26.32 $23.69______ ______ ______ ______ ____________ ______ ______ ______ ______
TOTAL RETURN . . . . . . . . . . . . . . . . . . . . . . . . . . . 22.73% 27.37% (1.00)% 19.92% 12.37%
SUPPLEMENTAL DATA:Net assets, end of period (millions) . . . . . . . . . . . . $507.9 $433.4 $341.4 $358.0 $298.0Ratio of expenses to average net assets . . . . . . . . . .86% .86% .86% .86% .86%Ratio of net investment income (loss) to average net assets . . . . . . . . . . . . . . . . . . . . . . (.28)% .22% .05% (.14)% .04%
Portfolio turnover rate. . . . . . . . . . . . . . . . . . . . . . . 28.16% 21.56% 23.38% 29.67% 42.07%
(1) Computed based on average shares outstanding.(2) The amount rounds to $0.00.
The accompanying notes to financial statements are an integral part of these highlights.

– 6 –
Financial Highlights Class N (NNLEX)For a share outstanding throughout each period
Years Ended December 31,_______________________________2020 2019 2018 2017 2016____ ____ ____ ____ ____
NET ASSET VALUE, BEGINNING OF PERIOD . . . . . $26.24 $21.86 $24.74 $22.44 $22.27INCOME (LOSS) FROMINVESTMENT OPERATIONS
Net investment loss(1) . . . . . . . . . . . . . . . . . . . (.12) (.01) (.07) (.11) (.07)Net gain (loss) on securities (realized and unrealized) . . . . . . . . . . . . . . . . 6.01 5.93 (.30) 4.51 2.77______ ______ ______ ______ ______
Total from investment operations . . . . . . . 5.89 5.92 (.37) 4.40 2.70______ ______ ______ ______ ______LESS DISTRIBUTIONSFrom net investment income . . . . . . . . . . . . . . — — — — —From net capital gain . . . . . . . . . . . . . . . . . . . . (1.69) (1.54) (2.51) (2.10) (2.53)______ ______ ______ ______ ______
Total distributions . . . . . . . . . . . . . . . . . . . (1.69) (1.54) (2.51) (2.10) (2.53)______ ______ ______ ______ ______NET ASSET VALUE, END OF PERIOD . . . . . . . . . . . $30.44 $26.24 $21.86 $24.74 $22.44______ ______ ______ ______ ____________ ______ ______ ______ ______
TOTAL RETURN . . . . . . . . . . . . . . . . . . . . . . . . . . . 22.48% 27.09% (1.33)% 19.57% 12.00%
SUPPLEMENTAL DATA:Net assets, end of period (millions) . . . . . . . . . . . . $28.0 $30.0 $28.6 $33.0 $33.3Ratio of expenses to average net assets . . . . . . . . . 1.07% 1.11% 1.17% 1.19% 1.21%Ratio of net investment loss to average net assets . . . . . . . . . . . . . . . . . . . . . . (.48)% (.03)% (.27)% (.46)% (.30)%
Portfolio turnover rate. . . . . . . . . . . . . . . . . . . . . . . 28.16% 21.56% 23.38% 29.67% 42.07%
(1) Computed based on average shares outstanding.
The accompanying notes to financial statements are an integral part of these highlights.

– 7 –
Top Ten Equity Portfolio HoldingsDecember 31, 2020 (unaudited)
Sector Diversification (As a Percentage of Portfolio)December 31, 2020 (unaudited)
Short-Term Investments
Other
Real Estate
Materials
Consumer Staples
Financials
Consumer Discretionary
Industrials
Health Care
Information Technology
0% 5% 10% 15% 20% 25% 30% 35% 40%
3.73%
1.67%
2.58%
3.58%
4.16%
6.82%
11.34%
15.84%
17.68%
32.60%
PercentageName of Net Assets_____ ____________Power Integrations, Inc. . . . . . . . . . . . . . . . . . . . . . . . . . . . . . . . . . . . . . . . . 2.45%Vocera Communications, Inc. . . . . . . . . . . . . . . . . . . . . . . . . . . . . . . . . . . . 2.34%Morningstar, Inc. . . . . . . . . . . . . . . . . . . . . . . . . . . . . . . . . . . . . . . . . . . . . . 2.26%CyberArk Software Ltd. . . . . . . . . . . . . . . . . . . . . . . . . . . . . . . . . . . . . . . . . 2.24%Rapid7, Inc. . . . . . . . . . . . . . . . . . . . . . . . . . . . . . . . . . . . . . . . . . . . . . . . . . 2.19%Ritchie Bros. Auctioneers Incorporated . . . . . . . . . . . . . . . . . . . . . . . . . . . . . 2.08%Bio-Techne Corporation . . . . . . . . . . . . . . . . . . . . . . . . . . . . . . . . . . . . . . . . 1.98%Descartes Systems Group Inc. (The) . . . . . . . . . . . . . . . . . . . . . . . . . . . . . . . 1.95%IAA, Inc. . . . . . . . . . . . . . . . . . . . . . . . . . . . . . . . . . . . . . . . . . . . . . . . . . . . . 1.94%Lattice Semiconductor Corporation . . . . . . . . . . . . . . . . . . . . . . . . . . . . . . . . 1.92%______Total of top ten . . . . . . . . . . . . . . . . . . . . . . . . . . . . . . . . . . . . . . . . . . . . . . . 21.35%____________

– 8 –
As a shareholder of the Fund, you incur two types of costs: (1) transaction costs and(2) ongoing costs, including management fees and other operating expenses. The followingtable is intended to help you understand your ongoing costs (in dollars) of investing in theFund and to compare these costs with those of other mutual funds.
The example is based on an investment of $1,000 made at the beginning of the period andheld for the entire period.
The first line of the table below for each share class of the Fund provides information aboutthe actual account values and actual expenses. You may use the information in this line,together with the amount you invested, to estimate the expenses that you paid over theperiod. Simply divide your account value by $1,000 (for example, an $8,600 account valuedivided by $1,000 = 8.6), then multiply the result by the number in the first line under theheading entitled “Expenses Paid During Period” to estimate the expenses you paid on youraccount during this period.
The second line of the table below provides information about hypothetical account valuesand hypothetical expenses based on the Fund’s actual expense ratios for each class of theFund and an assumed rate of return of 5% per year before expenses, which are not the Fund’sactual returns. The hypothetical account values and expenses may not be used to estimate theactual ending account balance or expenses you paid for the period. You may use thisinformation to compare the ongoing costs of investing in the Fund with other funds. To do so,compare this 5% hypothetical example with the 5% hypothetical examples that appear in theshareholder reports of other funds.
Please note that the expenses shown in the table are meant to highlight your ongoing costsonly and do not reflect any transactional costs, such as wire fees. Therefore, the second lineof the table is useful in comparing ongoing costs only, and will not help you determine therelative total costs of owning different funds. In addition, if these transactional costs wereincluded, your costs would have been higher.
Class IBeginning Ending ExpensesAccount Account Paid DuringValue Value Period*
06/30/20 12/31/20 07/01/20 – 12/31/20________ ________ __________________Actual $1,000.00 $1,280.70 $4.87Hypothetical 1,000.00 1,020.73 4.32(5% return before expenses)
* Expenses are equal to the Fund’s Class I six-month annualized expense ratio of 0.85%, multipliedby the average account value over the period, multiplied by 184 then divided by 366 to reflect theone-half year period.
Fund ExpensesFor the six month period ended December 31, 2020 (unaudited)

Class NBeginning Ending ExpensesAccount Account Paid DuringValue Value Period**
06/30/20 12/31/20 07/01/20 – 12/31/20________ ________ __________________Actual $1,000.00 $1,279.40 $6.02Hypothetical 1,000.00 1,019.72 5.33(5% return before expenses)
** Expenses are equal to the Fund’s Class N six-month annualized expense ratio of 1.05%,multiplied by the average account value over the period, multiplied by 184 then divided by 366 toreflect the one-half year period.
– 9 –
Fund Expenses (continued)For the six month period ended December 31, 2020 (unaudited)

– 10 –
Schedule of InvestmentsDecember 31, 2020
The accompanying notes to financial statements are an integral part of this schedule.
Shares orPrincipalAmount Value_________ _________
COMMON STOCKS — 96.39%Consumer Discretionary – Automobiles & Components — 2.41%
82,000 Dorman Products, Inc.* . . . . . . . . . . . . . . . . . . . . . . . . . . . . . . . . . . . . . . $ 7,119,24085,000 Patrick Industries, Inc. . . . . . . . . . . . . . . . . . . . . . . . . . . . . . . . . . . . . . . . 5,809,750___________
12,928,990___________Consumer Discretionary – Durables & Apparel — 2.64%
170,000 La-Z-Boy Incorporated . . . . . . . . . . . . . . . . . . . . . . . . . . . . . . . . . . . . . . . 6,772,800171,500 Lovesac Company (The)* . . . . . . . . . . . . . . . . . . . . . . . . . . . . . . . . . . . . . 7,389,935___________
14,162,735___________Consumer Discretionary – Retailing — 3.31%
68,500 Murphy USA Inc. . . . . . . . . . . . . . . . . . . . . . . . . . . . . . . . . . . . . . . . . . . . 8,964,595107,500 Ollie’s Bargain Outlet Holdings, Inc.* . . . . . . . . . . . . . . . . . . . . . . . . . . . . 8,790,275___________
17,754,870___________Consumer Discretionary – Services — 2.99%
265,000 Carriage Services, Inc. . . . . . . . . . . . . . . . . . . . . . . . . . . . . . . . . . . . . . . . 8,299,800352,500 Wendy’s Company (The) . . . . . . . . . . . . . . . . . . . . . . . . . . . . . . . . . . . . . 7,726,800___________
16,026,600___________Consumer Staples – Food & Staples Retailing — 2.74%
170,000 Grocery Outlet Holding Corp.* . . . . . . . . . . . . . . . . . . . . . . . . . . . . . . . . . 6,672,50088,000 PriceSmart, Inc. . . . . . . . . . . . . . . . . . . . . . . . . . . . . . . . . . . . . . . . . . . . . 8,015,920___________
14,688,420___________Consumer Staples – Food, Beverage & Tobacco — 1.42%
300,000 Nomad Foods Limited* . . . . . . . . . . . . . . . . . . . . . . . . . . . . . . . . . . . . . . . 7,626,000___________Financials – Banks — 1.17%
136,000 Glacier Bancorp, Inc. . . . . . . . . . . . . . . . . . . . . . . . . . . . . . . . . . . . . . . . . 6,257,360___________Financials – Diversified — 3.87%
116,500 Cohen & Steers, Inc. . . . . . . . . . . . . . . . . . . . . . . . . . . . . . . . . . . . . . . . . 8,655,95052,300 Morningstar, Inc. . . . . . . . . . . . . . . . . . . . . . . . . . . . . . . . . . . . . . . . . . . . 12,111,111___________
20,767,061___________Financials – Insurance — 1.78%
170,000 Brown & Brown, Inc. . . . . . . . . . . . . . . . . . . . . . . . . . . . . . . . . . . . . . . . . 8,059,70012,000 Goosehead Insurance, Inc. – Class A . . . . . . . . . . . . . . . . . . . . . . . . . . . . 1,497,120___________
9,556,820___________Health Care – Equipment & Services — 10.35%
120,000 BioTelemetry, Inc.* . . . . . . . . . . . . . . . . . . . . . . . . . . . . . . . . . . . . . . . . . . 8,649,600245,000 Covetrus, Inc.* . . . . . . . . . . . . . . . . . . . . . . . . . . . . . . . . . . . . . . . . . . . . . 7,041,30092,500 NuVasive, Inc.* . . . . . . . . . . . . . . . . . . . . . . . . . . . . . . . . . . . . . . . . . . . . . 5,210,52575,000 Omnicell, Inc.* . . . . . . . . . . . . . . . . . . . . . . . . . . . . . . . . . . . . . . . . . . . . . 9,001,500
147,000 Tabula Rasa HealthCare, Inc.* . . . . . . . . . . . . . . . . . . . . . . . . . . . . . . . . . 6,297,480

Shares orPrincipalAmount Value_________ _________
COMMON STOCKS — 96.39% (continued)Health Care – Equipment & Services — 10.35% (continued)
150,000 Tactile Systems Technology, Inc.* . . . . . . . . . . . . . . . . . . . . . . . . . . . . . . $ 6,741,000302,246 Vocera Communications, Inc.* . . . . . . . . . . . . . . . . . . . . . . . . . . . . . . . . . 12,552,276___________
55,493,681___________Health Care – Pharmaceuticals, Biotechnology & Life Sciences — 7.35%
33,500 Bio-Techne Corporation . . . . . . . . . . . . . . . . . . . . . . . . . . . . . . . . . . . . . . 10,637,92549,000 ICON plc* . . . . . . . . . . . . . . . . . . . . . . . . . . . . . . . . . . . . . . . . . . . . . . . . . 9,554,020
105,000 Pacira BioSciences, Inc.* . . . . . . . . . . . . . . . . . . . . . . . . . . . . . . . . . . . . . 6,283,200160,000 Prestige Consumer Healthcare Inc.* . . . . . . . . . . . . . . . . . . . . . . . . . . . . . 5,579,200107,500 Syneos Health, Inc.* . . . . . . . . . . . . . . . . . . . . . . . . . . . . . . . . . . . . . . . . . 7,323,975___________
39,378,320___________Industrials – Capital Goods — 4.45%
137,500 A.O. Smith Corporation . . . . . . . . . . . . . . . . . . . . . . . . . . . . . . . . . . . . . . . 7,537,750185,000 Beacon Roofing Supply, Inc.* . . . . . . . . . . . . . . . . . . . . . . . . . . . . . . . . . 7,435,150165,210 BMC Stock Holdings, Inc.* . . . . . . . . . . . . . . . . . . . . . . . . . . . . . . . . . . . . 8,868,473___________
23,841,373___________Industrials – Commercial & Professional Services — 8.22%
100,000 Exponent, Inc. . . . . . . . . . . . . . . . . . . . . . . . . . . . . . . . . . . . . . . . . . . . . . 9,003,000160,000 IAA, Inc.* . . . . . . . . . . . . . . . . . . . . . . . . . . . . . . . . . . . . . . . . . . . . . . . . . 10,396,80088,000 ICF International, Inc. . . . . . . . . . . . . . . . . . . . . . . . . . . . . . . . . . . . . . . . 6,541,040
375,000 KAR Auction Services, Inc. . . . . . . . . . . . . . . . . . . . . . . . . . . . . . . . . . . . 6,978,750160,000 Ritchie Bros. Auctioneers Incorporated . . . . . . . . . . . . . . . . . . . . . . . . . . 11,128,000___________
44,047,590___________Industrials – Transportation — 3.20%
164,000 Knight-Swift Transportation Holdings Inc. . . . . . . . . . . . . . . . . . . . . . . . . 6,858,480440,649 Marten Transport, Ltd. . . . . . . . . . . . . . . . . . . . . . . . . . . . . . . . . . . . . . . . 7,592,38268,500 Werner Enterprises, Inc. . . . . . . . . . . . . . . . . . . . . . . . . . . . . . . . . . . . . . 2,686,570___________
17,137,432___________Information Technology – Hardware & Equipment — 1.48%
90,000 ePlus inc.* . . . . . . . . . . . . . . . . . . . . . . . . . . . . . . . . . . . . . . . . . . . . . . . . 7,915,500___________Information Technology – Semiconductors &Semiconductor Equipment — 5.72%
225,000 Lattice Semiconductor Corporation* . . . . . . . . . . . . . . . . . . . . . . . . . . . . 10,309,500160,280 Power Integrations, Inc. . . . . . . . . . . . . . . . . . . . . . . . . . . . . . . . . . . . . . 13,120,521100,100 Semtech Corporation* . . . . . . . . . . . . . . . . . . . . . . . . . . . . . . . . . . . . . . . 7,216,209___________
30,646,230___________
– 11 –
Schedule of Investments (continued)December 31, 2020
The accompanying notes to financial statements are an integral part of this schedule.

Shares orPrincipalAmount Value_________ _________
COMMON STOCKS — 96.39% (continued)Information Technology – Software & Services — 25.45%
58,500 BlackLine, Inc.* . . . . . . . . . . . . . . . . . . . . . . . . . . . . . . . . . . . . . . . . . . . . $ 7,802,73074,250 CyberArk Software Ltd.* . . . . . . . . . . . . . . . . . . . . . . . . . . . . . . . . . . . . . . 11,998,058
179,000 Descartes Systems Group Inc. (The)* . . . . . . . . . . . . . . . . . . . . . . . . . . . 10,467,920192,500 EVERTEC, Inc. . . . . . . . . . . . . . . . . . . . . . . . . . . . . . . . . . . . . . . . . . . . . . 7,569,100102,500 ExlService Holdings, Inc.* . . . . . . . . . . . . . . . . . . . . . . . . . . . . . . . . . . . . 8,725,825305,000 i3 Verticals, Inc. – Class A* . . . . . . . . . . . . . . . . . . . . . . . . . . . . . . . . . . . 10,126,000149,800 Mimecast Limited* . . . . . . . . . . . . . . . . . . . . . . . . . . . . . . . . . . . . . . . . . . 8,514,632160,000 Model N, Inc.* . . . . . . . . . . . . . . . . . . . . . . . . . . . . . . . . . . . . . . . . . . . . . 5,708,80035,500 Paylocity Holding Corporation* . . . . . . . . . . . . . . . . . . . . . . . . . . . . . . . . 7,309,80578,000 Q2 Holdings, Inc.* . . . . . . . . . . . . . . . . . . . . . . . . . . . . . . . . . . . . . . . . . . 9,869,34079,500 Qualys, Inc.* . . . . . . . . . . . . . . . . . . . . . . . . . . . . . . . . . . . . . . . . . . . . . . . 9,688,665
130,000 Rapid7, Inc.* . . . . . . . . . . . . . . . . . . . . . . . . . . . . . . . . . . . . . . . . . . . . . . 11,720,800325,000 Repay Holdings Corporation* . . . . . . . . . . . . . . . . . . . . . . . . . . . . . . . . . . 8,856,250155,000 SailPoint Technologies Holdings, Inc.* . . . . . . . . . . . . . . . . . . . . . . . . . . 8,252,200135,900 WNS (Holdings) Limited* . . . . . . . . . . . . . . . . . . . . . . . . . . . . . . . . . . . . . 9,791,595___________
136,401,720___________Materials — 3.59%
59,500 AptarGroup, Inc. . . . . . . . . . . . . . . . . . . . . . . . . . . . . . . . . . . . . . . . . . . . 8,144,955281,000 GCP Applied Technologies Inc.* . . . . . . . . . . . . . . . . . . . . . . . . . . . . . . . . 6,645,65095,292 UFP Technologies, Inc.* . . . . . . . . . . . . . . . . . . . . . . . . . . . . . . . . . . . . . . 4,440,607___________
19,231,212___________Other — 1.67%
22,000 Invesco KBW Regional Banking ETF . . . . . . . . . . . . . . . . . . . . . . . . . . . . . 1,040,55660,000 iShares Russell 2000 Value ETF . . . . . . . . . . . . . . . . . . . . . . . . . . . . . . . . 7,905,000___________
8,945,556___________Real Estate — 2.58%
154,933 Community Healthcare Trust Incorporated . . . . . . . . . . . . . . . . . . . . . . . . 7,298,894154,200 NexPoint Residential Trust, Inc. . . . . . . . . . . . . . . . . . . . . . . . . . . . . . . . . 6,524,202___________
13,823,096___________TOTAL COMMON STOCKS(cost $278,590,703) . . . . . . . . . . . . . . . . . . . . . . . . . . . . . . . . . . . . . 516,630,566___________
– 12 –
Schedule of Investments (continued)December 31, 2020
The accompanying notes to financial statements are an integral part of this schedule.

Shares orPrincipalAmount Value_________ _________
SHORT-TERM INVESTMENTS — 3.73%U.S. Government Securities — 2.24%
$6,000,000 U.S. Treasury Bill 01/12/2021, 0.041% . . . . . . . . . . . . . . . . . . . . . . . . . . $ 5,999,9276,000,000 U.S. Treasury Bill 02/04/2021, 0.031% . . . . . . . . . . . . . . . . . . . . . . . . . . 5,999,830___________
11,999,757___________Variable Rate Security — 1.49%
8,004,695 Morgan Stanley Liquidity Funds Government Portfolio(Institutional Class), 7-day net yield 0.030% . . . . . . . . . . . . . . . . . . . . . 8,004,695___________TOTAL SHORT-TERM INVESTMENTS(cost $20,004,452) . . . . . . . . . . . . . . . . . . . . . . . . . . . . . . . . . . . . . . 20,004,452___________
TOTAL INVESTMENTS(cost $298,595,155) — 100.12% . . . . . . . . . . . . . . . . . . . . . . . . . . . 536,635,018___________
LIABILITIES, NET OF OTHER ASSETS — (0.12)% . . . . . . . . . . . . . . . . . . (677,134)___________TOTAL NET ASSETS(basis of percentages above) — 100% . . . . . . . . . . . . . . . . . . . . . . . $535,957,884______________________
* Non-income producing security.
– 13 –
Schedule of Investments (continued)December 31, 2020
The accompanying notes to financial statements are an integral part of this schedule.
– 14 –
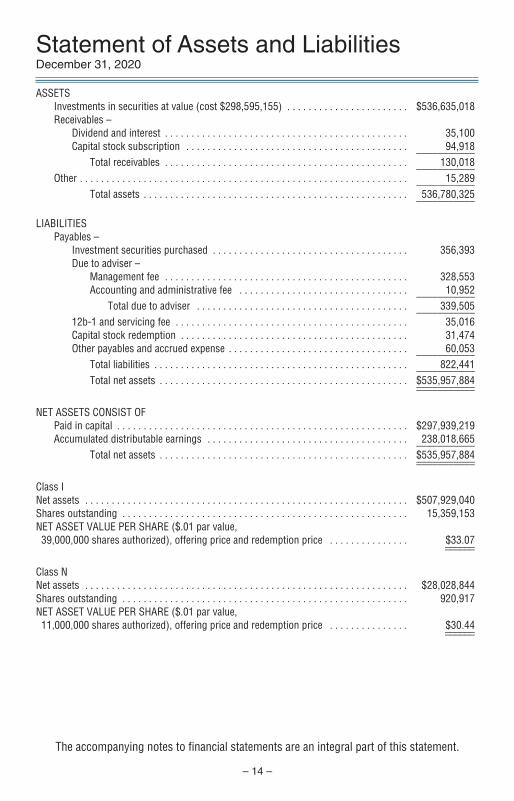
Statement of Assets and LiabilitiesDecember 31, 2020
ASSETSInvestments in securities at value (cost $298,595,155) . . . . . . . . . . . . . . . . . . . . . . . $536,635,018Receivables –
Dividend and interest . . . . . . . . . . . . . . . . . . . . . . . . . . . . . . . . . . . . . . . . . . . . . . 35,100Capital stock subscription . . . . . . . . . . . . . . . . . . . . . . . . . . . . . . . . . . . . . . . . . . 94,918___________
Total receivables . . . . . . . . . . . . . . . . . . . . . . . . . . . . . . . . . . . . . . . . . . . . . . 130,018___________Other . . . . . . . . . . . . . . . . . . . . . . . . . . . . . . . . . . . . . . . . . . . . . . . . . . . . . . . . . . . . . . 15,289___________
Total assets . . . . . . . . . . . . . . . . . . . . . . . . . . . . . . . . . . . . . . . . . . . . . . . . . . 536,780,325___________
LIABILITIESPayables –
Investment securities purchased . . . . . . . . . . . . . . . . . . . . . . . . . . . . . . . . . . . . . 356,393Due to adviser –
Management fee . . . . . . . . . . . . . . . . . . . . . . . . . . . . . . . . . . . . . . . . . . . . . . 328,553Accounting and administrative fee . . . . . . . . . . . . . . . . . . . . . . . . . . . . . . . . 10,952___________
Total due to adviser . . . . . . . . . . . . . . . . . . . . . . . . . . . . . . . . . . . . . . . . 339,505___________12b-1 and servicing fee . . . . . . . . . . . . . . . . . . . . . . . . . . . . . . . . . . . . . . . . . . . . 35,016Capital stock redemption . . . . . . . . . . . . . . . . . . . . . . . . . . . . . . . . . . . . . . . . . . . 31,474Other payables and accrued expense . . . . . . . . . . . . . . . . . . . . . . . . . . . . . . . . . . 60,053___________
Total liabilities . . . . . . . . . . . . . . . . . . . . . . . . . . . . . . . . . . . . . . . . . . . . . . . . 822,441___________Total net assets . . . . . . . . . . . . . . . . . . . . . . . . . . . . . . . . . . . . . . . . . . . . . . . $535,957,884______________________
NET ASSETS CONSIST OFPaid in capital . . . . . . . . . . . . . . . . . . . . . . . . . . . . . . . . . . . . . . . . . . . . . . . . . . . . . . . $297,939,219Accumulated distributable earnings . . . . . . . . . . . . . . . . . . . . . . . . . . . . . . . . . . . . . . 238,018,665___________
Total net assets . . . . . . . . . . . . . . . . . . . . . . . . . . . . . . . . . . . . . . . . . . . . . . . $535,957,884______________________
Class INet assets . . . . . . . . . . . . . . . . . . . . . . . . . . . . . . . . . . . . . . . . . . . . . . . . . . . . . . . . . . . . . $507,929,040Shares outstanding . . . . . . . . . . . . . . . . . . . . . . . . . . . . . . . . . . . . . . . . . . . . . . . . . . . . . . 15,359,153NET ASSET VALUE PER SHARE ($.01 par value, 39,000,000 shares authorized), offering price and redemption price . . . . . . . . . . . . . . . $33.07____________
Class NNet assets . . . . . . . . . . . . . . . . . . . . . . . . . . . . . . . . . . . . . . . . . . . . . . . . . . . . . . . . . . . . . $28,028,844Shares outstanding . . . . . . . . . . . . . . . . . . . . . . . . . . . . . . . . . . . . . . . . . . . . . . . . . . . . . . 920,917NET ASSET VALUE PER SHARE ($.01 par value, 11,000,000 shares authorized), offering price and redemption price . . . . . . . . . . . . . . . $30.44____________
The accompanying notes to financial statements are an integral part of this statement.

– 15 –
Statement of OperationsFor the year ended December 31, 2020
INCOMEDividend (net of foreign taxes of $20,310) . . . . . . . . . . . . . . . . . . . . . . . . . . . . . . . . . $ 2,537,307Interest . . . . . . . . . . . . . . . . . . . . . . . . . . . . . . . . . . . . . . . . . . . . . . . . . . . . . . . . . . . . 98,291___________
Total income . . . . . . . . . . . . . . . . . . . . . . . . . . . . . . . . . . . . . . . . . . . . . . . . . . . . . 2,635,598___________
EXPENSESManagement fee . . . . . . . . . . . . . . . . . . . . . . . . . . . . . . . . . . . . . . . . . . . . . . . . . . . . . 3,410,239Transfer agent fees . . . . . . . . . . . . . . . . . . . . . . . . . . . . . . . . . . . . . . . . . . . . . . . . . . . 129,082Accounting and administrative fees . . . . . . . . . . . . . . . . . . . . . . . . . . . . . . . . . . . . . . . 113,675Registration fees . . . . . . . . . . . . . . . . . . . . . . . . . . . . . . . . . . . . . . . . . . . . . . . . . . . . . 63,56812b-1 fees – Class N . . . . . . . . . . . . . . . . . . . . . . . . . . . . . . . . . . . . . . . . . . . . . . . . . . 40,319Audit and tax fees . . . . . . . . . . . . . . . . . . . . . . . . . . . . . . . . . . . . . . . . . . . . . . . . . . . . 34,548Accounting system and pricing service fees . . . . . . . . . . . . . . . . . . . . . . . . . . . . . . . . 31,164Custodian fees . . . . . . . . . . . . . . . . . . . . . . . . . . . . . . . . . . . . . . . . . . . . . . . . . . . . . . . 22,542Directors’ fees . . . . . . . . . . . . . . . . . . . . . . . . . . . . . . . . . . . . . . . . . . . . . . . . . . . . . . . 21,675Printing . . . . . . . . . . . . . . . . . . . . . . . . . . . . . . . . . . . . . . . . . . . . . . . . . . . . . . . . . . . . 20,149Postage and mailing . . . . . . . . . . . . . . . . . . . . . . . . . . . . . . . . . . . . . . . . . . . . . . . . . . 20,086Insurance . . . . . . . . . . . . . . . . . . . . . . . . . . . . . . . . . . . . . . . . . . . . . . . . . . . . . . . . . . 15,173Legal fees . . . . . . . . . . . . . . . . . . . . . . . . . . . . . . . . . . . . . . . . . . . . . . . . . . . . . . . . . . 14,039Servicing fees – Class N . . . . . . . . . . . . . . . . . . . . . . . . . . . . . . . . . . . . . . . . . . . . . . . 12,635Other operating expenses . . . . . . . . . . . . . . . . . . . . . . . . . . . . . . . . . . . . . . . . . . . . . . 8,439___________
Total expenses . . . . . . . . . . . . . . . . . . . . . . . . . . . . . . . . . . . . . . . . . . . . . . . . . . . 3,957,333___________Net investment loss . . . . . . . . . . . . . . . . . . . . . . . . . . . . . . . . . . . . . . . . . . . . . . . (1,321,735)___________
NET REALIZED GAIN ON INVESTMENTS . . . . . . . . . . . . . . . . . . . . . . . . . . . . . . . . . . . . . . 26,144,410___________
CHANGE IN NET UNREALIZED APPRECIATION/DEPRECIATIONON INVESTMENTS . . . . . . . . . . . . . . . . . . . . . . . . . . . . . . . . . . . . . . . . . . . . . . . . . . . . . . 75,291,321___________
Net realized and unrealized gain on investments . . . . . . . . . . . . . . . . . . . . . . . . . . . . . 101,435,731___________Net increase in net assets resulting from operations . . . . . . . . . . . . . . . . . . . . . . . . . . $100,113,996______________________
The accompanying notes to financial statements are an integral part of this statement.
– 16 –
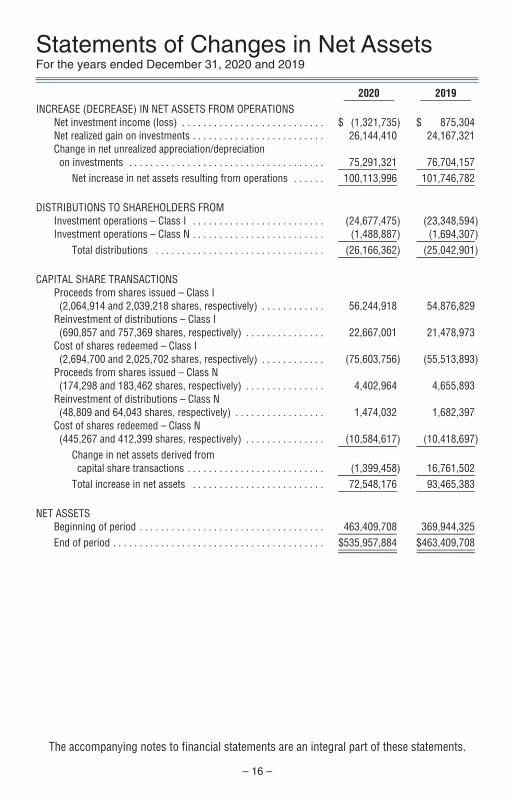
The accompanying notes to financial statements are an integral part of these statements.
2020 2019__________ __________INCREASE (DECREASE) IN NET ASSETS FROM OPERATIONS
Net investment income (loss) . . . . . . . . . . . . . . . . . . . . . . . . . . . $ (1,321,735) $ 875,304Net realized gain on investments . . . . . . . . . . . . . . . . . . . . . . . . . 26,144,410 24,167,321Change in net unrealized appreciation/depreciationon investments . . . . . . . . . . . . . . . . . . . . . . . . . . . . . . . . . . . . . 75,291,321 76,704,157__________ __________
Net increase in net assets resulting from operations . . . . . . 100,113,996 101,746,782__________ __________
DISTRIBUTIONS TO SHAREHOLDERS FROMInvestment operations – Class I . . . . . . . . . . . . . . . . . . . . . . . . . (24,677,475) (23,348,594)Investment operations – Class N . . . . . . . . . . . . . . . . . . . . . . . . . (1,488,887) (1,694,307)__________ __________
Total distributions . . . . . . . . . . . . . . . . . . . . . . . . . . . . . . . . (26,166,362) (25,042,901)__________ __________
CAPITAL SHARE TRANSACTIONSProceeds from shares issued – Class I(2,064,914 and 2,039,218 shares, respectively) . . . . . . . . . . . . 56,244,918 54,876,829
Reinvestment of distributions – Class I(690,857 and 757,369 shares, respectively) . . . . . . . . . . . . . . . 22,667,001 21,478,973
Cost of shares redeemed – Class I(2,694,700 and 2,025,702 shares, respectively) . . . . . . . . . . . . (75,603,756) (55,513,893)
Proceeds from shares issued – Class N(174,298 and 183,462 shares, respectively) . . . . . . . . . . . . . . . 4,402,964 4,655,893
Reinvestment of distributions – Class N(48,809 and 64,043 shares, respectively) . . . . . . . . . . . . . . . . . 1,474,032 1,682,397
Cost of shares redeemed – Class N(445,267 and 412,399 shares, respectively) . . . . . . . . . . . . . . . (10,584,617) (10,418,697)__________ __________
Change in net assets derived from capital share transactions . . . . . . . . . . . . . . . . . . . . . . . . . . (1,399,458) 16,761,502__________ __________
Total increase in net assets . . . . . . . . . . . . . . . . . . . . . . . . . 72,548,176 93,465,383__________ __________
NET ASSETSBeginning of period . . . . . . . . . . . . . . . . . . . . . . . . . . . . . . . . . . . 463,409,708 369,944,325__________ __________End of period . . . . . . . . . . . . . . . . . . . . . . . . . . . . . . . . . . . . . . . . $535,957,884 $463,409,708__________ ____________________ __________
Statements of Changes in Net AssetsFor the years ended December 31, 2020 and 2019

(1) Summary of Significant Accounting Policies —Nicholas Limited Edition, Inc. (the “Fund”) is organized as a Maryland corporation and isregistered as an open-end, diversified management investment company under theInvestment Company Act of 1940, as amended. The primary objective of the Fund islong-term growth. The following is a summary of the significant accounting policies ofthe Fund:
(a) Equity securities traded on a stock exchange will ordinarily be valued on the basis ofthe last sale price on the date of valuation on the securities principal exchange, or ifin the absence of any sale on that day, the closing bid price. For securitiesprincipally traded on the NASDAQ market, the Fund uses the NASDAQ OfficialClosing Price. Investments in shares of open-end mutual funds, including moneymarket funds, are valued at their daily net asset value, which is calculated as of theclose of regular trading on the New York Stock Exchange. Debt securities, excludingshort-term investments, are valued at their current evaluated bid price as determinedby an independent pricing service, which generates evaluations on the basis ofdealer quotes for normal institutional-sized trading units, issuer analysis, bondmarket activity and various other factors. Securities for which market quotationsmay not be readily available are valued at their fair value as determined in good faithby procedures adopted by the Board of Directors. Short-term investmentspurchased at par are valued at cost, which approximates market value. Short-terminvestments purchased at a premium or discount are stated at amortized cost, whichapproximates market value. The Fund did not maintain any positions in derivativeinstruments or engage in hedging activities during the year. Investment transactionsfor financial statement purposes are recorded on trade date.
In accordance with Accounting Standards Codification (“ASC”) 820-10, “Fair ValueMeasurements and Disclosures” (“ASC 820-10”), fair value is defined as the pricethat the Fund would receive upon selling an investment in a timely transaction to anindependent buyer in the principal or most advantageous market of the investment.ASC 820-10 established a three-tier hierarchy to maximize the use of observablemarket data and minimize the use of unobservable inputs and to establishclassification of fair value measurements for disclosure purposes. Inputs referbroadly to the assumptions that market participants would use in pricing the assetor liability, including assumptions about risk, for example, the risk inherent in aparticular valuation technique used to measure fair value such as a pricing modeland/or the risk inherent in the inputs to the valuation technique. Inputs may beobservable or unobservable. Observable inputs are inputs that reflect theassumptions market participants would use in pricing the asset or liability based onmarket data obtained from sources independent of the reporting entity.Unobservable inputs are inputs that reflect the reporting entity’s own assumptionsabout the assumptions market participants would use in pricing the asset or liabilitybased on the best information available in the circumstances. The three-tierhierarchy of inputs is summarized in the three broad levels listed below.
Level 1 – quoted prices in active markets for identical investments
– 17 –
Notes to Financial StatementsDecember 31, 2020

Level 2 – other significant observable inputs (including quoted prices forsimilar investments, interest rates, benchmark yields, bids, offers,transactions, spreads and other relationships observed in themarkets among market securities, underlying equity of the issuer,proprietary pricing models, credit risk, etc.)
Level 3 – significant unobservable inputs (including the Fund’s ownassumptions in determining the fair value of investments)
The inputs or methodology used for valuing securities are not necessarily anindication of the risk associated with investing in those securities.
The following is a summary of the inputs used as of December 31, 2020 in valuingthe Fund’s investments carried at value:
InvestmentsValuation Inputs in Securities_____________ __________Level 1 –Common Stocks(1) . . . . . . . . . . . . . . . . . . . . . . . . . . . . . . $516,630,566Money Market Fund . . . . . . . . . . . . . . . . . . . . . . . . . . . . . 8,004,695
Level 2 –U.S. Government Securities . . . . . . . . . . . . . . . . . . . . . . . 11,999,757
Level 3 –None . . . . . . . . . . . . . . . . . . . . . . . . . . . . . . . . . . . . . . . . —___________
Total . . . . . . . . . . . . . . . . . . . . . . . . . . . . . . . . . . $536,635,018______________________
(1) See Schedule of Investments for further detail by industry.
The Fund did not hold any Level 3 investments during the year.
(b) Net realized gain (loss) on portfolio securities was computed on the basis ofspecific identification.
(c) Dividend income is recorded on the ex-dividend date, and interest income isrecognized on an accrual basis. Non-cash dividends, if any, are recorded at valueon date of distribution. Generally, discounts and premiums on long-term debtsecurity purchases, if any, are amortized over the expected lives of the respectivesecurities using the effective yield method.
(d) Provision has not been made for federal income taxes or excise taxes since theFund has elected to be taxed as a “regulated investment company” and intends todistribute substantially all net investment income and net realized capital gains onsales of investments to its shareholders and otherwise comply with the provisionsof Subchapter M of the Internal Revenue Code applicable to regulated investmentcompanies.
Investment income, net capital gains (losses) and all expenses incurred by the Fundare allocated based on the relative net assets of each class, except for 12b-1 andshareholder servicing fees and certain other fees and expenses related to one classof shares.
– 18 –
Notes to Financial Statements (continued)December 31, 2020

Class N shares are subject to a 0.25% 12b-1 fee and a 0.10% servicing fee, asdescribed in its prospectus. Subsequent to April 30, 2017 through November 1,2020, the servicing fee was voluntarily reduced to 0.06% and from November 2,2020 through period-end was reduced to zero. The 12b-1 fee subsequent toApril 30, 2019 through November 1, 2020, was voluntarily reduced to 0.15% andfrom November 2, 2020 through period-end was increased to 0.20%. Income,expenses (other than expenses attributable to a specific class), and realized andunrealized gains and losses are allocated daily to each class of shares based uponthe relative net asset value of outstanding shares.
(e) Dividends and distributions paid to shareholders are recorded on the ex-dividenddate. Distributions from net investment income are generally declared and paid atleast annually. Distributions of net realized capital gain, if any, are declared and paidat least annually.
The amount of distributions from net investment income and net realized capitalgain are determined in accordance with federal income tax regulations, which maydiffer from U.S. generally accepted accounting principles (“U.S. GAAP”) forfinancial reporting purposes. Financial reporting records are adjusted forpermanent book-to-tax differences to reflect tax character. At December 31, 2020,reclassifications were recorded to increase accumulated distributable earnings anddecrease paid in capital by $1,322,489.
The tax character of distributions paid during the years ended December 31, 2020and 2019 was as follows:
12/31/2020 12/31/2019_________ _________Distributions paid from:Ordinary income . . . . . . . . . . . . . . $ — $ 875,304Long-term capital gain . . . . . . . . . . 26,166,362 24,167,597___________ ___________Total distributions paid . . . . . . . . . $26,166,362 $25,042,901___________ ______________________ ___________
As of December 31, 2020, investment cost for federal tax purposes was$298,616,353 and the tax basis components of net assets were as follows:
Unrealized appreciation . . . . . . . . . . . . . . . . . . . . . . . . . $240,683,264Unrealized depreciation . . . . . . . . . . . . . . . . . . . . . . . . . (2,664,599)___________Net unrealized appreciation . . . . . . . . . . . . . . . . . . . . . . 238,018,665___________Undistributed ordinary income . . . . . . . . . . . . . . . . . . . —Accumulated net realized capital gain . . . . . . . . . . . . . . —Paid in capital . . . . . . . . . . . . . . . . . . . . . . . . . . . . . . . . 297,939,219___________Net assets . . . . . . . . . . . . . . . . . . . . . . . . . . . . . . . . . . . $535,957,884______________________
The difference between financial statement and tax-basis cost is attributableprimarily to the tax deferral of wash sales losses.
– 19 –
Notes to Financial Statements (continued)December 31, 2020
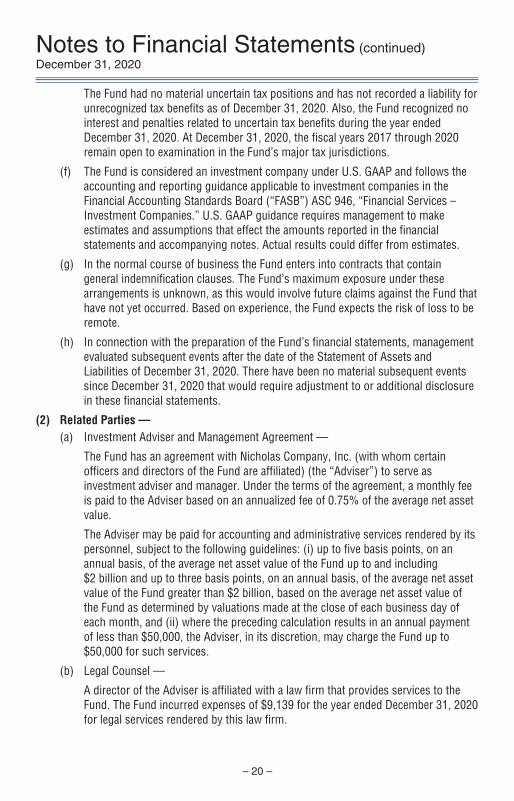
The Fund had no material uncertain tax positions and has not recorded a liability forunrecognized tax benefits as of December 31, 2020. Also, the Fund recognized nointerest and penalties related to uncertain tax benefits during the year endedDecember 31, 2020. At December 31, 2020, the fiscal years 2017 through 2020remain open to examination in the Fund’s major tax jurisdictions.
(f) The Fund is considered an investment company under U.S. GAAP and follows theaccounting and reporting guidance applicable to investment companies in theFinancial Accounting Standards Board (“FASB”) ASC 946, “Financial Services –Investment Companies.” U.S. GAAP guidance requires management to makeestimates and assumptions that effect the amounts reported in the financialstatements and accompanying notes. Actual results could differ from estimates.
(g) In the normal course of business the Fund enters into contracts that containgeneral indemnification clauses. The Fund’s maximum exposure under thesearrangements is unknown, as this would involve future claims against the Fund thathave not yet occurred. Based on experience, the Fund expects the risk of loss to beremote.
(h) In connection with the preparation of the Fund’s financial statements, managementevaluated subsequent events after the date of the Statement of Assets andLiabilities of December 31, 2020. There have been no material subsequent eventssince December 31, 2020 that would require adjustment to or additional disclosurein these financial statements.
(2) Related Parties —(a) Investment Adviser and Management Agreement —
The Fund has an agreement with Nicholas Company, Inc. (with whom certainofficers and directors of the Fund are affiliated) (the “Adviser”) to serve asinvestment adviser and manager. Under the terms of the agreement, a monthly feeis paid to the Adviser based on an annualized fee of 0.75% of the average net assetvalue.
The Adviser may be paid for accounting and administrative services rendered by itspersonnel, subject to the following guidelines: (i) up to five basis points, on anannual basis, of the average net asset value of the Fund up to and including$2 billion and up to three basis points, on an annual basis, of the average net assetvalue of the Fund greater than $2 billion, based on the average net asset value ofthe Fund as determined by valuations made at the close of each business day ofeach month, and (ii) where the preceding calculation results in an annual paymentof less than $50,000, the Adviser, in its discretion, may charge the Fund up to$50,000 for such services.
(b) Legal Counsel —
A director of the Adviser is affiliated with a law firm that provides services to theFund. The Fund incurred expenses of $9,139 for the year ended December 31, 2020for legal services rendered by this law firm.
– 20 –
Notes to Financial Statements (continued)December 31, 2020

– 21 –
(3) Investment Transactions —For the year ended December 31, 2020, the cost of purchases and the proceeds fromsales of investment securities, other than short-term obligations, aggregated$120,331,663 and $143,357,449, respectively.
Notes to Financial Statements (continued)December 31, 2020

– 22 –
To the shareholders and Board of Directors of Nicholas Limited Edition, Inc.
Opinion on the Financial Statements and Financial Highlights
We have audited the accompanying statement of assets and liabilities of Nicholas LimitedEdition, Inc. (the “Fund”), including the schedule of investments, as of December 31, 2020,the related statements of operations for the year then ended, the statements of changes in netassets for each of the two years in the period then ended, the financial highlights for each ofthe five years in the period then ended, and the related notes. In our opinion, the financialstatements and financial highlights present fairly, in all material respects, the financialposition of the Fund as of December 31, 2020, and the results of its operations for the yearthen ended, the changes in its net assets for each of the two years in the period then ended,and the financial highlights for each of the five years in the period then ended, in conformitywith accounting principles generally accepted in the United States of America.
Basis for Opinion
These financial statements and financial highlights are the responsibility of the Fund’smanagement. Our responsibility is to express an opinion on the Fund’s financial statements andfinancial highlights based on our audits. We are a public accounting firm registered with thePublic Company Accounting Oversight Board (United States) (PCAOB) and are required to beindependent with respect to the Fund in accordance with the U.S. federal securities laws and theapplicable rules and regulations of the Securities and Exchange Commission and the PCAOB.
We conducted our audits in accordance with the standards of the PCAOB. Those standardsrequire that we plan and perform the audit to obtain reasonable assurance about whether thefinancial statements and financial highlights are free of material misstatement, whether due toerror or fraud. The Fund is not required to have, nor were we engaged to perform, an audit ofits internal control over financial reporting. As part of our audits we are required to obtain anunderstanding of internal control over financial reporting but not for the purpose ofexpressing an opinion on the effectiveness of the Fund’s internal control over financialreporting. Accordingly, we express no such opinion.
Our audits included performing procedures to assess the risks of material misstatement ofthe financial statements and financial highlights, whether due to error or fraud, andperforming procedures that respond to those risks. Such procedures included examining, ona test basis, evidence regarding the amounts and disclosures in the financial statements andfinancial highlights. Our audits also included evaluating the accounting principles used andsignificant estimates made by management, as well as evaluating the overall presentation ofthe financial statements and financial highlights. Our procedures included confirmation ofsecurities owned as of December 31, 2020, by correspondence with the custodian andbrokers; when replies were not received from brokers, we performed other auditingprocedures. We believe that our audits provide a reasonable basis for our opinion.
Milwaukee, WisconsinFebruary 25, 2021
We have served as the auditor of one or more Nicholas investment companies since 1977.
Report of Independent Registered Public Accounting Firm

– 23 –
Historical Record(unaudited)
Net Investment Dollar Growth of
Net Income Capital Gain Weighted an InitialAsset Value Distributions Distributions Price/Earnings $10,000
Class I Per Share Per Share Per Share Ratio(2) Investment(3)__________ ___________ ___________ ____________ ___________May 18, 1987(1) . . . . . . . $10.00 $ — $ — — $ 10,000December 31, 1987 . . . . . 9.15 .0900 — 13.9 times 9,242December 31, 1988 . . . . . 11.29 .0969 .2527 14.1 11,762December 31, 1989 . . . . . 12.49 .1453 .6151 16.3 13,804December 31, 1990 . . . . . 12.03 .1207 .1213 14.2 13,566December 31, 1991 . . . . . 16.86 .1228 .2407 21.9 19,429December 31, 1992 . . . . . 18.77 .0815 .8275 18.8 22,690December 31, 1993 . . . . . 18.68 .0867 1.6782 20.4 24,738December 31, 1994 . . . . . 17.09 .1031 .9065 18.3 23,985December 31, 1995 . . . . . 19.22 .0761 2.9353 25.2 31,223December 31, 1996 . . . . . 20.74 .0124 2.6151 30.7 38,031December 31, 1997 . . . . . 25.07 .0029 2.4886 33.0 50,590December 31, 1998 . . . . . 24.20 .0142 1.2490 30.3 51,436December 31, 1999 . . . . . 22.61 .0538 .5439 23.4 49,333December 31, 2000 . . . . . 15.16 — 5.5800 25.9 45,063December 31, 2001 . . . . . 16.37 — .0357 25.5 48,764December 31, 2002 . . . . . 12.49 — .0311 21.4 37,299December 31, 2003 . . . . . 17.43 — — 24.2 52,051December 31, 2004 . . . . . 19.59 — .2679 25.3 59,309December 31, 2005 . . . . . 19.23 — 1.8896 25.2 63,925December 31, 2006 . . . . . 19.62 — .8425 23.6 68,002December 31, 2007 . . . . . 20.07 .0008 1.7607 24.7 75,615December 31, 2008 . . . . . 13.93 .0301 .0327 14.9 52,733December 31, 2009 . . . . . 17.76 .0005 — 23.5 67,234December 31, 2010 . . . . . 21.85 — 1.5377 24.8 88,494December 31, 2011 . . . . . 20.90 — 1.2484 22.9 89,672December 31, 2012 . . . . . 21.06 .0043 2.0167 22.3 99,159December 31, 2013 . . . . . 27.05 .0160 1.5957 23.9 134,984December 31, 2014 . . . . . 25.63 .0002 2.6251 24.9 140,842December 31, 2015 . . . . . 23.31 — 1.8767 23.4 138,262December 31, 2016 . . . . . 23.69 .0012 2.5295 25.3 155,364December 31, 2017 . . . . . 26.32 — 2.0989 27.7 186,320December 31, 2018 . . . . . 23.50 .0063 2.5137 25.5 184,458December 31, 2019 . . . . . 28.33 .0601 1.5436 29.2 234,944December 31, 2020 . . . . . 33.07 — 1.6863(a) 35.1 288,349
(1) Date of Initial Public Offering.(2) Based on latest 12 months accomplished earnings.(3) Assuming reinvestment of all distributions.
(a) Paid on December 29, 2020 to shareholders of record on December 28, 2020.

– 24 –
Historical Record (continued)(unaudited)
Net Investment Dollar Growth of
Net Income Capital Gain Weighted an InitialAsset Value Distributions Distributions Price/Earnings $10,000
Class N Per Share Per Share Per Share Ratio(2) Investment(3)__________ ___________ ___________ ____________ ___________February 28, 2005 (1) . . . $19.30 $ — $ — 25.5 times $10,000December 31, 2005 . . . . . 19.19 — 1.8581 25.2 10,903December 31, 2006 . . . . . 19.51 — .8425 23.6 11,560December 31, 2007 . . . . . 19.86 — 1.7607 24.7 12,802December 31, 2008 . . . . . 13.78 .0062 .0327 14.9 8,909December 31, 2009 . . . . . 17.54 .0005 — 23.5 11,341December 31, 2010 . . . . . 21.50 — 1.5377 24.8 14,888December 31, 2011 . . . . . 20.47 — 1.2484 22.9 15,034December 31, 2012 . . . . . 20.51 — 2.0167 22.3 16,568December 31, 2013 . . . . . 26.21 — 1.5957 23.9 22,466December 31, 2014 . . . . . 24.66 — 2.6251 24.9 23,361December 31, 2015 . . . . . 22.27 — 1.8767 23.4 22,849December 31, 2016 . . . . . 22.44 — 2.5295 25.3 25,591December 31, 2017 . . . . . 24.74 — 2.0989 27.7 30,597December 31, 2018 . . . . . 21.86 — 2.5137 25.5 30,189December 31, 2019 . . . . . 26.24 — 1.5436 29.2 38,367December 31, 2020 . . . . . 30.44 — 1.6863(a) 35.1 46,994
(1) Date of Initial Public Offering.(2) Based on latest 12 months accomplished earnings.(3) Assuming reinvestment of all distributions.
(a) Paid on December 29, 2020 to shareholders of record on December 28, 2020.

– 25 –
Approval of Investment Advisory Contract(unaudited)
In October 2020, the Board of Directors of the Fund renewed the one-year term of theInvestment Advisory Agreement by and between the Fund and the Adviser through October2021. In connection with the renewal of the Investment Advisory Agreement, no changes tothe amount or manner of calculation of the management fee or the terms of the agreementwere proposed by the Adviser or adopted by the Board. In renewing the Investment AdvisoryAgreement, the Board carefully considered the following factors on an absolute basis andrelative to the Fund’s peer group: (i) the Fund’s historical performance; (ii) the Fund’sperformance relative to its benchmark; (iii) the expense ratios for peer group funds in thesmall-cap growth category and the Fund’s risk/return profile as measured by the standarddeviation and the Sharpe Ratio; and (iv) the range and quality of the services offered by theAdviser. The peer group fund data included small-cap growth focused funds with similarasset sizes, number of holdings and market capitalizations and at least a 10-year history.In terms of the peer group data used for performance comparisons, the Fund’s Class I totalreturn ranked 31st, 24th, 22nd and 29th out of 43 funds for the one-, three-, five- andten-year periods ending September 30, 2020. The Fund’s Class I had the ninth lowest expenseratio among its peer group.
The Board considered the range of services to be provided by the Adviser to the Fund underthe Advisory Agreement. The Board concluded that the nature, extent and quality of theservices to be provided were consistent with the terms of the Advisory Agreement and theneeds of the Fund, and that the services provided were of a high quality.
The Board considered the investment performance of the Fund and the Adviser. Among otherthings, the Board noted its consideration of the Fund’s performance relative to peer funds andits benchmarks. The Board reviewed the actual and relative short-term and long-termperformance of the Fund. The Board agreed that the Fund demonstrated satisfactoryperformance with respect to its benchmarks and peers. The Board also discussed the extentto which economies of scale would be realized, and whether such economies were reflectedin the Fund’s fee levels and concluded that the Adviser had been instrumental in holding downFund costs, citing consistently low fees.
The Board considered the cost of services provided and the profits to be realized by the Adviserfrom the relationship with the Fund. The Board concluded that given the Board’s focus onperformance and maintaining a low fee structure that the Adviser’s profits were not relevant.
The Board determined that the Adviser had fully and adequately carried out the terms andconditions of its contract with the Fund. The Board expressed satisfaction with the Fund’sperformance, strategies to improve performance, management’s control of expenses and the rateof the management fee for the Fund and the overall level of services provided by the Adviser.
– 26 –
Liquidity Risk Management Program(unaudited)
The Fund has adopted and implemented a liquidity risk management program (the “Program”)in accordance with Rule 22e-4 under the 1940 Act. The Program seeks to assess and managethe Fund’s liquidity risk, i.e., the risk that the Fund is unable to satisfy redemption requestswithout significantly diluting remaining investors’ interests in the Fund. The Board of Directorsof the Fund has designated Nicholas Company, Inc., the Fund’s investment adviser, toadminister the Program. Certain aspects of the Program rely on third parties to perform certainfunctions, including the provision of market data and application of models.
The Program is comprised of various components designed to support the assessmentand/or management of liquidity risk, including: (1) the periodic assessment (no lessfrequently than annually) of certain factors that influence the Fund’s liquidity risk; (2) theperiodic classification (no less frequently than monthly) of the Fund’s investments into one offour liquidity categories that reflect an estimate of their liquidity under current marketconditions; (3) a 15% limit on the acquisition of “illiquid investments” (as defined underRule 22e-4); (4) for a Fund that does not invest primarily in “highly liquid investments” (asdefined under Rule 22e-4), the determination of a minimum percentage of the Fund’s assetsthat will generally be invested in highly liquid investments (a “Highly Liquid InvestmentMinimum”); and (5) periodic reporting to the Board of Directors.
At a meeting of the Board of Directors on February 1, 2021, Nicholas Company, Inc. provideda written report to the Board addressing the operation, and the adequacy and effectiveness ofthe implementation, of the Program, including, as applicable, the operation of any HighlyLiquid Investment Minimum and any material changes to the Program, for the period fromJanuary 1, 2020 through December 31, 2020 (the “Reporting Period”). Among other things,the annual report discussed: (1) the results of stress tests designed to assess liquidity undera hypothetical stressed scenario involving elevated redemptions; and (2) an assessment ofthe methodologies used to classify investments into one of four liquidity categories. Thereport concluded that the Program was reasonably designed to assess and manage liquidityrisk and was adequately and effectively implemented during the Reporting Period.
There can be no assurance that the Program will achieve its objectives under allcircumstances in the future. Please refer to the Fund’s prospectus for more informationregarding the Fund’s exposure to liquidity risk and other risks to which it may be subject.

– 27 –
A description of the policies and procedures that the Fund uses to determine how to voteproxies relating to portfolio securities is available, without charge, upon request by calling800-544-6547 or 414-276-0535. It also appears in the Fund’s Statement of AdditionalInformation, which can be found on the SEC’s website, www.sec.gov. A record of how theFund voted its proxies for the most recent twelve-month period ended June 30, also isavailable on the Fund’s website, www.nicholasfunds.com, and the SEC’s website,www.sec.gov.
Information on Proxy Voting(unaudited)
The Fund files its complete schedule of investments with the SEC for the first and thirdquarters of each fiscal year as an exhibit to its reports on Form N-PORT. The Fund’sForm N-PORT reports are available on the SEC’s website at www.sec.gov and may bereviewed and copied at the SEC’s Public Reference Room in Washington, D.C. Informationon the operation of the Public Reference Room may be obtained by calling 800-SEC-0330.
Quarterly Portfolio Schedule(unaudited)

– 28 –
The following table sets forth the pertinent information about the Fund’s directors and officersas of December 31, 2020. Unless otherwise listed, the business address of each director andofficer is 411 East Wisconsin Avenue, Milwaukee, WI 53202.
Number ofTerm of Portfolios
Positions Office and Principal in Fund OtherHeld Length of Occupations Complex DirectorshipsWith Time During Past Overseen Held
Name and Age Fund Served 5 Years by Director by Director____________ ________ _________ ___________ _________ ___________INTERESTED DIRECTORDavid O. Nicholas, CFA President, (3), 31 years President, Chief Executive 4 None59(1)(2) Director Officer, Chief Investment
and Officer and Director,Lead Nicholas Company, Inc.,Portfolio the Adviser to the Fund.Manager He has been the Lead
Portfolio Manager ofNicholas Fund, Inc. andNicholas II, Inc. andCo-Portfolio Manager ofNicholas Equity IncomeFund, Inc.
DISINTERESTED DIRECTORSJohn A. Hauser Director (3), 4 years Chaplain, Door County 4 None62 Medical Center, 2019 to
present. Private Investor, January 2018 to present. Senior Vice President – Trust and Community Relations, Nicolet Bank, October 2016 to December 2016. Senior Vice President – Director of Wealth Services, April 2016 to October 2016.Prior to its acquisition byNicolet Bank in April 2016,Mr. Hauser served in varioussenior management roles forBaylake Bank from 1984 to2008 and from 2009to April 2016.
Directors and Officers of the Fund(unaudited)

– 29 –
Number ofTerm of Portfolios
Positions Office and Principal in Fund OtherHeld Length of Occupations Complex DirectorshipsWith Time During Past Overseen Held
Name and Age Fund Served 5 Years by Director by Director____________ ________ _________ ___________ _________ ___________David P. Pelisek, CFA Director (3), 1 year Private Investor, 4 None61 September 2016 to
present. ManagingDirector, Robert W. Baird & Co., Inc., and Partner, Baird Capital PartnersBuyout Funds I–V, January 1994 toMay 2016.
Jay H. Robertson Director (3), 18 years Private Investor, 4 None69 April 2000 to present.
Chairman of the Boardof Robertson-Ryan andAssociates, Inc., an insurance brokerage firm from 1993 toMarch 2000.
Directors and Officers of the Fund (continued)(unaudited)

– 30 –
Term ofPositions Office andHeld Length ofWith Time
Name and Age Fund Served Principal Occupations During Past 5 Years____________ ________ _________ ______________________________________OFFICERSDavid L. Johnson, CFA Executive Annual, Executive Vice President, Nicholas Company, Inc., 78(2) Vice 34 years the Adviser to the Fund.
President
Lawrence J. Pavelec, CFA Senior Vice Annual, Executive Vice President, Secretary and Chief 62 President 16 years Operating Officer, Nicholas Company, Inc., the
and Adviser to the Fund, and employed by the Adviser Secretary since 2003.
Jennifer R. Kloehn, CPA Senior Vice Annual, Executive Vice President, Treasurer, Chief 47 President, 4 years Financial Officer and Chief Compliance Officer,
Treasurer Nicholas Company, Inc., the Adviser to the Fund. and Chief Compliance Officer and Assistant Vice President Compliance of the Adviser from July 2004 to April 2016.Officer
Ryan P. Bushman, CFA Senior Vice Annual, Vice President, Nicholas Company, Inc., the42 President Effective Adviser to the Fund. Co-Portfolio Manager
and Co- February 1, (effective February 1, 2021) of the Fund andPortfolio 2021 employed by Nicholas Company, Inc. since Manager October 2020. He was Co-Portfolio Manager at
Rice Hall James & Associates from March 2017to September 2020. He was an Equity Analyst andDirector for the BMO Small-Cap Growth and Mid-Cap Growth products from 2008 to October 2016 at BMO Asset Management Corp.
Candace L. Lesak, CFP Vice Annual, Employee, Nicholas Company, Inc., the Adviser to 63 President 27 years the Fund.____________________
(1) David O. Nicholas is the only director of the Fund who is an “interested person” of the Fund, as thatterm is defined in the 1940 Act. Mr. Nicholas is a Director of the Adviser and owns 60% of theoutstanding voting securities of the Adviser.
(2) David O. Nicholas is a nephew of David L. Johnson.(3) Until duly elected or re-elected at a subsequent annual meeting of the Fund.
The Fund’s Statement of Additional Information includes additional information about theFund directors and is available, without charge, upon request, by calling 800-544-6547 or414-276-0535.
Directors and Officers of the Fund (continued)(unaudited)

Nicholas Limited Edition, Inc. respects each shareholder’s right to privacy. We arecommitted to safeguarding the information that you provide us to maintain and executetransactions on your behalf.
We collect the following non-public personal information about you:
* Information we receive from you on applications or other forms, whether wereceive the form in writing or electronically. This includes, but is not limited to, yourname, address, phone number, tax identification number, date of birth, beneficiaryinformation and investment selection.
* Information about your transactions with us and account history with us. Thisincludes, but is not limited to, your account number, balances and cost basisinformation. This also includes transaction requests made through our transferagent.
* Other general information that we may obtain about you such as demographicinformation.
WE DO NOT SELL ANY NON-PUBLIC PERSONAL INFORMATIONABOUT CURRENT OR FORMER SHAREHOLDERS.
INFORMATION SHARED WITH OUR TRANSFER AGENT,A THIRD PARTY COMPANY, ALSO IS NOT SOLD.
We may share, only as permitted by law, non-public personal information about you withthird party companies. Listed below are some examples of third parties to whom we maydisclose non-public personal information. While these examples do not cover everycircumstance permitted by law, we hope they help you understand how your information maybe shared.
We may share non-public personal information about you:
* With companies who work for us to service your accounts or to processtransactions that you may request. This would include, but is not limited to, ourtransfer agent to process your transactions, mailing houses to send you requiredreports and correspondence regarding the Fund and its Adviser, the NicholasCompany, Inc., and our dividend disbursing agent to process fund dividend checks.
* With a party representing you, with your consent, such as your broker or lawyer.
* When required by law, such as in response to a subpoena or other legal process.
The Fund and its Adviser maintain policies and procedures to safeguard your non-publicpersonal information. Access is restricted to employees who the Adviser determines need theinformation in order to perform their job duties. To guard your non-public personalinformation we maintain physical, electronic, and procedural safeguards that comply withfederal standards.
In the event that you hold shares of the Fund with a financial intermediary, including, butnot limited to, a broker-dealer, bank, or trust company, the privacy policy of your financialintermediary would govern how your non-public personal information would be shared withnon-affiliated third parties.
– 31 –
Privacy Policy(unaudited)

– 32 –
Nicholas Funds Services Offered(unaudited)
• IRAs• Traditional • SIMPLE• Roth • SEP
• Coverdell Education Accounts
• Automatic Investment Plan
• Direct Deposit of Dividend and Capital Gain Distributions
• Systematic Withdrawal Plan
• Monthly Automatic Exchange between Funds
• Telephone Purchase and Redemption
• Telephone Exchange
• 24-hour Automated Account Information (800-544-6547)
• 24-hour Internet Account Access (www.nicholasfunds.com)
Please call a shareholder representative for further information on theabove services or with any other questions you may have regardingthe Nicholas Funds (800-544-6547).

Notes

Directors and OfficersDAVID O. NICHOLAS, President and Director
JOHN A. HAUSER, Director
DAVID P. PELISEK, Director
JAY H. ROBERTSON, Director
DAVID L. JOHNSON, Executive Vice President
RYAN P. BUSHMAN, Senior Vice President
JENNIFER R. KLOEHN, Senior Vice President,Treasurer and Chief Compliance Officer
LAWRENCE J. PAVELEC, Senior Vice President and Secretary
CANDACE L. LESAK, Vice President
Investment AdviserNICHOLAS COMPANY, INC.
Milwaukee, Wisconsinwww.nicholasfunds.com
414-276-0535 or 800-544-6547
Transfer AgentU.S. BANCORP FUND SERVICES, LLC
Milwaukee, Wisconsin414-276-0535 or 800-544-6547
DistributorQUASAR DISTRIBUTORS, LLC
Milwaukee, Wisconsin
CustodianU.S. BANK N.A.
Milwaukee, Wisconsin
Independent Registered Public Accounting FirmDELOITTE & TOUCHE LLP
Milwaukee, Wisconsin
CounselMICHAEL BEST & FRIEDRICH LLP
Milwaukee, Wisconsin
This report is submitted for the information of shareholders of the Fund. It is notauthorized for distribution to prospective investors unless preceded or accompanied byan effective prospectus.