Embed Size (px)
Citation preview
q 2002 Geological Society of America. For permission to copy, contact Copyright Permissions, GSA, or [email protected]; December 2002; v. 30; no. 12; p. 1087–1090; 3 figures; 1 table; Data Repository item 2002128. 1087
Nicaraguan volcanoes record paleoceanographic changesaccompanying closure of the Panama gatewayTerry Plank Department of Earth Sciences, Boston University, Boston, Massachusetts 02215, USA, and Department of
Geology, University of Kansas, Lawrence, Kansas 66044, USAVaughn Balzer Department of Geology, University of Kansas, Lawrence, Kansas 66044, USA, and Department of Geology,
Oregon State University, Corvallis, Oregon 97331, USAMichael Carr Department of Geological Sciences, Rutgers University, Piscataway, New Jersey 08854, USA
Figure 1. A: Central American volcanic arc (triangles) andGuatemala Basin (drill sites shown). Arrows indicate oceancirculation (North Equatorial Countercurrent, NECC). Dottedcircle is high-productivity Costa Rica dome (drawn wherethermocline shoals to #40 m in August–November; Fiedleret al., 1991). Shading is seafloor depth; contours are in me-ters. B: Volcanic arc in Nicaragua. Active volcanic front (sol-id triangles) and Miocene Coyol volcanic arc (open circlesare samples dated by Ehrenborg [1996]; open squares aresamples dated in this study). Age ranges are given in Ma.LN is Lago Nicaragua, and LM is Lago Managua.
ABSTRACTA major oceanographic event preserved in the Cocos plate
sedimentary column survived subduction and is recorded in thechanging composition of Nicaraguan magmas. A uranium increasein these magmas since the latest Miocene (after 7 Ma) resultedfrom the ‘‘carbonate crash’’ at 10 Ma and the ensuing high organiccarbon burial in the sediments. The response of the arc to thispaleoceanographic event requires near steady-state sediment re-cycling at this margin since 20 Ma. This relative stability in sedi-ment subduction invites one of the first attempts to balance sedi-mentary input and arc output across a subduction zone.Calculations based on Th indicate that as much as 75% of thesedimentary column was subducted beneath the arc. The Nicara-guan margin is one of the few places to observe such strong linksbetween the oceans and the solid earth.
Keywords: Nicaragua, volcano, geochemistry, sediment, uranium.
INTRODUCTIONThe growth rate of the continental crust and chemical evolution
of the mantle depend in large part on the balance between subductedinput and volcanic output at subduction zones. Sediment subductionrepresents a loss of mass from the continents and a gain of exoticchemical components in the mantle. The recycling of sedimentary ma-terial back to the continents via arc magmatism, however, modulatesthese effects. Despite the importance to the evolution of Earth, fewstudies have attempted to balance mass or chemical components acrosssubduction zones (Patino et al., 2000; Bach et al., 1998). Many diffi-culties arise in attempting such a mass balance. For example, marinesections near trenches have been well sampled by ocean drilling (e.g.,Rea and Ruff, 1996; Plank and Langmuir, 1998), but several millionyears of subduction separate these materials from those currently con-tributing to the magma-genesis zone, typically .100 km beneath thearc. This delay of a few million years is inherent to the recyclingproblem. Can we make sensible predictions about the material flux todepth, and/or can we assume that some aspects of the system are insteady state?
Previous work on the temporal variation of Western Pacific arcshas found that although some may respond to tectonic events such asbackarc spreading (e.g., Tonga; Clift and Vroon, 1996), others havemaintained a relatively constant geochemical composition for millionsof years (e.g., Izu; Bryant et al., 1999). The sediment-recycling sig-nature in these arcs, however, is weak and thus not ideal for exploringthe temporal variability of sediment flux and delivery. However, sed-iment tracers such as the 10Be abundance and the Ba/La ratio reachtheir global maximum in northwestern Nicaragua (Carr et al., 1990;Tera et al., 1986). Nicaragua also has the advantage that the arc hasmigrated trenchward with time; therefore, unlike other arcs where thevolcanic history is buried by each successive eruption, the past .20m.y. of arc volcanism is exposed in surface outcrops in Nicaragua(Ehrenborg, 1996).
TEMPORAL VARIATIONS IN COCOS PLATE SEDIMENTSThe other advantage to studying the temporal response to sedi-
ment subduction in Nicaragua is the simple sedimentary stratigraphyon the incoming Cocos plate (Fig. 1). Results from Deep Sea DrillingProject (DSDP) Leg 67 and Ocean Drilling Program (ODP) Legs 138and 170 have provided a detailed history of sedimentation in the Gua-temala Basin (Aubouin et al., 1982; Mayer et al., 1992; Kimura et al.,1997). The sedimentary column consists largely of two units, pelagiccarbonate overlain by diatomaceous hemipelagic clayey ooze (Fig. 2).The boundary between these two units is roughly synchronous acrossthe basin ca. 10 Ma and represents the ‘‘carbonate crash’’ (Lyle et al.,1995). The crash is thought to have been caused by an ;800 m risein the carbonate compensation depth, apparently reflecting the cessa-

1088 GEOLOGY, December 2002
Figure 2. Lithostratigraphy and chemos-tratigraphy at Deep Sea Drilling ProjectSite 495 and Ocean Drilling Program Sites844 and 845, Guatemala Basin. A and B:Calcium carbonate concentrations and or-ganic carbon mass-accumulation ratedowncore (Aubouin et al., 1982; Mayer etal., 1992). C and D: Ba and U mass-accumulation rate downcore. Site 495data are from Patino et al. (2000); Sites844 and 845 inductively coupled plasma–mass spectrometry data are in Data Re-pository (see text footnote 1). Shaded baris 11–9 Ma time period of carbonate crashin Guatemala Basin and separatescarbonate-rich from hemipelagic (hemi.)unit. High organic C and U at top of sec-tions is most likely due to passage ofsites beneath productive Costa Ricadome. Higher U concentrations at Site495 are consistent with its longer historybeneath dome.
tion of flow of less corrosive Caribbean intermediate and deep waterinto the Pacific following the shoaling of the Panama sill (Lyle et al.,1995; Farrell et al., 1995). Postcrash sediments were enriched in or-ganic carbon as the seafloor approached the Costa Rica dome, a regionof very high open-ocean surface productivity (Hofmann et al., 1981).
Because geochemical tracers are the means by which we detectsediment recycling, we need to relate the stratigraphic changes tochanges in the geochemical fluxes into the trench. Toward this end, weanalyzed 16 samples from ODP Sites 844 and 845 (Data Repository1
and Fig. 2), which, when combined with data from DSDP Site 495(Patino et al., 2000), provide a chemical stratigraphy of GuatemalaBasin sediments. Although most elements have very different concen-trations in the two lithologic units, we focus here on Ba and U, whichare notably enriched in the modern Nicaraguan volcanic arc, wherethey correlate with unambiguous sediment tracers such as 10Be.
The U abundance varies with lithologic type, being low in thelower pelagic carbonate unit (,500 ppb), but high in the upper hem-ipelagic ooze unit (to 10 ppm). As is commonly observed, U followsorganic C owing to authigenic precipitation of reduced U(IV) oxides(Chase et al., 2001; Klinkhammer and Palmer, 1991). At face value,the steep increase in both organic C and U in the top 25 m of thecolumns might be expected as any site approaches land, receives ter-restrial carbon, and then undergoes diagenetic release. There are severalreasons, however, why this generic model does not appear to be thedominant control on the U and C distributions. These sites are at.3000 m water depth and far from coastal upwelling regimes andterrestrial carbon sources. This is consistent with C/N ratios in ODPSites 844 and 845 sediments, which indicate predominantly marinesources (Meyers, 1997). The lack of sulfate reduction or ammoniumproduction in pore fluids at ODP Sites 844 and 845 (Mayer et al.,1992) suggests that diagenesis may not be the major controlling pro-cess. Instead, the increase of U and organic C during the past fewmillion years appears to coincide with passage of the sites beneath theincreased productivity caused by upwelling in the Costa Rica dome(Fig. 1A). Although there is little direct information on the history ofthe Costa Rica dome, it likely strengthened ca. 5–4 Ma, when theshoaling of the Panama sill caused major changes in basin salinity(Haug et al., 2001), thermocline depth (Cannariato and Ravelo, 1997),surface currents (Nisancioglu et al., 2002), and position of the inter-tropical convergence zone (Hovan, 1995); the latter may have the larg-
1GSA Data Repository item 2002128, Age data, geochemistry of sedimentsand volcanic rocks, and bulk sediment flux calculations, is available from Doc-uments Secretary, GSA, P.O. Box 9140, Boulder, CO 80301–9140, [email protected], or at www.geosociety.org/pubs/ft2002.htm.
est effect on the formation and position of the dome (Hofmann et al.,1981).
Although high U at the top of the section seems to reflect highproductivity in the Costa Rica dome, the low U abundances within thelower carbonate-rich unit are most likely due to a lack of preservationof organic matter. Carbonate-rich sediments typically have lower or-ganic C abundances than clay-rich sediments. The reasons are debated,but the lower surface area of carbonate sediments, owing in part to theabundance of sand-sized foraminifera, may lead to poorly preservedorganic C (Mayer, 1994; Pedersen, 1995) and by association, U. Forexample, ODP Sites 845 and 850 both underlie regions with similarmodern surface productivity (Lyle, 1992), and yet the carbonate-richsurface sediments at Site 850 contain much lower organic C (,0.4wt%) than the higher-surface-area clay-rich surface sediments at Site845 (.2 wt% organic C). Thus, the U profile in the Cocos sedimentsreflects both biologic productivity and preservation. The closure of thePanama gateway led to the carbonate crash ca. 10 Ma and strengthenedthe Costa Rica dome ca. 5–4 Ma, both of which enhanced precipitation,preservation, and subduction of U in sediments at the Central AmericanTrench.
In contrast to U, Ba accumulation rates were high prior to thecarbonate crash and have decreased somewhat since. The entire columnpreserves a high proportion (.95%) of authigenic Ba (Schroeder etal., 1997), and the lithologic changes in the section appear to have hadlittle effect on Ba preservation. High Ba concentration (.2000 ppm)is a long-term (.16 m.y.) feature of the subducting sedimentary col-umn, whereas high U is not. Because mass-accumulation rates are di-rectly proportional to subduction-input rates, high Ba accumulationtranslates into high Ba flux to the Central American Trench throughoutthe past 20 m.y., whereas the U flux has increased dramatically duringthe past several million years.
By using the foregoing inferences, we calculate sediment-subduction fluxes at 12 Ma, just prior to the carbonate crash, and at2.5 Ma, the age of material currently beneath the arc (Table 1). Thesecalculations show that the sedimentary flux of U to the trench hasincreased by a factor of 4, whereas the flux of Ba has varied only by;10%.
SEDIMENT RECYCLING AT THE NICARAGUA ARCIn order to gauge the response of the Nicaragua arc to these tem-
poral changes in the sediment input, we conducted a field campaign in1996 to sample the Miocene Coyol arc (Ehrenborg, 1996; Fig. 1). TheAr-Ar dates (see footnote 1) range from 24 to 7 Ma, and the arc hasmigrated trenchward since ca. 13 Ma (Fig. 1). The unsampled 7–0 Ma

GEOLOGY, December 2002 1089
TABLE 1. CONCENTRATIONS AND FLUXES
U(ppm)
Th(ppm)
Ba(ppm)
La(ppm)
Material flux*(31010kg/m.y.)
Bulk sediment, 2.5 Ma 1.17 0.81 2705 14.0 2.8Bulk sediment, 12 Ma 0.30 0.91 2422 13.5 2.9Avg. Modern arc 0.69 0.89 663 6.9 3.3Avg. Miocene arc 0.46 1.01 621 8.6 3.3Fractionated MORB 0.14 0.37 28 7.8
Note: MORB is mid-oceanic-ridge basalt. Sediment and Miocene arcconcentrations are given in GSA Data Repository (see footnote 1 in text). Modernarc data from Carr and Rose (1987). Sediment column currently beneath Nicaraguawas subducted at 2.5 Ma (on the basis of 68 mm/yr convergence rate, 688 slab dip,and 158 km depth to slab beneath arc). Arc flux calculated after subtracting mid-oceanic-ridge basalt (23 normal-MORB in Hofmann, 1988). Sediment flux at 2.5Ma from 464 m column and 885.6 kg/m3 dry bulk density. Sediment flux at 12 Mafrom 454 m, 946.6 kg/m3. Volcanic output rates from Patino et al. (2000); 1.17 3107 m3/Ma (per meter arc length) and 2800 kg/m3 density.
*Per meter arc length.
Figure 3. Geochemical variations along Central American volcanicarc, illustrating similar Ba/La ratios and contrasting U/Th ratios be-tween modern and Miocene volcanic rocks in Nicaragua sector.These relationships are consistent with changes calculated for sed-imentary columns subducted at 2.5 Ma and 12 Ma in Central Amer-ican Trench (Table 1), shown as arrows (some off scale). Modern arcdata are from Carr and Rose (1987); Miocene data are in Data Re-pository (see text footnote 1). Samples plotted have <53% SiO2(modern) or .3% MgO (Miocene), and <2% loss on ignition (leastaltered), and exclude high TiO2 basalts (as in Carr et al., 1990). Al-teration studies demonstrate that severe visible alteration (morethan that for samples plotted here) leads to <6.5% U loss and 17%Ba addition (Balzer, 1999). U/Th and Ba/La ratios are plotted insteadof U and Ba concentrations in order to minimize effects of partialmelting and crystal fractionation and to distinguish from mid-oceanic-ridge basalts (MORBs) and oceanic-island basalts (OIBs).Average arc concentrations (no screening or normalizing) also re-flect similar Ba (within 7%) and markedly different U (50%) betweenmodern and Miocene arcs. Relationship between arc and sedimentratios is not 1:1 because ratios are fractionated as sedimentary ma-terial leaves subducting plate and mixes with mantle beneath arc.
volcanic section is presumably buried beneath volcaniclastic depositsin the Nicaragua depression. We collected ;60 samples (Balzer, 1999)and analyzed ;40 of the most mafic and least altered for major andtrace elements and Sr isotopes (see footnote 1). In order to expand ourcoverage, we analyzed another ;20 samples collected previously (Nys-trom et al., 1988). The close similarities between the Coyol and modernarcs in major element and rare earth element (REE) compositions (Bal-zer, 1999) suggest that the Coyol volcanic rocks most likely representthe main Miocene arc, and not backarc volcanism.
Remarkably, the Coyol arc preserves the same along-strike trendin the Ba/La ratio as the modern arc, both in magnitude and spatialgradient (Fig. 3). This coincidence suggests that both the incoming fluxof Ba and the delivery process have been fairly constant along thismargin for 20 m.y. However, the Coyol arc is uniformly depleted in Urelative to the modern arc (Fig. 3), a finding consistent with predictedstratigraphic changes in Cocos plate sediments. Because all the Coyolsamples are older than 7 Ma and because the subduction time was ca.2.5 Ma, the sedimentary columns contributing to the Coyol arc allpreceded the carbonate crash. In addition to U and Ba, other chemicalsystematics are consistent with the predicted sedimentary fluxes. TheCoyol and modern arcs are similar in their range of Ce/Pb ratios andCe anomalies, as are the predicted sediment columns, whereas the Coy-ol arc has slightly lower 87Sr/86Sr ratios, as predicted from the globalseawater Sr isotope curve. Thus, the temporal stability (in Ba, Ce/Pb,rare earth elements) and changes (in U and Sr isotopes) in the Nicar-aguan arcs appear to originate in the oceanographic processes that con-trol Cocos plate sedimentation.
Given the regularity in the subduction process at Nicaragua, it ispossible to balance the input and output fluxes for some element trac-ers. A full mass balance would require an estimate of the compositionof the subducting basaltic basement as well, because this layer alsocontributes elements to the arc (e.g., Elliott et al., 1997). Basaltic Ubuffers arc concentrations, which is the reason that the modern andMiocene arcs vary by at most a factor of two (Fig. 3), whereas thesediment flux varies by a factor of four (Table 1). Unfortunately, theCocos basement has been poorly sampled in this region, so we focushere on the elements Th and Ba, the budgets of which in this arc aredominated by sediment input (Plank and Langmuir, 1993). We calculate(Table 1) that 76% of the sedimentary Th and 28% of the sedimentaryBa are recycled to the arc. These results are for the average Nicaraguanarc and do not take into account the large gradient in Ba/La ratio alongthe arc, which reflects important along-strike variations in delivery, thesource of which is debated (Carr et al., 1990; Leeman et al., 1994;Herrstrom et al., 1995; von Huene et al., 2000). We obtain virtuallythe same mass balance for the 12 Ma sedimentary column and averageMiocene arc (80% of the Th and 28% of the Ba), assuming a constantmaterial flux for the arc. These calculations demonstrate near-steady-
state recycling efficiency of this margin since 20 Ma. The preferentialrecycling of Th over Ba is not predicted from partition coefficients forred clay (Johnson and Plank, 1999), but may be related to the differentbehavior of the primary Ba host (sulfate) and Th host (silicate) in thesubduction zone, or the shallow loss of Ba to a fluid during sulfatereduction (Shipboard Scientific Party, 1997). Regardless of the exactmechanisms, the magnitude of Th recycling requires subduction of atleast 75% of the sedimentary column beneath the arc. This result isconsistent with efficient 10Be recycling (Tera et al., 1986), as well asthe apparent lack of sedimentary accretion at the Nicaragua margin(Ranero and von Huene, 2000).
The fidelity of the recycling process at the Nicaragua ‘‘subductionfactory’’ illustrates how tectonic events reverberate through Earth. Tec-tonic uplift of the Isthmus of Panama restricted and ultimately endedcommunication between the tropical Atlantic and Pacific Oceans. Thisepisode caused changes in seawater chemistry and ensuing sedimen-tation, which then affected element fluxes to the Central AmericanTrench and ultimately the composition of magmas erupted in the vol-

1090 GEOLOGY, December 2002
canic arc. Although Patino et al. (2000) showed how the two sedi-mentary units on the Cocos plate can be resolved in eruptive productsfrom a single volcano, we show how secular variations in the two unitshave been recorded in the arc during the past 20 m.y. It remains to beseen whether we can extend this treatment to volatile components andassess the impact of the carbonate crash and subduction cycling on thelong-term global carbonate-CO2 cycle.
ACKNOWLEDGMENTSWe thank J.-O. Nystrom for generously providing Coyol arc samples and
Wilfried Strauch and Nelson Buitrago at the Instituto Nicaraguense de EstudiosTerritoriales for help in Nicaragua. We also thank Rick Murray, Maureen Ray-mo, Andy Kurtz, Christina Ravelo, Simon Turner, and Mitch Lyle for discus-sions and reviews, Dan Gravatt for technical assistance, and Bruce Idleman atLehigh University for performing Ar-Ar dating. Eli Silver, Kirk McIntosh, andJulie Morris were essential in the initiation of this project. We acknowledgesupport from U.S. National Science Foundation grants OCE-9521717 (to Plank)and EAR-9628251, EAR-9406624, and OCE-9521716 (to Carr).
REFERENCES CITEDAubouin, J., and von Huene, R., 1982, Initial reports of the Deep Sea Drilling
Project, Volume 67: Washington, D.C., U.S. Government Printing Office,799 p.
Bach, W., Hegner, E., and Joerg, A., 1998, Chemical fluxes in the Tonga sub-duction zone: Evidence from the southern Lau Basin: Geophysical Re-search Letters, v. 25, p. 1467–1470.
Balzer, V.G., 1999, The late Miocene history of sediment subduction and re-cycling as recorded in the Nicaraguan volcanic arc [M.S. thesis]: Law-rence, University of Kansas, 151 p.
Bryant, C.J., Arculus, R.J., and Eggins, S.M., 1999, Laser ablation–inductivelycoupled plasma–mass spectrometry and tephras: A new approach to un-derstanding arc magma genesis: Geology, v. 27, p. 1119–1122.
Cannariato, K.G., and Ravelo, A.C., 1997, Pliocene–Pleistocene evolution ofthe eastern Pacific surface water circulation and thermocline depth: Pa-leoceanography, v. 12, p. 805.
Carr, M.J., and Rose, W.I., Jr., 1987, CENTAM: A database of Central Americanvolcanic rocks: Journal of Volcanology and Geothermal Research, v. 33,p. 239–240.
Carr, M.J., Feigenson, M.D., and Bennett, E.A., 1990, Incompatible elementand isotopic evidence for tectonic control of source mixing and melt ex-traction along the Central American arc: Contributions to Mineralogy andPetrology, v. 105, p. 369–380.
Chase, Z., Anderson, R.F., and Fleisher, M.Q., 2001, Evidence from authigenicuranium for increased productivity of the glacial Subantarctic Ocean: Pa-leoceanography, v. 16, p. 468–478.
Clift, P.D., and Vroon, P.Z., 1996, Isotopic evolution of the Tonga arc duringLau Basin rifting: Evidence from the volcaniclastic record: Journal ofPetrology, v. 37, p. 1153–1173.
Ehrenborg, J., 1996, A new stratigraphy for the Tertiary volcanic rocks of theNicaragua Highland: Geological Society of America Bulletin, v. 108,p. 830–842.
Elliott, T., Plank, T., Zindler, A., White, W., and Bourdon, B., 1997, Elementtransport from subducted slab to volcanic front at the Mariana arc: Journalof Geophysical Research, v. 102, p. 14,991–15,019.
Farrell, J., Raffi, I., Janacek, T.R., Murray, D.W., Levitan, M., Dadey, K.A.,Emeis, K.-C., Lyle, M., Flores, J.-A., and Hovan, S., 1995, Late Neogenesedimentation patterns in the eastern equatorial Pacific ocean, in Pisias,N.G., Mayer, L.A., et al., Proceedings of the Ocean Drilling Program,Scientific results, Volume 138: College Station, Texas, Ocean Drilling Pro-gram, p. 717–753.
Fiedler, P.C., Philbrick, V., and Chavez, F.P., 1991, Oceanic upwelling and pro-ductivity in the eastern tropical Pacific: Limnology and Oceanography,v. 36, p. 1834–1850.
Haug, G.H., Tiedemann, R., Zahn, R., and Ravelo, A.C., 2001, Role of Panamauplift on oceanic freshwater balance: Geology, v. 29, p. 207–210.
Herrstrom, E.A., Reagan, M.K., and Morris, J.D., 1995, Variations in lava com-position associated with flow of asthenosphere beneath southern CentralAmerica: Geology, v. 23, p. 617–620.
Hofmann, A.W., 1988, Chemical differentiation of the Earth: The relationshipbetween mantle, continental crust and oceanic crust: Earth and PlanetaryScience Letters, v. 90, p. 297–314.
Hofmann, E.E., Busalacchi, A.J., and O’Brien, J.J., 1981, Wind generation ofthe Costa Rica dome: Science, v. 214, p. 552–554.
Hovan, S., 1995, Late Cenozoic atmospheric circulation intensity and climatichistory recorded by eolian deposition in the eastern Equatorial PacificOcean, Leg 138, in Pisias, N.G., Mayer, L.A., et al., Proceedings of theOcean Drilling Program, Scientific results, Volume 138: College Station,Texas, Ocean Drilling Program, p. 615–625.
Johnson, M.C., and Plank, T., 1999, Dehydration and melting experiments con-strain the fate of subducted sediments: Geochemistry Geophysics andGeosystems, v. 1, p. 1999GC000014.
Kimura, G., Silver, E., and Blum, P., 1997, Proceedings of the Ocean DrillingProgram, Initial reports, Volume 170: College Station, Texas, Ocean Dril-ling Program, 554 p.
Klinkhammer, G.P., and Palmer, M.R., 1991, Uranium in the oceans: Where itgoes and why: Geochimica et Cosmochimica Acta, v. 55, p. 1799–1806.
Leeman, W.P., Carr, M.J., and Morris, J.D., 1994, Boron geochemistry of theCentral American volcanic arc—Constraints on the genesis of subduction-related magmas: Geochimica et Cosmochimica Acta, v. 58, p. 149–168.
Lyle, M., 1992, Composition maps of surface sediments of the eastern tropicalPacific ocean, in Mayer, L., Pisias, N., et al., Proceedings of the OceanDrilling Program, Scientific results, Volume 138: College Station, Texas,Ocean Drilling Program, p. 101–115.
Lyle, M., Dadey, K.A., and Farrell, J.W., 1995, The late Miocene (11–8 Ma)eastern Pacific carbonate crash: Evidence for reorganization of deep-watercirculation by the closure of the Panama gateway, in Pisias, N.G., Mayer,L.A., et al., Proceedings of the Ocean Drilling Program, Scientific results,Volume 138: College Station, Texas, Ocean Drilling Program, p. 821–838.
Mayer, L.M., 1994, Surface area control of organic carbon accumulation incontinental shelf sediments: Geochimica et Cosmochimica Acta, v. 58,p. 1271–1284.
Mayer, L., Pisias, N., and Janacek, T., 1992, Proceedings of the Ocean DrillingProgram, Initial reports, Volume 138: College Station, Texas, Ocean Dril-ling Program, 855 p.
Meyers, P.A., 1997, Organic geochemical proxies of paleoceanographic, paleo-limnologic, and paleoclimatic processes: Organic Geochemistry, v. 27,p. 213–250.
Nisancioglu, K.H., Raymo, M.E., and Stone, P.H., 2002, Reorganization of Mio-cene deep water circulation in response to the shoaling of the CentralAmerican seaway: Paleoceanography (in press).
Nystrom, J.-O., Levi, B., Troeng, B., Ehrenborg, J., and Carranza, G., 1998,Geochemistry of volcanic rocks in a traverse through Nicaragua: San Jose,Costa Rica, Revista Geologica de America Central, v. 8, p. 77–109.
Patino, L.C., Carr, M.J., and Feigenson, M.D., 2000, Local and regional vari-ations in Central American arc lavas controlled by variations in subductedsediment input: Contributions to Mineralogy and Petrology, v. 138,p. 265.
Pedersen, T.F., 1995, Sedimentary organic matter preservation: An assessmentand speculative synthesis: A comment: Marine Chemistry, v. 49,p. 117–119.
Plank, T., and Langmuir, C.H., 1993, Tracing trace elements from sedimentinput to volcanic output at subduction zones: Nature, v. 362, p. 739–743.
Plank, T., and Langmuir, C.H., 1998, The chemical composition of subductingsediment: Implications for the crust and mantle: Chemical Geology,v. 145, p. 325–394.
Ranero, C.R., and von Huene, R., 2000, Subduction erosion along the MiddleAmerica convergent margin: Nature, v. 404, p. 748–752.
Rea, D.K., and Ruff, L.J., 1996, Composition and mass flux of sediment en-tering the world’s subduction zones: Implications for global sediment bud-gets, great earthquakes, and volcanism: Earth and Planetary Science Let-ters, v. 140, p. 1–12.
Schroeder, J.O., Murray, R.W., Leinen, M., Pflaum, R.C., and Janacek, T., 1997,Barium in equatorial Pacific carbonate sediment: Terrigenous, oxide, andbiogenic associations: Paleoceanography, v. 12, p. 125–146.
Shipboard Scientific Party, 1997, Site 1040, in Kimura, G., Silver, E., et al.,Proceedings of the Ocean Drilling Program, Scientific results, Volume170: College Station, Texas, Ocean Drilling Program, p. 95–152.
Tera, F., Brown, L., Morris, J., Sacks, I.S., Klein, J., and Middleton, R., 1986,Sediment incorporation in island-arc magmas: Inferences from 10Be: Geo-chimica et Cosmochimica Acta, v. 50, p. 535–550.
von Huene, R., Ranero, C.R., Weinrebe, W., and Hinz, K., 2000, Quaternaryconvergent margin tectonics of Costa Rica, segmentation of the Cocosplate, and Central American volcanism: Tectonics, v. 19, p. 314–334.
Manuscript received May 6, 2002Revised manuscript received August 16, 2002Manuscript accepted August 20, 2002
Printed in USA

Plank-Page DR1
Table DR1: Chemical analyes of ODP 844 and 845 sediments
Leg138- 844B 844B 844B 844B 844B 844B 844B 844B 845A 845A 845A 845A 845A 845A 845A 845ACore-sec 2H-1 3H-2 4H-4 6H-6 9H-1 14H-4 21X-6 30X-6 1H-1 3H-5 7H-4 10H-2 16H-3 18H-5 25X-5 31X-4cm interval 46-47 100-102 56-57 102-104 66-67 100-102 100-102 145-150 30-32 40-42 96-98 101-103 110-112 100-102 100-102 70-72Subunit # IA IA IB IB IIA IIA IIB IIB IA IA IA IB IIA IIB IIB IICDepth (mcd) 6.1 18.76 20.02 55.13 80.32 138.8 212.14 299.21 0.31 24.37 65.43 94.6 162.44 185.89 258.74 314.34Depth (mbsf) 4.96 16.5 28.6 51.03 71.77 124 193.5 280.6 0.31 23.51 60.6 86.1 144.71 166.61 233.51 289.11Age (Ma) 0.45 1.82 2.05 7.74 10.53 12.18 14.41 17.07 0.0103 0.99119 3.87082 5.78568 10.2149 11.6704 15.0606 16.7506ICP-ES: SiO2 40.77 54.28 57.84 62.68 53.75 6.22 34.06 31.38 48.41 56.18 55.72 46.81 30.11 12.95 10.29 10.76 TiO2 0.421 0.640 0.527 0.403 0.053 0.009 0.008 0.017 0.379 0.427 0.543 0.387 0.118 0.062 0.029 0.057 Al2O3 8.18 12.89 13.04 7.55 1.18 0.36 0.37 0.44 8.46 9.66 11.94 8.75 3.67 0.84 0.79 1.09 Fe2O3 5.82 6.98 5.17 3.10 0.86 0.22 0.16 0.53 6.52 6.15 6.89 7.49 7.39 2.57 3.11 3.47 MnO 0.246 0.201 0.225 0.210 0.114 0.056 0.053 0.181 0.321 0.302 0.653 1.023 1.209 0.274 0.262 1.207 MgO 3.06 3.53 2.50 2.06 0.93 0.32 0.34 0.57 3.73 3.61 3.65 4.00 2.36 1.00 1.08 2.11 CaO 12.98 1.49 2.53 4.24 19.11 50.67 33.68 36.65 3.72 3.03 1.57 7.07 26.30 43.19 44.88 43.61 NaO 5.17 6.38 4.99 5.93 3.79 1.31 1.84 1.83 8.77 6.38 5.81 6.31 3.83 2.02 1.44 1.13 K2O 1.16 1.67 2.44 1.51 0.45 0.21 0.19 0.21 1.55 1.42 1.76 1.36 0.85 0.35 0.36 0.24 P2O5 0.187 0.262 0.236 0.224 0.136 0.089 0.045 0.048 0.174 0.171 0.365 0.402 0.430 0.151 0.177 0.189LOI 21.53 10.56 9.70 11.03 19.00 40.23 28.91 27.81 17.37 11.86 10.16 15.45 22.93 36.15 37.21 35.76H20- 8.36 15.31 8.11 10.01 8.89 3.01 4.30 3.56 15.90 14.92 14.43 12.31 9.33 4.45 3.34 5.13 Sr 554 434 369 563 830 1605 1091 1211 361 372 346 556 1197 1753 1502 1299 Ba 4285 10671 7634 10269 5361 1428 2378 2159 5578 7766 9094 8915 6998 2637 2254 2430shipboard:CaCO3 % 19.5 0.1 2.2 5.9 28.1 90.3 74.3 68.6 5.08 4.25 0.67 10.92 47.84 75.59 79.09 76.59Org. C % 0.9 0.4 0.3 0.2 0.5 na na na 2.27 0.94 0.35 0.64 0.52 na na naICP-MS: isoLi 7 45.43 59.96 46.20 18.08 10.76 4.01 1.64 10.32 39.14 50.27 55.32 45.27 21.48 8.92 10.50 40.63Be 9 1.068 1.551 1.515 1.545 0.767 0.149 0.446 0.335 1.204 1.387 1.780 1.726 1.459 0.380 0.474 0.402Sc 45 20.67 25.30 19.98 13.96 7.02 1.57 2.38 2.49 24.25 23.83 25.30 19.89 9.06 3.03 2.79 4.77V 51 316.8 132.9 97.9 69.4 48.6 11.3 9.0 14.7 166.5 222.8 101.1 242.6 35.2 58.8 26.1 34.2Cr 52 41.80 67.79 40.49 16.10 6.30 1.27 2.19 3.75 35.13 39.00 60.00 36.14 9.48 6.46 5.26 3.13Co 59 67.19 49.72 32.03 41.33 7.28 2.49 3.47 3.85 39.18 50.92 78.22 74.12 19.91 4.43 5.78 7.41Ni 60 704.0 480.4 260.2 422.2 111.0 10.3 10.2 10.5 445.1 486.7 573.7 706.6 77.8 20.9 26.4 32.1Cu 63 336.1 303.8 410.5 241.9 145.8 32.4 223.5 44.0 299.0 444.2 1017.6 1415.0 271.6 119.5 81.5 149.6Zn 66 503.3 451.9 233.5 267.7 128.6 20.8 20.9 21.7 608.3 579.3 405.9 505.0 148.5 41.0 54.6 65.6Ga 71 12.67 21.85 17.86 13.42 3.33 0.94 1.56 1.30 13.85 17.35 22.22 16.03 10.05 2.10 1.94 2.11Rb 85 27.05 43.50 69.71 31.59 5.38 0.93 1.18 2.68 34.93 37.26 46.85 41.46 42.58 7.65 8.69 5.36Sr 88 558 441 376 570 817 1580 1078 1201 366 379 352 560 1159 1749 1478 1281Y 89 34.1 65.1 59.5 48.1 22.2 11.5 8.2 8.8 38.1 41.3 80.6 95.4 64.6 26.5 17.6 20.8Zr 90 85.2 150.7 151.2 128.8 40.6 7.4 15.9 12.2 109.9 111.5 131.4 121.2 78.3 19.4 18.9 21.5Nb 93 4.584 7.908 7.755 8.067 0.853 0.163 0.173 0.354 4.537 5.108 6.139 5.325 3.989 0.524 0.570 0.887Cs 133 1.813 2.475 3.484 1.020 0.180 0.033 0.036 0.085 2.232 2.649 3.030 2.136 1.907 0.240 0.218 0.123Ba 135 4256 10505 7506 10157 5453 1450 2407 2178 5498 7626 8948 8855 7236 2643 2291 2466La 139 16.73 30.89 32.73 25.32 9.93 3.65 3.23 3.96 21.47 21.88 41.92 55.11 39.84 12.49 8.32 11.40Ce 140 25.02 38.65 46.14 31.69 4.54 0.84 0.89 1.44 27.23 29.97 42.49 36.35 22.91 3.76 3.08 3.84Pr 141 4.00 7.75 7.99 6.32 2.11 0.60 0.62 0.81 5.16 5.62 10.80 12.48 8.77 2.40 1.60 2.55Nd 146 16.96 33.08 32.50 26.48 9.11 2.64 2.67 3.46 21.73 24.00 45.98 52.90 36.46 10.35 6.88 10.74Sm 147 3.86 7.34 6.88 6.15 1.95 0.53 0.57 0.73 4.74 5.42 10.28 11.19 7.17 2.08 1.41 2.26Eu 151 1.059 2.034 1.781 1.715 0.335 0.152 0.131 0.177 1.291 1.466 2.731 2.980 1.638 0.545 0.373 0.594Gd 160 4.593 8.787 7.787 7.118 2.55 0.81 0.79 0.98 5.596 6.328 11.961 13.574 9.08 2.84 1.93 2.83Tb 159 0.797 1.533 1.352 1.222 0.431 0.140 0.134 0.170 0.978 1.099 2.064 2.297 1.557 0.481 0.329 0.485Dy 162 4.66 8.88 7.77 7.02 2.58 0.89 0.80 1.00 5.60 6.26 11.60 13.12 9.11 2.85 1.95 2.75Ho 165 1.057 1.991 1.724 1.558 0.590 0.222 0.186 0.226 1.237 1.359 2.498 2.895 2.013 0.645 0.447 0.592Er 166 3.12 5.78 5.00 4.48 1.72 0.68 0.54 0.65 3.56 3.84 7.09 8.16 5.73 1.86 1.31 1.67Yb 174 3.12 5.71 4.89 4.25 1.64 0.65 0.52 0.62 3.59 3.74 6.73 7.40 5.17 1.68 1.24 1.53Lu 175 0.516 0.932 0.793 0.676 0.276 0.112 0.088 0.100 0.590 0.605 1.087 1.176 0.819 0.262 0.198 0.237Hf 178 1.714 2.756 3.250 2.506 0.498 0.105 0.166 0.165 1.872 1.994 2.318 1.997 1.504 0.261 0.246 0.374Ta 181 0.228 0.403 0.454 0.407 0.047 0.009 0.007 0.018 0.223 0.255 0.303 0.255 0.292 0.028 0.023 0.048Pb 208 8.10 14.58 15.08 11.89 2.91 0.74 0.58 1.31 17.78 16.12 33.34 13.65 19.34 2.55 6.06 8.51Th 232 2.259 3.108 6.250 2.910 0.347 0.052 0.066 0.118 2.754 2.715 3.283 2.860 3.746 0.271 0.210 0.273U 238 9.651 1.508 2.125 1.232 1.986 0.541 0.272 0.232 7.074 9.668 1.330 0.956 0.996 0.260 0.104 0.267Samples taken from same interval as shipboard carbon/carbonate measurements (Mayer et al., 1992); na: no analysis; mcd: meters composite depth;mbsf: meters below seafloor; LOI: weight loss on ignition to 950°C; H2O-: weight loss to 105°C; all concentrations reported relative to dry (105°C) weightICP-MS solution were prepared in Savillex beakers as described in Johnson and Plank (1999), except H2O2 was added to decompose organic matter, and HNO3 and HF were added sequentially to dissolve first carbaonte and then silicate in carbonate-rich samplesUnknowns were calibrated using volcanic rock standard reference materials, with Ca, Sr and Ba added to match carbonate matrix68Zn, 69Ga, 139La, 147Sm and 151Eu were corrected for Ba intereferencesICP-ES solutions were prepared by LiBO2 fusion, after Plank and Ludden (1992); see Balzer (1999) for further details on ICP-ES and ICP-MS analyses.

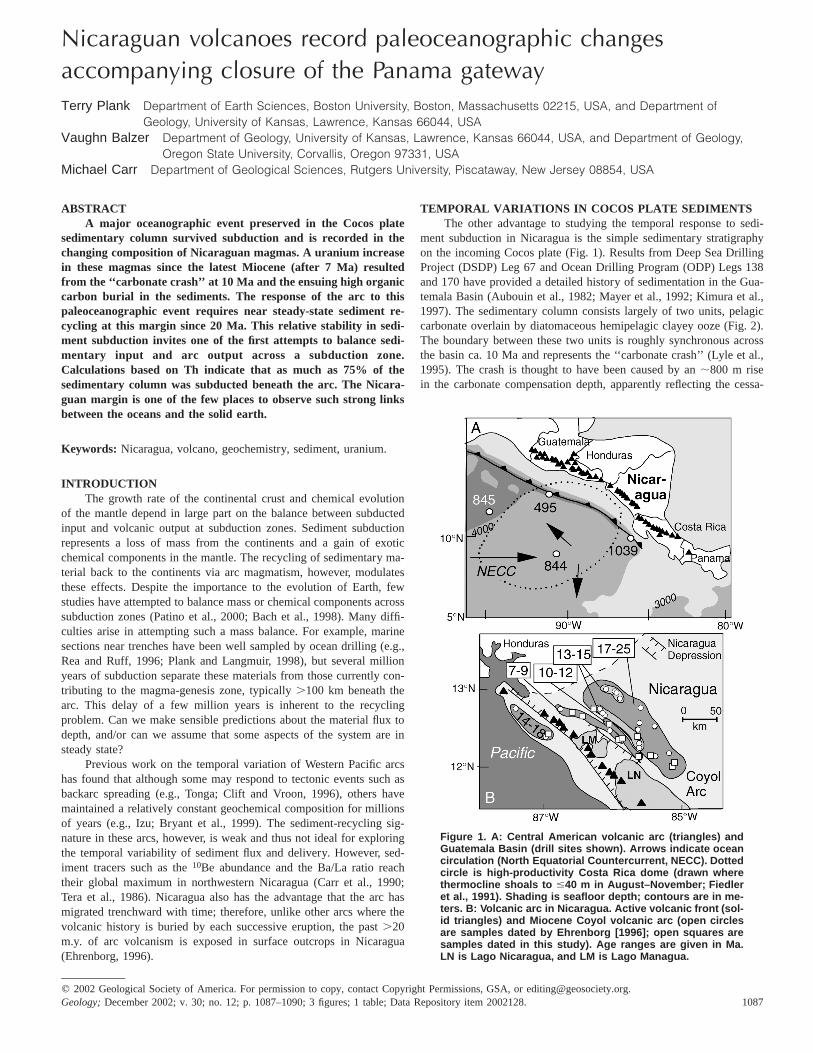
Plank-Page DR2
Table DR2: Chemical analyses, locations and ages of Miocene volcanics from Nicaragua
Sample CHD 2 CHD 3 TAM 2 LEO 18 LEO 25A LEO 25B TAM 1 LEO 8 LEO 9 TOR 1 LAR 1LMSplit Ny Ny Ny Ny Ny Ny NyUTM E 538.9 506.7 537.8 537.8 538.9 538.6 539.4 530.4 544.9UTM N 1341 1372.9 1342.6 1342.6 1341 1341.1 1340.5 1404 1405.1Age (Ma) 16.28err 0.26Age gr. II II II II II II II II II I IRegion Tam Tam Tam Tam Tam Tam Tam Tam Tam Lar LarDist. (km) 591 596 648 648 691 691 693 693 693 647 657DCP-ES:SiO2 53.19 54.74 54.51 50.58 58.62 58.57 50.91 54.55 51.80 52.96 67.08TiO2 1.11 1.18 1.50 1.38 1.15 1.26 1.30 1.50 1.06 1.71 0.58Al2O3 16.32 16.41 15.54 16.43 14.52 14.75 17.28 15.11 18.70 17.29 16.59FeO 10.32 10.29 11.83 12.14 10.41 9.90 11.55 11.98 10.40 9.05 4.05MnO 0.18 0.19 0.21 0.20 0.23 0.25 0.21 0.24 0.20 0.13 0.09MgO 5.53 4.51 4.12 5.73 3.16 3.32 5.52 4.24 4.17 4.92 1.31CaO 9.75 8.72 8.47 10.28 7.45 7.89 10.12 8.23 10.22 9.09 4.07Na2O 2.80 3.00 2.90 2.66 3.29 3.29 2.46 3.17 2.78 3.32 4.18K2O 0.60 0.73 0.65 0.50 0.96 0.55 0.47 0.66 0.53 1.10 1.88P2O5 0.19 0.23 0.26 0.08 0.22 0.22 0.20 0.33 0.13 0.43 0.17LOI 0.59 0.86 0.11 1.41 0.45 1.00 1.49 0.75 0.49 0.99 1.38ICP-MS:Li 9.32 10.02 13.97 8.03 23.59 7.02 8.32 12.09 5.83 4.54Be 0.53 0.64 0.80 0.65 0.74 0.81 0.67 0.80 0.51 1.19Sc 39.82 36.67 42.46 42.04 38.93 39.95 40.89 43.24 36.19 20.35 14.70V 365.37 380.23 355.81 406.52 276.35 287.00 398.29 356.23 357.79 249.44 96.32Cr 53.99 10.81 2.26 69.33 1.10 0.63 69.00 2.70 20.34 78.71 1.76Co 34.22 31.60 34.24 38.53 25.52 26.45 37.84 32.88 31.00 30.50 7.83Ni 21.71 13.02 8.39 30.85 2.34 2.04 30.60 7.29 12.93 36.35 2.96Cu 231.56 344.49 266.34 353.37 178.83 174.10 294.18 269.79 202.42 149.89 30.96Zn 96.55 101.94 124.18 110.80 119.78 124.51 110.66 122.80 96.34 127.04 65.65Rb 10.31 11.72 6.07 8.33 7.26 4.95 6.75 4.06 5.10 6.29 48.63Sr 370.03 377.09 312.32 332.04 323.62 369.35 332.95 305.62 355.93 1233.85 331.83Y 23.75 27.72 39.55 30.94 34.15 37.38 29.50 39.72 21.96 13.18 40.10Zr 65.06 85.69 99.84 81.85 91.14 93.86 77.25 102.60 53.01 56.50 168.88Nb 0.97 1.77 1.64 1.62 1.46 1.50 1.50 1.62 0.91 3.18 3.26Cs 0.37 0.20 0.06 0.61 0.06 0.64 0.38 0.05 0.09 0.19 1.98Ba 477.63 515.40 387.12 297.03 433.43 478.35 285.04 421.80 272.92 661.20 1196.43Ga 17.03 17.53 17.13 17.94 17.19 17.68 17.16 17.68 18.61 9.95La 3.59 4.92 6.51 4.81 6.15 6.55 4.56 6.54 3.79 11.32 14.15Ce 9.55 12.91 17.07 13.09 15.56 16.40 12.36 17.20 9.45 25.22 28.82Pr 1.73 2.26 2.98 2.33 2.69 2.83 2.19 3.02 1.66 4.32 4.64Nd 8.90 11.41 14.98 11.98 13.55 14.17 11.22 15.34 8.29 20.03 20.56Sm 2.76 3.42 4.66 3.72 4.03 4.25 3.57 4.68 2.51 4.37 5.19Eu 0.99 1.16 1.55 1.28 1.38 1.44 1.20 1.55 0.94 1.59 1.40Gd 3.54 4.27 5.86 4.76 5.09 5.41 4.50 5.91 3.22 3.74 6.02Tb 0.67 0.80 1.09 0.88 0.96 1.01 0.83 1.10 0.60 0.56 1.07Dy 3.91 4.63 6.41 5.19 5.65 5.98 4.90 6.48 3.55 2.66 6.07Ho 0.84 0.99 1.40 1.12 1.22 1.31 1.05 1.40 0.78 0.46 1.30Er 2.40 2.83 3.94 3.18 3.48 3.72 3.00 3.97 2.23 1.19 3.76Yb 2.34 2.77 3.79 3.06 3.41 3.62 2.90 3.83 2.18 0.95 3.91Lu 0.37 0.44 0.61 0.48 0.54 0.58 0.46 0.61 0.34 0.15 0.65Hf 1.92 2.49 2.86 2.39 2.65 2.73 2.20 2.93 1.53 1.77 4.15Ta 0.07 0.12 0.11 0.11 0.11 0.11 0.10 0.11 0.06 0.20 0.23Pb 2.90 3.28 3.44 3.29 3.66 4.05 2.78 3.72 2.27 3.72 6.70Th 0.28 0.42 0.54 0.41 0.60 0.62 0.39 0.56 0.20 0.25 2.07U 0.14 0.21 0.28 0.20 0.30 0.32 0.19 0.28 0.11 0.12 0.9787Sr/86Sr
Oxides (wt%); Elements (ppm). Ny = Splits from Nystrom et al. (1988); Ar-Ar total fusion groundmass ages, Lehigh Univ. Age group I ~ 6-13 Ma, II ~ 16-24 Ma; (*) = step heating Ar-Ar ages. Regions: Tamarindo, Larreynaga, Zarzales, Ciudad Dairo-Laguna Mayua, San Jacinto- Las Lajas, San Lorenzo, San Esteban, Juigalpa, El Rama. Major elements by DCP-ES at Rutgers University; and ICP-ES at the University of Kansas for Ny splits. All Fe calculated as FeO, and major elements summed to 100%. Trace elements by ICP-MS at University of Kansas. ICP-MS precision is better than 3% based on replicate analyses of a basalt standard (MAR) over the course of this project. Analytical procedures followed those in Johnson and Plank (1999) and Balzer (1999).

Plank-Page DR3
Table DR2
SampleSplitUTM EUTM NAge (Ma)errAge gr.RegionDist. (km)DCP-ES:SiO2 TiO2 Al2O3FeOMnOMgO CaO Na2OK2OP2O5LOIICP-MS:LiBeScV CrCoNiCuZnRbSrY ZrNbCsBaGaLaCePrNdSmEuGdTbDyHoErYbLuHfTaPbThU87Sr/86Sr
LAR 1M LAR 2 ZAR 12 ZAR 1 ZAR 2 ZAR 3 ZAR 5 ZAR 7 ZAR 6 ZAR 8 ZAR 9
544.9 544.7 557.5 561.1 561.1 562.2 570.3 577.1 574 578 582.51405.1 1405.7 1402.4 1400 1400.1 1400.1 1406.6 1410.7 1406.9 1410.6 1409.5
7.96 7.7 16.72 *0.1 0.11 0.25
I I I I I I II II II II IILar Lar Zar Zar Zar Zar Zar Zar Zar Zar Zar657 657 669 673 673 673 675 678 678 680 683
67.72 57.21 68.94 57.95 51.83 60.60 50.85 51.80 65.71 60.86 65.510.55 0.75 0.81 0.90 0.95 1.11 0.85 1.10 0.85 0.85 0.82
16.59 18.23 15.09 19.13 20.20 15.96 18.72 19.10 15.86 17.97 16.153.89 7.30 4.24 6.85 9.21 7.60 9.58 8.38 4.60 5.56 4.730.06 0.15 0.05 0.17 0.17 0.15 0.19 0.19 0.10 0.12 0.110.63 3.96 0.48 2.27 3.24 2.60 5.73 2.63 1.27 1.95 1.453.76 8.11 2.82 6.97 10.74 6.92 10.79 12.67 3.99 6.00 4.124.58 2.96 4.66 4.39 2.90 2.76 2.63 3.01 3.77 4.16 4.032.04 1.18 2.66 1.02 0.56 1.98 0.54 0.78 3.55 2.17 2.770.16 0.15 0.24 0.34 0.21 0.31 0.12 0.35 0.29 0.37 0.301.19 1.97 1.30 1.45 1.37 2.42 1.44 7.03 2.14 1.28 2.06
15.07 6.75 21.81 27.07 27.751.42 1.06 0.76 1.47 1.42
14.24 28.85 18.36 23.43 30.22 27.98 34.30 24.42 15.45 19.21 15.1676.88 227.30 40.67 130.92 174.54 193.31 301.04 211.65 72.79 108.35 85.11
9.80 0.93 1.50 33.72 8.23 35.48 26.66 1.37 0.62 1.556.40 23.75 3.79 13.50 24.22 15.16 35.16 23.03 7.16 11.55 7.690.55 25.30 0.47 2.97 14.16 13.45 28.30 16.15 2.25 15.33 2.48
31.66 118.13 10.75 14.62 144.00 69.75 152.67 65.36 25.65 36.28 19.5355.66 76.32 90.50 85.56 72.34 107.55 80.40 79.27 69.13 63.42 71.6743.14 20.05 57.18 16.66 11.66 41.81 7.37 16.46 90.08 49.13 64.97
314.53 383.80 297.48 580.55 502.43 372.06 390.27 655.74 310.76 383.24 343.7641.29 22.91 63.77 30.52 23.41 34.38 15.15 24.40 41.72 31.93 46.47
165.90 76.70 234.19 90.73 58.93 140.48 48.38 104.84 246.42 165.25 238.873.35 1.49 4.39 2.21 1.45 3.25 0.93 2.51 5.48 4.18 5.271.16 1.39 1.69 0.45 0.38 3.07 0.08 1.70 2.15 1.31 0.63
1293.25 619.32 1606.50 723.67 485.50 1020.42 266.47 470.91 1039.23 645.71 939.5011.30 17.07 17.53 9.38 11.14
19.47 4.92 17.74 9.88 7.11 10.85 3.53 8.74 16.96 13.19 17.0635.63 12.32 39.21 22.46 14.95 25.96 8.96 20.91 39.29 31.19 39.156.90 2.03 7.24 3.80 2.72 4.23 1.49 3.21 5.82 4.70 5.89
29.69 9.76 33.33 17.85 12.99 19.77 7.38 14.76 25.20 20.94 25.667.10 2.85 8.54 4.69 3.51 5.21 2.19 3.79 6.25 5.18 6.471.77 0.94 2.13 1.65 1.28 1.51 0.84 1.22 1.55 1.46 1.677.25 3.39 9.69 5.25 4.13 5.85 2.65 4.24 6.62 5.49 7.161.28 0.64 1.73 0.91 0.72 1.06 0.48 0.73 1.17 0.98 1.237.07 3.71 10.04 5.10 4.10 5.82 2.78 4.06 6.59 5.33 6.941.44 0.81 2.15 1.06 0.88 1.24 0.60 0.84 1.39 1.11 1.464.11 2.28 6.22 2.96 2.46 3.47 1.65 2.32 3.93 3.10 4.054.05 2.32 6.20 2.84 2.36 3.40 1.60 2.16 3.88 3.02 3.810.65 0.37 0.98 0.45 0.37 0.54 0.25 0.34 0.62 0.47 0.614.33 2.27 6.44 2.43 1.72 4.10 1.44 2.77 6.21 4.48 6.010.22 0.10 0.30 0.14 0.10 0.20 0.07 0.18 0.38 0.28 0.365.66 3.57 8.68 2.30 2.40 6.42 2.24 4.51 9.15 6.72 8.222.15 0.81 2.34 0.98 0.62 1.57 0.41 1.37 3.56 2.50 3.451.01 0.42 1.10 0.42 0.28 0.74 0.19 0.57 1.53 1.09 1.50
0.703785 0.703796

Plank-Page DR4
Table DR2
SampleSplitUTM EUTM NAge (Ma)errAge gr.RegionDist. (km)DCP-ES:SiO2 TiO2 Al2O3FeOMnOMgO CaO Na2OK2OP2O5LOIICP-MS:LiBeScV CrCoNiCuZnRbSrY ZrNbCsBaGaLaCePrNdSmEuGdTbDyHoErYbLuHfTaPbThU87Sr/86Sr
ZAR 11 CD 1 CD 2 CDC 2 CDC 3 LM 3B LM 3A LM 2A LM 2B LM 1 SJ 2Ny Ny
582.3 594.5 595.8 602.8 602.9 599.2 599.2 600.5 600.5 602.5 610.41408.1 1400.8 1401.6 1394.6 1394.6 1388.4 1388.4 1388.62 1388.62 1377.8 1361.9
II I I I I I I I I I IZar CD-LM CD-LM CD-LM CD-LM CD-LM CD-LM CD-LM CD-LM CD-LM SJ-LL683 697 697 708 708 709 709 711 711 718 735
66.21 52.44 51.46 53.30 51.97 53.92 51.64 50.00 50.06 52.10 51.840.85 0.87 1.13 0.81 0.81 1.44 1.05 1.08 0.84 0.99 0.92
15.62 19.98 18.86 16.56 20.34 17.29 17.92 19.70 23.32 17.73 17.834.73 9.06 10.45 9.08 8.22 11.29 9.33 10.87 7.73 9.42 8.840.10 0.18 0.30 0.17 0.16 0.19 0.17 0.18 0.14 0.19 0.231.35 3.25 3.97 6.87 4.79 3.31 5.95 3.84 2.72 6.38 6.183.85 10.78 9.71 9.68 10.35 7.87 9.88 10.40 11.92 9.26 10.333.93 2.73 3.14 2.87 2.88 3.51 3.01 3.00 2.69 2.92 2.813.03 0.58 0.71 0.49 0.40 0.80 0.74 0.69 0.42 0.68 0.720.32 0.13 0.27 0.17 0.10 0.37 0.30 0.24 0.16 0.33 0.293.47 1.15 1.02 0.54 0.52 2.39 0.72 0.92 0.73 0.48 0.89
24.66 6.431.49 0.65
16.05 33.46 31.40 31.84 26.46 33.23 28.73 30.55 23.20 32.16 33.6069.41 304.86 294.78 232.31 227.10 270.75 221.89 335.49 232.37 237.16 255.630.84 28.14 10.24 310.65 63.33 2.88 173.39 7.40 4.20 180.65 301.536.91 31.25 35.34 36.72 32.23 23.23 34.14 31.48 21.69 36.73 37.481.88 14.81 13.53 98.20 53.09 9.30 80.92 27.70 10.09 73.97 74.41
18.99 156.55 156.69 102.50 100.91 189.66 101.70 175.30 102.06 110.31 109.1371.33 78.60 92.32 79.21 65.46 118.26 86.83 78.00 61.30 98.09 82.2271.53 13.39 13.71 6.47 4.54 16.53 9.96 11.76 7.92 8.55 8.41
254.47 482.79 482.80 444.31 525.03 456.76 435.14 631.08 553.01 445.21 505.3341.10 21.06 55.29 25.85 21.42 35.96 22.55 22.31 16.49 24.78 24.84
249.56 53.78 71.14 46.05 43.56 99.01 91.24 53.11 38.65 89.24 65.845.57 1.20 2.74 1.60 1.53 3.81 4.28 2.03 1.45 3.72 2.441.63 0.45 0.42 0.26 0.18 0.71 0.24 0.40 0.23 0.22 0.18
1066.93 579.77 1990.53 669.98 484.45 763.04 690.30 579.28 501.01 601.41 795.6010.41 16.5817.26 8.06 15.06 6.09 4.56 11.82 9.25 7.18 5.07 9.91 9.2839.99 16.47 29.37 13.06 10.37 22.26 20.36 15.82 9.81 20.97 20.615.94 2.78 4.83 2.15 1.77 4.29 3.11 2.68 1.75 3.25 3.29
25.68 12.49 22.92 10.40 8.71 20.59 14.16 12.87 8.37 14.60 15.466.33 3.33 6.10 2.88 2.49 5.55 3.59 3.38 2.30 3.61 3.981.58 1.06 2.15 1.14 0.98 1.80 1.29 1.21 0.96 1.20 1.446.70 3.76 7.76 3.75 3.21 6.46 4.00 3.80 2.77 4.06 4.541.19 0.67 1.36 0.67 0.58 1.13 0.71 0.67 0.49 0.70 0.786.64 3.75 7.82 3.93 3.31 6.29 3.99 3.69 2.79 4.01 4.361.39 0.79 1.73 0.86 0.72 1.32 0.83 0.78 0.60 0.83 0.923.90 2.16 4.91 2.44 2.03 3.68 2.32 2.17 1.70 2.36 2.563.86 2.09 4.46 2.33 1.87 3.46 2.19 2.02 1.60 2.25 2.450.62 0.33 0.73 0.37 0.30 0.54 0.34 0.32 0.25 0.36 0.396.24 1.52 2.03 1.31 1.23 2.75 2.36 1.63 1.18 2.24 1.780.38 0.08 0.18 0.11 0.10 0.24 0.26 0.12 0.10 0.22 0.15
10.40 2.75 3.12 2.17 1.86 4.20 3.16 2.72 1.94 3.62 2.953.64 0.54 0.77 0.50 0.16 1.06 0.49 0.55 0.35 0.46 0.511.55 0.23 0.35 0.20 0.07 0.40 0.21 0.26 0.14 0.20 0.23
0.703641

Plank-Page DR5
Table DR2
SampleSplitUTM EUTM NAge (Ma)errAge gr.RegionDist. (km)DCP-ES:SiO2 TiO2 Al2O3FeOMnOMgO CaO Na2OK2OP2O5LOIICP-MS:LiBeScV CrCoNiCuZnRbSrY ZrNbCsBaGaLaCePrNdSmEuGdTbDyHoErYbLuHfTaPbThU87Sr/86Sr
SJ 3 EC 136 LL 3 LL 4 EC 177 EC 179 LL 1 LL 6 LL 5 LL 2 SLU 2Ny Ny Ny Ny
610.4 616.9 622.1 622.4 622.2 622.2 618.4 641.5 647.5 620.5 6491361.9 1365.6 1368 1369.3 1373.1 1373.2 1365.7 1367.7 1341.6 1366 1388.5
8.87 11.23 10.160.21 0.24 0.26
I I I I I I I I I I IISJ-LL SJ-LL SJ-LL SJ-LL SJ-LL SJ-LL SJ-LL SJ-LL SJ-LL SJ-SL SL
735 737 740 740 740 740 740 754 777 740 748
63.18 56.70 59.79 49.59 50.73 53.17 48.85 51.55 52.20 49.74 55.750.62 0.92 0.73 1.03 1.02 1.00 0.74 1.02 0.82 0.87 0.89
17.84 18.17 17.51 18.41 17.82 16.68 15.77 19.27 17.84 16.86 18.735.07 8.00 6.88 11.00 10.04 9.51 9.54 9.12 8.75 9.29 7.750.15 0.17 0.14 0.20 0.20 0.17 0.18 0.21 0.17 0.17 0.181.42 2.53 3.16 5.73 5.54 5.70 10.25 3.71 5.74 8.82 3.584.93 8.28 6.91 10.37 10.84 9.50 12.05 11.24 10.52 10.72 8.304.31 3.65 3.02 2.72 2.72 2.97 1.93 2.78 2.58 2.52 3.722.24 1.25 1.67 0.75 0.77 0.84 0.52 0.86 1.18 0.72 0.720.25 0.33 0.18 0.19 0.32 0.47 0.17 0.25 0.19 0.28 0.391.13 0.65 1.79 1.15 0.93 0.85 1.70 1.06 0.29 1.48 1.43
9.88 6.26 5.32 5.04 4.351.30 0.79 0.83 0.52 1.14
12.55 27.81 23.71 35.17 34.86 31.61 39.93 33.15 36.56 31.94 20.41122.06 227.27 192.52 357.45 296.29 236.10 268.74 294.97 267.00 241.54 178.18
2.23 2.08 15.90 15.53 162.72 169.56 391.30 16.76 110.81 315.80 2.2212.85 20.39 20.01 36.21 43.33 30.56 44.46 27.12 34.18 39.77 21.184.43 3.00 10.69 26.37 76.38 73.56 109.62 26.69 40.96 95.54 3.91
45.86 129.83 88.13 219.94 151.43 116.04 120.73 201.60 134.91 135.01 59.4467.11 84.83 75.08 91.52 79.83 82.12 71.63 88.67 87.22 80.99 84.2548.64 20.86 39.80 21.64 10.88 9.77 9.36 16.04 26.73 12.04 23.88
486.11 522.38 417.97 570.86 540.44 506.51 453.71 456.00 409.86 513.79 693.4526.47 25.13 24.74 18.50 18.75 24.03 14.34 24.10 20.42 17.95 27.01
161.71 87.10 112.72 41.67 50.10 78.28 38.49 73.29 76.85 56.95 120.003.14 2.00 2.32 0.99 1.77 3.14 1.24 3.07 2.85 2.46 3.380.76 0.52 1.64 0.19 0.31 0.15 0.06 0.60 0.78 0.26 1.54
1447.14 877.84 997.51 267.38 706.92 546.36 249.19 595.19 717.22 414.94 488.059.13 21.18 12.82 12.89 19.38
15.25 7.44 8.81 5.80 6.59 9.16 5.19 7.21 7.97 7.67 12.2631.49 17.42 19.76 14.11 14.34 19.88 12.28 17.06 17.60 18.15 27.484.69 2.82 3.07 2.41 2.32 3.21 2.00 2.75 2.77 2.87 4.21
19.65 13.25 13.81 11.62 10.58 14.46 9.32 13.05 12.60 13.34 18.584.52 3.60 3.52 3.10 2.79 3.64 2.44 3.56 3.27 3.33 4.551.39 1.23 1.08 1.13 1.07 1.30 0.88 1.19 1.11 1.16 1.454.53 4.10 3.93 3.37 3.23 4.14 2.75 4.16 3.66 3.57 4.740.77 0.74 0.71 0.59 0.56 0.73 0.48 0.76 0.66 0.61 0.814.23 4.18 3.99 3.27 3.20 4.12 2.62 4.19 3.60 3.24 4.490.87 0.87 0.84 0.68 0.67 0.85 0.53 0.89 0.75 0.66 0.922.49 2.47 2.40 1.88 1.86 2.43 1.45 2.49 2.10 1.80 2.572.54 2.45 2.42 1.79 1.77 2.36 1.36 2.45 2.05 1.72 2.570.42 0.38 0.39 0.28 0.28 0.38 0.21 0.39 0.32 0.27 0.403.91 2.34 3.03 1.32 1.30 1.95 1.12 2.14 2.17 1.56 2.880.21 0.13 0.17 0.06 0.12 0.18 0.08 0.19 0.18 0.14 0.225.64 3.17 5.22 1.97 2.15 2.84 1.65 3.40 3.16 2.79 4.241.80 1.13 1.47 0.31 0.64 0.48 0.32 0.89 1.19 0.43 1.641.00 0.51 0.66 0.19 0.29 0.22 0.15 0.40 0.53 0.23 0.68
0.703793

Plank-Page DR6
Table DR2
SampleSplitUTM EUTM NAge (Ma)errAge gr.RegionDist. (km)DCP-ES:SiO2 TiO2 Al2O3FeOMnOMgO CaO Na2OK2OP2O5LOIICP-MS:LiBeScV CrCoNiCuZnRbSrY ZrNbCsBaGaLaCePrNdSmEuGdTbDyHoErYbLuHfTaPbThU87Sr/86Sr
SL 1 SL 2 SE 1 SE 2 JUI 1 JUI 2 RAMA 16 RAM 16 RAMA 15 RAM 15CNy Ny
644.4 647.7 666.5 672.3 685.2 690 699.7 699.6 702.2 702.391368.7 1361.9 1341.6 1341.3 1333.5 1329.3 1327.5 1327.5 1330.9 1330.99
15.95 * 17.58 23.89 19.660.46 0.26 0.88 0.38
II II II II II II II II II IISL SLSE-RamaSE-RamaSE-RamaSE-Rama SE-Rama SE-Rama SE-Rama SE-Rama
755 763 792 794 810 818 825 825 826 826
54.45 67.00 52.38 50.25 50.05 66.65 52.26 52.33 50.72 49.831.02 0.56 0.82 0.97 0.90 0.50 0.86 0.84 0.85 0.69
18.16 16.08 19.76 18.25 19.28 15.99 17.66 18.38 20.52 22.269.42 3.84 8.20 9.59 9.81 3.89 8.85 8.69 8.80 7.680.19 0.11 0.15 0.18 0.18 0.12 0.14 0.12 0.18 0.144.08 1.43 4.32 5.99 4.99 1.97 6.72 6.04 5.01 4.368.46 4.00 10.59 11.61 11.88 5.00 9.76 9.96 10.88 12.553.20 3.82 2.86 2.47 2.45 3.93 2.80 2.70 2.46 2.090.83 2.98 0.71 0.49 0.31 1.84 0.78 0.72 0.44 0.280.20 0.20 0.20 0.19 0.15 0.09 0.19 0.22 0.14 0.111.16 5.02 1.16 2.99 1.21 0.94 0.91 2.29 0.60 0.62
4.16 6.85 5.33 4.75 5.410.72 1.26 0.66 0.65 0.35
35.66 11.07 30.62 35.36 35.83 17.11 29.77 30.63 32.83 28.48302.96 74.79 252.63 288.41 309.42 111.65 240.41 231.44 294.56 248.7213.93 4.63 45.43 50.81 35.70 14.18 138.18 139.90 28.43 19.9528.54 7.24 27.32 33.15 31.68 12.94 34.13 32.78 31.50 27.5510.48 3.35 36.35 26.86 36.15 13.29 59.71 58.99 17.58 30.7995.76 27.05 66.53 130.75 138.62 41.04 77.58 98.34 93.89 156.2492.78 59.82 80.41 76.93 77.72 52.32 73.29 70.83 75.22 65.1148.95 62.06 11.28 3.85 2.49 32.70 23.13 10.77 4.70 4.11
413.97 333.85 524.52 442.26 441.07 268.36 463.00 469.28 415.44 408.5225.61 23.30 19.57 16.19 16.17 20.90 17.42 17.24 14.86 11.7492.31 168.70 57.41 49.99 35.31 128.25 60.20 58.30 36.81 29.592.25 3.89 1.63 1.63 0.96 2.54 4.75 2.46 0.76 0.690.82 0.49 0.07 0.49 0.06 0.39 0.28 0.07 0.05 0.13
383.58 1324.39 343.92 237.17 220.62 705.89 282.12 277.80 168.43 143.6717.44 9.26 17.17 15.56 18.667.42 14.01 6.30 5.78 4.06 9.16 12.11 6.68 3.06 2.78
17.51 28.94 14.59 13.70 9.71 20.35 28.19 15.23 7.53 6.812.79 4.03 2.32 2.19 1.63 2.93 4.49 2.38 1.27 1.15
12.98 16.35 10.88 10.37 7.98 12.45 20.67 10.75 6.28 5.663.54 3.71 2.88 2.79 2.33 2.97 5.45 2.73 1.85 1.631.13 1.11 1.04 1.03 0.90 0.96 1.62 0.98 0.73 0.654.05 3.78 3.22 3.15 2.73 3.17 6.38 3.01 2.23 1.930.73 0.65 0.57 0.56 0.50 0.58 1.13 0.53 0.42 0.364.22 3.66 3.20 3.13 2.92 3.32 6.54 2.96 2.40 2.060.90 0.77 0.68 0.65 0.62 0.71 1.37 0.61 0.52 0.452.54 2.24 1.90 1.82 1.73 2.12 3.86 1.71 1.47 1.252.50 2.41 1.84 1.75 1.69 2.34 3.70 1.65 1.46 1.230.39 0.39 0.29 0.27 0.26 0.38 0.58 0.26 0.23 0.202.52 4.03 1.58 1.48 1.11 3.35 3.47 1.56 1.03 0.920.16 0.29 0.11 0.11 0.06 0.21 0.32 0.16 0.05 0.053.03 8.12 2.02 2.05 1.75 4.37 3.73 2.03 1.11 0.621.18 2.65 0.69 0.58 0.43 1.92 1.97 0.46 0.32 0.280.51 1.19 0.32 0.24 0.21 0.90 0.78 0.23 0.14 0.14
0.703604
Plank-Page DR7
Table DR2
SampleSplitUTM EUTM NAge (Ma)errAge gr.RegionDist. (km)DCP-ES:SiO2 TiO2 Al2O3FeOMnOMgO CaO Na2OK2OP2O5LOIICP-MS:LiBeScV CrCoNiCuZnRbSrY ZrNbCsBaGaLaCePrNdSmEuGdTbDyHoErYbLuHfTaPbThU87Sr/86Sr
RAMA 14 RAMA 11 RAMA 10 RAMA 7Ny Ny Ny Ny
717.4 738.3 749.6 756.41333.7 1326.2 1327.4 1329.9
II II II IISE-Rama SE-Rama SE-Rama SE-Rama
836 856 864 867
53.89 60.72 50.59 50.891.49 0.87 0.99 1.07
15.51 17.28 17.26 17.6911.45 6.63 9.18 9.330.20 0.15 0.20 0.214.28 2.51 8.23 7.218.43 6.18 10.21 9.773.12 4.21 2.46 2.891.23 1.25 0.61 0.670.39 0.20 0.27 0.280.49 0.62 1.19 0.68
9.250.96
43.91 23.86 32.32 32.70443.19 165.87 248.52 247.4115.81 3.30 205.24 242.9235.85 15.73 38.73 36.5015.45 2.96 92.76 92.05
294.28 39.99 201.59 81.60115.87 95.07 73.55 75.85
9.31 20.27 9.99 8.66335.52 432.04 338.92 379.0738.69 30.70 17.62 20.23
126.43 96.54 52.28 67.382.56 3.33 4.20 3.130.06 0.18 0.07 0.05
483.64 492.64 172.86 232.6420.60
6.96 8.82 5.84 6.4315.83 20.23 13.44 15.022.46 3.24 2.10 2.38
11.15 15.09 9.66 10.922.83 4.08 2.59 2.891.03 1.44 0.95 1.073.20 4.67 3.07 3.440.56 0.84 0.55 0.613.12 4.86 3.11 3.490.65 1.03 0.65 0.741.81 2.96 1.84 2.081.77 2.99 1.78 2.040.28 0.47 0.28 0.321.63 2.49 1.45 1.760.17 0.22 0.26 0.211.93 2.70 1.46 1.550.48 1.03 0.53 0.550.24 0.50 0.22 0.23

Table DR3. Bulk sediment calculationsHemi-1 Carb-1 Carb-2 Carb-3 Bulk-2.5 Bulk-12
Thick (m) 464 454dens(g/cc) 1.37 1.72 1.92 1.54 1.64 1.69 SiO2 55.00 13.60 4.25 29.67 19.58 15.54 TiO2 0.592 0.030 0.021 0.344 0.135 0.101 Al2O3 12.36 0.880 0.160 7.19 2.92 2.21 Fe2O3 6.21 3.14 1.97 5.02 3.49 3.35 MnO 0.146 0.610 0.230 0.434 0.444 0.495 MgO 2.26 0.980 0.781 1.71 1.18 1.11 CaO 2.99 41.3 52.2 27.6 36.2 40.2 NaO 2.10 0.430 0.196 1.06 0.700 0.532 K2O 1.82 0.260 0.169 1.02 0.539 0.419 P2O5 0.126 0.153 0.130 0.157 0.143 0.150LOI 16.4 38.6 40.0 25.9 34.7 35.9H20- 61 44 31 52 46 44CaCO3 % 0.0 73.8 90.9 45.9 63.2 70.6Sc 14.8 3.67 2.20 9.98 5.49 4.86V 117 74.5 48.7 118 77.4 79.5Cr 35.1 11.5 17.5 29.0 17.2 16.7Co 58.1 6.60 4.15 14.4 15.9 7.95Ni 181 39.9 26.1 38.5 63.9 36.9Cu 152 139 61.9 121 126 120Zn 227 69.7 31.0 75.8 91.7 63.6Rb 39.7 6.40 4.54 35.0 12.4 12.7Sr 332 1290 1523 926 1155 1250Y 27.7 27.1 12.8 25.8 24.3 24.0Zr 138 19.4 3.52 62.9 38.8 26.5Nb 3.92 0.878 0.249 4.432 1.329 1.586Cs 2.25 0.257 0.155 2.811 0.616 0.834Ba 3344 2785 1875 1988 2705 2422La 20.7 14.2 7.4 16.7 14.0 13.5Ce 28.3 5.13 1.43 19.89 8.79 7.86Pr 4.80 2.60 1.40 3.65 2.77 2.61Nd 18.3 10.1 5.2 14.0 10.7 10.1Sm 4.12 2.48 1.08 3.11 2.50 2.35Eu 1.07 0.492 0.250 0.705 0.553 0.495Gd 4.38 2.63 1.29 3.11 2.69 2.48Tb 0.700 0.480 0.240 0.548 0.473 0.449Dy 4.49 3.16 1.61 3.42 3.10 2.92Ho 1.00 0.670 0.365 0.739 0.670 0.627Er 2.91 1.80 1.05 2.03 1.86 1.71Yb 2.68 1.57 1.00 1.85 1.67 1.53Lu 0.400 0.230 0.155 0.281 0.247 0.227Hf 2.74 0.297 0.054 1.377 0.712 0.502Ta 0.205 0.046 0.013 0.285 0.070 0.096Pb 9.03 5.85 3.61 7.73 5.99 5.85Th 2.94 0.381 0.088 2.893 0.809 0.911U 5.47 0.159 0.169 0.766 1.174 0.30387Sr/86Sr 0.70763 0.70866 0.70831 0.70840 0.70851 0.70824
Carb-1 = sample s24-7-19 in Patino et al, (2000), which has ~75% CaCO3, appropriate to the average for the unit. Other elements calculated as above.
2.5 Ma sedimentary column = 140m Hemi1 + 255m Carb1 + 63m Carb2.12 Ma sedimentary column = 136m Carb-3 + 255m Carb1 + 63m Carb2.Bulk calculations are by mass, based on the thickness, wet bulk density and H2O- of each unit.
Carb-3 = calculated based on opal-free accumulation rates in Site 495 as 35 m arc ash (the average of all Nicaraguan volcanics with < 40 ppm Cr in the Centam database; Carr and Rose, 1987), 35 m continental detritus (post-Archean average shale; Taylor and McLennan, 1985); and 65 m carbonate (as in Carb-1, above).
Sedimentary column compositions calculated based on the section at Site 495, which consists of hydrothermal -oxide-carbonate (Carb-2), overlain by pelagic carbonate with opal (Carb-1), hemipelagic diatom ooze, and hemipelagic ooze with arc ash (Hemi-1). These same units are used to calculate the 2.5 Ma column (see below), but assuming 2.5 Ma (~27 m) more Carb-1 preceding the carbonate crash, and 2.5 Ma (~ 27 m) less of Hemi-1 immediately following the crash, based on accumulation rates in Aubouin et al. (1982). The top unit in the 12 Ma column (Carb-3) was assumed to be deposited prior to both the carbonate crash and the Costa Rica dome, but with otherwise a similar sedimentation history to Hemi-1 in Site 495.Hemi-1 = average of top 5 samples (145 m) at Site 495 (Patino et al., 2000). Co calculated from Co/Fe, Zn from Zn/Cu, Ga from Ga/Al, Zr from Zr/Al, Hf from Hf/Zr, and Ta from Nb/Ta in 844 and 845 sediments (Table DR1).
Carb-2 = average of lower 7 samples (63 m) at Site 495 (Patino et al., 2000), where Fe2O3/Al2O3 > 7, indicative of hydrothermal particulates. Other elements calculated as above.

References to Data Reposity Items
Aubouin, J. and von Huene, R., 1982, Initial Reports of the Deep Sea Drilling Project , Volume
67: Washington, D.C., U.S., Government Printing Office, 799 p.
Balzer, V.G., 1999, The late Miocene history of sediment subduction and recycling as recorded
in the Nicaraguan volcanic arc [M.S. thesis]: Lawrence, University of Kansas, 151 p.
Carr, M.J., and Rose, W.I., Jr., 1987, CENTAM—A data base of Central American volcanic
rocks: Journal of Volcanology and Geothermal Research, v. 33, p. 239–240.
Johnson, M.C., and Plank, T., 1999, Dehydration and melting experiments constrain the fate of
subducted sediments: Geochemistry Geophysics and Geosystems, v. 1, p.
1999GC000014.
Mayer, L., Pisias, N., and Janacek, T., 1992, Proceedings of the Ocean Drilling Program, Initial
reports, Volume 138: College Station, Texas, Ocean Drilling Program, 855 p.
Nyström, J-O., Levi, B., Troeng, B., Ehrenborg, J., and Carranza, G., 1998, Geochemistry of
volcanic rocks in a traverse through Nicaragua: San Jose, Costa Rica, Revista Geologica
de America Central, v. 8, p. 77–109.
Patino, L.C., Carr, M.J., and Feigenson, M.D., 2000, Local and regional variations in Central
American arc lavas controlled by variations in subducted sediment input: Contributions
to Mineralogy and Petrology, v. 138, p. 265.
Plank, T., and Ludden, J.N., 1992, Geochemistry of sediments in the Argo Abyssal Plain at ODP
Site 765: A continental margin reference section for sediment recycling in subduction
zones, in Ludden, J.N., and Gradstein, F., et al., Proceedings of the Ocean Drilling
Program, Scientific results, Volume 123: College Station, Texas, Ocean Drilling
Program, p. 167–189.
Taylor, S.R., and McLennan, S.M., 1985, The continental crust: Its composition and evolution:
Oxford, Blackwell, 312 p.