Embed Size (px)
Citation preview
NI 43-101 Technical Report on Resources Brewery Creek Project
Yukon, Canada
Prepared for:
Americas Bullion Royalty Corp. 1200 - 750 West Pender Street
Vancouver, British Columbia V6C2T8
Project Number: GU-000394-0001-01TTO
Effective Date: June 1, 2013
Report Date: October 23, 2013
Prepared by:
274 Union Boulevard, Suite 450
Lakewood, CO 80228
Endorsed by:
Donald Hulse, P.E., SME-RM M. Claiborne Newton, III, Ph.D., SME-RM
Michael J. Lechner, P. Geo. James F. Barr, P.Geo.
Joe Keane, P.E.
Americas Bullion Royalty Corp. i Brewery Creek Project NI 43-101 Technical Report on Resources
Gustavson Associates, LLC October 23, 2013 Brewery Creek_NI 43-101 TR_Final_20131023.docx
Table of Contents
1 SUMMARY (ITEM 1) ......................................................................................... 1-1 1.1 Property Description and Location .......................................................... 1-1 1.2 Ownership ............................................................................................... 1-2 1.3 Geology and Mineralization .................................................................... 1-2 1.4 Exploration Status ................................................................................... 1-3 1.5 Development and Operations ................................................................. 1-3 1.6 Mineral Resource Estimate ..................................................................... 1-4 1.7 Conclusions and Recommendations ...................................................... 1-8
2 INTRODUCTION (ITEM 2) ................................................................................ 2-1 2.1 Terms of Reference and Purpose of the Report ..................................... 2-1 2.2 Qualifications of Consultants .................................................................. 2-1
2.2.1 Details of Inspection .................................................................. 2-2 2.3 Sources of Information ............................................................................ 2-3 2.4 Effective Date ......................................................................................... 2-4 2.5 Units of Measure ..................................................................................... 2-4
3 RELIANCE ON OTHER EXPERTS (ITEM 3) .................................................... 3-1
4 PROPERTY DESCRIPTION AND LOCATION (ITEM 4) ................................... 4-1 4.1 Property Description and Location .......................................................... 4-1 4.2 Mineral Titles .......................................................................................... 4-3
4.2.1 Nature and Extent of Issuer’s Interest ....................................... 4-5 4.3 Royalties, Agreements and Encumbrances ............................................ 4-5
4.3.1 Alexco ........................................................................................ 4-5 4.3.2 Energold Royalty ....................................................................... 4-5 4.3.3 Franco-Nevada Royalty ............................................................. 4-5
4.4 Environmental Liabilities ......................................................................... 4-7 4.4.1 Environmental Liabilities from Past Mining Activities ................. 4-9 4.4.2 Current Environmental Liabilities ............................................... 4-9
4.5 Permits .................................................................................................. 4-10 4.5.1 Class IV Mining Land Use Permit –Exploration ....................... 4-10 4.5.2 Quartz Mining License ............................................................. 4-11 4.5.3 Type A Water Use Permit ........................................................ 4-11 4.5.4 Type B Water Use Permit ........................................................ 4-11
4.6 Other Significant Factors and Risks ...................................................... 4-11
5 ACCESSIBILITY, CLIMATE, LOCAL RESOURCES, INFRASTRUCTURE AND PHYSIOGRAPHY (ITEM 5) .......................................................................................... 5-1
5.1 Topography, Elevation and Vegetation ................................................... 5-1 5.2 Climate and Length of Operating Season ............................................... 5-1 5.3 Sufficiency of Surface Rights .................................................................. 5-2 5.4 Accessibility and Transportation to the Property ..................................... 5-2 5.5 Infrastructure Availability and Sources .................................................... 5-2
5.5.1 Power ........................................................................................ 5-5 5.5.2 Water ......................................................................................... 5-5 5.5.3 Personnel .................................................................................. 5-5
Americas Bullion Royalty Corp. ii Brewery Creek Project NI 43-101 Technical Report on Resources
Gustavson Associates, LLC October 23, 2013 Brewery Creek_NI 43-101 TR_Final_20131023.docx
5.5.4 Tailings Storage Areas .............................................................. 5-5 5.5.5 Waste Disposal Areas ............................................................... 5-6 5.5.6 Heap Leach Pad Areas ............................................................. 5-6 5.5.7 Processing Plant Sites ............................................................... 5-6
6 HISTORY (ITEM 6) ............................................................................................ 6-1 6.1 Prior Ownership ...................................................................................... 6-1 6.2 Past Exploration and Development Results ............................................ 6-2
6.2.1 Geologic Mapping ..................................................................... 6-2 6.2.2 Soil Sampling Surveys ............................................................... 6-2 6.2.3 Geophysical Surveys ................................................................. 6-5
6.3 Drilling ..................................................................................................... 6-5 6.3.1 Norex (1989) ............................................................................. 6-8 6.3.2 Loki / Viceroy (1990 – 1999) ...................................................... 6-8 6.3.3 Spectrum (2004) ........................................................................ 6-8 6.3.4 Alexco (2006) ............................................................................ 6-8
6.4 Historical Mineral Resource Estimates ................................................... 6-9 6.5 Historical Production ............................................................................. 6-10
7 GEOLOGICAL SETTING AND MINERALIZATION (ITEM 7) ............................ 7-1 7.1 Regional Geology ................................................................................... 7-1 7.2 Local and Property Geology ................................................................... 7-4 7.3 Stratigraphy ............................................................................................ 7-6
7.3.1 Intrusive Rocks .......................................................................... 7-8 7.4 Structural Geology .................................................................................. 7-9
7.4.1 Thrust Faults ............................................................................. 7-9 7.4.2 High-Angle Faults ...................................................................... 7-9
7.5 Significant Mineralized Zones ............................................................... 7-10 7.5.1 Kokanee .................................................................................. 7-13 7.5.2 Golden ..................................................................................... 7-13 7.5.3 Pacific ...................................................................................... 7-14 7.5.4 Blue ......................................................................................... 7-14 7.5.5 Lucky ....................................................................................... 7-14 7.5.6 Bohemian-Schooner ................................................................ 7-15 7.5.7 Canadian-Fosters .................................................................... 7-16 7.5.8 West and East Big Rock .......................................................... 7-16 7.5.9 Classic ..................................................................................... 7-17 7.5.10 Lone Star ................................................................................. 7-18 7.5.11 North Slope ............................................................................. 7-18 7.5.12 Sleeman .................................................................................. 7-19
8 DEPOSIT TYPES (ITEM 8) ............................................................................... 8-1 8.1 Mineral Deposit ....................................................................................... 8-1 8.2 Geological Model .................................................................................... 8-1
9 EXPLORATION (ITEM 9) .................................................................................. 9-1 9.1 Relevant Exploration Work ..................................................................... 9-1 9.2 Surveys and Investigations ..................................................................... 9-1
9.2.1 Magnetic Survey ........................................................................ 9-1 9.2.2 Soil Sampling Survey ................................................................ 9-3
Americas Bullion Royalty Corp. iii Brewery Creek Project NI 43-101 Technical Report on Resources
Gustavson Associates, LLC October 23, 2013 Brewery Creek_NI 43-101 TR_Final_20131023.docx
9.2.3 IP Survey ................................................................................... 9-6 9.3 Significant Results and Interpretation ..................................................... 9-6
10 DRILLING (ITEM 10) ....................................................................................... 10-1 10.1 Type and Extent .................................................................................... 10-3
10.1.1 Diamond Drilling (2009) ........................................................... 10-3 10.1.2 RC Drilling (2010) .................................................................... 10-3 10.1.3 Diamond Drilling (2010) ........................................................... 10-3 10.1.4 RC Drilling (2011) .................................................................... 10-3 10.1.5 Diamond Drilling (2011) ........................................................... 10-4 10.1.6 Sonic Drilling (2011) ................................................................ 10-4 10.1.7 Diamond Drilling (2012) ........................................................... 10-5
10.2 Summary of All Drilling Data ................................................................. 10-5 10.3 Interpretation and Relevant Results ...................................................... 10-7
11 SAMPLE PREPARATION, ANALYSIS AND SECURITY (ITEM 11) ............... 11-1 11.1 Sample Collection Methods .................................................................. 11-1
11.1.1 Historical Sampling by Norex (1989) ....................................... 11-1 11.1.2 Historical Sampling by Loki and Viceroy (1990 – 1999) .......... 11-1 11.1.3 Historical Sampling by Spectrum and Alexco (2004 and 2006) . 11-1 11.1.4 AMB’s Core Sampling (2009-2012) ......................................... 11-2 11.1.5 AMB’s RC Sampling (2010-2011) ........................................... 11-3 11.1.6 AMB’s RC Sampling (2012) ..................................................... 11-3
11.2 Sample Analytical Methods ................................................................... 11-4 11.2.1 Historical Analytical Methods by Norex (1989) ........................ 11-4 11.2.2 Historical Analytical Methods by Loki, and Viceroy (1990 – 1999) 11-4 11.2.3 Historical Analytical Methods by Spectrum (2004) .................. 11-4 11.2.4 Historical Analytical Methods by Alexco (2006) ....................... 11-4 11.2.5 AMB’s Analytical Methods (2009) ............................................ 11-4 11.2.6 AMB’s Analytical Methods (2010) ............................................ 11-5 11.2.7 AMB’s Analytical Methods (2011) ............................................ 11-5 11.2.8 AMB’s Analytical Methods (2012) ............................................ 11-5
11.3 AMB’s Security Measures ..................................................................... 11-6 11.4 QA/QC Samples ................................................................................... 11-6
11.4.1 Standards ................................................................................ 11-6 11.4.2 Blanks ...................................................................................... 11-7 11.4.3 Duplicates .............................................................................. 11-10
11.5 Opinion on Adequacy ......................................................................... 11-11
12 DATA VERIFICATION (ITEM 12) .................................................................... 12-1 12.1 Data Verification by EBA ....................................................................... 12-1
12.1.1 Verification of Historical Data .................................................. 12-1 12.1.2 Verification of Drilling Methods ................................................ 12-3 12.1.3 Verification of Collar Data ........................................................ 12-6 12.1.4 EBA Statement on Historical Data Verification ........................ 12-6 12.1.5 EBA Data Verification of AMB Data ......................................... 12-6
12.2 Data Verification by RMI ..................................................................... 12-10
Americas Bullion Royalty Corp. iv Brewery Creek Project NI 43-101 Technical Report on Resources
Gustavson Associates, LLC October 23, 2013 Brewery Creek_NI 43-101 TR_Final_20131023.docx
12.2.1 Verification of Drilling Methods by RMI .................................. 12-10 12.2.2 RMI’s Verification of AMB Drill Data ...................................... 12-17
12.3 Data Verification by Gustavson ........................................................... 12-19 12.3.1 Verification of Historical Data ................................................ 12-19 12.3.2 Verification of Drill Data ......................................................... 12-20 12.3.3 Gustavson Site Visit .............................................................. 12-20 12.3.4 Gustavson’s Statement on Data Adequacy ........................... 12-21
13 MINERAL PROCESSING AND METALLURGICAL TESTING (ITEM 13) ....... 13-1 13.1 MLI Job No. 3619 Current Metallurgical Testwork ................................ 13-1
13.1.1 Head Assay Analyses .............................................................. 13-2 13.1.2 Screen Analyses ..................................................................... 13-3 13.1.3 Bottle Roll Testing ................................................................... 13-4 13.1.4 Locked Cycle Column Leach Testing ...................................... 13-7 13.1.5 Prediction of Industrial Gold Production ................................ 13-16 13.1.6 Prediction of Industrial Reagent Consumption ...................... 13-18
13.2 MLI Job No. 3618 Reprocessing of Original Heap .............................. 13-20 13.2.1 Reprocessed Material Sample Preparation ........................... 13-20 13.2.2 Reprocessed Material Column Leach Tests .......................... 13-21
13.3 Industrial Gold Extraction and Reagent Consumption ........................ 13-23 13.4 Crusher Work Index and Abrasion ...................................................... 13-24 13.5 Historical Mine Pits ............................................................................. 13-24 13.6 Recommendations .............................................................................. 13-24
14 MINERAL RESOURCE ESTIMATE (ITEM 14) ................................................ 14-1 14.1 Kokanee, Golden, Pacific, Blue, and Lucky Deposits ........................... 14-3
14.1.1 Deposit Geology Pertinent to Resource Estimation ................. 14-3 14.1.2 Data Used for Estimation ......................................................... 14-4 14.1.3 Bulk Density ............................................................................ 14-5 14.1.4 Methodology ............................................................................ 14-5 14.1.5 Capping of Assays .................................................................. 14-7 14.1.6 Compositing ............................................................................ 14-8 14.1.7 Variography ............................................................................. 14-8 14.1.8 Estimation .............................................................................. 14-11
14.2 Bohemian, Schooner, Lower Fosters, West Big Rock, East Big Rock, Classic, and Lone Star Deposits .................................................................... 14-23
14.2.1 Deposit Geology Pertinent to Resource Estimation ............... 14-23 14.2.2 Data Used for Estimation ....................................................... 14-27 14.2.3 Bulk Density .......................................................................... 14-33 14.2.4 Methodology .......................................................................... 14-33 14.2.5 Capping of Assays ................................................................ 14-34 14.2.6 Compositing .......................................................................... 14-36 14.2.7 Estimation .............................................................................. 14-41
14.3 Historical Heap Leach Pad ................................................................. 14-57 14.4 North Slope and Sleeman Deposits .................................................... 14-59
14.4.1 Deposit Geology Pertinent to Resource Estimation ............... 14-60 14.4.2 Data Used for Estimation ....................................................... 14-61 14.4.3 Bulk Density .......................................................................... 14-62
Americas Bullion Royalty Corp. v Brewery Creek Project NI 43-101 Technical Report on Resources
Gustavson Associates, LLC October 23, 2013 Brewery Creek_NI 43-101 TR_Final_20131023.docx
14.4.4 Methodology .......................................................................... 14-63 14.4.5 Capping of Assays ................................................................ 14-64 14.4.6 Compositing .......................................................................... 14-65 14.4.7 Estimation .............................................................................. 14-65
14.5 Mineral Resource Classification .......................................................... 14-74 14.5.1 Kokanee, Golden, Pacific, Blue, and Lucky Deposits ............ 14-74 14.5.2 Bohemian, Schooner, Lower Fosters, West Big Rock, East Big Rock, Classic, and Lone Star Deposits ............................................... 14-75 14.5.3 Historical Heap Leach Pad .................................................... 14-75 14.5.4 North Slope and Sleeman Deposits ...................................... 14-75
14.6 Mineral Resource Estimation .............................................................. 14-76
15 ADJACENT PROPERTIES (ITEM 23) ............................................................. 15-1
16 OTHER RELEVANT DATA AND INFORMATION (ITEM 24) .......................... 16-1
17 INTERPRETATION AND CONCLUSIONS (ITEM 25) ..................................... 17-1 17.1 Results .................................................................................................. 17-1 17.2 Significant Risks and Uncertainties ....................................................... 17-2
17.2.1 Royalties .................................................................................. 17-2 17.2.2 Exploration .............................................................................. 17-2 17.2.3 Mineral Resource Estimate ..................................................... 17-2
18 RECOMMENDATIONS (ITEM 26) .................................................................. 18-1 18.1 Recommended Work Programs ............................................................ 18-1
18.1.2 Costs ....................................................................................... 18-2
19 REFERENCES ................................................................................................ 19-1
20 GLOSSARY ..................................................................................................... 20-1 20.1 Mineral Resources ................................................................................ 20-1 20.2 Mineral Reserves .................................................................................. 20-2 20.3 Glossary ................................................................................................ 20-2 20.4 Definition of Terms ................................................................................ 20-3
Americas Bullion Royalty Corp. vi Brewery Creek Project NI 43-101 Technical Report on Resources
Gustavson Associates, LLC October 23, 2013 Brewery Creek_NI 43-101 TR_Final_20131023.docx
Illustrations
FIGURE 4-1 SITE LOCATION MAP .................................................................................................................. 4-2 FIGURE 4-2 AREAS OF MINERAL CLAIMS AND MINING LEASES ........................................................................ 4-4 FIGURE 4-3 ROYALTY BOUNDARIES .............................................................................................................. 4-6 FIGURE 4-4 BREWERY CREEK PROJECT SITE PLAN....................................................................................... 4-8 FIGURE 5-1 GENERAL SITE LAYOUT ............................................................................................................. 5-3 FIGURE 5-2 EXISTING INFRASTRUCTURE ....................................................................................................... 5-4 FIGURE 6-1 SOIL SAMPLING RESULTS - GOLD ............................................................................................... 6-4 FIGURE 6-2 TRENCH AND DRILLHOLE LOCATIONS .......................................................................................... 6-7 FIGURE 7-1 REGIONAL GEOLOGY MAP ......................................................................................................... 7-2 FIGURE 7-2 REGIONAL GEOLOGY LEGEND .................................................................................................... 7-3 FIGURE 7-3 PROPERTY GEOLOGY MAP ........................................................................................................ 7-5 FIGURE 7-4 PROPERTY GEOLOGY LEGEND ................................................................................................... 7-6 FIGURE 7-5 SIGNIFICANT MINERALIZED ZONES ........................................................................................... 7-12 FIGURE 8-1 GEOLOGICAL MODEL SCHEMATIC ............................................................................................... 8-2 FIGURE 9-1 2011 MAGNETIC SURVEY RESULTS ............................................................................................ 9-2 FIGURE 9-2 SOIL SAMPLING SURVEY ............................................................................................................ 9-4 FIGURE 9-3 1988-2011 SOIL SAMPLING ....................................................................................................... 9-5 FIGURE 10-1 DRILLING LOCATIONS............................................................................................................. 10-2 FIGURE 11-1 BLANK GOLD ASSAY DATA, IF DETECTED 5-TIMES ABOVE RL ................................................. 11-8 FIGURE 11-2 BLANK GOLD ASSAY DATA, IF DETECTED 5-TIMES ABOVE RL .................................................. 11-9 FIGURE 11-3 DUPLICATE SAMPLE RESULTS .............................................................................................. 11-11 FIGURE 12-1 DECILE-DECILE PLOT OF AMB AND HISTORICAL CORE DRILLING DATA .................................... 12-3 FIGURE 12-2 DECILE-DECILE PLOT FOR RC AND CORE DRILLING DATA ....................................................... 12-4 FIGURE 12-3 DECILE-DECILE PLOT FOR RC AND CORE DRILLING DATA BY VICEROY AND LOKI ..................... 12-5 FIGURE 12-4 PLOT COMPARING DIAMOND CORE AND RC SAMPLES (BOHEMIAN DEPOSIT) ......................... 12-10 FIGURE 12-5 QQ PLOT COMPARING DIAMOND CORE AND RC SAMPLES (CLASSIC DEPOSIT) ...................... 12-11 FIGURE 12-6 QQ PLOT COMPARING AMB DIAMOND CORE AND VICEROY RC SAMPLES (BOHEMIAN DEPOSIT)
....................................................................................................................................................... 12-12 FIGURE 12-7 QQ PLOT COMPARING AMB DIAMOND CORE AND LOKI RC SAMPLES (FOSTERS DEPOSIT) .... 12-13 FIGURE 12-8 QQ PLOT COMPARING AMB DIAMOND CORE AND VICEROY RC SAMPLES ............................. 12-14 FIGURE 12-9 QQ PLOT COMPARING AMB RC AND VICEROY RC SAMPLES ................................................ 12-14 FIGURE 12-10 QQ PLOTS OF RC AND CORE GOLD GRADES ..................................................................... 12-16 FIGURE 13-1 BOTTLE ROLL HEAD ASSAYS ................................................................................................. 13-6 FIGURE 13-2 BOTTLE ROLL GOLD EXTRACTION RESULTS ........................................................................... 13-6 FIGURE 13-3 WEST BIG ROCK COLUMN LEACH GOLD EXTRACTION ........................................................... 13-13 FIGURE 13-4 EAST BIG ROCK COLUMN LEACH GOLD EXTRACTION ............................................................ 13-14 FIGURE 13-5 LOWER FOSTERS COLUMN LEACH GOLD EXTRACTION .......................................................... 13-14 FIGURE 13-6 BOHEMIAN COLUMN LEACH GOLD EXTRACTION .................................................................... 13-15 FIGURE 13-7 SCHOONER COLUMN LEACH GOLD EXTRACTION ................................................................... 13-15 FIGURE 14-1 LOCATION OF ALL RESOURCE AREA BLOCK MODELS .............................................................. 14-2 FIGURE 14-2 LUCKY AREA CONTACT PLOT ................................................................................................. 14-6 FIGURE 14-3 KOGD AREA RAW AU SAMPLE CUMULATIVE PROBABILITY PLOT ............................................. 14-8 FIGURE 14-4 PAIRWISE RELATIVE EXPERIMENTAL VARIOGRAMS WITHIN HORIZONTAL AND VERTICAL DIRECTIONS
FOR ALL SAMPLES WITHIN SDMN1 ................................................................................................... 14-10 FIGURE 14-5 PAIRWISE RELATIVE EXPERIMENTAL VARIOGRAMS WITHIN HORIZONTAL AND VERTICAL DIRECTIONS
FOR ALL SAMPLES WITHIN SDMN2 ................................................................................................... 14-10
Americas Bullion Royalty Corp. vii Brewery Creek Project NI 43-101 Technical Report on Resources
Gustavson Associates, LLC October 23, 2013 Brewery Creek_NI 43-101 TR_Final_20131023.docx
FIGURE 14-6 VALIDATION SECTION A-A’ OF KOKANEE BLOCK MODEL (SEE FIGURE 14-8 FOR LOCATION) ... 14-15 FIGURE 14-7 VALIDATION SECTION B-B’ OF GOLDEN BLOCK MODEL (SEE FIGURE 14-8 FOR LOCATION) ..... 14-16 FIGURE 14-8 DETAILED DRILL HOLE LOCATIONS OF KOGD AND LOCATION OF CROSS SECTIONS A-A’ AND B-B’
....................................................................................................................................................... 14-17 FIGURE 14-9 VALIDATION SECTION C-C’ OF PACIFIC BLOCK MODEL (SEE FIGURE 14-11 FOR LOCATION) ... 14-18 FIGURE 14-10 VALIDATION SECTION D-D’ OF BL BLOCK MODEL (SEE FIGURE 14-11 FOR LOCATION) ......... 14-19 FIGURE 14-11 DETAILED DRILL HOLE LOCATIONS OF PABL AND LOCATION OF CROSS SECTIONS C-C’ AND D-D’
....................................................................................................................................................... 14-20 FIGURE 14-12 VALIDATION SECTION E-E’ OF LUCKY BLOCK MODEL (SEE FIGURE 14-13 FOR LOCATION) .... 14-21 FIGURE 14-13 DETAILED DRILL HOLE LOCATIONS OF LU AND LOCATION OF CROSS SECTION E-E’ ............. 14-22 FIGURE 14-14 AU SOLUBILITY VS. LOGGED OXIDATION (BH INTRUSIVES) ................................................... 14-25 FIGURE 14-15 AU SOLUBILITY VS. LOGGED OXIDATION (SC INTRUSIVES) ................................................... 14-26 FIGURE 14-16 AU PROBABILITY PLOT – (BOHEMIAN INTRUSIVES) .............................................................. 14-35 FIGURE 14-17 AU GRADE CORRELOGRAM – (OXIDIZED BOHEMIAN INTRUSIVES) ........................................ 14-37 FIGURE 14-18 AU GRADE CORRELOGRAM – (OXIDIZED SCHOONER INTRUSIVES) ....................................... 14-37 FIGURE 14-19 AU GRADE CORRELOGRAM – (OXIDIZED LOWER FOSTERS INTRUSIVES) .............................. 14-38 FIGURE 14-20 AU GRADE CORRELOGRAM – (OXIDIZED WEST BIG ROCK INTRUSIVES) ............................... 14-38 FIGURE 14-21 0.2 G/T AU INDICATOR CORRELOGRAM – (OXIDIZED BOHEMIAN INTRUSIVES) ....................... 14-39 FIGURE 14-22 0.2 G/T AU INDICATOR CORRELOGRAM – (OXIDIZED SCHOONER INTRUSIVES) ...................... 14-39 FIGURE 14-23 0.2 G/T AU INDICATOR CORRELOGRAM – (OXIDIZED LOWER FOSTERS INTRUSIVES) ............. 14-40 FIGURE 14-24 0.2 G/T AU INDICATOR CORRELOGRAM – (OXIDIZED WEST BIG ROCK INTRUSIVES) .............. 14-40 FIGURE 14-25 BOHEMIAN BLOCK MODEL SECTION A-A’ (SEE FIGURE 14-27 FOR LOCATION) ..................... 14-43 FIGURE 14-26 SCHOONER BLOCK MODEL SECTION B-B’ (SEE FIGURE 14-27 FOR LOCATION) .................... 14-44 FIGURE 14-27 LOCATION OF BOHEMIAN (A-A’) AND SCHOONER (B-B’) CROSS SECTIONS ........................... 14-45 FIGURE 14-28 LOWER FOSTERS BLOCK MODEL SECTION C-C’ (SEE FIGURE 14-29 FOR LOCATION) ........... 14-46 FIGURE 14-29 LOCATION OF LOWER FOSTERS (C-C’) CROSS SECTION ..................................................... 14-47 FIGURE 14-30 WEST BIG ROCK BLOCK MODEL SECTION D-D’ (SEE FIGURE 14-32 FOR LOCATION) ............ 14-48 FIGURE 14-31 EAST BIG ROCK BLOCK MODEL SECTION E-E’ (SEE FIGURE 14-32 FOR LOCATION) ............. 14-49 FIGURE 14-32 LOCATION OF WEST BIG ROCK (D-D’) AND EAST BIG ROCK (E-E’) CROSS SECTIONS .......... 14-50 FIGURE 14-33 CLASSIC BLOCK MODEL SECTION F-F’ (SEE FIGURE 14-34 FOR LOCATION) ........................ 14-51 FIGURE 14-34 LOCATION OF CLASSIC (F-F’) CROSS SECTION ................................................................... 14-52 FIGURE 14-35 BOHEMIAN GOLD SWATH PLOT BY ELEVATION LEVELS ........................................................ 14-54 FIGURE 14-36 SCHOONER GOLD SWATH PLOT BY ELEVATION LEVELS....................................................... 14-54 FIGURE 14-37 LOWER FOSTERS GOLD SWATH PLOT BY ELEVATION LEVELS .............................................. 14-55 FIGURE 14-38 WEST BIG ROCK GOLD SWATH PLOT BY ELEVATION LEVELS ............................................... 14-55 FIGURE 14-39 EAST BIG ROCK GOLD SWATH PLOT BY ELEVATION LEVELS ................................................ 14-56 FIGURE 14-40 CLASSIC GOLD SWATH PLOT BY ELEVATION LEVELS ........................................................... 14-56 FIGURE 14-41 LONE STAR GOLD SWATH PLOT BY ELEVATION LEVELS ...................................................... 14-57 FIGURE 14-42 PLAN VIEW OF VICEROY HEAP LEACH PAD SHOWING SONIC HOLES .................................... 14-59 FIGURE 14-43 HEAP LEACH CROSS SECTION A-A’ .................................................................................... 14-59 FIGURE 14-44 SPECIFIC GRAVITY DETERMINATION BY ROCK TYPE ............................................................ 14-63 FIGURE 14-45 OBLIQUE SECTION OF NORTH SLOPE GOLD GRADE MODEL (40 METRE WIDE) ...................... 14-67 FIGURE 14-46 OBLIQUE SECTION OF SLEEMAN GOLD GRADE MODEL (25 METRE WIDE) ............................. 14-68 FIGURE 14-47 GRADE TONNAGE CURVE FOR THE NORTH SLOPE DEPOSIT ................................................ 14-70 FIGURE 14-48 GRADE TONNAGE CURVE FOR THE SLEEMAN DEPOSIT ........................................................ 14-70 FIGURE 14-49 LEGEND FOR GRADE-TONNAGE CURVE LINE TYPES .............................................................. 14-71 FIGURE 14-50 CUMULATIVE PROBABILITY PLOT FOR NORTH SLOPE DEPOSIT ............................................ 14-73 FIGURE 14-51 CUMULATIVE PROBABILITY PLOT FOR SLEEMAN DEPOSIT .................................................... 14-74
Americas Bullion Royalty Corp. viii Brewery Creek Project NI 43-101 Technical Report on Resources
Gustavson Associates, LLC October 23, 2013 Brewery Creek_NI 43-101 TR_Final_20131023.docx
List of Tables
TABLE 1-1 SUMMARY OF MINERAL RESOURCES ............................................................................................ 1-6 TABLE 6-1 SUMMARY OF HISTORICAL DRILLING ............................................................................................. 6-6 TABLE 6-2 HISTORICAL BREWERY CREEK INDICATED RESOURCES, 0.5 G/T AU CUTOFF .................................. 6-9 TABLE 6-3 HISTORICAL NORTH SLOPE INFERRED RESOURCE, 0.5 G/T AU CUTOFF ......................................... 6-9 TABLE 10-1 SUMMARY OF DRILLING CONDUCTED BY AMB .......................................................................... 10-1 TABLE 10-2 SUMMARY OF DRILLING FOR RESOURCE ESTIMATE AREAS ........................................................ 10-6 TABLE 10-3 DISTRIBUTION OF SIGNIFICANT HIGH-GRADE ............................................................................ 10-7 TABLE 11-1 HISTORICAL ANALYTICAL LABORATORIES ................................................................................. 11-1 TABLE 11-2 SUMMARY OF AVAILABLE STANDARD SAMPLE RESULTS ............................................................ 11-7 TABLE 11-3 SUMMARY OF BLANK SAMPLE RESULTS ................................................................................... 11-8 TABLE 11-4 SUMMARY OF DUPLICATE SAMPLES ....................................................................................... 11-10 TABLE 12-1 DRILLHOLES USED FOR HISTORICAL DATA VERIFICATION .......................................................... 12-2 TABLE 12-2 INDEPENDENT DRILL CORE SAMPLES COLLECTED BY EBA ....................................................... 12-8 TABLE 12-3 DRILL CORE SAMPLES EXAMINED BY RMI ............................................................................... 12-18 TABLE 12-4 DRILLHOLE ASSAY SAMPLES VERIFIED BY RMI ....................................................................... 12-18 TABLE 12-5 INDEPENDENT SAMPLE RESULTS ........................................................................................... 12-21 TABLE 13-1 DRILL CORE COMPOSITES GOLD HEAD ASSAY RESULTS .......................................................... 13-2 TABLE 13-2 DRILL CORE COMPOSITES HEAD SCREEN ANALYSES ................................................................ 13-3 TABLE 13-3 DRILL CORE COMPOSITES BOTTLE ROLL TESTS ....................................................................... 13-5 TABLE 13-4 DRILL CORE COMPOSITES COLUMN LEACH TESTS PHYSICAL CHARACTERISTICS ....................... 13-8 TABLE 13-5 DRILL CORE COMPOSITES COLUMN LEACH TESTS .................................................................. 13-11 TABLE 13-6 INDUSTRIAL HEAP LEACH DESIGN PARAMETERS ..................................................................... 13-16 TABLE 13-7 COLUMN LEACH TESTS AND MODELED GOLD EXTRACTION ..................................................... 13-17 TABLE 13-8 INDUSTRIAL HEAP LEACH METAL RECOVERY ESTIMATES ........................................................ 13-18 TABLE 13-9 WEIGHTED AVERAGE FOR LIME AND CEMENT FROM COLUMN TESTS ....................................... 13-18 TABLE 13-10 SODIUM CYANIDE CONSUMPTION ......................................................................................... 13-19 TABLE 13-11 REPROCESSED MATERIAL PHYSICAL CHARACTERISTICS ....................................................... 13-22 TABLE 13-12 REPROCESSED MATERIAL COLUMN LEACH TESTS ................................................................ 13-22 TABLE 13-13 REPROCESSING PARAMETERS ............................................................................................. 13-23 TABLE 13-14 WEIGHTED AVERAGE REAGENT CONSUMPTION .................................................................... 13-23 TABLE 13-15 WORK INDEX AND ABRASION RESULTS ................................................................................. 13-24 TABLE 14-1 SAMPLE GOLD ASSAY STATISTICS (GOLD GRADES REPORTED IN G/T) ........................................ 14-5 TABLE 14-2 BLOCK MODEL PARAMETERS ................................................................................................... 14-7 TABLE 14-3 GOLD CAP VALUES ................................................................................................................. 14-7 TABLE 14-4 COMPOSITE GOLD ASSAY STATISTICS (GOLD GRADES REPORTED IN G/T) ZONE ......................... 14-8 TABLE 14-5 BLOCK ESTIMATION PARAMETERS .......................................................................................... 14-12 TABLE 14-6 STRUCTURAL DOMAIN ESTIMATION PARAMETERS ................................................................... 14-13 TABLE 14-7 DESCRIPTIVE STATISTICS FOR GOLD IN COMPOSITE SAMPLES AND MODEL .............................. 14-14 TABLE 14-8 ID3 AND NN MODEL COMPARISON ......................................................................................... 14-23 TABLE 14-9 DRILLHOLE DATA .................................................................................................................. 14-27 TABLE 14-10 DRILLHOLE ASSAY STATISTICS – GOLD FIRE ASSAYS BY AREA ............................................. 14-28 TABLE 14-11 DRILLHOLE ASSAY STATISTICS – GOLD FIRE ASSAYS BY SAMPLE TYPE ................................. 14-29 TABLE 14-12 DRILLHOLE ASSAY STATISTICS – GOLD FIRE ASSAYS BY MAJOR ROCK TYPE ......................... 14-29 TABLE 14-13 DRILLHOLE ASSAY STATISTICS – GOLD FIRE ASSAYS BY LOGGED OXIDATION ........................ 14-30 TABLE 14-14 DRILLHOLE ASSAY STATISTICS – CYANIDE SOLUBLE GOLD ASSAYS BY AREA ........................ 14-31
Americas Bullion Royalty Corp. ix Brewery Creek Project NI 43-101 Technical Report on Resources
Gustavson Associates, LLC October 23, 2013 Brewery Creek_NI 43-101 TR_Final_20131023.docx
TABLE 14-15 DRILLHOLE ASSAY STATISTICS – GOLD PREG ROB ASSAYS BY AREA .................................... 14-32 TABLE 14-16 BULK DENSITY FOR BH, SC, FS, WB, AND EB MODELS ....................................................... 14-33 TABLE 14-17 BLOCK MODEL EXTENTS ..................................................................................................... 14-34 TABLE 14-18 GOLD GRADE CAPPING LIMITS BY AREA ............................................................................... 14-35 TABLE 14-19 GOLD GRADE ESTIMATION CONSTRAINTS ............................................................................. 14-41 TABLE 14-20 GOLD GRADE ESTIMATION PARAMETERS ............................................................................. 14-41 TABLE 14-21 GLOBAL BIAS CHECK – INVERSE DISTANCE VS. NEAREST NEIGHBOR GRADES ....................... 14-53 TABLE 14-22 DESCRIPTIONS FOR MAJOR ROCK TYPES USED IN GEOLOGIC MODEL .................................... 14-60 TABLE 14-23 DRILLHOLES BY DEPOSIT USED IN THE MINERAL RESOURCE ESTIMATE .................................. 14-62 TABLE 14-24 SPECIFIC GRAVITY VALUES USED FOR NORTH SLOPE AND SLEEMAN ..................................... 14-63 TABLE 14-25 BLOCK MODEL ORIGINS AND DIMENSIONS ............................................................................ 14-64 TABLE 14-26 HIGH GRADE CAPS APPLIED TO COMPOSITES ...................................................................... 14-65 TABLE 14-27 SUMMARY DESCRIPTIVE STATISTICS FOR RAW ASSAY AND 2M UNCAPPED COMPOSITE SAMPLES
....................................................................................................................................................... 14-65 TABLE 14-28 SUMMARY OF VARIOGRAM PARAMETERS .............................................................................. 14-66 TABLE 14-29 SUMMARY OF SEARCH ELLIPSE PARAMETERS ...................................................................... 14-66 TABLE 14-30 RESOURCE BLOCK MODEL COMPARATIVE STATISTICS .......................................................... 14-72 TABLE 14-31 OXIDE PIT PARAMETERS ..................................................................................................... 14-76 TABLE 14-32 SUMMARY OF TOTAL MINERAL RESOURCES ......................................................................... 14-78 TABLE 20-1 GLOSSARY .............................................................................................................................. 20-2 TABLE 20-2 ABBREVIATIONS ...................................................................................................................... 20-3
List of Appendices
APPENDIX A CERTIFICATE OF AUTHORS ...................................................................................... A-1 APPENDIX B CLAIMS LIST ........................................................................................................... B-1 APPENDIX C DRILLING DATA ...................................................................................................... C-1
Americas Bullion Royalty Corp. 1-1 Brewery Creek Project NI 43-101 Technical Report on Resources
Gustavson Associates, LLC October 23, 2013 Brewery Creek_NI 43-101 TR_Final_20131023.docx
1 Summary (Item 1) As commissioned by Americas Bullion Royalty Corp. (AMB)1, a publicly traded company on the Toronto Stock Exchange (TSX: AMB), Gustavson Associates, LLC, (Gustavson) has prepared a NI 43-101 Technical Report on Resources for the Brewery Creek Project in the Yukon Province of Canada.
In early 2013 Golden Predator Corp. changed its name to AMB and in the process bundled the Canada-based assets into Golden Predator Canada Corporation (Golden Predator) which exists as a wholly owned subsidiary of Americas Bullion Royalty Corp (AMB).
The Brewery Creek Project was a producing heap leach gold mining operation as Viceroy Resource Corporation mined seven near-surface oxide deposits from 1996 through 2002, after which the mine shut down primarily due to low gold prices. In 2009, AMB optioned the Brewery Creek property from Alexco Resource Corporation. In February 2012 AMB signed a purchase agreement with Alexco to acquire a 100% interest in the project and all outstanding quartz claims subject to a 2% net smelter return royalty in favor of Alexco. In September of 2012 the purchase was completed and AMB became the 100% owner of the Brewery Creek project.
In June 2012, AMB published a NI 43-101 Technical Report on Resources, which was then Amended and Reissued on January 17th, 2013. The purpose of this Technical Report on Resources is to update the January 17th, 2013 resource estimate, to include new data for existing resource areas and additional exploration targets.
This report was prepared to comply with public reporting obligations for Canadian National Instrument 43-101 Standards of Disclosure for Mineral Projects (NI 43-101), NI 43-101 Form F1, and Canadian Institute of Mining, Metallurgy and Petroleum (CIM) “Best Practices and Reporting Guidelines”, following a press release for updated resources dated September 15, 2013. The mineral resource estimate and interpretations and conclusions reported here are based on technical data available prior to the effective date of this report, June 1, 2013.
1.1 Property Description and Location
The Brewery Creek property consists of an area of 181 square kilometres (km2), located in northwestern Yukon, approximately 55 kilometres (km) due east of Dawson City. The
1 Within this Technical Report, Americas Bullion Royalty Corp. is synonymous with Golden Predator Canada Corporation, a wholly-owned subsidiary of Americas Bullion Royalty Corp., and Golden Predator, the erstwhile name of Americas Bullion Royalty Corp.
Americas Bullion Royalty Corp. 1-2 Brewery Creek Project NI 43-101 Technical Report on Resources
Gustavson Associates, LLC October 23, 2013 Brewery Creek_NI 43-101 TR_Final_20131023.docx
property is centered at Latitude 64.041887° N and Longitude 138.206389° W or UTM NAD83 Zone 7N at 636,401 metres (m) E; 7,104,673 m N.
The Property is located in the Ogilvie Mountains immediately north of the Klondike River and west of Lee Creek. Elevations on the Property range from approximately 450 metres (1,500 feet) to 1,200 metres (4,000 feet). Relief on the property varies from moderately flat terraces or benches in the southwest corner of the property to moderately steep for the majority of the Property. The area was not glaciated during the last glaciation period resulting in relatively steep V-shaped valleys incised by the creeks that cross the property. Natural bedrock exposure is generally less than 1% and is restricted to the higher elevation ridges within the Property area.
Located at approximately 64° north latitude, the Property is subject to a subarctic climate with average temperatures ranging from 15°C (60°F) in July to -26°C (-16°F) in January with temperatures commonly reaching above 30°C (86°F) in the summer and below -40°C (-40°F) in the winter. Average annual precipitation at Brewery Creek is approximately 325 mm and there are annually approximately 110 frost free days.
AMB’s field operations generally happen from March through October of each calendar year, depending on weather. This is consistent with the duration of past mining operations.
1.2 Ownership
AMB holds a 100% interest in all 1,075 quartz claims, 93 of which have been converted to mining leases. The area where AMB holds the surface rights is the same as the claim areas. Gustavson notes that the surface rights are sufficient for foreseeable exploration activities, and are expected to be sufficient for mining operations.
1.3 Geology and Mineralization
The Brewery Creek property is located within the foothills of the Ogilvie Mountains along the northeastern boundary of the Tintina Trench. The Tintina Trench forms a 15-kilometre wide erosional valley that delineates the northwest-striking Mesozoic to Tertiary Tintina Fault. In the vicinity of the Brewery Creek Project, the Tintina Fault juxtaposes Selwyn Basin stratigraphy on the northeast and the accreted terranes of the Canadian Cordillera on the southwest. Selwyn Basin stratigraphy is composed of Late Proterozoic and Paleozoic marginal basin deposits of ancient North America. The Cordillera rocks are dominantly composed of Klondike Schist and other allied rocks of the Yukon-Tanana Terrain, an allochthonous terrain of primarily volcanic arc rocks that evolved in mid to late Paleozoic time.
Americas Bullion Royalty Corp. 1-3 Brewery Creek Project NI 43-101 Technical Report on Resources
Gustavson Associates, LLC October 23, 2013 Brewery Creek_NI 43-101 TR_Final_20131023.docx
The Brewery Creek Project is in Selwyn Basin rocks northeast of the Tintina Trench. The Selwyn Basin stratigraphy consists of late Proterozoic to Paleozoic marginal basinal and platformal clastic and pelitic lower greenschist facies metasedimentary rocks. The provenance of the protoliths was the North American Craton. The stratigraphy includes thick sequences of Lower Proterozoic Hyland Group, Cambrian-Ordovician Road River Group and Devonian-Mississippian Earn Group sedimentary rocks.
The Selwyn Basin rocks have been polydeformed and imbricated by the Jura-Cretaceous Dawson, Tombstone and Robert Service Thrusts. The Hyland, Road River and Earn Group rocks are cut by Cretaceous intrusives (Tombstone Plutonic Suite) that form a northwest-trending belt of widely spaced intermediate to siliceous stocks and plutons that closely parallels the Tintina Trench. In the Brewery Creek area, these igneous rocks are monzonites and quartz monzonites that primarily intruded along the thrust faults and formed sill-like geometries. The majority of the gold mineralization at Brewery Creek is hosted within or adjacent to these felsic intrusive rocks.
Gold is associated with carbonate/clay, quartz and pyrite/arsenopyrite alteration of monzonite/quartz monzonite intrusive rocks and adjacent siliciclastic rocks. Resources are reported for fourteen deposits and also for the former heap leach pile. The fourteen deposits are Pacific, Blue, Lower Fosters, Kokanee, Golden, Lucky, Big Rock West, Big Rock East, Bohemian, Schooner, North Slope, Sleeman, Classic and Lone Star.
1.4 Exploration Status
AMB undertook an airborne magnetic survey, induced polarization (IP) survey, and soil sampling in 2011 and 2012. AMB utilized exploration results to guide drilling activities.
AMB has conducted exploration drilling at the Brewery Creek Project area since 2009. A total of 2,608 drillholes consisting of 198,829 metres, have been completed in the Bohemian, Schooner, Fosters, West and East Big Rock, Classic, Moosehead, Lone Star, Kokanee, Golden, Lucky, Pacific, Blue, North Slope, and Sleeman deposits. Drilling has been completed using reverse circulation and core drilling methods. Additional sonic drilling was completed in the former heap leach pile. Review of the drilling data shows that adequate data exist to support a resource estimate for these deposits.
1.5 Development and Operations
Loki / Viceroy constructed the mine 1995-1996 and began operation in 1996. From 1996 through 2002, approximately 280,000 ounces of gold were produced from seven near-surface oxide deposits (i.e., Pacific, Blue, Moosehead, Upper Fosters, Canadian, Lucky, Golden), which are located along strike within the historically termed “Brewery
Americas Bullion Royalty Corp. 1-4 Brewery Creek Project NI 43-101 Technical Report on Resources
Gustavson Associates, LLC October 23, 2013 Brewery Creek_NI 43-101 TR_Final_20131023.docx
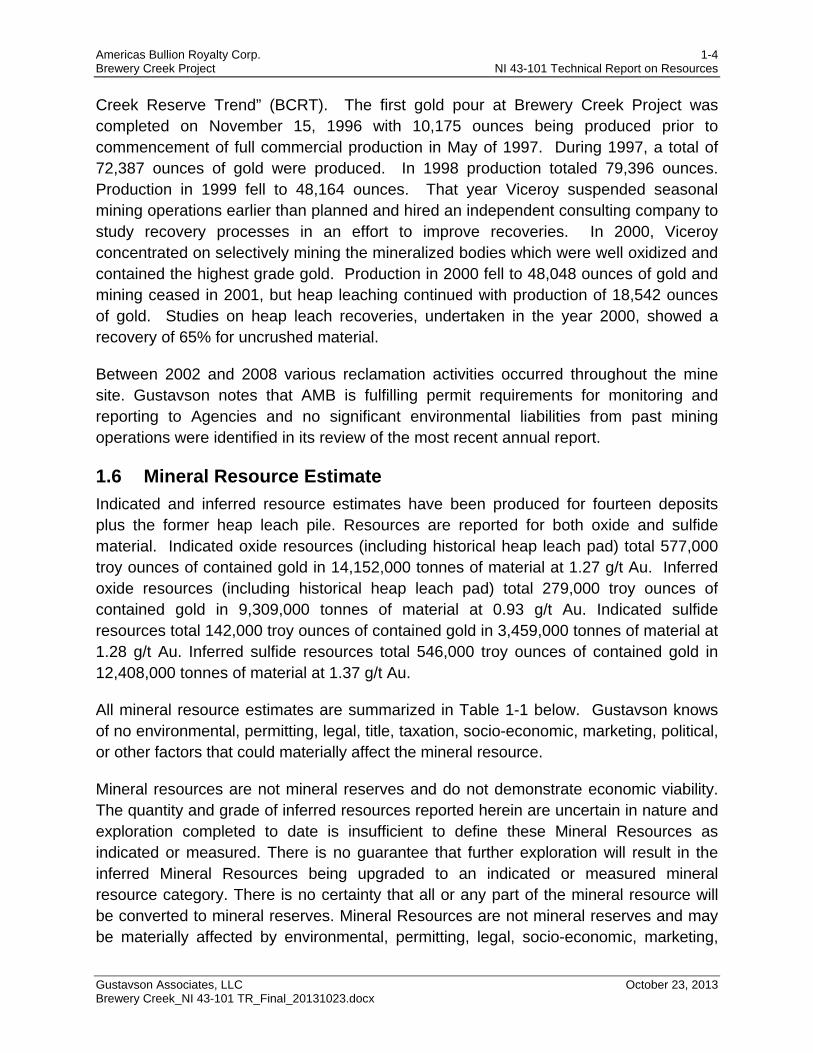
Creek Reserve Trend” (BCRT). The first gold pour at Brewery Creek Project was completed on November 15, 1996 with 10,175 ounces being produced prior to commencement of full commercial production in May of 1997. During 1997, a total of 72,387 ounces of gold were produced. In 1998 production totaled 79,396 ounces. Production in 1999 fell to 48,164 ounces. That year Viceroy suspended seasonal mining operations earlier than planned and hired an independent consulting company to study recovery processes in an effort to improve recoveries. In 2000, Viceroy concentrated on selectively mining the mineralized bodies which were well oxidized and contained the highest grade gold. Production in 2000 fell to 48,048 ounces of gold and mining ceased in 2001, but heap leaching continued with production of 18,542 ounces of gold. Studies on heap leach recoveries, undertaken in the year 2000, showed a recovery of 65% for uncrushed material.
Between 2002 and 2008 various reclamation activities occurred throughout the mine site. Gustavson notes that AMB is fulfilling permit requirements for monitoring and reporting to Agencies and no significant environmental liabilities from past mining operations were identified in its review of the most recent annual report.
1.6 Mineral Resource Estimate
Indicated and inferred resource estimates have been produced for fourteen deposits plus the former heap leach pile. Resources are reported for both oxide and sulfide material. Indicated oxide resources (including historical heap leach pad) total 577,000 troy ounces of contained gold in 14,152,000 tonnes of material at 1.27 g/t Au. Inferred oxide resources (including historical heap leach pad) total 279,000 troy ounces of contained gold in 9,309,000 tonnes of material at 0.93 g/t Au. Indicated sulfide resources total 142,000 troy ounces of contained gold in 3,459,000 tonnes of material at 1.28 g/t Au. Inferred sulfide resources total 546,000 troy ounces of contained gold in 12,408,000 tonnes of material at 1.37 g/t Au.
All mineral resource estimates are summarized in Table 1-1 below. Gustavson knows of no environmental, permitting, legal, title, taxation, socio-economic, marketing, political, or other factors that could materially affect the mineral resource.
Mineral resources are not mineral reserves and do not demonstrate economic viability. The quantity and grade of inferred resources reported herein are uncertain in nature and exploration completed to date is insufficient to define these Mineral Resources as indicated or measured. There is no guarantee that further exploration will result in the inferred Mineral Resources being upgraded to an indicated or measured mineral resource category. There is no certainty that all or any part of the mineral resource will be converted to mineral reserves. Mineral Resources are not mineral reserves and may be materially affected by environmental, permitting, legal, socio-economic, marketing,
Americas Bullion Royalty Corp. 1-5 Brewery Creek Project NI 43-101 Technical Report on Resources
Gustavson Associates, LLC October 23, 2013 Brewery Creek_NI 43-101 TR_Final_20131023.docx
political, or other factors. Quantity and grade are estimates and are rounded to reflect the fact that the resource estimate is an approximation. The effective date of this Mineral Resources Report is June 1st, 2013.

Americas Bullion Royalty Corp. 1-6 Brewery Creek Project NI 43-101 Technical Report on Resources
Gustavson Associates, LLC October 23, 2013 Brewery Creek_NI 43-101 TR_Final_20131023.docx
Table 1-1 Summary of Mineral Resources
Oxide Mineral Resources
Resource Area Au
Cutoff (g/t)
Indicated Oxide Resources
Inferred Oxide Resources Constrained
by $1250 LG Pit?
QP Responsible
Estimated with Capped Composites? Tonnes
(000) Au (g/t)
Au Ozs (000)
Tonnes (000)
Au (g/t)
Au Ozs (000)
Kokanee 0.54 1,201 1.19 46 279 1.19 11 Yes Don Hulse Yes
Golden 0.54 1,070 1.38 47 247 1.25 10 Yes Don Hulse Yes
Pacific 0.53 373 1.01 12 131 0.91 4 Yes Don Hulse Yes
Blue 0.53 250 1.29 10 29 0.98 1 Yes Don Hulse Yes
Lucky 0.54 2,394 1.36 105 236 1.27 10 Yes Don Hulse Yes
Bohemian 0.49 1,491 1.31 63 134 1.49 6 Yes Mike Lechner Yes
Schooner 0.51 1,108 1.99 71 243 2.65 21 Yes Mike Lechner Yes
Lower Fosters 0.51 1,090 1.61 56 492 1.52 24 Yes Mike Lechner Yes
West Big Rock 0.45 722 1.27 29 38 0.75 1 Yes Mike Lechner Yes
East Big Rock 0.48 596 1.10 21 21 0.87 1 Yes Mike Lechner Yes
Classic 0.54 - - - 3,711 0.81 97 No Mike Lechner Yes
Lone Star 0.54 - - - 1,522 0.88 43 No Mike Lechner Yes
North Slope 0.50 756 1.15 28 412 1.05 14 No James Barr Yes
Sleeman 0.50 124 1.14 5 132 0.84 4 No James Barr Yes
Historical Viceroy Pad 0.30 2,977 0.88 84 1,682 0.60 32 No Mike Lechner No
Total 14,152 1.27 577 9,309 0.93 279

Americas Bullion Royalty Corp. 1-7 Brewery Creek Project NI 43-101 Technical Report on Resources
Gustavson Associates, LLC October 23, 2013 Brewery Creek_NI 43-101 TR_Final_20131023.docx
Table 1-1 (cont.)
Sulfide Mineral Resources
Resource Area Au
Cutoff (g/t)
Indicated Sulfide Resources
Inferred Sulfide Resources Constrained
by $1250 LG Pit?
QP Responsible
Estimated with Capped Composites? Tonnes
(000) Au (g/t)
Au Ozs (000)
Tonnes (000)
Au (g/t)
Au Ozs (000)
Kokanee 0.70 - - - 1,547 1.33 66 No Don Hulse Yes
Golden 0.70 - - - 649 1.20 25 No Don Hulse Yes
Pacific 0.70 - - - 707 1.45 33 No Don Hulse Yes
Blue 0.70 - - - 1,358 1.31 57 No Don Hulse Yes
Lucky 0.70 - - - 1,783 1.36 78 No Don Hulse Yes
Bohemian 0.70 - - - 973 1.58 50 No Mike Lechner Yes
Schooner 0.70 - - - 313 1.42 14 No Mike Lechner Yes
Lower Fosters 0.70 - - - 883 1.45 41 No Mike Lechner Yes
West Big Rock 0.70 - - - 381 1.28 16 No Mike Lechner Yes
East Big Rock 0.70 - - - 170 1.00 5 No Mike Lechner Yes
Classic 0.70 - - - - - - No Mike Lechner Yes
Lone Star 0.70 - - - - - - No Mike Lechner Yes
North Slope 0.70 2,122 1.26 86 2,686 1.36 118 No James Barr Yes
Sleeman 0.70 1,337 1.30 56 958 1.40 43 No James Barr Yes
Total 3,459 1.28 142 12,408 1.37 546
Americas Bullion Royalty Corp. 1-8 Brewery Creek Project NI 43-101 Technical Report on Resources
Gustavson Associates, LLC October 23, 2013 Brewery Creek_NI 43-101 TR_Final_20131023.docx
1.7 Conclusions and Recommendations
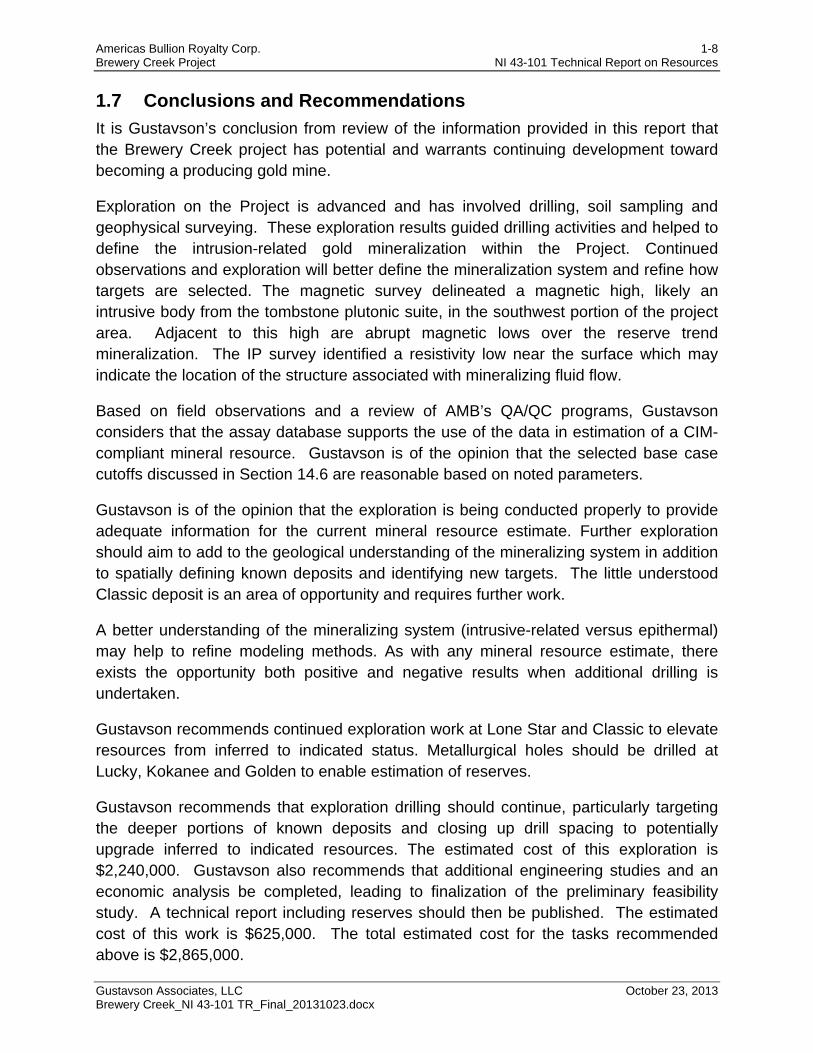
It is Gustavson’s conclusion from review of the information provided in this report that the Brewery Creek project has potential and warrants continuing development toward becoming a producing gold mine.
Exploration on the Project is advanced and has involved drilling, soil sampling and geophysical surveying. These exploration results guided drilling activities and helped to define the intrusion-related gold mineralization within the Project. Continued observations and exploration will better define the mineralization system and refine how targets are selected. The magnetic survey delineated a magnetic high, likely an intrusive body from the tombstone plutonic suite, in the southwest portion of the project area. Adjacent to this high are abrupt magnetic lows over the reserve trend mineralization. The IP survey identified a resistivity low near the surface which may indicate the location of the structure associated with mineralizing fluid flow.
Based on field observations and a review of AMB’s QA/QC programs, Gustavson considers that the assay database supports the use of the data in estimation of a CIM-compliant mineral resource. Gustavson is of the opinion that the selected base case cutoffs discussed in Section 14.6 are reasonable based on noted parameters.
Gustavson is of the opinion that the exploration is being conducted properly to provide adequate information for the current mineral resource estimate. Further exploration should aim to add to the geological understanding of the mineralizing system in addition to spatially defining known deposits and identifying new targets. The little understood Classic deposit is an area of opportunity and requires further work.
A better understanding of the mineralizing system (intrusive-related versus epithermal) may help to refine modeling methods. As with any mineral resource estimate, there exists the opportunity both positive and negative results when additional drilling is undertaken.
Gustavson recommends continued exploration work at Lone Star and Classic to elevate resources from inferred to indicated status. Metallurgical holes should be drilled at Lucky, Kokanee and Golden to enable estimation of reserves.
Gustavson recommends that exploration drilling should continue, particularly targeting the deeper portions of known deposits and closing up drill spacing to potentially upgrade inferred to indicated resources. The estimated cost of this exploration is $2,240,000. Gustavson also recommends that additional engineering studies and an economic analysis be completed, leading to finalization of the preliminary feasibility study. A technical report including reserves should then be published. The estimated cost of this work is $625,000. The total estimated cost for the tasks recommended above is $2,865,000.
Americas Bullion Royalty Corp. 2-1 Brewery Creek Project NI 43-101 Technical Report on Resources
Gustavson Associates, LLC October 23, 2013 Brewery Creek_NI 43-101 TR_Final_20131023.docx
2 Introduction (Item 2)
2.1 Terms of Reference and Purpose of the Report
As commissioned by Americas Bullion Royalty Corp. (AMB)2, a publicly traded company on the Toronto Stock Exchange (TSX: AMB), Gustavson Associates, LLC, (Gustavson) has prepared an NI 43-101 Technical Report on Resources for the Brewery Creek Project in the Yukon Province of Canada.
The Brewery Creek Project was a producing heap leach gold mining operation as Viceroy Resource Corporation mined seven near-surface oxide deposits from 1996 through 2002, after which the mine shut down primarily due to low gold prices. In 2009, AMB optioned the Brewery Creek property from Alexco Resource Corporation. In February 2012 AMB signed a purchase agreement with Alexco to acquire a 100% interest in the project and all outstanding quartz claims subject to a 2% net smelter return royalty in favor of Alexco. In September of 2012 the purchase was completed and AMB became the 100% owner of the Brewery Creek project.
In June 2012, AMB published an NI 43-101 Technical Report on Resources, which was then Amended and Reissued on January 17th, 2013 to fix clerical errors and table references. The purpose of this Technical Report on Resources is to update the January 17th, 2013 resource estimate to include data from additional exploration targets.
This report was prepared to comply with public reporting obligations for Canadian National Instrument 43-101 Standards of Disclosure for Mineral Projects (NI 43-101), NI 43-101 Form F1, and Canadian Institute of Mining, Metallurgy and Petroleum (CIM) “Best Practices and Reporting Guidelines” following a press release for updated resources dated September 15, 2013. The mineral resource estimate and interpretations and conclusions reported here are based on technical data available prior to the effective date of this report, June 1, 2013.
Items 15 through 22 of Form 43-101F1 (Mineral Reserve Estimates, Mining Methods, Recovery Methods, Project Infrastructure, Market Studies and Contracts, Environmental Studies, Permitting and Social or Community Impact, Capital and Operating Costs, and Economic Analysis, respectively) are not required for a Technical Report on Resources and are not included in this report.
2.2 Qualifications of Consultants
The Qualified Persons (QP), as defined by NI 43-101, responsible for this report are: 2 Within this Technical Report, Americas Bullion Royalty Corp. is synonymous with Golden Predator Canada Corporation, a wholly-owned subsidiary of Americas Bullion Royalty Corp., and Golden Predator, the erstwhile name of Americas Bullion Royalty Corp.
Americas Bullion Royalty Corp. 2-2 Brewery Creek Project NI 43-101 Technical Report on Resources
Gustavson Associates, LLC October 23, 2013 Brewery Creek_NI 43-101 TR_Final_20131023.docx
Mr. Donald Hulse, P.E., SME-RM, Vice President, Gustavson
Dr. M. Claiborne Newton, III, Ph.D., SME-RM, Chief Geologist, Gustavson
Mr. Michael J. Lechner P.Geo.., President, Resource Modeling Inc. (RMI)
Mr. P. James F. Barr, P. Geo., Senior Geologist, EBA Engineering Consultants Ltd. (EBA)
Mr. Joe Keane, P.E., Keane Mineral Engineering LLC
Dr. Newton is specifically responsible for Sections 1 through 12.3, 15 through 20, the overall content of the report, and served as the project manager. Mr. Hulse is responsible for Sections 14.1, 14.5, and 14.6. Mr. Lechner is responsible for Sections 12.2, 14.2, 14.3, 14.5, and 14.6. Mr. Barr is responsible for Sections 12.1, 14.4, 14.5, and 14.6. Mr. Keane is responsible for Section 13.
2.2.1 Details of Inspection
Dr. Newton visited the site on June 4 and 5, 2013. During the site visit, he examined rocks in the Lucky, Golden, Kokanee and Pacific pits, took structural measurements, collected three independent grab samples for gold assay, examined and photographed drill sites and examined drill core and cuttings, referencing mineralized intervals to corresponding intervals in the drillhole database.
Mr. Lechner, RMI geologist and Independent QP, conducted a site visit between October 16 and October 18 2012. The purpose of the visit was to become familiar with the site layout and facilities, review core drilling procedures, review core logging/sample handling procedures, examine drill core and review electronic data collection practices. Mr. Lechner was accompanied by AMB Senior Geologist Bruce Otto and Project Geologist Tyler Bourne.
While on site, Mr. Lechner examined two diamond drill rigs that were operating in the Classic-Lone Star areas. The first drill rig that was visited was an A5 drill operated by Matrix Diamond Drilling Inc. (drillhole BC12-580).The hole was approximately 250 metres deep at the time of the visit. The drill site was clean and the core was correctly handled at the site. The second drill rig that was visited was operated by Kluane Drilling Ltd. (drillhole BC12-576). Both drill rigs appeared to be delivering nearly 100% recovery. Both drills were using NQ tools with 10-foot-long core barrels.
Portions of three recent and two older diamond drillholes were examined by Mr. Lechner while on site. Selected drillhole intervals from specified holes were compared against the original drill logs. Table 12-3 lists the holes and intervals that Mr. Lechner examined.
Americas Bullion Royalty Corp. 2-3 Brewery Creek Project NI 43-101 Technical Report on Resources
Gustavson Associates, LLC October 23, 2013 Brewery Creek_NI 43-101 TR_Final_20131023.docx
Mr. Barr conducted a site visit on March 19-21 and May 30-31, 2012: during this time, he reviewed core logging, sample handling procedures, reviewed drill core and collected core samples for independent analysis.
2.3 Sources of Information
The information, opinions, conclusions, and estimates presented in this report are based on the following:
Information and technical data provided by AMB;
Observations made by Qualified Persons on site;
Review and assessment of previous investigations;
Assumptions, conditions, and qualifications as set forth in the report; and
Review and assessment of data, reports, and conclusions from other consulting organizations and previous property owners.
Gustavson sourced information from referenced documents as cited in the text and those summarized in Section 20, References, of this report.
In 2012 the Company commissioned a Prefeasibility Study (PFS), which is still in progress, and an updated resource estimate on the Brewery Creek Project. The PFS has investigated a mine plan based on an anticipated resource size; however, due to a larger than anticipated oxide resource, the mine plan requires further engineering on pit designs, waste dump sites and scheduling to accommodate an enhanced operation. The Company intends to complete a mine plan and resulting PFS and publish a subsequent NI 43-101 Technical Report once engineering studies have been finalized. Gustavson notes that these mining studies were performed prior to the completion of resource estimates for 5 deposits (Kokanee-Golden, Pacific-Blue, and Lucky) that are included in this Report, and as such, the mining assumptions used for design in the PFS may need to be updated. Gustavson notes that mining production and infrastructure should be evaluated following completion of the project resource estimate.
For completeness, the studies that have been used through the Effective Date of this Report are listed below.
2012 Geotechnical Site Investigation & Geotechnical Pre-Feasibility Study for Six Proposed Pits, by EBA, dated December 2012.
Capital Cost Estimate, Brewery Creek Prefeasibility Study Owner Operated Crushing, by K D Engineering, dated March 2013.
Conceptual Study: Connection to Yukon Energy Corporation Network, by BBA, dated November 19, 2012.

Americas Bullion Royalty Corp. 2-4 Brewery Creek Project NI 43-101 Technical Report on Resources
Gustavson Associates, LLC October 23, 2013 Brewery Creek_NI 43-101 TR_Final_20131023.docx
Design Criteria, Brewery Creek – Prefeasibility Study, by SGS Metcon / KD Engineering, dated April 8, 2013
Design Memo regarding Lower Foster Pit, Small Ephemeral Drainage Tributary Diversion – Conceptual Design, by EBA, dated December 20, 2012.
Electrical Load Study, by KD Engineering, dated February 6, 2013
Equipment List, by K D Engineering, dated January 2013.
Heap Leach Facility Pre-Feasibility Design – Cells 8, 9, & 10, by Tetra Tech, dated April 2013.
Lower Foster Pit, Small Ephemeral Drainage Tributary Diversion – Conceptual Design, by EBA, dated December 20, 2012
Memorandum regarding Brewery Creek Reprocessing Existing Heap Leach, by K D Engineering, dated November 5, 2012.
Quote for Golden Predator to Provide a Complete Contracted Crushing, Screening, and Conveying Operation System at Brewery Creek Mine, by Nuway Crushing Ltd, dated January 12, 2013.
Operating Cost Estimate, by K D Engineering, dated April 2013.
Technical Memorandum regarding Brewery Creek Preliminary Heap Leach Facility Water Balance, by Tetra Tech, dated January 14, 2013.
Technical Memorandum regarding Brewery Creek Mine Haul Roads, by EBA, dated January 2, 2013
Waste Rock Deposition Sites, Preliminary Options and Volume Estimates, by Tetra Tech, dated December 2012.
2.4 Effective Date
This report was completed based upon information available at the effective date of this report, June 1, 2013.
2.5 Units of Measure
Unless stated otherwise, all measurements reported here are in metric units, tonnes are metric, and currencies are expressed in constant 2Q 2013 US dollars. Precious metal content is reported in gram per metal per metric tonne (g/t).
Americas Bullion Royalty Corp. 3-1 Brewery Creek Project NI 43-101 Technical Report on Resources
Gustavson Associates, LLC October 23, 2013 Brewery Creek_NI 43-101 TR_Final_20131023.docx
3 Reliance on Other Experts (Item 3) The Qualified Persons relied in good faith on information provided by AMB regarding mineral tenure and royalty information (Sections 4.2 and 4.3). The Qualified Persons have not independently verified status of the property ownership or mineral tenure, which was based on information provided to Gustavson from AMB.
Americas Bullion Royalty Corp. 4-1 Brewery Creek Project NI 43-101 Technical Report on Resources
Gustavson Associates, LLC October 23, 2013 Brewery Creek_NI 43-101 TR_Final_20131023.docx
4 Property Description and Location (Item 4)
4.1 Property Description and Location
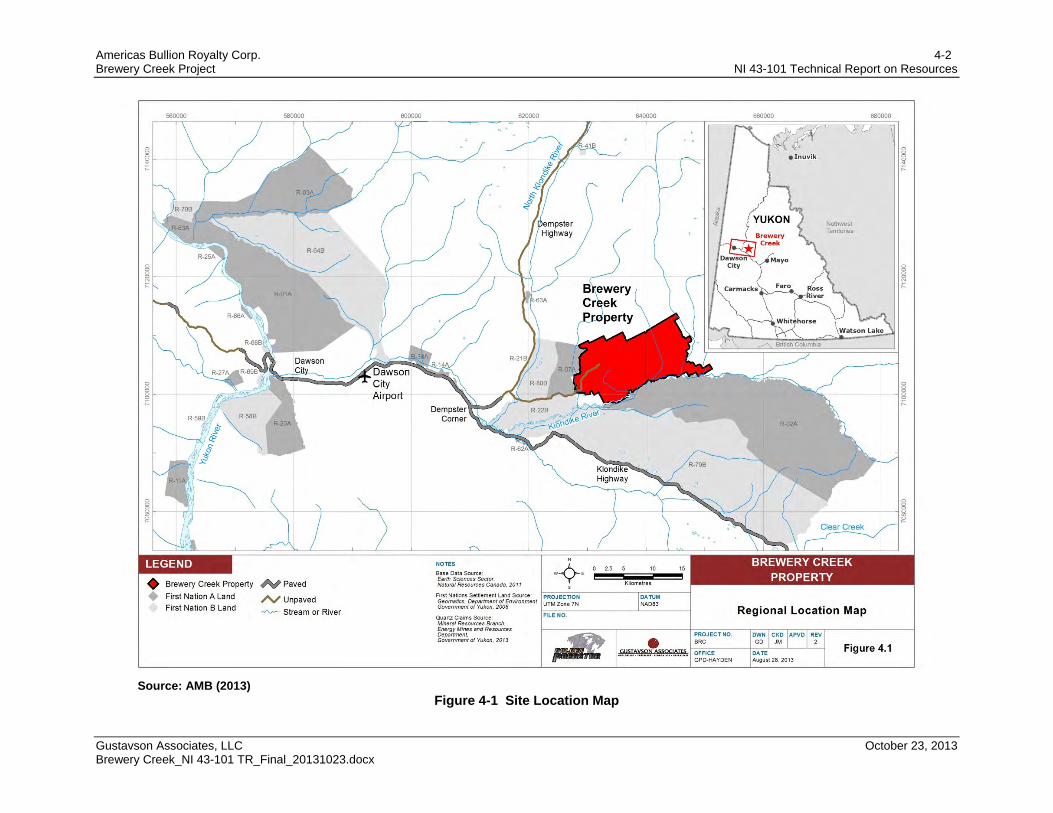
The Brewery Creek Project consists of an area of 181 square kilometres (km2), located in the northwestern Yukon, approximately 55 kilometres (km) due east of Dawson City (Figure 4-1). The property is centered at Latitude 64.041887° N and Longitude 138.206389° W or UTM NAD83 Zone 7N at 636,401 metres (m) E; 7,104,673 m N.
Americas Bullion Royalty Corp. 4-2 Brewery Creek Project NI 43-101 Technical Report on Resources
Gustavson Associates, LLC October 23, 2013 Brewery Creek_NI 43-101 TR_Final_20131023.docx
Source: AMB (2013)
Figure 4-1 Site Location Map
Americas Bullion Royalty Corp. 4-3 Brewery Creek Project NI 43-101 Technical Report on Resources
Gustavson Associates, LLC October 23, 2013 Brewery Creek_NI 43-101 TR_Final_20131023.docx
4.2 Mineral Titles
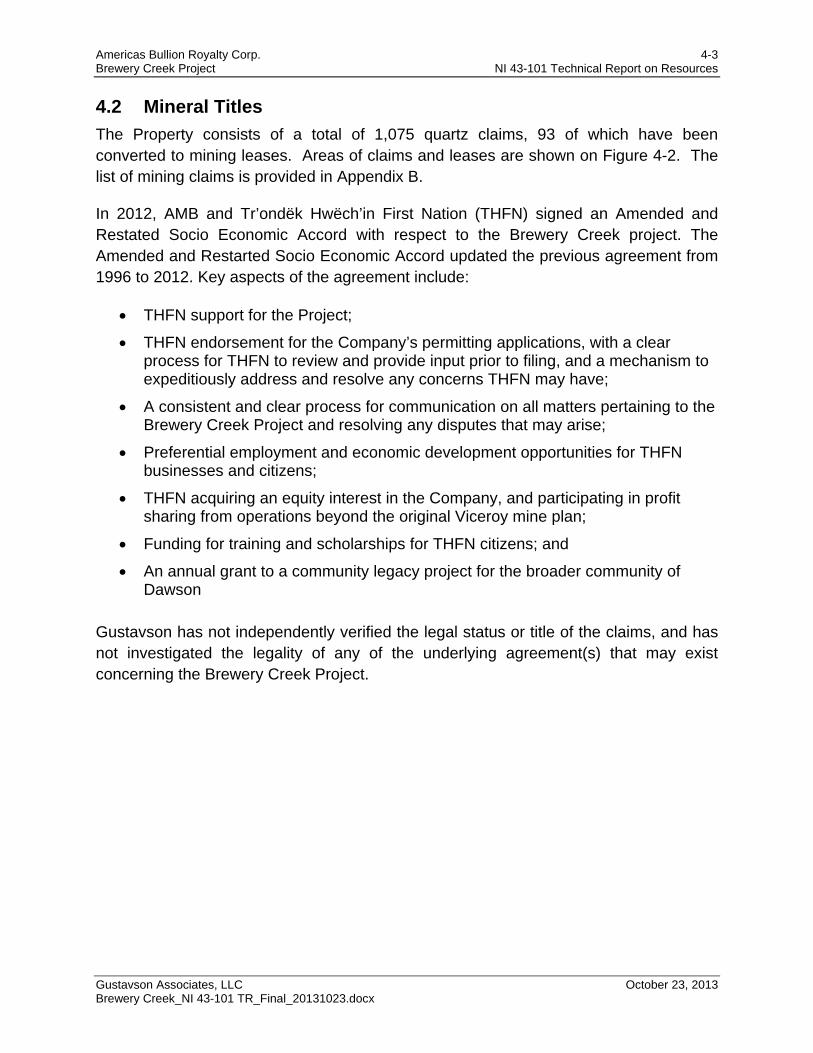
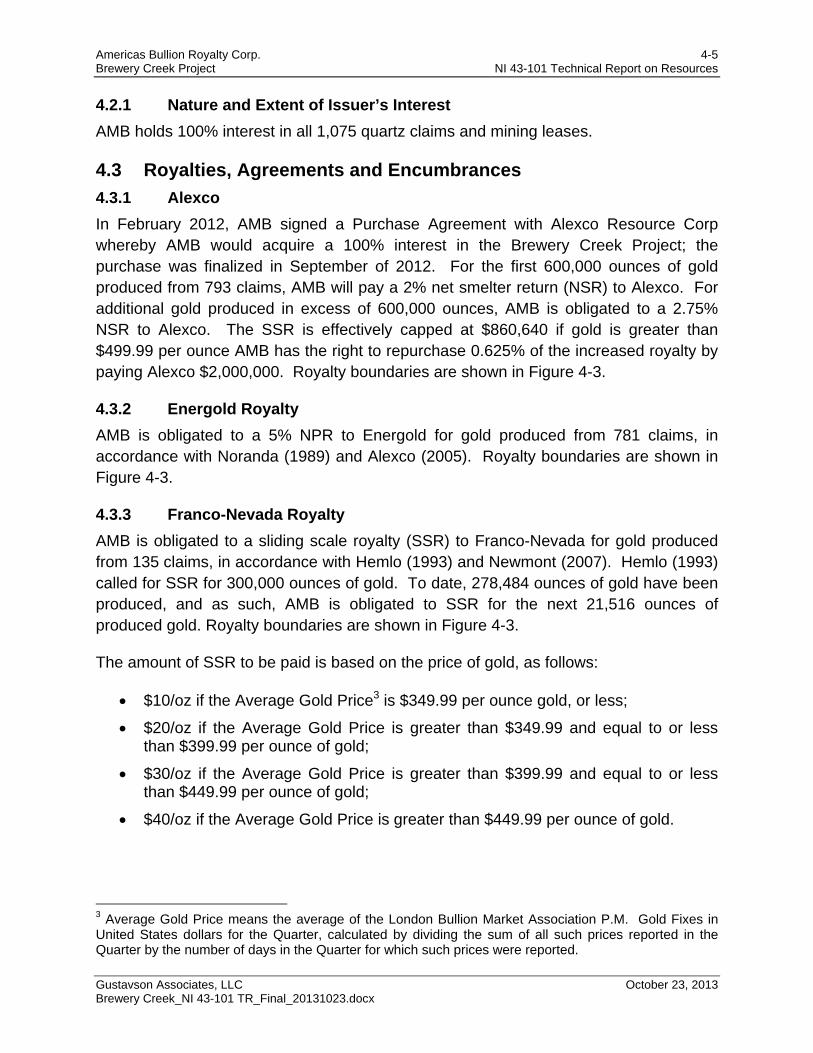
The Property consists of a total of 1,075 quartz claims, 93 of which have been converted to mining leases. Areas of claims and leases are shown on Figure 4-2. The list of mining claims is provided in Appendix B.
In 2012, AMB and Tr’ondëk Hwëch’in First Nation (THFN) signed an Amended and Restated Socio Economic Accord with respect to the Brewery Creek project. The Amended and Restarted Socio Economic Accord updated the previous agreement from 1996 to 2012. Key aspects of the agreement include:
THFN support for the Project;
THFN endorsement for the Company’s permitting applications, with a clear process for THFN to review and provide input prior to filing, and a mechanism to expeditiously address and resolve any concerns THFN may have;
A consistent and clear process for communication on all matters pertaining to the Brewery Creek Project and resolving any disputes that may arise;
Preferential employment and economic development opportunities for THFN businesses and citizens;
THFN acquiring an equity interest in the Company, and participating in profit sharing from operations beyond the original Viceroy mine plan;
Funding for training and scholarships for THFN citizens; and
An annual grant to a community legacy project for the broader community of Dawson
Gustavson has not independently verified the legal status or title of the claims, and has not investigated the legality of any of the underlying agreement(s) that may exist concerning the Brewery Creek Project.
Americas Bullion Royalty Corp. 4-4 Brewery Creek Project NI 43-101 Technical Report on Resources
Gustavson Associates, LLC October 23, 2013 Brewery Creek_NI 43-101 TR_Final_20131023.docx
Source: AMB (2013)
Figure 4-2 Areas of Mineral Claims and Mining Leases
Americas Bullion Royalty Corp. 4-5 Brewery Creek Project NI 43-101 Technical Report on Resources
Gustavson Associates, LLC October 23, 2013 Brewery Creek_NI 43-101 TR_Final_20131023.docx
4.2.1 Nature and Extent of Issuer’s Interest
AMB holds 100% interest in all 1,075 quartz claims and mining leases.
4.3 Royalties, Agreements and Encumbrances
4.3.1 Alexco
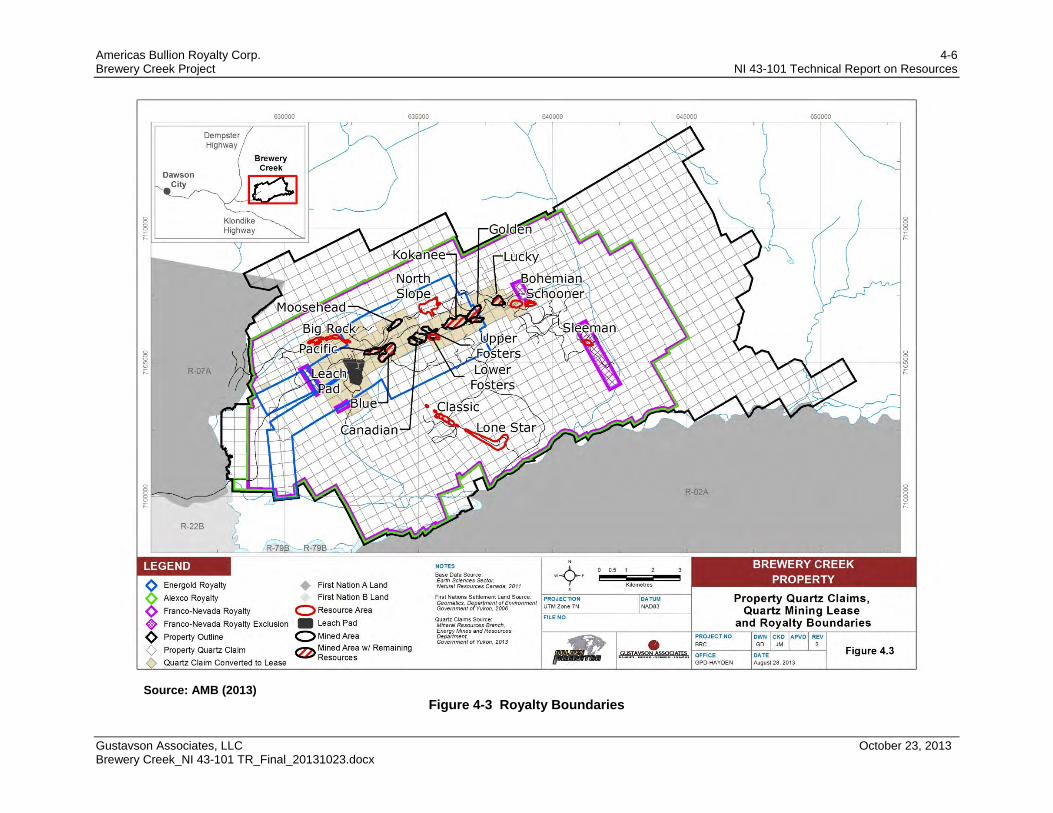
In February 2012, AMB signed a Purchase Agreement with Alexco Resource Corp whereby AMB would acquire a 100% interest in the Brewery Creek Project; the purchase was finalized in September of 2012. For the first 600,000 ounces of gold produced from 793 claims, AMB will pay a 2% net smelter return (NSR) to Alexco. For additional gold produced in excess of 600,000 ounces, AMB is obligated to a 2.75% NSR to Alexco. The SSR is effectively capped at $860,640 if gold is greater than $499.99 per ounce AMB has the right to repurchase 0.625% of the increased royalty by paying Alexco $2,000,000. Royalty boundaries are shown in Figure 4-3.
4.3.2 Energold Royalty
AMB is obligated to a 5% NPR to Energold for gold produced from 781 claims, in accordance with Noranda (1989) and Alexco (2005). Royalty boundaries are shown in Figure 4-3.
4.3.3 Franco-Nevada Royalty
AMB is obligated to a sliding scale royalty (SSR) to Franco-Nevada for gold produced from 135 claims, in accordance with Hemlo (1993) and Newmont (2007). Hemlo (1993) called for SSR for 300,000 ounces of gold. To date, 278,484 ounces of gold have been produced, and as such, AMB is obligated to SSR for the next 21,516 ounces of produced gold. Royalty boundaries are shown in Figure 4-3.
The amount of SSR to be paid is based on the price of gold, as follows:
$10/oz if the Average Gold Price3 is $349.99 per ounce gold, or less;
$20/oz if the Average Gold Price is greater than $349.99 and equal to or less than $399.99 per ounce of gold;
$30/oz if the Average Gold Price is greater than $399.99 and equal to or less than $449.99 per ounce of gold;
$40/oz if the Average Gold Price is greater than $449.99 per ounce of gold.
3 Average Gold Price means the average of the London Bullion Market Association P.M. Gold Fixes in United States dollars for the Quarter, calculated by dividing the sum of all such prices reported in the Quarter by the number of days in the Quarter for which such prices were reported.
Americas Bullion Royalty Corp. 4-6 Brewery Creek Project NI 43-101 Technical Report on Resources
Gustavson Associates, LLC October 23, 2013 Brewery Creek_NI 43-101 TR_Final_20131023.docx
Source: AMB (2013)
Figure 4-3 Royalty Boundaries
Americas Bullion Royalty Corp. 4-7 Brewery Creek Project NI 43-101 Technical Report on Resources
Gustavson Associates, LLC October 23, 2013 Brewery Creek_NI 43-101 TR_Final_20131023.docx
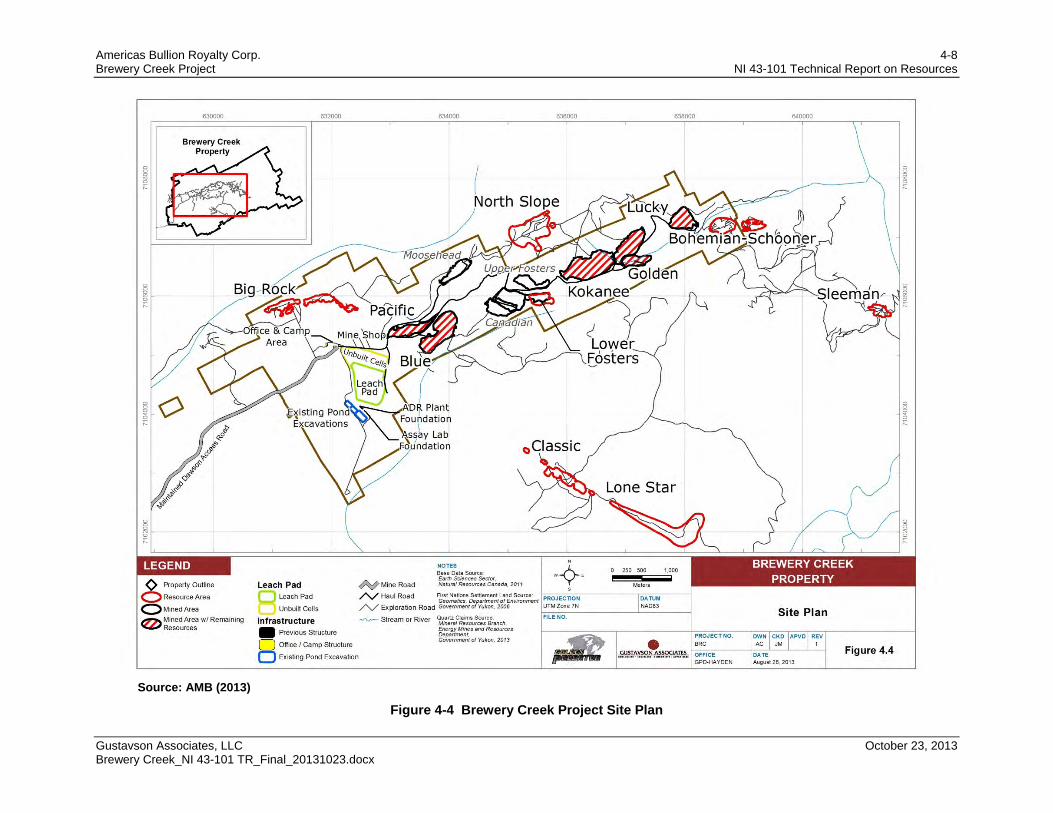
4.4 Environmental Liabilities
A site plan showing the Brewery Creek Project area is provided on Figure 4-4.
Americas Bullion Royalty Corp. 4-8 Brewery Creek Project NI 43-101 Technical Report on Resources
Gustavson Associates, LLC October 23, 2013 Brewery Creek_NI 43-101 TR_Final_20131023.docx
Source: AMB (2013)
Figure 4-4 Brewery Creek Project Site Plan
Americas Bullion Royalty Corp. 4-9 Brewery Creek Project NI 43-101 Technical Report on Resources
Gustavson Associates, LLC October 23, 2013 Brewery Creek_NI 43-101 TR_Final_20131023.docx
4.4.1 Environmental Liabilities from Past Mining Activities
Potential environmental impacts from past mining operations are managed under the Quartz Mining License held by AMB (see more information in Section 4.5.1). The Quartz Mining License cites requirements for site reclamation and closure, which have been completed. As part of the Quartz Mining License, AMB is required to conduct routine monitoring and submit an annual report to Yukon Energy, Mines and Resources. The report for 2012 was filed.
Gustavson notes that AMB is fulfilling permit requirements for monitoring and reporting to Agencies and no significant environmental liabilities from past mining operations were identified in its review of the most recent annual report (Golden Predator, 2013b).
4.4.2 Current Environmental Liabilities
There are no significant outstanding environmental liabilities remaining from the former mining operation. A final monitoring bond is place of approximately $750,000. AMB’s onsite activities are managed by the Yukon Water Board water permits and Yukon Energy, Mines and Resources mining permits (see Section 4.5). During 2012, AMB conducted reclamation activities of various drill pads and drill roads at the Brewery Creek Project area.
In October 2012, the Government of Yukon’s Environment, Water Resources Branch conducted an inspection of the Brewery Creek Project area. As stated in the Inspection Report, the reclamation is successful, the former pits and rock dumps appear stable; site conditions were found to be in general compliance with permit requirements.
During Gustavson’s review of permit and associated reports submitted to agencies pursuant to report requirements, Gustavson concludes that AMB’s environmental liabilities are well-managed and conducted generally in accordance with permit requirements. AMB is in good standing with regulatory agencies for environmental compliance.
AMB has commissioned additional environmental studies that have been completed as of the Effective Date of this report.
Memorandum regarding Brewery Creek Surface Water Hydrology. Prepared by Access Consulting Group, dated December 28, 2012.
Heritage Resource Overview Assessment for the Brewery Creek Property. Prepared by Matrix Research Ltd., dated June 2012.
Draft Brewery Creek Mine Reactivation Project, Terrestrial and Aquatic Resources – Existing Conditions Report. Prepared by Access Consulting Group, dated December 2012.
Americas Bullion Royalty Corp. 4-10 Brewery Creek Project NI 43-101 Technical Report on Resources
Gustavson Associates, LLC October 23, 2013 Brewery Creek_NI 43-101 TR_Final_20131023.docx
Socio-Economic Assessment 2012. Prepared by Ecofor Consulting BC Ltd, dated January 7, 2013.
Memorandum regarding Geochemical Characterization Program, Bohemian/ Schooner (BS) Proposed Preliminary Pit Area. Prepared by Access Consulting Group, dated June 5, 2012.
Memorandum regarding Geochemical Characterization Program, Lower Foster South East (LF-SE) Proposed Preliminary Pit Area. Prepared by Access Consulting Group, dated June 5, 2012.
Memorandum regarding Geochemical Characterization Program, Lower Foster Zone. Prepared by Access Consulting Group, dated May 1, 2012.
Memorandum regarding Brewery Creek Site Meteorological Data Summary, Lower Foster Zone. Prepared by Access Consulting Group, dated January 12, 2013.
Technical Memo regarding Brewery Creek Late Winter Moose Survey – Golden Predator. Prepared by Laberge Environmental Services, dated May 7, 2012.
Letter from EBA to Golden Predator Corp. regarding Hydrogeological Baseline Assessment, Big Rock deposits, Brewery Creek Mine, Yukon. Dated November 29, 2012.
Technical Memo regarding Groundwater Inflow to Proposed Open Pits (Conceptual Model). Prepared by EBA, dated December 31, 2012.
Letter from Vista Tek Limited to Golden Predator regarding September 2012 Engineering Inspection – Brewery Creek Mine, dated October 3, 2012.
4.5 Permits
Permits held by AMB are listed in this section. From discussion with AMB and based on documents reviewed by Gustavson, permits are in good standing with their respective regulatory agencies.
4.5.1 Class IV Mining Land Use Permit –Exploration
AMB holds a Class IV Mining Land Use permit LQ00364 that authorizes surface disturbances related to exploration activities such as drill road construction, drill pads, fuel storage, trenching and a 120 person camp. The permit expires on July 5, 2022.
The permit requires submittal of an annual report by March 31 of each year, summarizing activities performed in the preceding calendar year. Gustavson notes that such a report was submitted (Golden Predator, 2013b), and believes the license is in good standing.
Americas Bullion Royalty Corp. 4-11 Brewery Creek Project NI 43-101 Technical Report on Resources
Gustavson Associates, LLC October 23, 2013 Brewery Creek_NI 43-101 TR_Final_20131023.docx
4.5.2 Quartz Mining License
AMB holds a Quartz Mining License (QML) No. LQ00364 permitted by Yukon Energy, Mines and Resources. The QML covers mine production and closure, monitoring and inspections among others issues. The Quartz Mining License expires on December 31, 2021 (YEMR, 2012b).
The permit requires submittal of an annual report by March 31 of each year, summarizing activities performed in the preceding calendar year. Gustavson notes that such a report was submitted (Golden Predator, 2013b), and believes the license is in good standing.
4.5.3 Type A Water Use Permit
AMB holds a Type A Water Use License (WUL) No. QZ96-007 permitted by Yukon Water Board: the Type A Water Use License expires on December 31, 2021.
The Type A WUL consists of requirements for mine production and closure, mine and camp water use and waste disposal, water management and monitoring and others. The current WUL authorizes water extraction rate of up to 2,824 m³ per day for mining use.
The permit requires submittal of an annual report by February 28 of each year, summarizing activities performed in the preceding calendar year. Gustavson notes that such a report was submitted (Golden Predator, 2013b), and believes the license is in good standing.
4.5.4 Type B Water Use Permit
AMB holds a Type B Water Use License (WUL) MN12-038 permitted by Yukon Water Board: this permit expires in July 5, 2022. The Type B Water Use License allows for operation of a septic system for up to 120 persons and extraction of up to 50 m3 of water per day for domestic use. This permit is in good standing.
4.6 Other Significant Factors and Risks
Gustavson notes no significant factors or risks that may affect access, title, or right or ability to perform work on this property.
Americas Bullion Royalty Corp. 5-1 Brewery Creek Project NI 43-101 Technical Report on Resources
Gustavson Associates, LLC October 23, 2013 Brewery Creek_NI 43-101 TR_Final_20131023.docx
5 Accessibility, Climate, Local Resources, Infrastructure and Physiography (Item 5)
5.1 Topography, Elevation and Vegetation
The Property is located in the Ogilvie Mountains immediately north of the Klondike River and west of Lee Creek. Elevations on the property range from approximately 450 metres (1,500 feet) to 1,200 metres (4,000 feet). Relief on the property varies from moderately flat terraces or benches in the southwest corner of the property to moderately steep for the majority of the Property. The area was not glaciated during the last glaciation period resulting in relatively steep V-shaped valleys incised by the creeks that cross the property. Natural bedrock exposure is generally less than 1% and is restricted to the higher elevation ridges within the property area.
Vegetation on the property consists of four main types. The higher elevations (above 1,050 metres) consist of rounded hills covered with sub-alpine shrubs, grasses and widely spaced coniferous trees. Steep north facing slopes and narrow valley floors are covered with thick blankets of moss with thickets of slope alder and stunted spruce. Steep south facing slopes have two distinct styles of vegetation; coniferous trees with abundant undergrowth and areas of deciduous aspen, poplar and birch with little or no undergrowth.
EBA undertook a surficial terrain study on the Brewery Creek property in 2012. The results of the study show that all north facing slopes and valley bottoms can be influenced by permafrost. Permafrost in the study area is discontinuous and is probable on lowermost slopes and floors of the moderately steep (50% to 70% gradient) v-shaped stream valleys.
Areas of gentle topography, especially NW facing slopes, and gullies contain loess (fine wind-blown silt) up to 17 metres thick. Observed geomorphological processes include slow soil creep on the middle to lower slopes of some stream valleys and minor sloughing along some eroded stream banks. There were no indications of active rapid mass movement processes observed during the field visit.
5.2 Climate and Length of Operating Season
Located at approximately 64° north latitude, the property is subject to a subarctic climate with average temperatures ranging from 15°C (60°F) in July to -26°C (-16°F) in January with temperatures commonly reaching above 30°C (86°F) in the summer and below -40°C (-40°F) in the winter. Average annual precipitation at the Brewery Creek Project is approximately 325 mm and annually there are approximately 110 frost-free days.
Americas Bullion Royalty Corp. 5-2 Brewery Creek Project NI 43-101 Technical Report on Resources
Gustavson Associates, LLC October 23, 2013 Brewery Creek_NI 43-101 TR_Final_20131023.docx
AMB’s field operations generally happen from March through October of each calendar year, depending on weather. This is consistent with the duration of past mining operations.
5.3 Sufficiency of Surface Rights
The area where AMB holds the surface rights is the same as the claim areas. Gustavson notes that the surface rights are sufficient for foreseeable exploration activities, and they are expected to be sufficient for mining operations.
5.4 Accessibility and Transportation to the Property
The site is accessible year-round from the Klondike Highway connecting Whitehorse and Dawson City, Yukon, Canada. From Dawson City, the drive is approximately 40 kilometres along Klondike Highway (YT-2 South) in the easterly direction, then 7 kilometres north on the all-weather Dempster Highway and then approximately 20 kilometres along the North Fork all-weather access road to the Brewery Creek Project site.
Alternatively, from Whitehorse, Yukon, Canada, the drive is approximately 490 kilometres along Klondike Highway (YT-2 North) in the northwesterly direction, then 7 kilometres north on the all-weather Dempster Highway and then approximately 20 kilometres along the North Fork all-weather access road to the Brewery Creek Project site.
5.5 Infrastructure Availability and Sources
A generalized map showing site layout is provided on
Figure 5-1. A more detailed map showing the former heap leach pad area is provided on Figure 5-2.
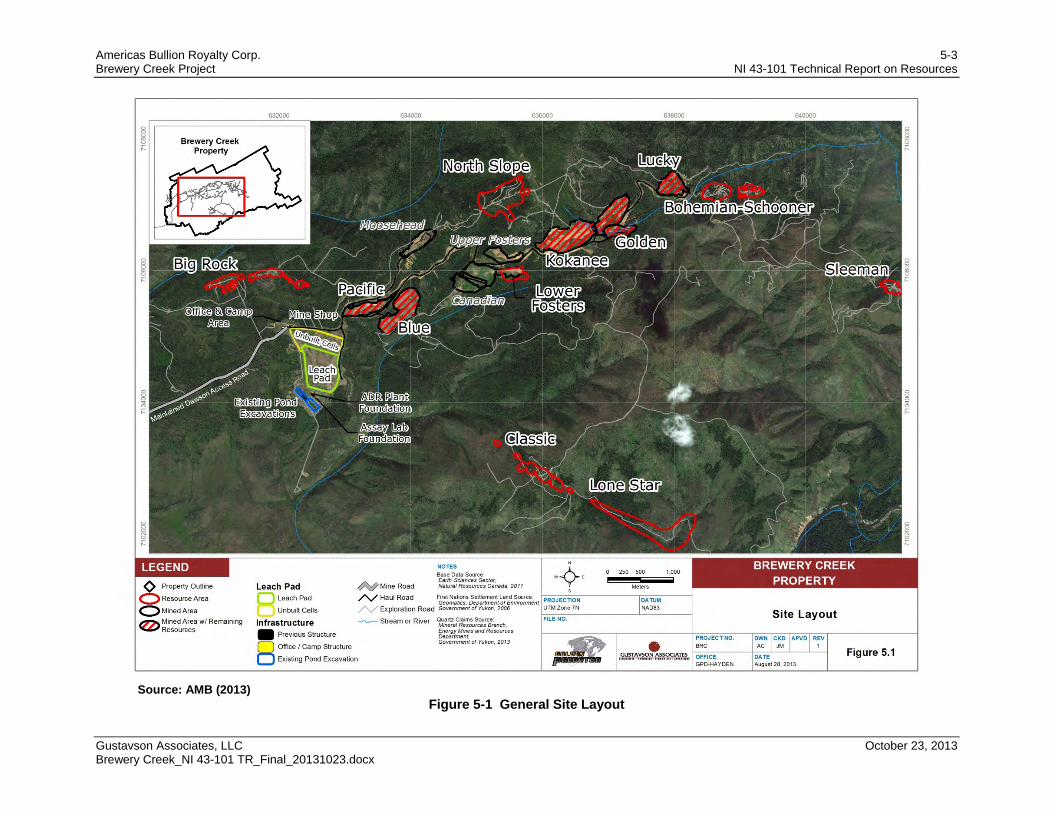
Americas Bullion Royalty Corp. 5-3 Brewery Creek Project NI 43-101 Technical Report on Resources
Gustavson Associates, LLC October 23, 2013 Brewery Creek_NI 43-101 TR_Final_20131023.docx
Source: AMB (2013)
Figure 5-1 General Site Layout

Americas Bullion Royalty Corp. 5-4 Brewery Creek Project NI 43-101 Technical Report on Resources
Gustavson Associates, LLC October 23, 2013 Brewery Creek_NI 43-101 TR_Final_20131023.docx
Source: AMB (2013)
Figure 5-2 Existing Infrastructure
Americas Bullion Royalty Corp. 5-5 Brewery Creek Project NI 43-101 Technical Report on Resources
Gustavson Associates, LLC October 23, 2013 Brewery Creek_NI 43-101 TR_Final_20131023.docx
As shown on Figure 5-2, the former maintenance shop (labeled Exploration Office) was partially dismantled after closure of the previous mining operations and is currently being used as offices and exploration core logging facilities. Accommodations include mobile living quarters in the form of prefabricated trailers and temporary tent structures. There is capacity for approximately 50 people in these current facilities.
5.5.1 Power
Power is currently supplied by a diesel generator (145 kW) as the site is not connected to the Yukon power grid.
The existing power supply is not expected to be sufficient to support potential future mining operations. AMB has commissioned an independent conceptual study by BBA, an independent Canadian consulting engineering firm, to estimate the cost of connecting the Brewery Creek Project to the Yukon Energy Corporation (YEC) network. BBA has evaluated conceptual engineering designs and costs which include a tap point substation, transmission and distribution line, and a Brewery Creek Project substation. A potential power line route following existing roadways is approximately 27 km. from the tap point on the main distribution grid to the Brewery Creek Project site.
5.5.2 Water
AMB holds a Type A Water Use License to obtain and use up to 2,824 m3 per day of water from various sources on site. The Type A Water Use Permit is sufficient for current and future exploration activities and for potential future mining operations.
In addition, AMB holds a Type B Water Use License to obtain and use up to 50 m3 per day for domestic purposes for 120 person camp and to dispose of the waste water in the approved septic system. Water supply for operations from the Type B Water Use Permit is sufficient for current and future exploration and mining activities.
5.5.3 Personnel
Skilled labor is available in the nearby B.C. province and Alaska. For future mining operations, the availability of personnel with applicable skills in the Yukon is limited; however, it is expected that skilled workers will gravitate into the area for employment.
5.5.4 Tailings Storage Areas
During past mining operations, material was treated by heap leach, as further described in Section 5.5.6 below. Future mining is expected to utilize heap leaching as the means for processing, and as such, no tailings storage areas are expected.
Americas Bullion Royalty Corp. 5-6 Brewery Creek Project NI 43-101 Technical Report on Resources
Gustavson Associates, LLC October 23, 2013 Brewery Creek_NI 43-101 TR_Final_20131023.docx
5.5.5 Waste Disposal Areas
Existing waste disposal infrastructure consists of a secure dumpster for waste disposal, an incinerator for solid waste, and sewage disposal system. The existing solid waste disposal methods are sufficient.
5.5.6 Heap Leach Pad Areas
During previous mine operations, material was treated by heap leach. The facility was designed and permitted for a capacity of approximately 15 million tonnes of material within 10 cells. Capacity for Cells 1 through 6 has been reached and approximately 1 million tonnes of capacity is estimated to remain on Cell 7. In total, Cells 1 to 7 contain approximately 9.5 million tonnes of leached run of mine material. The existing Cells 1 to 7 are lined, with a main solution collection ditch along the west edge of the leach pad with flow to process ponds, and are surrounded by a containment dike constructed along the south and west edges of the leach pad.
The permitted area for the remaining three cells (i.e., Cells 8, 9, and 10) is 190,000 m², with remaining permitted capacity of 5.5 million tonnes. AMB commissioned Tetra Tech to design the 3 remaining cells, which has been completed (Tetra Tech, 2013b). Tetra Tech also prepared a preliminary heap leach water balance which called for 21,510 m3 of water during Year 1 of operations (Tetra Tech, 2013a), a quantity that is well within the water supply permitted under the Type A water permit (see Section 4.5.3).
5.5.7 Processing Plant Sites
The processing plant from former mining operations was removed and sold. To accommodate mining operations, an ADR building is expected to be located on the approximate same foundation as the previous ADR building.
Infrastructure facilities at the site were examined by Gustavson and appear to be in good shape and adequate for supporting continuing exploration activities.

Americas Bullion Royalty Corp. 6-1 Brewery Creek Project NI 43-101 Technical Report on Resources
Gustavson Associates, LLC October 23, 2013 Brewery Creek_NI 43-101 TR_Final_20131023.docx
6 History (Item 6)
6.1 Prior Ownership
The initial claims for the Brewery Creek Project were staked by Noranda Exploration (Norex) in 1987 to cover a reconnaissance geochemical anomaly. Further claims were staked in subsequent years to cover possible extensions of gold mineralization.
In 1989, Norex entered into an agreement with Total Erickson Resources Limited (TERL). TERL provided Norex with $300,000 for exploration, and, in return, TERL earned a 5% NPR on 52 of the Brewery Creek Project area claims. In October 1992, TERL assigned all of its interests, rights, and title to Energold Minerals, Inc.
In September 1992, Hemlo Gold Mines, Inc. (Hemlo) acquired all of Norex’s right, title, and interest to the Brewery Creek Project property area, including obligations to TERL. In 1993, Loki Gold Corporation entered into an assignment agreement with Hemlo, thus acquiring all of Hemlo’s rights, title, and interest.
In May 1996 Loki and Baja Gold, Inc. joined to form a new company under the name Viceroy Minerals Corporation (Viceroy). Mine commissioning, production, closure and reclamation occurred under Viceroy ownership.
On May 1, 2003, an agreement among Viceroy, 650399 BC Ltd., Spectrum Gold Inc., and NovaGold Canada Inc. (NovaGold) was established in which Viceroy would allow 650399 BC Ltd an option to purchase mineral properties of, other rights to, and assets of the Brewery Creek Project. At this time, 650399 BC Ltd. (BC) was a wholly owned subsidiary of Spectrum Gold Inc. (Spectrum).
A small drilling program was conducted by 650399 BC Ltd. in 2004. Later that year, NovaGold acquired all of the outstanding shares of SpectrumGold and thus the option for assets of the Brewery Creek Project.
In April 2005, NovaGold relinquished the option for Brewery Creek Project claims and mining leases to Alexco Resource Corporation (Alexco) with a back-in clause following the completion of $700,000 of exploration expenditures by Alexco. NovaGold elected not to participate with this back-in option.
In 2009, Golden Predator signed an option agreement with Alexco whereby Golden Predator had the option to acquire up to 75% interest in 793 quartz claims and mining leases covering 127 km². A Purchase Agreement was signed between Golden Predator and Alexco in February 2012 and the sale was completed in September of 2012 by which Golden Predator purchased 100% ownership in the property.
Americas Bullion Royalty Corp. 6-2 Brewery Creek Project NI 43-101 Technical Report on Resources
Gustavson Associates, LLC October 23, 2013 Brewery Creek_NI 43-101 TR_Final_20131023.docx
In early 2013 Golden Predator Corp. changed its name to Americas Bullion Royalty Corp. (AMB) and in the process bundled the Canada based assets into Golden Predator Canada Corporation (Golden Predator) which exists as a wholly owned subsidiary of AMB.
6.2 Past Exploration and Development Results
Historical exploration surveys conducted at Brewery Creek Project between 1988 and 2006 included geologic mapping, extensive grid soil sampling, ground and airborne geophysical studies, mechanized surface trenching, and extensive core and reverse-circulation drilling.
6.2.1 Geologic Mapping
Due to rare exposure of the local bedrock, geologic mapping on the site has been restricted primarily to trench and road cut exposures. Scree and soil mapping was also utilized outboard from main exploration zones to develop a coherent and regionally consistent geology map.
A Ph.D. thesis titled The Structural and Hydrothermal Evolution of Intrusion-Related Gold Mineralization at the Brewery Creek Mine, Yukon, Canada, authored by Mark Lindsay was submitted to the James Cook University, North Queensland, Australia, in May 2006. The work presents a detailed account of mineralogy, alteration and structural implications at the Brewery Creek Project. The geologic mapping is discussed in Section 7.2 of this report.
6.2.2 Soil Sampling Surveys
As reported in Diment (2009), over 24,000 soil samples have been collected on the property to date.
Between 1988 and 1992, more than 8,000 soil samples were collected at 50 metre intervals on 100 metre and 200 metre spaced lines over the mineralized zones. Lines were spaced at 400 metres over the remainder of the property. The samples were analyzed for gold, silver, antimony, arsenic and mercury; two-thirds of these samples were submitted for ICP analysis.
Between 1994 and 1996, more than 10,500 soil samples were collected across previously sampled portions of the exploration grid. Anomalies were extended south of the Classic zone and west of the Big Rock zones. Soil samples were collected at 25 metre intervals in areas of moderate topographic relief or at 12.5 metre intervals in subdued relief on 100 metre spaced lines. Bedrock and surficial geology were mapped at each sample site.
In 1997, approximately 6,000 soil samples, at 25 metre intervals on 100 metre spaced lines, were collected to better define anomalous trends in the South Canadian zone.
Americas Bullion Royalty Corp. 6-3 Brewery Creek Project NI 43-101 Technical Report on Resources
Gustavson Associates, LLC October 23, 2013 Brewery Creek_NI 43-101 TR_Final_20131023.docx
Soil sampling results through 2009 are provided on Figure 6-1. The hydrothermal system at the Brewery Creek Project is anomalous in gold, arsenic, antimony and mercury. Silver is weakly anomalous and erratic; it is associated with zinc in the sedimentary rocks and gold in the epithermal system.
Gold-in-soil anomalies have assisted in discovery of all the known mineralized zones and exploration targets.
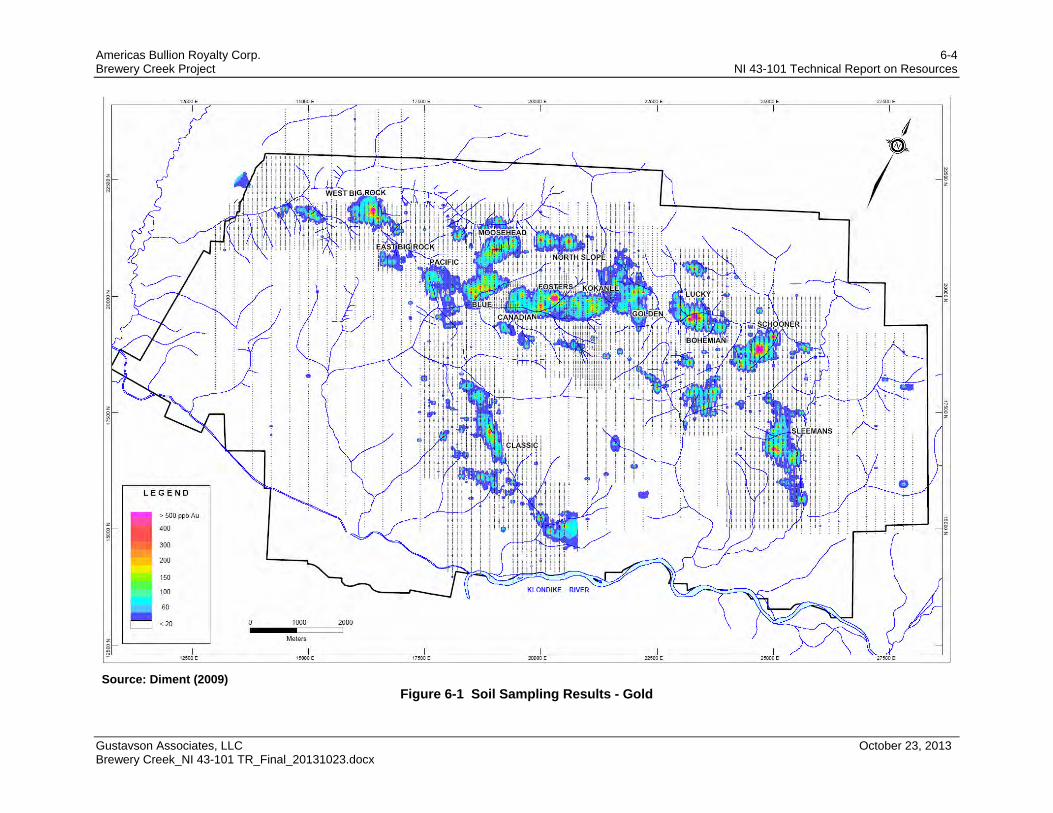
Americas Bullion Royalty Corp. 6-4 Brewery Creek Project NI 43-101 Technical Report on Resources
Gustavson Associates, LLC October 23, 2013 Brewery Creek_NI 43-101 TR_Final_20131023.docx
Source: Diment (2009)
Figure 6-1 Soil Sampling Results - Gold
Americas Bullion Royalty Corp. 6-5 Brewery Creek Project NI 43-101 Technical Report on Resources
Gustavson Associates, LLC October 23, 2013 Brewery Creek_NI 43-101 TR_Final_20131023.docx
6.2.3 Geophysical Surveys
Geophysical surveys consisted of ground magnetometer and IP surveys conducted between 1989 and 1992 by Norex. In 1998 an airborne magnetometer and radiometric survey was also conducted covering the entire property and adjacent R-7A and R-2A Tr’ondek Hwech'in settlement land. During 2004, 28 km of Induced Polarization (IP) geophysical survey were completed. Results of the 1998 magnetometer and radiometric survey and 2004 IP geophysical survey were not made available to Gustavson.
Although the airborne and ground magnetometer surveys were useful in delineating Tombstone Suite intrusive centers and their adjacent hornfelsed aureoles, mineralized zones typically lie outboard of or flank these magnetic anomalies. The oxidized, auriferous sills that make up most of the Reserve Trend deposits exhibited a relatively flat magnetic response.
Results of the 2004, twenty-eight kilometre IP geophysical survey clearly defined two chargeability domains (west-high and east-low) that are separated by a major northwest trending fault. The trace of this structure passes from the Classic Zone to just west of the Pacific production pit. A strong magnetic-high is coincident with the high chargeability anomaly. Sulfide-bearing intrusive bodies and/or hornfelsed, pyrrhotite-bearing strata may possibly explain the high chargeability features whereas the low chargeability terrain to the east may reflect widespread sulfide destruction linked to the main mineralizing event over the mine trend.
6.3 Drilling
A summary of historical drilling conducted from 1989 to 2004 is provided in Table 6-1. Trench and drillhole locations are shown on Figure 6-2.
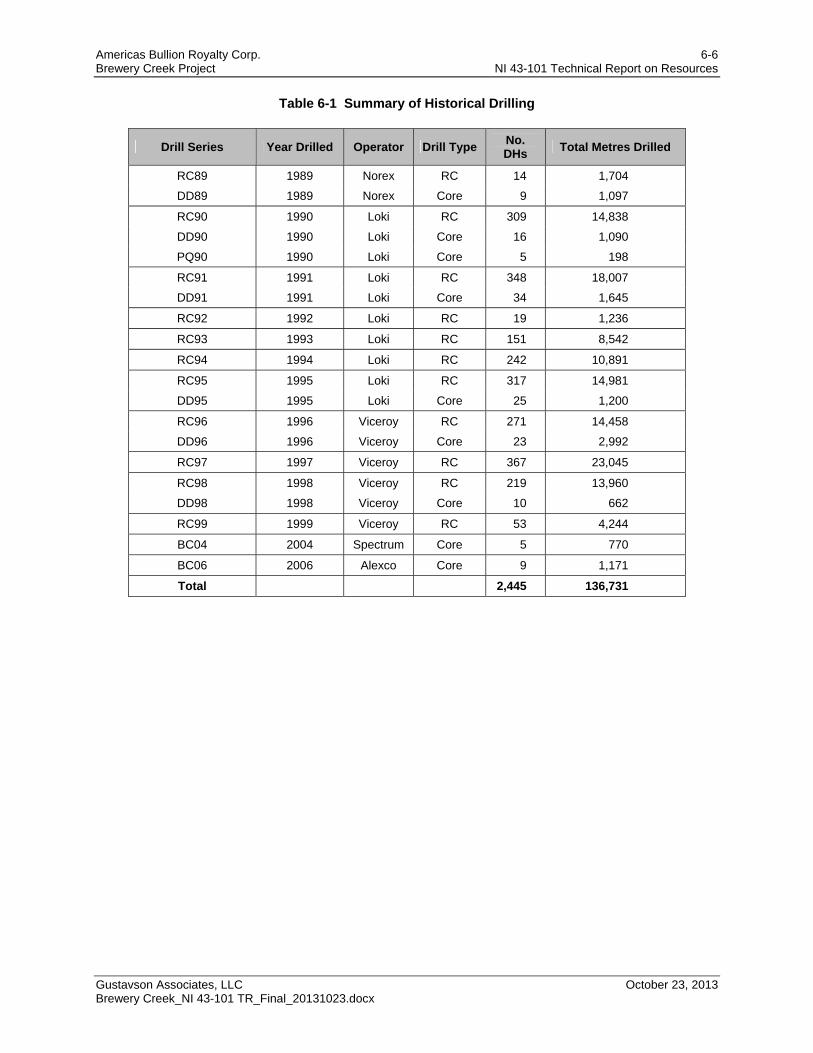
Americas Bullion Royalty Corp. 6-6 Brewery Creek Project NI 43-101 Technical Report on Resources
Gustavson Associates, LLC October 23, 2013 Brewery Creek_NI 43-101 TR_Final_20131023.docx
Table 6-1 Summary of Historical Drilling
Drill Series Year Drilled Operator Drill Type No. DHs
Total Metres Drilled
RC89 1989 Norex RC 14 1,704
DD89 1989 Norex Core 9 1,097
RC90 1990 Loki RC 309 14,838
DD90 1990 Loki Core 16 1,090
PQ90 1990 Loki Core 5 198
RC91 1991 Loki RC 348 18,007
DD91 1991 Loki Core 34 1,645
RC92 1992 Loki RC 19 1,236
RC93 1993 Loki RC 151 8,542
RC94 1994 Loki RC 242 10,891
RC95 1995 Loki RC 317 14,981
DD95 1995 Loki Core 25 1,200
RC96 1996 Viceroy RC 271 14,458
DD96 1996 Viceroy Core 23 2,992
RC97 1997 Viceroy RC 367 23,045
RC98 1998 Viceroy RC 219 13,960
DD98 1998 Viceroy Core 10 662
RC99 1999 Viceroy RC 53 4,244
BC04 2004 Spectrum Core 5 770
BC06 2006 Alexco Core 9 1,171
Total 2,445 136,731
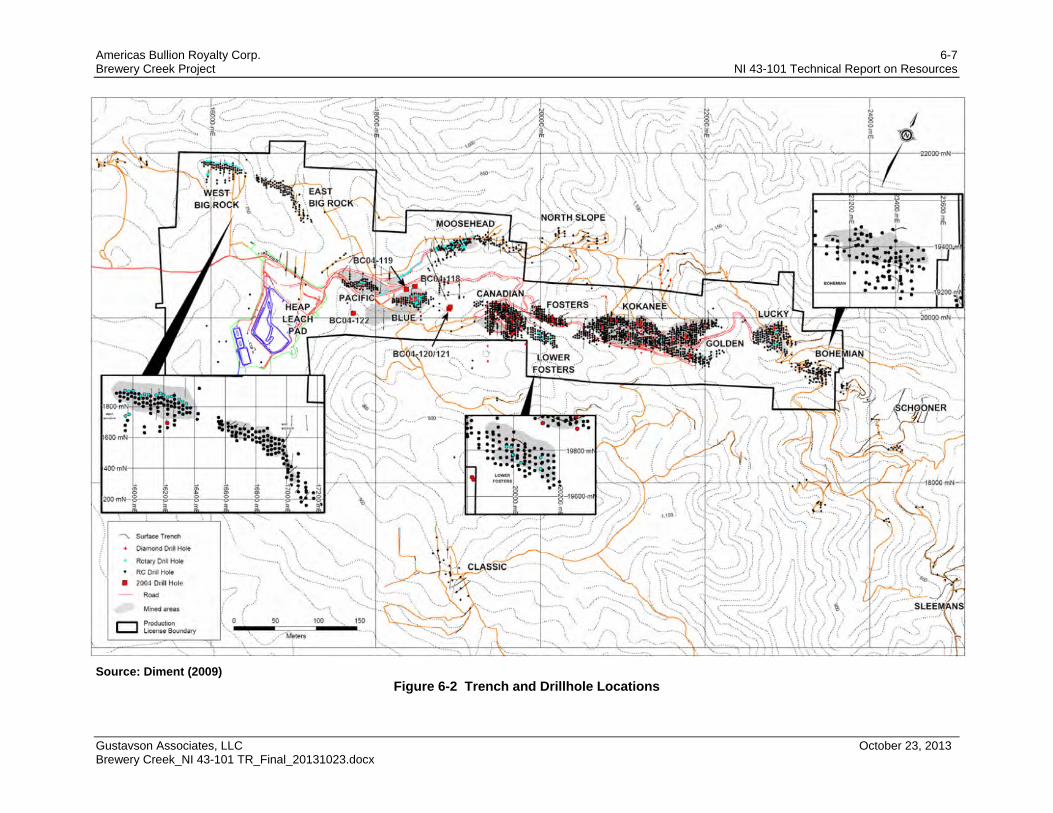
Americas Bullion Royalty Corp. 6-7 Brewery Creek Project NI 43-101 Technical Report on Resources
Gustavson Associates, LLC October 23, 2013 Brewery Creek_NI 43-101 TR_Final_20131023.docx
Source: Diment (2009)
Figure 6-2 Trench and Drillhole Locations
Americas Bullion Royalty Corp. 6-8 Brewery Creek Project NI 43-101 Technical Report on Resources
Gustavson Associates, LLC October 23, 2013 Brewery Creek_NI 43-101 TR_Final_20131023.docx
6.3.1 Norex (1989)
Norex completed 13 reverse circulation (RC) holes, totaling 1,704 metres, near the current Upper Fosters, Canadian, Blue and Kokanee areas, and 9 diamond drill holes, totaling 1,096.8 metres, near the current Upper Fosters, Canadian and Moosehead areas that were completed by Norex in 1989.
The drilling targeted anomalous soil samples and were generally oriented to the north, across dip of geology. Materials intersected in these holes with significant grades have been removed by previous Viceroy mining operations and are not considered to be relevant to the mineral resource estimate presented in this report.
6.3.2 Loki / Viceroy (1990 – 1999)
AMB’s drill database has records for a total of 2,296 RC holes drilled between 1989 and 1999 amounting to a total of 124,201.6 metres and a total of 113 core holes drilled between 1989 and 1999 amounting to a total of 7,787.7 metres.
The programs were designed as early exploration programs followed by delineation drilling programs for Viceroy resource and reserve development.
Drilling by Loki and Viceroy was generally conducted in combination of vertical and inclined drilling at 25 to 30 metres spacing along fences offset at 20 to 40 metres across the development areas of interest.
Core recovery was inherently low in many of the core holes due to poor integrity of the wall rock sedimentary rocks. As RC drilling was used as the preferred method for deposit delineation, the limited core drilling post 1989 was restricted to geotechnical drilling for pit wall stability studies, deeper sulfide drilling, and twinning of significant RC hole intercepts for grade and thickness comparisons.
6.3.3 Spectrum (2004)
Following mine closure, core drilling was resumed in 2004 by Spectrum Gold to provide adequate information for structural interpretation during this renewed phase of exploration. Diamond drilling in 2004 tested targets at Blue, Blue East and South Pacific. A total of 5 core holes totaling 770 metres were completed.
6.3.4 Alexco (2006)
Alexco completed a diamond drilling program in 2006, managed by geological personnel from NovaGold. The drill program consisted of 9 HQ core holes for 1,171.53 metres. The drilling was carried out by E. Caron Diamond Drilling Ltd. of Whitehorse, Yukon. Caron supplied the program with two skid mounted Longyear 38 drills with drill pipe sloops, water tank and a water truck, and a D-7 cat for rig moves.
Americas Bullion Royalty Corp. 6-9 Brewery Creek Project NI 43-101 Technical Report on Resources
Gustavson Associates, LLC October 23, 2013 Brewery Creek_NI 43-101 TR_Final_20131023.docx
The drilling was completed between March 20 and May 1, 2006 at Bohemian, Classic, Blue as well as IP anomalies along a major NW-striking fault extending from the Classic to the Pacific Zone.
6.4 Historical Mineral Resource Estimates
The historical resource estimates described in this section are taken from various historical records. These resource estimates have not been verified, and are not considered reliable. In historical reporting, the term “resource” is not necessarily used according to current NI 43-101 definitions. The resource estimates are disclosed here for historical completeness only. These resources were not used as a basis for the current resource estimate.
A Technical Report for the Brewery Creek Project was prepared for Viceroy in 2003 (Diment and Simpson, 2003). It is unclear if these Mineral Resources are NI 43-101 compliant. The Mineral Resources therein for the West Big Rock, East Big Rock, Bohemian, and Lower Fosters were estimated using SURPAC software by Geosim Services and are shown below in Table 6-2.
The report is dated May 16th, 2003. No effective date for the resource was provided in the report.
Table 6-2 Historical Brewery Creek Indicated Resources, 0.5 g/t Au Cutoff
Zone Tonnes >Cutoff
Grade (g/t Au)
Recovery Grade (g/t Au)
Total In-situ Oz
Estimated Recovered Oz
West Big Rock 815,800 1.133 0.764 29,700 20,000
East Big Rock 1,017,400 0.907 0.577 29,700 19,000
Bohemian 1,180,900 1.387 0.576 42,900 18,000
Lower Fosters 961,900 1.387 0.576 42,900 18,000
Total 3,975,900 1.135 0.652 145,000 83,000
A hand-calculated, sectional resource was also presented for the North Slope resource area, and is shown in Table 6-3.
Table 6-3 Historical North Slope Inferred Resource, 0.5 g/t Au Cutoff
Zone Tonnes >Cutoff Grade (g/t Au) Total Oz
North Slope 2,214,000 2.01 143,000
Americas Bullion Royalty Corp. 6-10 Brewery Creek Project NI 43-101 Technical Report on Resources
Gustavson Associates, LLC October 23, 2013 Brewery Creek_NI 43-101 TR_Final_20131023.docx
6.5 Historical Production
The description of the historical production found below has been extracted and modified from Diment and Simpson (2009).
Loki / Viceroy constructed the mine from 1995 to 1996 and began operation in 1996. From 1996 through 2002, approximately 280,000 ounces of gold were produced from seven near-surface oxide deposits (i.e., Pacific, Blue, Moosehead, Fosters, Canadian), occurring along strike within the historically termed “Brewery Creek Reserve Trend” (BCRT). A silver credit was included within the doré shipped from site. The first gold pour at the Brewery Creek mine was completed on November 15, 1996 with 10,175 ounces being produced prior to commencement of full commercial production in May of 1997. During 1997, a total of 72,387 ounces of gold were produced. In 1998 production totaled 79,396 ounces. Production in 1999 fell to 48,164 ounces. Viceroy suspended seasonal mining operations in 1999 earlier than planned and hired an independent consulting company to study recovery processes in an effort to improve recoveries. In 2000, Viceroy concentrated on selectively mining the mineralized bodies which were well oxidized and contained the highest grade. Production in 2000 fell to 48,048 ounces of gold. Mining ceased in 2001, but heap leaching continued with production of 18,542 ounces of gold.
During 2002, Viceroy undertook and completed approximately 50% of the mine area reclamation related to re-contouring and re-vegetation of pits and dumps. A heap detoxification program was also initiated bringing cyanide and metal levels of heap effluent to water license discharge levels, excluding selenium, by September, 2002. An amendment to the water license was approved by government regulatory agencies at this time, allowing land application of heap effluent of up to 200,000 m³ per year. Re-circulation of effluent to the heap ceased in October, 2002 excluding 450 l/min that was applied to the heap over the winter (2002/2003) for snow making purposes. A final closure and decommissioning plan was prepared and submitted as required, to the regulatory agencies, and the primary elements of the plan were adopted and water license amendments were granted in April 2005.
Historical studies undertaken in the year 2000, on heap leach recoveries had shown a recovery of 65% for uncrushed material. Discussions were raised at the time on the merits of crushing for which studies had shown a potential increase of 10% for the recoveries, at a stated cost of $2.50 per tonne at the time. It should be noted that the recoveries estimated in the preproduction study undertaken in 1995 were 78%.
Americas Bullion Royalty Corp. 7-1 Brewery Creek Project NI 43-101 Technical Report on Resources
Gustavson Associates, LLC October 23, 2013 Brewery Creek_NI 43-101 TR_Final_20131023.docx
7 Geological Setting and Mineralization (Item 7)
7.1 Regional Geology
The northern Cordillera consists of five physiographic domains composed of deformed metasedimentary rocks, allochthonous terranes and associated magmatic rocks (Figure 7-1, legend Figure 7-2). From west to east these domains are referred as; Insular, Coast, Intermontane, Omineca and Foreland belts. Within the northern Cordillera, the Tintina Fault generally marks the boundary between the ancient North American craton on the northeast to the allochthonous (accreted) terrains, composed of younger and varying rock types, to the southwest. The Tintina Fault, is interpreted as a Paleogene-aged dextral strike-slip fault with an estimated displacement of at least 450 km, but may be up to 1200 km (Hart, 2011). The fault is marked by the Tintina Trench, a broad valley approximately 15 km wide in the Project area which also extends throughout the Yukon as the northern extension of the Rocky Mountain Trench. Volcanic rocks were deposited in the Tintina Trench about 55 Ma and it is filled with young unconsolidated sediments.
The Brewery Creek Project is situated in the Omineca Belt, east of the Tintina Fault in the central northern Cordillera, and is characterized by large mountain ranges and plateaus composed of folded and variably metamorphosed sedimentary and volcanic strata intruded by felsic plutons. The property lies in the foothills of the Ogilvie Mountains, on the northern Stewart Plateau.
The Property is located on the western edge of the epicratonic Selwyn Basin, which is bound on the southwest by the Tintina Fault and on the north by the Dawson Thrust Fault (Gordey and Makepeace, 2001). The Selwyn Basin stratigraphy consists of late Proterozoic to Paleozoic marginal basinal and platformal clastic and pelitic lower greenschist grade metasedimentary rocks whose protoliths were derived from the North American Craton. Because metamorphic grade is low and original sedimentary features are readily identifiable, the prefix “meta” will commonly be left off in rock descriptions in the rest of this Report. Various aged volcanic and intrusive rocks are stratabound within the sedimentary rocks. During the Proterozoic and again in the late Devonian, the basin was subjected to rifting. This rifting was accompanied by the emplacement of the volcanics and emplacement of thick sills of intrusive rocks.
By late Jurassic, the rocks of the Intermontane Belt of the Cordillera collided with the passive margin of the North America Shelf, causing compressive tectonics (Murphy, 1997). This resulted in crustal shortening, tight folding, and thrusting. Three regionally stacked thrust panels were formed separated by the Robert Service, Tombstone and Dawson thrust faults (from oldest to youngest) (Murphy, 1997). This thrusting has mainly affected the Intermontane and Omineca belts.
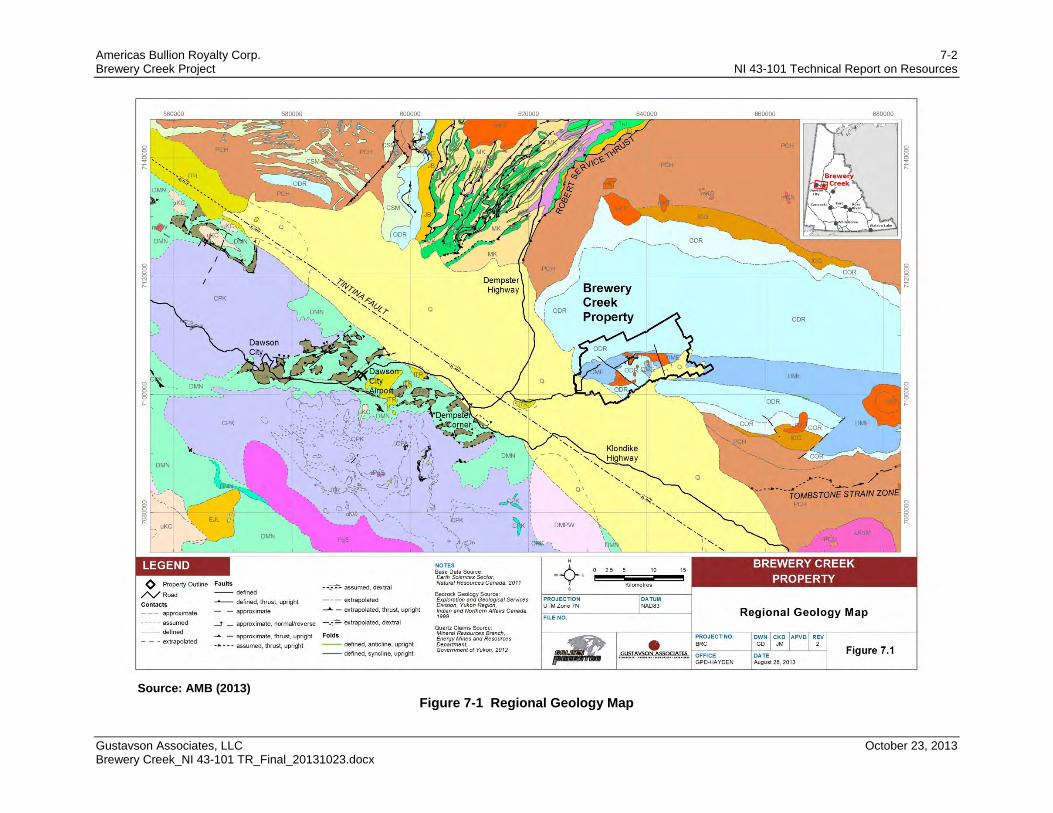
Americas Bullion Royalty Corp. 7-2 Brewery Creek Project NI 43-101 Technical Report on Resources
Gustavson Associates, LLC October 23, 2013 Brewery Creek_NI 43-101 TR_Final_20131023.docx
Source: AMB (2013)
Figure 7-1 Regional Geology Map
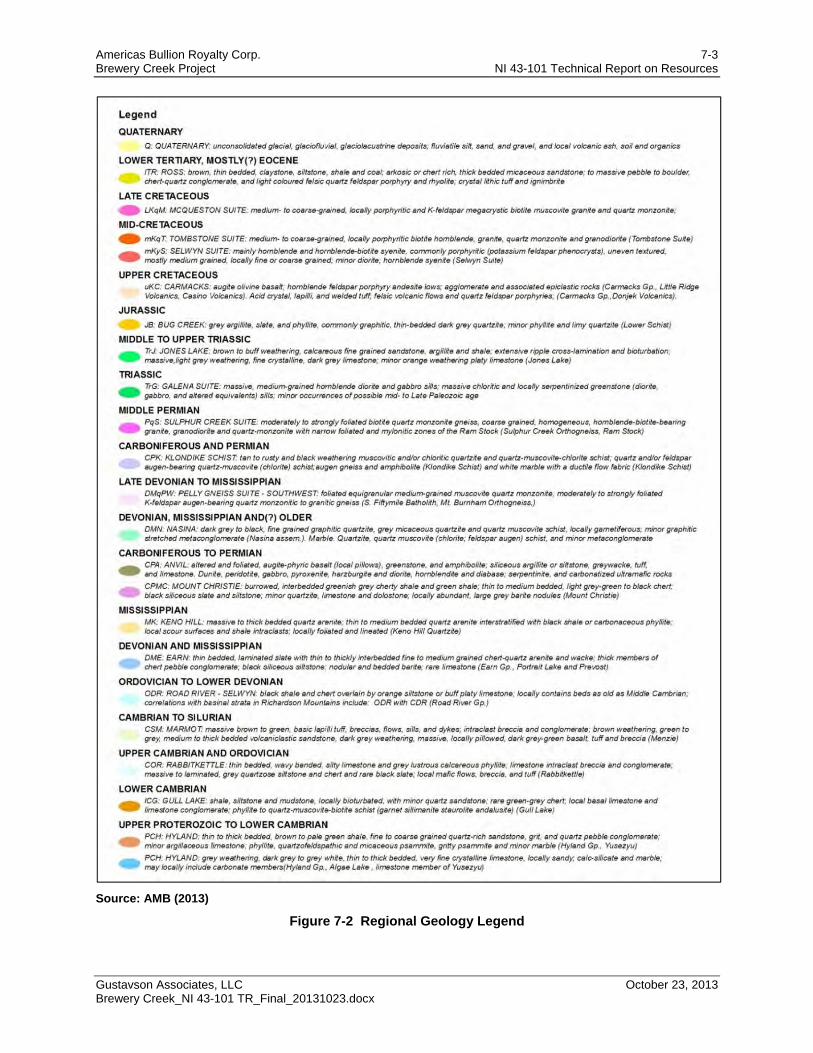
Americas Bullion Royalty Corp. 7-3 Brewery Creek Project NI 43-101 Technical Report on Resources
Gustavson Associates, LLC October 23, 2013 Brewery Creek_NI 43-101 TR_Final_20131023.docx
Source: AMB (2013)
Figure 7-2 Regional Geology Legend
Americas Bullion Royalty Corp. 7-4 Brewery Creek Project NI 43-101 Technical Report on Resources
Gustavson Associates, LLC October 23, 2013 Brewery Creek_NI 43-101 TR_Final_20131023.docx
7.2 Local and Property Geology
Metasedimentary rocks within the property boundary are composed of Rabbitkettle Formation (Cambrian-Ordovician) calcareous phyllite overlain by Road River Group (Ordovician-Silurian) volcanic rocks and off-shelf sedimentary rocks and Earn Group (Lower Devonian) siliciclastic rocks. Throughout most of the property, Cretaceous monzonite and quartz monzonite intrudes Earn Group and Road River Group stratigraphy as a series of semi-conformable sills along a 15 km strike length. Cretaceous (91 Ma), Tombstone Suite biotite monzonite and syenite stock-like bodies occur locally in the south-central part of the property. Sill emplacement is primarily controlled by a tectonized, graphitic argillite at the contact between the Earn and Road River Groups. This contact is also the locus of NNE-directed thrust faulting that has placed thin (<150 metres thick) sequences of Silurian siltstone against Devonian siliciclastic rocks. The age of thrusting is probably related to the earliest Cretaceous movement on the Tombstone Thrust.
A property geology plan and a legend are shown respectively in Figure 7-3 and Figure 7-4.
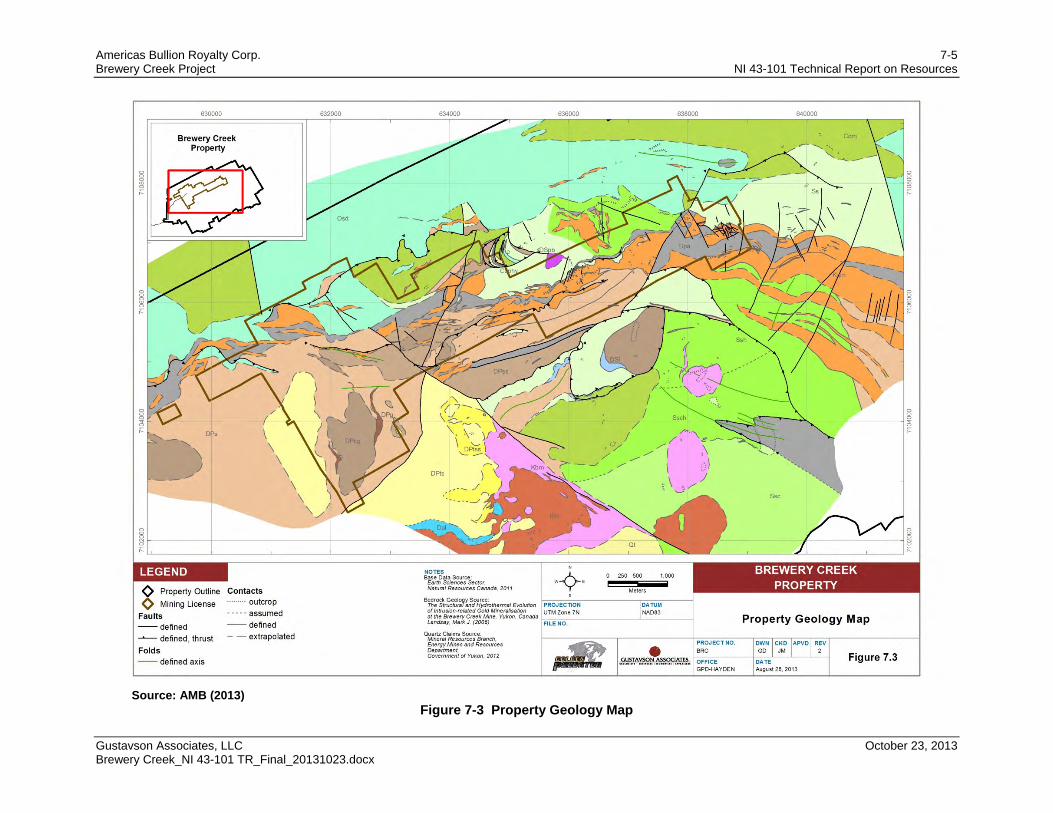
Americas Bullion Royalty Corp. 7-5 Brewery Creek Project NI 43-101 Technical Report on Resources
Gustavson Associates, LLC October 23, 2013 Brewery Creek_NI 43-101 TR_Final_20131023.docx
Source: AMB (2013)
Figure 7-3 Property Geology Map
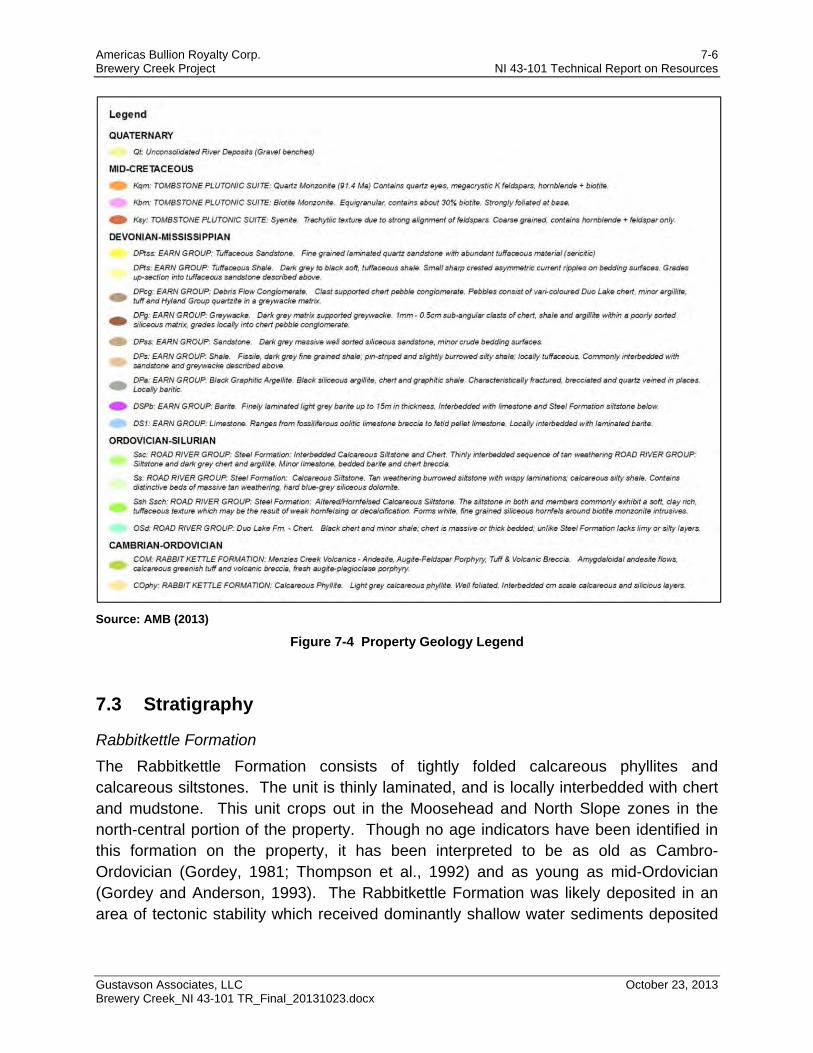
Americas Bullion Royalty Corp. 7-6 Brewery Creek Project NI 43-101 Technical Report on Resources
Gustavson Associates, LLC October 23, 2013 Brewery Creek_NI 43-101 TR_Final_20131023.docx
Source: AMB (2013)
Figure 7-4 Property Geology Legend
7.3 Stratigraphy
Rabbitkettle Formation
The Rabbitkettle Formation consists of tightly folded calcareous phyllites and calcareous siltstones. The unit is thinly laminated, and is locally interbedded with chert and mudstone. This unit crops out in the Moosehead and North Slope zones in the north-central portion of the property. Though no age indicators have been identified in this formation on the property, it has been interpreted to be as old as Cambro-Ordovician (Gordey, 1981; Thompson et al., 1992) and as young as mid-Ordovician (Gordey and Anderson, 1993). The Rabbitkettle Formation was likely deposited in an area of tectonic stability which received dominantly shallow water sediments deposited
Americas Bullion Royalty Corp. 7-7 Brewery Creek Project NI 43-101 Technical Report on Resources
Gustavson Associates, LLC October 23, 2013 Brewery Creek_NI 43-101 TR_Final_20131023.docx
at low energy. Lindsey (2006) observed local cross-lamination and graded bedding suggesting the formation is upright.
Menzie Creek Volcanics
The Menzie Creek Volcanics consist of medium grained, chlorite and carbonate altered dolerite and basalt, hyaloclastic breccias and mafic volcaniclastic rocks. The Menzie Creek rocks lie unconformably over the Rabbitkettle Formation, and are overlain by the Steel Formation. Though no determination of age has been made for the Menzie Creek Volcanics, Diment and Craig (1999) suggest a late Cambrian to early Ordovician age.
Road River Group
This stratigraphic unit is exposed throughout the Project area and is typically found along the northern portion of the property. It is made up of wispy laminated calcareous siltstones and massive chert conformably overlying the Rabbitkettle Formation. The Group is subdivided into the older Duo Lake Formation and the younger Steel Formation (Cecile, 1982).
Steel Formation
The Steel Formation is seen throughout the Property. This unit defines the top of the Road River group, and, may have acted as a focus of intrusion emplacement between overlying Earn Group rocks and underlying Road River rocks. The Steel Formation consists of wispy laminated siltstone with burrow marks, and interbeds of graphitic shales. Conodont assemblages in the Steel Formation have been identified as Silurian to early Devonian in age (Norford and Poulton, 1995). The formation also contains what appear to be turbidite sequences, or storm shelf debris flows which may have been formed during a period of rifting.
Earn Group
The youngest package of sedimentary rocks on the property is the Earn Group which unconformably overlies the Road River Group and represents platform, or shelf, marine sediments. The package is the primary host to the BCRT. This unit is composed of graphitic argillites, graphitic siltstones and argillite with lesser amounts of sandstone, greywacke, and chert-pebble conglomerate. Interbedded within the Earn Group, are black limestones and barite horizons. No age determinations have been made for the Earn Group strata, but Campbell (1967) suggests that deposition of this unit extended from the Devonian through the early Carboniferous. It is likely that the Earn Group was formed in an area of tectonic stability during periods of ocean transgressions and regressions.
Americas Bullion Royalty Corp. 7-8 Brewery Creek Project NI 43-101 Technical Report on Resources
Gustavson Associates, LLC October 23, 2013 Brewery Creek_NI 43-101 TR_Final_20131023.docx
7.3.1 Intrusive Rocks
The majority of the gold mineralization at the Brewery Creek Project is hosted within mid-Cretaceous, felsic intrusive rocks of the Tombstone Plutonic Suite. The intrusive rocks are exposed along an east-northeasterly striking structural zone over a distance of 15 km along strike and 0.5-2.0 km perpendicular to strike. Several compositional and textural phases have been mapped in drill core and drill cuttings. The older intrusive phases are emplaced parallel, or sub-parallel, to sedimentary bedding and along thrust faults often resulting in sill-like geometries, while the younger intrusive phases are present as dikes and small stocks distinctly discordant to the country rock. The sill complexes are the main host for gold mineralization, while the younger discordant intrusives host lower grade gold mineralization. The thickness of the individual sills and the entire sill complex varies across the property from 100’s of metres in the southeast (Sleeman area) to 10’s of metres in the northwest (Pacific area). Some thicker sill complexes host volumetrically greater amounts of gold mineralization (Kokanee-Golden; Bohemian-Schooner areas).
The oldest intrusive rocks in the area are a series of monzonite and quartz monzonite sills. These rocks are fine to medium grained with textures ranging from equigranular to porphyritic. Phenocryst assemblages are comprised of variable amounts of biotite (5-30%), orthoclase (40-55%), plagioclase (30-40%) with minor quartz and hornblende. Biotite and orthoclase are commonly euhedral with phenocrysts ranging from 1-3 mm for biotite and 3-20 mm in diameter for orthoclase. Large, zoned megacrysts of orthoclase with biotite inclusions are common in the southeastern portion of the property. Plagioclase is commonly subhedral with phenocrysts ranging from 3-10 mm in diameter. Xenoliths of black argillite are common in these rocks.
Sedimentary rocks on the margins of the sills are commonly strongly sheared suggesting that the sills followed older, low-angle structures. Locally, clasts of monzonite are incorporated into the shear zones defining a component of post-sill emplacement deformation. U/Pb isotopic dating of zircon from these monzonites yield an age of 91.4 Ma ± 0.2, similar to other Tombstone Suite intrusions in the region.
In the Sleeman area, younger monzonite dikes cut the older intrusions. The dikes are biotite bearing with no free quartz or hornblende and have a much finer grained texture than the older intrusive rocks. Where these dikes are altered, the feldspars have been converted to clay and biotite has been converted to white mica/clay.
South of the main sill complex are small stocks of biotite monzonite and syenite that intrude Road River Group and Earn Group sedimentary rocks. These intrusions are relatively coarse-grained with equigranular to porphyritic/pegmatitic textures. The stocks crosscut sedimentary bedding and local tremolite-epidote-diopside-garnet-skarn
Americas Bullion Royalty Corp. 7-9 Brewery Creek Project NI 43-101 Technical Report on Resources
Gustavson Associates, LLC October 23, 2013 Brewery Creek_NI 43-101 TR_Final_20131023.docx
is developed marginal to the intrusive rocks. These intrusions host gold mineralization in the Classic area.
7.4 Structural Geology
Paleozoic metasedimentary strata at the Brewery Creek Project form a homoclinal sequence that strikes approximately 070° azimuth and dips moderately southeast. The sequence displays tectonic fabrics and geometries that indicate polyphase deformation including thrust faults that strike approximately parallel to stratigraphy and accompanying folds. Earlier workers describe multiple generations and orientations of folding (Lindsay, 2006; Diment and Simpson, 2009); work completed by AMB has not verified these features. At least three orientations of high-angle faults formed subsequent to thrust faulting. Many of the fault sets described below, influence or control the distribution of mineralization.
7.4.1 Thrust Faults
Stratigraphic repetitions best define the positions of thrust faults at the Brewery Creek Project. Many were mapped by earlier workers along the main area of mineralization (Diment and Simpson, 2009). The faults generally strike east-northeast (±070° AZ), dip moderately southeast, and commonly place siltstone of the Steele formation above variably graphitic and locally baritic argillite of the Earn group. Graphitic argillite typically occurs within and along the fault zones and defines the zone of displacement. The argillites typically display well developed tectonic fabrics.
Regional work by Murphy (1997) shows that thrust faulting took place between late Jurassic and mid-Cretaceous time based on the age of the youngest stratigraphy cut by the thrust faults and a 142 ±6 ma date on muscovite in the Tombstone Strain Zone, a cross cutting structural feature. The Jurassic date is consistent with thrust faults mapped regionally in the Brooks Range (Plafker, 1994).
The Brewery Creek Project sill complex intrudes and lies concordant within proximity to the thrust faults but shows no evidence of thrust faulting. Apparently, these sills are younger than the latest movement on the faults and appear to have utilized them as an intrusive plumbing system.
7.4.2 High-Angle Faults
At least three orientations of high-angle faults occur at the Brewery Creek Project, one set strikes northeast, another strikes northwest, and the other east-northeast; all are steeply dipping. The northeast and northwest striking sets show a strong component of strike displacement and commonly displace mineralization. The east-northeast striking structures show primarily normal displacement.
Americas Bullion Royalty Corp. 7-10 Brewery Creek Project NI 43-101 Technical Report on Resources
Gustavson Associates, LLC October 23, 2013 Brewery Creek_NI 43-101 TR_Final_20131023.docx
Northwesterly striking structures generally have a strike azimuth of approximately 330° and are near vertically dipping. Relations visible in the Kokanee open pit, show dextral displacement of mineralization. They commonly have local displacements of 3-10 metres; however, field relations suggest overall displacement up to a few hundred metres. Lindsay (2006) suggests dextral movement along the 300° striking Classic Fault could have produced 1.5 km of dextral displacement.
North-easterly striking structures have azimuths of 020° to 030° and are generally near vertical dip. Fault fabrics indicate that the primary sense of displacement is strike-slip. Where confirmed by local outcrop relations, they show sinistral displacement. The magnitude of total displacement is difficult to interpret since they generally strike semi-parallel to the lithologies and mineralized zones.
East-Northeast striking faults occur throughout the district. They generally have an azimuth of 070° and dip steeply to the northwest. Outcrop relationships in the Kokanee open pit show that they are normal faults that displace rocks down to the north-northwest. Displacement is generally small; where observed in outcrop, less than 10m. Closely spaced joint sets commonly parallel these faults.
Tectonic fabrics within fault zones exposed in outcrop demonstrate that the northeast and northwest structures were co-active, and their strikes are consistent with a conjugate set. These faults cut the sill complex representing the most recent movement subsequent to sill intrusion at approximately 90 to 92 MA. Minor and small-scale quartz-sulfide veinlets and stockworks with 330° azimuths were observed in the hanging wall of a northeast-striking fault in the Golden deposit, suggesting that the 330° AZ orientation was active during mineralization. No major mineralized zones, except Classic and possibly Lone Star, follow the northwest orientation, indicating that, though active, it was not strongly dilatant during mineralization. Several large deposits and mineralized zones, including parts of the Kokanee and Golden deposits, follow mapped northeast-striking faults, indicating that the northeast orientation was active and strongly dilatant during mineralization. The northwest-striking faults show the greatest amount of post-mineralization displacement.
7.5 Significant Mineralized Zones
Historical production on the property occurred along the historical BCRT. The Brewery Creek District consists of numerous deposits, mineralized zones and past producing deposits both along this trend as well as within peripheral mineralized areas. Past producing areas within the BCRT include the Pacific, Blue, Canadian, Upper Fosters, and Kokanee, Golden and Lucky deposits. Additional to these, Mineral Resources have been defined for the Big Rock West, Big Rock East, Lower Fosters, Bohemian and Schooner deposits along the BCRT; the North Slope deposit north of the BCRT;
Americas Bullion Royalty Corp. 7-11 Brewery Creek Project NI 43-101 Technical Report on Resources
Gustavson Associates, LLC October 23, 2013 Brewery Creek_NI 43-101 TR_Final_20131023.docx
Sleeman deposit east of the BCRT, and the Classic and Lone Star deposits south of the BCRT. Mineralized areas peripheral to the BCRT, including Moosehead, have not been considered for the purposes of this report. Figure 7-5 shows the locations of the significant mineralized zones.
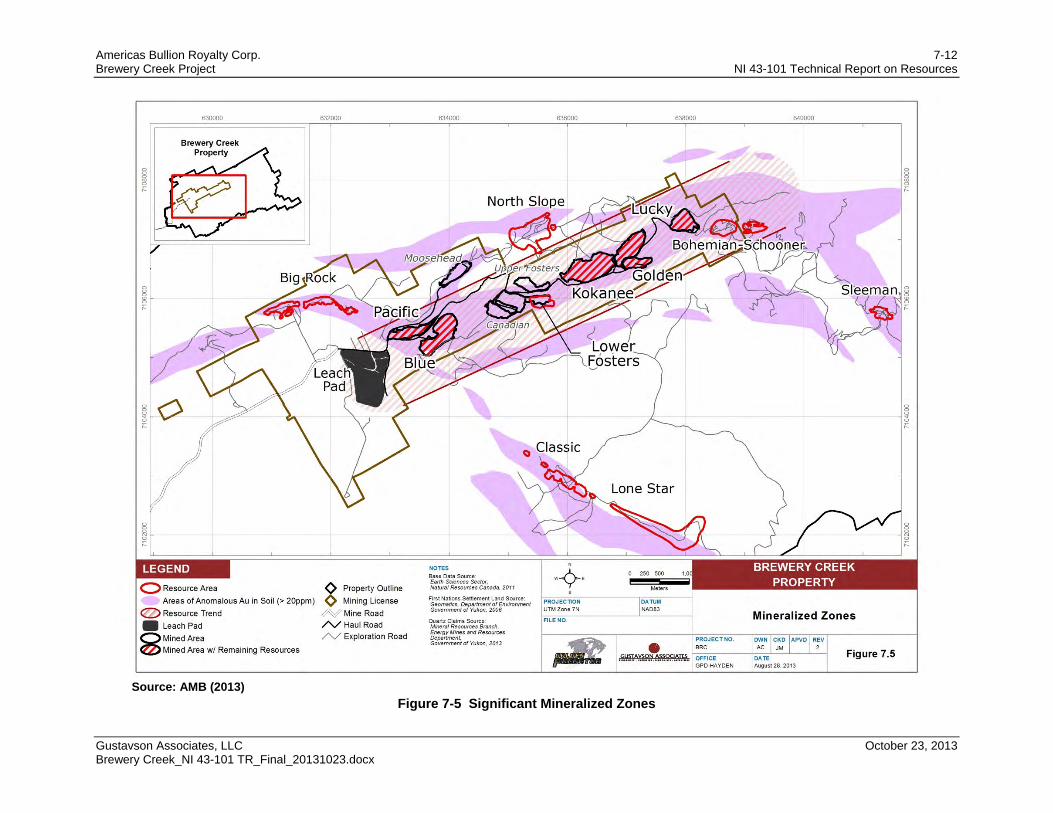
Americas Bullion Royalty Corp. 7-12 Brewery Creek Project NI 43-101 Technical Report on Resources
Gustavson Associates, LLC October 23, 2013 Brewery Creek_NI 43-101 TR_Final_20131023.docx
Source: AMB (2013)
Figure 7-5 Significant Mineralized Zones
Americas Bullion Royalty Corp. 7-13 Brewery Creek Project NI 43-101 Technical Report on Resources
Gustavson Associates, LLC October 23, 2013 Brewery Creek_NI 43-101 TR_Final_20131023.docx
7.5.1 Kokanee
The Kokanee deposit was mined by Viceroy from four pits; all pits were partially backfilled. The southern two pits remain mostly open while the northern two are almost entirely backfilled and reclaimed. The deposit is centrally located along the BCRT and formed in the thickest and most extensive part of the Cretaceous quartz monzonite sill complex. The deposit is defined by 31 core holes and 506 RC holes, totaling 29,654 metres. The deposit is ~1100 metres in length, ~40 metres wide, and ~190 metres down dip.
Mineralized material at Kokanee occurs primarily in the quartz monzonite sill complex and subordinately in siltstone and argillite. Observations of mineralized material exposed in pit walls shows millimetre-scale veinlets with iron-oxide ± quartz fillings. The mineralized quartz monzonite typically contains several percent of evenly disseminated oxidized pyrite.
Drill logs indicate alteration of the K-feldspar component of quartz monzonite to white clay. Locally developed auriferous sheeted quartz veins were noted in pit highwalls. Pervasive silicification occurs locally, but is not common.
7.5.2 Golden
The Golden deposit lies immediately east of Kokanee and may be a faulted offset of Kokanee. It was mined by Viceroy from 4 pits; three were backfilled and reclaimed, the lowest and farthest south pit was not backfilled and remains in its fully mined state. The deposit is defined by 19 core holes and 363 RC holes, totaling 21,251 metres. The deposit is ~950 metres in length, ~30 metres wide, and ~150 metres down dip.
Golden, like Kokanee, is hosted by the thickest and most extensive part of the Cretaceous quartz monzonite sill complex. It is a nearly identical system structurally, and the styles of alteration identical. Both of these resource areas show a bi-directionality to the strike direction of the highest grade material, one northeast and the other northwest trending, forming a conjugate pattern.
The K-feldspar component of quartz monzonite, both phenocryst and groundmass are altered to white clay. Locally developed auriferous sheeted quartz veins and seams filled with oxidized Fe were noted in pit highwalls. Pervasive silicification occurs locally, but is not common. The most pervasively developed alteration occurs along faults with orientations similar to the distribution of higher grade material, suggesting that these structures were hydrothermal fluid conduits.
Americas Bullion Royalty Corp. 7-14 Brewery Creek Project NI 43-101 Technical Report on Resources
Gustavson Associates, LLC October 23, 2013 Brewery Creek_NI 43-101 TR_Final_20131023.docx
7.5.3 Pacific
The Pacific deposit was mined by Viceroy; the pit was not backfilled, and remains in its fully mined state. Pacific lies along the Reserve Trend, immediately east of the Classic Fault. The deposit is defined by 17 core holes and 80 RC holes, totaling 6,966 metres. The deposit is ~500 metres in length, ~50 metres wide, and ~300 metres down dip.
Pacific is the only deposit in the district that is hosted primarily by lower Paleozoic siltstone. Mineralization is generally tabular and follows a combination of shallow south dipping bedding and high-angle BCRT-parallel faults. Higher grade parts of the deposit are steeper along these faults. The deposit has been segmented by several post-mineralization northwest-trending dextral faults.
Observations of mineralized material exposed in pit walls shows millimetre-scale veinlets with iron-oxide ±quartz fillings. One occurrence was noted of a pervasively silicified breccia at the intersection of a northeast-trending and a northwest-trending set of faults. The breccia contains angular fragments of silicified siltstone in a quartz matrix.
7.5.4 Blue
The Blue deposit was mined by Viceroy, and the pit was partially backfilled and reclaimed. Blue lies directly east of the Pacific deposit along the BCRT. A fault separates the two deposits; one possible restoration of displacement suggests that the two deposits may have been a single mineralizing system. The deposit is defined by 26 core holes and 113 RC holes, totaling 8,149 metres. The deposit is ~560 metres in length, ~45 metres wide, and ~200 metres down dip.
Blue is hosted primarily by Cretaceous quartz monzonite and subordinately by lower Paleozoic siltstone. Mineralization is generally tabular and follows the strike and dip of the sill complex. Unlike Pacific, the primary strike of the deposit lies along a series of northeast-trending faults. A strong discontinuity in stratigraphy, sill development, and mineralization occurs at the eastern end of the deposit. An area of poorly defined mineralization occurs immediately southeast of the deposit, suggesting a possible post-mineralization offset of the deposit along a northwest trending fault.
Drill logs indicate that alteration of the quartz monzonite includes strong white clay development after K-feldspar phenocrysts and groundmass, and locally developed auriferous sheeted quartz veins. Pervasive silicification is noted locally, but is not common.
7.5.5 Lucky
The Lucky pit was mined by Viceroy, partially backfilled and reclaimed. The deposit occupies the northeastern-most segment of the BCRT. It is situated immediately west of the Bohemian-Schooner deposits and northeast of the Golden deposit. The Lucky
Americas Bullion Royalty Corp. 7-15 Brewery Creek Project NI 43-101 Technical Report on Resources
Gustavson Associates, LLC October 23, 2013 Brewery Creek_NI 43-101 TR_Final_20131023.docx
deposit is defined by 169 RC drillholes and 3 diamond drillholes, totaling 11,240 m. The deposit is ~550 metres in length, ~50 metres wide, and ~360 metres down dip.
Altered Cretaceous quartz monzonite that intrudes lower Earn Group sedimentary rocks host mineralized material at Lucky, similar to that at Bohemian-Schooner. Dominant mineralized trends typically strike 035° or 060° and dip moderately (-25 to -45) to the southeast. Mineralized material in the hanging wall is abruptly terminated to the northwest by Steel-formation sedimentary rocks at the footwall contact of a major 040° trending fault.
7.5.6 Bohemian-Schooner
The Bohemian-Schooner deposit and surrounding mineralized area was originally discovered by soil sampling, trenching and drilling in the 1990’s by Viceroy. The area remains unmined and is defined by 129 reverse-circulation drillholes and 122 core drillholes, totaling 23,385 metres. A linear distance of approximately 7 km separates the zone from the old heap leach pad. The Bohemian deposit is ~520 metres in length, ~50 metres wide, and ~160 metres down dip. The Schooner deposit is ~450 metres in length, ~50 metres wide, and ~160 metres down dip.
A sill complex at Bohemian/Schooner hosts the majority of mineralization. It intrudes a section of siltstones of the Steele Formation and interleaved, structurally dismembered carbonaceous argillite of unknown affinity. The composite strike length of the sill complex is over 1 km oriented east-west, dipping 5° to 10° to the south. A prominent high-angle east-west striking structural zone traverses the entire length of the area. Sills occur on both sides of the structure and are displaced down to the north across it. The sills are thickest along the structure, indicating that it may have localized the intrusions. Higher grade parts of the resource also align along this structure.
A large fault with a 330° strike azimuth lies between the Bohemian-Schooner resource area and the formerly mined Lucky deposit to the west. Sporadic mineralization and isolated drill intercepts in the intervening area between these two areas indicates that they may have been contiguous prior to faulting. If so, the fault would have a total displacement of over 250 metres. Alternatively, if the fault displaced farther, the Bohemian/Schooner resource could have aligned with the eastern extension of the Big Rock - North Slope trend. Much of the section at Bohemian/Schooner consists of siltstone of the Steel Formation, also suggesting a possible affinity with the North Slope mineralized zone.
Gold mineralization at Bohemian/Schooner occurs primarily in clay-altered quartz monzonite sills and subordinately in adjacent siltstone. It occurs most commonly in association with strong argillic altered and locally silicified quartz monzonite. Sheeted

Americas Bullion Royalty Corp. 7-16 Brewery Creek Project NI 43-101 Technical Report on Resources
Gustavson Associates, LLC October 23, 2013 Brewery Creek_NI 43-101 TR_Final_20131023.docx
and stockwork mm- to cm-scale quartz-pyrite-arsenopyrite veins, commonly forming conjugate patterns in detail, cut the altered intrusion and occur in association with higher grade zones.
7.5.7 Canadian-Fosters
The Fosters mineralized resource area includes only the un-mined Lower Fosters deposit which lies approximately 3.5 km from the current heap leach pad. The Upper Fosters and Canadian deposits have been mined historically and are not part of this Mineral Resource. The area is defined by 392 reverse-circulation drillholes and 40 core holes, totaling 19,550 metres of drilling. Numerous blastholes were drilled within the historical pits for which location and analytical data exists. The Lower Fosters deposit (the only part of the complex reported in this study) is ~550 metres in length, ~30 metres wide, and ~260 metres down dip.
A large sill complex extends throughout the Fosters-Canadian area and hosts most of the known mineralization. It has a strike length of at least 1.2 km and a down-dip extent of at least 500 metres. It strikes 070° azimuth and dips approximately 20° southeast. The sill complex contains large interleaves of sedimentary strata and splits into a complex array of individual sills along strike and dip.
Several faults traverse the area. Modeling shows that a 330° AZ fault offsets the western extension of the Canadian deposit, and a 020° AZ Fault separates the Canadian deposit from the Lower Foster’s deposit. Logged gouge zones in several holes along the northernmost known extent of the sill complex indicates that a major 070° AZ fault may offset the down dip continuation below the Lower Fosters resource.
Logs of reverse circulation drillholes indicate that mineralization is associated with clay alteration, presumably from the destruction of K-feldspar minerals. According to Diment and Simpson (2009), mineralization is associated with pervasive phyllic and locally intense argillic alteration. The feldspars alter to an assemblage of sericite, illite and kaolinite. Fine pyrite and arsenopyrite occur in association with secondary quartz. Gold occurs primarily in the limonite-altered quartz monzonite and subordinately in sedimentary strata that lie adjacent to the intrusions.
7.5.8 West and East Big Rock
The West and East Big Rock deposits are the farthest west known occurrence in the district and are located approximately 1.2 km from the current heap leach pad. They were discovered in the early 1990’s by Viceroy Gold by soil sampling and trenching. The two zones were first drilled in 1991; most of the drilling was carried out between 1994 and 1998. The deposits are defined by 213 reverse-circulation rotary holes, and 69 core holes, totaling 22,288 metres of drilling. The West Big Rock deposit is ~650
Americas Bullion Royalty Corp. 7-17 Brewery Creek Project NI 43-101 Technical Report on Resources
Gustavson Associates, LLC October 23, 2013 Brewery Creek_NI 43-101 TR_Final_20131023.docx
metres in length, ~30 metres wide, and ~220 metres down dip. The East Big Rock deposit is ~640 metres in length, ~30 metres wide and ~180 metres down dip.
Mineralization occurs primarily in limonite-altered quartz monzonite sills and subordinately in adjacent siliciclastic sedimentary strata. Big Rock sills strike 070° azimuth and dip between 40 and 45 degrees southeast and have a drill-defined strike length of approximately 1.5 km. The eastern part of the sill complex and deposit are truncated by the Classic fault, or a splay. Lindsay (2006) suggests that Big Rock mineralization is a westerly continuation of the BCRT that is displaced approximately 1.5 km to the northwest by the Classic Fault. An alternate interpretation is that these deposits represent the westerly continuation of a mineralized trend which parallels the BCRT to the northwest, between the Big Rock resources and the North Slope mineralized zones. No other faults were mapped or modeled in the Big Rock resource area.
The reverse-circulation drilling chip logs show that gold mineralization occurs primarily in clay-altered quartz monzonite. Much of the zone is oxidized, and the location of oxidation from surface down suggests that it resulted from supergene processes. The distribution of elevated gold values with respect to sill-form intrusions suggest that lithology, and perhaps rock rheology was a primary control on mineralization.
7.5.9 Classic
The Classic deposit is located approximately 3 km south of the main BCRT, 7 km west of the Sleeman deposit and 4 km south of the old heap leach pad. Discovered originally in 1991 (Hemlo Gold Mines Inc.-Loki Gold Corporation) through a southern grid expansion, the Classic Zone was then being classified as an isolated, arsenic gold anomaly. To date, the Classic deposit remains poorly understood with current interpretations based on the underlying pluton and faulting. It is currently defined by 52 reverse-circulation drillholes and 17 core holes, totaling 13,478 metres. The currently identified mineralization lies entirely on the southwest side of the Classic fault. The deposit is ~1400 metres in length, ~30 metres wide, and ~240 metres down dip.
Predominant rock units hosting mineralization contain variable percentages of syenite (alkali) and biotite monzonite (increasing plagioclase). Mineralization is found to exist within centimetre-scale sheeted quartz veinlets. Structurally, the Classic zone is open at depth and in both directions along strike. Cutting across the eastern portion is the northwest trending and steeply south west dipping Classic fault which is mapped to be post intrusion and post mineralization. A similar intrusive complex which displays altered mineralization akin to the Classic is mapped within the footwall of the Classic fault with a dextral offset of 1.5 km (Lindsay, 2006) to the southeast.
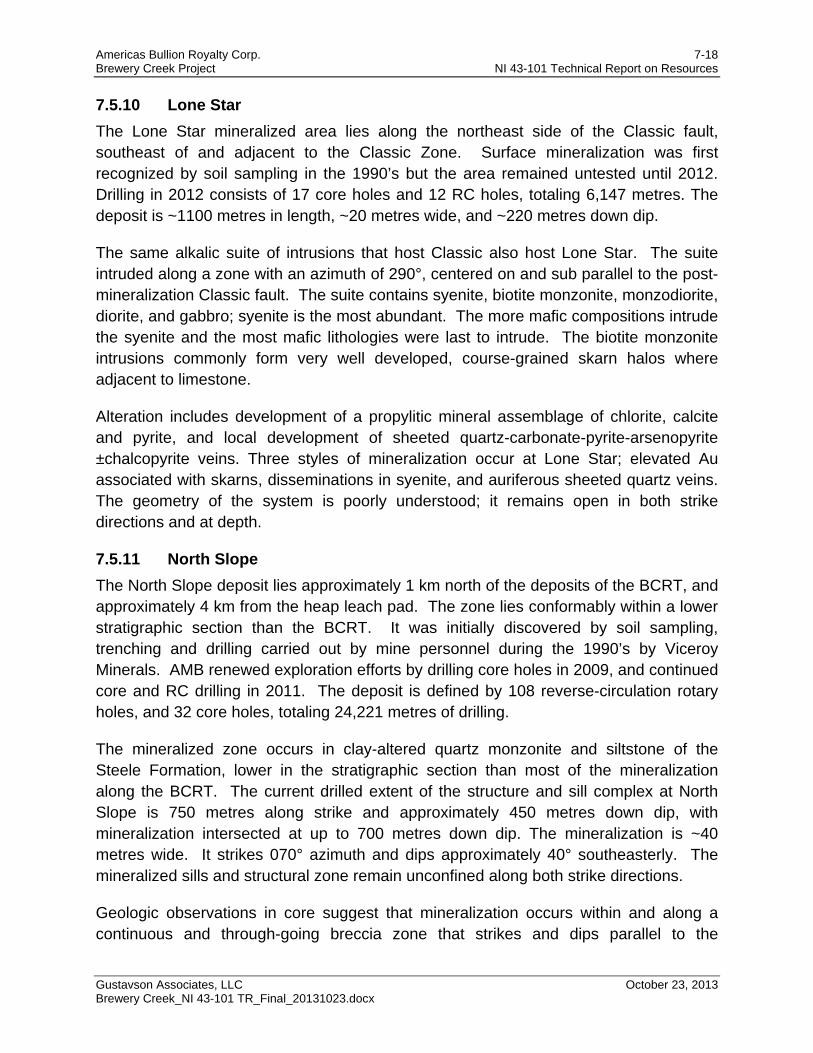
Americas Bullion Royalty Corp. 7-18 Brewery Creek Project NI 43-101 Technical Report on Resources
Gustavson Associates, LLC October 23, 2013 Brewery Creek_NI 43-101 TR_Final_20131023.docx
7.5.10 Lone Star
The Lone Star mineralized area lies along the northeast side of the Classic fault, southeast of and adjacent to the Classic Zone. Surface mineralization was first recognized by soil sampling in the 1990’s but the area remained untested until 2012. Drilling in 2012 consists of 17 core holes and 12 RC holes, totaling 6,147 metres. The deposit is ~1100 metres in length, ~20 metres wide, and ~220 metres down dip.
The same alkalic suite of intrusions that host Classic also host Lone Star. The suite intruded along a zone with an azimuth of 290°, centered on and sub parallel to the post-mineralization Classic fault. The suite contains syenite, biotite monzonite, monzodiorite, diorite, and gabbro; syenite is the most abundant. The more mafic compositions intrude the syenite and the most mafic lithologies were last to intrude. The biotite monzonite intrusions commonly form very well developed, course-grained skarn halos where adjacent to limestone.
Alteration includes development of a propylitic mineral assemblage of chlorite, calcite and pyrite, and local development of sheeted quartz-carbonate-pyrite-arsenopyrite ±chalcopyrite veins. Three styles of mineralization occur at Lone Star; elevated Au associated with skarns, disseminations in syenite, and auriferous sheeted quartz veins. The geometry of the system is poorly understood; it remains open in both strike directions and at depth.
7.5.11 North Slope
The North Slope deposit lies approximately 1 km north of the deposits of the BCRT, and approximately 4 km from the heap leach pad. The zone lies conformably within a lower stratigraphic section than the BCRT. It was initially discovered by soil sampling, trenching and drilling carried out by mine personnel during the 1990’s by Viceroy Minerals. AMB renewed exploration efforts by drilling core holes in 2009, and continued core and RC drilling in 2011. The deposit is defined by 108 reverse-circulation rotary holes, and 32 core holes, totaling 24,221 metres of drilling.
The mineralized zone occurs in clay-altered quartz monzonite and siltstone of the Steele Formation, lower in the stratigraphic section than most of the mineralization along the BCRT. The current drilled extent of the structure and sill complex at North Slope is 750 metres along strike and approximately 450 metres down dip, with mineralization intersected at up to 700 metres down dip. The mineralization is ~40 metres wide. It strikes 070° azimuth and dips approximately 40° southeasterly. The mineralized sills and structural zone remain unconfined along both strike directions.
Geologic observations in core suggest that mineralization occurs within and along a continuous and through-going breccia zone that strikes and dips parallel to the
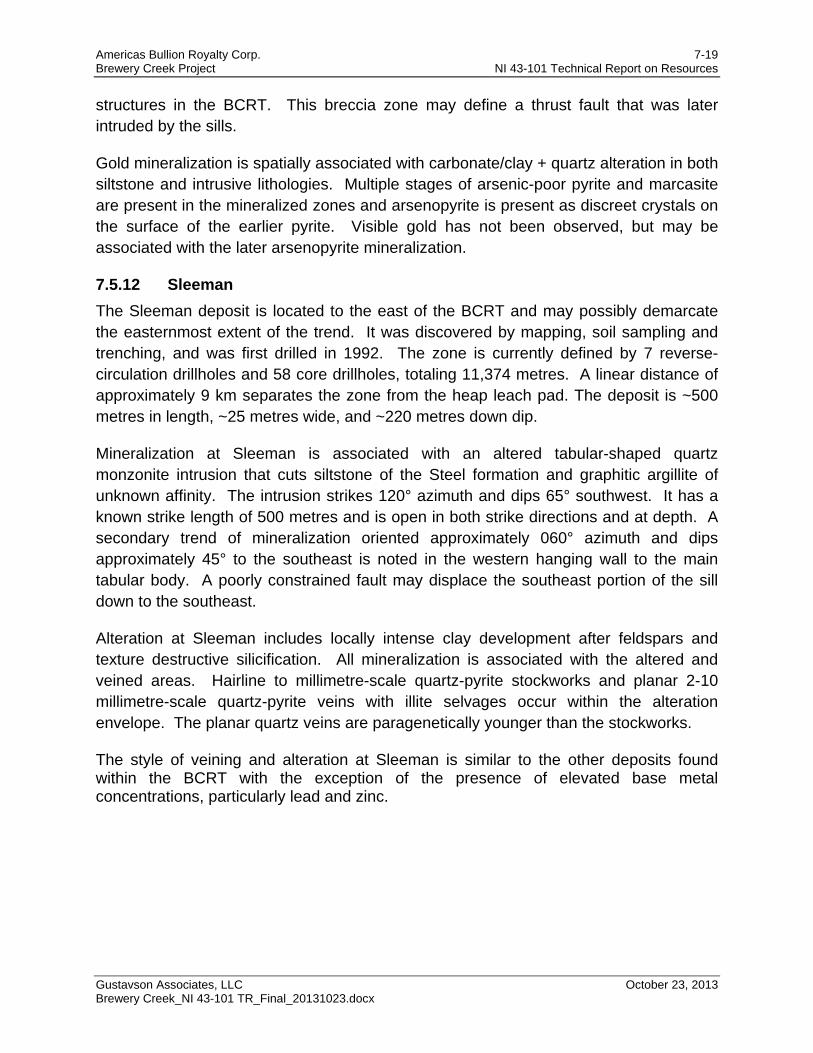
Americas Bullion Royalty Corp. 7-19 Brewery Creek Project NI 43-101 Technical Report on Resources
Gustavson Associates, LLC October 23, 2013 Brewery Creek_NI 43-101 TR_Final_20131023.docx
structures in the BCRT. This breccia zone may define a thrust fault that was later intruded by the sills.
Gold mineralization is spatially associated with carbonate/clay + quartz alteration in both siltstone and intrusive lithologies. Multiple stages of arsenic-poor pyrite and marcasite are present in the mineralized zones and arsenopyrite is present as discreet crystals on the surface of the earlier pyrite. Visible gold has not been observed, but may be associated with the later arsenopyrite mineralization.
7.5.12 Sleeman
The Sleeman deposit is located to the east of the BCRT and may possibly demarcate the easternmost extent of the trend. It was discovered by mapping, soil sampling and trenching, and was first drilled in 1992. The zone is currently defined by 7 reverse-circulation drillholes and 58 core drillholes, totaling 11,374 metres. A linear distance of approximately 9 km separates the zone from the heap leach pad. The deposit is ~500 metres in length, ~25 metres wide, and ~220 metres down dip.
Mineralization at Sleeman is associated with an altered tabular-shaped quartz monzonite intrusion that cuts siltstone of the Steel formation and graphitic argillite of unknown affinity. The intrusion strikes 120° azimuth and dips 65° southwest. It has a known strike length of 500 metres and is open in both strike directions and at depth. A secondary trend of mineralization oriented approximately 060° azimuth and dips approximately 45° to the southeast is noted in the western hanging wall to the main tabular body. A poorly constrained fault may displace the southeast portion of the sill down to the southeast.
Alteration at Sleeman includes locally intense clay development after feldspars and texture destructive silicification. All mineralization is associated with the altered and veined areas. Hairline to millimetre-scale quartz-pyrite stockworks and planar 2-10 millimetre-scale quartz-pyrite veins with illite selvages occur within the alteration envelope. The planar quartz veins are paragenetically younger than the stockworks.
The style of veining and alteration at Sleeman is similar to the other deposits found within the BCRT with the exception of the presence of elevated base metal concentrations, particularly lead and zinc.
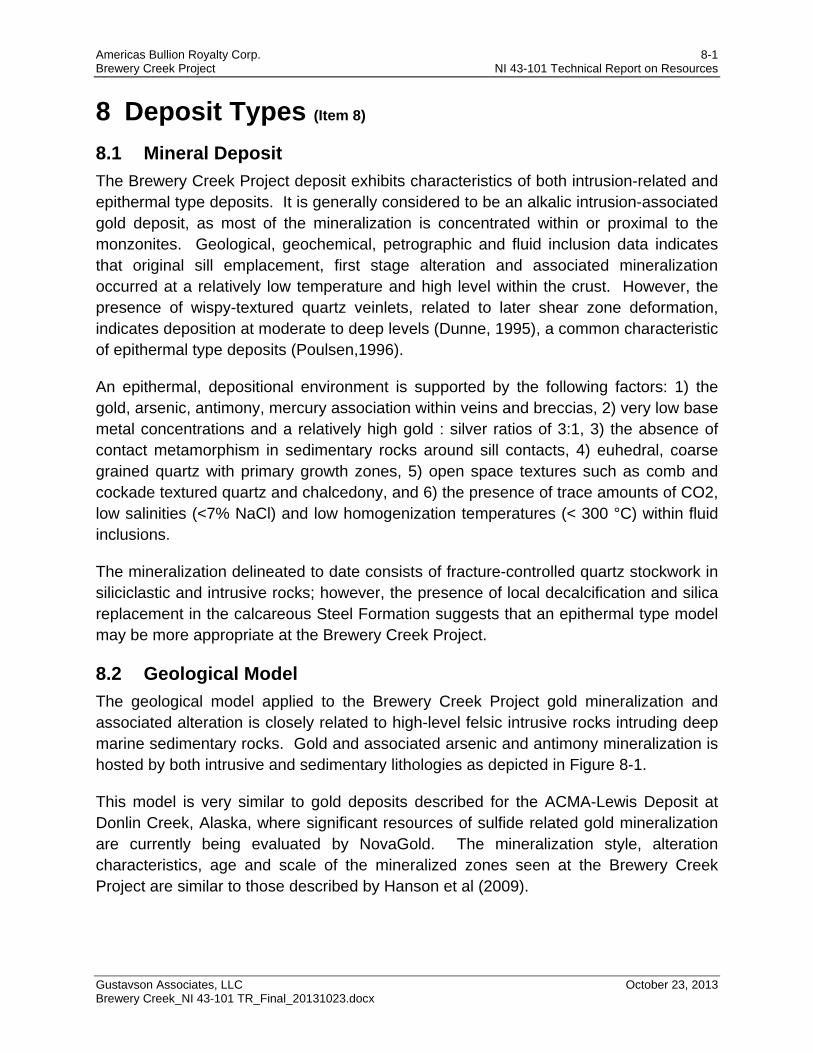
Americas Bullion Royalty Corp. 8-1 Brewery Creek Project NI 43-101 Technical Report on Resources
Gustavson Associates, LLC October 23, 2013 Brewery Creek_NI 43-101 TR_Final_20131023.docx
8 Deposit Types (Item 8)
8.1 Mineral Deposit
The Brewery Creek Project deposit exhibits characteristics of both intrusion-related and epithermal type deposits. It is generally considered to be an alkalic intrusion-associated gold deposit, as most of the mineralization is concentrated within or proximal to the monzonites. Geological, geochemical, petrographic and fluid inclusion data indicates that original sill emplacement, first stage alteration and associated mineralization occurred at a relatively low temperature and high level within the crust. However, the presence of wispy-textured quartz veinlets, related to later shear zone deformation, indicates deposition at moderate to deep levels (Dunne, 1995), a common characteristic of epithermal type deposits (Poulsen,1996).
An epithermal, depositional environment is supported by the following factors: 1) the gold, arsenic, antimony, mercury association within veins and breccias, 2) very low base metal concentrations and a relatively high gold : silver ratios of 3:1, 3) the absence of contact metamorphism in sedimentary rocks around sill contacts, 4) euhedral, coarse grained quartz with primary growth zones, 5) open space textures such as comb and cockade textured quartz and chalcedony, and 6) the presence of trace amounts of CO2, low salinities (<7% NaCl) and low homogenization temperatures (< 300 °C) within fluid inclusions.
The mineralization delineated to date consists of fracture-controlled quartz stockwork in siliciclastic and intrusive rocks; however, the presence of local decalcification and silica replacement in the calcareous Steel Formation suggests that an epithermal type model may be more appropriate at the Brewery Creek Project.
8.2 Geological Model
The geological model applied to the Brewery Creek Project gold mineralization and associated alteration is closely related to high-level felsic intrusive rocks intruding deep marine sedimentary rocks. Gold and associated arsenic and antimony mineralization is hosted by both intrusive and sedimentary lithologies as depicted in Figure 8-1.
This model is very similar to gold deposits described for the ACMA-Lewis Deposit at Donlin Creek, Alaska, where significant resources of sulfide related gold mineralization are currently being evaluated by NovaGold. The mineralization style, alteration characteristics, age and scale of the mineralized zones seen at the Brewery Creek Project are similar to those described by Hanson et al (2009).
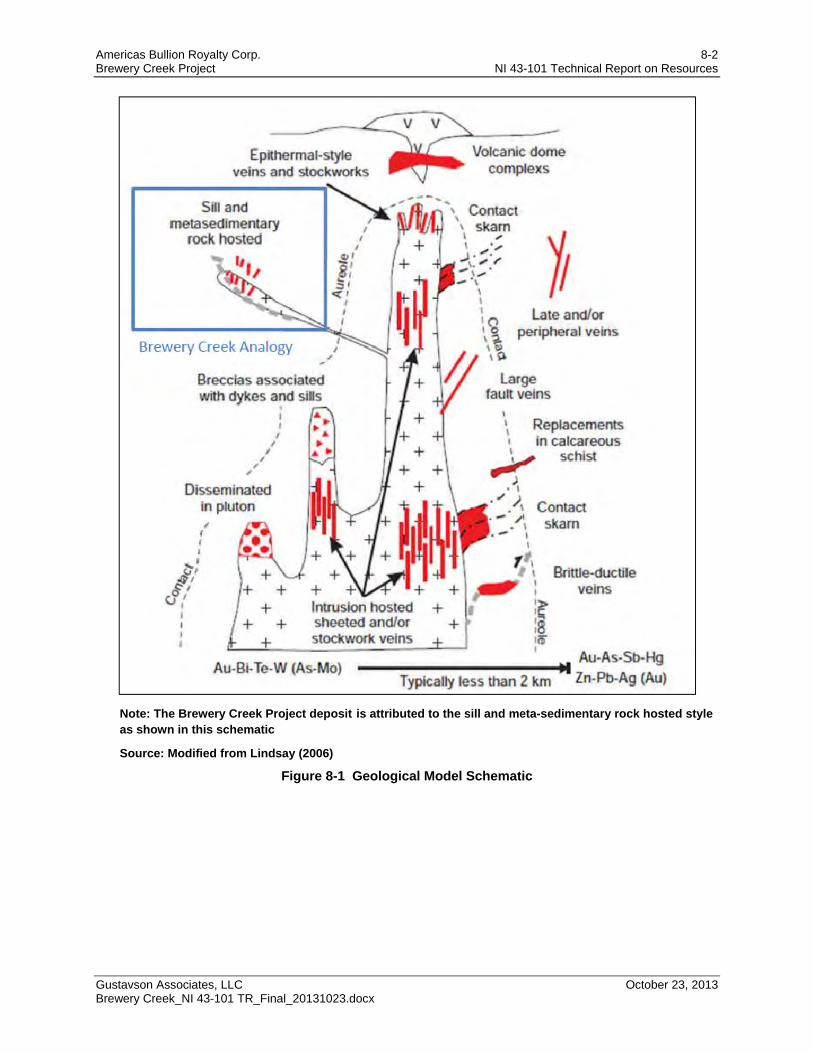
Americas Bullion Royalty Corp. 8-2 Brewery Creek Project NI 43-101 Technical Report on Resources
Gustavson Associates, LLC October 23, 2013 Brewery Creek_NI 43-101 TR_Final_20131023.docx
Note: The Brewery Creek Project deposit is attributed to the sill and meta-sedimentary rock hosted style
as shown in this schematic
Source: Modified from Lindsay (2006)
Figure 8-1 Geological Model Schematic
Americas Bullion Royalty Corp. 9-1 Brewery Creek Project NI 43-101 Technical Report on Resources
Gustavson Associates, LLC October 23, 2013 Brewery Creek_NI 43-101 TR_Final_20131023.docx
9 Exploration (Item 9)
9.1 Relevant Exploration Work
Exploration conducted by AMB includes geophysical surveys, soil sampling surveys and an extensive drilling campaign. These surveys were undertaken to extend known mineralized zones, reveal new mineralized zones, and provide information on parts of the property which had not been tested.
9.2 Surveys and Investigations
9.2.1 Magnetic Survey
In 2012, Precision GeoSurveys Inc. of Vancouver, BC was contracted to fly an airborne magnetic survey. This was done in order to better define the magnetic signatures in know areas of mineralization and to investigate these same signature in unexplored areas.
Lines were located at 100 metre spacing’s oriented east-west, and tie lines were flown at 1 kilometre spacing’s oriented north-south. The nominal height was 35 to 37 metres above the ground. Test flights prior to the survey were flown at an altitude where there is no ground effect in order to perform magnetic compensation. The computer program PEIComp was used to create a model for the survey to remove noise induced by aircraft movement. The results of the 2011 and 2012 magnetic surveys are shown on Figure 9-1.
The magnetic survey delineates a magnetic high, likely an intrusive body from the tombstone plutonic suite, in the southwest portion of the project area. Adjacent to this high are abrupt magnetic lows over the reserve trend mineralization. The mineralization at Classic and Lone Star appear to be associated with a magnetic high that may be a result of elevated magnetite and or pyrrhotite content.
The resulting data obtained from this survey has highlighted several areas for future exploration.
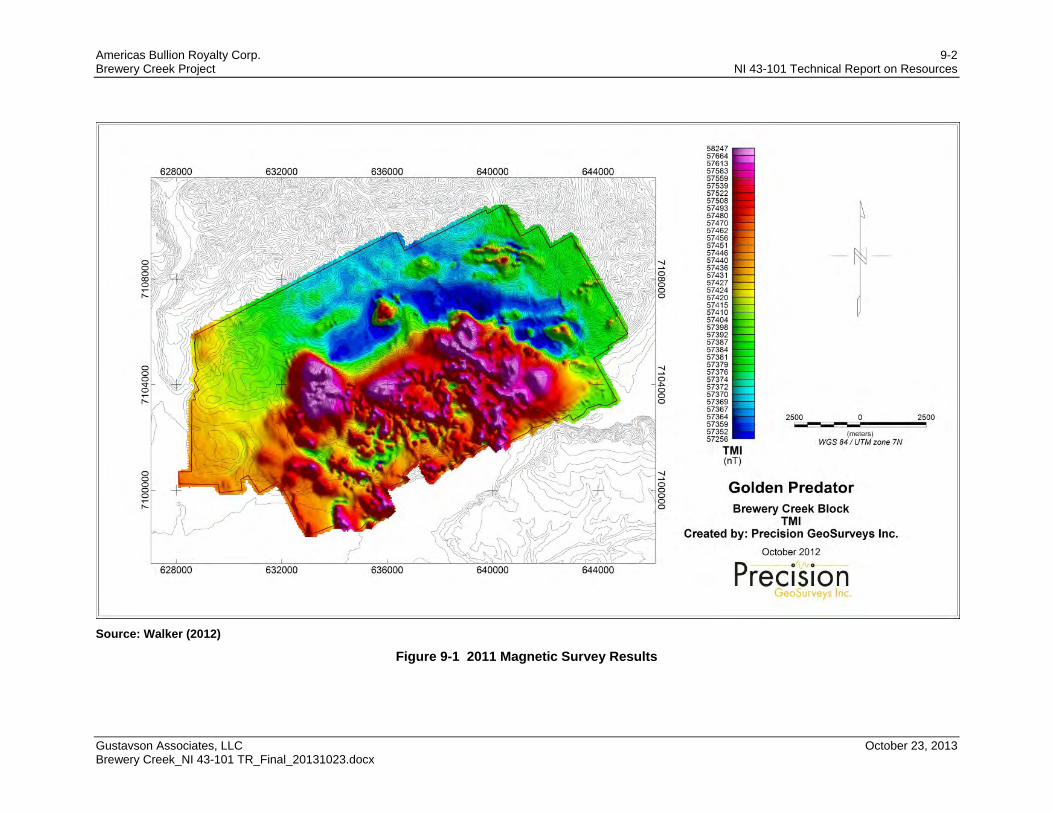
Americas Bullion Royalty Corp. 9-2 Brewery Creek Project NI 43-101 Technical Report on Resources
Gustavson Associates, LLC October 23, 2013 Brewery Creek_NI 43-101 TR_Final_20131023.docx
Source: Walker (2012)
Figure 9-1 2011 Magnetic Survey Results
Americas Bullion Royalty Corp. 9-3 Brewery Creek Project NI 43-101 Technical Report on Resources
Gustavson Associates, LLC October 23, 2013 Brewery Creek_NI 43-101 TR_Final_20131023.docx
9.2.2 Soil Sampling Survey
The 2011 soil sampling survey (Figure 9-2) was conducted at the southern portion of the property, and the eastern claim extension including the Sleeman zone. The sample program was an in-fill program to obtain closer spaced data points in between earlier soil sampling events. Samples were collected at 50 metres spacing’s with soil lines being 100 metres apart and lines over the Sleeman main zone being 50 metres apart. The southern soil survey covered approximately 9 km2, and the Sleeman/claim extension covered approximately 7.4 km2. Procedures were in place for collecting in areas of great talus cover, and duplicate samples were taken to ensure sample quality. A total of 4,305 samples were collected over the area including duplicates.
The combined results of all the soil sampling programs (Figure 9-3) refined the Lone Star area anomaly, refined scattered anomalies between Lone Star and Sleeman and highlighted some low level anomalies east of the reserve trend.
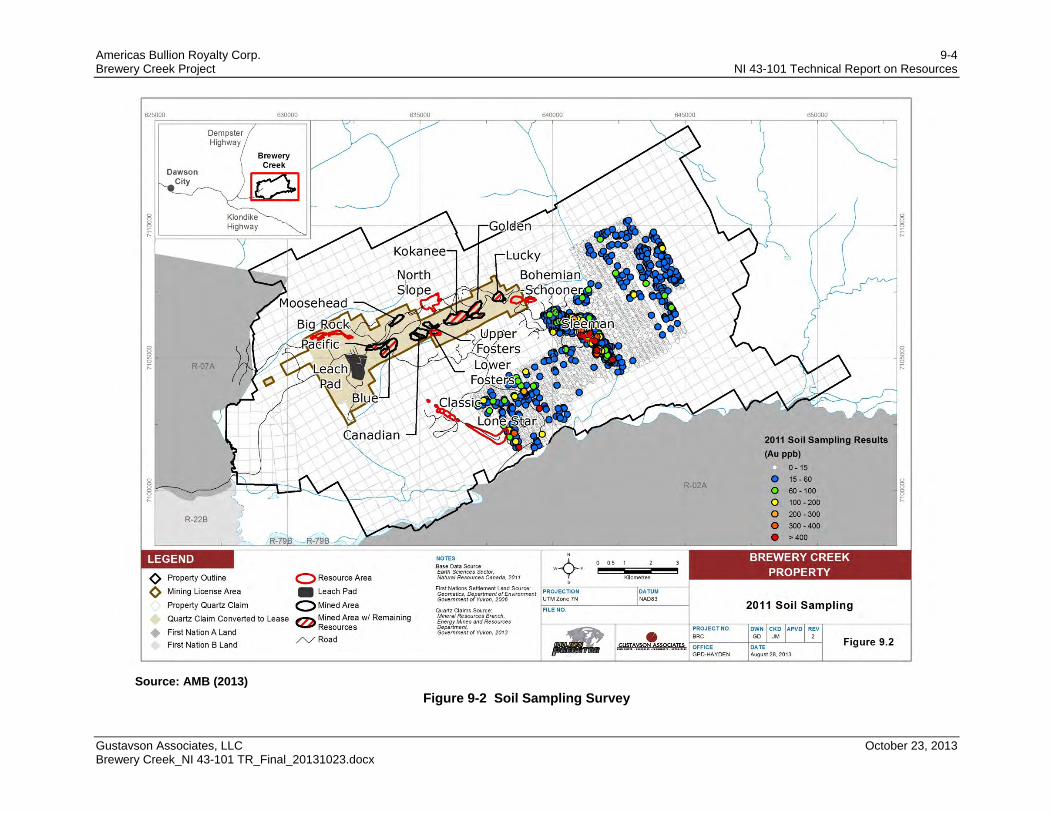
Americas Bullion Royalty Corp. 9-4 Brewery Creek Project NI 43-101 Technical Report on Resources
Gustavson Associates, LLC October 23, 2013 Brewery Creek_NI 43-101 TR_Final_20131023.docx
Source: AMB (2013)
Figure 9-2 Soil Sampling Survey
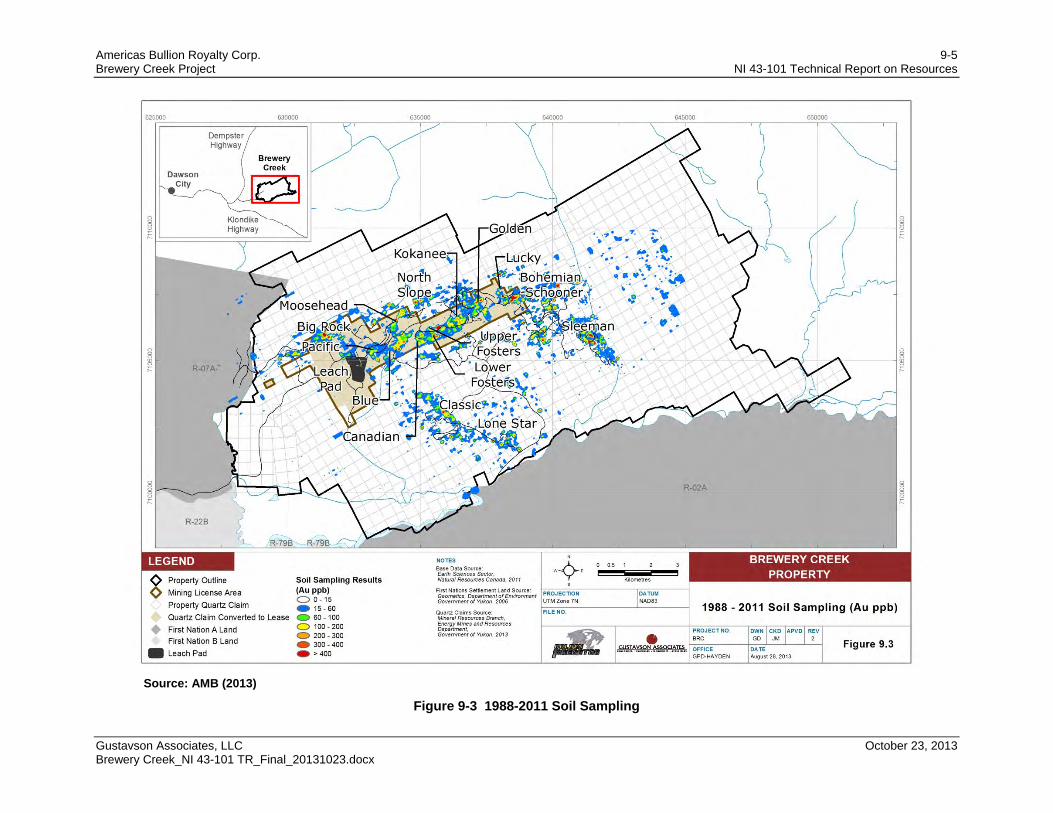
Americas Bullion Royalty Corp. 9-5 Brewery Creek Project NI 43-101 Technical Report on Resources
Gustavson Associates, LLC October 23, 2013 Brewery Creek_NI 43-101 TR_Final_20131023.docx
Source: AMB (2013)
Figure 9-3 1988-2011 Soil Sampling
Americas Bullion Royalty Corp. 9-6 Brewery Creek Project NI 43-101 Technical Report on Resources
Gustavson Associates, LLC October 23, 2013 Brewery Creek_NI 43-101 TR_Final_20131023.docx
9.2.3 IP Survey
During 2011, Aurora Geosciences of Whitehorse, YT was contracted to conduct an induced polarization (IP) survey was undertaken over the Sleeman zone at the eastern portion of the property.
The IP survey conducted by Aurora Geoscience covered a line distance of 19.8 kilometres and covered an area of approximately 4.3 km2 over the Sleeman Zone. Lines were cut and picketed using handheld GPS units, which were also used to mark electrode and current injection points. Modified pole dipole arrangement of the electrodes was used for this survey with dipole spacing at 50 metres on all lines. The survey started with 50 metre – 10 conductor cables until the temperature dropped below -10 degrees Celsius. From there, the survey was done with a 10 channel – 500 metre wire bundle until the terrain became too steep and the snow too deep. The survey was then finished with 50 metres – 6 conductor cables with a 4 channel – 200 metre wire bundle.
9.3 Significant Results and Interpretation
AMB utilized the exploration results to guide drilling activities. The magnetic survey delineates a magnetic high, likely an intrusive body from the tombstone plutonic suite, in the southwest portion of the project area. Adjacent to this high are abrupt magnetic lows over the reserve trend mineralization. The IP survey identified a resistivity low near the surface which may indicate the location of the structure associated with mineralizing fluid flow.
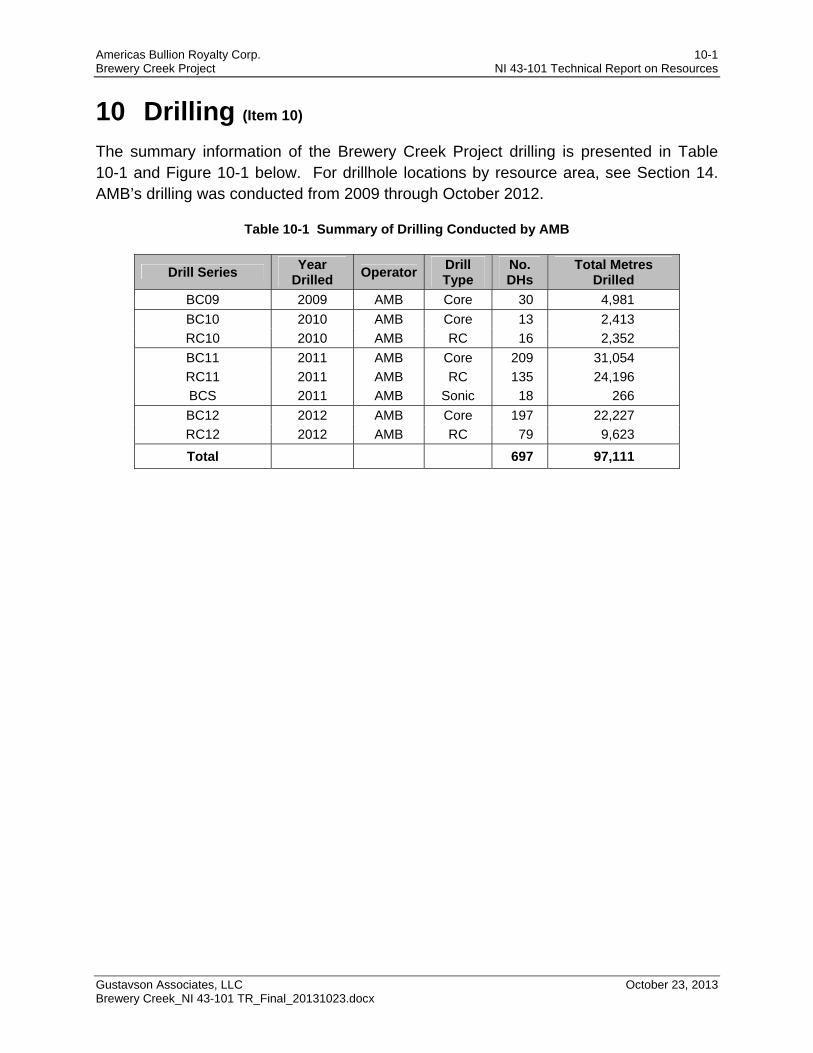
Americas Bullion Royalty Corp. 10-1 Brewery Creek Project NI 43-101 Technical Report on Resources
Gustavson Associates, LLC October 23, 2013 Brewery Creek_NI 43-101 TR_Final_20131023.docx
10 Drilling (Item 10) The summary information of the Brewery Creek Project drilling is presented in Table 10-1 and Figure 10-1 below. For drillhole locations by resource area, see Section 14. AMB’s drilling was conducted from 2009 through October 2012.
Table 10-1 Summary of Drilling Conducted by AMB
Drill Series Year
Drilled Operator
Drill Type
No. DHs
Total Metres Drilled
BC09 2009 AMB Core 30 4,981
BC10 2010 AMB Core 13 2,413
RC10 2010 AMB RC 16 2,352
BC11 2011 AMB Core 209 31,054
RC11 2011 AMB RC 135 24,196
BCS 2011 AMB Sonic 18 266
BC12 2012 AMB Core 197 22,227
RC12 2012 AMB RC 79 9,623
Total 697 97,111
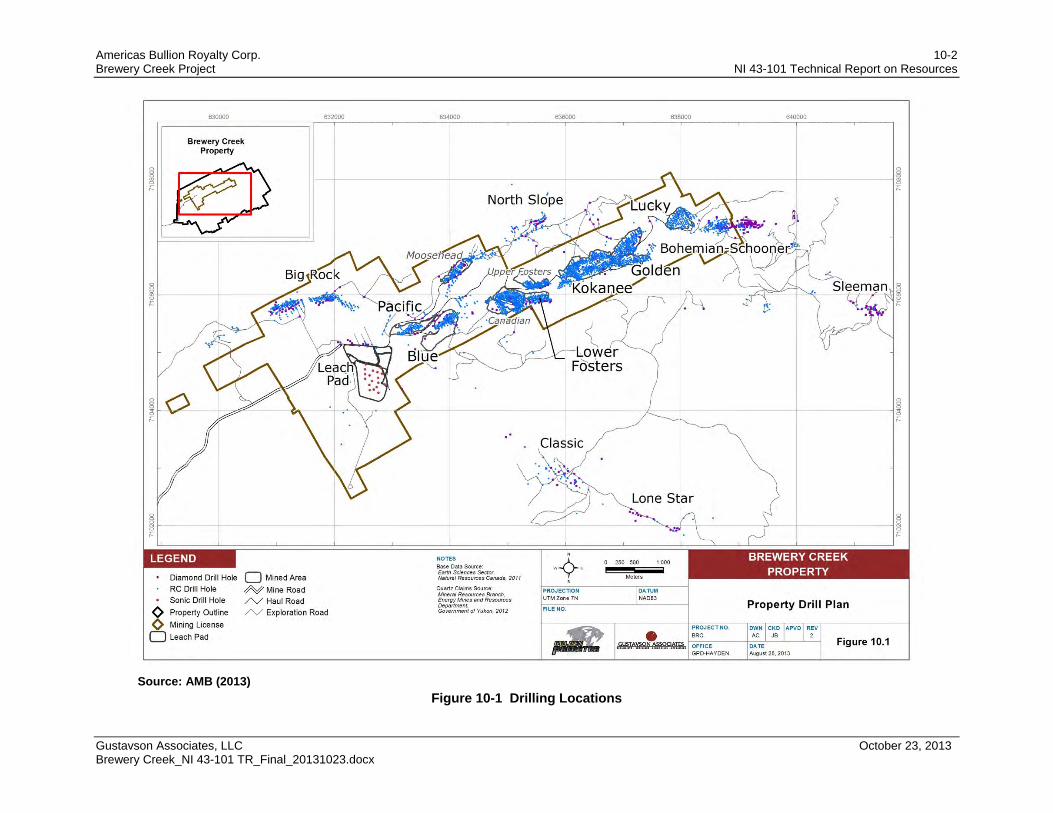
Americas Bullion Royalty Corp. 10-2 Brewery Creek Project NI 43-101 Technical Report on Resources
Gustavson Associates, LLC October 23, 2013 Brewery Creek_NI 43-101 TR_Final_20131023.docx
Source: AMB (2013)
Figure 10-1 Drilling Locations
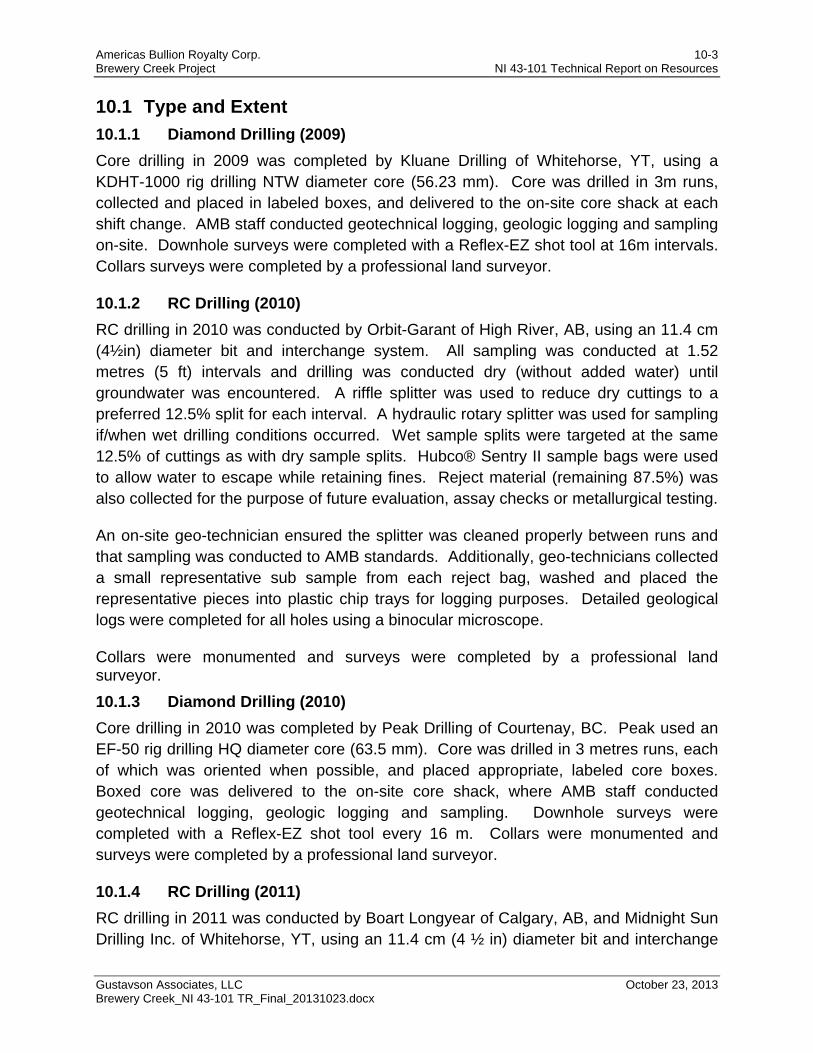
Americas Bullion Royalty Corp. 10-3 Brewery Creek Project NI 43-101 Technical Report on Resources
Gustavson Associates, LLC October 23, 2013 Brewery Creek_NI 43-101 TR_Final_20131023.docx
10.1 Type and Extent
10.1.1 Diamond Drilling (2009)
Core drilling in 2009 was completed by Kluane Drilling of Whitehorse, YT, using a KDHT-1000 rig drilling NTW diameter core (56.23 mm). Core was drilled in 3m runs, collected and placed in labeled boxes, and delivered to the on-site core shack at each shift change. AMB staff conducted geotechnical logging, geologic logging and sampling on-site. Downhole surveys were completed with a Reflex-EZ shot tool at 16m intervals. Collars surveys were completed by a professional land surveyor.
10.1.2 RC Drilling (2010)
RC drilling in 2010 was conducted by Orbit-Garant of High River, AB, using an 11.4 cm (4½in) diameter bit and interchange system. All sampling was conducted at 1.52 metres (5 ft) intervals and drilling was conducted dry (without added water) until groundwater was encountered. A riffle splitter was used to reduce dry cuttings to a preferred 12.5% split for each interval. A hydraulic rotary splitter was used for sampling if/when wet drilling conditions occurred. Wet sample splits were targeted at the same 12.5% of cuttings as with dry sample splits. Hubco® Sentry II sample bags were used to allow water to escape while retaining fines. Reject material (remaining 87.5%) was also collected for the purpose of future evaluation, assay checks or metallurgical testing.
An on-site geo-technician ensured the splitter was cleaned properly between runs and that sampling was conducted to AMB standards. Additionally, geo-technicians collected a small representative sub sample from each reject bag, washed and placed the representative pieces into plastic chip trays for logging purposes. Detailed geological logs were completed for all holes using a binocular microscope.
Collars were monumented and surveys were completed by a professional land surveyor.
10.1.3 Diamond Drilling (2010)
Core drilling in 2010 was completed by Peak Drilling of Courtenay, BC. Peak used an EF-50 rig drilling HQ diameter core (63.5 mm). Core was drilled in 3 metres runs, each of which was oriented when possible, and placed appropriate, labeled core boxes. Boxed core was delivered to the on-site core shack, where AMB staff conducted geotechnical logging, geologic logging and sampling. Downhole surveys were completed with a Reflex-EZ shot tool every 16 m. Collars were monumented and surveys were completed by a professional land surveyor.
10.1.4 RC Drilling (2011)
RC drilling in 2011 was conducted by Boart Longyear of Calgary, AB, and Midnight Sun Drilling Inc. of Whitehorse, YT, using an 11.4 cm (4 ½ in) diameter bit and interchange
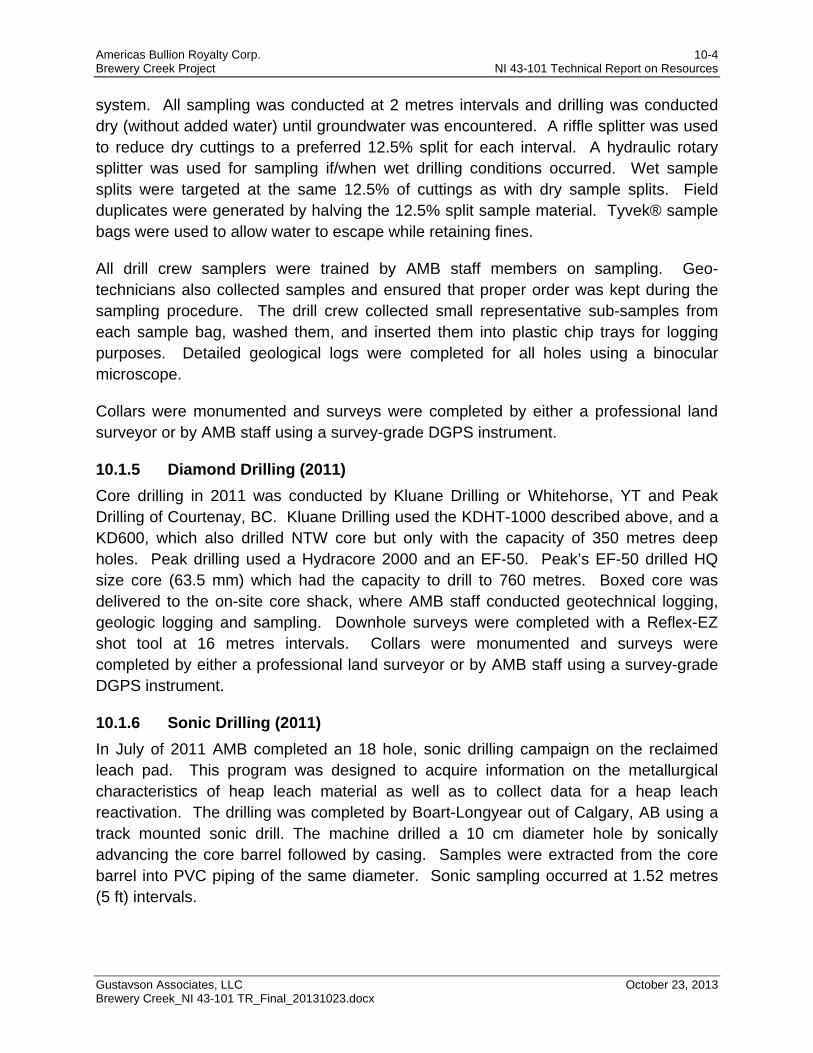
Americas Bullion Royalty Corp. 10-4 Brewery Creek Project NI 43-101 Technical Report on Resources
Gustavson Associates, LLC October 23, 2013 Brewery Creek_NI 43-101 TR_Final_20131023.docx
system. All sampling was conducted at 2 metres intervals and drilling was conducted dry (without added water) until groundwater was encountered. A riffle splitter was used to reduce dry cuttings to a preferred 12.5% split for each interval. A hydraulic rotary splitter was used for sampling if/when wet drilling conditions occurred. Wet sample splits were targeted at the same 12.5% of cuttings as with dry sample splits. Field duplicates were generated by halving the 12.5% split sample material. Tyvek® sample bags were used to allow water to escape while retaining fines.
All drill crew samplers were trained by AMB staff members on sampling. Geo-technicians also collected samples and ensured that proper order was kept during the sampling procedure. The drill crew collected small representative sub-samples from each sample bag, washed them, and inserted them into plastic chip trays for logging purposes. Detailed geological logs were completed for all holes using a binocular microscope.
Collars were monumented and surveys were completed by either a professional land surveyor or by AMB staff using a survey-grade DGPS instrument.
10.1.5 Diamond Drilling (2011)
Core drilling in 2011 was conducted by Kluane Drilling or Whitehorse, YT and Peak Drilling of Courtenay, BC. Kluane Drilling used the KDHT-1000 described above, and a KD600, which also drilled NTW core but only with the capacity of 350 metres deep holes. Peak drilling used a Hydracore 2000 and an EF-50. Peak’s EF-50 drilled HQ size core (63.5 mm) which had the capacity to drill to 760 metres. Boxed core was delivered to the on-site core shack, where AMB staff conducted geotechnical logging, geologic logging and sampling. Downhole surveys were completed with a Reflex-EZ shot tool at 16 metres intervals. Collars were monumented and surveys were completed by either a professional land surveyor or by AMB staff using a survey-grade DGPS instrument.
10.1.6 Sonic Drilling (2011)
In July of 2011 AMB completed an 18 hole, sonic drilling campaign on the reclaimed leach pad. This program was designed to acquire information on the metallurgical characteristics of heap leach material as well as to collect data for a heap leach reactivation. The drilling was completed by Boart-Longyear out of Calgary, AB using a track mounted sonic drill. The machine drilled a 10 cm diameter hole by sonically advancing the core barrel followed by casing. Samples were extracted from the core barrel into PVC piping of the same diameter. Sonic sampling occurred at 1.52 metres (5 ft) intervals.
Americas Bullion Royalty Corp. 10-5 Brewery Creek Project NI 43-101 Technical Report on Resources
Gustavson Associates, LLC October 23, 2013 Brewery Creek_NI 43-101 TR_Final_20131023.docx
10.1.7 Diamond Drilling (2012)
In 2012, drilling was conducted by Kluane Drilling of Whitehorse, YT with a KDHT-1000, and by Matrix Diamond Drilling Inc of Kimberly, BC with an A5 drill. Boxed core was delivered to the onsite core shack, where AMB staff conducted geotechnical logging, geologic logging and sampling.
Downhole surveys were completed with a Reflex-EZ shot tool at 16m intervals. Collars were monumented and surveys were completed by AMB staff using a survey-grade DGPS instrument.
10.2 Summary of All Drilling Data
Table 10-2 summarizes all drilling that has been conducted for target areas through the Effective Date of the report.
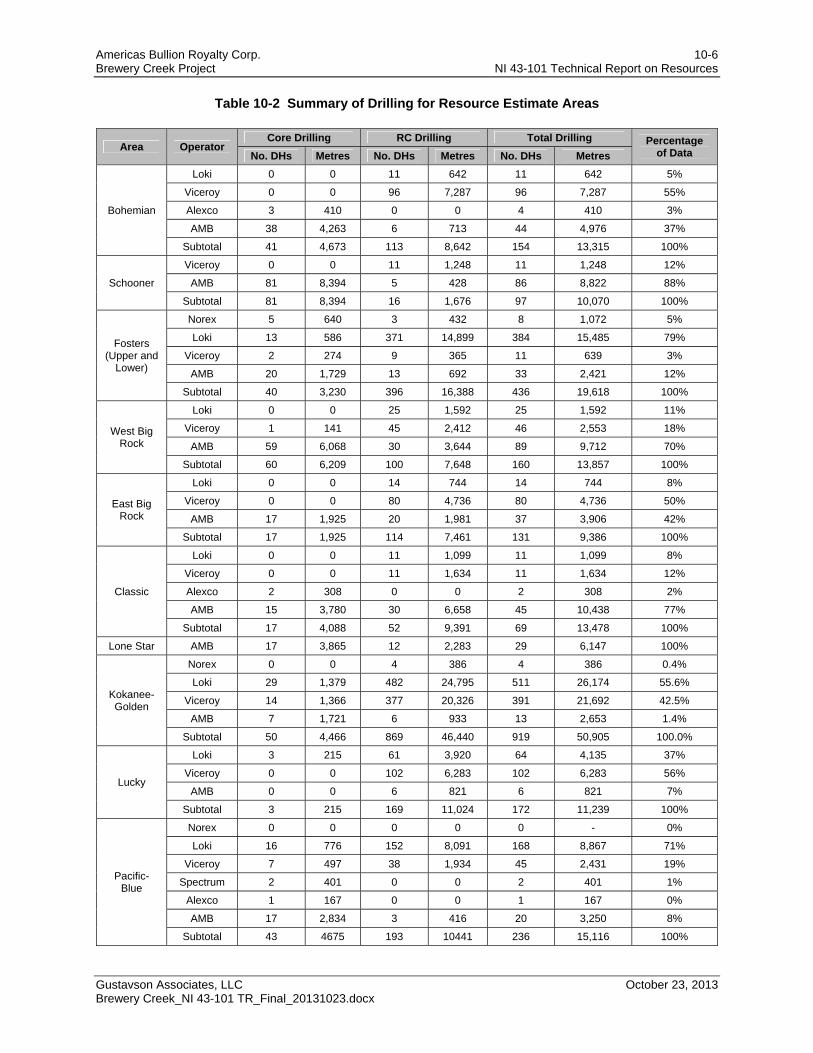
Americas Bullion Royalty Corp. 10-6 Brewery Creek Project NI 43-101 Technical Report on Resources
Gustavson Associates, LLC October 23, 2013 Brewery Creek_NI 43-101 TR_Final_20131023.docx
Table 10-2 Summary of Drilling for Resource Estimate Areas
Area Operator Core Drilling RC Drilling Total Drilling Percentage
of Data No. DHs Metres No. DHs Metres No. DHs Metres
Bohemian
Loki 0 0 11 642 11 642 5%
Viceroy 0 0 96 7,287 96 7,287 55%
Alexco 3 410 0 0 4 410 3%
AMB 38 4,263 6 713 44 4,976 37%
Subtotal 41 4,673 113 8,642 154 13,315 100%
Schooner
Viceroy 0 0 11 1,248 11 1,248 12%
AMB 81 8,394 5 428 86 8,822 88%
Subtotal 81 8,394 16 1,676 97 10,070 100%
Fosters (Upper and
Lower)
Norex 5 640 3 432 8 1,072 5%
Loki 13 586 371 14,899 384 15,485 79%
Viceroy 2 274 9 365 11 639 3%
AMB 20 1,729 13 692 33 2,421 12%
Subtotal 40 3,230 396 16,388 436 19,618 100%
West Big Rock
Loki 0 0 25 1,592 25 1,592 11%
Viceroy 1 141 45 2,412 46 2,553 18%
AMB 59 6,068 30 3,644 89 9,712 70%
Subtotal 60 6,209 100 7,648 160 13,857 100%
East Big Rock
Loki 0 0 14 744 14 744 8%
Viceroy 0 0 80 4,736 80 4,736 50%
AMB 17 1,925 20 1,981 37 3,906 42%
Subtotal 17 1,925 114 7,461 131 9,386 100%
Classic
Loki 0 0 11 1,099 11 1,099 8%
Viceroy 0 0 11 1,634 11 1,634 12%
Alexco 2 308 0 0 2 308 2%
AMB 15 3,780 30 6,658 45 10,438 77%
Subtotal 17 4,088 52 9,391 69 13,478 100%
Lone Star AMB 17 3,865 12 2,283 29 6,147 100%
Kokanee-Golden
Norex 0 0 4 386 4 386 0.4%
Loki 29 1,379 482 24,795 511 26,174 55.6%
Viceroy 14 1,366 377 20,326 391 21,692 42.5%
AMB 7 1,721 6 933 13 2,653 1.4%
Subtotal 50 4,466 869 46,440 919 50,905 100.0%
Lucky
Loki 3 215 61 3,920 64 4,135 37%
Viceroy 0 0 102 6,283 102 6,283 56%
AMB 0 0 6 821 6 821 7%
Subtotal 3 215 169 11,024 172 11,239 100%
Pacific-Blue
Norex 0 0 0 0 0 - 0%
Loki 16 776 152 8,091 168 8,867 71%
Viceroy 7 497 38 1,934 45 2,431 19%
Spectrum 2 401 0 0 2 401 1%
Alexco 1 167 0 0 1 167 0%
AMB 17 2,834 3 416 20 3,250 8%
Subtotal 43 4675 193 10441 236 15,116 100%
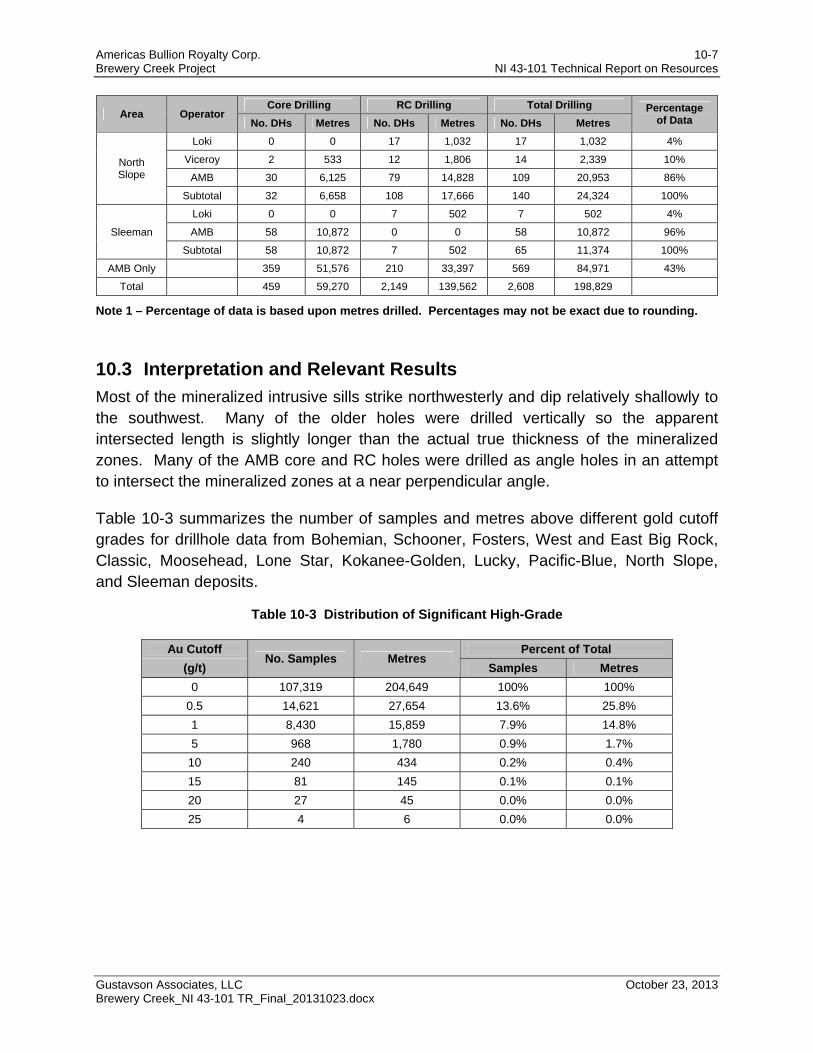
Americas Bullion Royalty Corp. 10-7 Brewery Creek Project NI 43-101 Technical Report on Resources
Gustavson Associates, LLC October 23, 2013 Brewery Creek_NI 43-101 TR_Final_20131023.docx
Area Operator Core Drilling RC Drilling Total Drilling Percentage
of Data No. DHs Metres No. DHs Metres No. DHs Metres
North Slope
Loki 0 0 17 1,032 17 1,032 4%
Viceroy 2 533 12 1,806 14 2,339 10%
AMB 30 6,125 79 14,828 109 20,953 86%
Subtotal 32 6,658 108 17,666 140 24,324 100%
Sleeman
Loki 0 0 7 502 7 502 4%
AMB 58 10,872 0 0 58 10,872 96%
Subtotal 58 10,872 7 502 65 11,374 100%
AMB Only 359 51,576 210 33,397 569 84,971 43%
Total 459 59,270 2,149 139,562 2,608 198,829
Note 1 – Percentage of data is based upon metres drilled. Percentages may not be exact due to rounding.
10.3 Interpretation and Relevant Results
Most of the mineralized intrusive sills strike northwesterly and dip relatively shallowly to the southwest. Many of the older holes were drilled vertically so the apparent intersected length is slightly longer than the actual true thickness of the mineralized zones. Many of the AMB core and RC holes were drilled as angle holes in an attempt to intersect the mineralized zones at a near perpendicular angle.
Table 10-3 summarizes the number of samples and metres above different gold cutoff grades for drillhole data from Bohemian, Schooner, Fosters, West and East Big Rock, Classic, Moosehead, Lone Star, Kokanee-Golden, Lucky, Pacific-Blue, North Slope, and Sleeman deposits.
Table 10-3 Distribution of Significant High-Grade
Au Cutoff No. Samples Metres
Percent of Total
(g/t) Samples Metres
0 107,319 204,649 100% 100%
0.5 14,621 27,654 13.6% 25.8%
1 8,430 15,859 7.9% 14.8%
5 968 1,780 0.9% 1.7%
10 240 434 0.2% 0.4%
15 81 145 0.1% 0.1%
20 27 45 0.0% 0.0%
25 4 6 0.0% 0.0%
Americas Bullion Royalty Corp. 11-1 Brewery Creek Project NI 43-101 Technical Report on Resources
Gustavson Associates, LLC October 23, 2013 Brewery Creek_NI 43-101 TR_Final_20131023.docx
11 Sample Preparation, Analysis and Security (Item 11)
11.1 Sample Collection Methods
11.1.1 Historical Sampling by Norex (1989)
Information for the Norex sampling preparation and analysis program were not available at the time of reporting. A total of 7 diamond drillholes and 11 RC holes from this campaign were drilled within the Fosters-Canadian, Moosehead, and Kokanee-Golden area discussed in this report. The material surrounding the significant mineralized intervals of these holes has now been mined and these holes do not contribute to the current Mineral Resources found on the property and their sampling methodology is considered irrelevant to this report.
11.1.2 Historical Sampling by Loki and Viceroy (1990 – 1999)
The details of core and RC drill sample preparation, QA/QC, analysis and security procedures prior to 2004 are generally absent in the project files. Based on Viceroy drill and sample logs, samples were logged and collected on continuous 2 metre intervals downhole and submitted to the mine site laboratory for gold assay and metallurgical test work (Table 11-1). Based on data verification work reported in Section 12 of this report, Gustavson is of the opinion that these historical data are suitable for use in resource estimation.
Table 11-1 Historical Analytical Laboratories
Period Operator App. Samples Laboratory Analytical Method
1989 Norex 1,300 Norex Hot Aqua Regia Digestion with AA Analysis
1990-1992 Loki 18,000 Acme Hot Aqua Regia Digestion with AA Analysis
1993-1995 Loki 18,000 Terramin 30g Fire Assay with AA Finish
1996-1999 Viceroy 29,000 Brewery Creek Mine 30g Fire Assay with AA Finish
2004 Spectrum 382 ALS Chemex 30g Fire Assay with AA Finish
2006 Alexco 783 ALS Chemex 30g Fire Assay with AA Finish
11.1.3 Historical Sampling by Spectrum and Alexco (2004 and 2006)
Sampling procedures in 2004 and 2006 were as follows. The geologist laid out each sample by marking the start and end of the sample in red marker on the core. The first part of the sample tag was stapled onto the core box at the start of the sample. If the next sample was a standard, blank or duplicate, that sample tag was stapled onto the box next to the previous tag. The second part of the sample tag was then placed into a
Americas Bullion Royalty Corp. 11-2 Brewery Creek Project NI 43-101 Technical Report on Resources
Gustavson Associates, LLC October 23, 2013 Brewery Creek_NI 43-101 TR_Final_20131023.docx
plastic sample bag and the number written in marker onto the bag. The core was then transferred to the core cutting area.
The core was cut in half longitudinally using a 14 inch core saw. The technician placed one half of the core into the sample bag with the corresponding sample tag stapled on the core box. When a second tag was beside the first tag, the technician placed either the blank material or standard material into the next sample bag, based on what was written on the sample tag. When the second tag called for a duplicate, the technician placed an empty sample bag with a sample tag included into the previous sample. Each bag was then closed and secured with a zap strap.
Once twenty sample bags were collected (a complete batch), each batch was placed into rice sacks and labeled with the batch number, bag number, sample numbers within batch, and ALS Chemex’s North Vancouver address. Each rice bag was then taped shut and secured with a zap strap. Twice a week, the rice bags were delivered to Mayo and placed on the Kluane Transport Ltd. truck for Whitehorse, where it was shipped to Northwest Freight Systems for transportation to ALS Chemex (ALS) in North Vancouver.
11.1.4 AMB’s Core Sampling (2009-2012)
Sampling procedures used from 2009 through 2012 were as follows. Core was oriented (when applicable), retrieved from the barrel, cleaned, placed into boxes and transported to the on-site core logging facility by either drilling crew or AMB staff. Upon arrival at the logging facility, core was logged and tagged for sample breaks. Sample tags, labeled with numeric sample ID, were then attached to core boxes at appropriate sample break points. A preferred sample interval of 2 metres was used whenever possible, but varying sample intervals were used to honor lithologic contacts, significant structural features, alteration and mineralized intervals. Prior to sampling, geotechnical and oriented structural measurements were recorded, specific gravity of select lithologic units was measured and the core was photographed.
A diamond saw located at the on-site core logging facility was used to sample halved core; field duplicates were generated using ¼ core samples. Samples were placed in pre-labeled poly bags and grouped into batches within labeled, sealed/secured rice sacks in preparation for shipment to the lab. Unsampled ½ core was returned to the original core box for storage on-site.
Batch sizes in 2009 and 2010 consisted of 36 samples, including QA/QC SRM (Au standards and blanks) and field duplicates. Mid-season 2011, batches were increased from a 36 sample count to include all samples for each drillhole. This method of whole-
Americas Bullion Royalty Corp. 11-3 Brewery Creek Project NI 43-101 Technical Report on Resources
Gustavson Associates, LLC October 23, 2013 Brewery Creek_NI 43-101 TR_Final_20131023.docx
hole batch sizing has been used consistently since the 2011 change, and throughout the 2012 program.
11.1.5 AMB’s RC Sampling (2010-2011)
In 2010 and 2011, RC drill samples were collected from an 11.4 cm (4 ½ in) diameter drillhole with a uniform 1.52 metres (5 ft) sample interval. Dry cuttings were funneled from the cyclone through a three-tier Jones (riffle) splitter, setup to gather 12.5% of the returned material. A hydraulic rotary splitter was used for sampling if/when wet drilling occurred. Wet sample splits were targeted at the same 12.5% of cuttings as with dry sample splits. All samples were contained in pre-labeled Hubco® Sentry II or Tyvek® bag, which allows for water drainage while retaining fines.
Each sample was identified using a blind assay tag number placed in the sample bag. The corresponding sample number was also written on the sample bag. Bags were sealed and collected at the drill, placed into pre-labeled rice bags and were transported to the logging area by either the drillers or AMB staff.
In 2010, sample batches of 36 were accumulated for shipment: each batch of 36 samples included, one blank, one standard reference material, and one duplicate. Field duplicates were generated by splitting the remaining (87.5%) sample material. In 2011, field duplicates were generated by halving the 12.5% sample split with a box splitter. Entire holes were placed in apple crates and shipped as individual batches, which included inserted blank and standard reference material.
11.1.6 AMB’s RC Sampling (2012)
In 2012, RC samples were collected over 1.52 metre intervals from a 8.89 cm (3 ½ in) diameter hole. Dry cuttings were funneled from the cyclone through the three-tier Jones (riffle) splitter, setup to gather 12.5% of the returned material. A hydraulic rotary splitter was used for sampling if/when wet drilling occurred. Wet samples were targeted at the same 12.5% of cuttings as with dry sample splits. All samples were contained in Sunset Manufacturing BVLBL bags, which were pre-labeled. These bags allowed for drainage of excess water while retaining fines.
Each sample was identified using a blind assay tag number placed in the sample bag. The corresponding sample number was also written on the sample bag. Bags were sealed and collected at the drill, and transported to the logging area by either the drillers or AMB staff. After a period of time for draining of excess water, bags were placed in pre-labeled sample bins (apple crates) with a corresponding batch label (batched by hole). Field duplicates were generated by halving the 12.5% sample split with a box splitter. Entire holes were placed in apple crates and shipped as individual batches which included blank, standard reference material, and the aforementioned duplicates.
Americas Bullion Royalty Corp. 11-4 Brewery Creek Project NI 43-101 Technical Report on Resources
Gustavson Associates, LLC October 23, 2013 Brewery Creek_NI 43-101 TR_Final_20131023.docx
11.2 Sample Analytical Methods
11.2.1 Historical Analytical Methods by Norex (1989)
Analytical methods used by Norex are unknown.
11.2.2 Historical Analytical Methods by Loki, and Viceroy (1990 – 1999)
Drill logs and laboratory certificates recovered from Loki/Viceroy drilling campaigns indicate that analysis was conducted using aqua regia digestion with atomic absorption finish during the years 1990 through 1992 at ACME laboratories. The method was changed to 30g fire assay using atomic absorption finish during Loki/Viceroy drilling between the years 1993-1999 at Terramin Labs and the on-site laboratory.
Some of Loki and Viceroy’s samples were assayed at ALS, though actual methods used are not known.
11.2.3 Historical Analytical Methods by Spectrum (2004)
The analytical methods used by ALS for the Spectrum 2004 drill samples were as follows. ALS sample preparation (Prep 31) procedure, which involves finely crushing the entire sample to better than 70% -2 mm, splitting off up to 250 g and pulverizing the split to better than 85% passing 75 micron. Gold was analyzed by ALS procedure Au-AA-25, a fire assay - atomic absorption finish method. Samples were also assayed for 34 metals by ME-ICP41, an aqua Regia digestion and analysis by inductively coupled plasma-atomic emission spectroscopy (ICP-ES).
11.2.4 Historical Analytical Methods by Alexco (2006)
The analytical methods used by ALS for the 2006 drill samples were as follows. ALS sample preparation (Prep 31), then assayed for gold by Au-AA25, see Section 11.2.3 for description.
Analysis for an additional 27 elements was completed using ALS method ME-ICP61, a hot four-acid digestion and analysis by ICP-ES.
11.2.5 AMB’s Analytical Methods (2009)
ACME Analytical Laboratories of Vancouver, B.C. performed all sample preparation and analyses. ACME Analytical Laboratory is certified by ISO 9001:2008 FM 63007.
Core samples were logged and sampled at the project site under the supervision of the project geologist and then expedited in sealed bags to Whitehorse where they were shipped via common carrier to Vancouver. After being received and logged in at the laboratory, a 2 kg split of core was dried then crushed to 80% -10 mesh. A 250 g split was then pulverized to 85% -200 mesh (Sample Preparation Method R200-250).
Americas Bullion Royalty Corp. 11-5 Brewery Creek Project NI 43-101 Technical Report on Resources
Gustavson Associates, LLC October 23, 2013 Brewery Creek_NI 43-101 TR_Final_20131023.docx
A 15 g split of each sample was analyzed by ICP-MS after Aqua Regia digestion to yield a 37 element scan (Method 1F01). All samples yielding greater than 500 ppb gold then underwent a 30 g fire assay with an ICP-ES finish (Method G6). QA/QC procedures followed for the diamond drilling program include submittal of assay standards for analysis approximately every 30 samples as well as a blank and a duplicate sample of quarter core at approximately the same frequency.
11.2.6 AMB’s Analytical Methods (2010)
All drill core and RC chips samples in 2010 were received at the ALS Chemex sample prep facility in Whitehorse, YT and analyzed by ALS Chemex in Vancouver, BC. ALS Chemex Laboratory in Vancouver Canada is certified by ISO 9001:2008 and ISO/IEC 17025:2005. Identical procedures were used for both RC and core samples. Samples were prepared in accordance with Prep 31 requirements, as described in Section 11.2.3. Samples were assayed for gold by Au-AA23, with reporting limits of 0.005 to 10 ppm. Samples were also analyzed for 35 elements by ME-ICP41.
11.2.7 AMB’s Analytical Methods (2011)
Drill core and RC samples in 2011 were received at either ALS Minerals Whitehorse, YT sample prep facility or at one of ACME Laboratories Dawson City, YT or Whitehorse, YT sample prep facilities. Sample analysis was conducted by either ACME Laboratories, Vancouver, BC or by ALS Minerals, Vancouver, BC or Reno, NV.
Samples sent to ACME were prepared using Method R200-250, as described in Section 11.2.5. ACME assayed for gold by Method G6, 0.005g/t detection limit, 10 ppm upper limit, fire assay of 30g Atomic Absorption finish (Automatic Gravimetric Overlimit); and by Analytical Method Code 7TD1 for silver only (2g/t detection limit), which consists of hot 4-Acid digestion of 1g minimum pulp for sulfide and silicate ores followed by ICP-ES analysis.
Samples submitted to ALS are prepared using method Prep 31, as described in Section 11.2.3, followed by gold assay by Au-AA23, and for 35 elements by ME-ICP41, as described in Section 11.2.6.
11.2.8 AMB’s Analytical Methods (2012)
AMB’s 2012 samples were prepared by Prep 31, as described in Section 11.2.3, followed by gold assay by Au-AA23 as described in Section 11.2.6. Some samples were analyzed for multi-elements by ME-ICP41, as described in Section 11.2.6. All samples that returned gold grades in excess of 200 ppb (0.2 ppm) were re-analyzed by cyanide leach and gold preg-robbing methods (Au-AA31 and Au-AA31a).
Americas Bullion Royalty Corp. 11-6 Brewery Creek Project NI 43-101 Technical Report on Resources
Gustavson Associates, LLC October 23, 2013 Brewery Creek_NI 43-101 TR_Final_20131023.docx
Part way through their 2012 drilling campaign, AMB ran cyanide leach analyses (AuAA13) on all intrusive samples where the initial fire assay grade was in excess of 0.2 g/t.
11.3 AMB’s Security Measures
During a site visit in March, 2012, EBA reviewed the sample collection and processing protocol being implemented on site. The facilities in place at the time consisted of dedicated core receiving/logging, cutting and processing areas. Security and control on sample handing is measured through the process and is described in subsequent sections. RMI conducted a similar review of sample collection during a site visit in mid-October 2012.
All sampling was conducted under the supervision of a AMB project geologist and the chain of custody from the drill to the sample preparation and logging facility is continually monitored by the project geologist. Samples are shipped to the lab by qualified couriers or AMB personnel under security-tagged bags with independent identification numbers.
During Gustavson’s site visit, no drilling or sampling were being performed, so sampling security measures were not observed directly. However, Gustavson is of the opinion that security measures are commensurate with industry standard practice.
11.4 QA/QC Samples
In summary, no QA/QC data were identified for assay data by Norex, Loki, and Viceroy, drilling conducted between 1989 and 1999. Available QA/QC results are described below.
11.4.1 Standards
Available standard samples and results as provided from AMB are summarized in Table 11-2. As shown on Table 11-2, of the 1,746 standard samples from 2004 through 2012, 6% of the standards exceeded the acceptance criteria, which was the certified standard result, plus or minus 3-times the certified standard deviation results. Gustavson notes that approximately two-thirds those samples that are outside the acceptance criteria were detected at levels below the acceptance criteria, potentially suggesting gold is more likely to be under-reported, rather than over-reported. Gustavson concludes that the available standard results are acceptable.
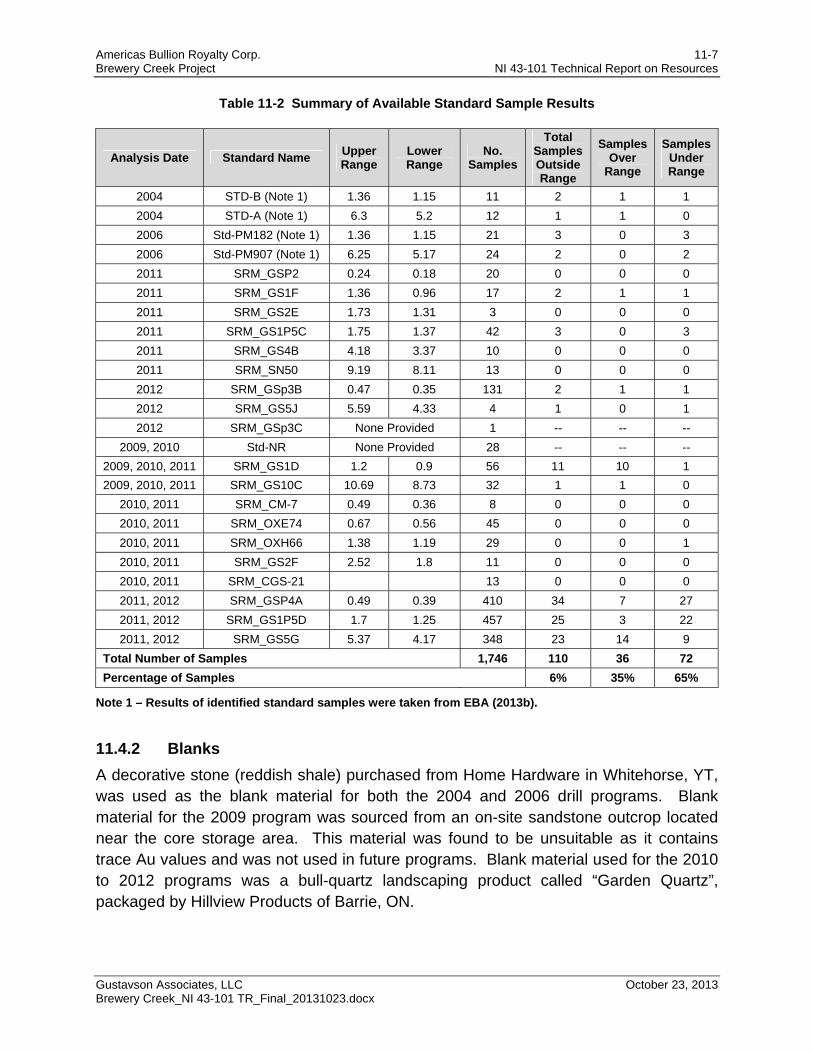
Americas Bullion Royalty Corp. 11-7 Brewery Creek Project NI 43-101 Technical Report on Resources
Gustavson Associates, LLC October 23, 2013 Brewery Creek_NI 43-101 TR_Final_20131023.docx
Table 11-2 Summary of Available Standard Sample Results
Analysis Date Standard Name Upper Range
Lower Range
No. Samples
Total Samples Outside Range
Samples Over
Range
Samples Under Range
2004 STD-B (Note 1) 1.36 1.15 11 2 1 1
2004 STD-A (Note 1) 6.3 5.2 12 1 1 0
2006 Std-PM182 (Note 1) 1.36 1.15 21 3 0 3
2006 Std-PM907 (Note 1) 6.25 5.17 24 2 0 2
2011 SRM_GSP2 0.24 0.18 20 0 0 0
2011 SRM_GS1F 1.36 0.96 17 2 1 1
2011 SRM_GS2E 1.73 1.31 3 0 0 0
2011 SRM_GS1P5C 1.75 1.37 42 3 0 3
2011 SRM_GS4B 4.18 3.37 10 0 0 0
2011 SRM_SN50 9.19 8.11 13 0 0 0
2012 SRM_GSp3B 0.47 0.35 131 2 1 1
2012 SRM_GS5J 5.59 4.33 4 1 0 1
2012 SRM_GSp3C None Provided 1 -- -- --
2009, 2010 Std-NR None Provided 28 -- -- --
2009, 2010, 2011 SRM_GS1D 1.2 0.9 56 11 10 1
2009, 2010, 2011 SRM_GS10C 10.69 8.73 32 1 1 0
2010, 2011 SRM_CM-7 0.49 0.36 8 0 0 0
2010, 2011 SRM_OXE74 0.67 0.56 45 0 0 0
2010, 2011 SRM_OXH66 1.38 1.19 29 0 0 1
2010, 2011 SRM_GS2F 2.52 1.8 11 0 0 0
2010, 2011 SRM_CGS-21 13 0 0 0
2011, 2012 SRM_GSP4A 0.49 0.39 410 34 7 27
2011, 2012 SRM_GS1P5D 1.7 1.25 457 25 3 22
2011, 2012 SRM_GS5G 5.37 4.17 348 23 14 9
Total Number of Samples 1,746 110 36 72
Percentage of Samples 6% 35% 65%
Note 1 – Results of identified standard samples were taken from EBA (2013b).
11.4.2 Blanks
A decorative stone (reddish shale) purchased from Home Hardware in Whitehorse, YT, was used as the blank material for both the 2004 and 2006 drill programs. Blank material for the 2009 program was sourced from an on-site sandstone outcrop located near the core storage area. This material was found to be unsuitable as it contains trace Au values and was not used in future programs. Blank material used for the 2010 to 2012 programs was a bull-quartz landscaping product called “Garden Quartz”, packaged by Hillview Products of Barrie, ON.
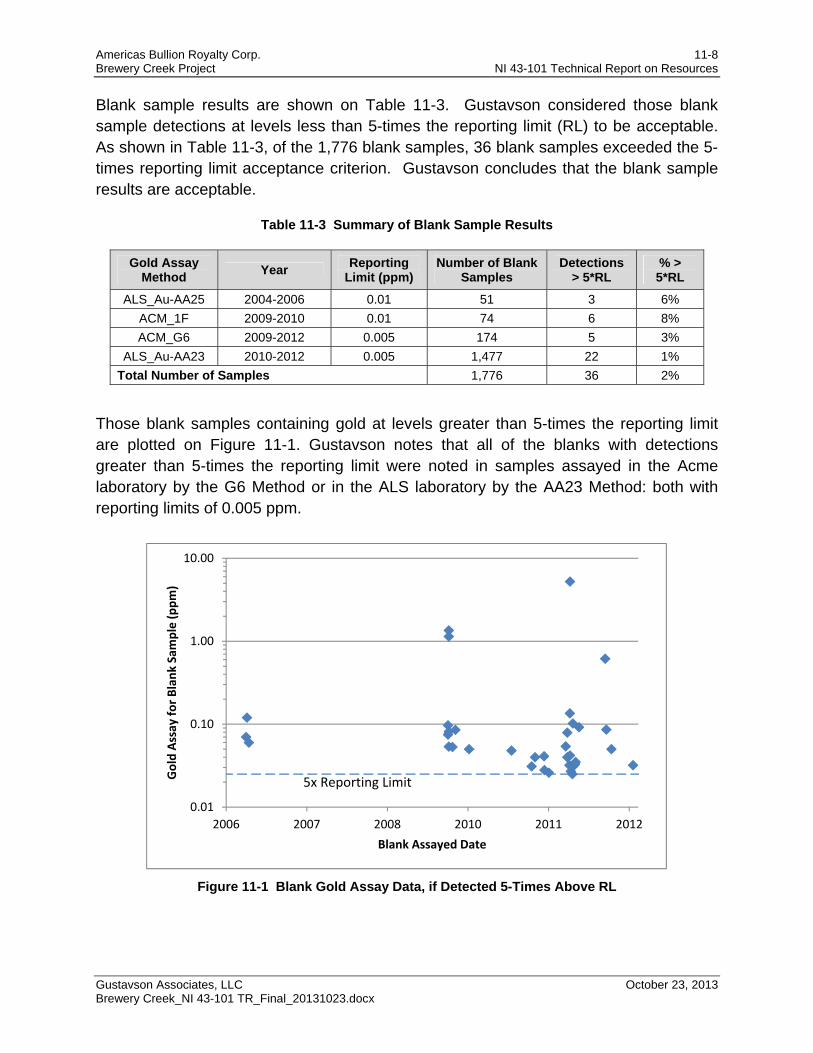
Americas Bullion Royalty Corp. 11-8 Brewery Creek Project NI 43-101 Technical Report on Resources
Gustavson Associates, LLC October 23, 2013 Brewery Creek_NI 43-101 TR_Final_20131023.docx
Blank sample results are shown on Table 11-3. Gustavson considered those blank sample detections at levels less than 5-times the reporting limit (RL) to be acceptable. As shown in Table 11-3, of the 1,776 blank samples, 36 blank samples exceeded the 5-times reporting limit acceptance criterion. Gustavson concludes that the blank sample results are acceptable.
Table 11-3 Summary of Blank Sample Results
Gold Assay Method
Year Reporting
Limit (ppm) Number of Blank
Samples Detections
> 5*RL % > 5*RL
ALS_Au-AA25 2004-2006 0.01 51 3 6%
ACM_1F 2009-2010 0.01 74 6 8%
ACM_G6 2009-2012 0.005 174 5 3%
ALS_Au-AA23 2010-2012 0.005 1,477 22 1%
Total Number of Samples 1,776 36 2%
Those blank samples containing gold at levels greater than 5-times the reporting limit are plotted on Figure 11-1. Gustavson notes that all of the blanks with detections greater than 5-times the reporting limit were noted in samples assayed in the Acme laboratory by the G6 Method or in the ALS laboratory by the AA23 Method: both with reporting limits of 0.005 ppm.
Figure 11-1 Blank Gold Assay Data, if Detected 5-Times Above RL
0.01
0.10
1.00
10.00
2006 2007 2008 2010 2011 2012
Gold Assay for Blank Sample (ppm)
Blank Assayed Date
5x Reporting Limit
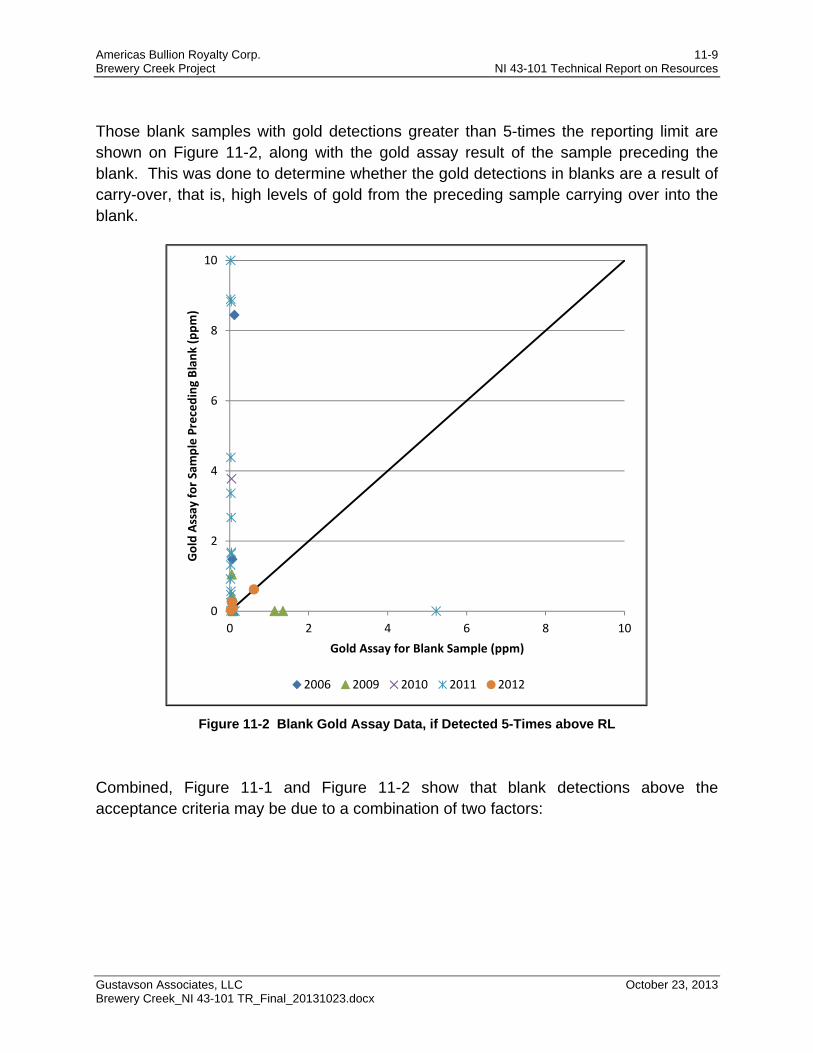
Americas Bullion Royalty Corp. 11-9 Brewery Creek Project NI 43-101 Technical Report on Resources
Gustavson Associates, LLC October 23, 2013 Brewery Creek_NI 43-101 TR_Final_20131023.docx
Those blank samples with gold detections greater than 5-times the reporting limit are shown on Figure 11-2, along with the gold assay result of the sample preceding the blank. This was done to determine whether the gold detections in blanks are a result of carry-over, that is, high levels of gold from the preceding sample carrying over into the blank.
Figure 11-2 Blank Gold Assay Data, if Detected 5-Times above RL
Combined, Figure 11-1 and Figure 11-2 show that blank detections above the acceptance criteria may be due to a combination of two factors:
0
2
4
6
8
10
0 2 4 6 8 10
Gold Assay for Sample Preceding Blank (ppm)
Gold Assay for Blank Sample (ppm)
2006 2009 2010 2011 2012
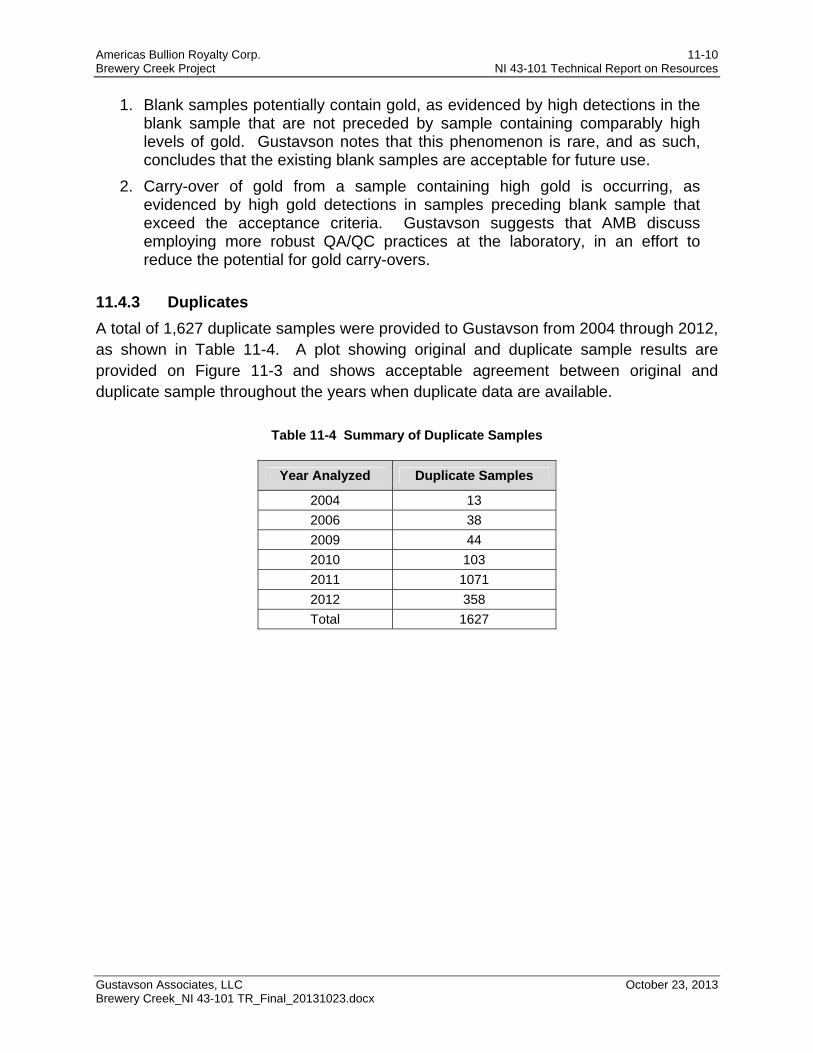
Americas Bullion Royalty Corp. 11-10 Brewery Creek Project NI 43-101 Technical Report on Resources
Gustavson Associates, LLC October 23, 2013 Brewery Creek_NI 43-101 TR_Final_20131023.docx
1. Blank samples potentially contain gold, as evidenced by high detections in the blank sample that are not preceded by sample containing comparably high levels of gold. Gustavson notes that this phenomenon is rare, and as such, concludes that the existing blank samples are acceptable for future use.
2. Carry-over of gold from a sample containing high gold is occurring, as evidenced by high gold detections in samples preceding blank sample that exceed the acceptance criteria. Gustavson suggests that AMB discuss employing more robust QA/QC practices at the laboratory, in an effort to reduce the potential for gold carry-overs.
11.4.3 Duplicates
A total of 1,627 duplicate samples were provided to Gustavson from 2004 through 2012, as shown in Table 11-4. A plot showing original and duplicate sample results are provided on Figure 11-3 and shows acceptable agreement between original and duplicate sample throughout the years when duplicate data are available.
Table 11-4 Summary of Duplicate Samples
Year Analyzed Duplicate Samples
2004 13
2006 38
2009 44
2010 103
2011 1071
2012 358
Total 1627
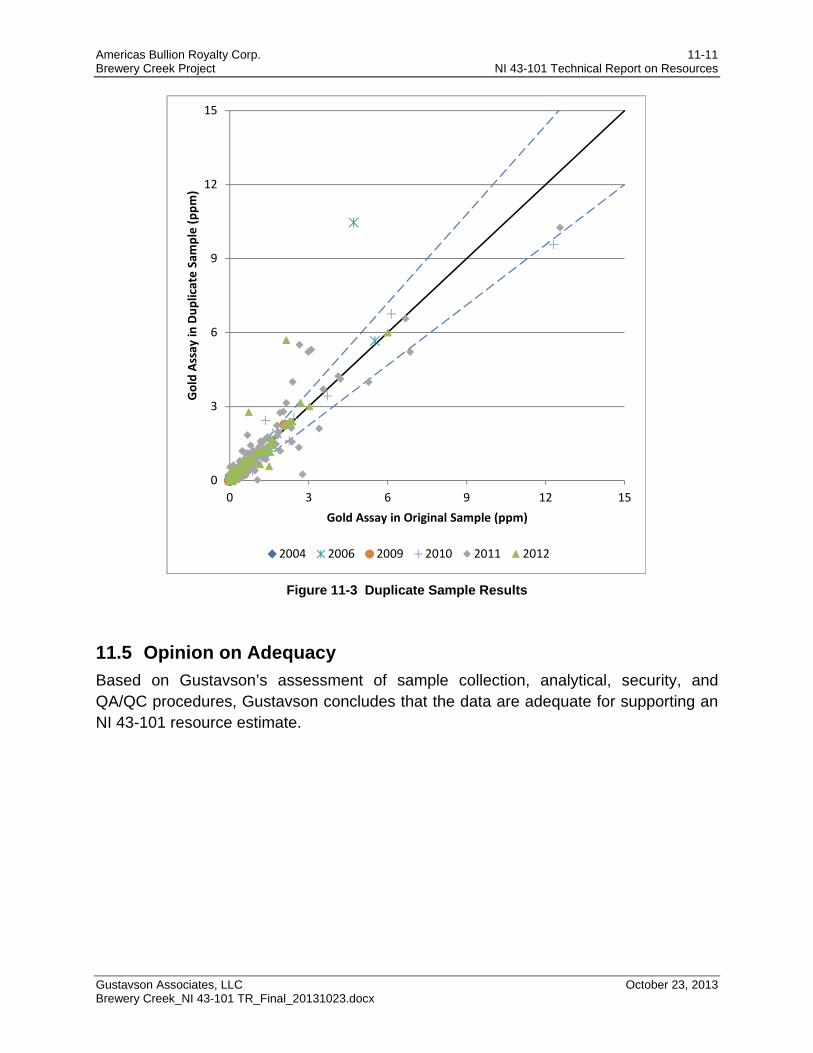
Americas Bullion Royalty Corp. 11-11 Brewery Creek Project NI 43-101 Technical Report on Resources
Gustavson Associates, LLC October 23, 2013 Brewery Creek_NI 43-101 TR_Final_20131023.docx
Figure 11-3 Duplicate Sample Results
11.5 Opinion on Adequacy
Based on Gustavson’s assessment of sample collection, analytical, security, and QA/QC procedures, Gustavson concludes that the data are adequate for supporting an NI 43-101 resource estimate.
0
3
6
9
12
15
0 3 6 9 12 15
Gold Assay in
Duplicate Sam
ple (ppm)
Gold Assay in Original Sample (ppm)
2004 2006 2009 2010 2011 2012
Americas Bullion Royalty Corp. 12-1 Brewery Creek Project NI 43-101 Technical Report on Resources
Gustavson Associates, LLC October 23, 2013 Brewery Creek_NI 43-101 TR_Final_20131023.docx
12 Data Verification (Item 12) Verification of data used for resource estimation was completed and signed off by three parties.
EBA completed a site visit and data verification as reported in a previous Technical Report titled “Updated Mineral Resource Estimate for the Brewery Creek Property, Yukon Territory, Canada, effective March 11th, 2012 and amended January 17th, 2013”. The verification results from the general database and of data in support of the resource estimates of the North Slope and Sleeman deposits have been extracted from EBA’s report and summarized in the current report.
RMI is responsible for verifying data used to support the resource estimates of the Bohemian, Schooner, Fosters, West and East Big Rock, Classic, Lone Star, and former heap leach pad.
Gustavson is responsible for verifying the data used to support the resource estimates of the Kokanee, Golden, Pacific, Blue, and Lucky deposits.
Data verification completed by the three parties is described in the following sections.
12.1 Data Verification by EBA
12.1.1 Verification of Historical Data
Physical drill core and RC chip sample records for historical drilling on the property were no longer retained at the Brewery Creek Project facility. The assay certificates for a portion of the historical drillholes were not available for data verification. Given these limitations, a desktop review was conducted comparing results from historical drillholes with more recent AMB drill data.
Recent drilling conducted by AMB aimed to test the validity of historically reported gold grades. The traces of 12 historical holes lie within 7 metres of AMB holes (Table 12-1): EBA visually inspected the twinned intersections using geological software and found them to compare favorably in terms of mineralization depth, intercept thickness, grade and logged lithology. The majority of AMB drilling lies with 25 metres of Loki-Viceroy era holes. In general, nearby holes from the historical drill dataset show strong similarities in the intercept thickness, tenor and logged lithologies with AMB drilling.
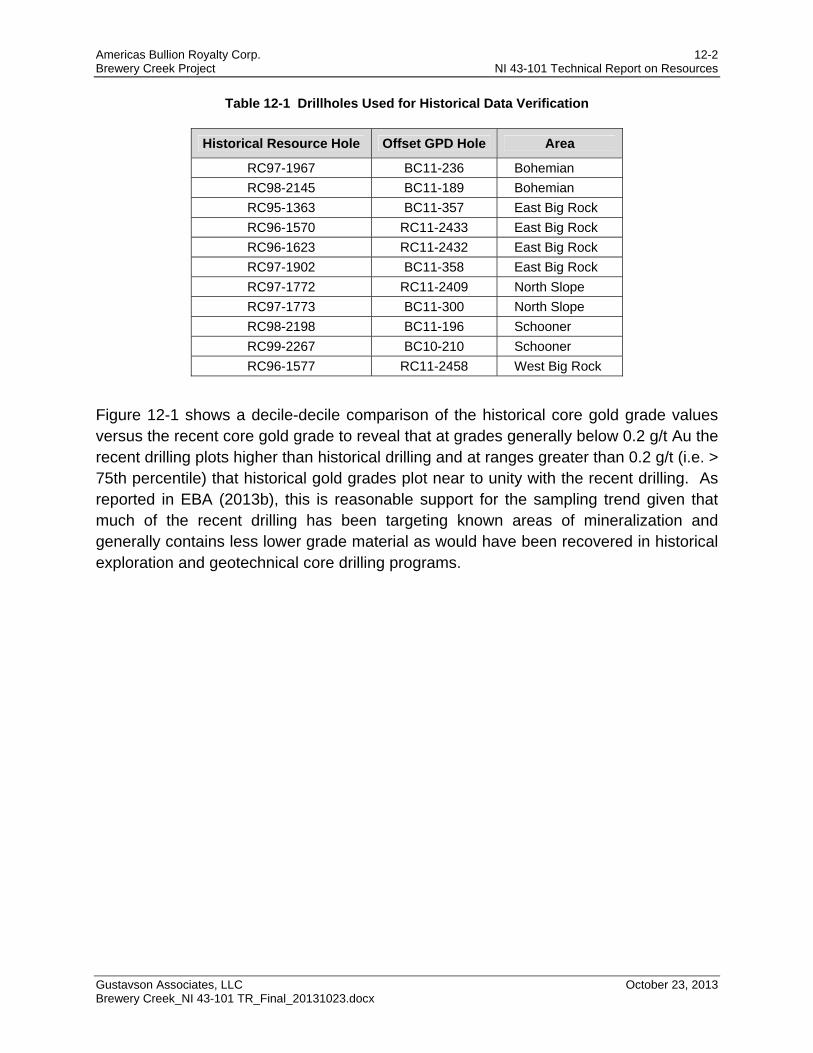
Americas Bullion Royalty Corp. 12-2 Brewery Creek Project NI 43-101 Technical Report on Resources
Gustavson Associates, LLC October 23, 2013 Brewery Creek_NI 43-101 TR_Final_20131023.docx
Table 12-1 Drillholes Used for Historical Data Verification
Historical Resource Hole Offset GPD Hole Area
RC97-1967 BC11-236 Bohemian
RC98-2145 BC11-189 Bohemian
RC95-1363 BC11-357 East Big Rock
RC96-1570 RC11-2433 East Big Rock
RC96-1623 RC11-2432 East Big Rock
RC97-1902 BC11-358 East Big Rock
RC97-1772 RC11-2409 North Slope
RC97-1773 BC11-300 North Slope
RC98-2198 BC11-196 Schooner
RC99-2267 BC10-210 Schooner
RC96-1577 RC11-2458 West Big Rock
Figure 12-1 shows a decile-decile comparison of the historical core gold grade values versus the recent core gold grade to reveal that at grades generally below 0.2 g/t Au the recent drilling plots higher than historical drilling and at ranges greater than 0.2 g/t (i.e. > 75th percentile) that historical gold grades plot near to unity with the recent drilling. As reported in EBA (2013b), this is reasonable support for the sampling trend given that much of the recent drilling has been targeting known areas of mineralization and generally contains less lower grade material as would have been recovered in historical exploration and geotechnical core drilling programs.
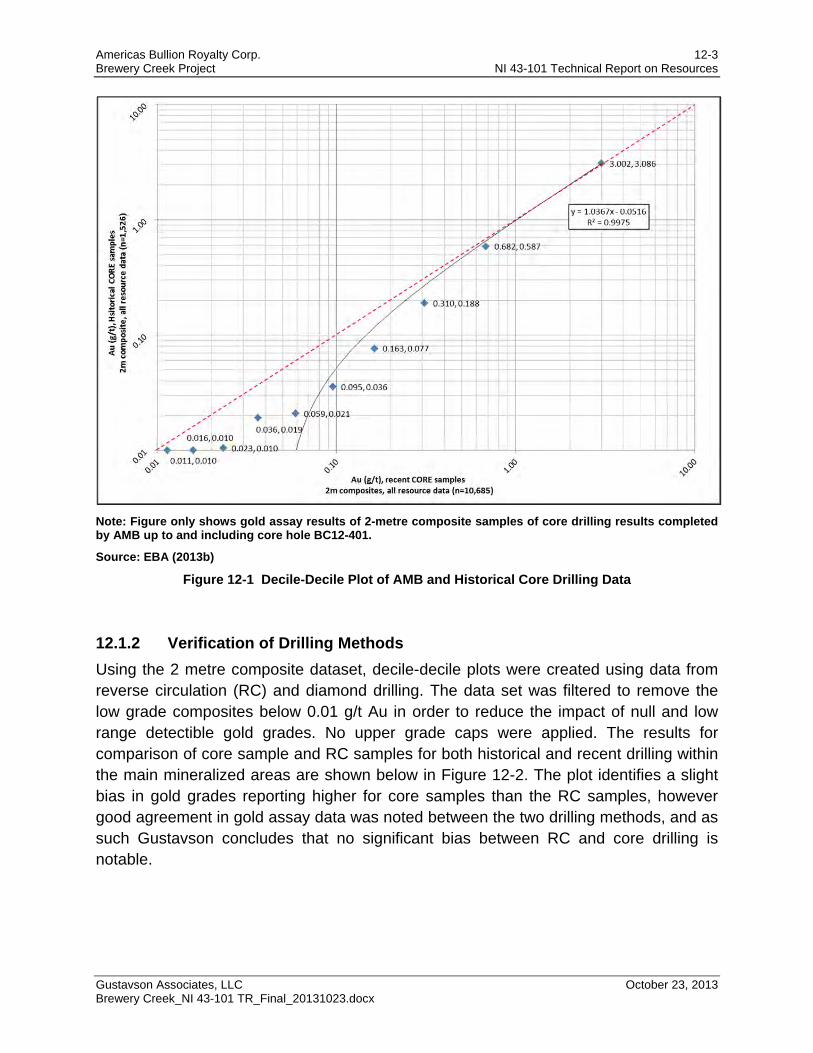
Americas Bullion Royalty Corp. 12-3 Brewery Creek Project NI 43-101 Technical Report on Resources
Gustavson Associates, LLC October 23, 2013 Brewery Creek_NI 43-101 TR_Final_20131023.docx
Note: Figure only shows gold assay results of 2-metre composite samples of core drilling results completed by AMB up to and including core hole BC12-401.
Source: EBA (2013b)
Figure 12-1 Decile-Decile Plot of AMB and Historical Core Drilling Data
12.1.2 Verification of Drilling Methods
Using the 2 metre composite dataset, decile-decile plots were created using data from reverse circulation (RC) and diamond drilling. The data set was filtered to remove the low grade composites below 0.01 g/t Au in order to reduce the impact of null and low range detectible gold grades. No upper grade caps were applied. The results for comparison of core sample and RC samples for both historical and recent drilling within the main mineralized areas are shown below in Figure 12-2. The plot identifies a slight bias in gold grades reporting higher for core samples than the RC samples, however good agreement in gold assay data was noted between the two drilling methods, and as such Gustavson concludes that no significant bias between RC and core drilling is notable.

Americas Bullion Royalty Corp. 12-4 Brewery Creek Project NI 43-101 Technical Report on Resources
Gustavson Associates, LLC October 23, 2013 Brewery Creek_NI 43-101 TR_Final_20131023.docx
Source: EBA (2013b)
Figure 12-2 Decile-Decile Plot for RC and Core Drilling Data
In a comparison that included only drilling data by Loki/Viceroy (Figure 12-3), low grade ranges below 0.1 g/t Au appear to bias slightly towards the RC sampling, where grades plotting above 0.2 g/t Au plot near the unity line. The number of historical RC samples (n=21,611) far exceeds that of the core samples (n=1,526). This trend suggests that no significant bias is noted in the historical Viceroy data within the useable range of gold grades at the property database scale.
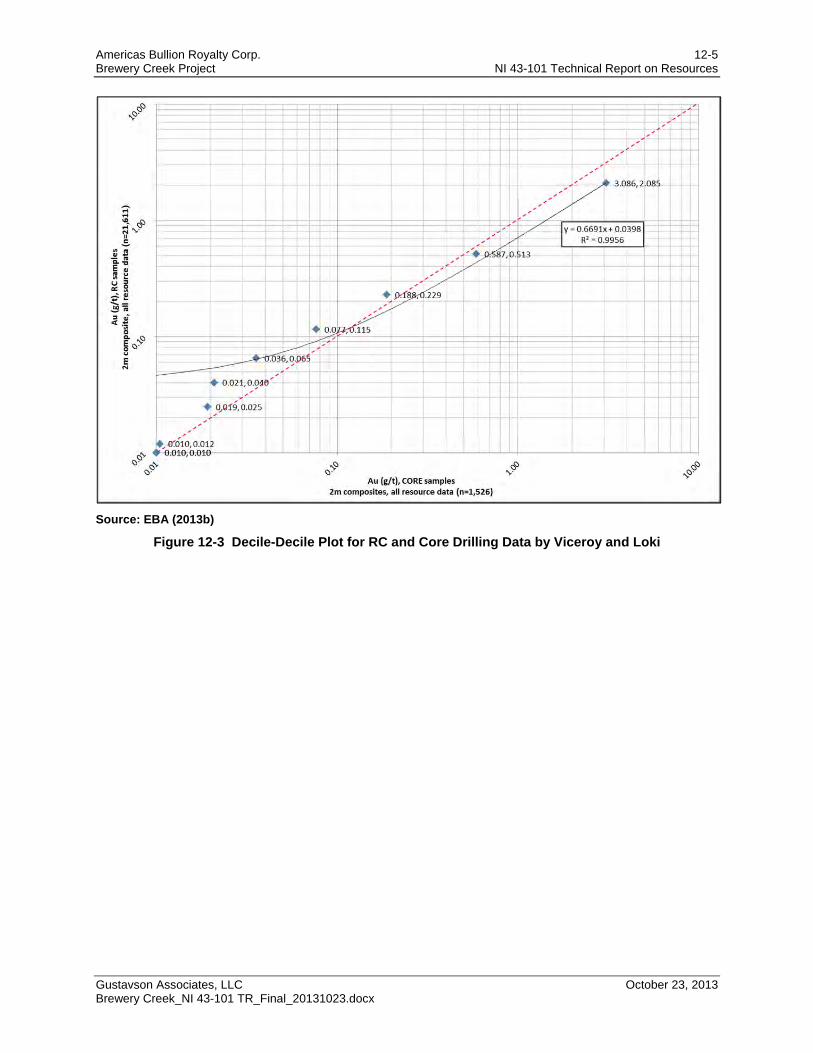
Americas Bullion Royalty Corp. 12-5 Brewery Creek Project NI 43-101 Technical Report on Resources
Gustavson Associates, LLC October 23, 2013 Brewery Creek_NI 43-101 TR_Final_20131023.docx
Source: EBA (2013b)
Figure 12-3 Decile-Decile Plot for RC and Core Drilling Data by Viceroy and Loki
Americas Bullion Royalty Corp. 12-6 Brewery Creek Project NI 43-101 Technical Report on Resources
Gustavson Associates, LLC October 23, 2013 Brewery Creek_NI 43-101 TR_Final_20131023.docx
12.1.3 Verification of Collar Data
Drillhole location and orientation data used in the database has been extracted and from the original Viceroy AutoCAD database, verified with available logs and survey reports and retranslated from historical mine grid co-ordinates to UTM coordinates. Historical Viceroy surveying was completed from 1996 onwards using survey grade Trimble equipment which measured and reported both latitude and longitude, and local coordinates with the Viceroy mine grid. Control of the surface coordinates was completed by AMB in 2009-2010 with the assistance from the original Viceroy surveyor. In total, approximately 40 historical drillhole collar monuments were located, mostly as stakes with labeled aluminum tags, between west Big Rock and Schooner and used to define an accurate transformation from the original mine grid to modern UTM co-ordinates that could be applied to all historical drillholes and surveyed information. The process was completed using an affine polynomial algorithm and was verified using actual road centerlines and later with the 2011 LIDAR survey conducted on the property. In 2010, it was determined by AMB that an upward 2.49 metre vertical shift be applied to the historical datum used by Viceroy. Comparison of the re-surveyed historical monuments to the transformed database co-ordinates results in location deviation ranging from approximately 0.5 to 2 metres at the lateral extents of the property. EBA has reviewed the database and methodology used to undertake this transformation and feels that it has been completed using acceptable and modern methods.
12.1.4 EBA Statement on Historical Data Verification
EBA feels that the historical drilling data is verifiable and valid for use in mineral resource estimation. Support is based on the review of historical results, positive comparison of the historical results to recent AMB drilling and minimal to no bias apparent between the various datasets.
12.1.5 EBA Data Verification of AMB Data
12.1.5.1 EBA Site Visit
A site visit was conducted between March 19-21, 2012, by EBA geologist and Independent QP James Barr, P. Geo. The purpose of the visit was to become familiar with the site layout and facilities, review core logging and sample handling procedures, review drill core and collect core samples from recent AMB drilling for independent analysis. Mr. Barr was accompanied by AMB Senior Geologist Bruce Otto, Geologist Mark Shutty and Program Manager Don Penner for the duration of the visit. A second site visit was conducted from May 30 to 31, 2012, at which time no QA/QC review or sample collection was completed.
Americas Bullion Royalty Corp. 12-7 Brewery Creek Project NI 43-101 Technical Report on Resources
Gustavson Associates, LLC October 23, 2013 Brewery Creek_NI 43-101 TR_Final_20131023.docx
In total, 7 core holes were reviewed while on site in March, 2012, which provided a familiarity of the variety of rock types and mineralizing systems present at the Brewery Creek Project. Specific core intervals from these holes were selected based on availability, spatial distribution and representative grades.
12.1.5.2 EBA Independent Samples
During this field visit 6 samples were collected from 4 holes, packaged in sampling bags, and transported by Mr. Barr to the EBA offices in Vancouver and then couriered directly to ALS Chemex laboratories for analysis.
For QA/QC purposes a Standard Reference Material (SRM) and a blank sample was included in the sample batch for a total of 8 samples for laboratory analysis at ALS Chemex (Vancouver). Table 12-2 presents the results of the ALS Chemex tests, labeled as EBA, against the original AMB analytical values for Au, and Ag.
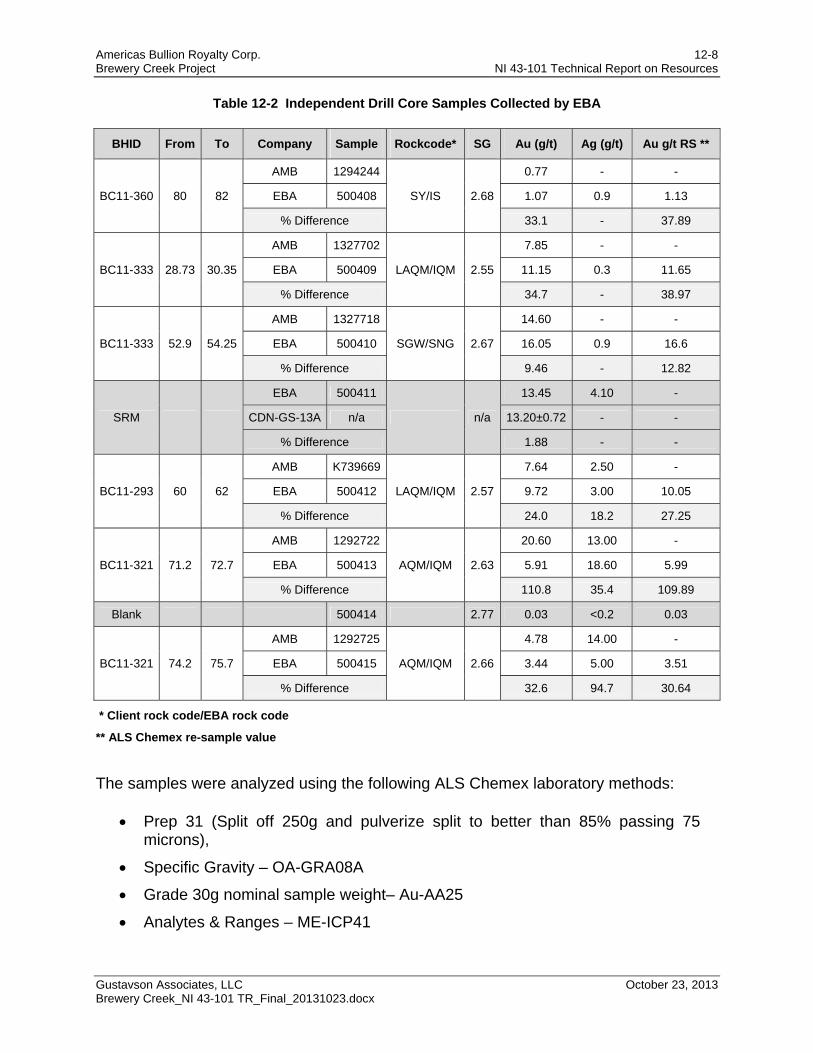
Americas Bullion Royalty Corp. 12-8 Brewery Creek Project NI 43-101 Technical Report on Resources
Gustavson Associates, LLC October 23, 2013 Brewery Creek_NI 43-101 TR_Final_20131023.docx
Table 12-2 Independent Drill Core Samples Collected by EBA
BHID From To Company Sample Rockcode* SG Au (g/t) Ag (g/t) Au g/t RS **
BC11-360 80 82
AMB 1294244
SY/IS 2.68
0.77 - -
EBA 500408 1.07 0.9 1.13
% Difference 33.1 - 37.89
BC11-333 28.73 30.35
AMB 1327702
LAQM/IQM 2.55
7.85 - -
EBA 500409 11.15 0.3 11.65
% Difference 34.7 - 38.97
BC11-333 52.9 54.25
AMB 1327718
SGW/SNG 2.67
14.60 - -
EBA 500410 16.05 0.9 16.6
% Difference 9.46 - 12.82
SRM
EBA 500411
n/a
13.45 4.10 -
CDN-GS-13A n/a 13.20±0.72 - -
% Difference 1.88 - -
BC11-293 60 62
AMB K739669
LAQM/IQM 2.57
7.64 2.50 -
EBA 500412 9.72 3.00 10.05
% Difference 24.0 18.2 27.25
BC11-321 71.2 72.7
AMB 1292722
AQM/IQM 2.63
20.60 13.00 -
EBA 500413 5.91 18.60 5.99
% Difference 110.8 35.4 109.89
Blank 500414 2.77 0.03 <0.2 0.03
BC11-321 74.2 75.7
AMB 1292725
AQM/IQM 2.66
4.78 14.00 -
EBA 500415 3.44 5.00 3.51
% Difference 32.6 94.7 30.64
* Client rock code/EBA rock code
** ALS Chemex re-sample value
The samples were analyzed using the following ALS Chemex laboratory methods:
Prep 31 (Split off 250g and pulverize split to better than 85% passing 75 microns),
Specific Gravity – OA-GRA08A
Grade 30g nominal sample weight– Au-AA25
Analytes & Ranges – ME-ICP41

Americas Bullion Royalty Corp. 12-9 Brewery Creek Project NI 43-101 Technical Report on Resources
Gustavson Associates, LLC October 23, 2013 Brewery Creek_NI 43-101 TR_Final_20131023.docx
EBA conducted a percent difference comparison (Equation 1) of the original AMB values against the analytical results provided by ALS Chemex. A percent difference is used to provide an absolute difference between the duplicate samples relative to their mean allowing meaningful comparison independent of the magnitude of the individual grades. The analysis was calculated using the following formula where, AMB is the original analytical result, and EBA is the duplicate analytical result obtained from ALS Chemex.
Equation 1: Percent Difference Comparison
%
2
100%
Through discussion and observations made while on site, EBA confirms that AMB is using best practices in their exploration and sample collection procedures.
Results from the independent sample collection using percent difference analysis show that in 4 of the 6 samples tested, the AMB samples graded lower (Au g/t) than that of the EBA samples (ALS Chemex) analysis. AMB samples 1292725 and 1292722 were exception to this with +110.8% and +32.6% differences, respectfully.
Due to the irregularities found in the percent difference comparison for EBA sample 500413, sample re-analysis was requested at ALS Chemex. The results for the re-sampling indicate slight global increase in all reported gold grades. The results, however, do support consistent values and reproducibility of the grades as seen in Table 12-2.
Specific gravity (SG) for each sample was tested and fall within the ranges of values determined by AMB work. This analysis showed no major deviation in the results in terms of the tested lithologies and analytical results.
12.1.5.3 EBA Statement on Verification of AMB’s Drill Data
EBA sampling conducted on site indicated a slight variance in grade results for all samples collected on site. The positive percent difference found in hole BC11-321 was exceptionally high and may be accountable to a core recovery issue following sampling or to material shifting within the core box as the material was broken and integrity was quite poor. A number of factors could account for this deviation; however, it is not felt that a bias is present in the dataset.
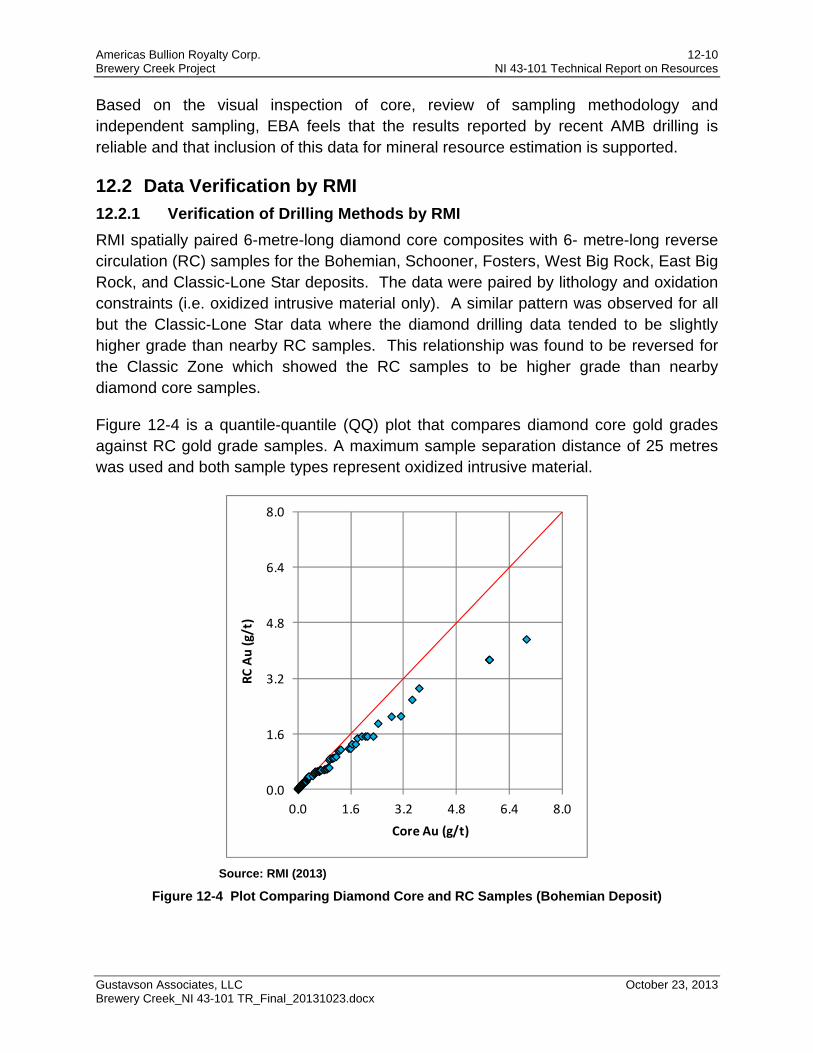
Americas Bullion Royalty Corp. 12-10 Brewery Creek Project NI 43-101 Technical Report on Resources
Gustavson Associates, LLC October 23, 2013 Brewery Creek_NI 43-101 TR_Final_20131023.docx
Based on the visual inspection of core, review of sampling methodology and independent sampling, EBA feels that the results reported by recent AMB drilling is reliable and that inclusion of this data for mineral resource estimation is supported.
12.2 Data Verification by RMI
12.2.1 Verification of Drilling Methods by RMI
RMI spatially paired 6-metre-long diamond core composites with 6- metre-long reverse circulation (RC) samples for the Bohemian, Schooner, Fosters, West Big Rock, East Big Rock, and Classic-Lone Star deposits. The data were paired by lithology and oxidation constraints (i.e. oxidized intrusive material only). A similar pattern was observed for all but the Classic-Lone Star data where the diamond drilling data tended to be slightly higher grade than nearby RC samples. This relationship was found to be reversed for the Classic Zone which showed the RC samples to be higher grade than nearby diamond core samples.
Figure 12-4 is a quantile-quantile (QQ) plot that compares diamond core gold grades against RC gold grade samples. A maximum sample separation distance of 25 metres was used and both sample types represent oxidized intrusive material.
Source: RMI (2013)
Figure 12-4 Plot Comparing Diamond Core and RC Samples (Bohemian Deposit)
0.0
1.6
3.2
4.8
6.4
8.0
0.0 1.6 3.2 4.8 6.4 8.0
RC Au (g/t)
Core Au (g/t)
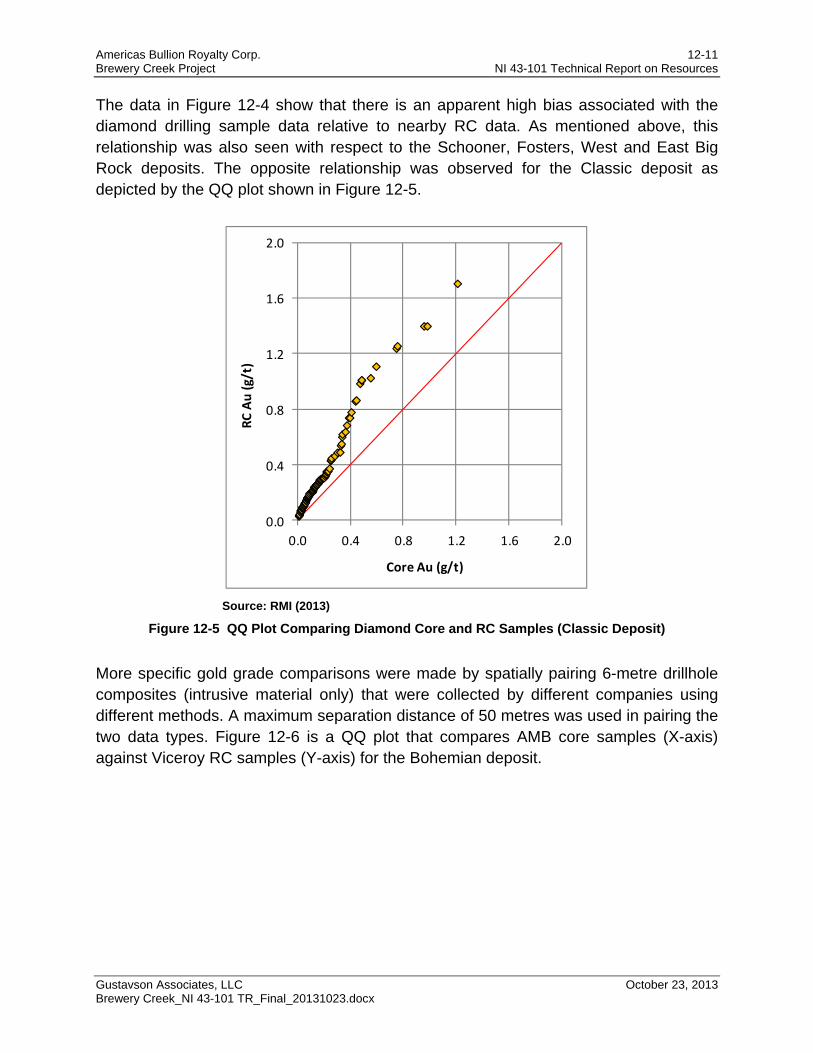
Americas Bullion Royalty Corp. 12-11 Brewery Creek Project NI 43-101 Technical Report on Resources
Gustavson Associates, LLC October 23, 2013 Brewery Creek_NI 43-101 TR_Final_20131023.docx
The data in Figure 12-4 show that there is an apparent high bias associated with the diamond drilling sample data relative to nearby RC data. As mentioned above, this relationship was also seen with respect to the Schooner, Fosters, West and East Big Rock deposits. The opposite relationship was observed for the Classic deposit as depicted by the QQ plot shown in Figure 12-5.
Source: RMI (2013)
Figure 12-5 QQ Plot Comparing Diamond Core and RC Samples (Classic Deposit)
More specific gold grade comparisons were made by spatially pairing 6-metre drillhole composites (intrusive material only) that were collected by different companies using different methods. A maximum separation distance of 50 metres was used in pairing the two data types. Figure 12-6 is a QQ plot that compares AMB core samples (X-axis) against Viceroy RC samples (Y-axis) for the Bohemian deposit.
0.0
0.4
0.8
1.2
1.6
2.0
0.0 0.4 0.8 1.2 1.6 2.0
RC Au (g/t)
Core Au (g/t)
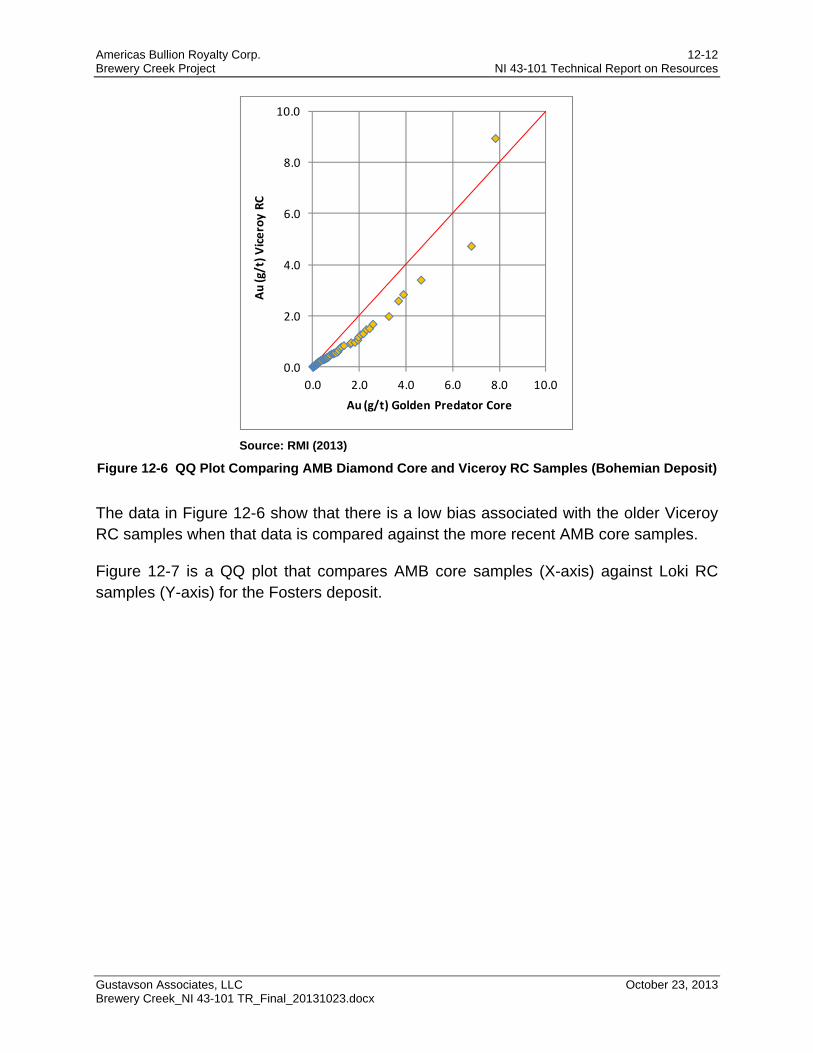
Americas Bullion Royalty Corp. 12-12 Brewery Creek Project NI 43-101 Technical Report on Resources
Gustavson Associates, LLC October 23, 2013 Brewery Creek_NI 43-101 TR_Final_20131023.docx
Source: RMI (2013)
Figure 12-6 QQ Plot Comparing AMB Diamond Core and Viceroy RC Samples (Bohemian Deposit)
The data in Figure 12-6 show that there is a low bias associated with the older Viceroy RC samples when that data is compared against the more recent AMB core samples.
Figure 12-7 is a QQ plot that compares AMB core samples (X-axis) against Loki RC samples (Y-axis) for the Fosters deposit.
0.0
2.0
4.0
6.0
8.0
10.0
0.0 2.0 4.0 6.0 8.0 10.0
Au (g/t) Viceroy RC
Au (g/t) Golden Predator Core
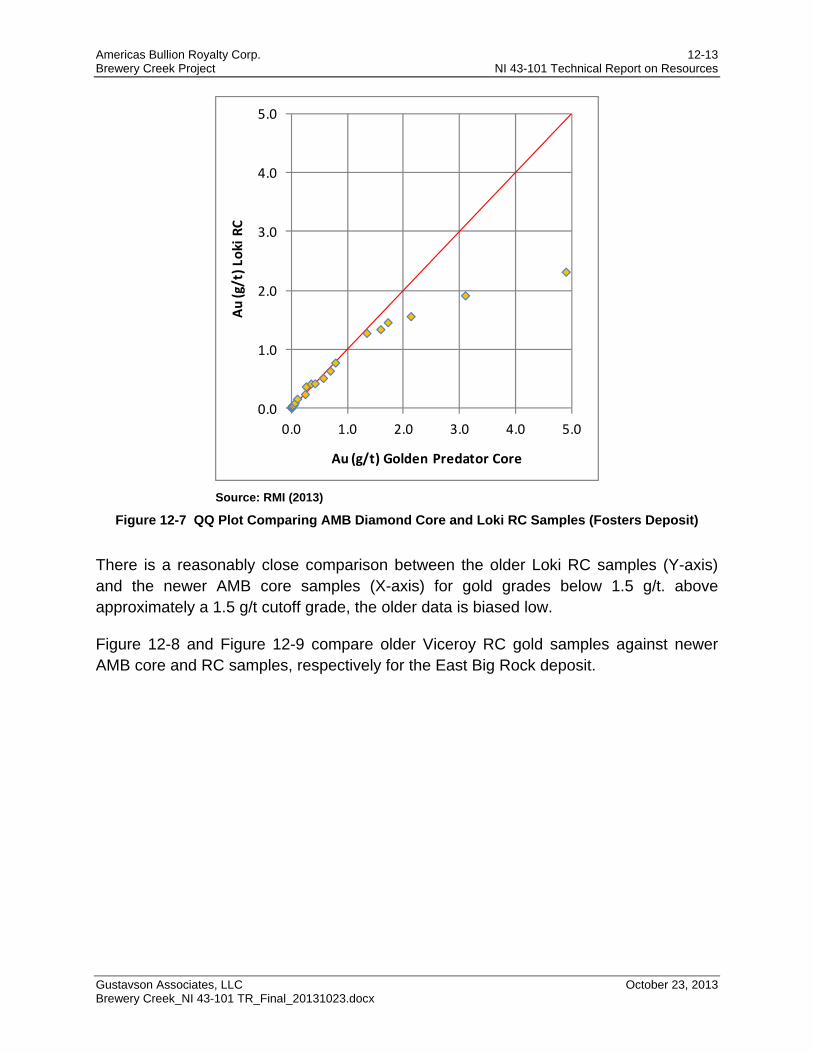
Americas Bullion Royalty Corp. 12-13 Brewery Creek Project NI 43-101 Technical Report on Resources
Gustavson Associates, LLC October 23, 2013 Brewery Creek_NI 43-101 TR_Final_20131023.docx
Source: RMI (2013)
Figure 12-7 QQ Plot Comparing AMB Diamond Core and Loki RC Samples (Fosters Deposit)
There is a reasonably close comparison between the older Loki RC samples (Y-axis) and the newer AMB core samples (X-axis) for gold grades below 1.5 g/t. above approximately a 1.5 g/t cutoff grade, the older data is biased low.
Figure 12-8 and Figure 12-9 compare older Viceroy RC gold samples against newer AMB core and RC samples, respectively for the East Big Rock deposit.
0.0
1.0
2.0
3.0
4.0
5.0
0.0 1.0 2.0 3.0 4.0 5.0
Au (g/t) Loki RC
Au (g/t) Golden Predator Core
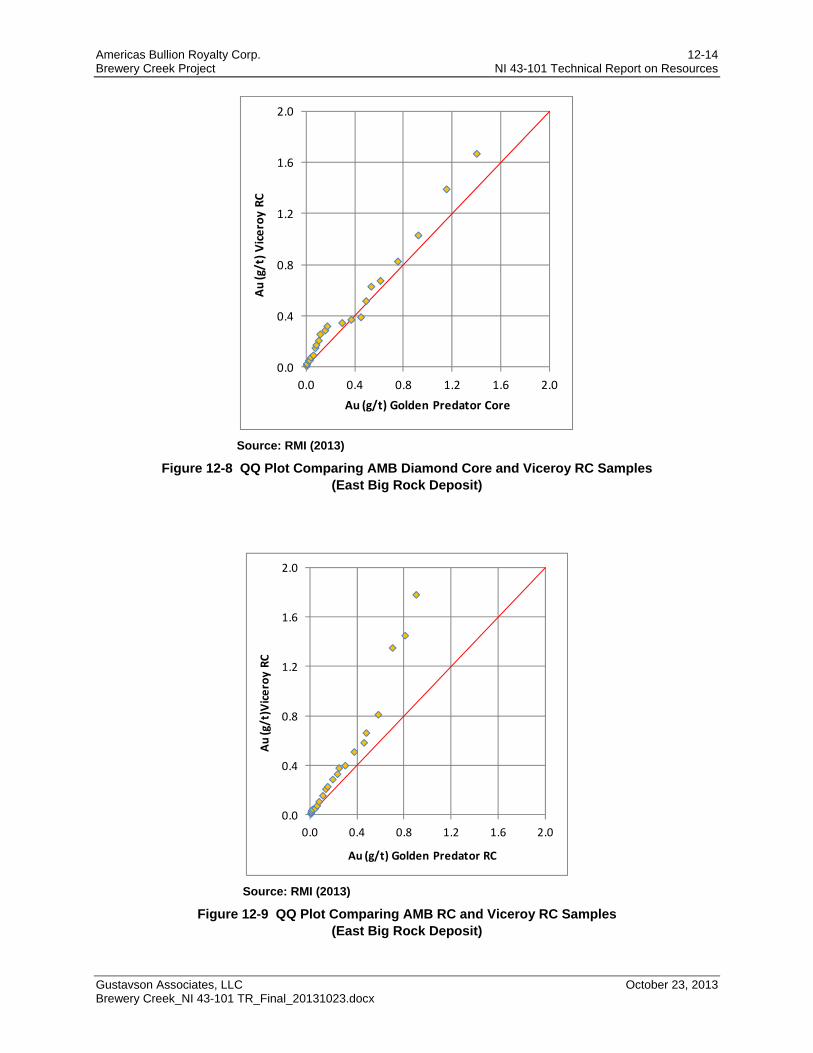
Americas Bullion Royalty Corp. 12-14 Brewery Creek Project NI 43-101 Technical Report on Resources
Gustavson Associates, LLC October 23, 2013 Brewery Creek_NI 43-101 TR_Final_20131023.docx
Source: RMI (2013)
Figure 12-8 QQ Plot Comparing AMB Diamond Core and Viceroy RC Samples (East Big Rock Deposit)
Source: RMI (2013)
Figure 12-9 QQ Plot Comparing AMB RC and Viceroy RC Samples (East Big Rock Deposit)
0.0
0.4
0.8
1.2
1.6
2.0
0.0 0.4 0.8 1.2 1.6 2.0
Au (g/t) Viceroy RC
Au (g/t) Golden Predator Core
0.0
0.4
0.8
1.2
1.6
2.0
0.0 0.4 0.8 1.2 1.6 2.0
Au (g/t)Viceroy RC
Au (g/t) Golden Predator RC
Americas Bullion Royalty Corp. 12-15 Brewery Creek Project NI 43-101 Technical Report on Resources
Gustavson Associates, LLC October 23, 2013 Brewery Creek_NI 43-101 TR_Final_20131023.docx
The QQ plot data in Figure 12-8 and Figure 12-9 that compare Viceroy RC data against AMB core and RC samples show that there is a slight high bias associated with the Viceroy RC data.
RMI compared diamond core sample data with nearby reverse circulation (RC) samples to see if there were any significant differences in gold grades. The original assay samples were composited to 6-metre lengths and then core and RC samples were spatially paired provided both samples types were collected from oxidized intrusive material. RMI notes that there is a slight to moderate high-grade bias associated with core hole samples collected from the Bohemian, Schooner, Fosters, West Big Rock, and East Big Rock deposits. The opposite relationship (i.e. RC samples were higher than core) was observed with the Classic-Lone Star deposit data. At this stage of exploration at Classic it is difficult to determine the cause behind these apparent differences. Groundwater is often the cause for poor RC sampling results but according to AMB's geologic staff, groundwater should not be an issue with the RC samples at Classic. Figure 12-10 contains six quantile-quantile (QQ) plots that compare RC gold grades (Y-axis) with core gold grades (X-axis). As mentioned above, core hole assays from most of the deposits tend to be higher than the RC data above a 0.5 to 1.0 g/t cutoff grade.

Americas Bullion Royalty Corp. 12-16 Brewery Creek Project NI 43-101 Technical Report on Resources
Gustavson Associates, LLC October 23, 2013 Brewery Creek_NI 43-101 TR_Final_20131023.docx
Source: RMI (2013)
Figure 12-10 QQ Plots of RC and Core Gold Grades
Americas Bullion Royalty Corp. 12-17 Brewery Creek Project NI 43-101 Technical Report on Resources
Gustavson Associates, LLC October 23, 2013 Brewery Creek_NI 43-101 TR_Final_20131023.docx
RMI compared gold grades with core recovery for the Classic-Lone Star deposit to see if gold was being lost when recovery was poor. Gold grades are seen to increase marginally as core recovery increases. It is possible that the core samples are not as representative as RC samples at Classic but RMI is recommending that AMB drill three to five diamond holes next to existing RC holes to further examine biases.
Based on the sample studies that have been completed it is RMI's opinion that the core and RC samples are suitable to be used to estimate Mineral Resources for the Bohemian, Schooner, Fosters, West Big Rock and East Big Rock zones. Because of wider spaced drilling and the potential for biased RC samples, RMI elected to classify Classic and Lone Star as Inferred Resources.
RMI examined sampling and assaying procedures that were implemented by AMB and also verified that assay records from the 2012 drilling campaign were accurately entered into the project database. Various diamond core and RC sample data were spatially paired and then compared with one another to check for possible biases. In general, most of the spatially paired sample comparisons suggest that the older RC sample data are biased low when compared against AMB core data.
Based on RMI's verification procedures the gold assay data used for the Brewery Creek Project are suitable for estimating Mineral Resources. RMI recommends that AMB follow up on the apparent high-bias associated with Classic and East Big Rock RC samples by drilling two or three core holes adjacent to existing RC holes so that possible biases can be further analyzed.
12.2.2 RMI’s Verification of AMB Drill Data
12.2.2.1 RMI’s Site Visit
A site visit was conducted between October 16 and October 18 2012, by RMI geologist and Independent QP Michael Lechner, P. Geo. The purpose of the visit was to become familiar with the site layout and facilities, review core drilling procedures, review core logging/sample handling procedures, examine drill core and review electronic data collection practices. Mr. Lechner was accompanied by AMB Senior Geologist Bruce Otto and Project Geologist Tyler Bourne.
While on site, Mr. Lechner examined two diamond drill rigs that were operating in the Classic-Lone Star areas. The first drill rig that was visited was an A5 drill operated by Matrix Diamond Drilling Inc. (drillhole BC12-580).The hole was approximately 250 metres deep at the time of the visit. The drill site was clean and the core was correctly handled at the site. The second drill rig that was visited was operated by Kluane Drilling Ltd. (drillhole BC12-576). Both drill rigs appeared to be delivering nearly 100% recovery. Both drills were using NQ tools with 10-foot-long core barrels.
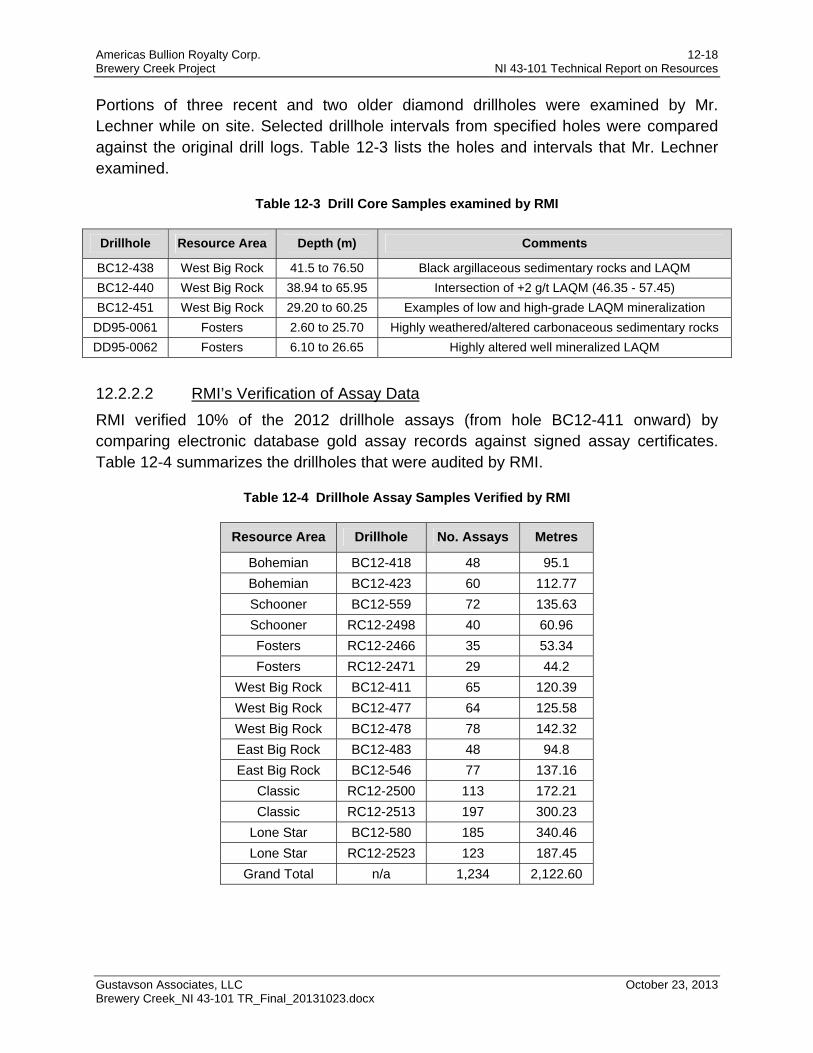
Americas Bullion Royalty Corp. 12-18 Brewery Creek Project NI 43-101 Technical Report on Resources
Gustavson Associates, LLC October 23, 2013 Brewery Creek_NI 43-101 TR_Final_20131023.docx
Portions of three recent and two older diamond drillholes were examined by Mr. Lechner while on site. Selected drillhole intervals from specified holes were compared against the original drill logs. Table 12-3 lists the holes and intervals that Mr. Lechner examined.
Table 12-3 Drill Core Samples examined by RMI
Drillhole Resource Area Depth (m) Comments
BC12-438 West Big Rock 41.5 to 76.50 Black argillaceous sedimentary rocks and LAQM
BC12-440 West Big Rock 38.94 to 65.95 Intersection of +2 g/t LAQM (46.35 - 57.45)
BC12-451 West Big Rock 29.20 to 60.25 Examples of low and high-grade LAQM mineralization
DD95-0061 Fosters 2.60 to 25.70 Highly weathered/altered carbonaceous sedimentary rocks
DD95-0062 Fosters 6.10 to 26.65 Highly altered well mineralized LAQM
12.2.2.2 RMI’s Verification of Assay Data
RMI verified 10% of the 2012 drillhole assays (from hole BC12-411 onward) by comparing electronic database gold assay records against signed assay certificates. Table 12-4 summarizes the drillholes that were audited by RMI.
Table 12-4 Drillhole Assay Samples Verified by RMI
Resource Area Drillhole No. Assays Metres
Bohemian BC12-418 48 95.1
Bohemian BC12-423 60 112.77
Schooner BC12-559 72 135.63
Schooner RC12-2498 40 60.96
Fosters RC12-2466 35 53.34
Fosters RC12-2471 29 44.2
West Big Rock BC12-411 65 120.39
West Big Rock BC12-477 64 125.58
West Big Rock BC12-478 78 142.32
East Big Rock BC12-483 48 94.8
East Big Rock BC12-546 77 137.16
Classic RC12-2500 113 172.21
Classic RC12-2513 197 300.23
Lone Star BC12-580 185 340.46
Lone Star RC12-2523 123 187.45
Grand Total n/a 1,234 2,122.60
Americas Bullion Royalty Corp. 12-19 Brewery Creek Project NI 43-101 Technical Report on Resources
Gustavson Associates, LLC October 23, 2013 Brewery Creek_NI 43-101 TR_Final_20131023.docx
No gold assay database errors were discovered by RMI. Drillhole collar locations were compared against the provided topographic surfaces. Minor elevation differences were noted for some holes and are thought to be associated with reclaimed drill pads which made the collars appear to be slightly low.
12.2.2.3 RMI Statement Regarding Data Verification
RMI examined sampling and assaying procedures that were implemented by AMB and also verified that assay records from the 2012 drilling campaign were accurately entered into the project database. Various diamond core and RC sample data were spatially paired and then compared with one another to check for possible biases. In general, most of the spatially paired sample comparisons suggest that the older RC sample data are biased low when compared against AMB core data.
Based on RMI's verification procedures the gold assay data used for the Brewery Creek Project are suitable for estimating Mineral Resources. RMI recommends that AMB follow up on the apparent high-bias associated with Classic and East Big Rock RC samples by drilling two or three core holes adjacent to existing RC holes so that possible biases can be further analyzed.
12.3 Data Verification by Gustavson
12.3.1 Verification of Historical Data
To validate historical drilling, Gustavson performed a point validation analysis on the historical data. Historical data were used to estimate at gold grade value at the XYZ location of AMB samples using an Inverse Distance Squared method. The estimated values were then compared to the actual value of the AMB sample at that location. A correlation analysis was then performed on the estimated versus actual data. Point validation was restricted by major rock type (intrusive or sedimentary). The results of the correlation analyses were mixed, and Gustavson performed other analyses to confirm historical data. Gustavson next compared the historical drillhole and blasthole data on a bench by bench basis. This analysis showed that the two independent assay campaigns showed similar high grade zones in blastholes and nearby drillholes. Visual inspection showed a good correlation, though it indicated there might be down-hole drift in the drillholes. Gustavson also visually compared historical and AMB drillhole grades on a section basis. Again, high grade zones indicated in the historical data were matched by high grade assays in modern drilling. This visual inspection also showed that some of the previously noted discrepancies between historical and modern drilling may be due to the location of drilling campaigns. Historical campaigns generally targeted the core of the high grade portions of the deposits, while modern drilling has focused more on the periphery of the deposits. Modern drilling has also taken place after mining operations were begun, and therefore is affected by the removal of material that was present
Americas Bullion Royalty Corp. 12-20 Brewery Creek Project NI 43-101 Technical Report on Resources
Gustavson Associates, LLC October 23, 2013 Brewery Creek_NI 43-101 TR_Final_20131023.docx
during past campaigns. There were no twin holes of historical and AMB drilling to compare. Given the analyses noted above, Gustavson is of the opinion that the historical data is appropriate for resource estimation.
12.3.2 Verification of Drill Data
Drillhole collar data were compared to the site topographic map to confirm that elevations are consistent. The survey data for each drillhole were also examined. Those drillholes containing greater than 5° variation in dip or azimuth, or containing greater than 1° per metre are verified by AMB, and corrected, if necessary. To ensure logging quality, AMB verifies assay and lithology data entries to ensure that data are available from top to bottom of drillhole, with no missing intervals or intervals exceeding the total depth of drillhole. Gustavson reviewed blasthole data compared to the site pre and post mining topography to check that elevations were consistent with those data.
Gustavson implements a data validation step to ensure that the Excel database received matches the actual lab assay certificates. Gustavson requires a 99% confidence level and minimum 4% confidence interval to consider a database of good enough quality for resource estimation. The AMB sample assay Excel database contains 3548 samples. Of the 502 samples versus assay certificate values checked, Gustavson found 45 errors. However, it was noted that in some cases the assay values had been rounded from three decimal places to two, which may account for some errors. This validation produced a 3% confidence interval at a 99% confidence level, which Gustavson believes is an acceptable error rate and that the data is valid.
12.3.3 Gustavson Site Visit
Gustavson QP, M.C. Newton, III, visited the site on June 4 and 5, 2013. During the site visit, Dr. Newton examined rocks in the Lucky, Golden, Kokanee and Pacific pits, took structural measurements, and collected three independent grab samples for gold assay. During the course of the visit, the samples remained in Dr. Newton’s custody or vision and were delivered personally by Dr. Newton to ALS Chemex in Whitehorse, Canada. The samples were assayed by ALS’s ICP21 and gravimetric methods. Results of these three samples are provided in Table 12-5 below. BC-1 and BC-2 were quartz-pyrite veined quartz monzonite and sample BC-3 was highly fractured but weakly altered felsic intrusive rock. The results of the Gustavson sampling independently verify AMB’s drilling results.
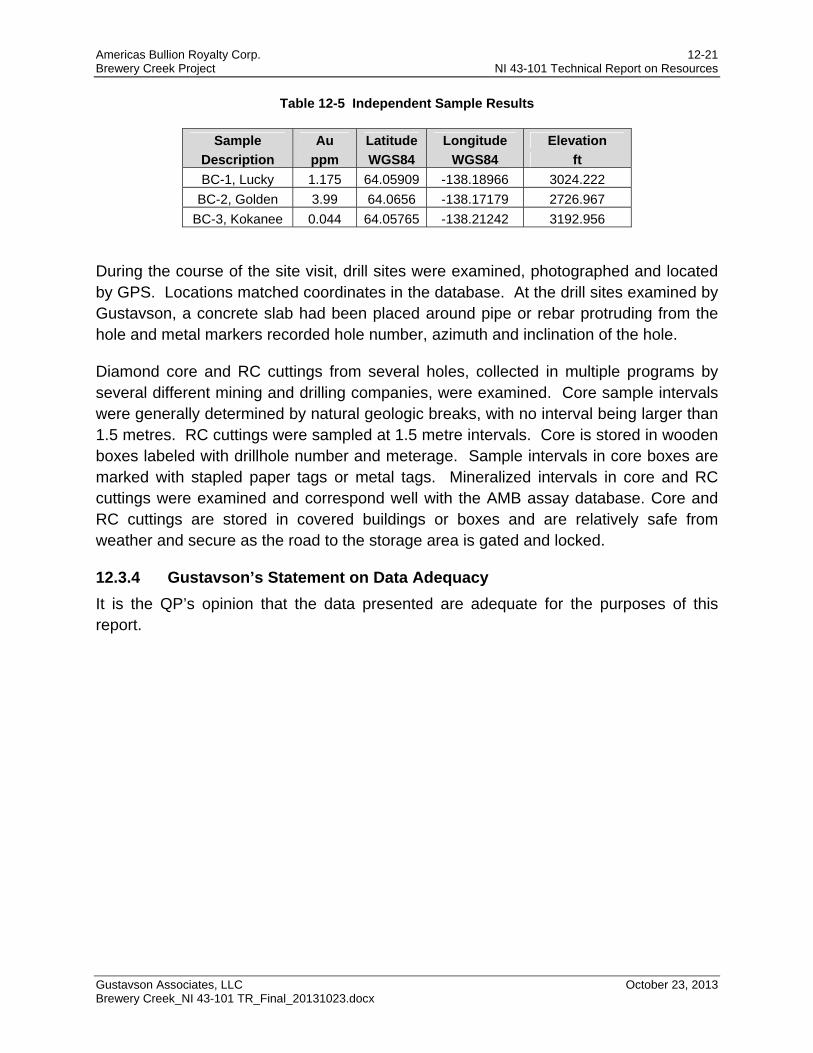
Americas Bullion Royalty Corp. 12-21 Brewery Creek Project NI 43-101 Technical Report on Resources
Gustavson Associates, LLC October 23, 2013 Brewery Creek_NI 43-101 TR_Final_20131023.docx
Table 12-5 Independent Sample Results
Sample Au Latitude Longitude Elevation
Description ppm WGS84 WGS84 ft
BC-1, Lucky 1.175 64.05909 -138.18966 3024.222
BC-2, Golden 3.99 64.0656 -138.17179 2726.967
BC-3, Kokanee 0.044 64.05765 -138.21242 3192.956
During the course of the site visit, drill sites were examined, photographed and located by GPS. Locations matched coordinates in the database. At the drill sites examined by Gustavson, a concrete slab had been placed around pipe or rebar protruding from the hole and metal markers recorded hole number, azimuth and inclination of the hole.
Diamond core and RC cuttings from several holes, collected in multiple programs by several different mining and drilling companies, were examined. Core sample intervals were generally determined by natural geologic breaks, with no interval being larger than 1.5 metres. RC cuttings were sampled at 1.5 metre intervals. Core is stored in wooden boxes labeled with drillhole number and meterage. Sample intervals in core boxes are marked with stapled paper tags or metal tags. Mineralized intervals in core and RC cuttings were examined and correspond well with the AMB assay database. Core and RC cuttings are stored in covered buildings or boxes and are relatively safe from weather and secure as the road to the storage area is gated and locked.
12.3.4 Gustavson’s Statement on Data Adequacy
It is the QP’s opinion that the data presented are adequate for the purposes of this report.
Americas Bullion Royalty Corp. 13-1 Brewery Creek Project NI 43-101 Technical Report on Resources
Gustavson Associates, LLC October 23, 2013 Brewery Creek_NI 43-101 TR_Final_20131023.docx
13 Mineral Processing and Metallurgical Testing (Item 13)
Metallurgical testing of material from the Brewery Creek Project has been conducted with early reports completed in 1988 by Loki Gold Corporation and testwork by Kappes, Cassiday & Associates and Lakefield in the 1990's. Three sources of metallurgical information have been used to complete this technical study.
In 2012, ABM delivered drill core interval samples obtained from seven deposits located within the Brewery Creek Project to McClelland Laboratories Inc. (MLI) in Sparks, Nevada for a metallurgical study. The metallurgical study is nearing completion and included sample characterization, bottle roll testing and column leach testing. This work is being completed under MLI Job No. 3719 and data logs have been used for metallurgical interpretation of new material from various pits.
Metallurgical data have been extracted from an MLI draft report, MLI Job No. 3618, to estimate metallurgical performance of residue material from the existing heap leach pad. This study was conducted on sonic drill samples collected from the existing heap and delivered to MLI in October 2011.
Viceroy operated the Brewery Creek Project heap leach from 1996 through 2002 and operations reports from this period have been used in estimation of cyanide consumption.
The following review summarizes procedures used to conduct sample preparation, testwork and the metallurgical data developed from the column leach tests at MLI. SGS Metcon/KD Engineering (SGS) conducted the gold extraction projections using a metallurgical software program, METSIM©, for the column leach test data.
13.1 MLI Job No. 3619 Current Metallurgical Testwork
Thirty-two PQ diameter drill core composite samples from seven pits were subjected to head assay characterization, bottle roll testing and column leach testing. Samples for testing included areas of waste and low recovery as part of a variability study. AMB described each composite in detail, including rock type, and gave reasons for composite selection. Rock types for this study are summarized as follows:
LAQM - Limonitic Altered Quartz Monzonite
AQM - Altered Quartz Monzonite
ARG - Graphitic Argillite
Syenite
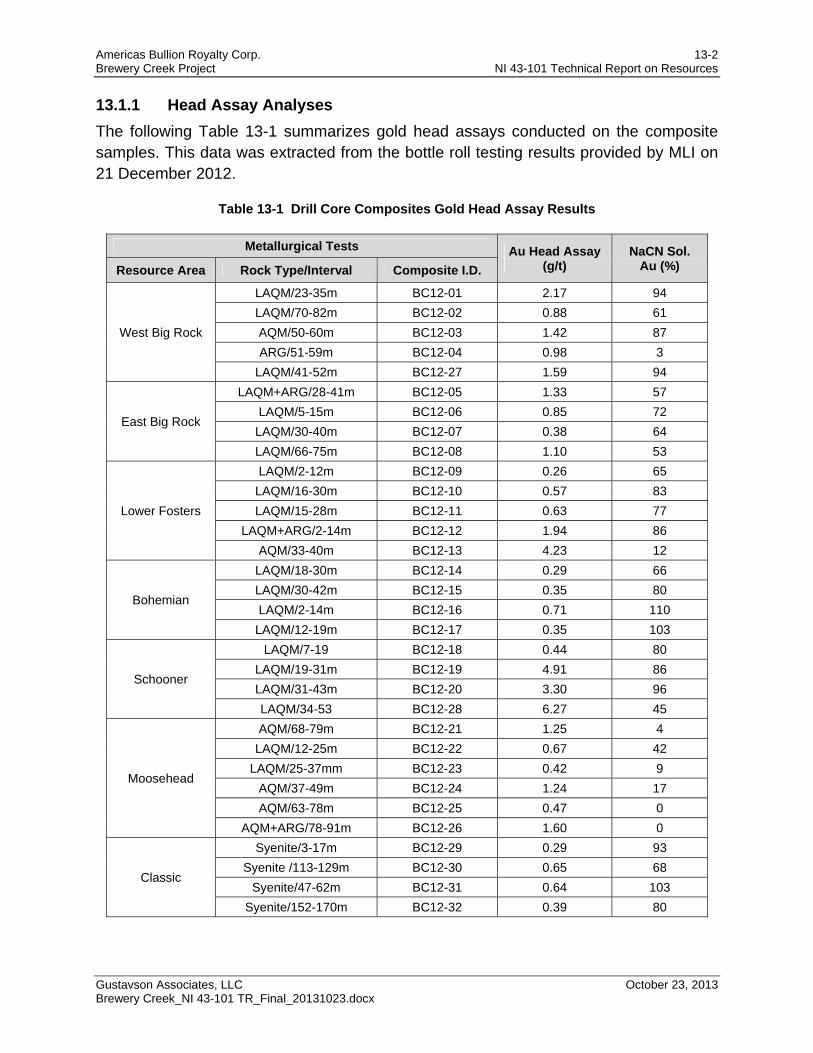
Americas Bullion Royalty Corp. 13-2 Brewery Creek Project NI 43-101 Technical Report on Resources
Gustavson Associates, LLC October 23, 2013 Brewery Creek_NI 43-101 TR_Final_20131023.docx
13.1.1 Head Assay Analyses
The following Table 13-1 summarizes gold head assays conducted on the composite samples. This data was extracted from the bottle roll testing results provided by MLI on 21 December 2012.
Table 13-1 Drill Core Composites Gold Head Assay Results
Metallurgical Tests Au Head Assay (g/t)
NaCN Sol. Au (%) Resource Area Rock Type/Interval Composite I.D.
West Big Rock
LAQM/23-35m BC12-01 2.17 94
LAQM/70-82m BC12-02 0.88 61
AQM/50-60m BC12-03 1.42 87
ARG/51-59m BC12-04 0.98 3
LAQM/41-52m BC12-27 1.59 94
East Big Rock
LAQM+ARG/28-41m BC12-05 1.33 57
LAQM/5-15m BC12-06 0.85 72
LAQM/30-40m BC12-07 0.38 64
LAQM/66-75m BC12-08 1.10 53
Lower Fosters
LAQM/2-12m BC12-09 0.26 65
LAQM/16-30m BC12-10 0.57 83
LAQM/15-28m BC12-11 0.63 77
LAQM+ARG/2-14m BC12-12 1.94 86
AQM/33-40m BC12-13 4.23 12
Bohemian
LAQM/18-30m BC12-14 0.29 66
LAQM/30-42m BC12-15 0.35 80
LAQM/2-14m BC12-16 0.71 110
LAQM/12-19m BC12-17 0.35 103
Schooner
LAQM/7-19 BC12-18 0.44 80
LAQM/19-31m BC12-19 4.91 86
LAQM/31-43m BC12-20 3.30 96
LAQM/34-53 BC12-28 6.27 45
Moosehead
AQM/68-79m BC12-21 1.25 4
LAQM/12-25m BC12-22 0.67 42
LAQM/25-37mm BC12-23 0.42 9
AQM/37-49m BC12-24 1.24 17
AQM/63-78m BC12-25 0.47 0
AQM+ARG/78-91m BC12-26 1.60 0
Classic
Syenite/3-17m BC12-29 0.29 93
Syenite /113-129m BC12-30 0.65 68
Syenite/47-62m BC12-31 0.64 103
Syenite/152-170m BC12-32 0.39 80

Americas Bullion Royalty Corp. 13-3 Brewery Creek Project NI 43-101 Technical Report on Resources
Gustavson Associates, LLC October 23, 2013 Brewery Creek_NI 43-101 TR_Final_20131023.docx
The gold grade of the composite samples varied from 0.26 to 6.27 grams per tonne. The sodium cyanide soluble gold assays varied from completely refractory, zero percent soluble, to completely amenable, 100 percent soluble.
13.1.2 Screen Analyses
Each composite sample was screened and stage crushed to approximately 80 percent passing 9.5 mm prior to bottle roll and column leach testing. These screen analysis are shown in Table 13-2.
Table 13-2 Drill Core Composites Head Screen Analyses
Resource Area Composite
ID Column
ID
Weight Passing (%)
9.5mm 6.3mm 1.7mm 420µm 150µm 75µm
West Big Rock
BC12-01 P-1 81 56 26 13 8 6
BC12-02 P-2 80 61 28 14 9 7
BC12-03 P-3 79 54 23 11 6 4
BC12-04 P-4 78 55 25 12 8 6
BC12-27 P-27 78 49 20 9 6 5
East Big Rock
BC12-05 P-5 87 68 36 19 12 8
BC12-06 P-6 85 64 33 17 11 7
BC12-07 P-7 82 60 30 16 11 8
BC12-08 P-8 80 47 19 8 5 4
Lower Fosters
BC12-09 P-9 78 64 43 28 22 19
BC12-10 P-10 83 62 30 14 8 6
BC12-11 P-11 78 57 28 15 9 7
BC12-12 P-12 87 77 46 23 14 10
BC12-13 P-13 78 50 20 9 5 4
Bohemian
BC12-14 P-14 84 55 23 10 6 4
BC12-15 P-15 79 45 16 7 4 3
BC12-16 P-16 85 60 28 13 8 6
BC12-17 P-17 84 57 22 10 6 5
Schooner
BC12-18 P-18 78 52 23 11 7 5
BC12-19 P-19 77 51 19 8 5 4
BC12-20 P-20 84 59 24 11 7 5
BC12-28 P-28 80 52 22 9 5 4
Moosehead
BC12-21 P-21 77 50 21 10 6 5
BC12-22 P-22 79 51 21 10 6 5
BC12-23 P-23 77 45 15 6 4 3
BC12-24 P-24 75 43 15 6 4 3
BC12-25 P-25 79 52 19 9 5 4
BC12-26 P-26 80 52 21 10 6 5
Classic
BC12-29 P-29 81 63 32 12 5 3
BC12-30 P-30 78 51 24 11 6 4
BC12-31 P-31 84 61 33 17 9 5
BC12-32 P-32 82 57 29 16 9 6
Americas Bullion Royalty Corp. 13-4 Brewery Creek Project NI 43-101 Technical Report on Resources
Gustavson Associates, LLC October 23, 2013 Brewery Creek_NI 43-101 TR_Final_20131023.docx
Two samples, both from Lower Fosters, showed greater than 10 percent passing 75 microns. In the column test program, only these samples were agglomerated with cement.
13.1.3 Bottle Roll Testing
Bottle roll tests were conducted on 80 percent passing 9.5 mm composite test charges from each drillhole to determine gold extraction, gold leach kinetics and reagent consumption. The tests were conducted for 96 hours maintaining 40 percent solid, pulp pH between 10.8 and 11.2, sodium cyanide concentration of 1 g/l and pregnant leach solution samples were withdrawn at 2, 6, 24, 48, 72 and 96 hours to measure pH, cyanide concentration, gold and silver concentrations. At the end of 96 hours, the bottle roll tests were terminated and leached residues were filtered, washed, dried, weighed, and assayed for gold and silver. The reagent consumption and gold results are presented in Table 13-3.
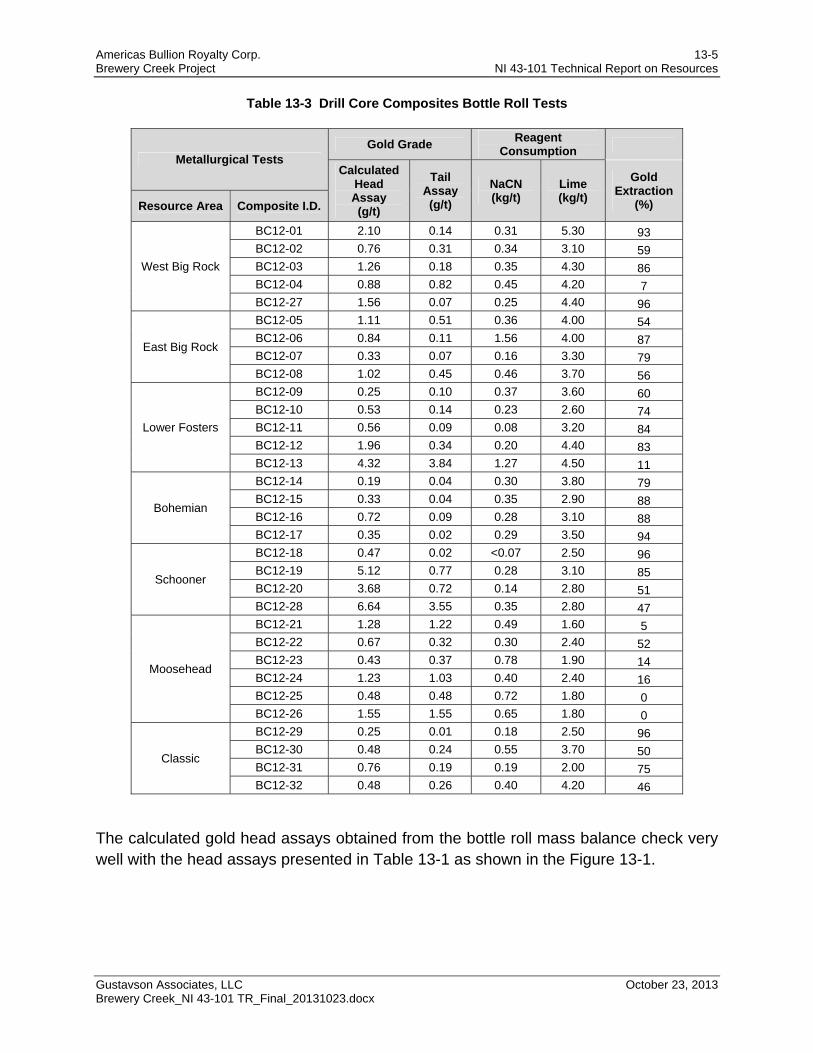
Americas Bullion Royalty Corp. 13-5 Brewery Creek Project NI 43-101 Technical Report on Resources
Gustavson Associates, LLC October 23, 2013 Brewery Creek_NI 43-101 TR_Final_20131023.docx
Table 13-3 Drill Core Composites Bottle Roll Tests
Metallurgical Tests Gold Grade
Reagent Consumption
Calculated Head Assay (g/t)
Tail Assay (g/t)
NaCN (kg/t)
Lime (kg/t)
Gold Extraction
(%) Resource Area Composite I.D.
West Big Rock
BC12-01 2.10 0.14 0.31 5.30 93 BC12-02 0.76 0.31 0.34 3.10 59 BC12-03 1.26 0.18 0.35 4.30 86 BC12-04 0.88 0.82 0.45 4.20 7 BC12-27 1.56 0.07 0.25 4.40 96
East Big Rock
BC12-05 1.11 0.51 0.36 4.00 54 BC12-06 0.84 0.11 1.56 4.00 87 BC12-07 0.33 0.07 0.16 3.30 79 BC12-08 1.02 0.45 0.46 3.70 56
Lower Fosters
BC12-09 0.25 0.10 0.37 3.60 60 BC12-10 0.53 0.14 0.23 2.60 74 BC12-11 0.56 0.09 0.08 3.20 84 BC12-12 1.96 0.34 0.20 4.40 83 BC12-13 4.32 3.84 1.27 4.50 11
Bohemian
BC12-14 0.19 0.04 0.30 3.80 79 BC12-15 0.33 0.04 0.35 2.90 88 BC12-16 0.72 0.09 0.28 3.10 88 BC12-17 0.35 0.02 0.29 3.50 94
Schooner
BC12-18 0.47 0.02 <0.07 2.50 96 BC12-19 5.12 0.77 0.28 3.10 85 BC12-20 3.68 0.72 0.14 2.80 51 BC12-28 6.64 3.55 0.35 2.80 47
Moosehead
BC12-21 1.28 1.22 0.49 1.60 5 BC12-22 0.67 0.32 0.30 2.40 52 BC12-23 0.43 0.37 0.78 1.90 14 BC12-24 1.23 1.03 0.40 2.40 16 BC12-25 0.48 0.48 0.72 1.80 0 BC12-26 1.55 1.55 0.65 1.80 0
Classic
BC12-29 0.25 0.01 0.18 2.50 96 BC12-30 0.48 0.24 0.55 3.70 50 BC12-31 0.76 0.19 0.19 2.00 75 BC12-32 0.48 0.26 0.40 4.20 46
The calculated gold head assays obtained from the bottle roll mass balance check very well with the head assays presented in Table 13-1 as shown in the Figure 13-1.
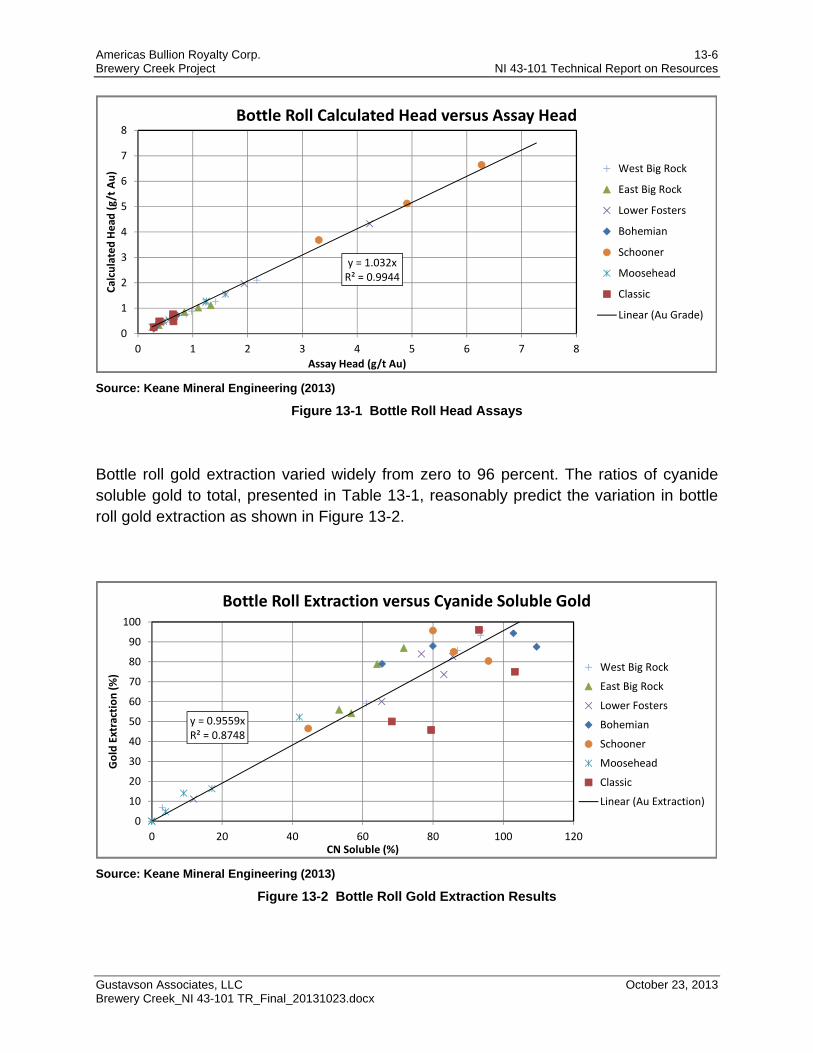
Americas Bullion Royalty Corp. 13-6 Brewery Creek Project NI 43-101 Technical Report on Resources
Gustavson Associates, LLC October 23, 2013 Brewery Creek_NI 43-101 TR_Final_20131023.docx
Source: Keane Mineral Engineering (2013)
Figure 13-1 Bottle Roll Head Assays
Bottle roll gold extraction varied widely from zero to 96 percent. The ratios of cyanide soluble gold to total, presented in Table 13-1, reasonably predict the variation in bottle roll gold extraction as shown in Figure 13-2.
Source: Keane Mineral Engineering (2013)
Figure 13-2 Bottle Roll Gold Extraction Results
y = 1.032xR² = 0.9944
0
1
2
3
4
5
6
7
8
0 1 2 3 4 5 6 7 8
Calculated Head
(g/t Au)
Assay Head (g/t Au)
Bottle Roll Calculated Head versus Assay Head
West Big Rock
East Big Rock
Lower Fosters
Bohemian
Schooner
Moosehead
Classic
Linear (Au Grade)
y = 0.9559xR² = 0.8748
0
10
20
30
40
50
60
70
80
90
100
0 20 40 60 80 100 120
Gold Extraction (%)
CN Soluble (%)
Bottle Roll Extraction versus Cyanide Soluble Gold
West Big Rock
East Big Rock
Lower Fosters
Bohemian
Schooner
Moosehead
Classic
Linear (Au Extraction)
Americas Bullion Royalty Corp. 13-7 Brewery Creek Project NI 43-101 Technical Report on Resources
Gustavson Associates, LLC October 23, 2013 Brewery Creek_NI 43-101 TR_Final_20131023.docx
13.1.4 Locked Cycle Column Leach Testing
A locked cycle column leach test program is being conducted on 80 percent passing 9.5 mm composite samples. A total of 32 column tests are in progress to determine gold extraction, leach kinetics and reagent consumptions. Each test charge weighed approximately 71 kg, with the exception of one test using a 34 kg test charge, and was either not agglomerated or agglomerated with either lime or cement and water to optimum moisture content before loading in the column.
The column tests have been under leach for at least 30 days on a leach-rest pattern followed by rinse and drain cycles. Some columns were still under leach by the time of this report preparation. Feed solution containing 1.0 g NaCN was applied at a rate of 0.005 gpm/ft2 and pregnant leach solutions volumes were measured daily and samples were collected and submitted for gold and silver analysis, pH and cyanide concentration. The pregnant leach solutions were pumped through a three stage carbon circuit for adsorption of dissolved gold values. Barren solution, with appropriate make-up reagent, was applied to the charges daily.
After the leach-rest cycles, wash cycles were conducted to remove residual cyanide and to recover dissolved gold values. At the end of the wash cycles, drain cycles were conducted to remove excess solutions from the residues. After leaching, washing, and draining, residues are unloaded from the columns, air dried, blended and split to obtain samples for a tail assay analyses.
Column test physical characteristics complete through the summary report used for this study are presented in Table 13-4:
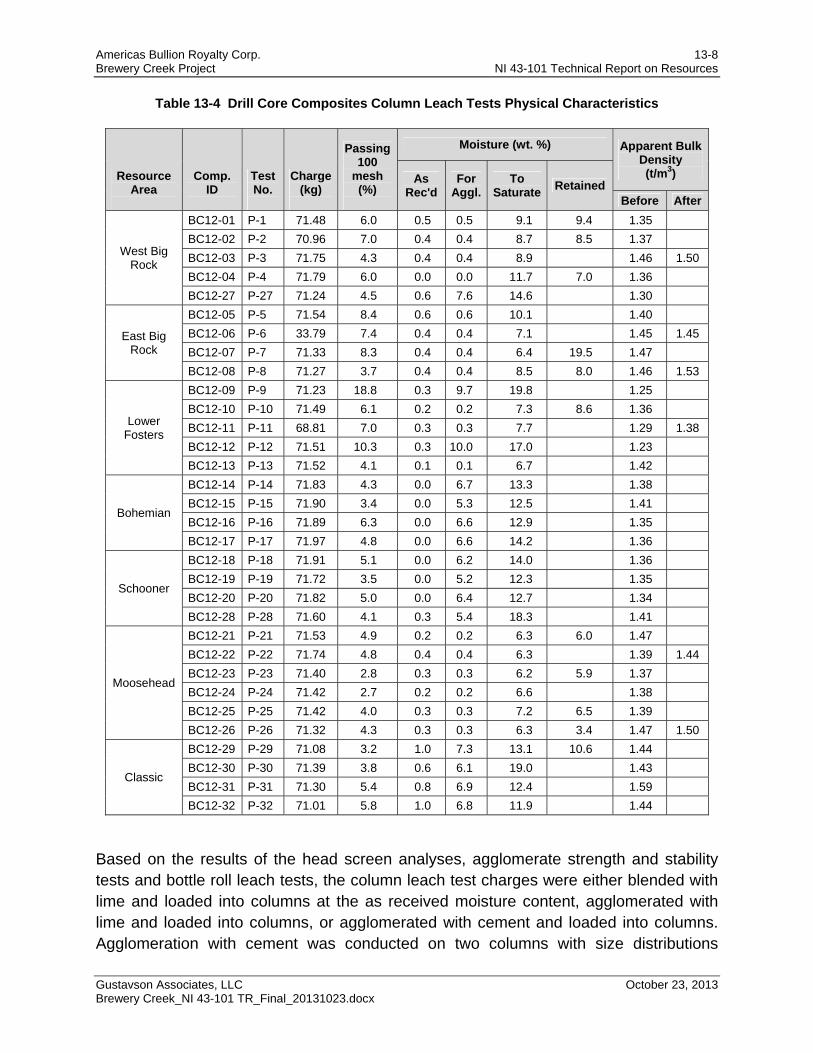
Americas Bullion Royalty Corp. 13-8 Brewery Creek Project NI 43-101 Technical Report on Resources
Gustavson Associates, LLC October 23, 2013 Brewery Creek_NI 43-101 TR_Final_20131023.docx
Table 13-4 Drill Core Composites Column Leach Tests Physical Characteristics
Resource Area
Comp. ID
Test No.
Charge(kg)
Passing 100
mesh (%)
Moisture (wt. %) Apparent Bulk Density (t/m3) As
Rec'd For
Aggl.To
SaturateRetained
Before After
West Big Rock
BC12-01 P-1 71.48 6.0 0.5 0.5 9.1 9.4 1.35
BC12-02 P-2 70.96 7.0 0.4 0.4 8.7 8.5 1.37
BC12-03 P-3 71.75 4.3 0.4 0.4 8.9 1.46 1.50
BC12-04 P-4 71.79 6.0 0.0 0.0 11.7 7.0 1.36
BC12-27 P-27 71.24 4.5 0.6 7.6 14.6 1.30
East Big Rock
BC12-05 P-5 71.54 8.4 0.6 0.6 10.1 1.40
BC12-06 P-6 33.79 7.4 0.4 0.4 7.1 1.45 1.45
BC12-07 P-7 71.33 8.3 0.4 0.4 6.4 19.5 1.47
BC12-08 P-8 71.27 3.7 0.4 0.4 8.5 8.0 1.46 1.53
Lower Fosters
BC12-09 P-9 71.23 18.8 0.3 9.7 19.8 1.25
BC12-10 P-10 71.49 6.1 0.2 0.2 7.3 8.6 1.36
BC12-11 P-11 68.81 7.0 0.3 0.3 7.7 1.29 1.38
BC12-12 P-12 71.51 10.3 0.3 10.0 17.0 1.23
BC12-13 P-13 71.52 4.1 0.1 0.1 6.7 1.42
Bohemian
BC12-14 P-14 71.83 4.3 0.0 6.7 13.3 1.38
BC12-15 P-15 71.90 3.4 0.0 5.3 12.5 1.41
BC12-16 P-16 71.89 6.3 0.0 6.6 12.9 1.35
BC12-17 P-17 71.97 4.8 0.0 6.6 14.2 1.36
Schooner
BC12-18 P-18 71.91 5.1 0.0 6.2 14.0 1.36
BC12-19 P-19 71.72 3.5 0.0 5.2 12.3 1.35
BC12-20 P-20 71.82 5.0 0.0 6.4 12.7 1.34
BC12-28 P-28 71.60 4.1 0.3 5.4 18.3 1.41
Moosehead
BC12-21 P-21 71.53 4.9 0.2 0.2 6.3 6.0 1.47
BC12-22 P-22 71.74 4.8 0.4 0.4 6.3 1.39 1.44
BC12-23 P-23 71.40 2.8 0.3 0.3 6.2 5.9 1.37
BC12-24 P-24 71.42 2.7 0.2 0.2 6.6 1.38
BC12-25 P-25 71.42 4.0 0.3 0.3 7.2 6.5 1.39
BC12-26 P-26 71.32 4.3 0.3 0.3 6.3 3.4 1.47 1.50
Classic
BC12-29 P-29 71.08 3.2 1.0 7.3 13.1 10.6 1.44
BC12-30 P-30 71.39 3.8 0.6 6.1 19.0 1.43
BC12-31 P-31 71.30 5.4 0.8 6.9 12.4 1.59
BC12-32 P-32 71.01 5.8 1.0 6.8 11.9 1.44
Based on the results of the head screen analyses, agglomerate strength and stability tests and bottle roll leach tests, the column leach test charges were either blended with lime and loaded into columns at the as received moisture content, agglomerated with lime and loaded into columns, or agglomerated with cement and loaded into columns. Agglomeration with cement was conducted on two columns with size distributions
Americas Bullion Royalty Corp. 13-9 Brewery Creek Project NI 43-101 Technical Report on Resources
Gustavson Associates, LLC October 23, 2013 Brewery Creek_NI 43-101 TR_Final_20131023.docx
containing greater than 10 percent minus 100 mesh material, both from Lower Fosters. The column test data logs did not note any problems with solution permeability at the targeted irrigation rate of 0.005 gpm/ft2. All column test charges were loaded into 6-inch diameter columns, with the exception of P-6 which used a 4-inch diameter column, to an initial height of approximately 10 feet. As received moisture contents were consistently low at 1 percent or less. Moisture under leach (to saturate) varied widely from 6 to 20 percent. Retained moisture values also varied widely with one unexpected result in Test P-7 where the retained moisture is three times greater than the saturation moisture. Interpretation of this result should be deferred until publication of the final MLI report. Initial dry bulk densities ranged from 1.3 to 1.6 t/m3. Similarities in characteristics are apparent for each pit except Lower Fosters, where more variation in moisture and particle distribution is seen between composites.
Americas Bullion Royalty Corp. 13-10 Brewery Creek Project NI 43-101 Technical Report on Resources
Gustavson Associates, LLC October 23, 2013 Brewery Creek_NI 43-101 TR_Final_20131023.docx
Table 13-5 summarizes the metallurgical results obtained from the column leach tests.
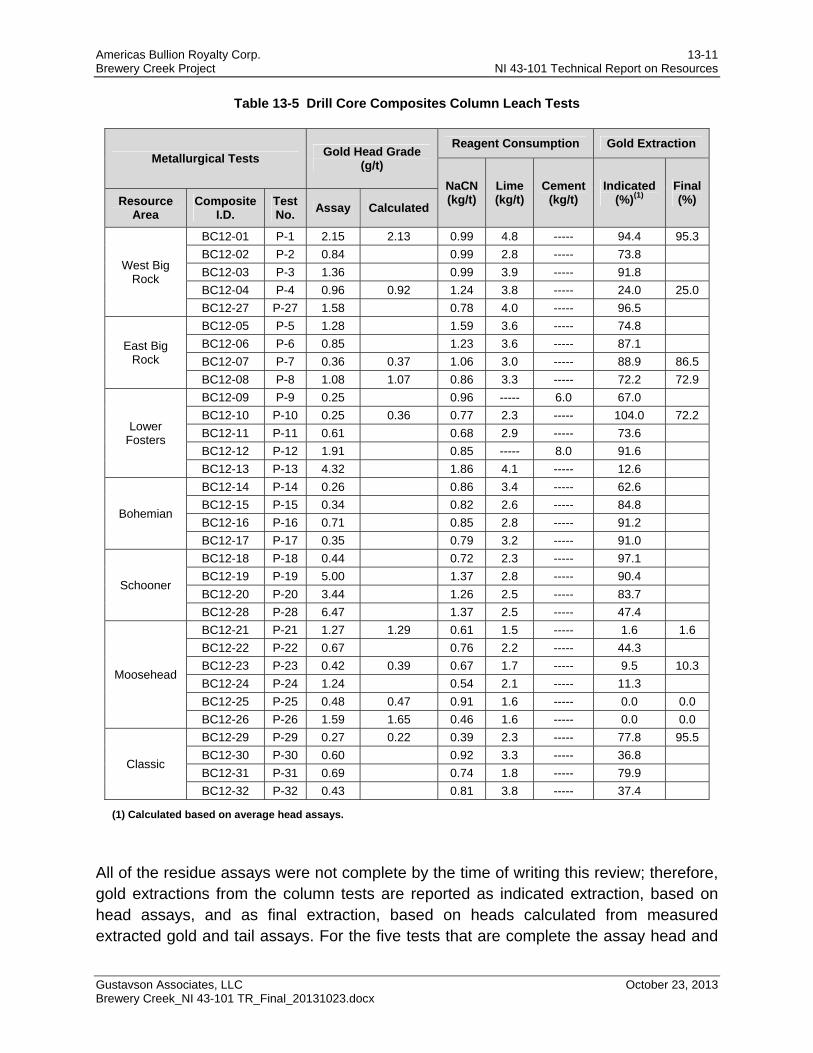
Americas Bullion Royalty Corp. 13-11 Brewery Creek Project NI 43-101 Technical Report on Resources
Gustavson Associates, LLC October 23, 2013 Brewery Creek_NI 43-101 TR_Final_20131023.docx
Table 13-5 Drill Core Composites Column Leach Tests
Metallurgical Tests Gold Head Grade
(g/t)
Reagent Consumption Gold Extraction
NaCN (kg/t)
Lime (kg/t)
Cement (kg/t)
Indicated (%)(1)
Final (%) Resource
Area Composite
I.D. Test No.
Assay Calculated
West Big Rock
BC12-01 P-1 2.15 2.13 0.99 4.8 ----- 94.4 95.3
BC12-02 P-2 0.84 0.99 2.8 ----- 73.8
BC12-03 P-3 1.36 0.99 3.9 ----- 91.8
BC12-04 P-4 0.96 0.92 1.24 3.8 ----- 24.0 25.0
BC12-27 P-27 1.58 0.78 4.0 ----- 96.5
East Big Rock
BC12-05 P-5 1.28 1.59 3.6 ----- 74.8
BC12-06 P-6 0.85 1.23 3.6 ----- 87.1
BC12-07 P-7 0.36 0.37 1.06 3.0 ----- 88.9 86.5
BC12-08 P-8 1.08 1.07 0.86 3.3 ----- 72.2 72.9
Lower Fosters
BC12-09 P-9 0.25 0.96 ----- 6.0 67.0
BC12-10 P-10 0.25 0.36 0.77 2.3 ----- 104.0 72.2
BC12-11 P-11 0.61 0.68 2.9 ----- 73.6
BC12-12 P-12 1.91 0.85 ----- 8.0 91.6
BC12-13 P-13 4.32 1.86 4.1 ----- 12.6
Bohemian
BC12-14 P-14 0.26 0.86 3.4 ----- 62.6
BC12-15 P-15 0.34 0.82 2.6 ----- 84.8
BC12-16 P-16 0.71 0.85 2.8 ----- 91.2
BC12-17 P-17 0.35 0.79 3.2 ----- 91.0
Schooner
BC12-18 P-18 0.44 0.72 2.3 ----- 97.1
BC12-19 P-19 5.00 1.37 2.8 ----- 90.4
BC12-20 P-20 3.44 1.26 2.5 ----- 83.7
BC12-28 P-28 6.47 1.37 2.5 ----- 47.4
Moosehead
BC12-21 P-21 1.27 1.29 0.61 1.5 ----- 1.6 1.6
BC12-22 P-22 0.67 0.76 2.2 ----- 44.3
BC12-23 P-23 0.42 0.39 0.67 1.7 ----- 9.5 10.3
BC12-24 P-24 1.24 0.54 2.1 ----- 11.3
BC12-25 P-25 0.48 0.47 0.91 1.6 ----- 0.0 0.0
BC12-26 P-26 1.59 1.65 0.46 1.6 ----- 0.0 0.0
Classic
BC12-29 P-29 0.27 0.22 0.39 2.3 ----- 77.8 95.5
BC12-30 P-30 0.60 0.92 3.3 ----- 36.8
BC12-31 P-31 0.69 0.74 1.8 ----- 79.9
BC12-32 P-32 0.43 0.81 3.8 ----- 37.4
(1) Calculated based on average head assays.
All of the residue assays were not complete by the time of writing this review; therefore, gold extractions from the column tests are reported as indicated extraction, based on head assays, and as final extraction, based on heads calculated from measured extracted gold and tail assays. For the five tests that are complete the assay head and

Americas Bullion Royalty Corp. 13-12 Brewery Creek Project NI 43-101 Technical Report on Resources
Gustavson Associates, LLC October 23, 2013 Brewery Creek_NI 43-101 TR_Final_20131023.docx
calculated head values agree well with the exceptions of tests P-10 and P-29. Interpretation of these discrepancies should be deferred until MLI has completed a final report.
The preliminary sodium cyanide consumption ranged approximately from 0.67 to 1.37 kg/t. While cyanide consumption is material dependent, variation is also introduced as some of the columns are complete and some still under leach.
The reported levels of lime and cement consumption are indeed the quantities of lime and cement added to the samples during loading. Lime was not added for pH control to any of the columns while under leach and pregnant leach solution pH values were acceptably between 10 and 11 for a majority of the time with occasional early periods of 11 to 12, and isolated occurrences of pH greater than 12 or less than 9 at solution breakthrough.
The column leach also included samples that were outside of the proposed pit limits as well as samples from areas with known preg-robbing or refractory response as described by the Brewery Creek Project geology that were tested to observe the metallurgical response. The results of these columns tests were omitted in estimation of gold recovery and reagent consumption by pit. The omitted column tests are:
West Big Rock BC12-03 Composite Sample
West Big Rock BC12-04 Composite Sample
East Big Rock BC12-05 Composite Sample
Lower Foster BC12-12 Composite Sample
Lower Foster BC12-13 Composite Sample
Moosehead BC12-21 Composite Sample
Moosehead BC12-24 Composite Sample
Moosehead BC12-25 Composite Sample
Moosehead BC12-26 Composite Sample
Additionally, due to poor metallurgical response from the Moosehead samples, this deposit has been removed from mine planning. Finally, as the Classis deposit remains under development, it also is not included in the mine plan.
Figure 13-3 through Figure 13-7 depict the actual column leach data and METSIM projections for gold leach extraction versus leach day. Only the column leach tests used for estimating project gold extraction levels are shown. The METSIM projections fit the
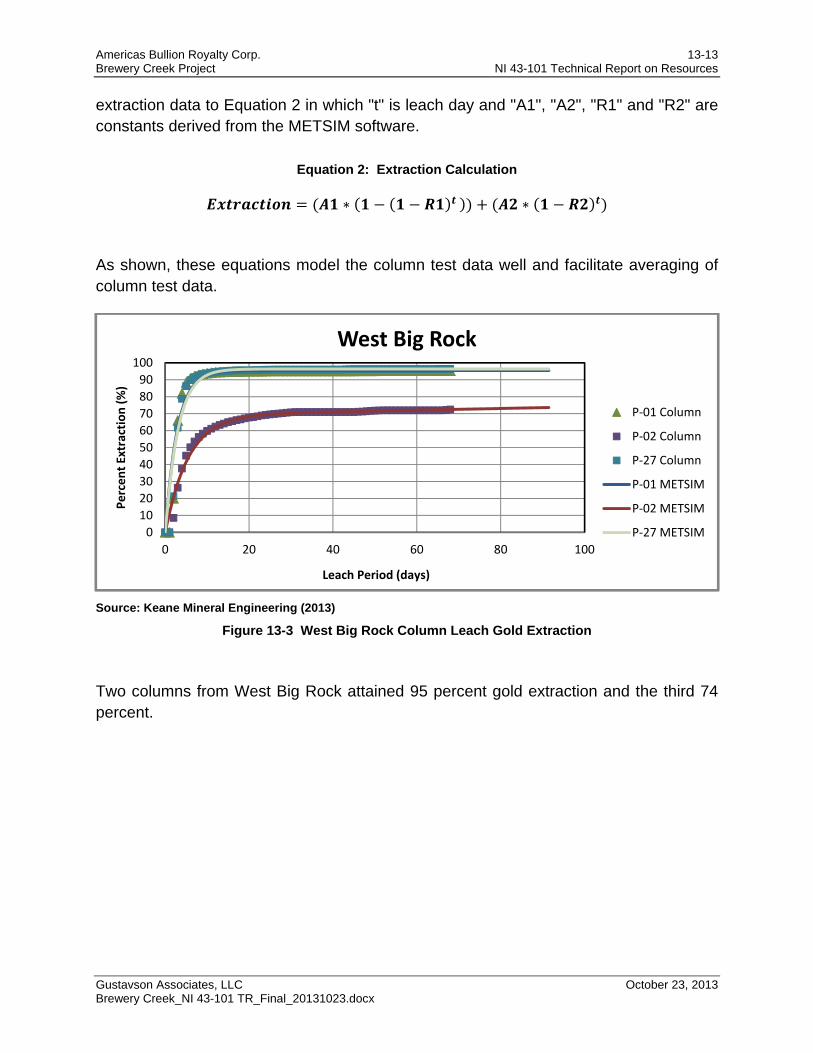
Americas Bullion Royalty Corp. 13-13 Brewery Creek Project NI 43-101 Technical Report on Resources
Gustavson Associates, LLC October 23, 2013 Brewery Creek_NI 43-101 TR_Final_20131023.docx
extraction data to Equation 2 in which "t" is leach day and "A1", "A2", "R1" and "R2" are constants derived from the METSIM software.
Equation 2: Extraction Calculation
∗ ∗
As shown, these equations model the column test data well and facilitate averaging of column test data.
Source: Keane Mineral Engineering (2013)
Figure 13-3 West Big Rock Column Leach Gold Extraction
Two columns from West Big Rock attained 95 percent gold extraction and the third 74 percent.
0.00 1.00 2.00 3.00 4.00 5.00 6.00 7.00
0
10
20
30
40
50
60
70
80
90
100
0 20 40 60 80 100
Percent Extraction (%)
Leach Period (days)
West Big Rock
P‐01 Column
P‐02 Column
P‐27 Column
P‐01 METSIM
P‐02 METSIM
P‐27 METSIM
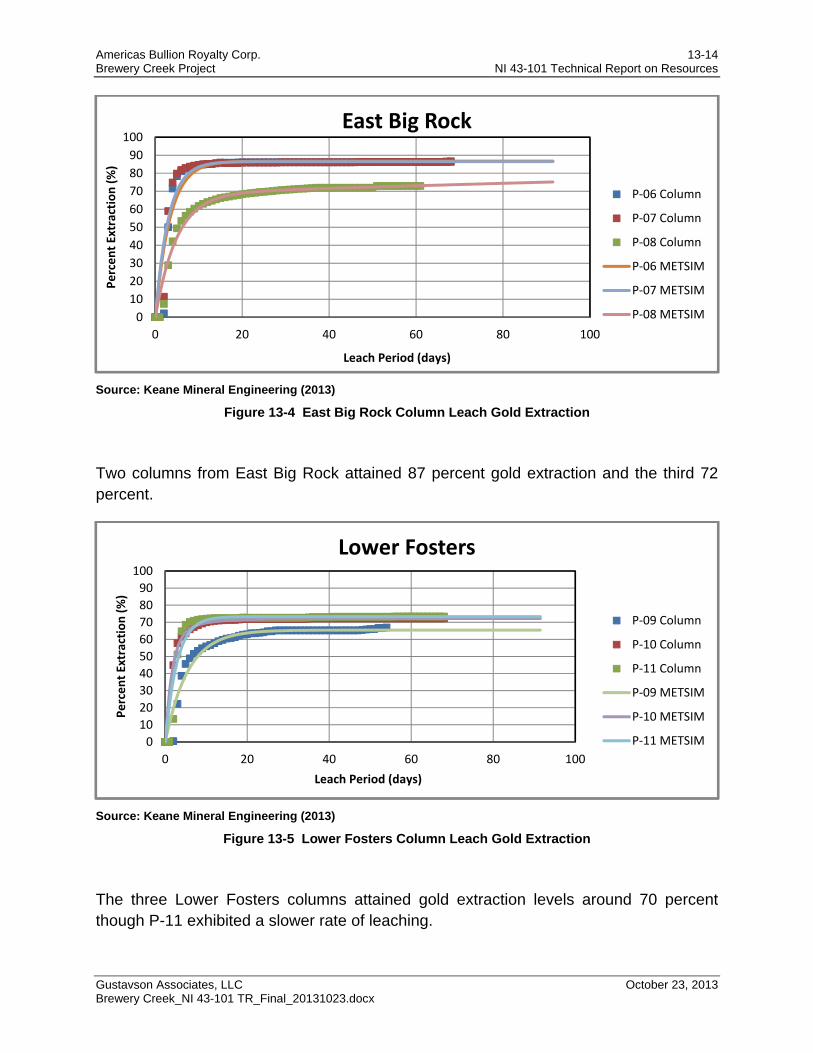
Americas Bullion Royalty Corp. 13-14 Brewery Creek Project NI 43-101 Technical Report on Resources
Gustavson Associates, LLC October 23, 2013 Brewery Creek_NI 43-101 TR_Final_20131023.docx
Source: Keane Mineral Engineering (2013)
Figure 13-4 East Big Rock Column Leach Gold Extraction
Two columns from East Big Rock attained 87 percent gold extraction and the third 72 percent.
Source: Keane Mineral Engineering (2013)
Figure 13-5 Lower Fosters Column Leach Gold Extraction
The three Lower Fosters columns attained gold extraction levels around 70 percent though P-11 exhibited a slower rate of leaching.
0.00 1.00 2.00 3.00 4.00 5.00 6.00 7.00
0
10
20
30
40
50
60
70
80
90
100
0 20 40 60 80 100
Percent Extraction (%)
Leach Period (days)
East Big Rock
P‐06 Column
P‐07 Column
P‐08 Column
P‐06 METSIM
P‐07 METSIM
P‐08 METSIM
0.00 1.00 2.00 3.00 4.00 5.00 6.00 7.00
0
10
20
30
40
50
60
70
80
90
100
0 20 40 60 80 100
Percent Extraction (%)
Leach Period (days)
Lower Fosters
P‐09 Column
P‐10 Column
P‐11 Column
P‐09 METSIM
P‐10 METSIM
P‐11 METSIM
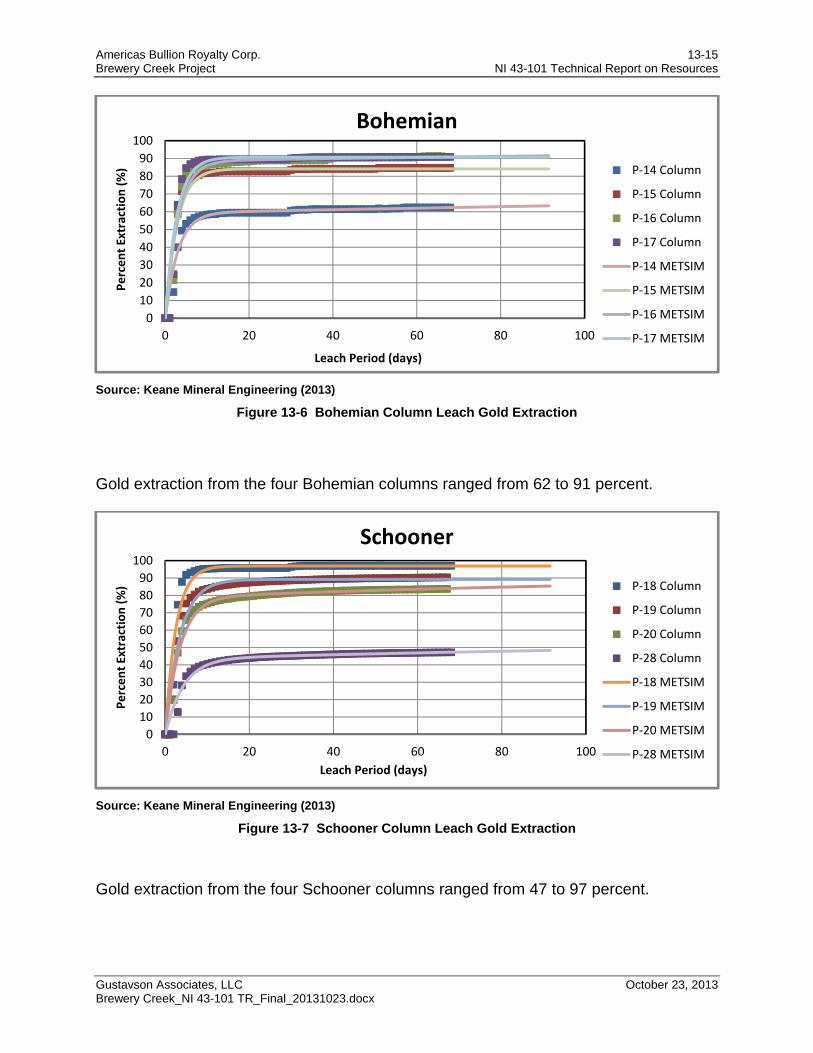
Americas Bullion Royalty Corp. 13-15 Brewery Creek Project NI 43-101 Technical Report on Resources
Gustavson Associates, LLC October 23, 2013 Brewery Creek_NI 43-101 TR_Final_20131023.docx
Source: Keane Mineral Engineering (2013)
Figure 13-6 Bohemian Column Leach Gold Extraction
Gold extraction from the four Bohemian columns ranged from 62 to 91 percent.
Source: Keane Mineral Engineering (2013)
Figure 13-7 Schooner Column Leach Gold Extraction
Gold extraction from the four Schooner columns ranged from 47 to 97 percent.
0.00 1.00 2.00 3.00 4.00 5.00 6.00 7.00
0
10
20
30
40
50
60
70
80
90
100
0 20 40 60 80 100
Percent Extraction (%)
Leach Period (days)
Bohemian
P‐14 Column
P‐15 Column
P‐16 Column
P‐17 Column
P‐14 METSIM
P‐15 METSIM
P‐16 METSIM
P‐17 METSIM
0.00 1.00 2.00 3.00 4.00 5.00 6.00 7.00
0
10
20
30
40
50
60
70
80
90
100
0 20 40 60 80 100
Percent Extraction (%)
Leach Period (days)
Schooner
P‐18 Column
P‐19 Column
P‐20 Column
P‐28 Column
P‐18 METSIM
P‐19 METSIM
P‐20 METSIM
P‐28 METSIM
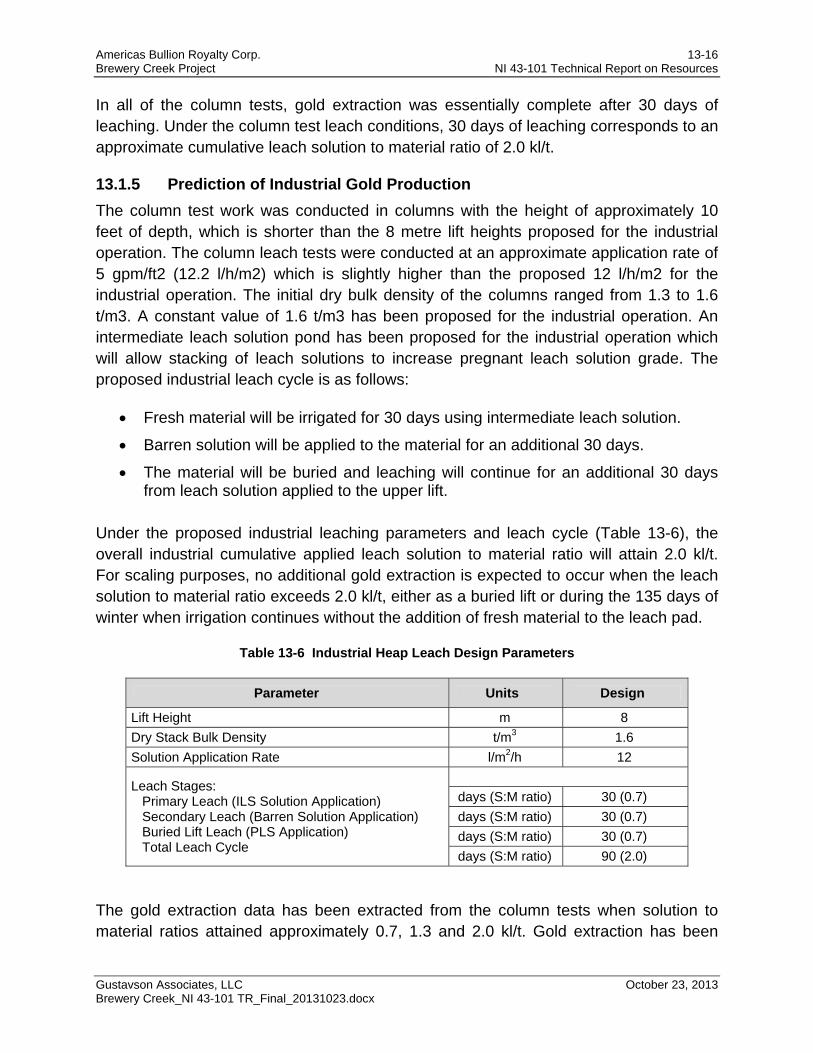
Americas Bullion Royalty Corp. 13-16 Brewery Creek Project NI 43-101 Technical Report on Resources
Gustavson Associates, LLC October 23, 2013 Brewery Creek_NI 43-101 TR_Final_20131023.docx
In all of the column tests, gold extraction was essentially complete after 30 days of leaching. Under the column test leach conditions, 30 days of leaching corresponds to an approximate cumulative leach solution to material ratio of 2.0 kl/t.
13.1.5 Prediction of Industrial Gold Production
The column test work was conducted in columns with the height of approximately 10 feet of depth, which is shorter than the 8 metre lift heights proposed for the industrial operation. The column leach tests were conducted at an approximate application rate of 5 gpm/ft2 (12.2 l/h/m2) which is slightly higher than the proposed 12 l/h/m2 for the industrial operation. The initial dry bulk density of the columns ranged from 1.3 to 1.6 t/m3. A constant value of 1.6 t/m3 has been proposed for the industrial operation. An intermediate leach solution pond has been proposed for the industrial operation which will allow stacking of leach solutions to increase pregnant leach solution grade. The proposed industrial leach cycle is as follows:
Fresh material will be irrigated for 30 days using intermediate leach solution.
Barren solution will be applied to the material for an additional 30 days.
The material will be buried and leaching will continue for an additional 30 days from leach solution applied to the upper lift.
Under the proposed industrial leaching parameters and leach cycle (Table 13-6), the overall industrial cumulative applied leach solution to material ratio will attain 2.0 kl/t. For scaling purposes, no additional gold extraction is expected to occur when the leach solution to material ratio exceeds 2.0 kl/t, either as a buried lift or during the 135 days of winter when irrigation continues without the addition of fresh material to the leach pad.
Table 13-6 Industrial Heap Leach Design Parameters
Parameter Units Design
Lift Height m 8
Dry Stack Bulk Density t/m3 1.6
Solution Application Rate l/m2/h 12
Leach Stages: Primary Leach (ILS Solution Application) Secondary Leach (Barren Solution Application) Buried Lift Leach (PLS Application) Total Leach Cycle
days (S:M ratio) 30 (0.7)
days (S:M ratio) 30 (0.7)
days (S:M ratio) 30 (0.7)
days (S:M ratio) 90 (2.0)
The gold extraction data has been extracted from the column tests when solution to material ratios attained approximately 0.7, 1.3 and 2.0 kl/t. Gold extraction has been
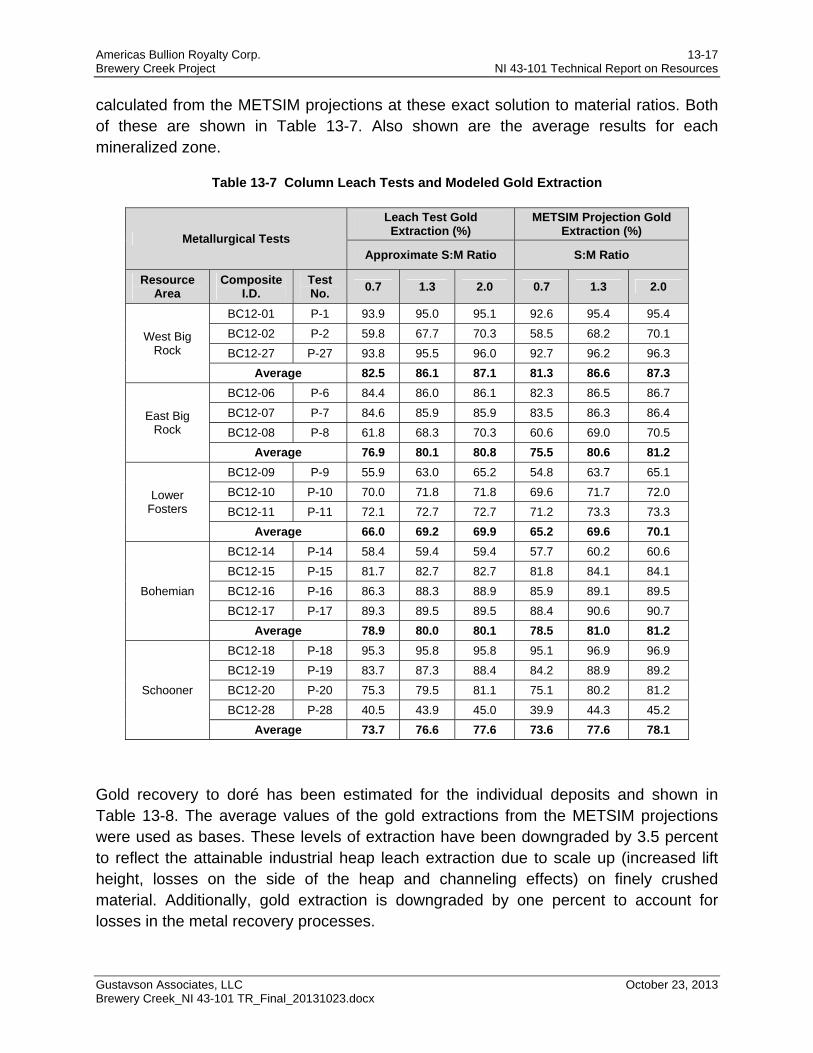
Americas Bullion Royalty Corp. 13-17 Brewery Creek Project NI 43-101 Technical Report on Resources
Gustavson Associates, LLC October 23, 2013 Brewery Creek_NI 43-101 TR_Final_20131023.docx
calculated from the METSIM projections at these exact solution to material ratios. Both of these are shown in Table 13-7. Also shown are the average results for each mineralized zone.
Table 13-7 Column Leach Tests and Modeled Gold Extraction
Metallurgical Tests
Leach Test Gold Extraction (%)
METSIM Projection Gold Extraction (%)
Approximate S:M Ratio S:M Ratio
Resource Area
Composite I.D.
Test No.
0.7 1.3 2.0 0.7 1.3 2.0
West Big Rock
BC12-01 P-1 93.9 95.0 95.1 92.6 95.4 95.4
BC12-02 P-2 59.8 67.7 70.3 58.5 68.2 70.1
BC12-27 P-27 93.8 95.5 96.0 92.7 96.2 96.3
Average 82.5 86.1 87.1 81.3 86.6 87.3
East Big Rock
BC12-06 P-6 84.4 86.0 86.1 82.3 86.5 86.7
BC12-07 P-7 84.6 85.9 85.9 83.5 86.3 86.4
BC12-08 P-8 61.8 68.3 70.3 60.6 69.0 70.5
Average 76.9 80.1 80.8 75.5 80.6 81.2
Lower Fosters
BC12-09 P-9 55.9 63.0 65.2 54.8 63.7 65.1
BC12-10 P-10 70.0 71.8 71.8 69.6 71.7 72.0
BC12-11 P-11 72.1 72.7 72.7 71.2 73.3 73.3
Average 66.0 69.2 69.9 65.2 69.6 70.1
Bohemian
BC12-14 P-14 58.4 59.4 59.4 57.7 60.2 60.6
BC12-15 P-15 81.7 82.7 82.7 81.8 84.1 84.1
BC12-16 P-16 86.3 88.3 88.9 85.9 89.1 89.5
BC12-17 P-17 89.3 89.5 89.5 88.4 90.6 90.7
Average 78.9 80.0 80.1 78.5 81.0 81.2
Schooner
BC12-18 P-18 95.3 95.8 95.8 95.1 96.9 96.9
BC12-19 P-19 83.7 87.3 88.4 84.2 88.9 89.2
BC12-20 P-20 75.3 79.5 81.1 75.1 80.2 81.2
BC12-28 P-28 40.5 43.9 45.0 39.9 44.3 45.2
Average 73.7 76.6 77.6 73.6 77.6 78.1
Gold recovery to doré has been estimated for the individual deposits and shown in Table 13-8. The average values of the gold extractions from the METSIM projections were used as bases. These levels of extraction have been downgraded by 3.5 percent to reflect the attainable industrial heap leach extraction due to scale up (increased lift height, losses on the side of the heap and channeling effects) on finely crushed material. Additionally, gold extraction is downgraded by one percent to account for losses in the metal recovery processes.
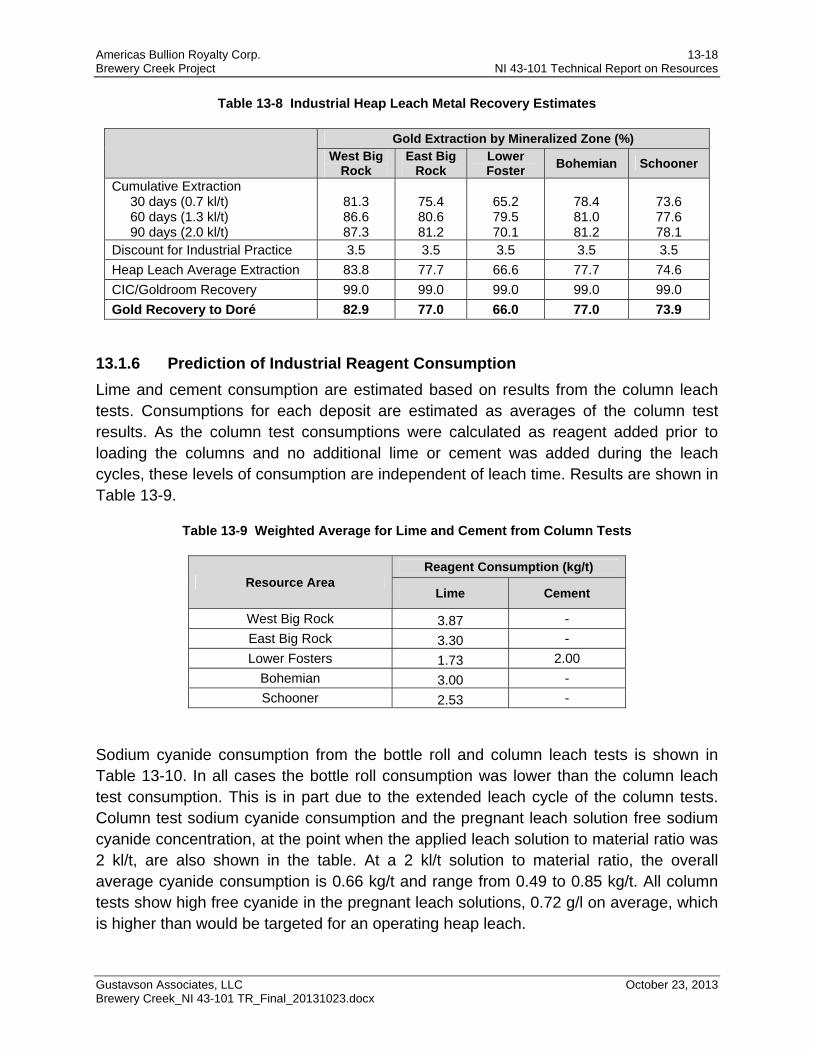
Americas Bullion Royalty Corp. 13-18 Brewery Creek Project NI 43-101 Technical Report on Resources
Gustavson Associates, LLC October 23, 2013 Brewery Creek_NI 43-101 TR_Final_20131023.docx
Table 13-8 Industrial Heap Leach Metal Recovery Estimates
Gold Extraction by Mineralized Zone (%) West Big
Rock East Big
Rock Lower Foster
Bohemian Schooner
Cumulative Extraction 30 days (0.7 kl/t) 60 days (1.3 kl/t) 90 days (2.0 kl/t)
81.3 86.6 87.3
75.4 80.6 81.2
65.2 79.5 70.1
78.4 81.0 81.2
73.6 77.6 78.1
Discount for Industrial Practice 3.5 3.5 3.5 3.5 3.5
Heap Leach Average Extraction 83.8 77.7 66.6 77.7 74.6
CIC/Goldroom Recovery 99.0 99.0 99.0 99.0 99.0
Gold Recovery to Doré 82.9 77.0 66.0 77.0 73.9
13.1.6 Prediction of Industrial Reagent Consumption
Lime and cement consumption are estimated based on results from the column leach tests. Consumptions for each deposit are estimated as averages of the column test results. As the column test consumptions were calculated as reagent added prior to loading the columns and no additional lime or cement was added during the leach cycles, these levels of consumption are independent of leach time. Results are shown in Table 13-9.
Table 13-9 Weighted Average for Lime and Cement from Column Tests
Resource Area Reagent Consumption (kg/t)
Lime Cement
West Big Rock 3.87 -
East Big Rock 3.30 -
Lower Fosters 1.73 2.00
Bohemian 3.00 -
Schooner 2.53 -
Sodium cyanide consumption from the bottle roll and column leach tests is shown in Table 13-10. In all cases the bottle roll consumption was lower than the column leach test consumption. This is in part due to the extended leach cycle of the column tests. Column test sodium cyanide consumption and the pregnant leach solution free sodium cyanide concentration, at the point when the applied leach solution to material ratio was 2 kl/t, are also shown in the table. At a 2 kl/t solution to material ratio, the overall average cyanide consumption is 0.66 kg/t and range from 0.49 to 0.85 kg/t. All column tests show high free cyanide in the pregnant leach solutions, 0.72 g/l on average, which is higher than would be targeted for an operating heap leach.
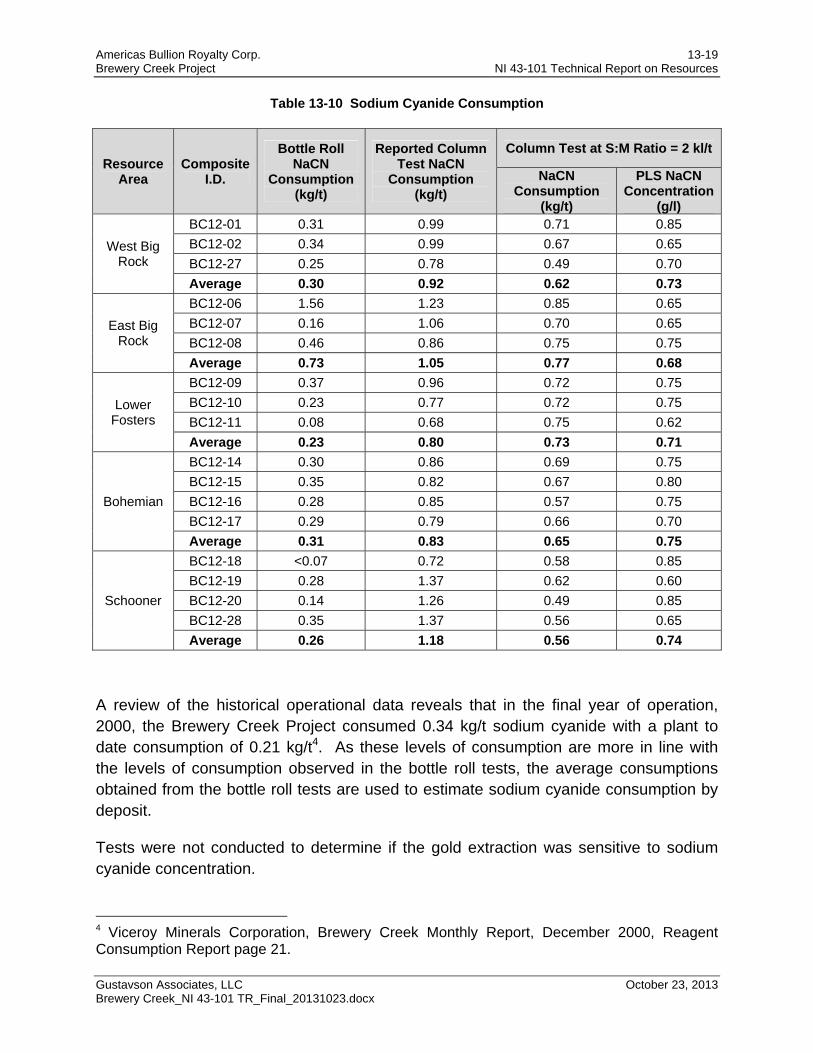
Americas Bullion Royalty Corp. 13-19 Brewery Creek Project NI 43-101 Technical Report on Resources
Gustavson Associates, LLC October 23, 2013 Brewery Creek_NI 43-101 TR_Final_20131023.docx
Table 13-10 Sodium Cyanide Consumption
Resource Area
Composite I.D.
Bottle Roll NaCN
Consumption (kg/t)
Reported Column Test NaCN
Consumption (kg/t)
Column Test at S:M Ratio = 2 kl/t
NaCN Consumption
(kg/t)
PLS NaCN Concentration
(g/l)
West Big Rock
BC12-01 0.31 0.99 0.71 0.85
BC12-02 0.34 0.99 0.67 0.65
BC12-27 0.25 0.78 0.49 0.70
Average 0.30 0.92 0.62 0.73
East Big Rock
BC12-06 1.56 1.23 0.85 0.65
BC12-07 0.16 1.06 0.70 0.65
BC12-08 0.46 0.86 0.75 0.75
Average 0.73 1.05 0.77 0.68
Lower Fosters
BC12-09 0.37 0.96 0.72 0.75
BC12-10 0.23 0.77 0.72 0.75
BC12-11 0.08 0.68 0.75 0.62
Average 0.23 0.80 0.73 0.71
Bohemian
BC12-14 0.30 0.86 0.69 0.75
BC12-15 0.35 0.82 0.67 0.80
BC12-16 0.28 0.85 0.57 0.75
BC12-17 0.29 0.79 0.66 0.70
Average 0.31 0.83 0.65 0.75
Schooner
BC12-18 <0.07 0.72 0.58 0.85
BC12-19 0.28 1.37 0.62 0.60
BC12-20 0.14 1.26 0.49 0.85
BC12-28 0.35 1.37 0.56 0.65
Average 0.26 1.18 0.56 0.74
A review of the historical operational data reveals that in the final year of operation, 2000, the Brewery Creek Project consumed 0.34 kg/t sodium cyanide with a plant to date consumption of 0.21 kg/t4. As these levels of consumption are more in line with the levels of consumption observed in the bottle roll tests, the average consumptions obtained from the bottle roll tests are used to estimate sodium cyanide consumption by deposit.
Tests were not conducted to determine if the gold extraction was sensitive to sodium cyanide concentration.
4 Viceroy Minerals Corporation, Brewery Creek Monthly Report, December 2000, Reagent Consumption Report page 21.
Americas Bullion Royalty Corp. 13-20 Brewery Creek Project NI 43-101 Technical Report on Resources
Gustavson Associates, LLC October 23, 2013 Brewery Creek_NI 43-101 TR_Final_20131023.docx
13.2 MLI Job No. 3618 Reprocessing of Original Heap
The original work at the Brewery Creek Project processed an estimated 9.5 million tonnes of material on a truck dumped heap leach. This material is scheduled to be reprocessed along with the new material. A drilling program was conducted on the old heap and 18 sonic drillholes were punched down to a maximum depth of 75 ft. One hundred-seventy seven head samples were analyzed and composited into 28 samples for bottle roll analysis. The individual holes were then combined into 4 composite samples, RZ-1 to 4, and crushed to 9.5 mm, agglomerated, and column leached.5
Each drill core interval sample was analyzed for total gold and silver, cyanide soluble gold and silver, and preg-robbing potential of the carbonaceous minerals. Composite samples were reconstituted from the interval samples and subjected to bottle roll leach testing, vat leach testing and column leach testing. Bottle roll testing and column leach testing were conducted on composites prepared by mineralized zones to evaluate re-handling and crushing the residue material. Screen analyses were conducted on column composite sample heads and residual tails. Vat leach tests included fresh water rinsing followed by cyanide leaching to evaluate rinsing or re-leaching the existing residue material.
13.2.1 Reprocessed Material Sample Preparation
A total of 177 drill core interval samples were delivered to MLI on 21 October 2011 from the Brewery Creek Project. A majority of the drill core intervals were 5 ft long and weighed approximately 20 kg. There were 16 interval samples measured less than 4 feet in length and weighed between 2 kg and 20 kg. The interval samples were prepared according to the following procedures to generate test charges for the interval head assays and composite head assays.
Each drill core interval sample was dried and the dry samples with 8 kg or more blended and split in half by coning and quartering methods.
The interval samples with less than 8 kg of weight stage crushed to 80 percent passing 38 mm (100 percent passing 50 mm) prior to splitting.
One half of the interval sample prepared in the previous stages was saved for further tests. The other half was stage crushed to 80 percent passing 9.5 mm (100 percent passing 12.5 mm).
A 1,000 gram was split from each 80 percent passing 9.5 mm sample and submitted for the interval sample Au and Ag assays.
5 Memorandum from KD Engineering 5 Nov 2012, “Brewery Creek Reprocessing Existing Heap Leach”
Americas Bullion Royalty Corp. 13-21 Brewery Creek Project NI 43-101 Technical Report on Resources
Gustavson Associates, LLC October 23, 2013 Brewery Creek_NI 43-101 TR_Final_20131023.docx
The un-crushed and 80 percent passing 38 mm materials prepared in the first two stages were combined to generate a total of 28 drillhole composite samples representing the upper and lower portions of the drillholes.
The 60 to 60.6 feet interval from the drillhole BCS 6-2 was not included in these composites. It was suspected by the client that this 0.6 foot long interval had been mislabeled and/or included by mistake.
A 15 kg split was taken from each composite for vat leach tests.
The remaining composite samples were crushed to 80 percent passing 38 mm (100 percent passing 50 mm), blended and a 5 kg split was obtained by coning and quartering methods.
Each 5 kg composite was stage crushed to 80 percent passing 9.5 mm and 1,000 gram test charges were split for composite head assays. The composite head assay analyses were conducted in triplicate.
The following paragraphs describe the steps used to generate composite test charges for stability tests, bottle roll testing and column leach testing.
Composite samples prepared in the previous steps were blended by mineralized zone and test charges were split for agglomerate strength and stability tests (10 kg) and bottle roll testing (5 kg).
The 5 kg split was crushed to 80 percent passing 9.5 mm (100 percent passing 12.5 mm) and 1,000 gram test charges were split for bottle roll testing and head assay analysis. Head assays were conducted in triplicate using 1,000 gram splits.
The reject 38 mm material from each residue zone composites was blended and 90 kg splits were stage crushed to 80 percent passing 9.5 mm (100 percent passing 12.5 mm). From the 9.5 mm material 75 kg was split for column leach tests and the remaining material (~15 kg) was used for head screen analyses.
13.2.2 Reprocessed Material Column Leach Tests
Head assay splits from each interval and the composites were assayed for gold and silver content by conventional fire assay and geochemical methods. The cyanide soluble gold and cyanide soluble silver were determined by cyanide shake tests.
Physical characteristics for the column leach tests are shown in Table 13-11.
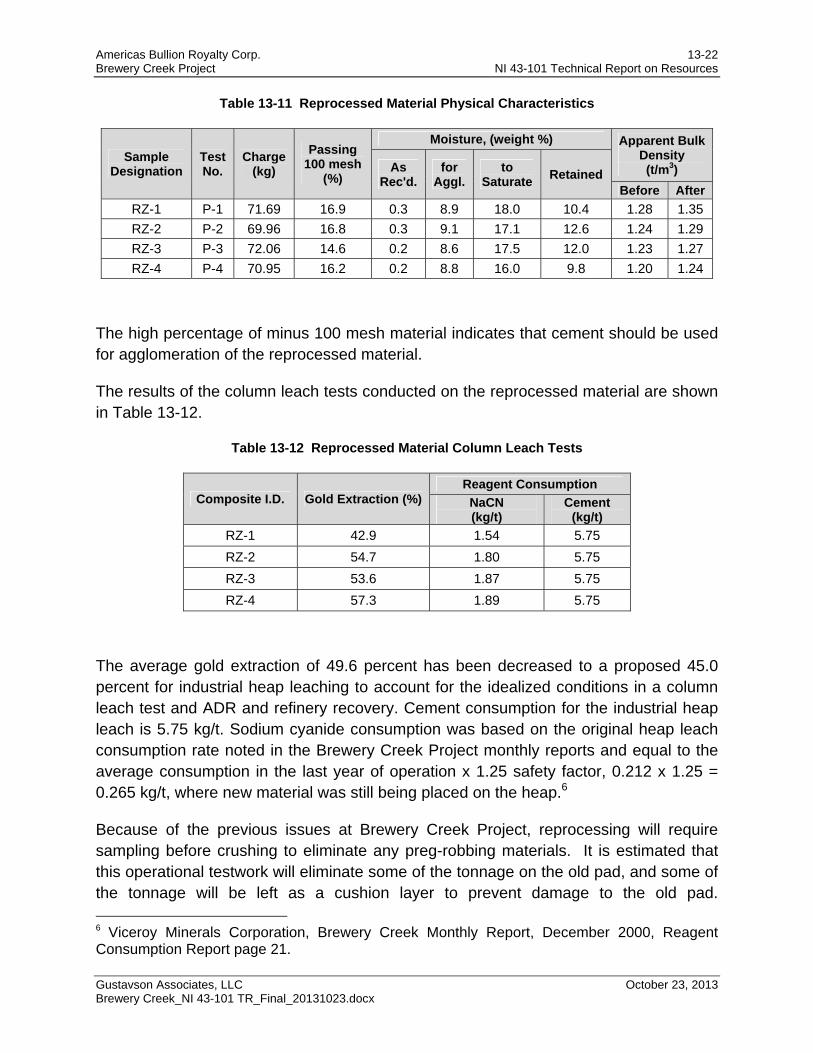
Americas Bullion Royalty Corp. 13-22 Brewery Creek Project NI 43-101 Technical Report on Resources
Gustavson Associates, LLC October 23, 2013 Brewery Creek_NI 43-101 TR_Final_20131023.docx
Table 13-11 Reprocessed Material Physical Characteristics
Sample Designation
Test No.
Charge (kg)
Passing 100 mesh
(%)
Moisture, (weight %) Apparent Bulk Density (t/m3) As
Rec'd. for
Aggl. to
Saturate Retained
Before After
RZ-1 P-1 71.69 16.9 0.3 8.9 18.0 10.4 1.28 1.35
RZ-2 P-2 69.96 16.8 0.3 9.1 17.1 12.6 1.24 1.29
RZ-3 P-3 72.06 14.6 0.2 8.6 17.5 12.0 1.23 1.27
RZ-4 P-4 70.95 16.2 0.2 8.8 16.0 9.8 1.20 1.24
The high percentage of minus 100 mesh material indicates that cement should be used for agglomeration of the reprocessed material.
The results of the column leach tests conducted on the reprocessed material are shown in Table 13-12.
Table 13-12 Reprocessed Material Column Leach Tests
Composite I.D. Gold Extraction (%) Reagent Consumption
NaCN (kg/t)
Cement (kg/t)
RZ-1 42.9 1.54 5.75
RZ-2 54.7 1.80 5.75
RZ-3 53.6 1.87 5.75
RZ-4 57.3 1.89 5.75
The average gold extraction of 49.6 percent has been decreased to a proposed 45.0 percent for industrial heap leaching to account for the idealized conditions in a column leach test and ADR and refinery recovery. Cement consumption for the industrial heap leach is 5.75 kg/t. Sodium cyanide consumption was based on the original heap leach consumption rate noted in the Brewery Creek Project monthly reports and equal to the average consumption in the last year of operation x 1.25 safety factor, 0.212 x 1.25 = 0.265 kg/t, where new material was still being placed on the heap.6
Because of the previous issues at Brewery Creek Project, reprocessing will require sampling before crushing to eliminate any preg-robbing materials. It is estimated that this operational testwork will eliminate some of the tonnage on the old pad, and some of the tonnage will be left as a cushion layer to prevent damage to the old pad. 6 Viceroy Minerals Corporation, Brewery Creek Monthly Report, December 2000, Reagent Consumption Report page 21.

Americas Bullion Royalty Corp. 13-23 Brewery Creek Project NI 43-101 Technical Report on Resources
Gustavson Associates, LLC October 23, 2013 Brewery Creek_NI 43-101 TR_Final_20131023.docx
Additionally, the volume available on the old and new cells combined limits the amount of tonnage processed from the old pad. Parameters are shown in Table 13-13.
Table 13-13 Reprocessing Parameters
Description Value Units Comments
Resource 4,774,000 t/h Estimated
Grade 0.59 g/t Mine Plan grade
Recovery 45 % Test work7
Lime Consumption 0 kg/t Column Leach Tests
Cyanide Consumption 0.265 kg/t Operational data
Cement Consumption 5.75 kg/t Column Leach Tests
13.3 Industrial Gold Extraction and Reagent Consumption
Table 13-14 summarizes the levels of gold extraction and reagent consumption for the resource areas included in MLI job #3719 and the reprocessed heap. This table includes the estimated tonnage from each resource area. The weighted average gold extraction and reagent consumption have been used as bases for the process plant design criteria. The weighted average reagent consumption values have been used to estimate overall per tonne operating cost. The gold extraction results by deposit have been used in conjunction with the mine plan to estimate gold production.
Table 13-14 Weighted Average Reagent Consumption
Resource Area Tonnes Au Extraction
(%) NaCN (kg/t)
Lime (kg/t)
Cement(kg/t)
West Big Rock 1,256,700 82.9 0.30 3.87 0
East Big Rock 783,300 77.0 0.73 3.30 0
Lower Fosters 1,099,300 66.0 0.23 1.73 2.00
Bohemian 2,018,600 77.0 0.31 3.00 0
Schooner 1,428,500 73.9 0.26 2.53 0
Old Heap 4,774,000 45.0 0.27 0 5.75
Weighted Average 11,360,400 66.6 0.30 1.67 2.61
Run-of-Mine size distribution is assumed based on visual inspection of materials on the pad and in the mined-out pits.
7 “Report on Heap Leach Residue Testing, MLI Job No. 3618”, Dec. 19 2012, McClelland Laboratories, Inc.
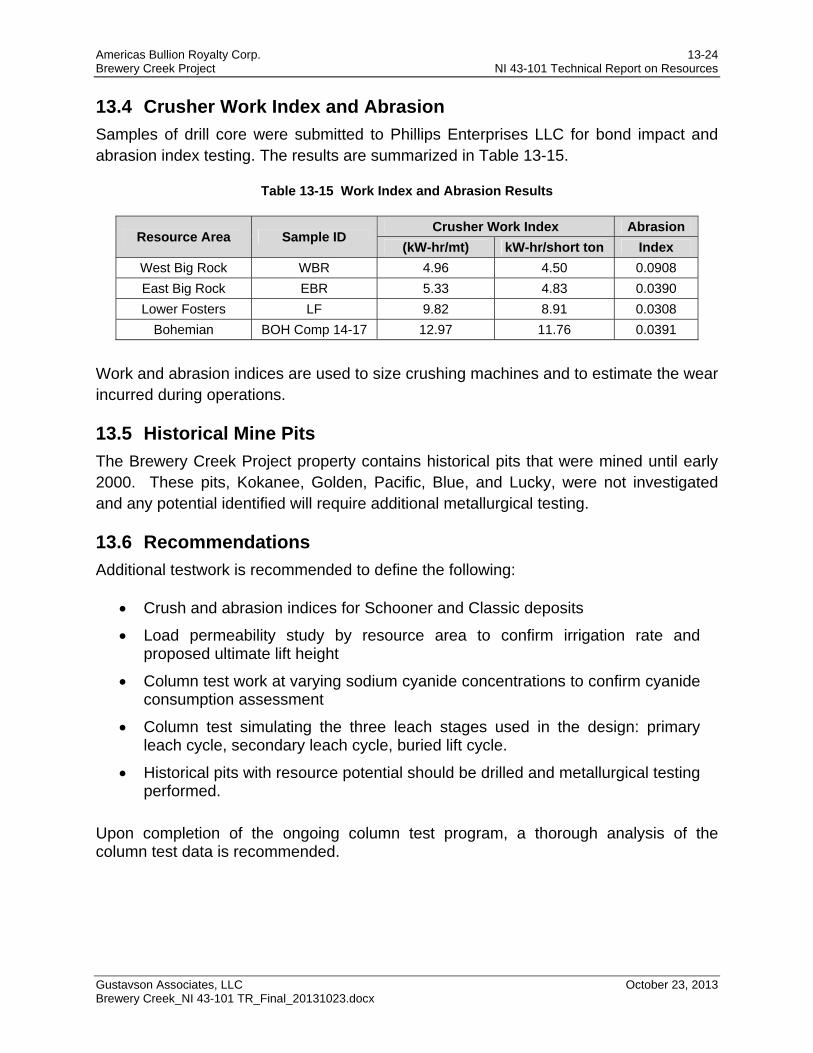
Americas Bullion Royalty Corp. 13-24 Brewery Creek Project NI 43-101 Technical Report on Resources
Gustavson Associates, LLC October 23, 2013 Brewery Creek_NI 43-101 TR_Final_20131023.docx
13.4 Crusher Work Index and Abrasion
Samples of drill core were submitted to Phillips Enterprises LLC for bond impact and abrasion index testing. The results are summarized in Table 13-15.
Table 13-15 Work Index and Abrasion Results
Resource Area Sample ID Crusher Work Index Abrasion
(kW-hr/mt) kW-hr/short ton Index
West Big Rock WBR 4.96 4.50 0.0908
East Big Rock EBR 5.33 4.83 0.0390
Lower Fosters LF 9.82 8.91 0.0308
Bohemian BOH Comp 14-17 12.97 11.76 0.0391
Work and abrasion indices are used to size crushing machines and to estimate the wear incurred during operations.
13.5 Historical Mine Pits
The Brewery Creek Project property contains historical pits that were mined until early 2000. These pits, Kokanee, Golden, Pacific, Blue, and Lucky, were not investigated and any potential identified will require additional metallurgical testing.
13.6 Recommendations
Additional testwork is recommended to define the following:
Crush and abrasion indices for Schooner and Classic deposits
Load permeability study by resource area to confirm irrigation rate and proposed ultimate lift height
Column test work at varying sodium cyanide concentrations to confirm cyanide consumption assessment
Column test simulating the three leach stages used in the design: primary leach cycle, secondary leach cycle, buried lift cycle.
Historical pits with resource potential should be drilled and metallurgical testing performed.
Upon completion of the ongoing column test program, a thorough analysis of the column test data is recommended.
Americas Bullion Royalty Corp. 14-1 Brewery Creek Project NI 43-101 Technical Report on Resources
Gustavson Associates, LLC October 23, 2013 Brewery Creek_NI 43-101 TR_Final_20131023.docx
14 Mineral Resource Estimate (Item 14) A total of fifteen Mineral Resource estimates are presented in this report which have been prepared or validated independently by three independent Qualified Persons, Michael J. Lechner, P. Geo., of RMI, James Barr, P. Geo., of EBA, and D. Hulse, P.E., of Gustavson.
AMB prepared mineral resource estimates for the Pacific-Blue (PABL), Kokanee-Golden (KOGD) and Lucky (LU) resource areas which were verified by Gustavson. D. Hulse is the responsible QP for the KOGD, PABL, and LU resource estimates. These estimates are presented in Section 14.1, 14.5, and 14.6.
Mr. Lechner prepared the Mineral Resources for the Bohemian (BH), Schooner (SC), Lower Fosters (FS), West Big Rock (WB), East Big Rock (EB), Classic (CL), and Lone Star (LS) deposit, and for the historical heap leach pad material. M. Lechner is the responsible QP for the BH, SC, FS, WB, EB, CL, LS and heap leach pad resource estimates. These estimates are presented in Sections 14.2, 14.3., 14.5, and 14.6.
Mr. Barr prepared mineral resource estimates for the North Slope (NS) and Sleeman (SL) deposits. J. Barr is the responsible QP for the NS and SL resource estimates. These estimates are summarized in Section 14.4, 14.5, and 14.6.
Figure 14-1 shows the location of the fourteen block models. The heap leach pad is not shown.
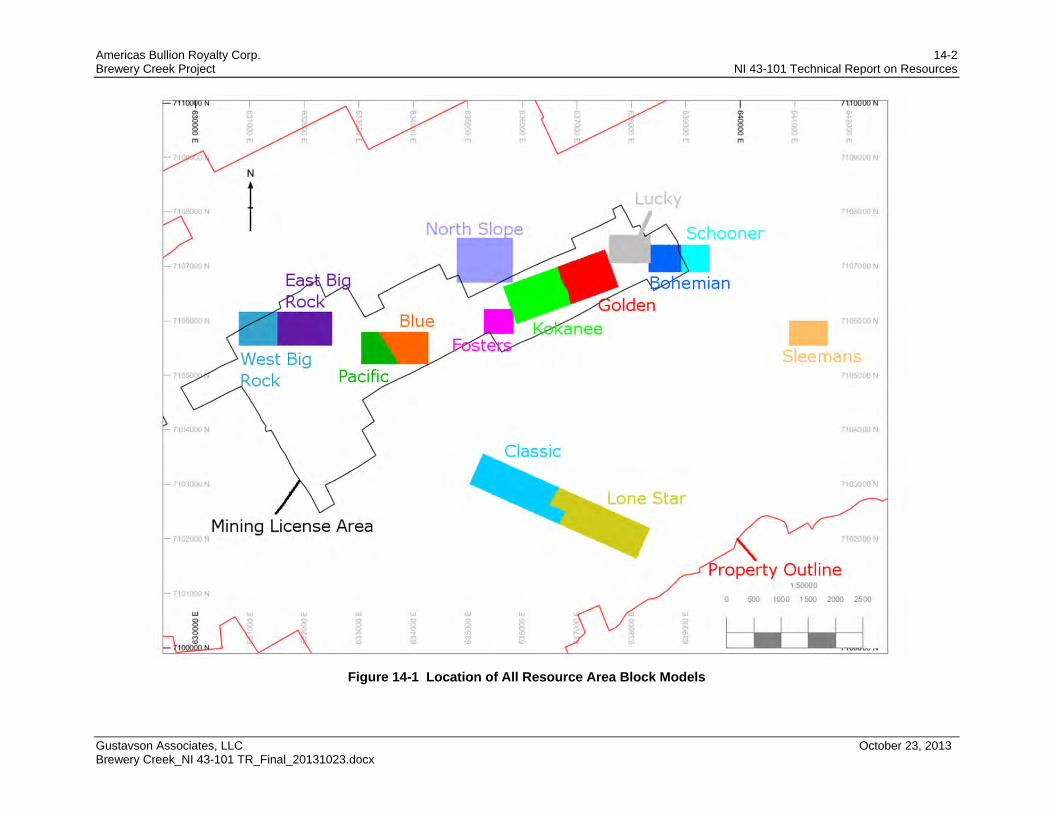
Americas Bullion Royalty Corp. 14-2 Brewery Creek Project NI 43-101 Technical Report on Resources
Gustavson Associates, LLC October 23, 2013 Brewery Creek_NI 43-101 TR_Final_20131023.docx
Figure 14-1 Location of All Resource Area Block Models
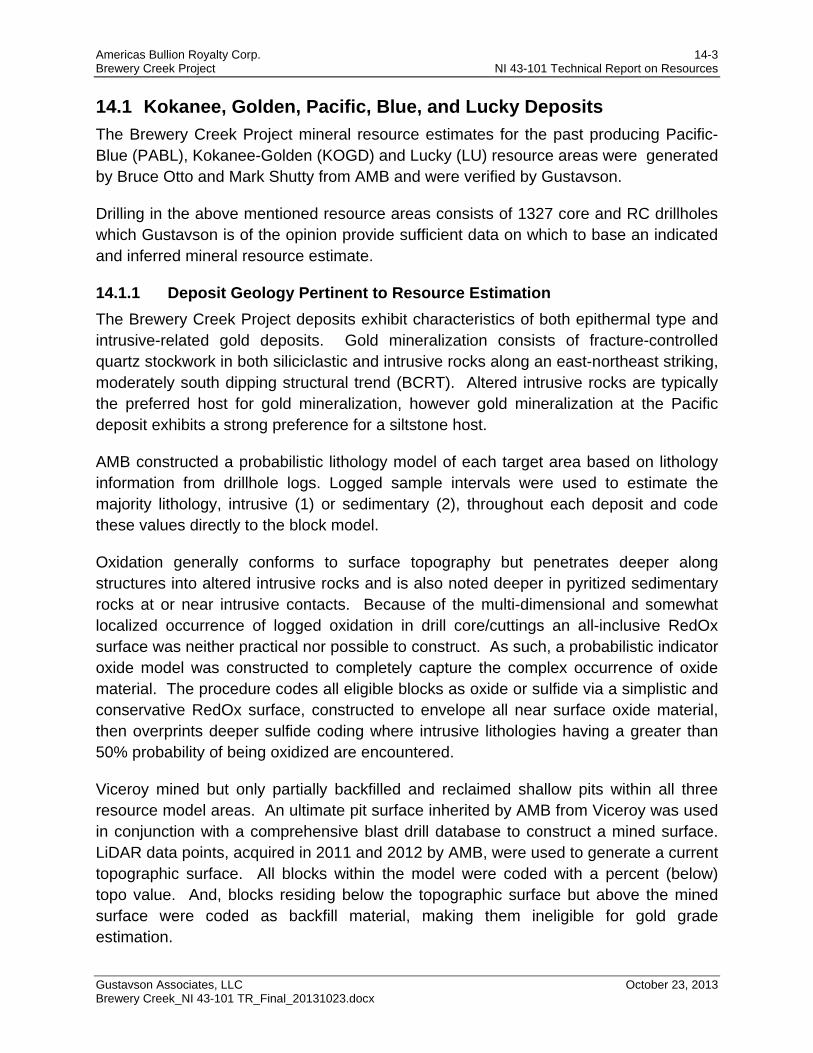
Americas Bullion Royalty Corp. 14-3 Brewery Creek Project NI 43-101 Technical Report on Resources
Gustavson Associates, LLC October 23, 2013 Brewery Creek_NI 43-101 TR_Final_20131023.docx
14.1 Kokanee, Golden, Pacific, Blue, and Lucky Deposits
The Brewery Creek Project mineral resource estimates for the past producing Pacific-Blue (PABL), Kokanee-Golden (KOGD) and Lucky (LU) resource areas were generated by Bruce Otto and Mark Shutty from AMB and were verified by Gustavson.
Drilling in the above mentioned resource areas consists of 1327 core and RC drillholes which Gustavson is of the opinion provide sufficient data on which to base an indicated and inferred mineral resource estimate.
14.1.1 Deposit Geology Pertinent to Resource Estimation
The Brewery Creek Project deposits exhibit characteristics of both epithermal type and intrusive-related gold deposits. Gold mineralization consists of fracture-controlled quartz stockwork in both siliciclastic and intrusive rocks along an east-northeast striking, moderately south dipping structural trend (BCRT). Altered intrusive rocks are typically the preferred host for gold mineralization, however gold mineralization at the Pacific deposit exhibits a strong preference for a siltstone host.
AMB constructed a probabilistic lithology model of each target area based on lithology information from drillhole logs. Logged sample intervals were used to estimate the majority lithology, intrusive (1) or sedimentary (2), throughout each deposit and code these values directly to the block model.
Oxidation generally conforms to surface topography but penetrates deeper along structures into altered intrusive rocks and is also noted deeper in pyritized sedimentary rocks at or near intrusive contacts. Because of the multi-dimensional and somewhat localized occurrence of logged oxidation in drill core/cuttings an all-inclusive RedOx surface was neither practical nor possible to construct. As such, a probabilistic indicator oxide model was constructed to completely capture the complex occurrence of oxide material. The procedure codes all eligible blocks as oxide or sulfide via a simplistic and conservative RedOx surface, constructed to envelope all near surface oxide material, then overprints deeper sulfide coding where intrusive lithologies having a greater than 50% probability of being oxidized are encountered.
Viceroy mined but only partially backfilled and reclaimed shallow pits within all three resource model areas. An ultimate pit surface inherited by AMB from Viceroy was used in conjunction with a comprehensive blast drill database to construct a mined surface. LiDAR data points, acquired in 2011 and 2012 by AMB, were used to generate a current topographic surface. All blocks within the model were coded with a percent (below) topo value. And, blocks residing below the topographic surface but above the mined surface were coded as backfill material, making them ineligible for gold grade estimation.
Americas Bullion Royalty Corp. 14-4 Brewery Creek Project NI 43-101 Technical Report on Resources
Gustavson Associates, LLC October 23, 2013 Brewery Creek_NI 43-101 TR_Final_20131023.docx
AMB’s models consist of generalized structurally bound, sediment/intrusive lithology models coded to account for oxide/sulfide and backfill material types. Gold estimation was conducted using inverse distance (ID) method and validated with nearest neighbor (NN) method for eligible blocks meeting the criteria of residing below the present topographic surface and having an assigned intrusive or sediment rock type.
14.1.2 Data Used for Estimation
AMB created a 3D block model of the mineral resource based on current and historical data. The resource estimate is divided into three areas consisting of 5 targets. The Kokanee-Golden (KOGD) model consists of the Kokanee (KO) and Golden (GD) targets; the Pacific-Blue (PABL) model consists of the Pacific (PA) and Blue (BL) targets, and the Lucky (LU) model consists of the Lucky (LU) target. Drillhole data used for estimation are summarized in Table C-1, Appendix C.
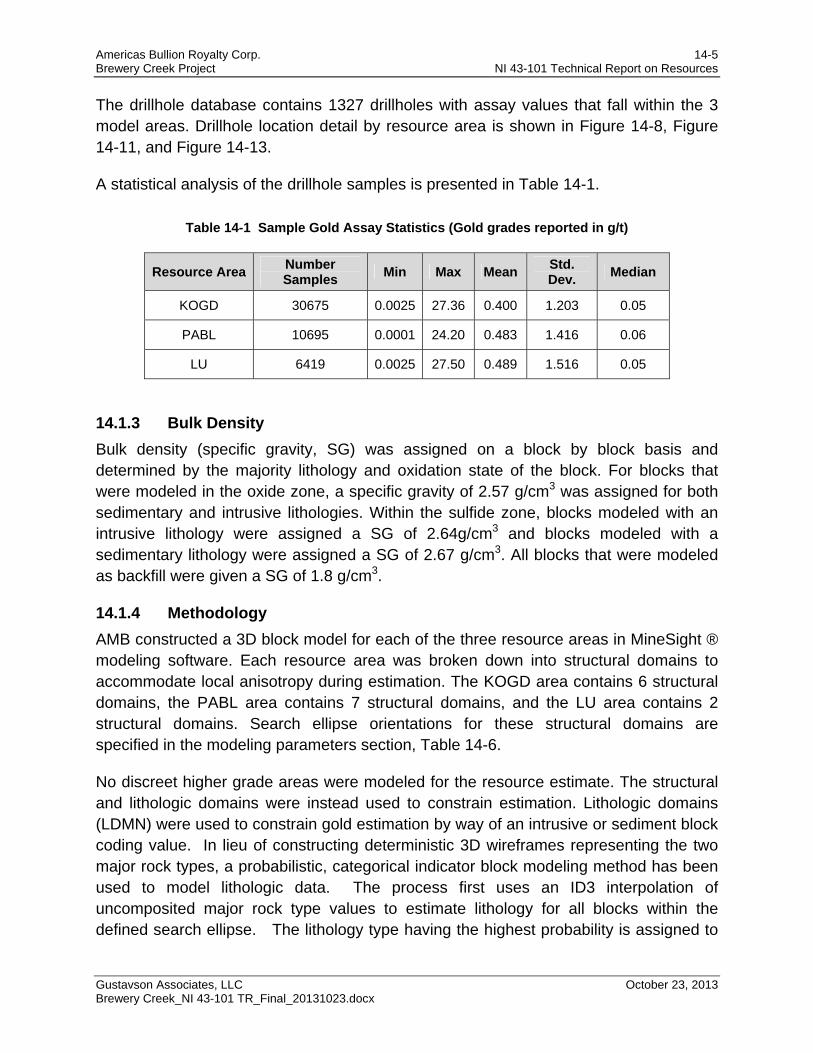
Americas Bullion Royalty Corp. 14-5 Brewery Creek Project NI 43-101 Technical Report on Resources
Gustavson Associates, LLC October 23, 2013 Brewery Creek_NI 43-101 TR_Final_20131023.docx
The drillhole database contains 1327 drillholes with assay values that fall within the 3 model areas. Drillhole location detail by resource area is shown in Figure 14-8, Figure 14-11, and Figure 14-13.
A statistical analysis of the drillhole samples is presented in Table 14-1.
Table 14-1 Sample Gold Assay Statistics (Gold grades reported in g/t)
Resource Area Number Samples
Min Max Mean Std. Dev.
Median
KOGD 30675 0.0025 27.36 0.400 1.203 0.05
PABL 10695 0.0001 24.20 0.483 1.416 0.06
LU 6419 0.0025 27.50 0.489 1.516 0.05
14.1.3 Bulk Density
Bulk density (specific gravity, SG) was assigned on a block by block basis and determined by the majority lithology and oxidation state of the block. For blocks that were modeled in the oxide zone, a specific gravity of 2.57 g/cm3 was assigned for both sedimentary and intrusive lithologies. Within the sulfide zone, blocks modeled with an intrusive lithology were assigned a SG of 2.64g/cm3 and blocks modeled with a sedimentary lithology were assigned a SG of 2.67 g/cm3. All blocks that were modeled as backfill were given a SG of 1.8 g/cm3.
14.1.4 Methodology
AMB constructed a 3D block model for each of the three resource areas in MineSight ® modeling software. Each resource area was broken down into structural domains to accommodate local anisotropy during estimation. The KOGD area contains 6 structural domains, the PABL area contains 7 structural domains, and the LU area contains 2 structural domains. Search ellipse orientations for these structural domains are specified in the modeling parameters section, Table 14-6.
No discreet higher grade areas were modeled for the resource estimate. The structural and lithologic domains were instead used to constrain estimation. Lithologic domains (LDMN) were used to constrain gold estimation by way of an intrusive or sediment block coding value. In lieu of constructing deterministic 3D wireframes representing the two major rock types, a probabilistic, categorical indicator block modeling method has been used to model lithologic data. The process first uses an ID3 interpolation of uncomposited major rock type values to estimate lithology for all blocks within the defined search ellipse. The lithology type having the highest probability is assigned to
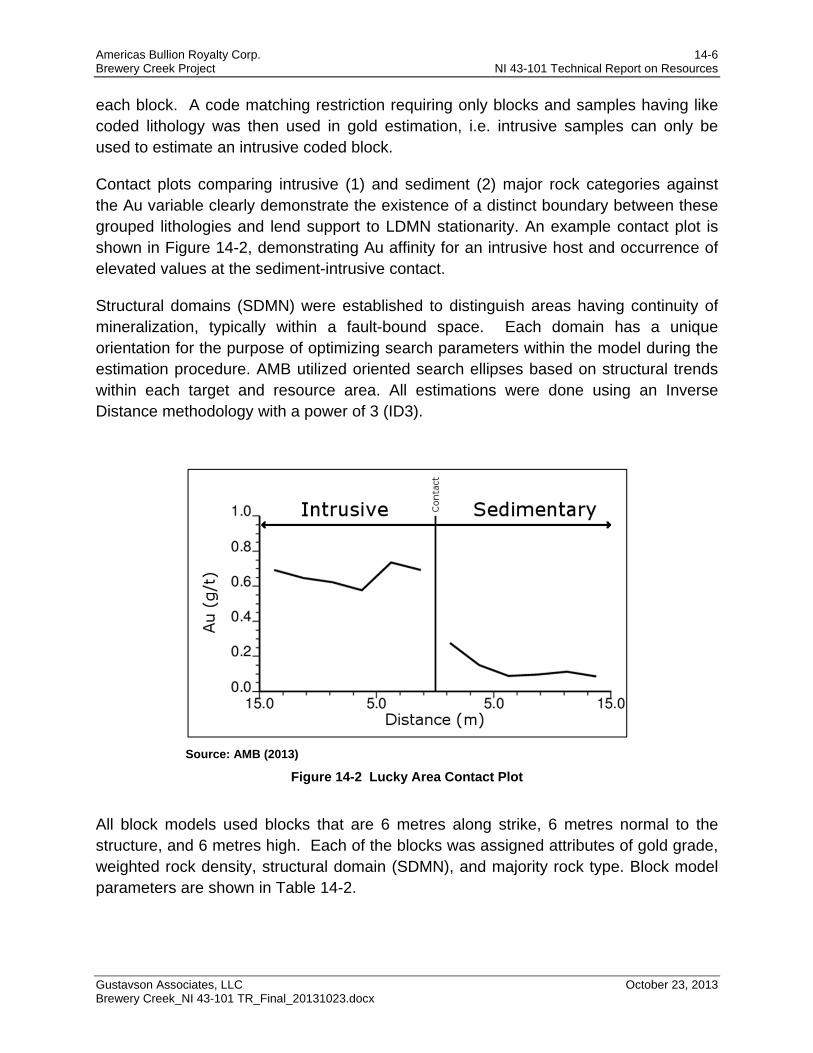
Americas Bullion Royalty Corp. 14-6 Brewery Creek Project NI 43-101 Technical Report on Resources
Gustavson Associates, LLC October 23, 2013 Brewery Creek_NI 43-101 TR_Final_20131023.docx
each block. A code matching restriction requiring only blocks and samples having like coded lithology was then used in gold estimation, i.e. intrusive samples can only be used to estimate an intrusive coded block.
Contact plots comparing intrusive (1) and sediment (2) major rock categories against the Au variable clearly demonstrate the existence of a distinct boundary between these grouped lithologies and lend support to LDMN stationarity. An example contact plot is shown in Figure 14-2, demonstrating Au affinity for an intrusive host and occurrence of elevated values at the sediment-intrusive contact.
Structural domains (SDMN) were established to distinguish areas having continuity of mineralization, typically within a fault-bound space. Each domain has a unique orientation for the purpose of optimizing search parameters within the model during the estimation procedure. AMB utilized oriented search ellipses based on structural trends within each target and resource area. All estimations were done using an Inverse Distance methodology with a power of 3 (ID3).
Source: AMB (2013)
Figure 14-2 Lucky Area Contact Plot
All block models used blocks that are 6 metres along strike, 6 metres normal to the structure, and 6 metres high. Each of the blocks was assigned attributes of gold grade, weighted rock density, structural domain (SDMN), and majority rock type. Block model parameters are shown in Table 14-2.
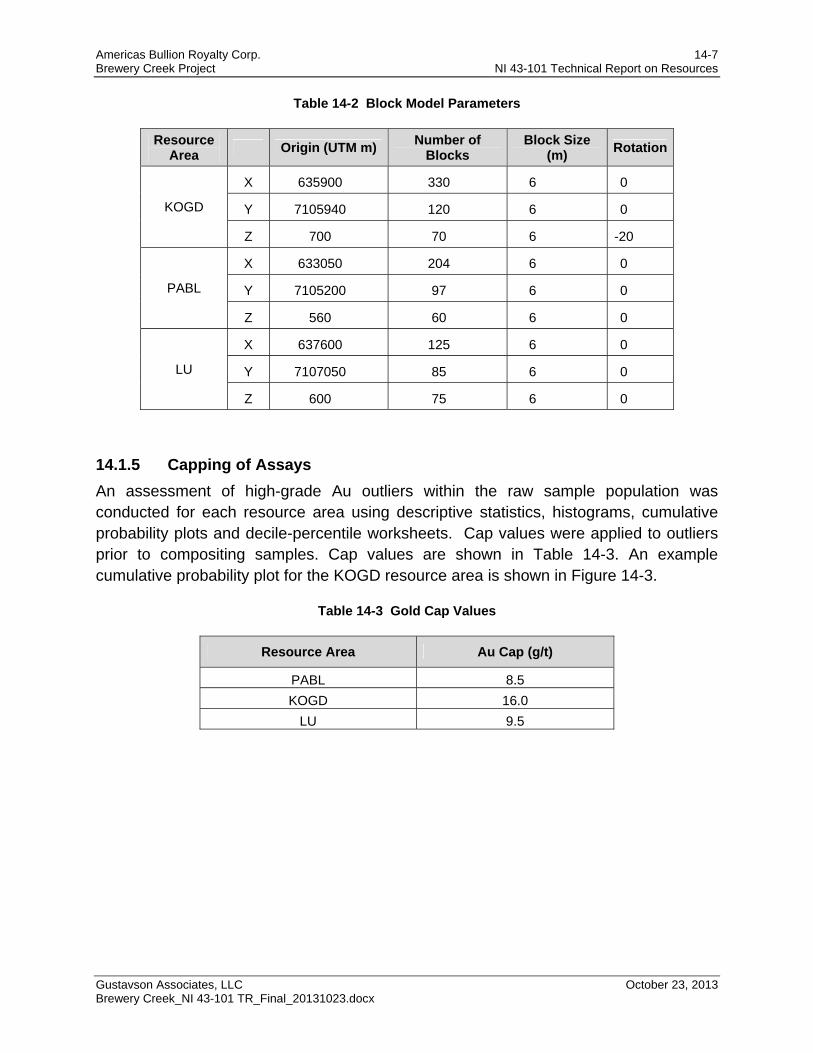
Americas Bullion Royalty Corp. 14-7 Brewery Creek Project NI 43-101 Technical Report on Resources
Gustavson Associates, LLC October 23, 2013 Brewery Creek_NI 43-101 TR_Final_20131023.docx
Table 14-2 Block Model Parameters
Resource Area
Origin (UTM m) Number of
Blocks Block Size
(m) Rotation
KOGD
X 635900 330 6 0
Y 7105940 120 6 0
Z 700 70 6 -20
PABL
X 633050 204 6 0
Y 7105200 97 6 0
Z 560 60 6 0
LU
X 637600 125 6 0
Y 7107050 85 6 0
Z 600 75 6 0
14.1.5 Capping of Assays
An assessment of high-grade Au outliers within the raw sample population was conducted for each resource area using descriptive statistics, histograms, cumulative probability plots and decile-percentile worksheets. Cap values were applied to outliers prior to compositing samples. Cap values are shown in Table 14-3. An example cumulative probability plot for the KOGD resource area is shown in Figure 14-3.
Table 14-3 Gold Cap Values
Resource Area Au Cap (g/t)
PABL 8.5
KOGD 16.0
LU 9.5
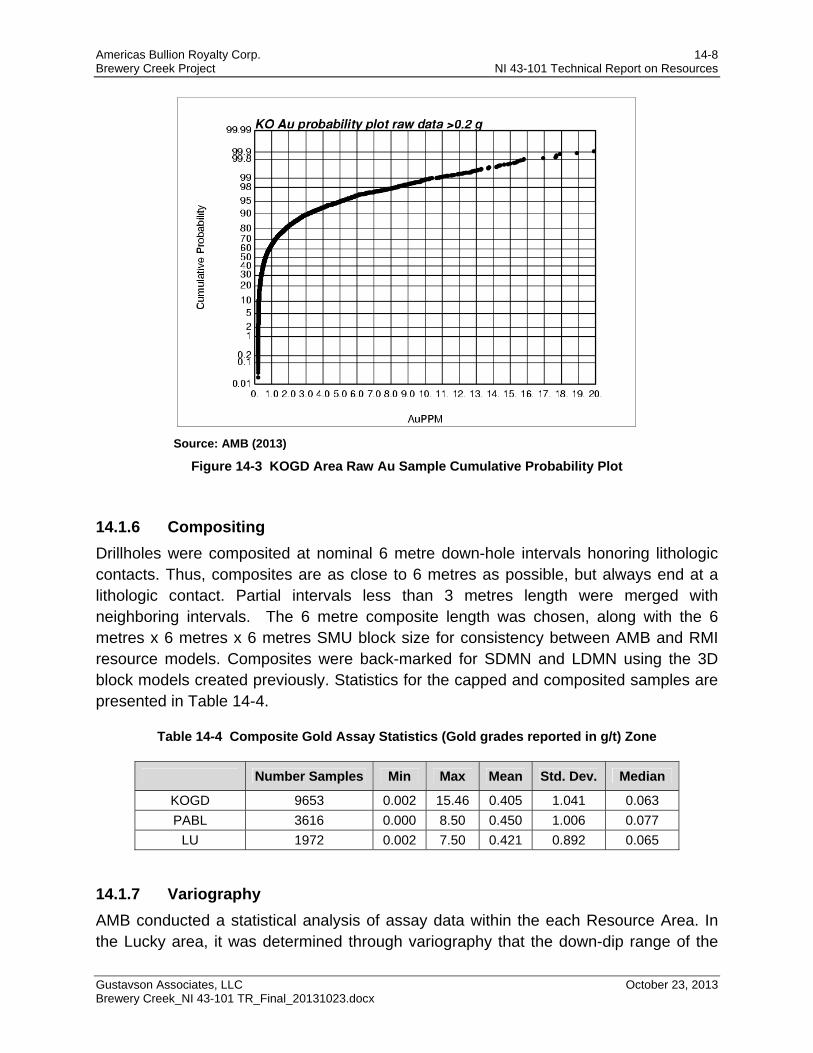
Americas Bullion Royalty Corp. 14-8 Brewery Creek Project NI 43-101 Technical Report on Resources
Gustavson Associates, LLC October 23, 2013 Brewery Creek_NI 43-101 TR_Final_20131023.docx
Source: AMB (2013)
Figure 14-3 KOGD Area Raw Au Sample Cumulative Probability Plot
14.1.6 Compositing
Drillholes were composited at nominal 6 metre down-hole intervals honoring lithologic contacts. Thus, composites are as close to 6 metres as possible, but always end at a lithologic contact. Partial intervals less than 3 metres length were merged with neighboring intervals. The 6 metre composite length was chosen, along with the 6 metres x 6 metres x 6 metres SMU block size for consistency between AMB and RMI resource models. Composites were back-marked for SDMN and LDMN using the 3D block models created previously. Statistics for the capped and composited samples are presented in Table 14-4.
Table 14-4 Composite Gold Assay Statistics (Gold grades reported in g/t) Zone
Number Samples Min Max Mean Std. Dev. Median
KOGD 9653 0.002 15.46 0.405 1.041 0.063
PABL 3616 0.000 8.50 0.450 1.006 0.077
LU 1972 0.002 7.50 0.421 0.892 0.065
14.1.7 Variography
AMB conducted a statistical analysis of assay data within the each Resource Area. In the Lucky area, it was determined through variography that the down-dip range of the

Americas Bullion Royalty Corp. 14-9 Brewery Creek Project NI 43-101 Technical Report on Resources
Gustavson Associates, LLC October 23, 2013 Brewery Creek_NI 43-101 TR_Final_20131023.docx
gold grade continuity was 70 metres. The continuity along strike was 70 metres. The search ellipse ranges in the PABL and KOGD Resource Areas, 80 metres along strike and 40 metres down-dip, were determined by variography conducted previously at other, similar BRC district deposits. The variograms from the LU resource area are shown in Figure 14-4 and Figure 14-5.
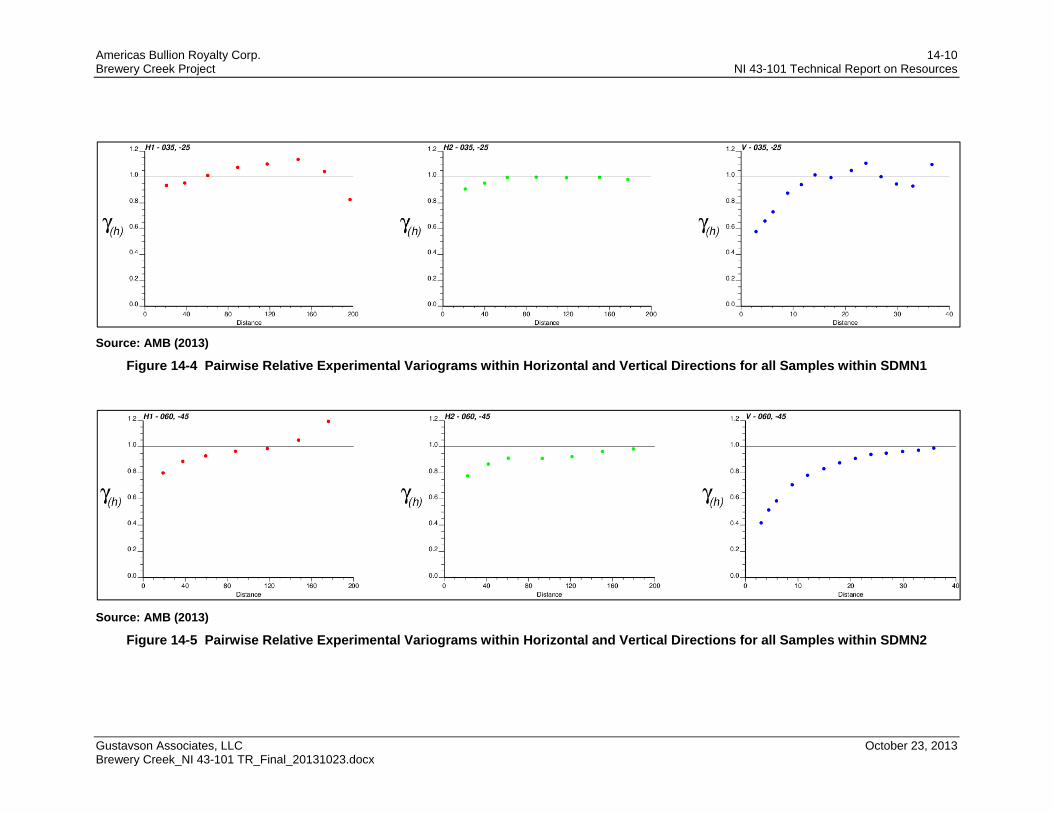
Americas Bullion Royalty Corp. 14-10 Brewery Creek Project NI 43-101 Technical Report on Resources
Gustavson Associates, LLC October 23, 2013 Brewery Creek_NI 43-101 TR_Final_20131023.docx
Source: AMB (2013)
Figure 14-4 Pairwise Relative Experimental Variograms within Horizontal and Vertical Directions for all Samples within SDMN1
Source: AMB (2013)
Figure 14-5 Pairwise Relative Experimental Variograms within Horizontal and Vertical Directions for all Samples within SDMN2
Americas Bullion Royalty Corp. 14-11 Brewery Creek Project NI 43-101 Technical Report on Resources
Gustavson Associates, LLC October 23, 2013 Brewery Creek_NI 43-101 TR_Final_20131023.docx
14.1.8 Estimation
Within each area, blocks were estimated using only composites from the same lithologic and structural domains (KOGD and PABL only). For example, a block in structural domain 1 with a majority lithology of sedimentary will be estimated using only composites back-marked as structural domain 1 from the 3D structural model and marked as in the sediment lithology domain from the 3D lithology model. Essentially lithologic domains are hard boundaries for grade estimation. The resource was estimated in 3 passes for all blocks. A three-pass interpolation was utilized to estimate Au via an Inverse Distance method (ID) within each structural domain. Each pass searches progressively less distance; the liberal first pass fills the model with widely spaced data, much of which will contribute to the inferred category. The second pass tightly constrains the interpolation and forms the basis for much of the indicated category. The third pass constrains the interpolation to within a block or two of the composite data and assures that the blocks closest to the drillholes accurately portray the composite values. The estimation parameters are listed in Table 14-5 and Table 14-6.
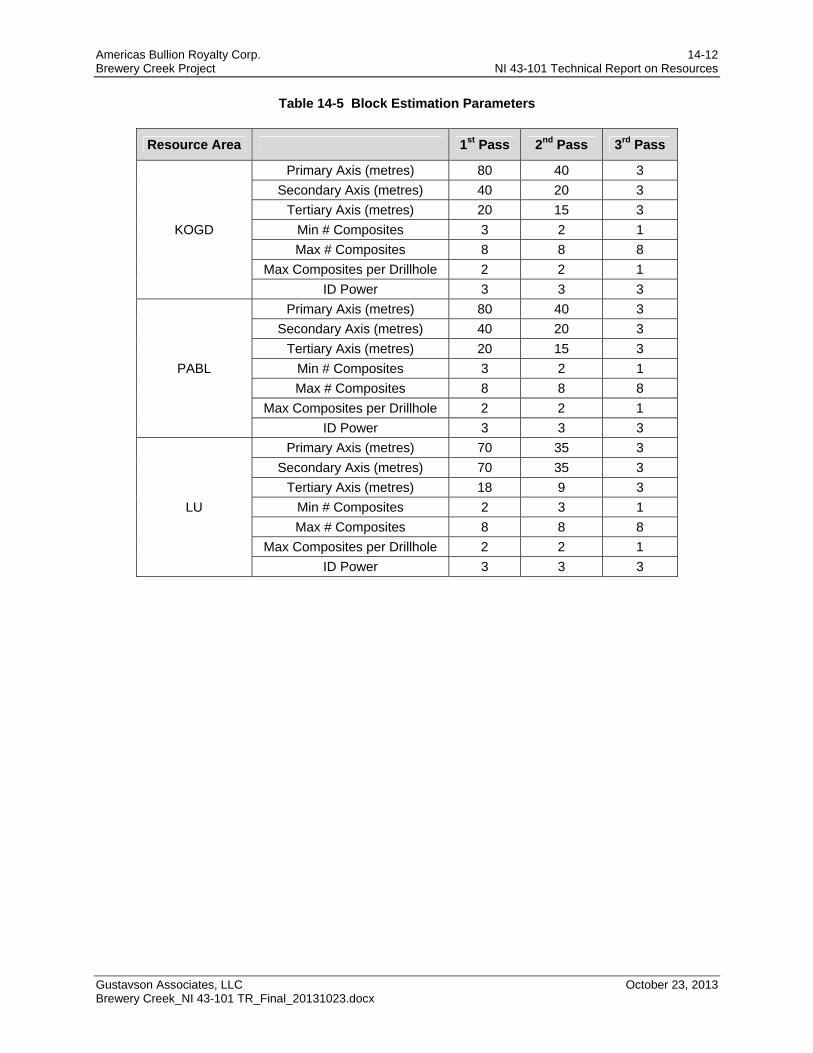
Americas Bullion Royalty Corp. 14-12 Brewery Creek Project NI 43-101 Technical Report on Resources
Gustavson Associates, LLC October 23, 2013 Brewery Creek_NI 43-101 TR_Final_20131023.docx
Table 14-5 Block Estimation Parameters
Resource Area 1st Pass 2nd Pass 3rd Pass
KOGD
Primary Axis (metres) 80 40 3
Secondary Axis (metres) 40 20 3
Tertiary Axis (metres) 20 15 3
Min # Composites 3 2 1
Max # Composites 8 8 8
Max Composites per Drillhole 2 2 1
ID Power 3 3 3
PABL
Primary Axis (metres) 80 40 3
Secondary Axis (metres) 40 20 3
Tertiary Axis (metres) 20 15 3
Min # Composites 3 2 1
Max # Composites 8 8 8
Max Composites per Drillhole 2 2 1
ID Power 3 3 3
LU
Primary Axis (metres) 70 35 3
Secondary Axis (metres) 70 35 3
Tertiary Axis (metres) 18 9 3
Min # Composites 2 3 1
Max # Composites 8 8 8
Max Composites per Drillhole 2 2 1
ID Power 3 3 3
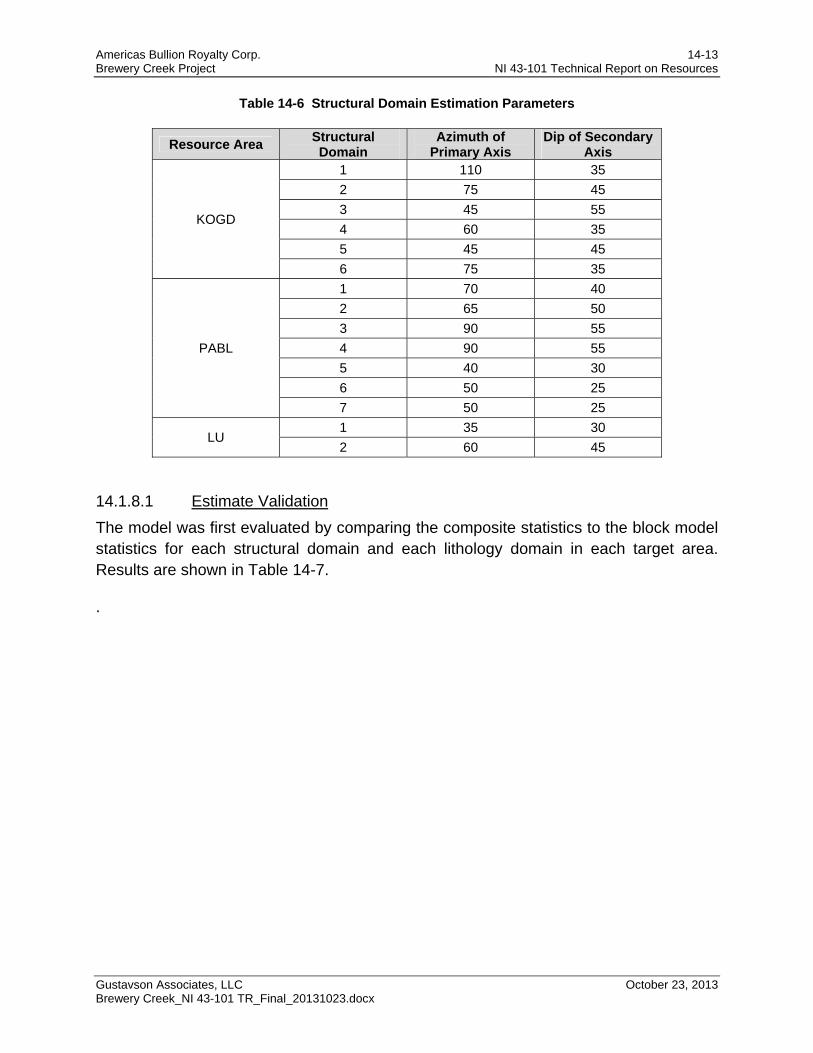
Americas Bullion Royalty Corp. 14-13 Brewery Creek Project NI 43-101 Technical Report on Resources
Gustavson Associates, LLC October 23, 2013 Brewery Creek_NI 43-101 TR_Final_20131023.docx
Table 14-6 Structural Domain Estimation Parameters
Resource Area Structural Domain
Azimuth of Primary Axis
Dip of Secondary Axis
KOGD
1 110 35
2 75 45
3 45 55
4 60 35
5 45 45
6 75 35
PABL
1 70 40
2 65 50
3 90 55
4 90 55
5 40 30
6 50 25
7 50 25
LU 1 35 30
2 60 45
14.1.8.1 Estimate Validation
The model was first evaluated by comparing the composite statistics to the block model statistics for each structural domain and each lithology domain in each target area. Results are shown in Table 14-7.
.
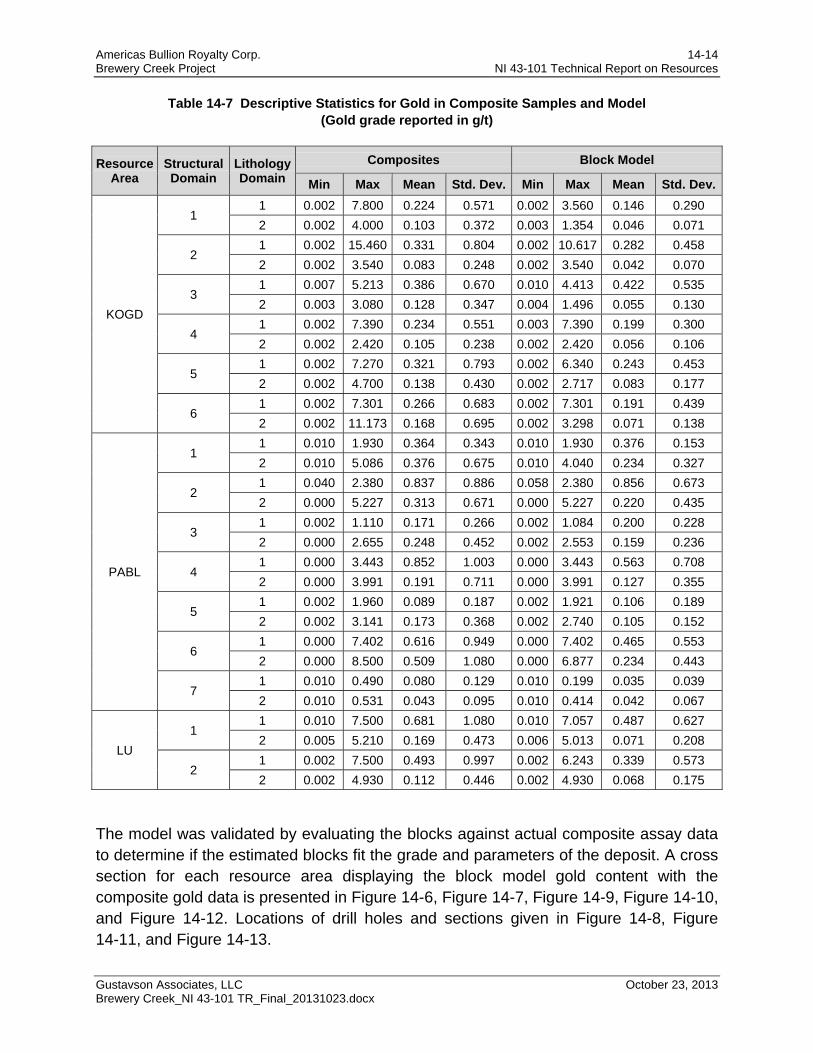
Americas Bullion Royalty Corp. 14-14 Brewery Creek Project NI 43-101 Technical Report on Resources
Gustavson Associates, LLC October 23, 2013 Brewery Creek_NI 43-101 TR_Final_20131023.docx
Table 14-7 Descriptive Statistics for Gold in Composite Samples and Model (Gold grade reported in g/t)
Resource Area
Structural Domain
Lithology Domain
Composites Block Model
Min Max Mean Std. Dev. Min Max Mean Std. Dev.
KOGD
1 1 0.002 7.800 0.224 0.571 0.002 3.560 0.146 0.290
2 0.002 4.000 0.103 0.372 0.003 1.354 0.046 0.071
2 1 0.002 15.460 0.331 0.804 0.002 10.617 0.282 0.458
2 0.002 3.540 0.083 0.248 0.002 3.540 0.042 0.070
3 1 0.007 5.213 0.386 0.670 0.010 4.413 0.422 0.535
2 0.003 3.080 0.128 0.347 0.004 1.496 0.055 0.130
4 1 0.002 7.390 0.234 0.551 0.003 7.390 0.199 0.300
2 0.002 2.420 0.105 0.238 0.002 2.420 0.056 0.106
5 1 0.002 7.270 0.321 0.793 0.002 6.340 0.243 0.453
2 0.002 4.700 0.138 0.430 0.002 2.717 0.083 0.177
6 1 0.002 7.301 0.266 0.683 0.002 7.301 0.191 0.439
2 0.002 11.173 0.168 0.695 0.002 3.298 0.071 0.138
PABL
1 1 0.010 1.930 0.364 0.343 0.010 1.930 0.376 0.153
2 0.010 5.086 0.376 0.675 0.010 4.040 0.234 0.327
2 1 0.040 2.380 0.837 0.886 0.058 2.380 0.856 0.673
2 0.000 5.227 0.313 0.671 0.000 5.227 0.220 0.435
3 1 0.002 1.110 0.171 0.266 0.002 1.084 0.200 0.228
2 0.000 2.655 0.248 0.452 0.002 2.553 0.159 0.236
4 1 0.000 3.443 0.852 1.003 0.000 3.443 0.563 0.708
2 0.000 3.991 0.191 0.711 0.000 3.991 0.127 0.355
5 1 0.002 1.960 0.089 0.187 0.002 1.921 0.106 0.189
2 0.002 3.141 0.173 0.368 0.002 2.740 0.105 0.152
6 1 0.000 7.402 0.616 0.949 0.000 7.402 0.465 0.553
2 0.000 8.500 0.509 1.080 0.000 6.877 0.234 0.443
7 1 0.010 0.490 0.080 0.129 0.010 0.199 0.035 0.039
2 0.010 0.531 0.043 0.095 0.010 0.414 0.042 0.067
LU
1 1 0.010 7.500 0.681 1.080 0.010 7.057 0.487 0.627
2 0.005 5.210 0.169 0.473 0.006 5.013 0.071 0.208
2 1 0.002 7.500 0.493 0.997 0.002 6.243 0.339 0.573
2 0.002 4.930 0.112 0.446 0.002 4.930 0.068 0.175
The model was validated by evaluating the blocks against actual composite assay data to determine if the estimated blocks fit the grade and parameters of the deposit. A cross section for each resource area displaying the block model gold content with the composite gold data is presented in Figure 14-6, Figure 14-7, Figure 14-9, Figure 14-10, and Figure 14-12. Locations of drill holes and sections given in Figure 14-8, Figure 14-11, and Figure 14-13.
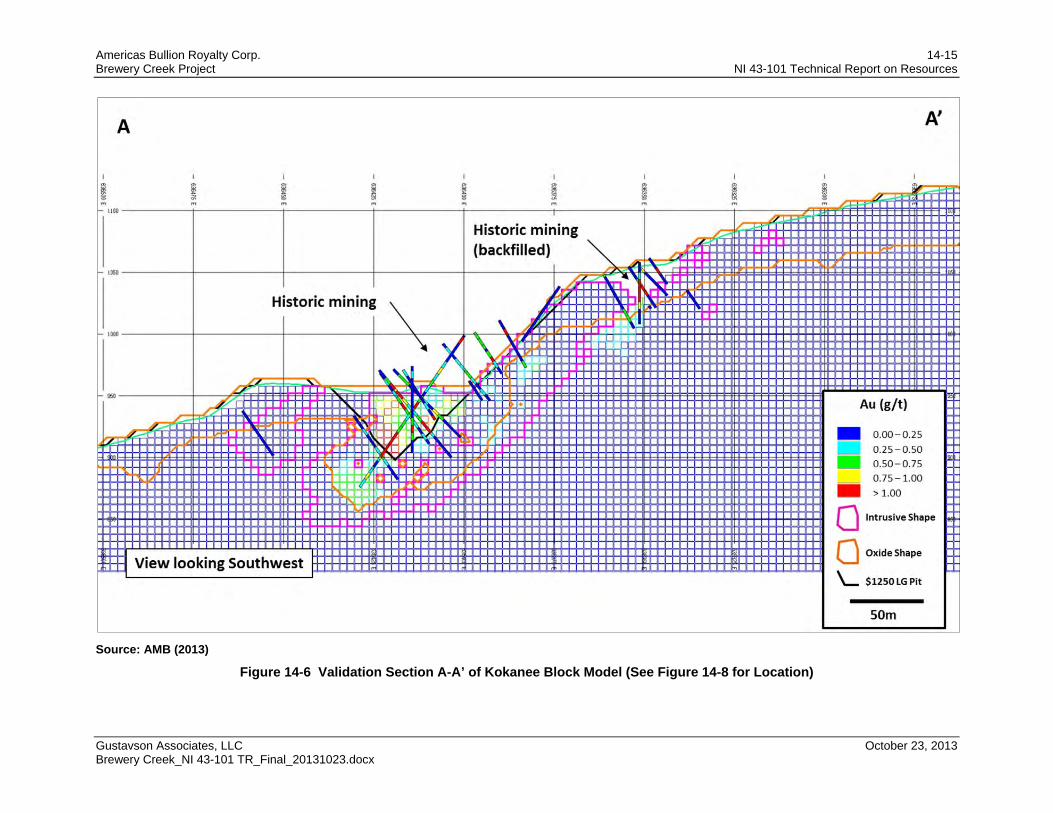
Americas Bullion Royalty Corp. 14-15 Brewery Creek Project NI 43-101 Technical Report on Resources
Gustavson Associates, LLC October 23, 2013 Brewery Creek_NI 43-101 TR_Final_20131023.docx
Source: AMB (2013)
Figure 14-6 Validation Section A-A’ of Kokanee Block Model (See Figure 14-8 for Location)
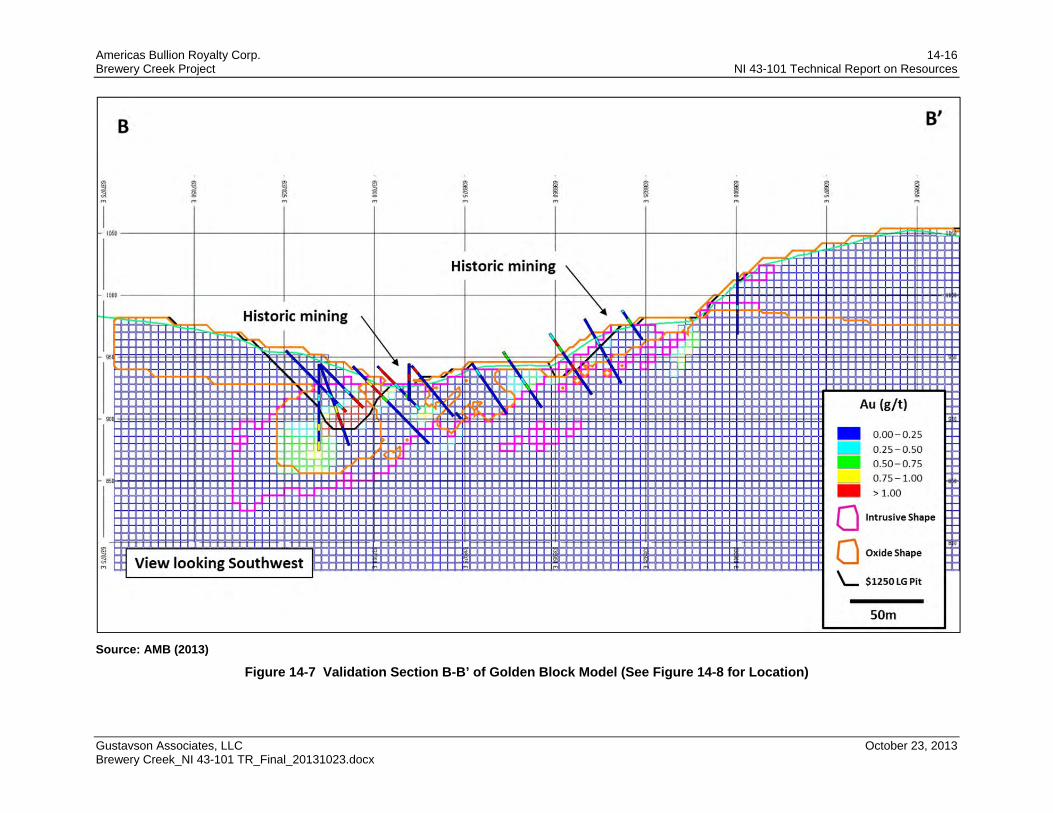
Americas Bullion Royalty Corp. 14-16 Brewery Creek Project NI 43-101 Technical Report on Resources
Gustavson Associates, LLC October 23, 2013 Brewery Creek_NI 43-101 TR_Final_20131023.docx
Source: AMB (2013)
Figure 14-7 Validation Section B-B’ of Golden Block Model (See Figure 14-8 for Location)
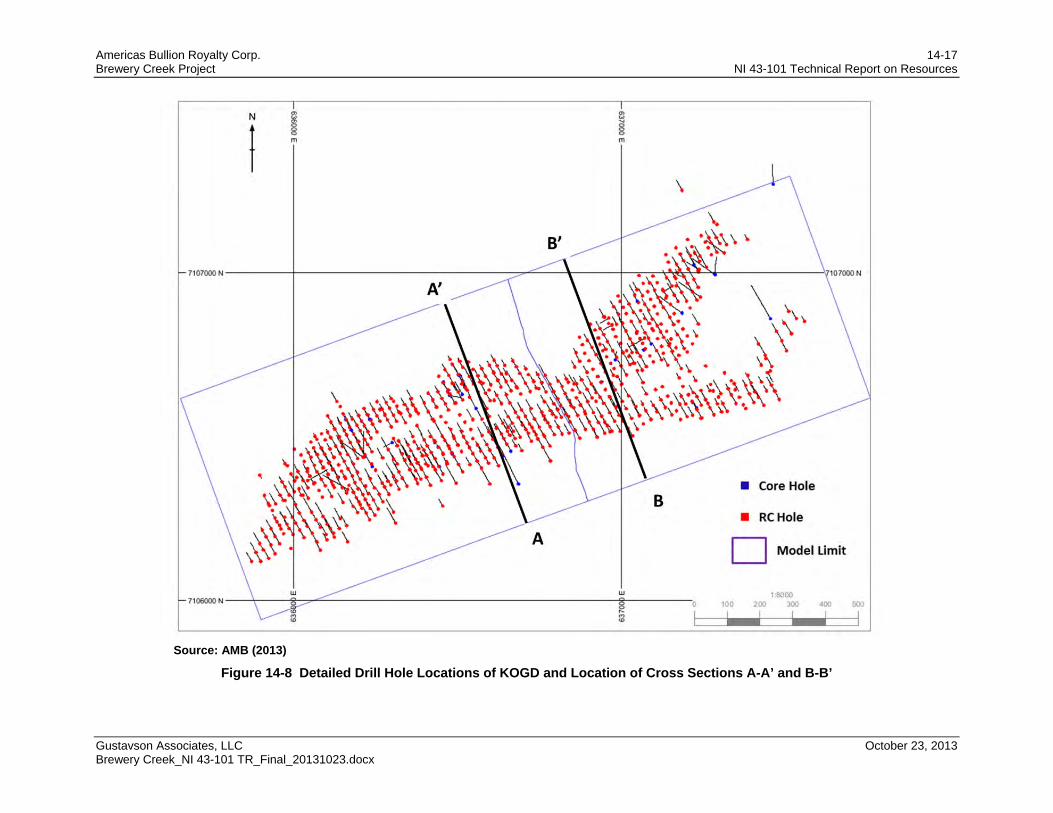
Americas Bullion Royalty Corp. 14-17 Brewery Creek Project NI 43-101 Technical Report on Resources
Gustavson Associates, LLC October 23, 2013 Brewery Creek_NI 43-101 TR_Final_20131023.docx
Source: AMB (2013)
Figure 14-8 Detailed Drill Hole Locations of KOGD and Location of Cross Sections A-A’ and B-B’
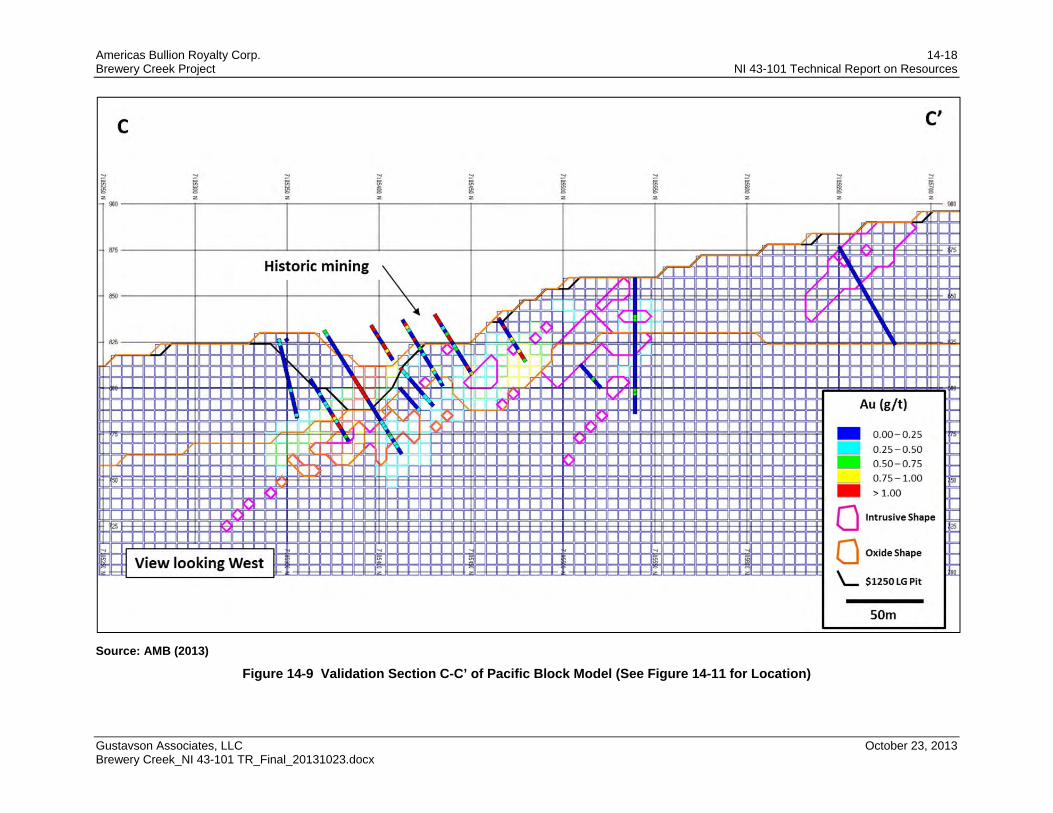
Americas Bullion Royalty Corp. 14-18 Brewery Creek Project NI 43-101 Technical Report on Resources
Gustavson Associates, LLC October 23, 2013 Brewery Creek_NI 43-101 TR_Final_20131023.docx
Source: AMB (2013)
Figure 14-9 Validation Section C-C’ of Pacific Block Model (See Figure 14-11 for Location)
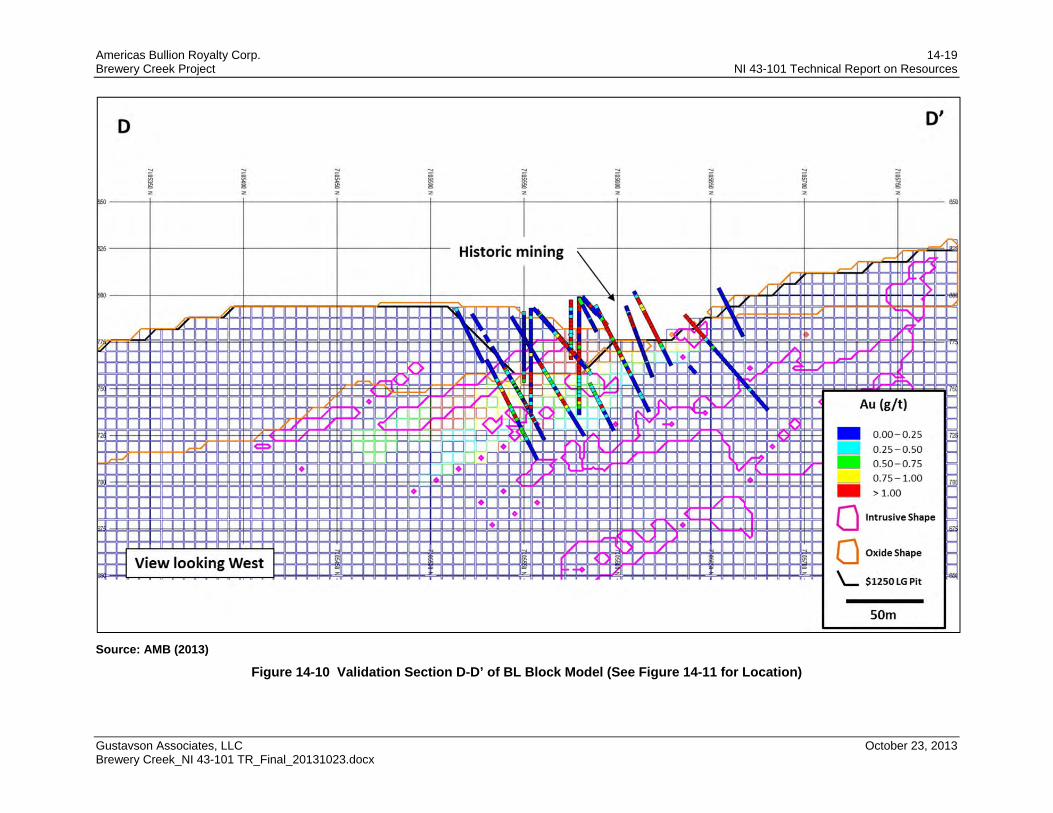
Americas Bullion Royalty Corp. 14-19 Brewery Creek Project NI 43-101 Technical Report on Resources
Gustavson Associates, LLC October 23, 2013 Brewery Creek_NI 43-101 TR_Final_20131023.docx
Source: AMB (2013)
Figure 14-10 Validation Section D-D’ of BL Block Model (See Figure 14-11 for Location)

Americas Bullion Royalty Corp. 14-20 Brewery Creek Project NI 43-101 Technical Report on Resources
Gustavson Associates, LLC October 23, 2013 Brewery Creek_NI 43-101 TR_Final_20131023.docx
Source: AMB (2013)
Figure 14-11 Detailed Drill Hole Locations of PABL and Location of Cross Sections C-C’ and D-D’
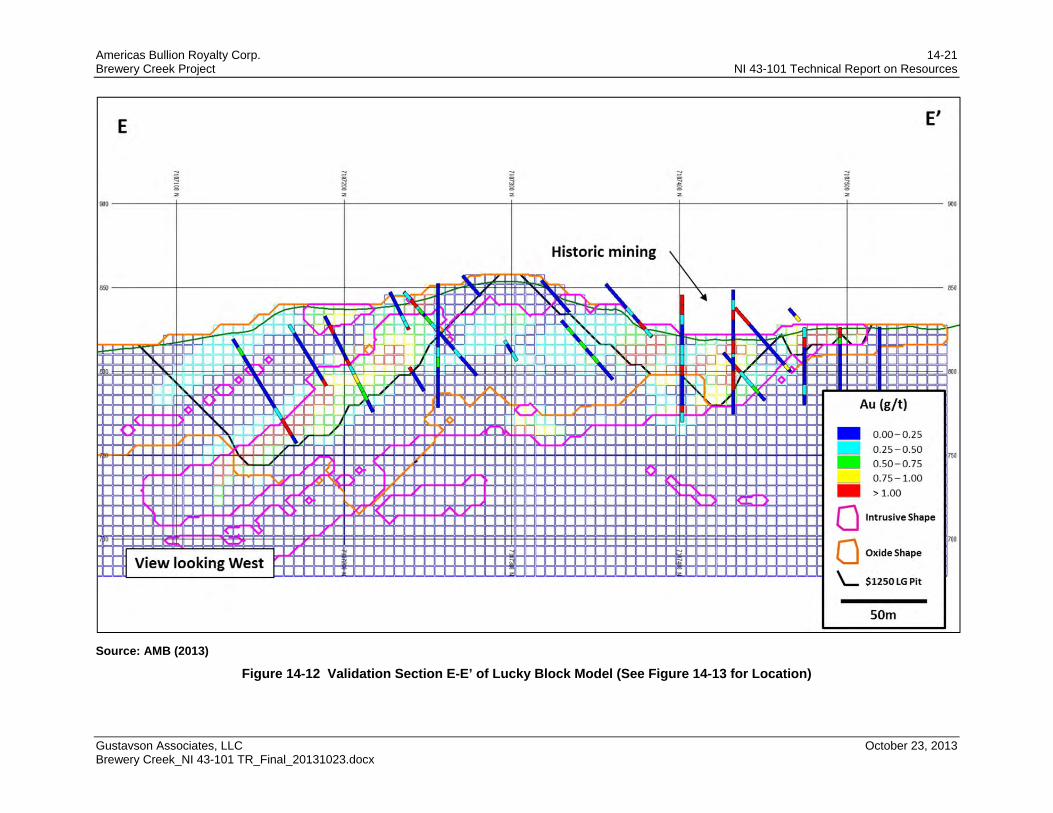
Americas Bullion Royalty Corp. 14-21 Brewery Creek Project NI 43-101 Technical Report on Resources
Gustavson Associates, LLC October 23, 2013 Brewery Creek_NI 43-101 TR_Final_20131023.docx
Source: AMB (2013)
Figure 14-12 Validation Section E-E’ of Lucky Block Model (See Figure 14-13 for Location)
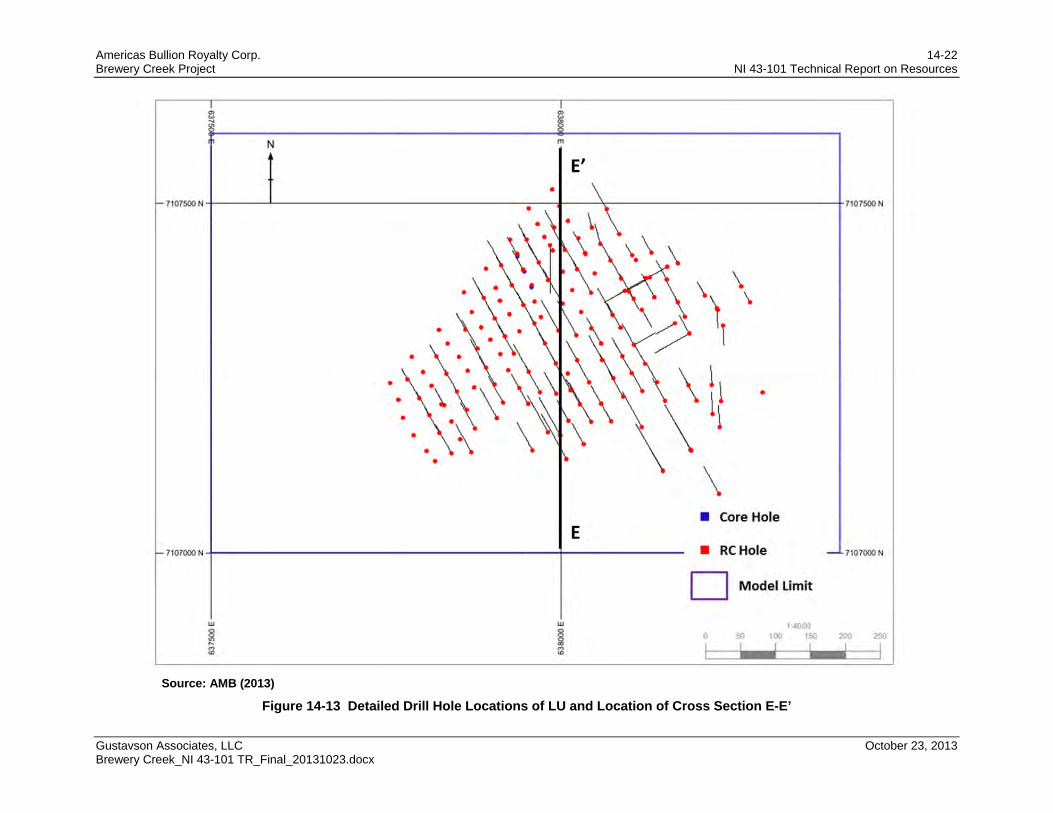
Americas Bullion Royalty Corp. 14-22 Brewery Creek Project NI 43-101 Technical Report on Resources
Gustavson Associates, LLC October 23, 2013 Brewery Creek_NI 43-101 TR_Final_20131023.docx
Source: AMB (2013)
Figure 14-13 Detailed Drill Hole Locations of LU and Location of Cross Section E-E’
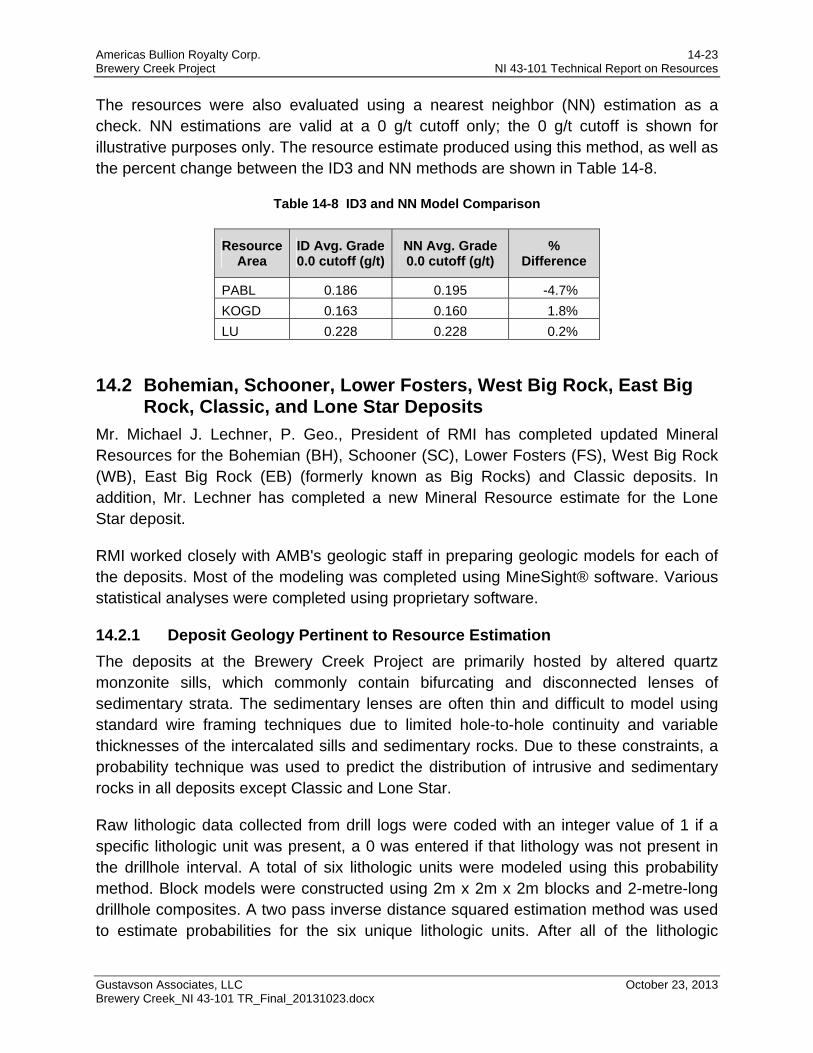
Americas Bullion Royalty Corp. 14-23 Brewery Creek Project NI 43-101 Technical Report on Resources
Gustavson Associates, LLC October 23, 2013 Brewery Creek_NI 43-101 TR_Final_20131023.docx
The resources were also evaluated using a nearest neighbor (NN) estimation as a check. NN estimations are valid at a 0 g/t cutoff only; the 0 g/t cutoff is shown for illustrative purposes only. The resource estimate produced using this method, as well as the percent change between the ID3 and NN methods are shown in Table 14-8.
Table 14-8 ID3 and NN Model Comparison
Resource Area
ID Avg. Grade 0.0 cutoff (g/t)
NN Avg. Grade 0.0 cutoff (g/t)
% Difference
PABL 0.186 0.195 -4.7%
KOGD 0.163 0.160 1.8%
LU 0.228 0.228 0.2%
14.2 Bohemian, Schooner, Lower Fosters, West Big Rock, East Big Rock, Classic, and Lone Star Deposits
Mr. Michael J. Lechner, P. Geo., President of RMI has completed updated Mineral Resources for the Bohemian (BH), Schooner (SC), Lower Fosters (FS), West Big Rock (WB), East Big Rock (EB) (formerly known as Big Rocks) and Classic deposits. In addition, Mr. Lechner has completed a new Mineral Resource estimate for the Lone Star deposit.
RMI worked closely with AMB's geologic staff in preparing geologic models for each of the deposits. Most of the modeling was completed using MineSight® software. Various statistical analyses were completed using proprietary software.
14.2.1 Deposit Geology Pertinent to Resource Estimation
The deposits at the Brewery Creek Project are primarily hosted by altered quartz monzonite sills, which commonly contain bifurcating and disconnected lenses of sedimentary strata. The sedimentary lenses are often thin and difficult to model using standard wire framing techniques due to limited hole-to-hole continuity and variable thicknesses of the intercalated sills and sedimentary rocks. Due to these constraints, a probability technique was used to predict the distribution of intrusive and sedimentary rocks in all deposits except Classic and Lone Star.
Raw lithologic data collected from drill logs were coded with an integer value of 1 if a specific lithologic unit was present, a 0 was entered if that lithology was not present in the drillhole interval. A total of six lithologic units were modeled using this probability method. Block models were constructed using 2m x 2m x 2m blocks and 2-metre-long drillhole composites. A two pass inverse distance squared estimation method was used to estimate probabilities for the six unique lithologic units. After all of the lithologic
Americas Bullion Royalty Corp. 14-24 Brewery Creek Project NI 43-101 Technical Report on Resources
Gustavson Associates, LLC October 23, 2013 Brewery Creek_NI 43-101 TR_Final_20131023.docx
indicators were estimated the blocks were assigned intrusive (1) and sediment (2) codes based on the highest of the six possible lithologic probabilities that were estimated. The 2-metre model blocks provided a high degree of resolution and resulted in excellent continuity for the distribution of thin sedimentary intervals. Three dimensional intrusive wireframes were constructed from the 2-metre block model. Those wireframes were used to code the 6-metre block models so that the blocks were either intrusive or sediment based on a majority rule. In addition to whole block coding, the percentage of intrusive and sediment were stored in each block. This step would allow mine planners to have an idea about possible dilution of "clean" intrusive with potentially preg robbing sedimentary rocks.
Wide-spaced drilling and complicated compositional and textural relationships in the Classic-Lone Star intrusive complex precluded the construction of a standard wire frame geological model. Probability modeling of lithology as described above was deemed to not be appropriate for the style of mineralization observed in this area, so development of a technique suited to the construction of a model was required for this intrusive suite.
A multi-variate factor analysis of ICP data from the Classic and Lone Star resource drilling resulted in three whole-rock signatures and one hydrothermal signature. This analysis, based on empirical geochemical data, was used to build a model which is thought to be more appropriate than from drillhole lithologic data alone. The factor representing a hydrothermal signature of gold, arsenic, and copper defined a broad and coherent area of mineralization. Results of the analysis were used to construct a three dimensional wireframe that was used to constrain the estimate of gold for the Classic-Lone Star deposits.
14.2.1.1 Oxidation
Previously, AMB constructed oxidation surfaces based on logged oxidation intensity. Numeric codes of 0 (no oxidation) through 4 (complete oxidation) were assigned to each interval by the AMB geologic staff. The oxide surface was based on intervals where the oxide intensity code was 3 or 4. Cyanide soluble analyses were collected for 2012 drillhole samples where the initial fire assay grade was above a 0.2 g/t cutoff. RMI conducted a study of comparing how well solubility data compared with the logged oxidation attribute. In general, high cyanide solubility results tended to correspond well with intervals that were logged with oxidation codes of 3 and 4 for intrusive rocks. However, RMI found that in many cases, reasonably high solubility (+ 70%) were associated with intervals that had been logged with oxidation codes of 1 or 2. In general, gold solubility was found to be quite low for sedimentary units. In addition to poor gold solubility the sedimentary rocks also display varying degrees of gold preg robbing. Boxplots were generated for each mineralized zone by major rock type (intrusive and sedimentary rocks) comparing cyanide solubility with logged oxidation
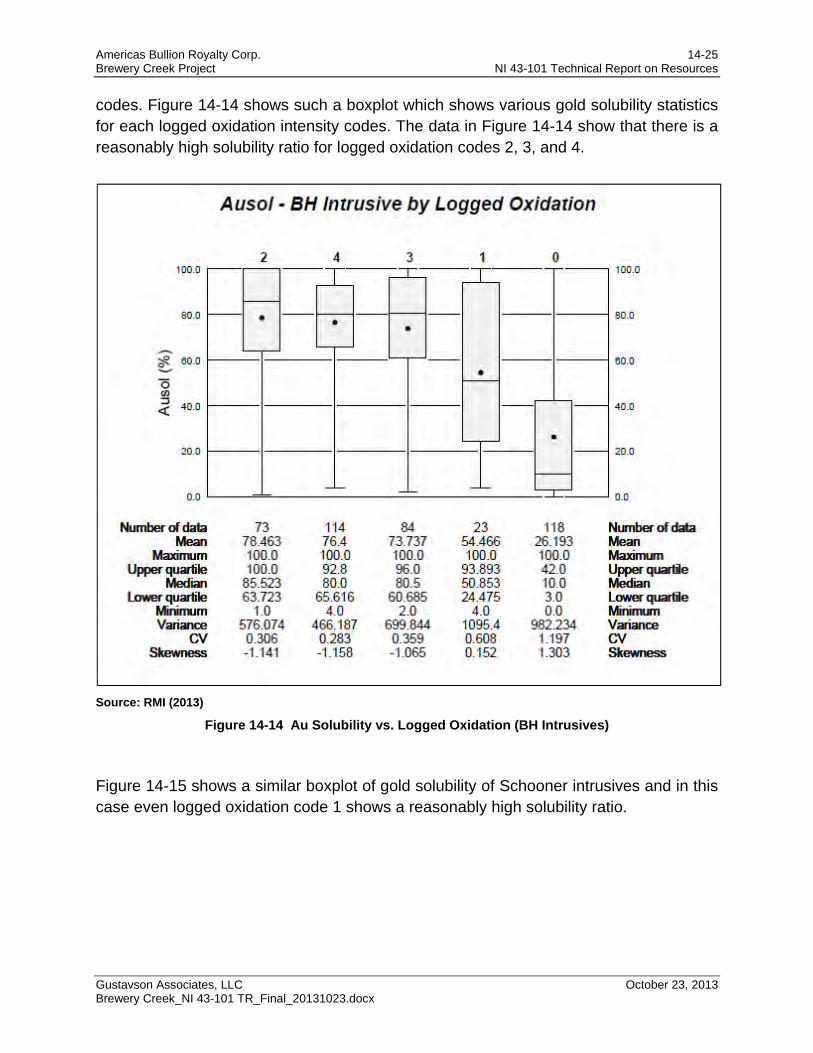
Americas Bullion Royalty Corp. 14-25 Brewery Creek Project NI 43-101 Technical Report on Resources
Gustavson Associates, LLC October 23, 2013 Brewery Creek_NI 43-101 TR_Final_20131023.docx
codes. Figure 14-14 shows such a boxplot which shows various gold solubility statistics for each logged oxidation intensity codes. The data in Figure 14-14 show that there is a reasonably high solubility ratio for logged oxidation codes 2, 3, and 4.
Source: RMI (2013)
Figure 14-14 Au Solubility vs. Logged Oxidation (BH Intrusives)
Figure 14-15 shows a similar boxplot of gold solubility of Schooner intrusives and in this case even logged oxidation code 1 shows a reasonably high solubility ratio.

Americas Bullion Royalty Corp. 14-26 Brewery Creek Project NI 43-101 Technical Report on Resources
Gustavson Associates, LLC October 23, 2013 Brewery Creek_NI 43-101 TR_Final_20131023.docx
Source: RMI (2013)
Figure 14-15 Au Solubility vs. Logged Oxidation (SC Intrusives)
Based on an analysis of solubility data a new method was used to sub-divide the various block models into two regimes: potentially leachable ("oxidized") and non-leachable ("sulfide"). An oxidation indicator probability function was implemented to help predict potentially leachable material. Indicator values of 0 (low probability of being leachable) or 1 (potentially leachable) were assigned to six-metre-long drillhole composites. The indicator value of 1 was based on the previously described boxplot analysis on a deposit by deposit basis. The 0/1 indicator values were used to estimate "oxidation" probability in each block model. Blocks with an estimated "oxidation" probability above 50% were flagged as potentially amenable to cyanidation (i.e. MODOX = 1). All other blocks were considered as "sulfide" (i.e. MODOX = 2 ). The MODOX field was then used to define oxide and sulfide resources.
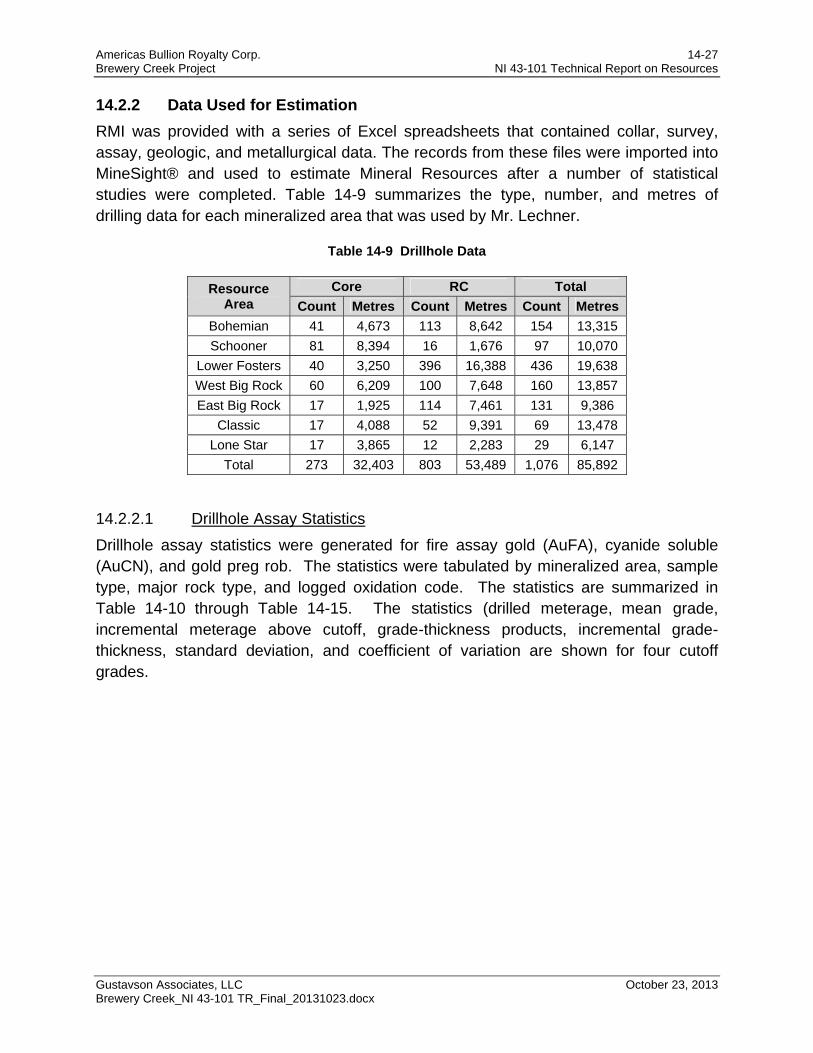
Americas Bullion Royalty Corp. 14-27 Brewery Creek Project NI 43-101 Technical Report on Resources
Gustavson Associates, LLC October 23, 2013 Brewery Creek_NI 43-101 TR_Final_20131023.docx
14.2.2 Data Used for Estimation
RMI was provided with a series of Excel spreadsheets that contained collar, survey, assay, geologic, and metallurgical data. The records from these files were imported into MineSight® and used to estimate Mineral Resources after a number of statistical studies were completed. Table 14-9 summarizes the type, number, and metres of drilling data for each mineralized area that was used by Mr. Lechner.
Table 14-9 Drillhole Data
Resource Area
Core RC Total
Count Metres Count Metres Count Metres
Bohemian 41 4,673 113 8,642 154 13,315
Schooner 81 8,394 16 1,676 97 10,070
Lower Fosters 40 3,250 396 16,388 436 19,638
West Big Rock 60 6,209 100 7,648 160 13,857
East Big Rock 17 1,925 114 7,461 131 9,386
Classic 17 4,088 52 9,391 69 13,478
Lone Star 17 3,865 12 2,283 29 6,147
Total 273 32,403 803 53,489 1,076 85,892
14.2.2.1 Drillhole Assay Statistics
Drillhole assay statistics were generated for fire assay gold (AuFA), cyanide soluble (AuCN), and gold preg rob. The statistics were tabulated by mineralized area, sample type, major rock type, and logged oxidation code. The statistics are summarized in Table 14-10 through Table 14-15. The statistics (drilled meterage, mean grade, incremental meterage above cutoff, grade-thickness products, incremental grade-thickness, standard deviation, and coefficient of variation are shown for four cutoff grades.
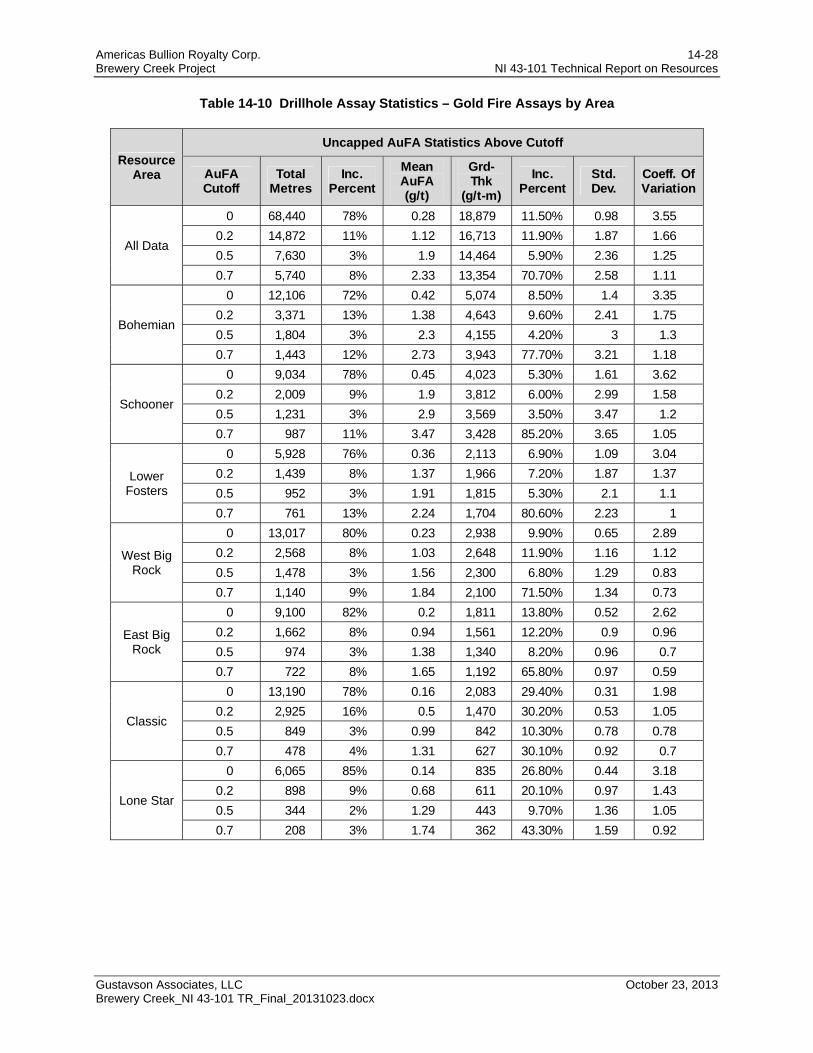
Americas Bullion Royalty Corp. 14-28 Brewery Creek Project NI 43-101 Technical Report on Resources
Gustavson Associates, LLC October 23, 2013 Brewery Creek_NI 43-101 TR_Final_20131023.docx
Table 14-10 Drillhole Assay Statistics – Gold Fire Assays by Area
Resource Area
Uncapped AuFA Statistics Above Cutoff
AuFA Cutoff
Total Metres
Inc. Percent
Mean AuFA (g/t)
Grd-Thk
(g/t-m)
Inc. Percent
Std. Dev.
Coeff. Of Variation
All Data
0 68,440 78% 0.28 18,879 11.50% 0.98 3.55
0.2 14,872 11% 1.12 16,713 11.90% 1.87 1.66
0.5 7,630 3% 1.9 14,464 5.90% 2.36 1.25
0.7 5,740 8% 2.33 13,354 70.70% 2.58 1.11
Bohemian
0 12,106 72% 0.42 5,074 8.50% 1.4 3.35
0.2 3,371 13% 1.38 4,643 9.60% 2.41 1.75
0.5 1,804 3% 2.3 4,155 4.20% 3 1.3
0.7 1,443 12% 2.73 3,943 77.70% 3.21 1.18
Schooner
0 9,034 78% 0.45 4,023 5.30% 1.61 3.62
0.2 2,009 9% 1.9 3,812 6.00% 2.99 1.58
0.5 1,231 3% 2.9 3,569 3.50% 3.47 1.2
0.7 987 11% 3.47 3,428 85.20% 3.65 1.05
Lower Fosters
0 5,928 76% 0.36 2,113 6.90% 1.09 3.04
0.2 1,439 8% 1.37 1,966 7.20% 1.87 1.37
0.5 952 3% 1.91 1,815 5.30% 2.1 1.1
0.7 761 13% 2.24 1,704 80.60% 2.23 1
West Big Rock
0 13,017 80% 0.23 2,938 9.90% 0.65 2.89
0.2 2,568 8% 1.03 2,648 11.90% 1.16 1.12
0.5 1,478 3% 1.56 2,300 6.80% 1.29 0.83
0.7 1,140 9% 1.84 2,100 71.50% 1.34 0.73
East Big Rock
0 9,100 82% 0.2 1,811 13.80% 0.52 2.62
0.2 1,662 8% 0.94 1,561 12.20% 0.9 0.96
0.5 974 3% 1.38 1,340 8.20% 0.96 0.7
0.7 722 8% 1.65 1,192 65.80% 0.97 0.59
Classic
0 13,190 78% 0.16 2,083 29.40% 0.31 1.98
0.2 2,925 16% 0.5 1,470 30.20% 0.53 1.05
0.5 849 3% 0.99 842 10.30% 0.78 0.78
0.7 478 4% 1.31 627 30.10% 0.92 0.7
Lone Star
0 6,065 85% 0.14 835 26.80% 0.44 3.18
0.2 898 9% 0.68 611 20.10% 0.97 1.43
0.5 344 2% 1.29 443 9.70% 1.36 1.05
0.7 208 3% 1.74 362 43.30% 1.59 0.92
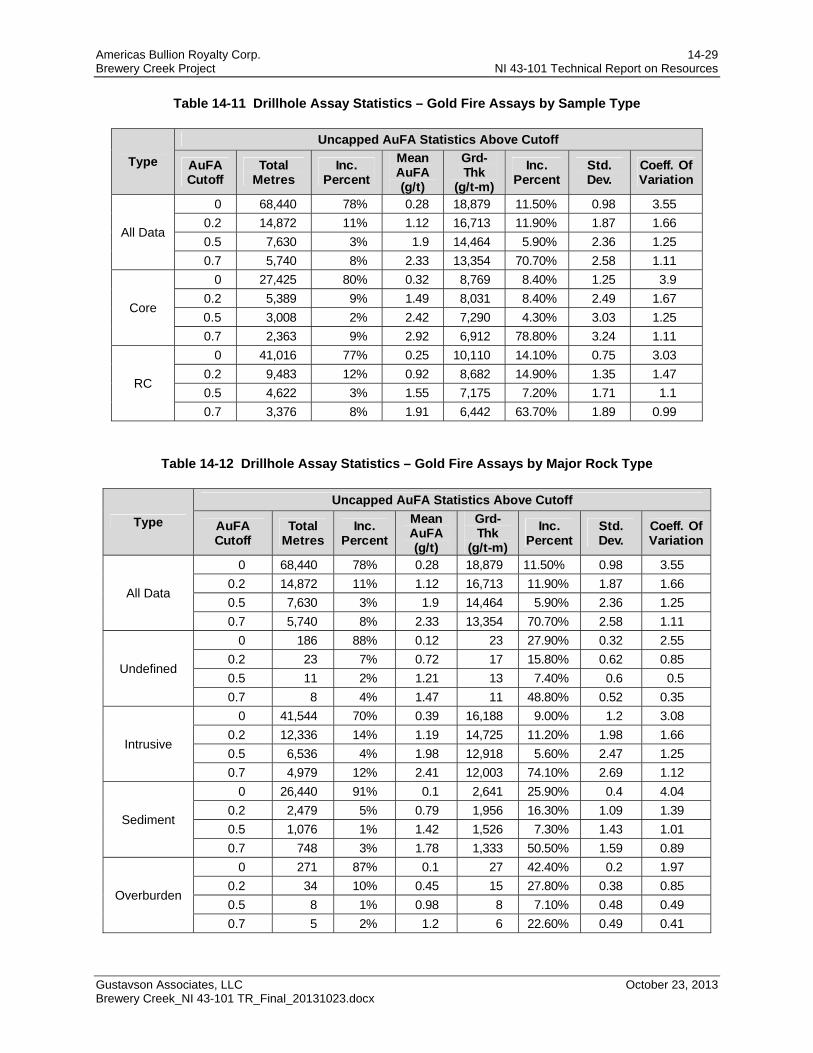
Americas Bullion Royalty Corp. 14-29 Brewery Creek Project NI 43-101 Technical Report on Resources
Gustavson Associates, LLC October 23, 2013 Brewery Creek_NI 43-101 TR_Final_20131023.docx
Table 14-11 Drillhole Assay Statistics – Gold Fire Assays by Sample Type
Type
Uncapped AuFA Statistics Above Cutoff
AuFA Cutoff
Total Metres
Inc. Percent
Mean AuFA (g/t)
Grd-Thk
(g/t-m)
Inc. Percent
Std. Dev.
Coeff. Of Variation
All Data
0 68,440 78% 0.28 18,879 11.50% 0.98 3.55
0.2 14,872 11% 1.12 16,713 11.90% 1.87 1.66
0.5 7,630 3% 1.9 14,464 5.90% 2.36 1.25
0.7 5,740 8% 2.33 13,354 70.70% 2.58 1.11
Core
0 27,425 80% 0.32 8,769 8.40% 1.25 3.9
0.2 5,389 9% 1.49 8,031 8.40% 2.49 1.67
0.5 3,008 2% 2.42 7,290 4.30% 3.03 1.25
0.7 2,363 9% 2.92 6,912 78.80% 3.24 1.11
RC
0 41,016 77% 0.25 10,110 14.10% 0.75 3.03
0.2 9,483 12% 0.92 8,682 14.90% 1.35 1.47
0.5 4,622 3% 1.55 7,175 7.20% 1.71 1.1
0.7 3,376 8% 1.91 6,442 63.70% 1.89 0.99
Table 14-12 Drillhole Assay Statistics – Gold Fire Assays by Major Rock Type
Type
Uncapped AuFA Statistics Above Cutoff
AuFA Cutoff
Total Metres
Inc. Percent
Mean AuFA (g/t)
Grd-Thk
(g/t-m)
Inc. Percent
Std. Dev.
Coeff. Of Variation
All Data
0 68,440 78% 0.28 18,879 11.50% 0.98 3.55
0.2 14,872 11% 1.12 16,713 11.90% 1.87 1.66
0.5 7,630 3% 1.9 14,464 5.90% 2.36 1.25
0.7 5,740 8% 2.33 13,354 70.70% 2.58 1.11
Undefined
0 186 88% 0.12 23 27.90% 0.32 2.55
0.2 23 7% 0.72 17 15.80% 0.62 0.85
0.5 11 2% 1.21 13 7.40% 0.6 0.5
0.7 8 4% 1.47 11 48.80% 0.52 0.35
Intrusive
0 41,544 70% 0.39 16,188 9.00% 1.2 3.08
0.2 12,336 14% 1.19 14,725 11.20% 1.98 1.66
0.5 6,536 4% 1.98 12,918 5.60% 2.47 1.25
0.7 4,979 12% 2.41 12,003 74.10% 2.69 1.12
Sediment
0 26,440 91% 0.1 2,641 25.90% 0.4 4.04
0.2 2,479 5% 0.79 1,956 16.30% 1.09 1.39
0.5 1,076 1% 1.42 1,526 7.30% 1.43 1.01
0.7 748 3% 1.78 1,333 50.50% 1.59 0.89
Overburden
0 271 87% 0.1 27 42.40% 0.2 1.97
0.2 34 10% 0.45 15 27.80% 0.38 0.85
0.5 8 1% 0.98 8 7.10% 0.48 0.49
0.7 5 2% 1.2 6 22.60% 0.49 0.41

Americas Bullion Royalty Corp. 14-30 Brewery Creek Project NI 43-101 Technical Report on Resources
Gustavson Associates, LLC October 23, 2013 Brewery Creek_NI 43-101 TR_Final_20131023.docx
Table 14-13 Drillhole Assay Statistics – Gold Fire Assays by Logged Oxidation
Type
Uncapped AuFA Statistics Above Cutoff
AuFA Cutoff
Total Metres
Inc. Percent
Mean AuFA (g/t)
Grd-Thk
(g/t-m)
Inc. Percent
Std. Dev.
Coeff. Of Variation
All Data
0 68,440 78% 0.28 18,879 11.50% 0.98 3.55
0.2 14,872 11% 1.12 16,713 11.90% 1.87 1.66
0.5 7,630 3% 1.9 14,464 5.90% 2.36 1.25
0.7 5,740 8% 2.33 13,354 70.70% 2.58 1.11
Undefined
0 13,000 78% 0.24 3,123 14.50% 0.89 3.72
0.2 2,889 12% 0.92 2,670 15.60% 1.73 1.87
0.5 1,313 3% 1.66 2,183 7.10% 2.36 1.42
0.7 936 7% 2.1 1,962 62.80% 2.68 1.28
0
0 13,792 87% 0.17 2,299 16.00% 0.71 4.26
0.2 1,741 6% 1.11 1,930 11.50% 1.72 1.56
0.5 892 2% 1.87 1,666 5.70% 2.15 1.15
0.7 669 5% 2.29 1,535 66.80% 2.33 1.02
1
0 12,041 84% 0.18 2,142 17.80% 0.7 3.93
0.2 1,922 9% 0.92 1,761 16.00% 1.55 1.69
0.5 798 2% 1.78 1,418 6.20% 2.12 1.2
0.7 569 5% 2.26 1,285 60.00% 2.35 1.04
2
0 9,616 77% 0.29 2,778 11.80% 1.12 3.88
0.2 2,174 12% 1.13 2,450 12.80% 2.16 1.91
0.5 1,025 3% 2.05 2,096 5.70% 2.87 1.41
0.7 755 8% 2.57 1,937 69.70% 3.19 1.24
3
0 10,533 72% 0.35 3,651 8.30% 0.93 2.68
0.2 2,998 12% 1.12 3,349 11.00% 1.48 1.32
0.5 1,715 4% 1.72 2,949 6.50% 1.72 1
0.7 1,313 12% 2.07 2,713 74.30% 1.83 0.89
4
0 9,459 67% 0.52 4,886 6.80% 1.47 2.84
0.2 3,148 13% 1.45 4,552 8.20% 2.27 1.57
0.5 1,889 4% 2.2 4,153 4.70% 2.68 1.22
0.7 1,497 16% 2.62 3,922 80.30% 2.87 1.1
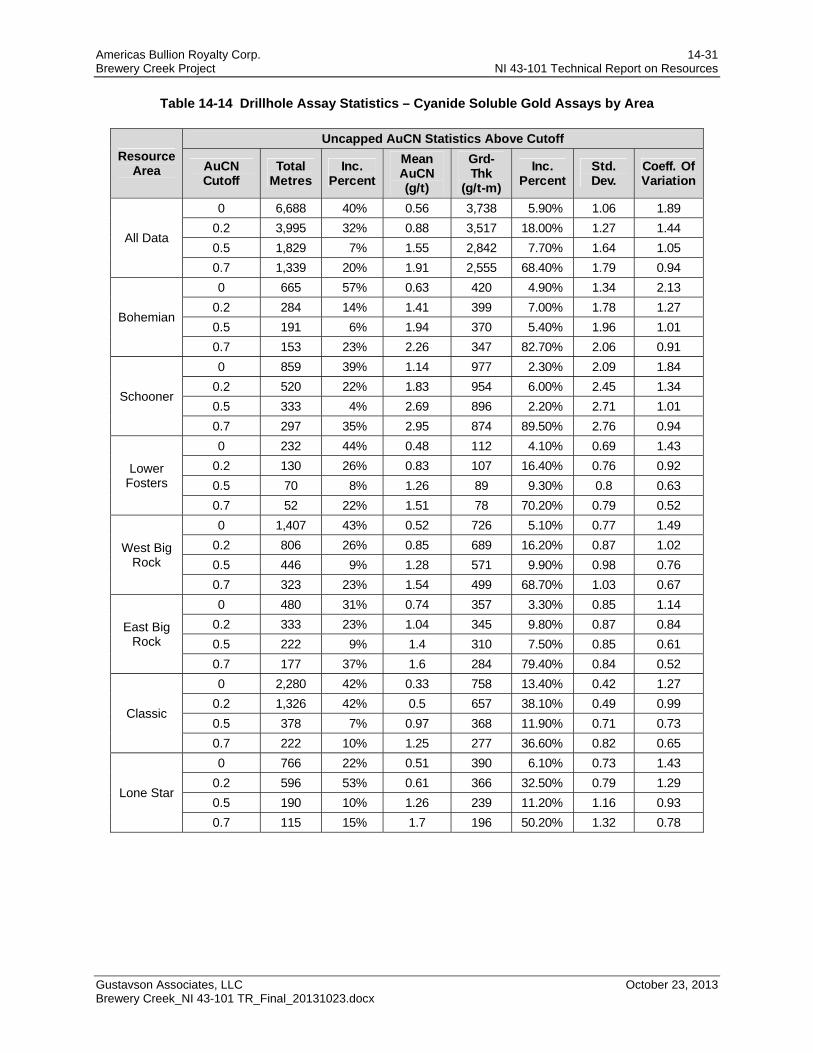
Americas Bullion Royalty Corp. 14-31 Brewery Creek Project NI 43-101 Technical Report on Resources
Gustavson Associates, LLC October 23, 2013 Brewery Creek_NI 43-101 TR_Final_20131023.docx
Table 14-14 Drillhole Assay Statistics – Cyanide Soluble Gold Assays by Area
Resource Area
Uncapped AuCN Statistics Above Cutoff
AuCN Cutoff
Total Metres
Inc. Percent
Mean AuCN (g/t)
Grd-Thk
(g/t-m)
Inc. Percent
Std. Dev.
Coeff. Of Variation
All Data
0 6,688 40% 0.56 3,738 5.90% 1.06 1.89
0.2 3,995 32% 0.88 3,517 18.00% 1.27 1.44
0.5 1,829 7% 1.55 2,842 7.70% 1.64 1.05
0.7 1,339 20% 1.91 2,555 68.40% 1.79 0.94
Bohemian
0 665 57% 0.63 420 4.90% 1.34 2.13
0.2 284 14% 1.41 399 7.00% 1.78 1.27
0.5 191 6% 1.94 370 5.40% 1.96 1.01
0.7 153 23% 2.26 347 82.70% 2.06 0.91
Schooner
0 859 39% 1.14 977 2.30% 2.09 1.84
0.2 520 22% 1.83 954 6.00% 2.45 1.34
0.5 333 4% 2.69 896 2.20% 2.71 1.01
0.7 297 35% 2.95 874 89.50% 2.76 0.94
Lower Fosters
0 232 44% 0.48 112 4.10% 0.69 1.43
0.2 130 26% 0.83 107 16.40% 0.76 0.92
0.5 70 8% 1.26 89 9.30% 0.8 0.63
0.7 52 22% 1.51 78 70.20% 0.79 0.52
West Big Rock
0 1,407 43% 0.52 726 5.10% 0.77 1.49
0.2 806 26% 0.85 689 16.20% 0.87 1.02
0.5 446 9% 1.28 571 9.90% 0.98 0.76
0.7 323 23% 1.54 499 68.70% 1.03 0.67
East Big Rock
0 480 31% 0.74 357 3.30% 0.85 1.14
0.2 333 23% 1.04 345 9.80% 0.87 0.84
0.5 222 9% 1.4 310 7.50% 0.85 0.61
0.7 177 37% 1.6 284 79.40% 0.84 0.52
Classic
0 2,280 42% 0.33 758 13.40% 0.42 1.27
0.2 1,326 42% 0.5 657 38.10% 0.49 0.99
0.5 378 7% 0.97 368 11.90% 0.71 0.73
0.7 222 10% 1.25 277 36.60% 0.82 0.65
Lone Star
0 766 22% 0.51 390 6.10% 0.73 1.43
0.2 596 53% 0.61 366 32.50% 0.79 1.29
0.5 190 10% 1.26 239 11.20% 1.16 0.93
0.7 115 15% 1.7 196 50.20% 1.32 0.78
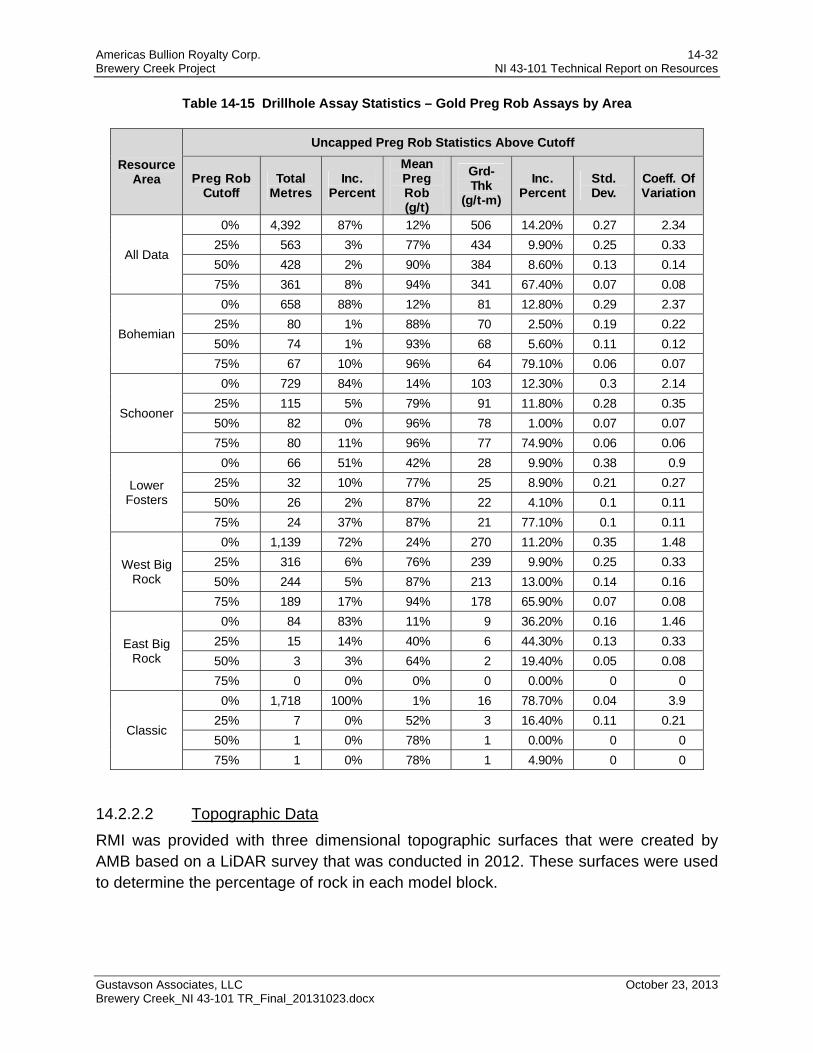
Americas Bullion Royalty Corp. 14-32 Brewery Creek Project NI 43-101 Technical Report on Resources
Gustavson Associates, LLC October 23, 2013 Brewery Creek_NI 43-101 TR_Final_20131023.docx
Table 14-15 Drillhole Assay Statistics – Gold Preg Rob Assays by Area
Resource Area
Uncapped Preg Rob Statistics Above Cutoff
Preg Rob Cutoff
Total Metres
Inc. Percent
Mean Preg Rob (g/t)
Grd-Thk
(g/t-m)
Inc. Percent
Std. Dev.
Coeff. Of Variation
All Data
0% 4,392 87% 12% 506 14.20% 0.27 2.34
25% 563 3% 77% 434 9.90% 0.25 0.33
50% 428 2% 90% 384 8.60% 0.13 0.14
75% 361 8% 94% 341 67.40% 0.07 0.08
Bohemian
0% 658 88% 12% 81 12.80% 0.29 2.37
25% 80 1% 88% 70 2.50% 0.19 0.22
50% 74 1% 93% 68 5.60% 0.11 0.12
75% 67 10% 96% 64 79.10% 0.06 0.07
Schooner
0% 729 84% 14% 103 12.30% 0.3 2.14
25% 115 5% 79% 91 11.80% 0.28 0.35
50% 82 0% 96% 78 1.00% 0.07 0.07
75% 80 11% 96% 77 74.90% 0.06 0.06
Lower Fosters
0% 66 51% 42% 28 9.90% 0.38 0.9
25% 32 10% 77% 25 8.90% 0.21 0.27
50% 26 2% 87% 22 4.10% 0.1 0.11
75% 24 37% 87% 21 77.10% 0.1 0.11
West Big Rock
0% 1,139 72% 24% 270 11.20% 0.35 1.48
25% 316 6% 76% 239 9.90% 0.25 0.33
50% 244 5% 87% 213 13.00% 0.14 0.16
75% 189 17% 94% 178 65.90% 0.07 0.08
East Big Rock
0% 84 83% 11% 9 36.20% 0.16 1.46
25% 15 14% 40% 6 44.30% 0.13 0.33
50% 3 3% 64% 2 19.40% 0.05 0.08
75% 0 0% 0% 0 0.00% 0 0
Classic
0% 1,718 100% 1% 16 78.70% 0.04 3.9
25% 7 0% 52% 3 16.40% 0.11 0.21
50% 1 0% 78% 1 0.00% 0 0
75% 1 0% 78% 1 4.90% 0 0
14.2.2.2 Topographic Data
RMI was provided with three dimensional topographic surfaces that were created by AMB based on a LiDAR survey that was conducted in 2012. These surfaces were used to determine the percentage of rock in each model block.
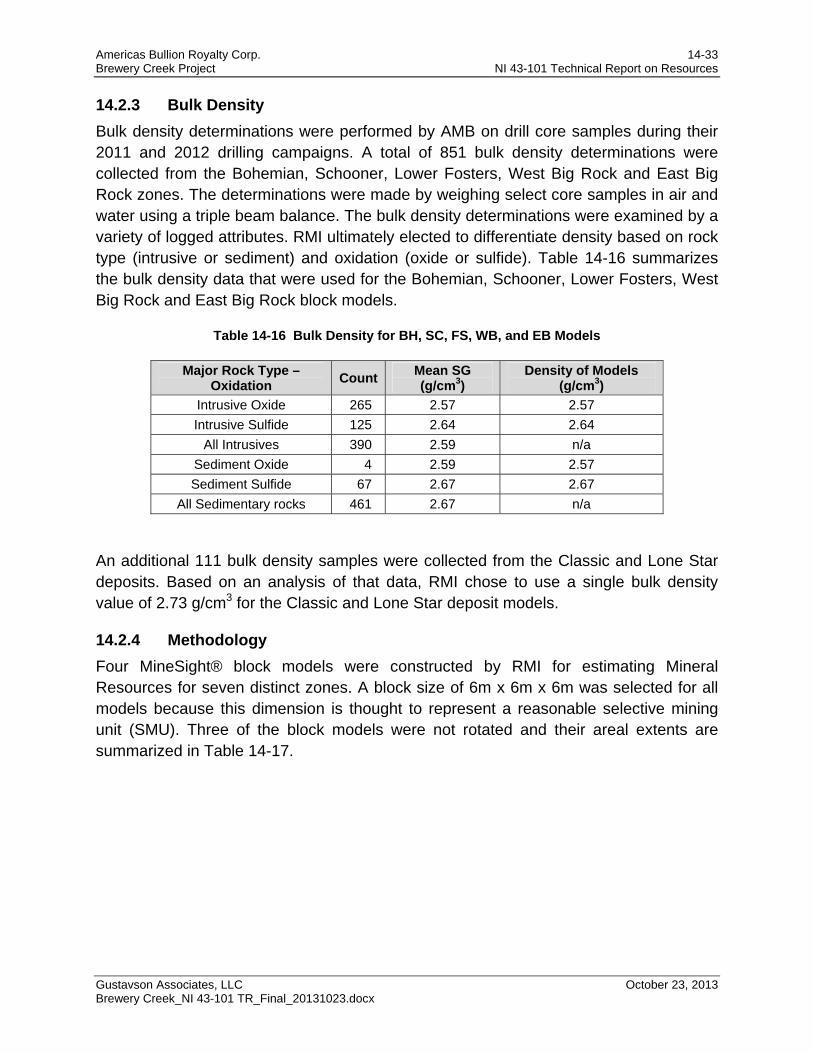
Americas Bullion Royalty Corp. 14-33 Brewery Creek Project NI 43-101 Technical Report on Resources
Gustavson Associates, LLC October 23, 2013 Brewery Creek_NI 43-101 TR_Final_20131023.docx
14.2.3 Bulk Density
Bulk density determinations were performed by AMB on drill core samples during their 2011 and 2012 drilling campaigns. A total of 851 bulk density determinations were collected from the Bohemian, Schooner, Lower Fosters, West Big Rock and East Big Rock zones. The determinations were made by weighing select core samples in air and water using a triple beam balance. The bulk density determinations were examined by a variety of logged attributes. RMI ultimately elected to differentiate density based on rock type (intrusive or sediment) and oxidation (oxide or sulfide). Table 14-16 summarizes the bulk density data that were used for the Bohemian, Schooner, Lower Fosters, West Big Rock and East Big Rock block models.
Table 14-16 Bulk Density for BH, SC, FS, WB, and EB Models
Major Rock Type – Oxidation
CountMean SG (g/cm3)
Density of Models (g/cm3)
Intrusive Oxide 265 2.57 2.57
Intrusive Sulfide 125 2.64 2.64
All Intrusives 390 2.59 n/a
Sediment Oxide 4 2.59 2.57
Sediment Sulfide 67 2.67 2.67
All Sedimentary rocks 461 2.67 n/a
An additional 111 bulk density samples were collected from the Classic and Lone Star deposits. Based on an analysis of that data, RMI chose to use a single bulk density value of 2.73 g/cm3 for the Classic and Lone Star deposit models.
14.2.4 Methodology
Four MineSight® block models were constructed by RMI for estimating Mineral Resources for seven distinct zones. A block size of 6m x 6m x 6m was selected for all models because this dimension is thought to represent a reasonable selective mining unit (SMU). Three of the block models were not rotated and their areal extents are summarized in Table 14-17.
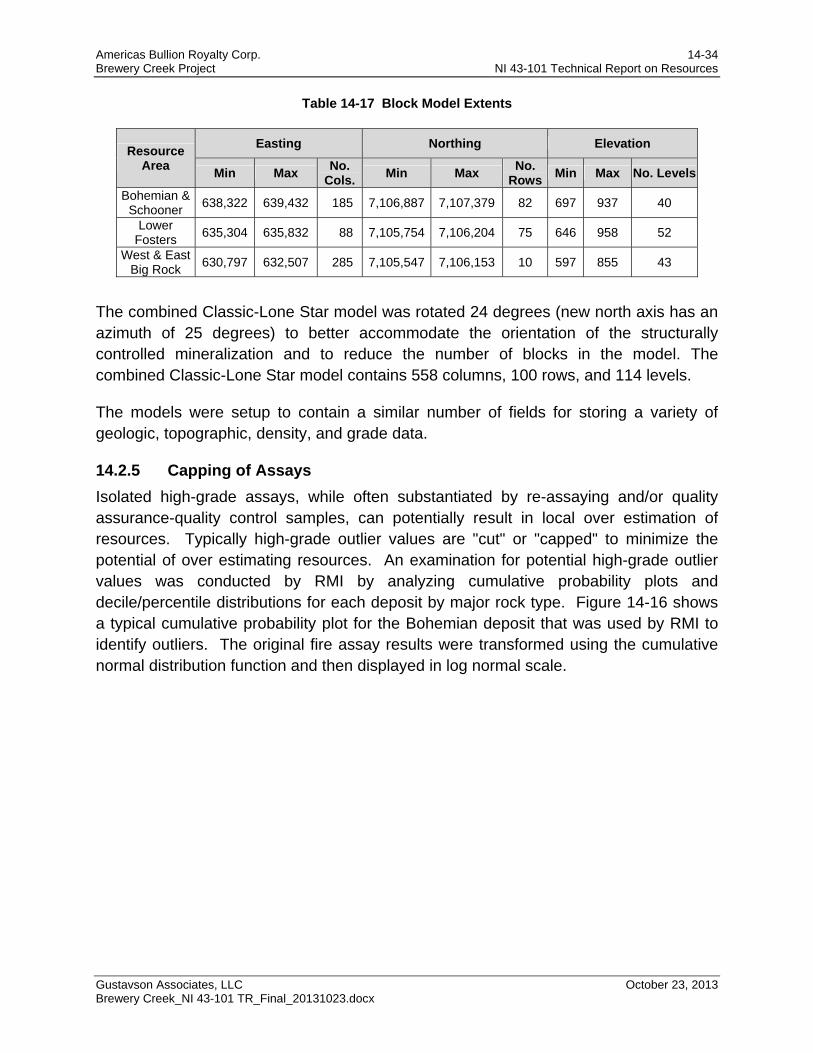
Americas Bullion Royalty Corp. 14-34 Brewery Creek Project NI 43-101 Technical Report on Resources
Gustavson Associates, LLC October 23, 2013 Brewery Creek_NI 43-101 TR_Final_20131023.docx
Table 14-17 Block Model Extents
Resource Area
Easting Northing Elevation
Min Max No.
Cols.Min Max
No. Rows
Min Max No. Levels
Bohemian & Schooner
638,322 639,432 185 7,106,887 7,107,379 82 697 937 40
Lower Fosters
635,304 635,832 88 7,105,754 7,106,204 75 646 958 52
West & East Big Rock
630,797 632,507 285 7,105,547 7,106,153 10 597 855 43
The combined Classic-Lone Star model was rotated 24 degrees (new north axis has an azimuth of 25 degrees) to better accommodate the orientation of the structurally controlled mineralization and to reduce the number of blocks in the model. The combined Classic-Lone Star model contains 558 columns, 100 rows, and 114 levels.
The models were setup to contain a similar number of fields for storing a variety of geologic, topographic, density, and grade data.
14.2.5 Capping of Assays
Isolated high-grade assays, while often substantiated by re-assaying and/or quality assurance-quality control samples, can potentially result in local over estimation of resources. Typically high-grade outlier values are "cut" or "capped" to minimize the potential of over estimating resources. An examination for potential high-grade outlier values was conducted by RMI by analyzing cumulative probability plots and decile/percentile distributions for each deposit by major rock type. Figure 14-16 shows a typical cumulative probability plot for the Bohemian deposit that was used by RMI to identify outliers. The original fire assay results were transformed using the cumulative normal distribution function and then displayed in log normal scale.

Americas Bullion Royalty Corp. 14-35 Brewery Creek Project NI 43-101 Technical Report on Resources
Gustavson Associates, LLC October 23, 2013 Brewery Creek_NI 43-101 TR_Final_20131023.docx
Source: RMI (2013)
Figure 14-16 Au Probability Plot – (Bohemian Intrusives)
Similar plots were generated for each mineralized zone for intrusive and sedimentary rocks.
Table 14-18 summarizes the grade capping limits that were used by RMI for each mineralized zone. The raw original assay intervals were capped according to the values shown in Table 14-18 prior to compositing the drillhole data.
Table 14-18 Gold Grade Capping Limits by Area
Area Au Cap Grade (g/t)
Intrusive Sediment
Bohemian 10.0 5.0
Schooner 10.0 2.5
Lower Fosters 7.5 4.5
West Big Rock 6.0 2.0
East Big Rock 4.0 2.0
Classic 5.0 0.4
Lone Star 5.0 0.3
0.001
0.010
0.100
1.000
10.000
100.000
-4.0 -3.0 -2.0 -1.0 0.0 1.0 2.0 3.0 4.0 5.0
Go
ld (g
/t)
Cumulative Normal Distribution Function
Log Normal Approximation
Bohemian Intrusives
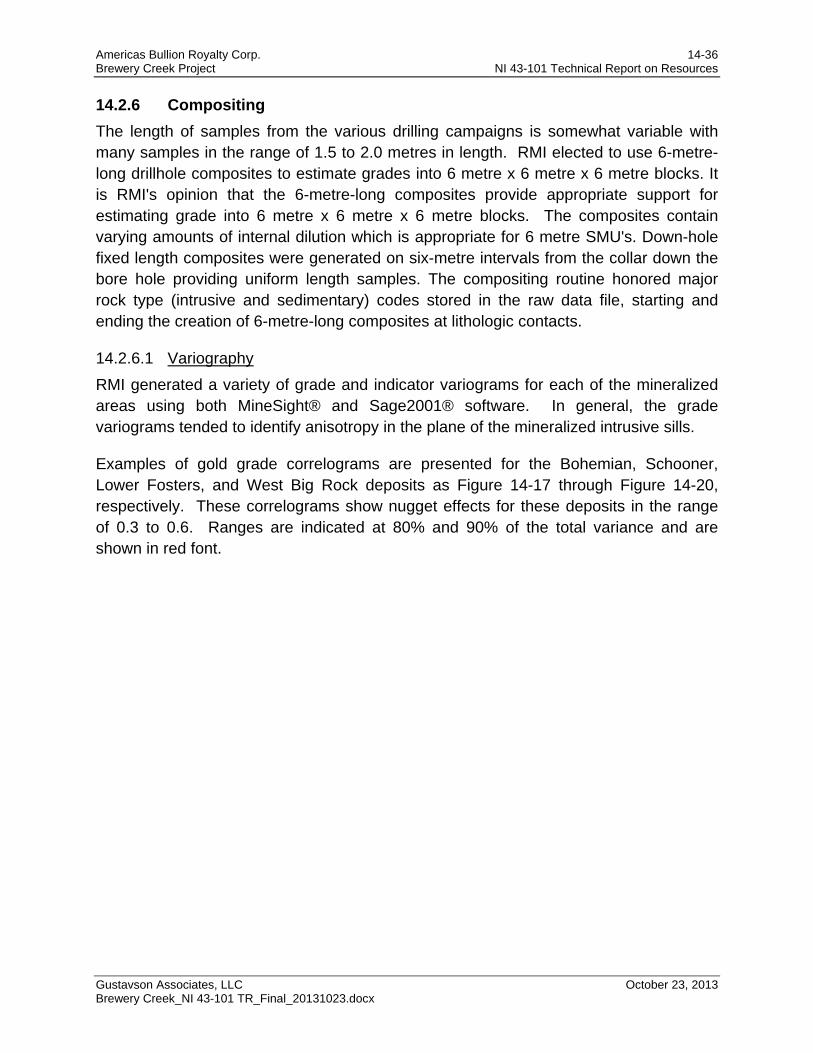
Americas Bullion Royalty Corp. 14-36 Brewery Creek Project NI 43-101 Technical Report on Resources
Gustavson Associates, LLC October 23, 2013 Brewery Creek_NI 43-101 TR_Final_20131023.docx
14.2.6 Compositing
The length of samples from the various drilling campaigns is somewhat variable with many samples in the range of 1.5 to 2.0 metres in length. RMI elected to use 6-metre-long drillhole composites to estimate grades into 6 metre x 6 metre x 6 metre blocks. It is RMI's opinion that the 6-metre-long composites provide appropriate support for estimating grade into 6 metre x 6 metre x 6 metre blocks. The composites contain varying amounts of internal dilution which is appropriate for 6 metre SMU's. Down-hole fixed length composites were generated on six-metre intervals from the collar down the bore hole providing uniform length samples. The compositing routine honored major rock type (intrusive and sedimentary) codes stored in the raw data file, starting and ending the creation of 6-metre-long composites at lithologic contacts.
14.2.6.1 Variography
RMI generated a variety of grade and indicator variograms for each of the mineralized areas using both MineSight® and Sage2001® software. In general, the grade variograms tended to identify anisotropy in the plane of the mineralized intrusive sills.
Examples of gold grade correlograms are presented for the Bohemian, Schooner, Lower Fosters, and West Big Rock deposits as Figure 14-17 through Figure 14-20, respectively. These correlograms show nugget effects for these deposits in the range of 0.3 to 0.6. Ranges are indicated at 80% and 90% of the total variance and are shown in red font.
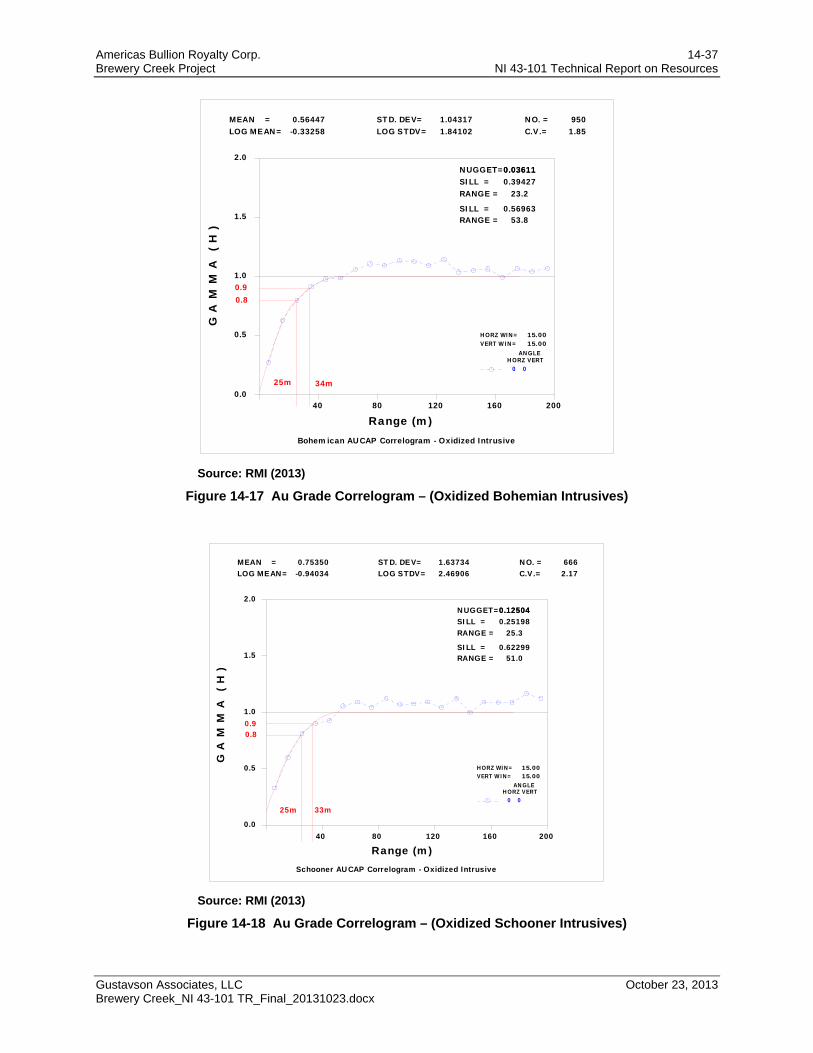
Americas Bullion Royalty Corp. 14-37 Brewery Creek Project NI 43-101 Technical Report on Resources
Gustavson Associates, LLC October 23, 2013 Brewery Creek_NI 43-101 TR_Final_20131023.docx
Source: RMI (2013)
Figure 14-17 Au Grade Correlogram – (Oxidized Bohemian Intrusives)
Source: RMI (2013)
Figure 14-18 Au Grade Correlogram – (Oxidized Schooner Intrusives)
NUGGET= 0.03611 0.03611SILL =RANGE = 23.2
0.39427
SILL = 0.56963RANGE = 53.8
ANGLEHORZ VERT
HORZ WIN=VERT WIN=
15.0015.00
40 0.0
80
0.5
120
1.0
160
1.5
200
2.0
Range (m)
G A
M M
A
( H
)
Bohemican AUCAP Correlogram - Oxidized Intrusive
0 0
MEAN = 0.56447LOG MEAN= -0.33258
STD. DEV= 1.04317LOG STDV= 1.84102
NO. = 950C.V.= 1.85
0.8 0.9
25m 34m
NUGGET= 0.12504 0.12504SILL =RANGE = 25.3
0.25198
SILL = 0.62299RANGE = 51.0
ANGLEHORZ VERT
HORZ WIN=VERT WIN=
15.0015.00
40 0.0
80
0.5
120
1.0
160
1.5
200
2.0
Range (m)
G A
M M
A
( H
)
Schooner AUCAP Correlogram - Oxidized Intrusive
0 0
MEAN = 0.75350LOG MEAN= -0.94034
STD. DEV= 1.63734LOG STDV= 2.46906
NO. = 666C.V.= 2.17
25m 33m
0.9 0.8
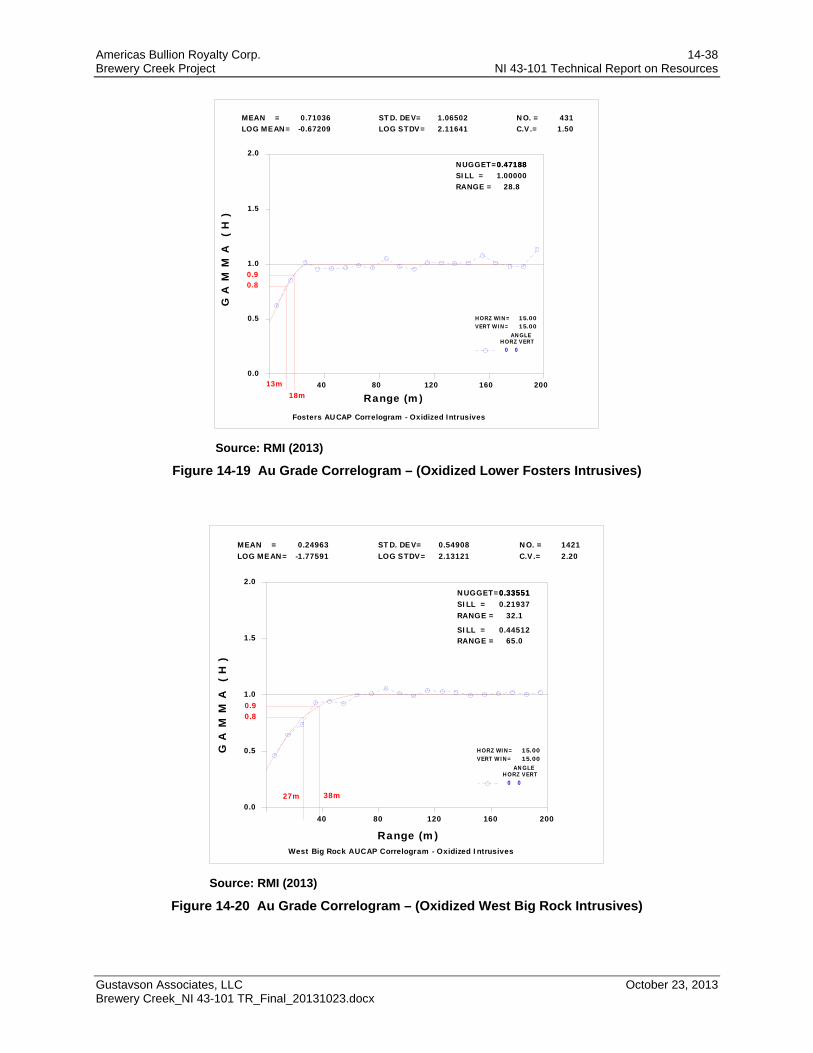
Americas Bullion Royalty Corp. 14-38 Brewery Creek Project NI 43-101 Technical Report on Resources
Gustavson Associates, LLC October 23, 2013 Brewery Creek_NI 43-101 TR_Final_20131023.docx
Source: RMI (2013)
Figure 14-19 Au Grade Correlogram – (Oxidized Lower Fosters Intrusives)
Source: RMI (2013)
Figure 14-20 Au Grade Correlogram – (Oxidized West Big Rock Intrusives)
NUGGET= 0.47188 0.47188SILL = 1.00000RANGE = 28.8
ANGLEHORZ VERT
HORZ WIN=VERT WIN=
15.0015.00
40 0.0
80
0.5
120
1.0
160
1.5
200
2.0
Range (m)
G A
M M
A
( H
)
Fosters AUCAP Correlogram - Oxidized Intrusives
0 0
MEAN = 0.71036LOG MEAN= -0.67209
STD. DEV= 1.06502LOG STDV= 2.11641
NO. = 431C.V.= 1.50
0.90.8
13m18m
NUGGET= 0.33551 0.33551SILL =RANGE = 32.1
0.21937
SILL = 0.44512RANGE = 65.0
ANGLEHORZ VERT
HORZ WIN=VERT WIN=
15.0015.00
40 0.0
80
0.5
120
1.0
160
1.5
200
2.0
Range (m)
G A
M M
A
( H
)
West Big Rock AUCAP Correlogram - Oxidized Intrusives
0 0
MEAN = 0.24963LOG MEAN= -1.77591
STD. DEV= 0.54908LOG STDV= 2.13121
NO. = 1421C.V.= 2.20
0.9 0.8
27m 38m
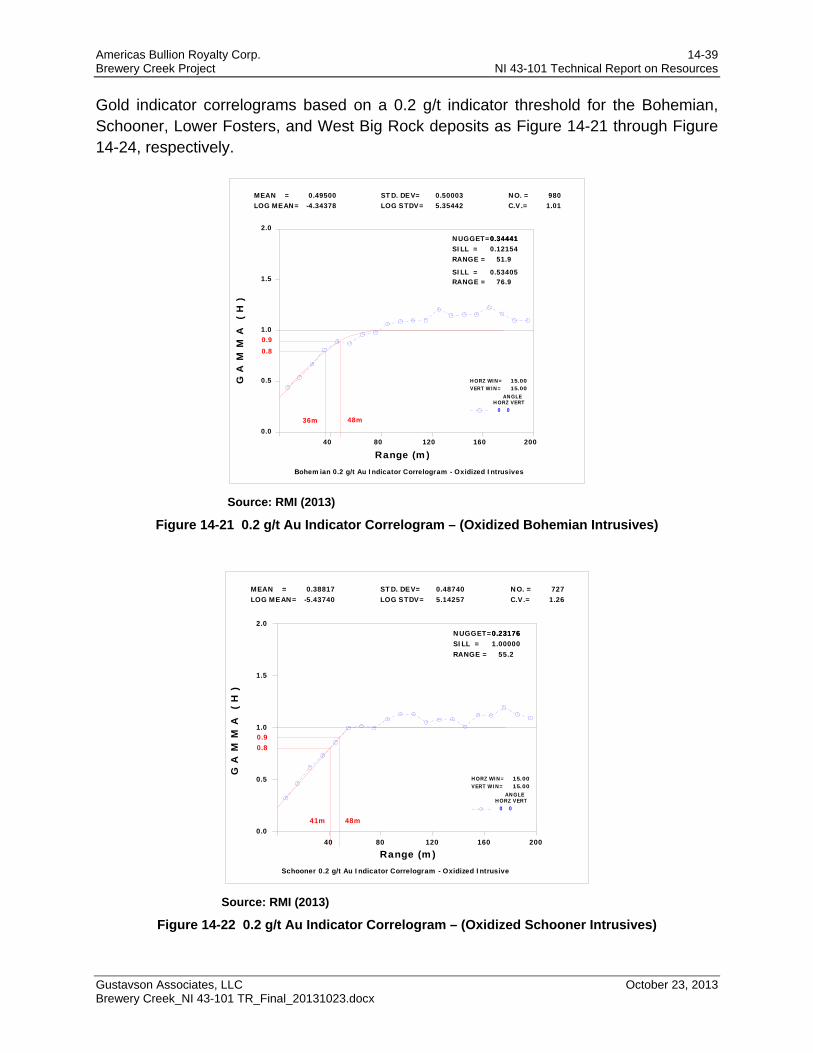
Americas Bullion Royalty Corp. 14-39 Brewery Creek Project NI 43-101 Technical Report on Resources
Gustavson Associates, LLC October 23, 2013 Brewery Creek_NI 43-101 TR_Final_20131023.docx
Gold indicator correlograms based on a 0.2 g/t indicator threshold for the Bohemian, Schooner, Lower Fosters, and West Big Rock deposits as Figure 14-21 through Figure 14-24, respectively.
Source: RMI (2013)
Figure 14-21 0.2 g/t Au Indicator Correlogram – (Oxidized Bohemian Intrusives)
Source: RMI (2013)
Figure 14-22 0.2 g/t Au Indicator Correlogram – (Oxidized Schooner Intrusives)
NUGGET= 0.34441 0.34441SILL =RANGE = 51.9
0.12154
SILL = 0.53405RANGE = 76.9
ANGLEHORZ VERT
HORZ WIN=VERT WIN=
15.0015.00
40 0.0
80
0.5
120
1.0
160
1.5
200
2.0
Range (m)
G A
M M
A
( H
)
Bohemian 0.2 g/t Au Indicator Correlogram - Oxidized Intrusives
0 0
MEAN = 0.49500LOG MEAN= -4.34378
STD. DEV= 0.50003LOG STDV= 5.35442
NO. = 980C.V.= 1.01
0.90.8
36m 48m
NUGGET= 0.23176 0.23176SILL = 1.00000RANGE = 55.2
ANGLEHORZ VERT
HORZ WIN=VERT WIN=
15.0015.00
40 0.0
80
0.5
120
1.0
160
1.5
200
2.0
Range (m)
G A
M M
A
( H
)
Schooner 0.2 g/t Au Indicator Correlogram - Oxidized Intrusive
0 0
MEAN = 0.38817LOG MEAN= -5.43740
STD. DEV= 0.48740LOG STDV= 5.14257
NO. = 727C.V.= 1.26
41m 48m
0.9 0.8
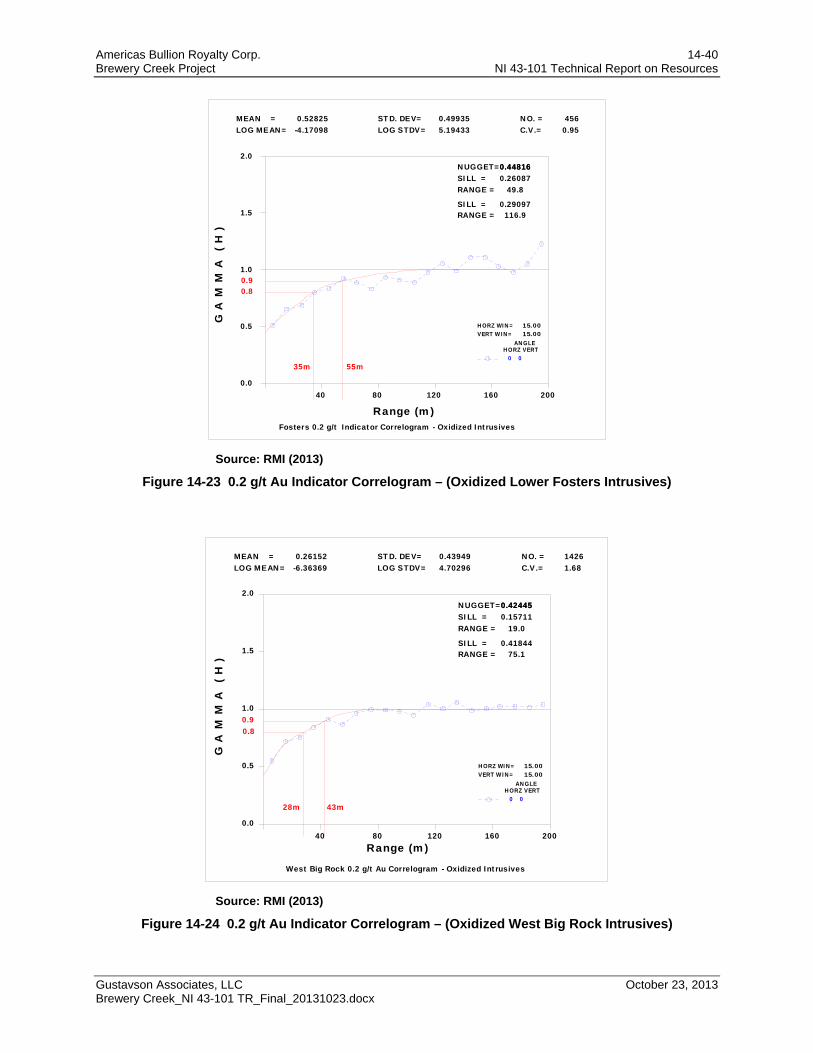
Americas Bullion Royalty Corp. 14-40 Brewery Creek Project NI 43-101 Technical Report on Resources
Gustavson Associates, LLC October 23, 2013 Brewery Creek_NI 43-101 TR_Final_20131023.docx
Source: RMI (2013)
Figure 14-23 0.2 g/t Au Indicator Correlogram – (Oxidized Lower Fosters Intrusives)
Source: RMI (2013)
Figure 14-24 0.2 g/t Au Indicator Correlogram – (Oxidized West Big Rock Intrusives)
NUGGET= 0.44816 0.44816SILL =RANGE = 49.8
0.26087
SILL = 0.29097RANGE = 116.9
ANGLEHORZ VERT
HORZ WIN=VERT WIN=
15.0015.00
40 0.0
80
0.5
120
1.0
160
1.5
200
2.0
Range (m)
G A
M M
A
( H
)
Fosters 0.2 g/t Indicator Correlogram - Oxidized Intrusives
0 0
MEAN = 0.52825LOG MEAN= -4.17098
STD. DEV= 0.49935LOG STDV= 5.19433
NO. = 456C.V.= 0.95
0.9 0.8
35m 55m
NUGGET= 0.42445 0.42445SILL =RANGE = 19.0
0.15711
SILL = 0.41844RANGE = 75.1
ANGLEHORZ VERT
HORZ WIN=VERT WIN=
15.0015.00
40 0.0
80
0.5
120
1.0
160
1.5
200
2.0
Range (m)
G A
M M
A
( H
)
West Big Rock 0.2 g/t Au Correlogram - Oxidized Intrusives
0 0
MEAN = 0.26152LOG MEAN= -6.36369
STD. DEV= 0.43949LOG STDV= 4.70296
NO. = 1426C.V.= 1.68
0.9 0.8
28m 43m
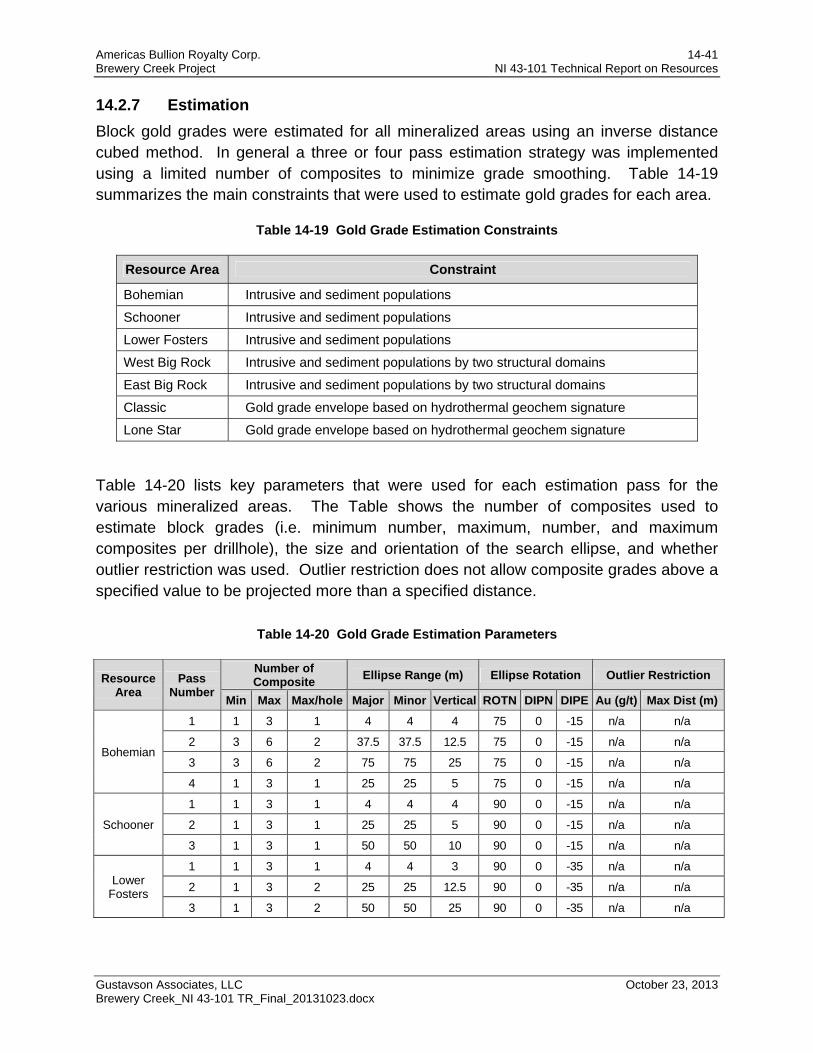
Americas Bullion Royalty Corp. 14-41 Brewery Creek Project NI 43-101 Technical Report on Resources
Gustavson Associates, LLC October 23, 2013 Brewery Creek_NI 43-101 TR_Final_20131023.docx
14.2.7 Estimation
Block gold grades were estimated for all mineralized areas using an inverse distance cubed method. In general a three or four pass estimation strategy was implemented using a limited number of composites to minimize grade smoothing. Table 14-19 summarizes the main constraints that were used to estimate gold grades for each area.
Table 14-19 Gold Grade Estimation Constraints
Resource Area Constraint
Bohemian Intrusive and sediment populations
Schooner Intrusive and sediment populations
Lower Fosters Intrusive and sediment populations
West Big Rock Intrusive and sediment populations by two structural domains
East Big Rock Intrusive and sediment populations by two structural domains
Classic Gold grade envelope based on hydrothermal geochem signature
Lone Star Gold grade envelope based on hydrothermal geochem signature
Table 14-20 lists key parameters that were used for each estimation pass for the various mineralized areas. The Table shows the number of composites used to estimate block grades (i.e. minimum number, maximum, number, and maximum composites per drillhole), the size and orientation of the search ellipse, and whether outlier restriction was used. Outlier restriction does not allow composite grades above a specified value to be projected more than a specified distance.
Table 14-20 Gold Grade Estimation Parameters
Resource Area
Pass Number
Number of Composite
Ellipse Range (m) Ellipse Rotation Outlier Restriction
Min Max Max/hole Major Minor Vertical ROTN DIPN DIPE Au (g/t) Max Dist (m)
Bohemian
1 1 3 1 4 4 4 75 0 -15 n/a n/a
2 3 6 2 37.5 37.5 12.5 75 0 -15 n/a n/a
3 3 6 2 75 75 25 75 0 -15 n/a n/a
4 1 3 1 25 25 5 75 0 -15 n/a n/a
Schooner
1 1 3 1 4 4 4 90 0 -15 n/a n/a
2 1 3 1 25 25 5 90 0 -15 n/a n/a
3 1 3 1 50 50 10 90 0 -15 n/a n/a
Lower Fosters
1 1 3 1 4 4 3 90 0 -35 n/a n/a
2 1 3 2 25 25 12.5 90 0 -35 n/a n/a
3 1 3 2 50 50 25 90 0 -35 n/a n/a
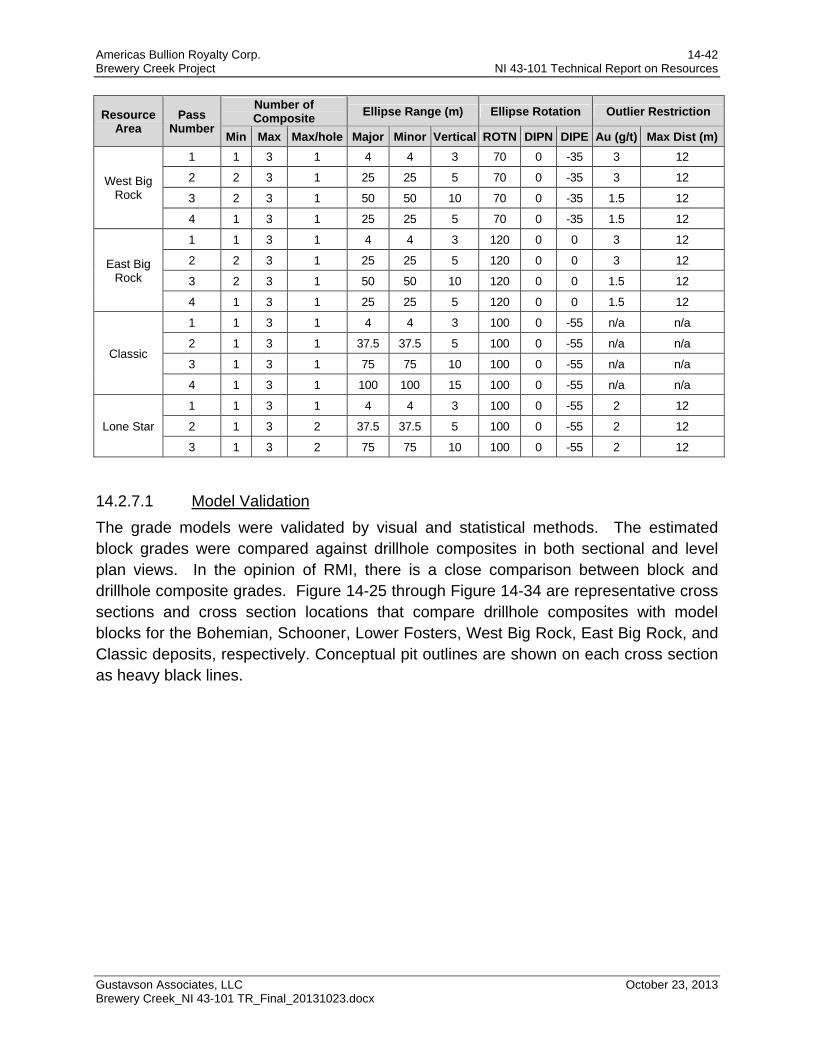
Americas Bullion Royalty Corp. 14-42 Brewery Creek Project NI 43-101 Technical Report on Resources
Gustavson Associates, LLC October 23, 2013 Brewery Creek_NI 43-101 TR_Final_20131023.docx
Resource Area
Pass Number
Number of Composite
Ellipse Range (m) Ellipse Rotation Outlier Restriction
Min Max Max/hole Major Minor Vertical ROTN DIPN DIPE Au (g/t) Max Dist (m)
West Big Rock
1 1 3 1 4 4 3 70 0 -35 3 12
2 2 3 1 25 25 5 70 0 -35 3 12
3 2 3 1 50 50 10 70 0 -35 1.5 12
4 1 3 1 25 25 5 70 0 -35 1.5 12
East Big Rock
1 1 3 1 4 4 3 120 0 0 3 12
2 2 3 1 25 25 5 120 0 0 3 12
3 2 3 1 50 50 10 120 0 0 1.5 12
4 1 3 1 25 25 5 120 0 0 1.5 12
Classic
1 1 3 1 4 4 3 100 0 -55 n/a n/a
2 1 3 1 37.5 37.5 5 100 0 -55 n/a n/a
3 1 3 1 75 75 10 100 0 -55 n/a n/a
4 1 3 1 100 100 15 100 0 -55 n/a n/a
Lone Star
1 1 3 1 4 4 3 100 0 -55 2 12
2 1 3 2 37.5 37.5 5 100 0 -55 2 12
3 1 3 2 75 75 10 100 0 -55 2 12
14.2.7.1 Model Validation
The grade models were validated by visual and statistical methods. The estimated block grades were compared against drillhole composites in both sectional and level plan views. In the opinion of RMI, there is a close comparison between block and drillhole composite grades. Figure 14-25 through Figure 14-34 are representative cross sections and cross section locations that compare drillhole composites with model blocks for the Bohemian, Schooner, Lower Fosters, West Big Rock, East Big Rock, and Classic deposits, respectively. Conceptual pit outlines are shown on each cross section as heavy black lines.
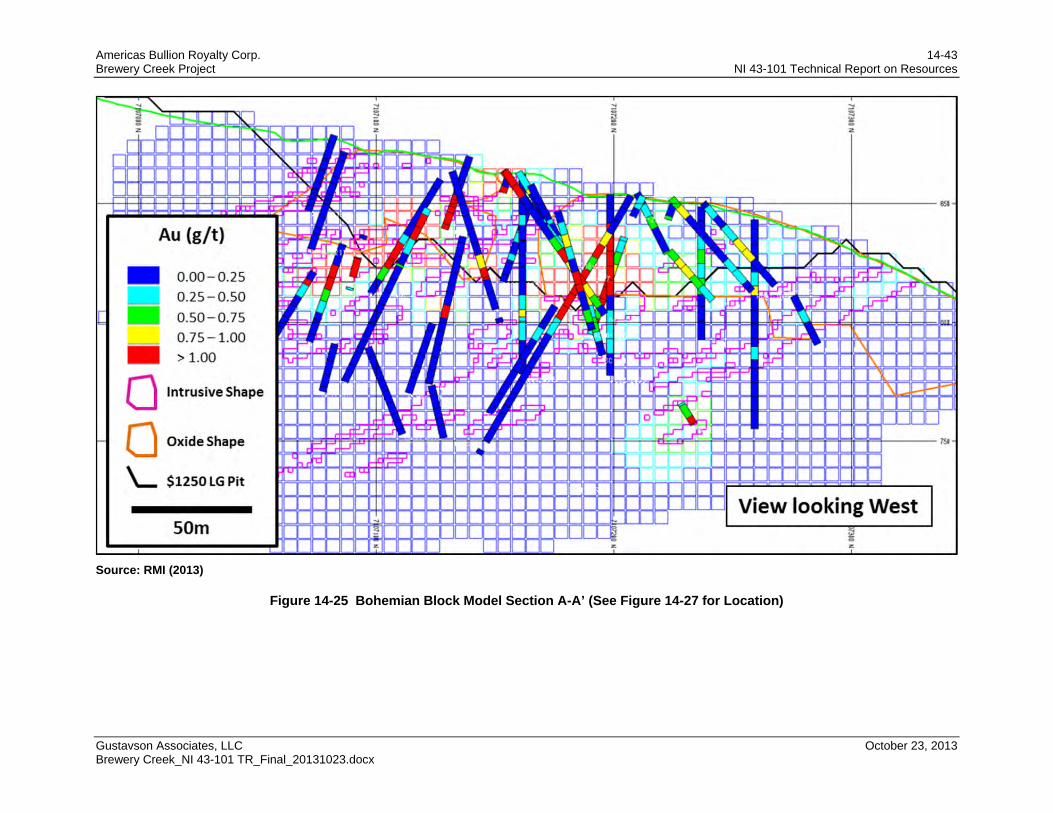
Americas Bullion Royalty Corp. 14-43 Brewery Creek Project NI 43-101 Technical Report on Resources
Gustavson Associates, LLC October 23, 2013 Brewery Creek_NI 43-101 TR_Final_20131023.docx
Source: RMI (2013)
Figure 14-25 Bohemian Block Model Section A-A’ (See Figure 14-27 for Location)
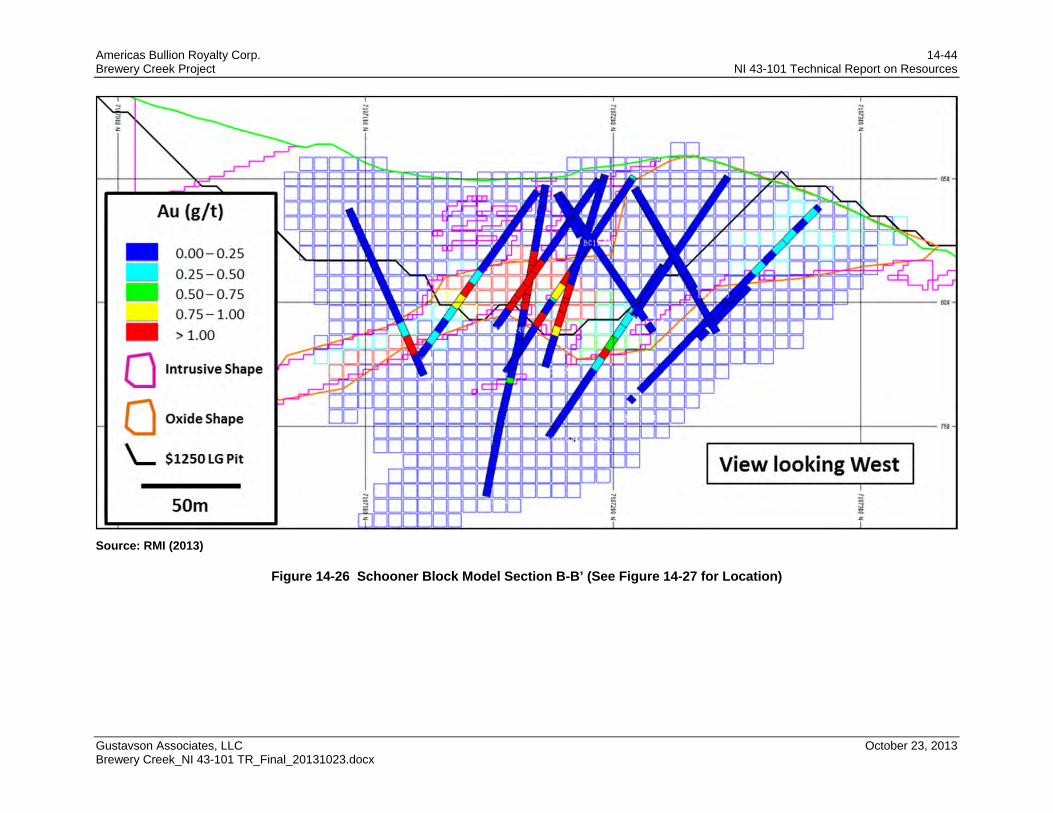
Americas Bullion Royalty Corp. 14-44 Brewery Creek Project NI 43-101 Technical Report on Resources
Gustavson Associates, LLC October 23, 2013 Brewery Creek_NI 43-101 TR_Final_20131023.docx
Source: RMI (2013)
Figure 14-26 Schooner Block Model Section B-B’ (See Figure 14-27 for Location)
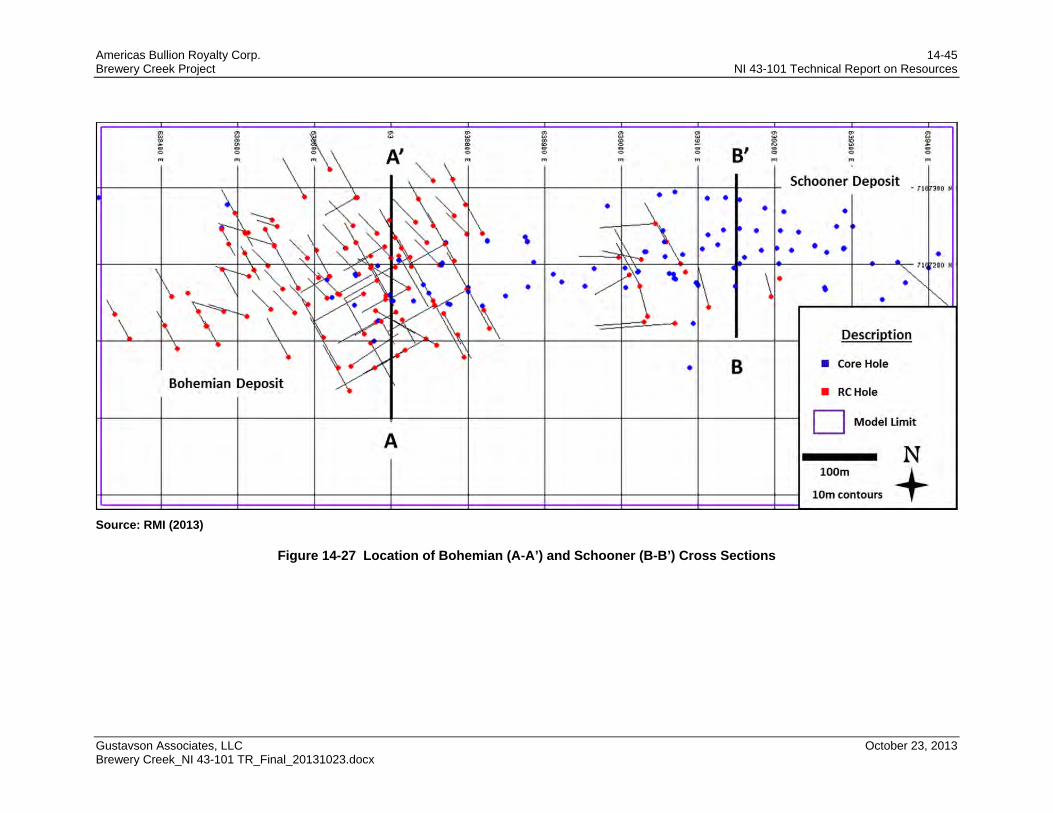
Americas Bullion Royalty Corp. 14-45 Brewery Creek Project NI 43-101 Technical Report on Resources
Gustavson Associates, LLC October 23, 2013 Brewery Creek_NI 43-101 TR_Final_20131023.docx
Source: RMI (2013)
Figure 14-27 Location of Bohemian (A-A’) and Schooner (B-B’) Cross Sections
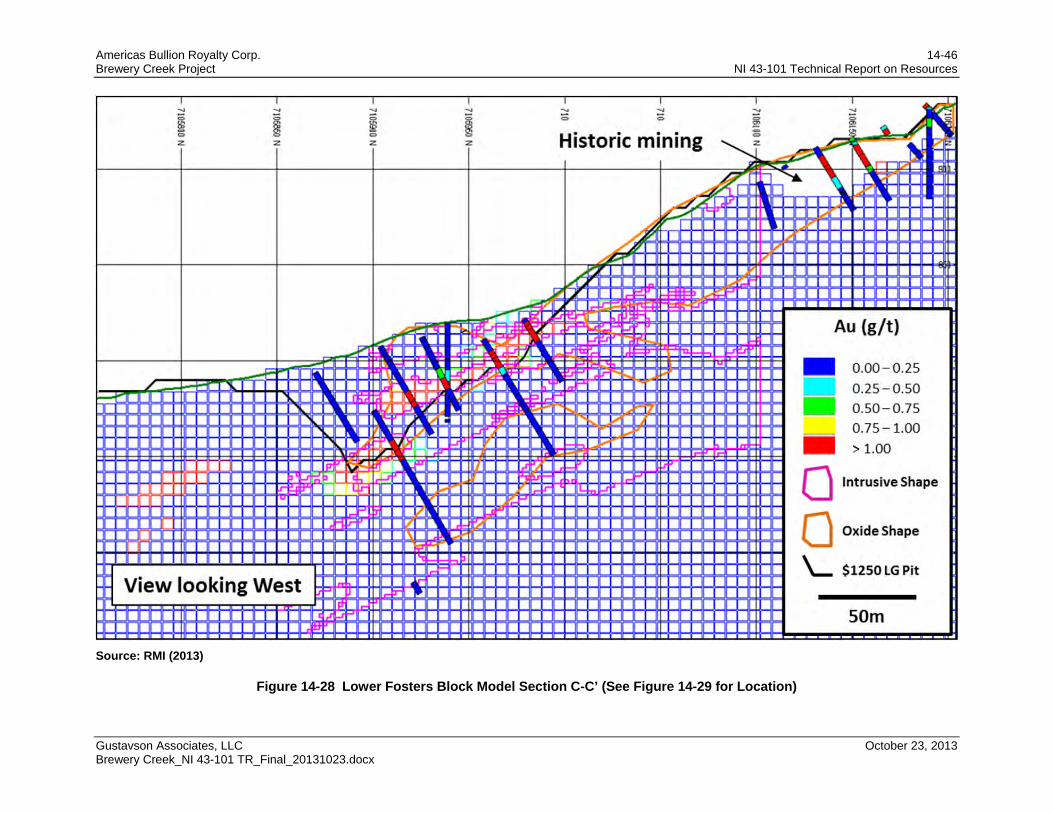
Americas Bullion Royalty Corp. 14-46 Brewery Creek Project NI 43-101 Technical Report on Resources
Gustavson Associates, LLC October 23, 2013 Brewery Creek_NI 43-101 TR_Final_20131023.docx
Source: RMI (2013)
Figure 14-28 Lower Fosters Block Model Section C-C’ (See Figure 14-29 for Location)
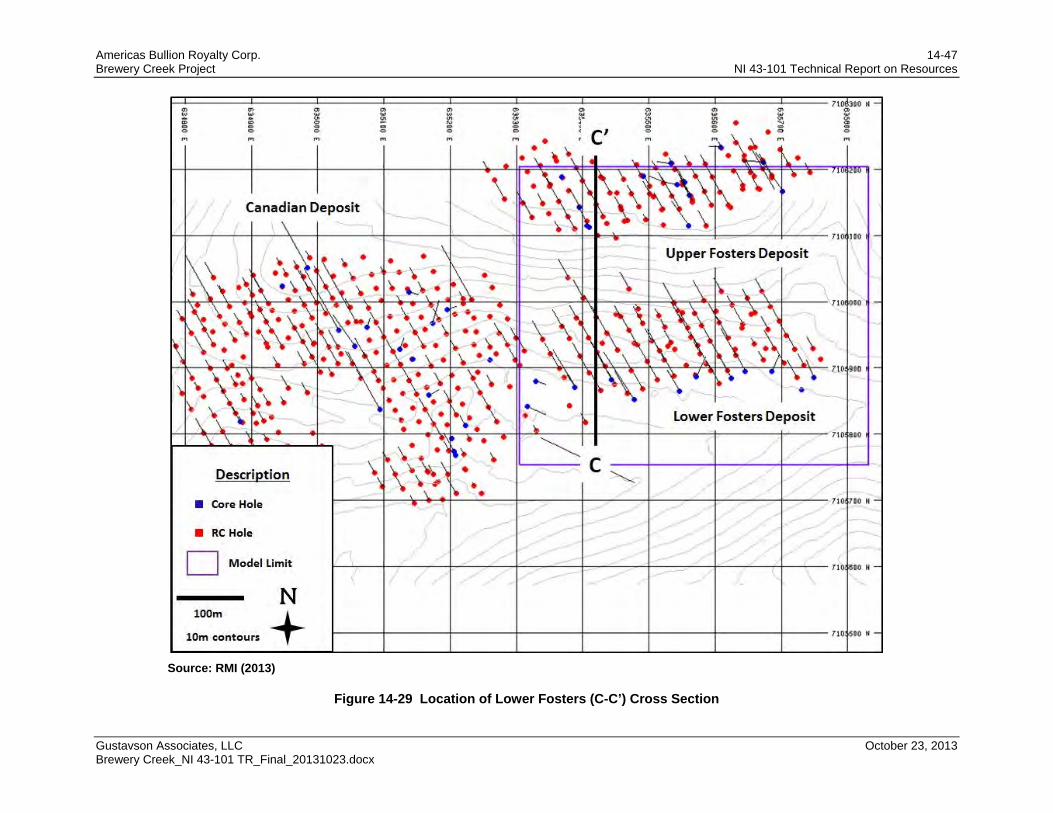
Americas Bullion Royalty Corp. 14-47 Brewery Creek Project NI 43-101 Technical Report on Resources
Gustavson Associates, LLC October 23, 2013 Brewery Creek_NI 43-101 TR_Final_20131023.docx
Source: RMI (2013)
Figure 14-29 Location of Lower Fosters (C-C’) Cross Section
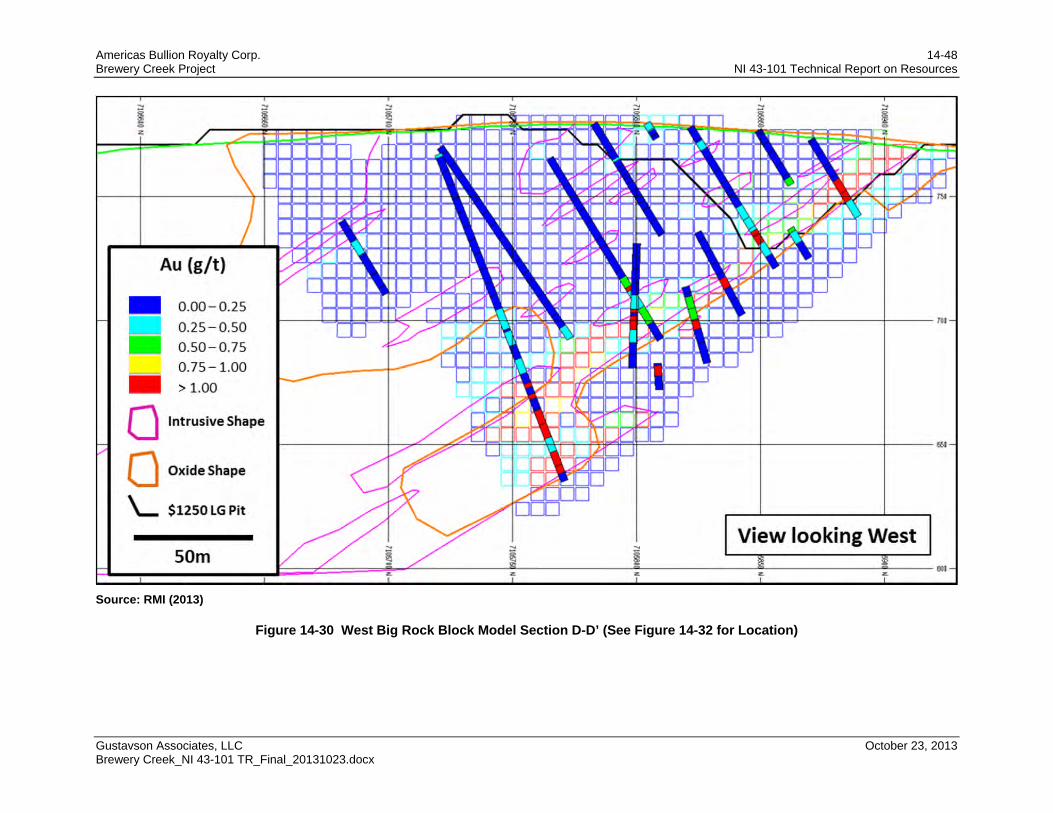
Americas Bullion Royalty Corp. 14-48 Brewery Creek Project NI 43-101 Technical Report on Resources
Gustavson Associates, LLC October 23, 2013 Brewery Creek_NI 43-101 TR_Final_20131023.docx
Source: RMI (2013)
Figure 14-30 West Big Rock Block Model Section D-D’ (See Figure 14-32 for Location)
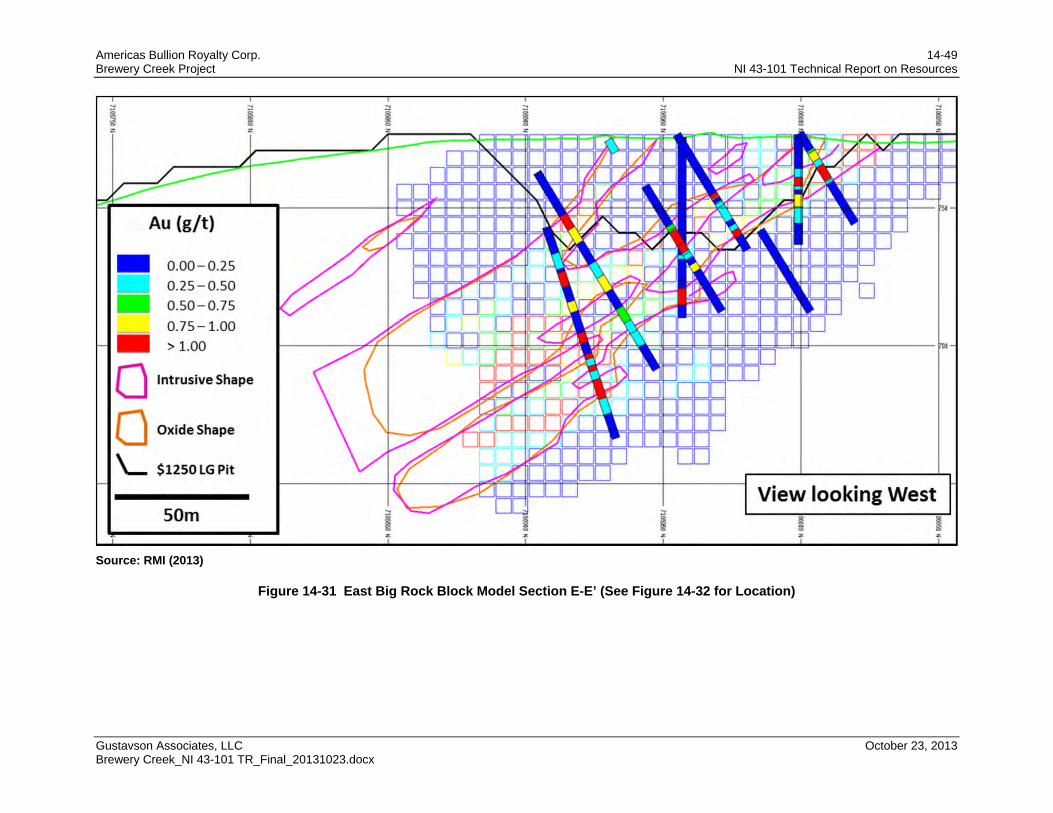
Americas Bullion Royalty Corp. 14-49 Brewery Creek Project NI 43-101 Technical Report on Resources
Gustavson Associates, LLC October 23, 2013 Brewery Creek_NI 43-101 TR_Final_20131023.docx
Source: RMI (2013)
Figure 14-31 East Big Rock Block Model Section E-E’ (See Figure 14-32 for Location)
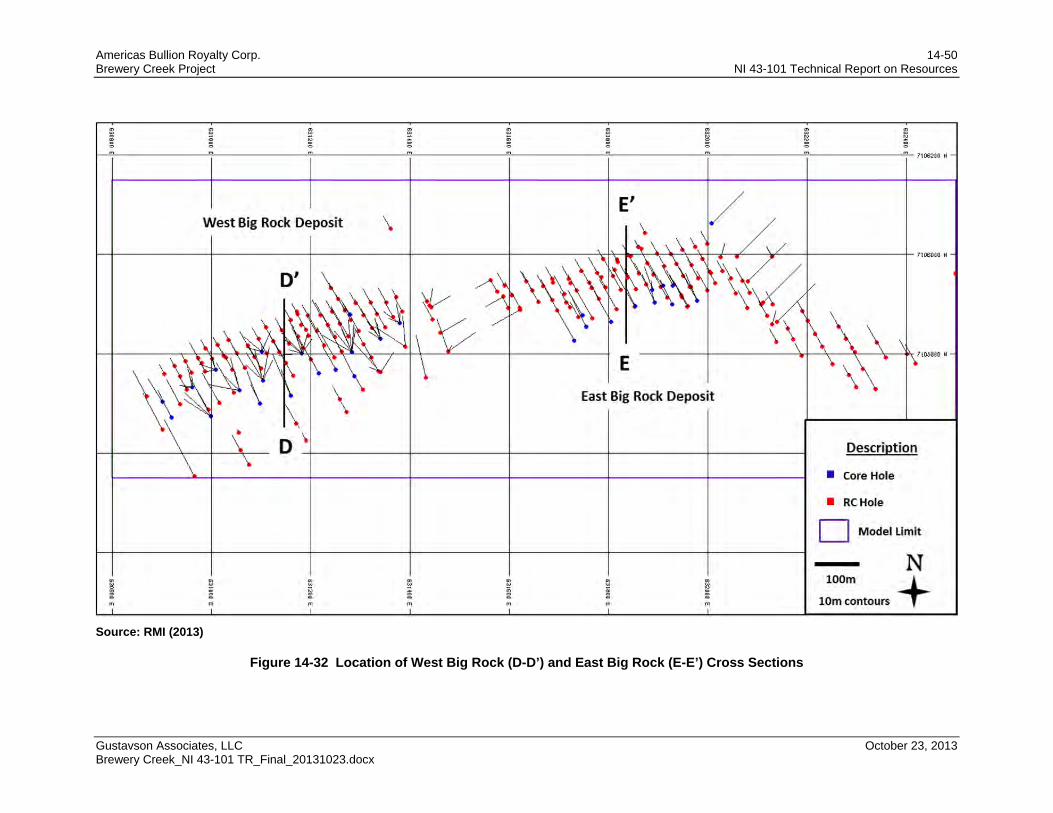
Americas Bullion Royalty Corp. 14-50 Brewery Creek Project NI 43-101 Technical Report on Resources
Gustavson Associates, LLC October 23, 2013 Brewery Creek_NI 43-101 TR_Final_20131023.docx
Source: RMI (2013)
Figure 14-32 Location of West Big Rock (D-D’) and East Big Rock (E-E’) Cross Sections
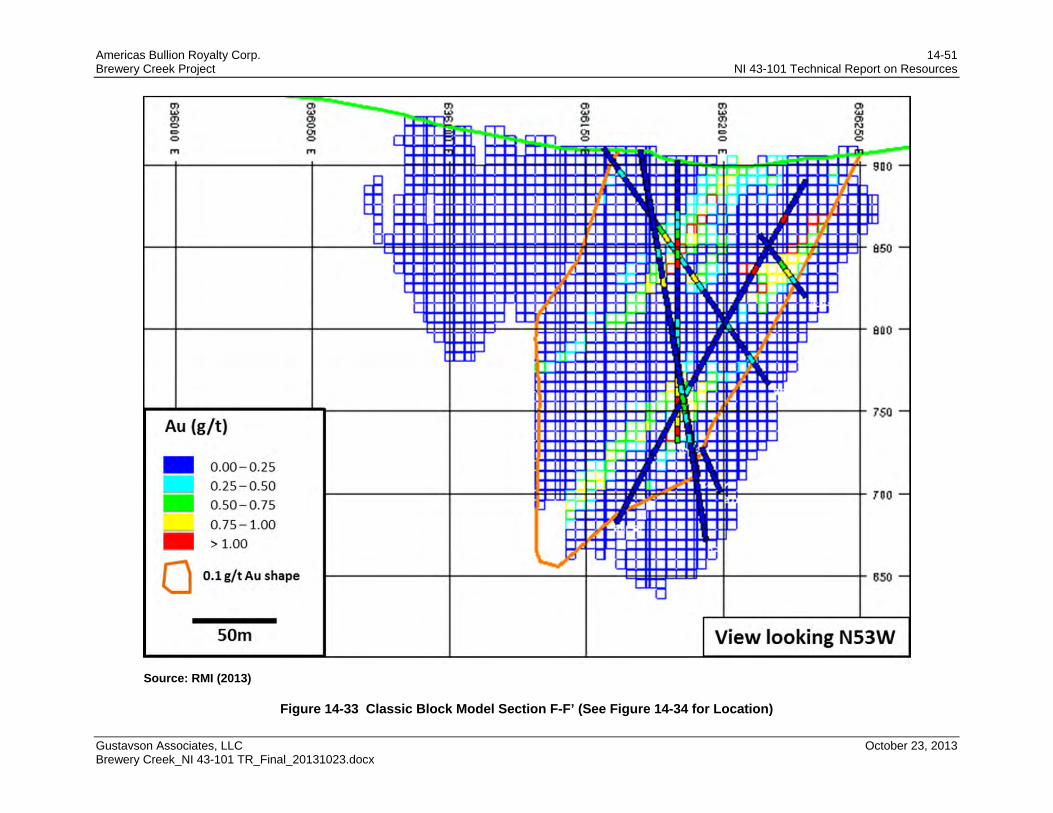
Americas Bullion Royalty Corp. 14-51 Brewery Creek Project NI 43-101 Technical Report on Resources
Gustavson Associates, LLC October 23, 2013 Brewery Creek_NI 43-101 TR_Final_20131023.docx
Source: RMI (2013)
Figure 14-33 Classic Block Model Section F-F’ (See Figure 14-34 for Location)
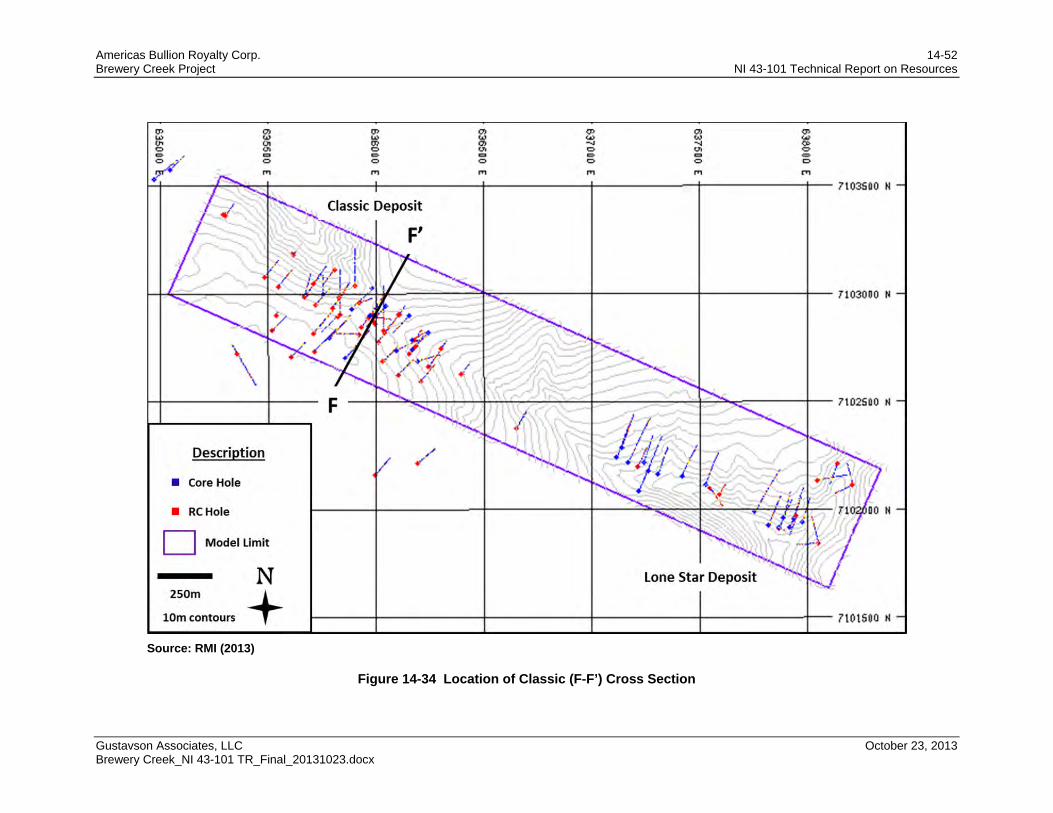
Americas Bullion Royalty Corp. 14-52 Brewery Creek Project NI 43-101 Technical Report on Resources
Gustavson Associates, LLC October 23, 2013 Brewery Creek_NI 43-101 TR_Final_20131023.docx
Source: RMI (2013)
Figure 14-34 Location of Classic (F-F’) Cross Section
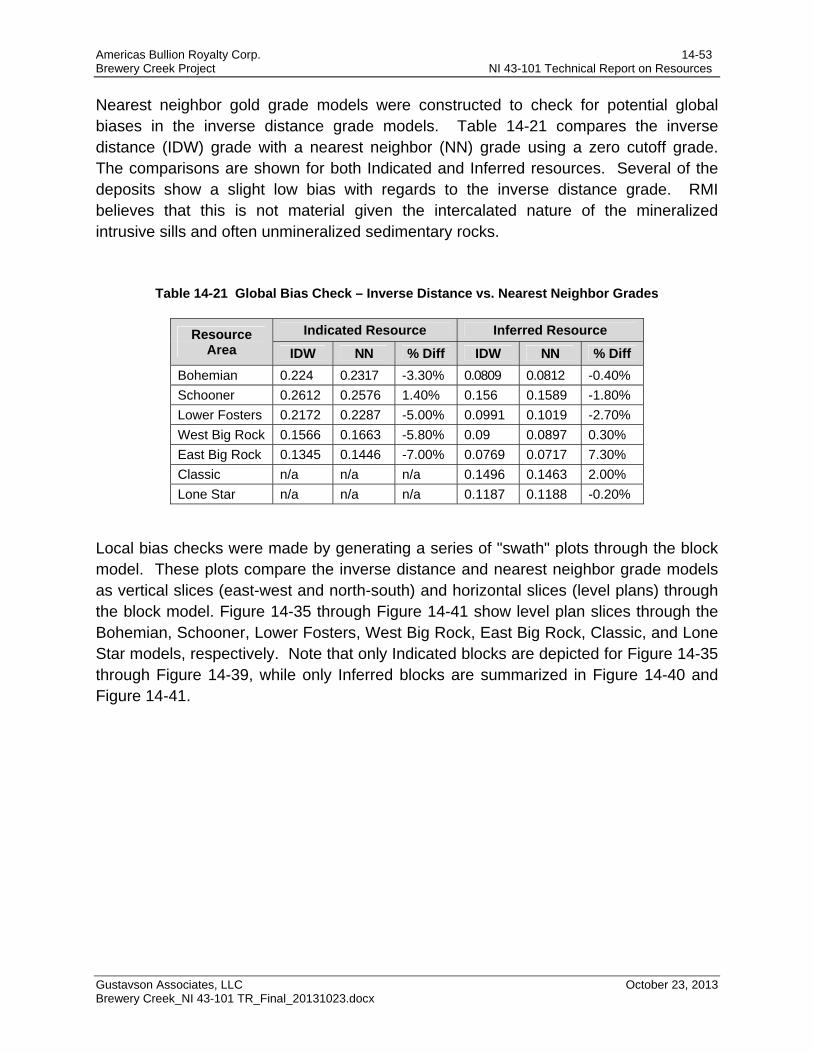
Americas Bullion Royalty Corp. 14-53 Brewery Creek Project NI 43-101 Technical Report on Resources
Gustavson Associates, LLC October 23, 2013 Brewery Creek_NI 43-101 TR_Final_20131023.docx
Nearest neighbor gold grade models were constructed to check for potential global biases in the inverse distance grade models. Table 14-21 compares the inverse distance (IDW) grade with a nearest neighbor (NN) grade using a zero cutoff grade. The comparisons are shown for both Indicated and Inferred resources. Several of the deposits show a slight low bias with regards to the inverse distance grade. RMI believes that this is not material given the intercalated nature of the mineralized intrusive sills and often unmineralized sedimentary rocks.
Table 14-21 Global Bias Check – Inverse Distance vs. Nearest Neighbor Grades
Resource Area
Indicated Resource Inferred Resource
IDW NN % Diff IDW NN % Diff
Bohemian 0.224 0.2317 -3.30% 0.0809 0.0812 -0.40%
Schooner 0.2612 0.2576 1.40% 0.156 0.1589 -1.80%
Lower Fosters 0.2172 0.2287 -5.00% 0.0991 0.1019 -2.70%
West Big Rock 0.1566 0.1663 -5.80% 0.09 0.0897 0.30%
East Big Rock 0.1345 0.1446 -7.00% 0.0769 0.0717 7.30%
Classic n/a n/a n/a 0.1496 0.1463 2.00%
Lone Star n/a n/a n/a 0.1187 0.1188 -0.20%
Local bias checks were made by generating a series of "swath" plots through the block model. These plots compare the inverse distance and nearest neighbor grade models as vertical slices (east-west and north-south) and horizontal slices (level plans) through the block model. Figure 14-35 through Figure 14-41 show level plan slices through the Bohemian, Schooner, Lower Fosters, West Big Rock, East Big Rock, Classic, and Lone Star models, respectively. Note that only Indicated blocks are depicted for Figure 14-35 through Figure 14-39, while only Inferred blocks are summarized in Figure 14-40 and Figure 14-41.
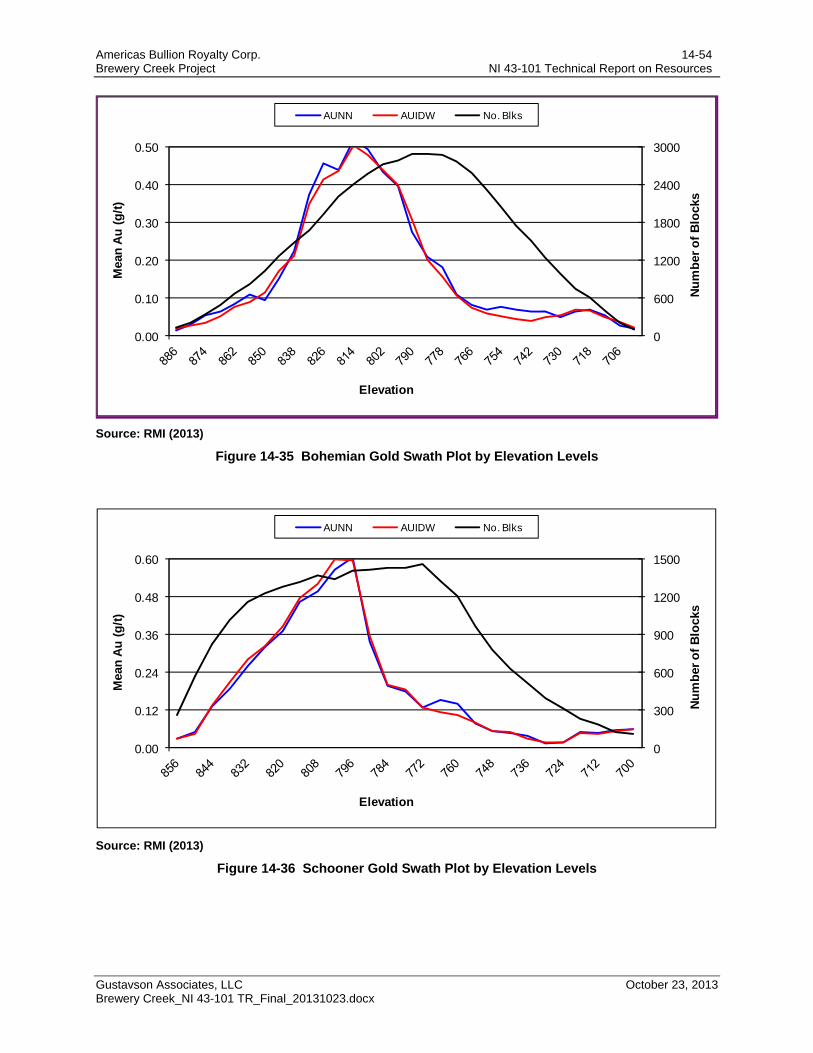
Americas Bullion Royalty Corp. 14-54 Brewery Creek Project NI 43-101 Technical Report on Resources
Gustavson Associates, LLC October 23, 2013 Brewery Creek_NI 43-101 TR_Final_20131023.docx
Source: RMI (2013)
Figure 14-35 Bohemian Gold Swath Plot by Elevation Levels
Source: RMI (2013)
Figure 14-36 Schooner Gold Swath Plot by Elevation Levels
0
600
1200
1800
2400
3000
0.00
0.10
0.20
0.30
0.40
0.50
Nu
mb
er o
f B
lock
s
Mea
n A
u (
g/t
)
Elevation
AUNN AUIDW No. Blks
0
300
600
900
1200
1500
0.00
0.12
0.24
0.36
0.48
0.60
Nu
mb
er o
f B
lock
s
Mea
n A
u (
g/t
)
Elevation
AUNN AUIDW No. Blks
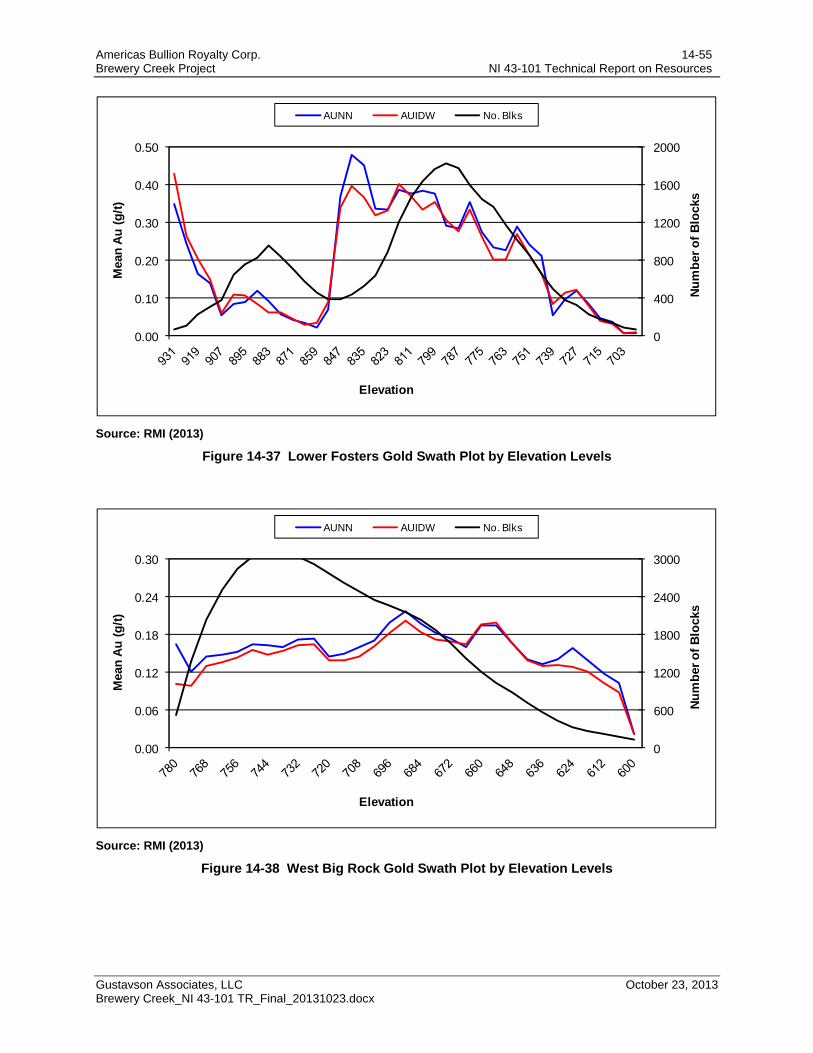
Americas Bullion Royalty Corp. 14-55 Brewery Creek Project NI 43-101 Technical Report on Resources
Gustavson Associates, LLC October 23, 2013 Brewery Creek_NI 43-101 TR_Final_20131023.docx
Source: RMI (2013)
Figure 14-37 Lower Fosters Gold Swath Plot by Elevation Levels
Source: RMI (2013)
Figure 14-38 West Big Rock Gold Swath Plot by Elevation Levels
0
400
800
1200
1600
2000
0.00
0.10
0.20
0.30
0.40
0.50
Nu
mb
er o
f B
lock
s
Mea
n A
u (
g/t
)
Elevation
AUNN AUIDW No. Blks
0
600
1200
1800
2400
3000
0.00
0.06
0.12
0.18
0.24
0.30
Nu
mb
er o
f B
lock
s
Mea
n A
u (
g/t
)
Elevation
AUNN AUIDW No. Blks
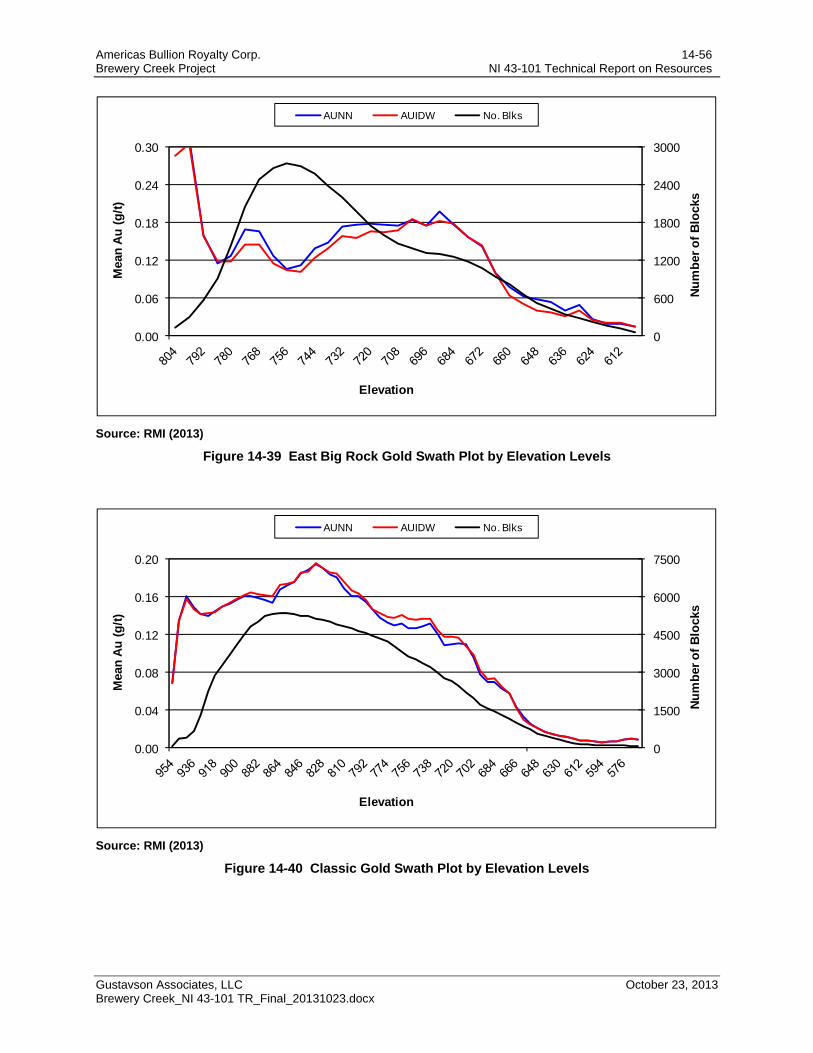
Americas Bullion Royalty Corp. 14-56 Brewery Creek Project NI 43-101 Technical Report on Resources
Gustavson Associates, LLC October 23, 2013 Brewery Creek_NI 43-101 TR_Final_20131023.docx
Source: RMI (2013)
Figure 14-39 East Big Rock Gold Swath Plot by Elevation Levels
Source: RMI (2013)
Figure 14-40 Classic Gold Swath Plot by Elevation Levels
0
600
1200
1800
2400
3000
0.00
0.06
0.12
0.18
0.24
0.30
Nu
mb
er o
f B
lock
s
Mea
n A
u (
g/t
)
Elevation
AUNN AUIDW No. Blks
0
1500
3000
4500
6000
7500
0.00
0.04
0.08
0.12
0.16
0.20
Nu
mb
er o
f B
lock
s
Mea
n A
u (
g/t
)
Elevation
AUNN AUIDW No. Blks
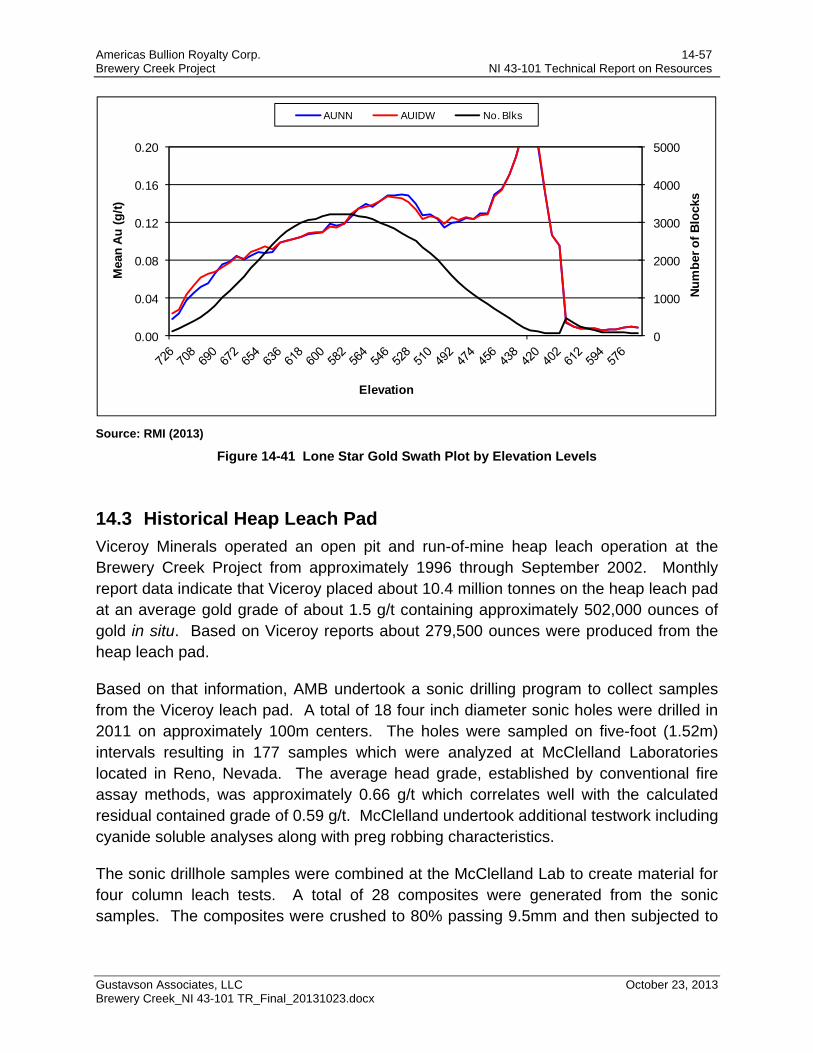
Americas Bullion Royalty Corp. 14-57 Brewery Creek Project NI 43-101 Technical Report on Resources
Gustavson Associates, LLC October 23, 2013 Brewery Creek_NI 43-101 TR_Final_20131023.docx
Source: RMI (2013)
Figure 14-41 Lone Star Gold Swath Plot by Elevation Levels
14.3 Historical Heap Leach Pad
Viceroy Minerals operated an open pit and run-of-mine heap leach operation at the Brewery Creek Project from approximately 1996 through September 2002. Monthly report data indicate that Viceroy placed about 10.4 million tonnes on the heap leach pad at an average gold grade of about 1.5 g/t containing approximately 502,000 ounces of gold in situ. Based on Viceroy reports about 279,500 ounces were produced from the heap leach pad.
Based on that information, AMB undertook a sonic drilling program to collect samples from the Viceroy leach pad. A total of 18 four inch diameter sonic holes were drilled in 2011 on approximately 100m centers. The holes were sampled on five-foot (1.52m) intervals resulting in 177 samples which were analyzed at McClelland Laboratories located in Reno, Nevada. The average head grade, established by conventional fire assay methods, was approximately 0.66 g/t which correlates well with the calculated residual contained grade of 0.59 g/t. McClelland undertook additional testwork including cyanide soluble analyses along with preg robbing characteristics.
The sonic drillhole samples were combined at the McClelland Lab to create material for four column leach tests. A total of 28 composites were generated from the sonic samples. The composites were crushed to 80% passing 9.5mm and then subjected to
0
1000
2000
3000
4000
5000
0.00
0.04
0.08
0.12
0.16
0.20
Nu
mb
er o
f B
lock
s
Mea
n A
u (
g/t
)
Elevation
AUNN AUIDW No. Blks
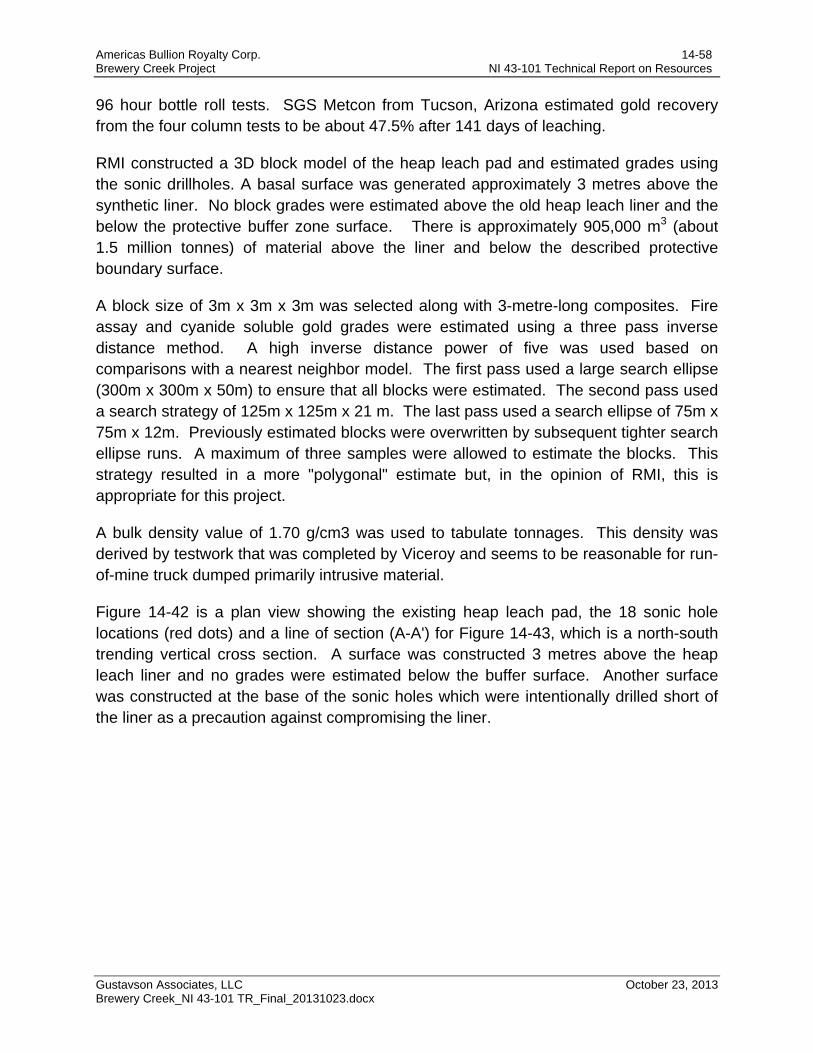
Americas Bullion Royalty Corp. 14-58 Brewery Creek Project NI 43-101 Technical Report on Resources
Gustavson Associates, LLC October 23, 2013 Brewery Creek_NI 43-101 TR_Final_20131023.docx
96 hour bottle roll tests. SGS Metcon from Tucson, Arizona estimated gold recovery from the four column tests to be about 47.5% after 141 days of leaching.
RMI constructed a 3D block model of the heap leach pad and estimated grades using the sonic drillholes. A basal surface was generated approximately 3 metres above the synthetic liner. No block grades were estimated above the old heap leach liner and the below the protective buffer zone surface. There is approximately 905,000 m3 (about 1.5 million tonnes) of material above the liner and below the described protective boundary surface.
A block size of 3m x 3m x 3m was selected along with 3-metre-long composites. Fire assay and cyanide soluble gold grades were estimated using a three pass inverse distance method. A high inverse distance power of five was used based on comparisons with a nearest neighbor model. The first pass used a large search ellipse (300m x 300m x 50m) to ensure that all blocks were estimated. The second pass used a search strategy of 125m x 125m x 21 m. The last pass used a search ellipse of 75m x 75m x 12m. Previously estimated blocks were overwritten by subsequent tighter search ellipse runs. A maximum of three samples were allowed to estimate the blocks. This strategy resulted in a more "polygonal" estimate but, in the opinion of RMI, this is appropriate for this project.
A bulk density value of 1.70 g/cm3 was used to tabulate tonnages. This density was derived by testwork that was completed by Viceroy and seems to be reasonable for run-of-mine truck dumped primarily intrusive material.
Figure 14-42 is a plan view showing the existing heap leach pad, the 18 sonic hole locations (red dots) and a line of section (A-A') for Figure 14-43, which is a north-south trending vertical cross section. A surface was constructed 3 metres above the heap leach liner and no grades were estimated below the buffer surface. Another surface was constructed at the base of the sonic holes which were intentionally drilled short of the liner as a precaution against compromising the liner.
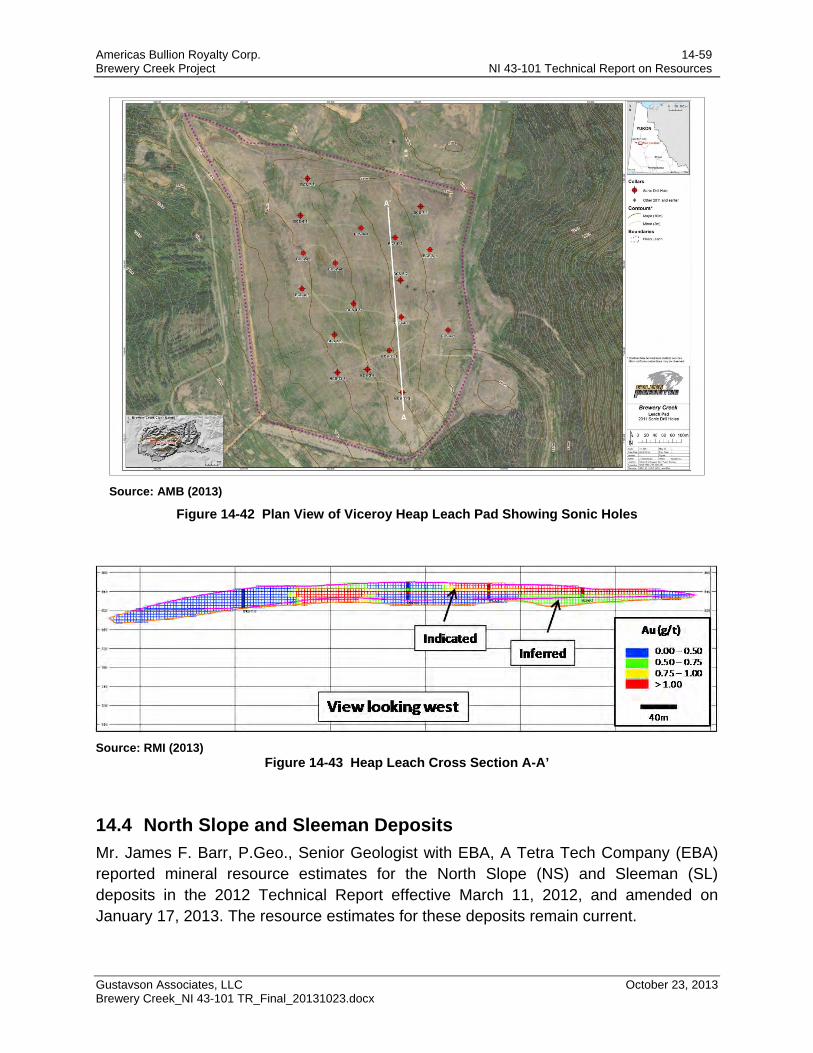
Americas Bullion Royalty Corp. 14-59 Brewery Creek Project NI 43-101 Technical Report on Resources
Gustavson Associates, LLC October 23, 2013 Brewery Creek_NI 43-101 TR_Final_20131023.docx
Source: AMB (2013)
Figure 14-42 Plan View of Viceroy Heap Leach Pad Showing Sonic Holes
Source: RMI (2013)
Figure 14-43 Heap Leach Cross Section A-A’
14.4 North Slope and Sleeman Deposits
Mr. James F. Barr, P.Geo., Senior Geologist with EBA, A Tetra Tech Company (EBA) reported mineral resource estimates for the North Slope (NS) and Sleeman (SL) deposits in the 2012 Technical Report effective March 11, 2012, and amended on January 17, 2013. The resource estimates for these deposits remain current.
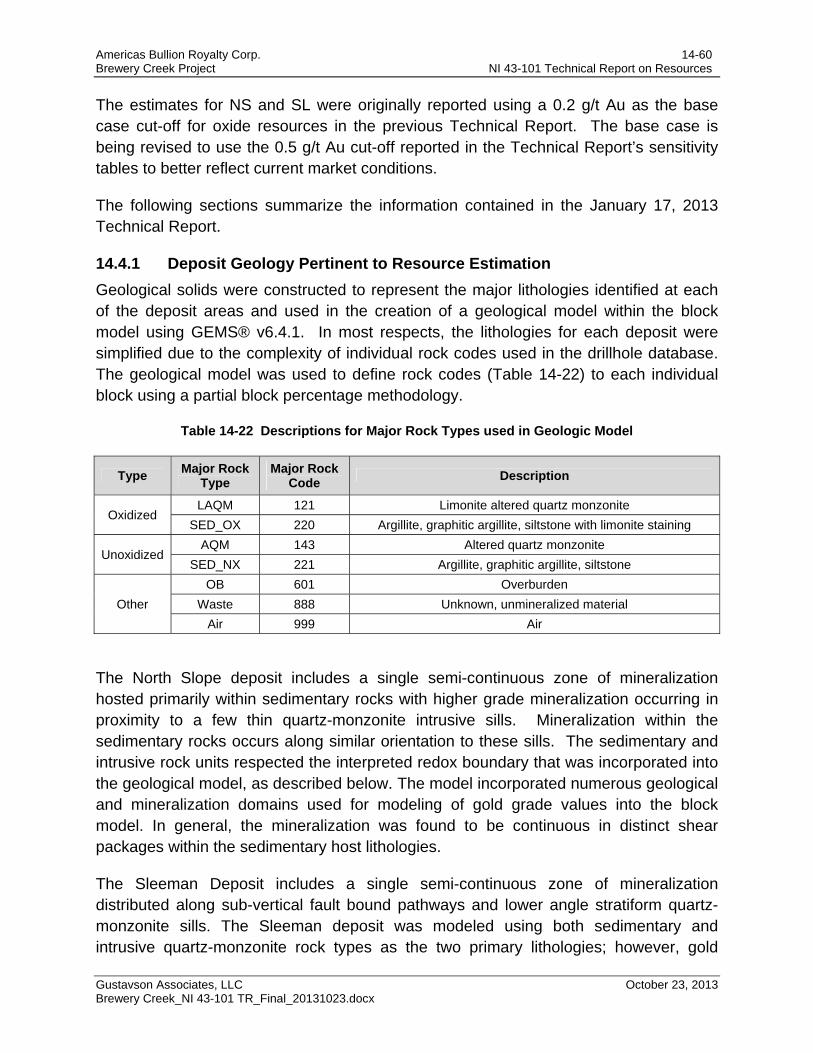
Americas Bullion Royalty Corp. 14-60 Brewery Creek Project NI 43-101 Technical Report on Resources
Gustavson Associates, LLC October 23, 2013 Brewery Creek_NI 43-101 TR_Final_20131023.docx
The estimates for NS and SL were originally reported using a 0.2 g/t Au as the base case cut-off for oxide resources in the previous Technical Report. The base case is being revised to use the 0.5 g/t Au cut-off reported in the Technical Report’s sensitivity tables to better reflect current market conditions.
The following sections summarize the information contained in the January 17, 2013 Technical Report.
14.4.1 Deposit Geology Pertinent to Resource Estimation
Geological solids were constructed to represent the major lithologies identified at each of the deposit areas and used in the creation of a geological model within the block model using GEMS® v6.4.1. In most respects, the lithologies for each deposit were simplified due to the complexity of individual rock codes used in the drillhole database. The geological model was used to define rock codes (Table 14-22) to each individual block using a partial block percentage methodology.
Table 14-22 Descriptions for Major Rock Types used in Geologic Model
Type Major Rock
Type Major Rock
Code Description
Oxidized LAQM 121 Limonite altered quartz monzonite
SED_OX 220 Argillite, graphitic argillite, siltstone with limonite staining
Unoxidized AQM 143 Altered quartz monzonite
SED_NX 221 Argillite, graphitic argillite, siltstone
Other
OB 601 Overburden
Waste 888 Unknown, unmineralized material
Air 999 Air
The North Slope deposit includes a single semi-continuous zone of mineralization hosted primarily within sedimentary rocks with higher grade mineralization occurring in proximity to a few thin quartz-monzonite intrusive sills. Mineralization within the sedimentary rocks occurs along similar orientation to these sills. The sedimentary and intrusive rock units respected the interpreted redox boundary that was incorporated into the geological model, as described below. The model incorporated numerous geological and mineralization domains used for modeling of gold grade values into the block model. In general, the mineralization was found to be continuous in distinct shear packages within the sedimentary host lithologies.
The Sleeman Deposit includes a single semi-continuous zone of mineralization distributed along sub-vertical fault bound pathways and lower angle stratiform quartz-monzonite sills. The Sleeman deposit was modeled using both sedimentary and intrusive quartz-monzonite rock types as the two primary lithologies; however, gold
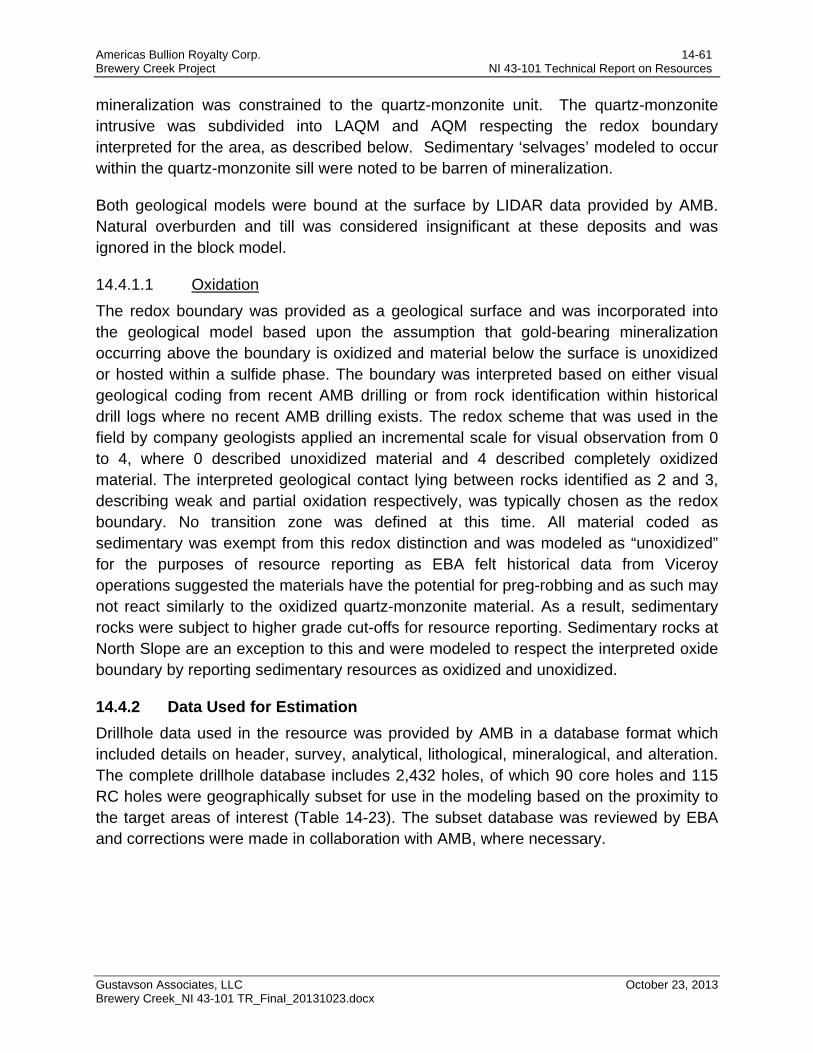
Americas Bullion Royalty Corp. 14-61 Brewery Creek Project NI 43-101 Technical Report on Resources
Gustavson Associates, LLC October 23, 2013 Brewery Creek_NI 43-101 TR_Final_20131023.docx
mineralization was constrained to the quartz-monzonite unit. The quartz-monzonite intrusive was subdivided into LAQM and AQM respecting the redox boundary interpreted for the area, as described below. Sedimentary ‘selvages’ modeled to occur within the quartz-monzonite sill were noted to be barren of mineralization.
Both geological models were bound at the surface by LIDAR data provided by AMB. Natural overburden and till was considered insignificant at these deposits and was ignored in the block model.
14.4.1.1 Oxidation
The redox boundary was provided as a geological surface and was incorporated into the geological model based upon the assumption that gold-bearing mineralization occurring above the boundary is oxidized and material below the surface is unoxidized or hosted within a sulfide phase. The boundary was interpreted based on either visual geological coding from recent AMB drilling or from rock identification within historical drill logs where no recent AMB drilling exists. The redox scheme that was used in the field by company geologists applied an incremental scale for visual observation from 0 to 4, where 0 described unoxidized material and 4 described completely oxidized material. The interpreted geological contact lying between rocks identified as 2 and 3, describing weak and partial oxidation respectively, was typically chosen as the redox boundary. No transition zone was defined at this time. All material coded as sedimentary was exempt from this redox distinction and was modeled as “unoxidized” for the purposes of resource reporting as EBA felt historical data from Viceroy operations suggested the materials have the potential for preg-robbing and as such may not react similarly to the oxidized quartz-monzonite material. As a result, sedimentary rocks were subject to higher grade cut-offs for resource reporting. Sedimentary rocks at North Slope are an exception to this and were modeled to respect the interpreted oxide boundary by reporting sedimentary resources as oxidized and unoxidized.
14.4.2 Data Used for Estimation
Drillhole data used in the resource was provided by AMB in a database format which included details on header, survey, analytical, lithological, mineralogical, and alteration. The complete drillhole database includes 2,432 holes, of which 90 core holes and 115 RC holes were geographically subset for use in the modeling based on the proximity to the target areas of interest (Table 14-23). The subset database was reviewed by EBA and corrections were made in collaboration with AMB, where necessary.
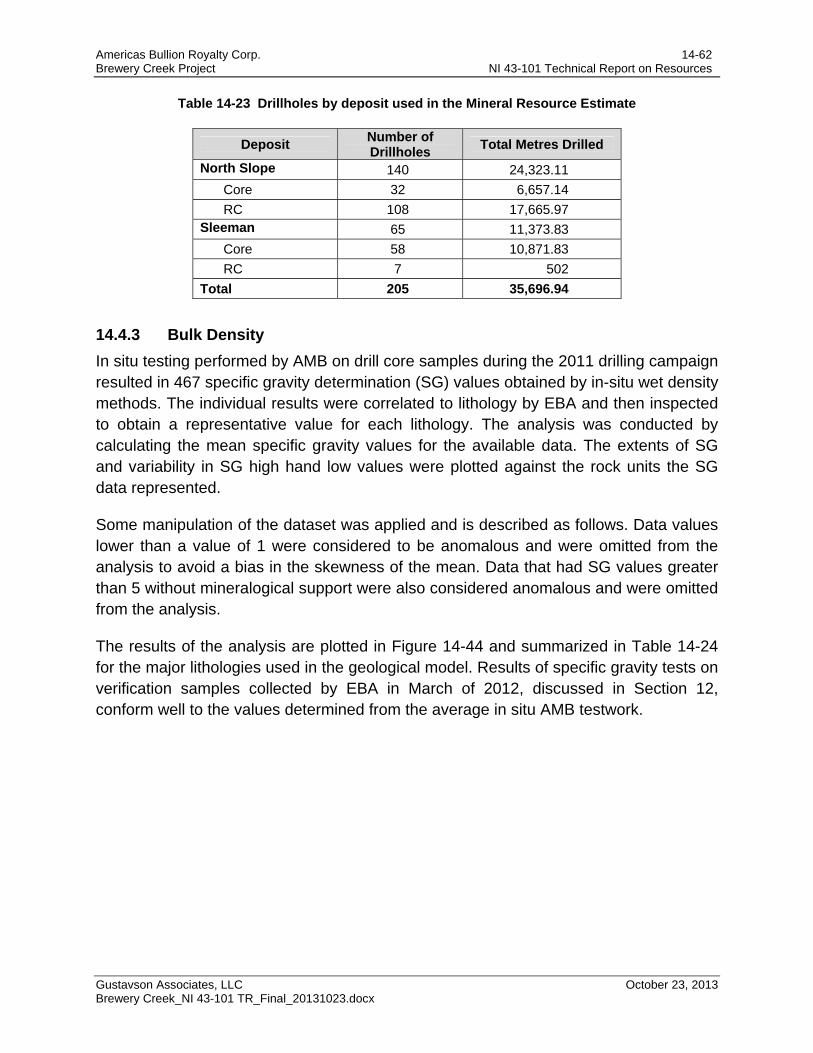
Americas Bullion Royalty Corp. 14-62 Brewery Creek Project NI 43-101 Technical Report on Resources
Gustavson Associates, LLC October 23, 2013 Brewery Creek_NI 43-101 TR_Final_20131023.docx
Table 14-23 Drillholes by deposit used in the Mineral Resource Estimate
Deposit Number of Drillholes
Total Metres Drilled
North Slope 140 24,323.11
Core 32 6,657.14
RC 108 17,665.97 Sleeman 65 11,373.83
Core 58 10,871.83
RC 7 502
Total 205 35,696.94
14.4.3 Bulk Density
In situ testing performed by AMB on drill core samples during the 2011 drilling campaign resulted in 467 specific gravity determination (SG) values obtained by in-situ wet density methods. The individual results were correlated to lithology by EBA and then inspected to obtain a representative value for each lithology. The analysis was conducted by calculating the mean specific gravity values for the available data. The extents of SG and variability in SG high hand low values were plotted against the rock units the SG data represented.
Some manipulation of the dataset was applied and is described as follows. Data values lower than a value of 1 were considered to be anomalous and were omitted from the analysis to avoid a bias in the skewness of the mean. Data that had SG values greater than 5 without mineralogical support were also considered anomalous and were omitted from the analysis.
The results of the analysis are plotted in Figure 14-44 and summarized in Table 14-24 for the major lithologies used in the geological model. Results of specific gravity tests on verification samples collected by EBA in March of 2012, discussed in Section 12, conform well to the values determined from the average in situ AMB testwork.
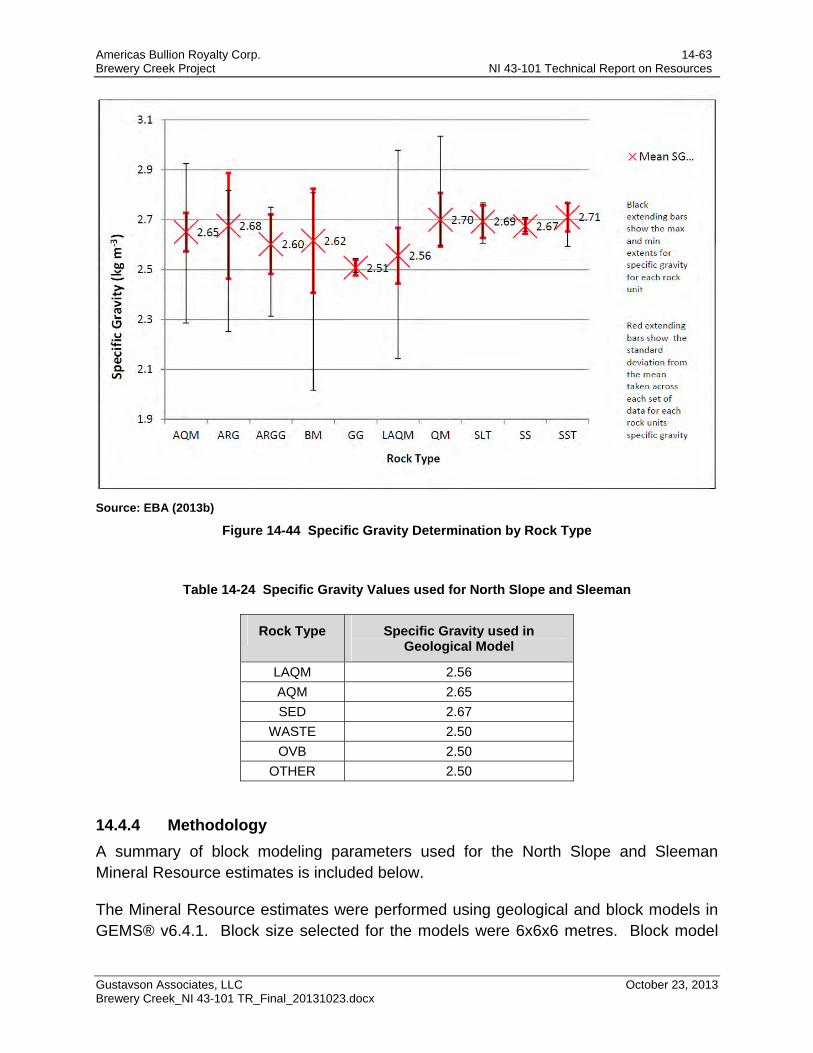
Americas Bullion Royalty Corp. 14-63 Brewery Creek Project NI 43-101 Technical Report on Resources
Gustavson Associates, LLC October 23, 2013 Brewery Creek_NI 43-101 TR_Final_20131023.docx
Source: EBA (2013b)
Figure 14-44 Specific Gravity Determination by Rock Type
Table 14-24 Specific Gravity Values used for North Slope and Sleeman
Rock Type Specific Gravity used in Geological Model
LAQM 2.56
AQM 2.65
SED 2.67
WASTE 2.50
OVB 2.50
OTHER 2.50
14.4.4 Methodology
A summary of block modeling parameters used for the North Slope and Sleeman Mineral Resource estimates is included below.
The Mineral Resource estimates were performed using geological and block models in GEMS® v6.4.1. Block size selected for the models were 6x6x6 metres. Block model
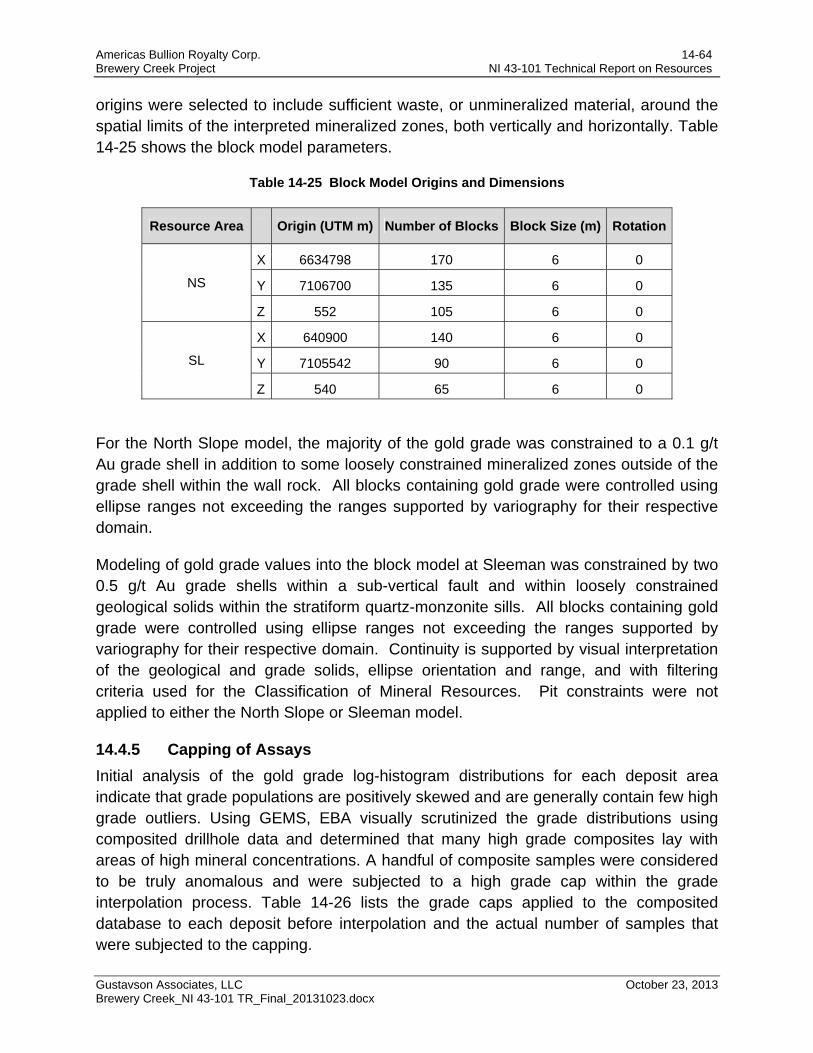
Americas Bullion Royalty Corp. 14-64 Brewery Creek Project NI 43-101 Technical Report on Resources
Gustavson Associates, LLC October 23, 2013 Brewery Creek_NI 43-101 TR_Final_20131023.docx
origins were selected to include sufficient waste, or unmineralized material, around the spatial limits of the interpreted mineralized zones, both vertically and horizontally. Table 14-25 shows the block model parameters.
Table 14-25 Block Model Origins and Dimensions
Resource Area Origin (UTM m) Number of Blocks Block Size (m) Rotation
NS
X 6634798 170 6 0
Y 7106700 135 6 0
Z 552 105 6 0
SL
X 640900 140 6 0
Y 7105542 90 6 0
Z 540 65 6 0
For the North Slope model, the majority of the gold grade was constrained to a 0.1 g/t Au grade shell in addition to some loosely constrained mineralized zones outside of the grade shell within the wall rock. All blocks containing gold grade were controlled using ellipse ranges not exceeding the ranges supported by variography for their respective domain.
Modeling of gold grade values into the block model at Sleeman was constrained by two 0.5 g/t Au grade shells within a sub-vertical fault and within loosely constrained geological solids within the stratiform quartz-monzonite sills. All blocks containing gold grade were controlled using ellipse ranges not exceeding the ranges supported by variography for their respective domain. Continuity is supported by visual interpretation of the geological and grade solids, ellipse orientation and range, and with filtering criteria used for the Classification of Mineral Resources. Pit constraints were not applied to either the North Slope or Sleeman model.
14.4.5 Capping of Assays
Initial analysis of the gold grade log-histogram distributions for each deposit area indicate that grade populations are positively skewed and are generally contain few high grade outliers. Using GEMS, EBA visually scrutinized the grade distributions using composited drillhole data and determined that many high grade composites lay with areas of high mineral concentrations. A handful of composite samples were considered to be truly anomalous and were subjected to a high grade cap within the grade interpolation process. Table 14-26 lists the grade caps applied to the composited database to each deposit before interpolation and the actual number of samples that were subjected to the capping.
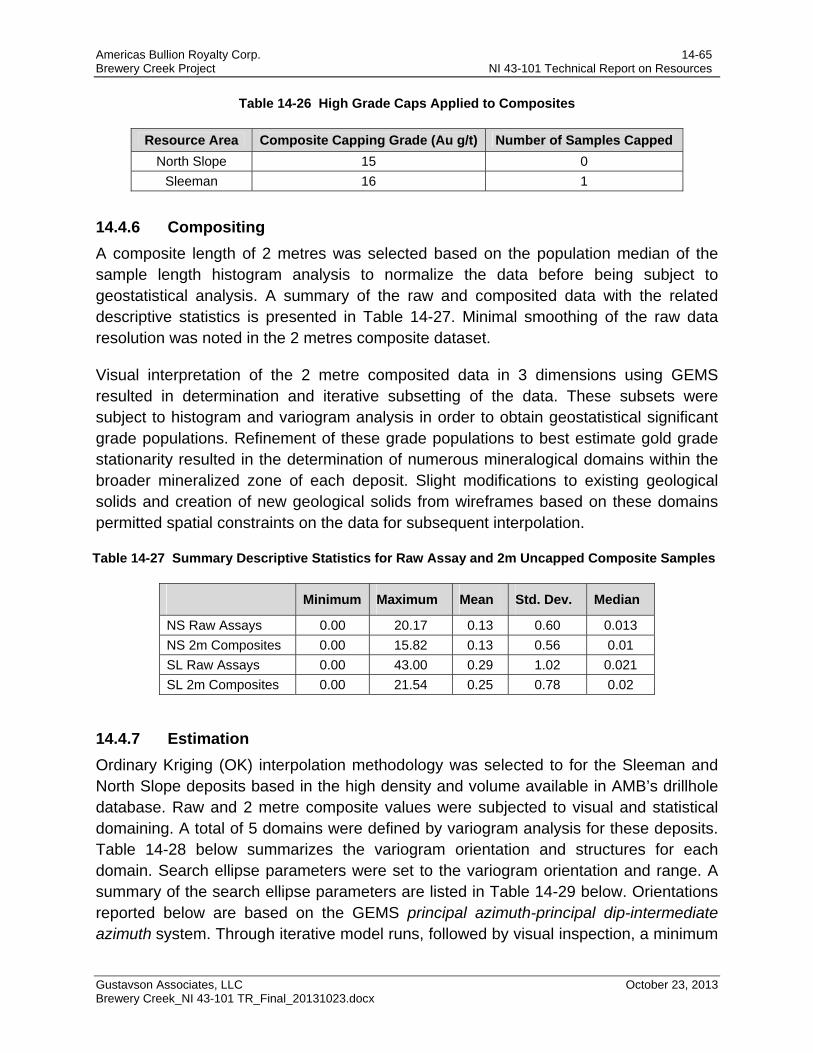
Americas Bullion Royalty Corp. 14-65 Brewery Creek Project NI 43-101 Technical Report on Resources
Gustavson Associates, LLC October 23, 2013 Brewery Creek_NI 43-101 TR_Final_20131023.docx
Table 14-26 High Grade Caps Applied to Composites
Resource Area Composite Capping Grade (Au g/t) Number of Samples Capped
North Slope 15 0
Sleeman 16 1
14.4.6 Compositing
A composite length of 2 metres was selected based on the population median of the sample length histogram analysis to normalize the data before being subject to geostatistical analysis. A summary of the raw and composited data with the related descriptive statistics is presented in Table 14-27. Minimal smoothing of the raw data resolution was noted in the 2 metres composite dataset.
Visual interpretation of the 2 metre composited data in 3 dimensions using GEMS resulted in determination and iterative subsetting of the data. These subsets were subject to histogram and variogram analysis in order to obtain geostatistical significant grade populations. Refinement of these grade populations to best estimate gold grade stationarity resulted in the determination of numerous mineralogical domains within the broader mineralized zone of each deposit. Slight modifications to existing geological solids and creation of new geological solids from wireframes based on these domains permitted spatial constraints on the data for subsequent interpolation.
Table 14-27 Summary Descriptive Statistics for Raw Assay and 2m Uncapped Composite Samples
Minimum Maximum Mean Std. Dev. Median
NS Raw Assays 0.00 20.17 0.13 0.60 0.013
NS 2m Composites 0.00 15.82 0.13 0.56 0.01
SL Raw Assays 0.00 43.00 0.29 1.02 0.021
SL 2m Composites 0.00 21.54 0.25 0.78 0.02
14.4.7 Estimation
Ordinary Kriging (OK) interpolation methodology was selected to for the Sleeman and North Slope deposits based in the high density and volume available in AMB’s drillhole database. Raw and 2 metre composite values were subjected to visual and statistical domaining. A total of 5 domains were defined by variogram analysis for these deposits. Table 14-28 below summarizes the variogram orientation and structures for each domain. Search ellipse parameters were set to the variogram orientation and range. A summary of the search ellipse parameters are listed in Table 14-29 below. Orientations reported below are based on the GEMS principal azimuth-principal dip-intermediate azimuth system. Through iterative model runs, followed by visual inspection, a minimum
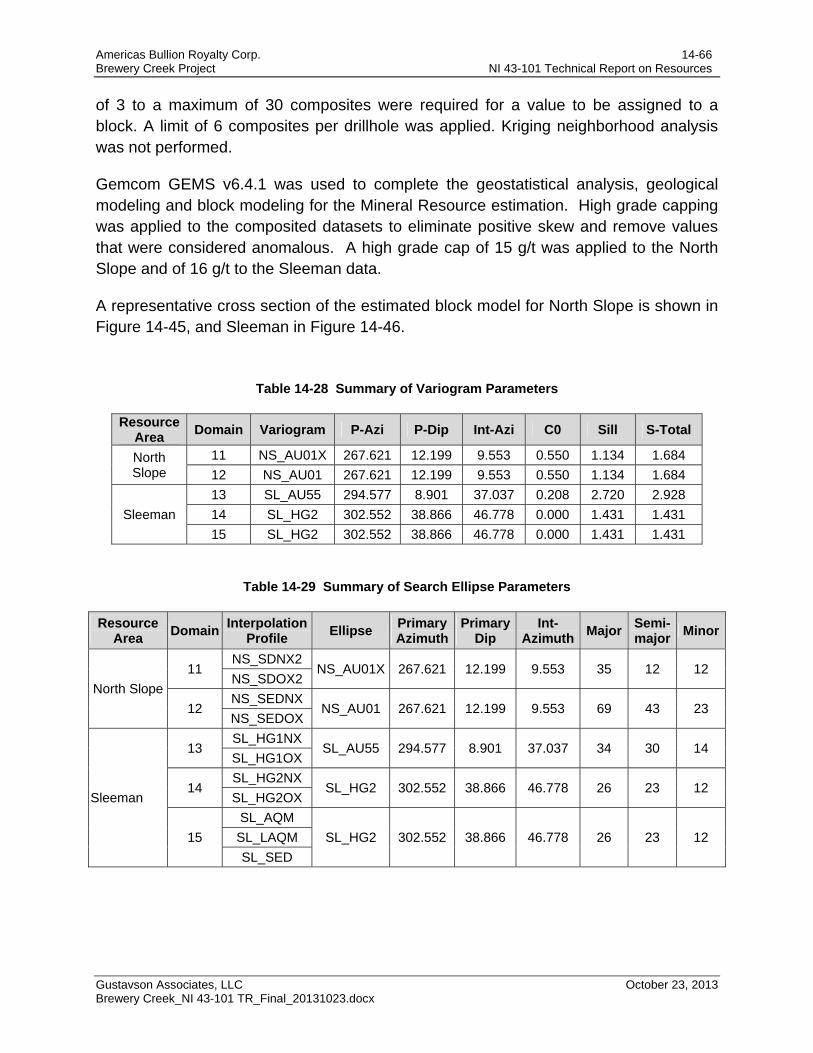
Americas Bullion Royalty Corp. 14-66 Brewery Creek Project NI 43-101 Technical Report on Resources
Gustavson Associates, LLC October 23, 2013 Brewery Creek_NI 43-101 TR_Final_20131023.docx
of 3 to a maximum of 30 composites were required for a value to be assigned to a block. A limit of 6 composites per drillhole was applied. Kriging neighborhood analysis was not performed.
Gemcom GEMS v6.4.1 was used to complete the geostatistical analysis, geological modeling and block modeling for the Mineral Resource estimation. High grade capping was applied to the composited datasets to eliminate positive skew and remove values that were considered anomalous. A high grade cap of 15 g/t was applied to the North Slope and of 16 g/t to the Sleeman data.
A representative cross section of the estimated block model for North Slope is shown in Figure 14-45, and Sleeman in Figure 14-46.
Table 14-28 Summary of Variogram Parameters
Resource Area
Domain Variogram P-Azi P-Dip Int-Azi C0 Sill S-Total
North Slope
11 NS_AU01X 267.621 12.199 9.553 0.550 1.134 1.684
12 NS_AU01 267.621 12.199 9.553 0.550 1.134 1.684
Sleeman
13 SL_AU55 294.577 8.901 37.037 0.208 2.720 2.928
14 SL_HG2 302.552 38.866 46.778 0.000 1.431 1.431
15 SL_HG2 302.552 38.866 46.778 0.000 1.431 1.431
Table 14-29 Summary of Search Ellipse Parameters
Resource Area
Domain Interpolation
Profile Ellipse
Primary Azimuth
Primary Dip
Int-Azimuth
Major Semi-major
Minor
North Slope
11 NS_SDNX2
NS_AU01X 267.621 12.199 9.553 35 12 12 NS_SDOX2
12 NS_SEDNX
NS_AU01 267.621 12.199 9.553 69 43 23 NS_SEDOX
Sleeman
13 SL_HG1NX
SL_AU55 294.577 8.901 37.037 34 30 14 SL_HG1OX
14 SL_HG2NX
SL_HG2 302.552 38.866 46.778 26 23 12 SL_HG2OX
15
SL_AQM
SL_HG2 302.552 38.866 46.778 26 23 12 SL_LAQM
SL_SED
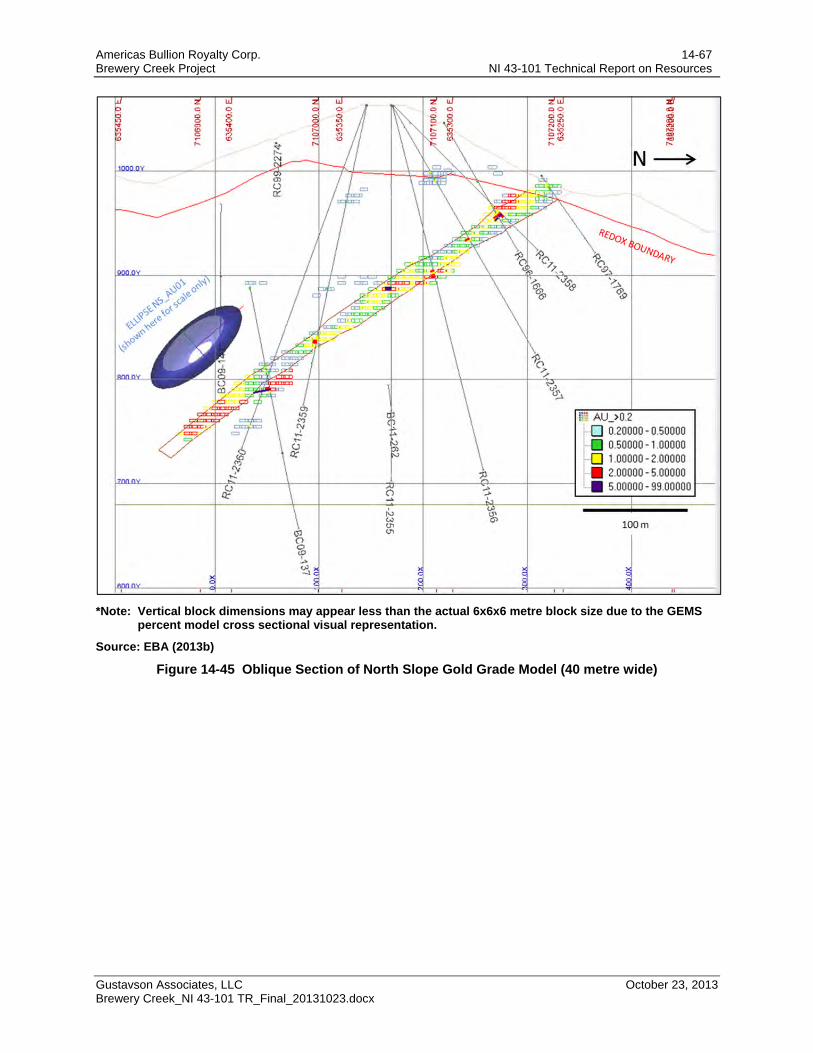
Americas Bullion Royalty Corp. 14-67 Brewery Creek Project NI 43-101 Technical Report on Resources
Gustavson Associates, LLC October 23, 2013 Brewery Creek_NI 43-101 TR_Final_20131023.docx
*Note: Vertical block dimensions may appear less than the actual 6x6x6 metre block size due to the GEMS percent model cross sectional visual representation.
Source: EBA (2013b)
Figure 14-45 Oblique Section of North Slope Gold Grade Model (40 metre wide)
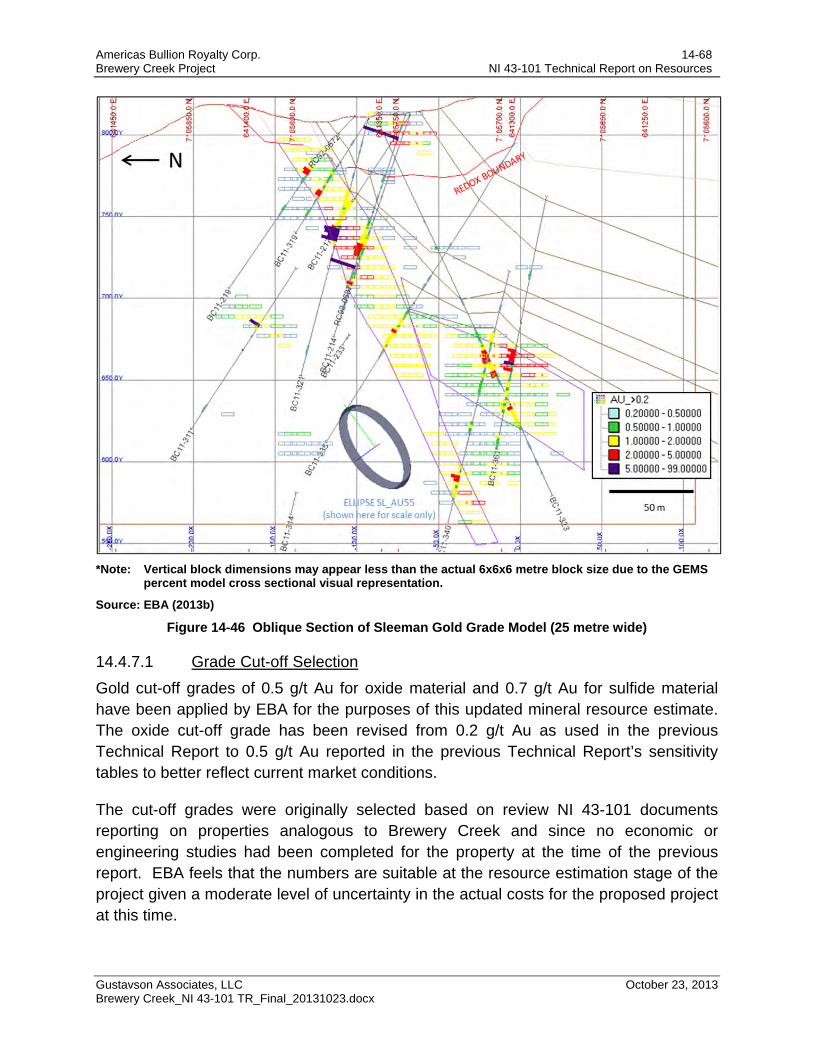
Americas Bullion Royalty Corp. 14-68 Brewery Creek Project NI 43-101 Technical Report on Resources
Gustavson Associates, LLC October 23, 2013 Brewery Creek_NI 43-101 TR_Final_20131023.docx
*Note: Vertical block dimensions may appear less than the actual 6x6x6 metre block size due to the GEMS percent model cross sectional visual representation.
Source: EBA (2013b)
Figure 14-46 Oblique Section of Sleeman Gold Grade Model (25 metre wide)
14.4.7.1 Grade Cut-off Selection
Gold cut-off grades of 0.5 g/t Au for oxide material and 0.7 g/t Au for sulfide material have been applied by EBA for the purposes of this updated mineral resource estimate. The oxide cut-off grade has been revised from 0.2 g/t Au as used in the previous Technical Report to 0.5 g/t Au reported in the previous Technical Report’s sensitivity tables to better reflect current market conditions.
The cut-off grades were originally selected based on review NI 43-101 documents reporting on properties analogous to Brewery Creek and since no economic or engineering studies had been completed for the property at the time of the previous report. EBA feels that the numbers are suitable at the resource estimation stage of the project given a moderate level of uncertainty in the actual costs for the proposed project at this time.
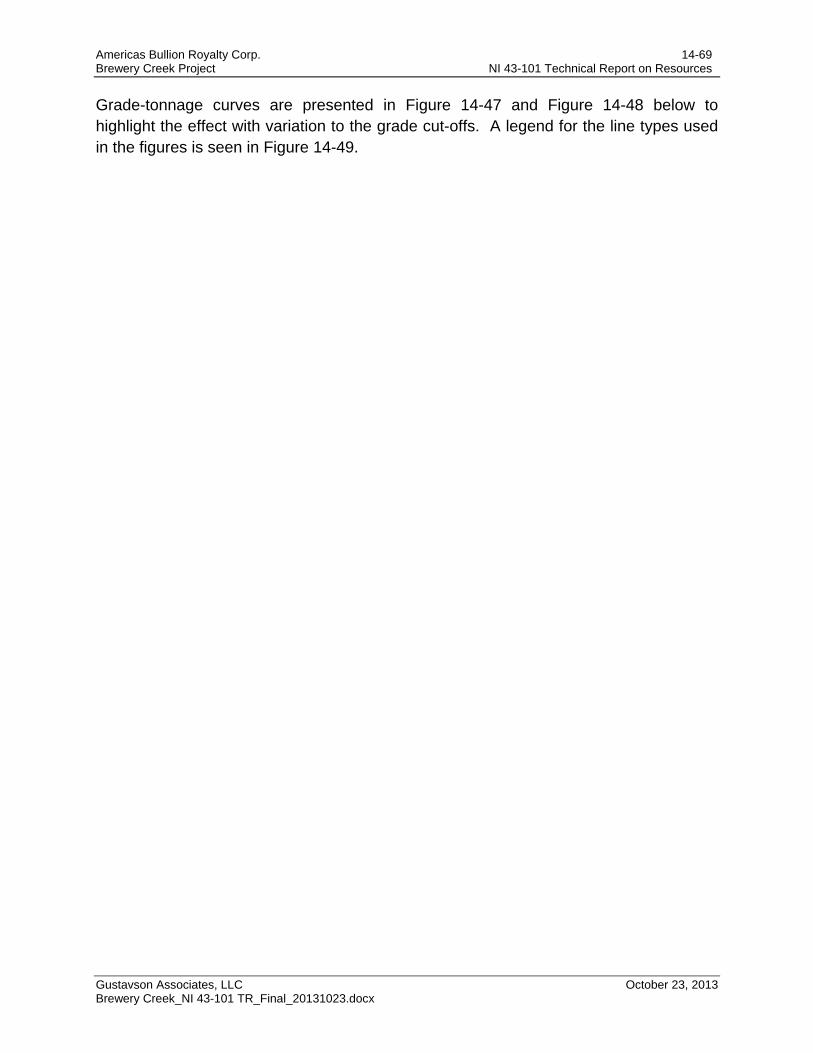
Americas Bullion Royalty Corp. 14-69 Brewery Creek Project NI 43-101 Technical Report on Resources
Gustavson Associates, LLC October 23, 2013 Brewery Creek_NI 43-101 TR_Final_20131023.docx
Grade-tonnage curves are presented in Figure 14-47 and Figure 14-48 below to highlight the effect with variation to the grade cut-offs. A legend for the line types used in the figures is seen in Figure 14-49.
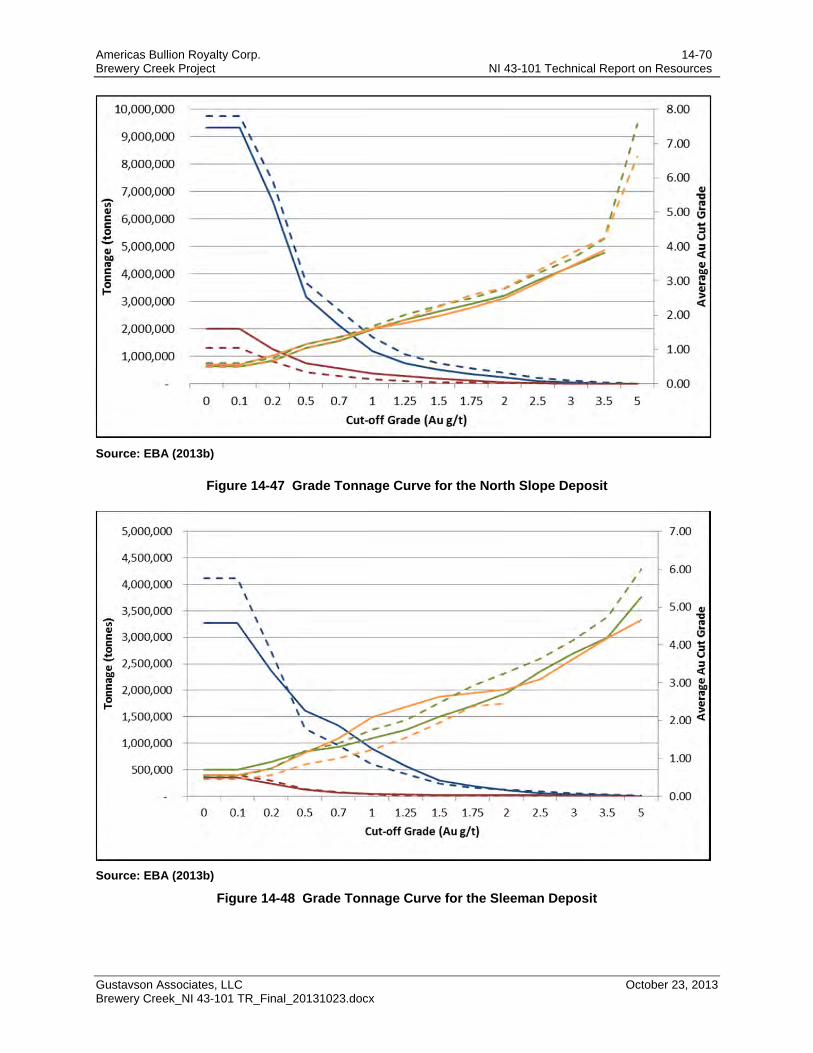
Americas Bullion Royalty Corp. 14-70 Brewery Creek Project NI 43-101 Technical Report on Resources
Gustavson Associates, LLC October 23, 2013 Brewery Creek_NI 43-101 TR_Final_20131023.docx
Source: EBA (2013b)
Figure 14-47 Grade Tonnage Curve for the North Slope Deposit
Source: EBA (2013b)
Figure 14-48 Grade Tonnage Curve for the Sleeman Deposit
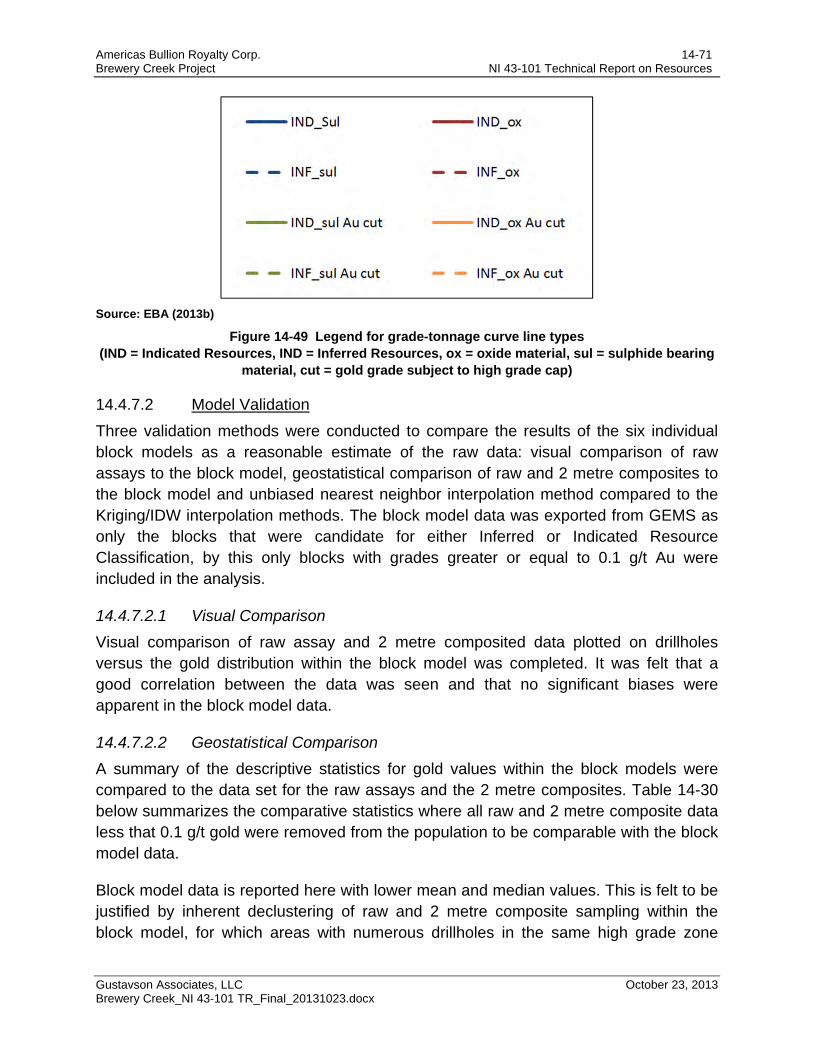
Americas Bullion Royalty Corp. 14-71 Brewery Creek Project NI 43-101 Technical Report on Resources
Gustavson Associates, LLC October 23, 2013 Brewery Creek_NI 43-101 TR_Final_20131023.docx
Source: EBA (2013b)
Figure 14-49 Legend for grade-tonnage curve line types (IND = Indicated Resources, IND = Inferred Resources, ox = oxide material, sul = sulphide bearing
material, cut = gold grade subject to high grade cap)
14.4.7.2 Model Validation
Three validation methods were conducted to compare the results of the six individual block models as a reasonable estimate of the raw data: visual comparison of raw assays to the block model, geostatistical comparison of raw and 2 metre composites to the block model and unbiased nearest neighbor interpolation method compared to the Kriging/IDW interpolation methods. The block model data was exported from GEMS as only the blocks that were candidate for either Inferred or Indicated Resource Classification, by this only blocks with grades greater or equal to 0.1 g/t Au were included in the analysis.
14.4.7.2.1 Visual Comparison
Visual comparison of raw assay and 2 metre composited data plotted on drillholes versus the gold distribution within the block model was completed. It was felt that a good correlation between the data was seen and that no significant biases were apparent in the block model data.
14.4.7.2.2 Geostatistical Comparison
A summary of the descriptive statistics for gold values within the block models were compared to the data set for the raw assays and the 2 metre composites. Table 14-30 below summarizes the comparative statistics where all raw and 2 metre composite data less that 0.1 g/t gold were removed from the population to be comparable with the block model data.
Block model data is reported here with lower mean and median values. This is felt to be justified by inherent declustering of raw and 2 metre composite sampling within the block model, for which areas with numerous drillholes in the same high grade zone
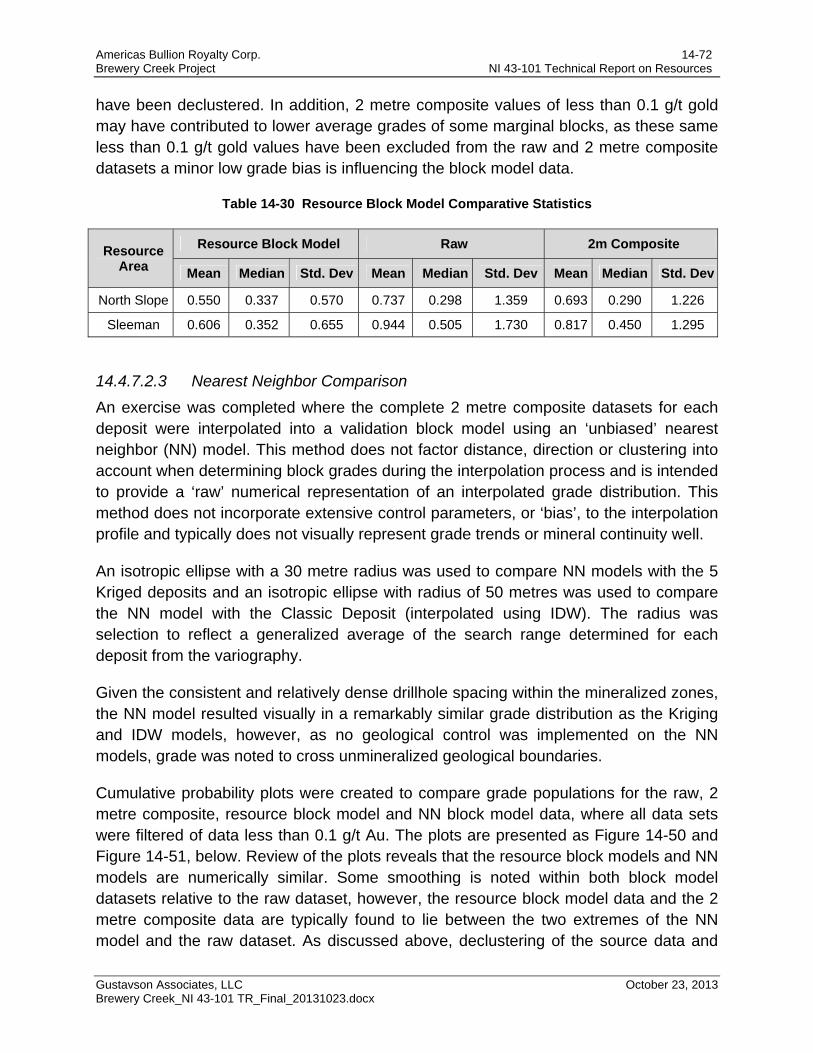
Americas Bullion Royalty Corp. 14-72 Brewery Creek Project NI 43-101 Technical Report on Resources
Gustavson Associates, LLC October 23, 2013 Brewery Creek_NI 43-101 TR_Final_20131023.docx
have been declustered. In addition, 2 metre composite values of less than 0.1 g/t gold may have contributed to lower average grades of some marginal blocks, as these same less than 0.1 g/t gold values have been excluded from the raw and 2 metre composite datasets a minor low grade bias is influencing the block model data.
Table 14-30 Resource Block Model Comparative Statistics
Resource Area
Resource Block Model Raw 2m Composite
Mean Median Std. Dev Mean Median Std. Dev Mean Median Std. Dev
North Slope 0.550 0.337 0.570 0.737 0.298 1.359 0.693 0.290 1.226
Sleeman 0.606 0.352 0.655 0.944 0.505 1.730 0.817 0.450 1.295
14.4.7.2.3 Nearest Neighbor Comparison
An exercise was completed where the complete 2 metre composite datasets for each deposit were interpolated into a validation block model using an ‘unbiased’ nearest neighbor (NN) model. This method does not factor distance, direction or clustering into account when determining block grades during the interpolation process and is intended to provide a ‘raw’ numerical representation of an interpolated grade distribution. This method does not incorporate extensive control parameters, or ‘bias’, to the interpolation profile and typically does not visually represent grade trends or mineral continuity well.
An isotropic ellipse with a 30 metre radius was used to compare NN models with the 5 Kriged deposits and an isotropic ellipse with radius of 50 metres was used to compare the NN model with the Classic Deposit (interpolated using IDW). The radius was selection to reflect a generalized average of the search range determined for each deposit from the variography.
Given the consistent and relatively dense drillhole spacing within the mineralized zones, the NN model resulted visually in a remarkably similar grade distribution as the Kriging and IDW models, however, as no geological control was implemented on the NN models, grade was noted to cross unmineralized geological boundaries.
Cumulative probability plots were created to compare grade populations for the raw, 2 metre composite, resource block model and NN block model data, where all data sets were filtered of data less than 0.1 g/t Au. The plots are presented as Figure 14-50 and Figure 14-51, below. Review of the plots reveals that the resource block models and NN models are numerically similar. Some smoothing is noted within both block model datasets relative to the raw dataset, however, the resource block model data and the 2 metre composite data are typically found to lie between the two extremes of the NN model and the raw dataset. As discussed above, declustering of the source data and
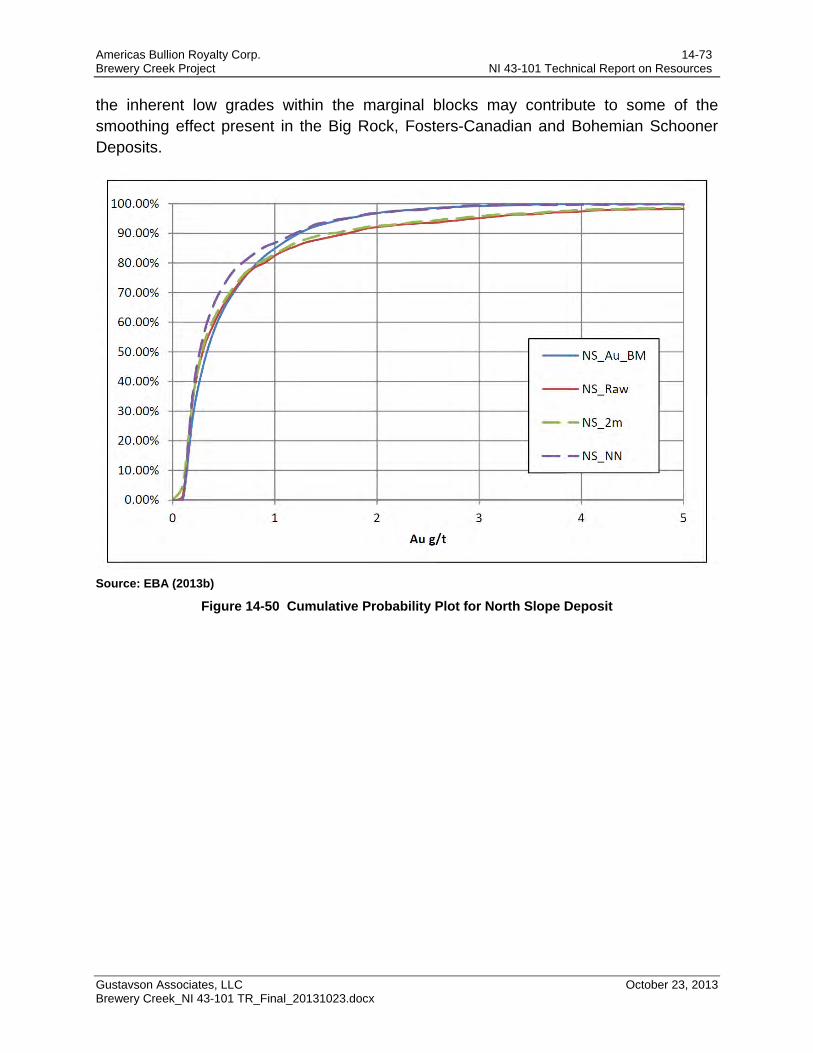
Americas Bullion Royalty Corp. 14-73 Brewery Creek Project NI 43-101 Technical Report on Resources
Gustavson Associates, LLC October 23, 2013 Brewery Creek_NI 43-101 TR_Final_20131023.docx
the inherent low grades within the marginal blocks may contribute to some of the smoothing effect present in the Big Rock, Fosters-Canadian and Bohemian Schooner Deposits.
Source: EBA (2013b)
Figure 14-50 Cumulative Probability Plot for North Slope Deposit
Americas Bullion Royalty Corp. 14-74 Brewery Creek Project NI 43-101 Technical Report on Resources
Gustavson Associates, LLC October 23, 2013 Brewery Creek_NI 43-101 TR_Final_20131023.docx
Source: EBA (2013b)
Figure 14-51 Cumulative Probability Plot for Sleeman Deposit
14.5 Mineral Resource Classification
14.5.1 Kokanee, Golden, Pacific, Blue, and Lucky Deposits
The estimated block grades were classified into Indicated and Inferred categories. For the Kokanee, Golden, Pacific, Blue, and Lucky deposits oxide blocks that were estimated by two or more drillholes with the closest hole within 25m were classified as Indicated Resources. Also, blocks in KOGD and PABL that were estimated by a single drillhole within 15 metres of the nearest drillhole, and blocks in LU that were estimated by a single drillhole within 7.5 metres of the nearest drillhole were classified as Indicated Resources. All other estimated oxide blocks were classified as Inferred. Oxide blocks were reported inside a $1250 Au LG pit. The parameters for pit construction are listed in Table 14-31. These pit parameters were used to construct a base case Au cutoff grade for resource reporting, as noted in Equation 3. All sulfide blocks were classified as Inferred. No Measured Mineral Resources have been defined within the current Mineral Resource Estimate.
Americas Bullion Royalty Corp. 14-75 Brewery Creek Project NI 43-101 Technical Report on Resources
Gustavson Associates, LLC October 23, 2013 Brewery Creek_NI 43-101 TR_Final_20131023.docx
14.5.2 Bohemian, Schooner, Lower Fosters, West Big Rock, East Big Rock, Classic, and Lone Star Deposits
The estimated block grades were classified into Indicated and Inferred categories. For the Bohemian, Schooner, Lower Fosters, West Big Rock, and East Big Rock deposits oxide blocks that were estimated by two or more drillholes with the closest hole within 25m were classified as Indicated Resources. Blocks estimated by a single drillhole within 12.5m were also classified as Indicated Resources. All other estimated oxide blocks were classified as Inferred. Oxide blocks in the above areas were reported inside a $1250 Au LG pit. The parameters for pit construction are listed in Table 14-31. These pit parameters were used to construct a base case Au cutoff grade for resource reporting, as noted in Equation 3. All sulfide blocks were classified as Inferred. Blocks were considered as Inferred Resources for the Classic and Lone Star deposits if they were estimated by three or more drillholes with the closest hole located within 50 metres or two or more holes with the closest within 37.5 metres or 1 hole within 25 metres. No Measured Mineral Resources have been defined within the current Mineral Resource Estimate.
14.5.3 Historical Heap Leach Pad
Indicated Resources were confined to the base of the sampled sonic drillholes upward to the existing heap surface. All material below the base of the assayed sonic holes to a surface located 3 metres above the heap leach liner was classified as Inferred Resources. The lower portion of the existing heap leach pad was placed into the Inferred category primarily due to a lack of sonic drillhole assays from the lower levels of the pad, and to provide a conservative buffer zone to protect the liner from being breached. The base case Au cutoff was calculated based on assuming a $1250/oz Au price, and a 45% recovery.
14.5.4 North Slope and Sleeman Deposits
An Inferred classification has been applied to target marginal and outlier blocks in the block models, which suggest presence and continuity of mineralization but lack the density of data for confirmation. Inferred blocks lie within the maximum variogram range, are associated with one or more drillholes, exist on the outer extremities of the principal mineralized body, have at least 3 composite samples reporting within the search ellipse and contain partial block grades of greater than or equal to 0.1 g/t Au. An Indicated classification has been applied to block models to target portions of the mineralized body where data density confirms the presence and continuity of mineralization with a moderate level of confidence. Indicated blocks lie within 25 metres of the closest reporting composite, have a minimum of 8 composites reporting within the search ellipse from a minimum of 2 drillholes and contain partial block grades of greater than or equal to 0.1 g/t Au. These minimum criteria were selected based on visual
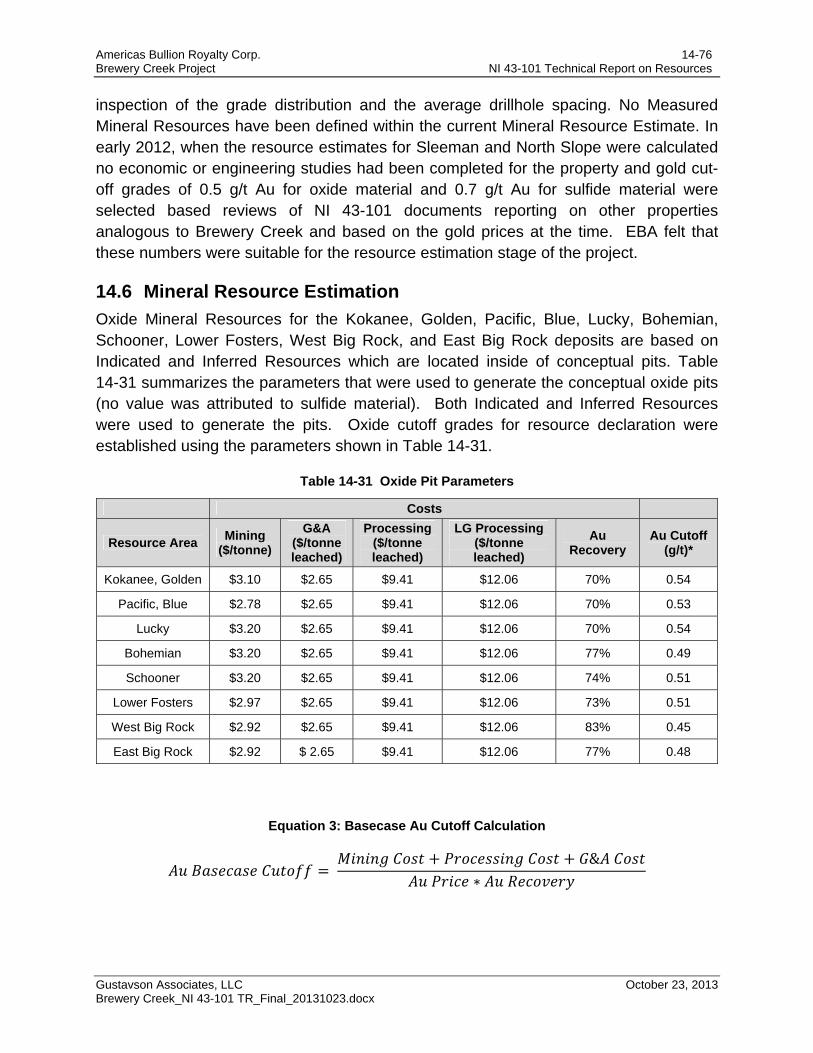
Americas Bullion Royalty Corp. 14-76 Brewery Creek Project NI 43-101 Technical Report on Resources
Gustavson Associates, LLC October 23, 2013 Brewery Creek_NI 43-101 TR_Final_20131023.docx
inspection of the grade distribution and the average drillhole spacing. No Measured Mineral Resources have been defined within the current Mineral Resource Estimate. In early 2012, when the resource estimates for Sleeman and North Slope were calculated no economic or engineering studies had been completed for the property and gold cut-off grades of 0.5 g/t Au for oxide material and 0.7 g/t Au for sulfide material were selected based reviews of NI 43-101 documents reporting on other properties analogous to Brewery Creek and based on the gold prices at the time. EBA felt that these numbers were suitable for the resource estimation stage of the project.
14.6 Mineral Resource Estimation
Oxide Mineral Resources for the Kokanee, Golden, Pacific, Blue, Lucky, Bohemian, Schooner, Lower Fosters, West Big Rock, and East Big Rock deposits are based on Indicated and Inferred Resources which are located inside of conceptual pits. Table 14-31 summarizes the parameters that were used to generate the conceptual oxide pits (no value was attributed to sulfide material). Both Indicated and Inferred Resources were used to generate the pits. Oxide cutoff grades for resource declaration were established using the parameters shown in Table 14-31.
Table 14-31 Oxide Pit Parameters
Costs
Resource Area Mining
($/tonne)
G&A ($/tonne leached)
Processing ($/tonne leached)
LG Processing ($/tonne leached)
Au Recovery
Au Cutoff (g/t)*
Kokanee, Golden $3.10 $2.65 $9.41 $12.06 70% 0.54
Pacific, Blue $2.78 $2.65 $9.41 $12.06 70% 0.53
Lucky $3.20 $2.65 $9.41 $12.06 70% 0.54
Bohemian $3.20 $2.65 $9.41 $12.06 77% 0.49
Schooner $3.20 $2.65 $9.41 $12.06 74% 0.51
Lower Fosters $2.97 $2.65 $9.41 $12.06 73% 0.51
West Big Rock $2.92 $2.65 $9.41 $12.06 83% 0.45
East Big Rock $2.92 $ 2.65 $9.41 $12.06 77% 0.48
Equation 3: Basecase Au Cutoff Calculation
&
∗
Americas Bullion Royalty Corp. 14-77 Brewery Creek Project NI 43-101 Technical Report on Resources
Gustavson Associates, LLC October 23, 2013 Brewery Creek_NI 43-101 TR_Final_20131023.docx
All mineral resource estimates are summarized in Table 14-32. Gustavson knows of no environmental, permitting, legal, title, taxation, socio-economic, marketing, political, or other factors that could materially affect the mineral resource.
Mineral resources are not mineral reserves and do not demonstrate economic viability. The quantity and grade of inferred resources reported herein are uncertain in nature and exploration completed to date is insufficient to define these Mineral Resources as indicated or measured. There is no guarantee that further exploration will result in the inferred Mineral Resources being upgraded to an indicated or measured mineral resource category. There is no certainty that all or any part of the mineral resource will be converted to mineral reserves. Mineral Resources are not mineral reserves and may be materially affected by environmental, permitting, legal, socio-economic, marketing, political, or other factors. Quantity and grade are estimates and are rounded to reflect the fact that the resource estimate is an approximation.
The effective date of this Mineral Resources is June 1st, 2013.
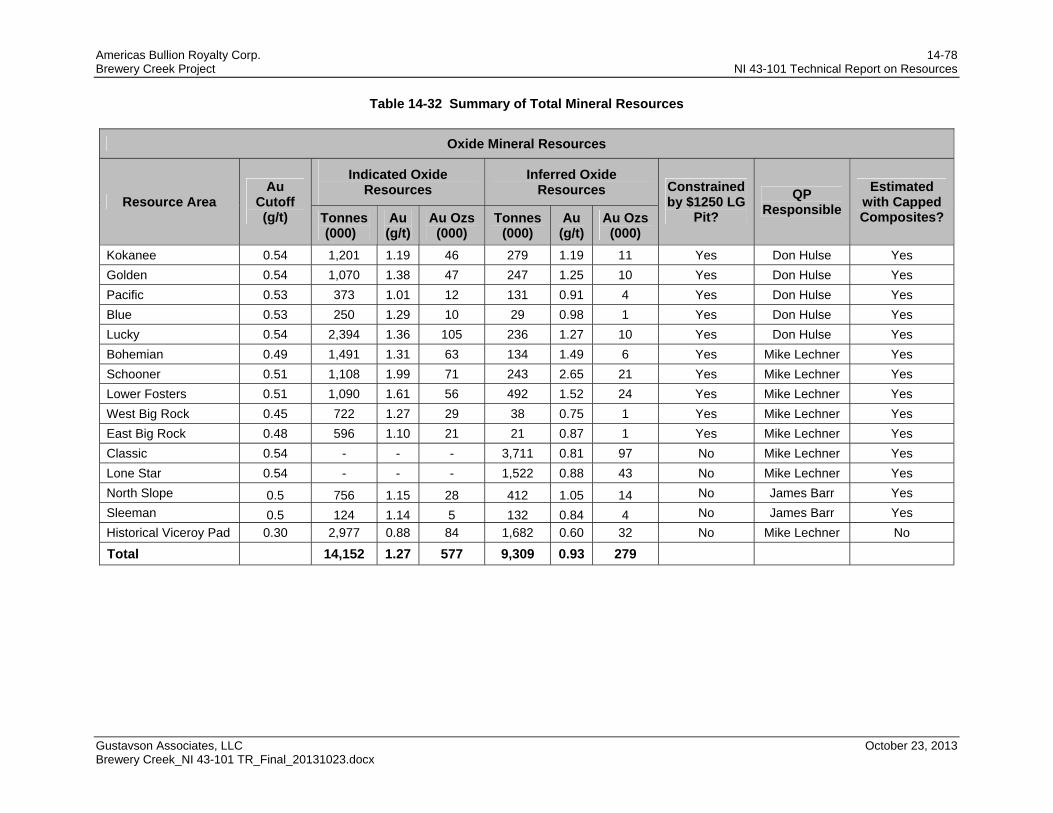
Americas Bullion Royalty Corp. 14-78 Brewery Creek Project NI 43-101 Technical Report on Resources
Gustavson Associates, LLC October 23, 2013 Brewery Creek_NI 43-101 TR_Final_20131023.docx
Table 14-32 Summary of Total Mineral Resources
Oxide Mineral Resources
Resource Area Au
Cutoff (g/t)
Indicated Oxide Resources
Inferred Oxide Resources Constrained
by $1250 LG Pit?
QP Responsible
Estimated with Capped Composites? Tonnes
(000) Au (g/t)
Au Ozs (000)
Tonnes (000)
Au (g/t)
Au Ozs (000)
Kokanee 0.54 1,201 1.19 46 279 1.19 11 Yes Don Hulse Yes
Golden 0.54 1,070 1.38 47 247 1.25 10 Yes Don Hulse Yes
Pacific 0.53 373 1.01 12 131 0.91 4 Yes Don Hulse Yes
Blue 0.53 250 1.29 10 29 0.98 1 Yes Don Hulse Yes
Lucky 0.54 2,394 1.36 105 236 1.27 10 Yes Don Hulse Yes
Bohemian 0.49 1,491 1.31 63 134 1.49 6 Yes Mike Lechner Yes
Schooner 0.51 1,108 1.99 71 243 2.65 21 Yes Mike Lechner Yes
Lower Fosters 0.51 1,090 1.61 56 492 1.52 24 Yes Mike Lechner Yes
West Big Rock 0.45 722 1.27 29 38 0.75 1 Yes Mike Lechner Yes
East Big Rock 0.48 596 1.10 21 21 0.87 1 Yes Mike Lechner Yes
Classic 0.54 - - - 3,711 0.81 97 No Mike Lechner Yes
Lone Star 0.54 - - - 1,522 0.88 43 No Mike Lechner Yes
North Slope 0.5 756 1.15 28 412 1.05 14 No James Barr Yes
Sleeman 0.5 124 1.14 5 132 0.84 4 No James Barr Yes
Historical Viceroy Pad 0.30 2,977 0.88 84 1,682 0.60 32 No Mike Lechner No
Total 14,152 1.27 577 9,309 0.93 279
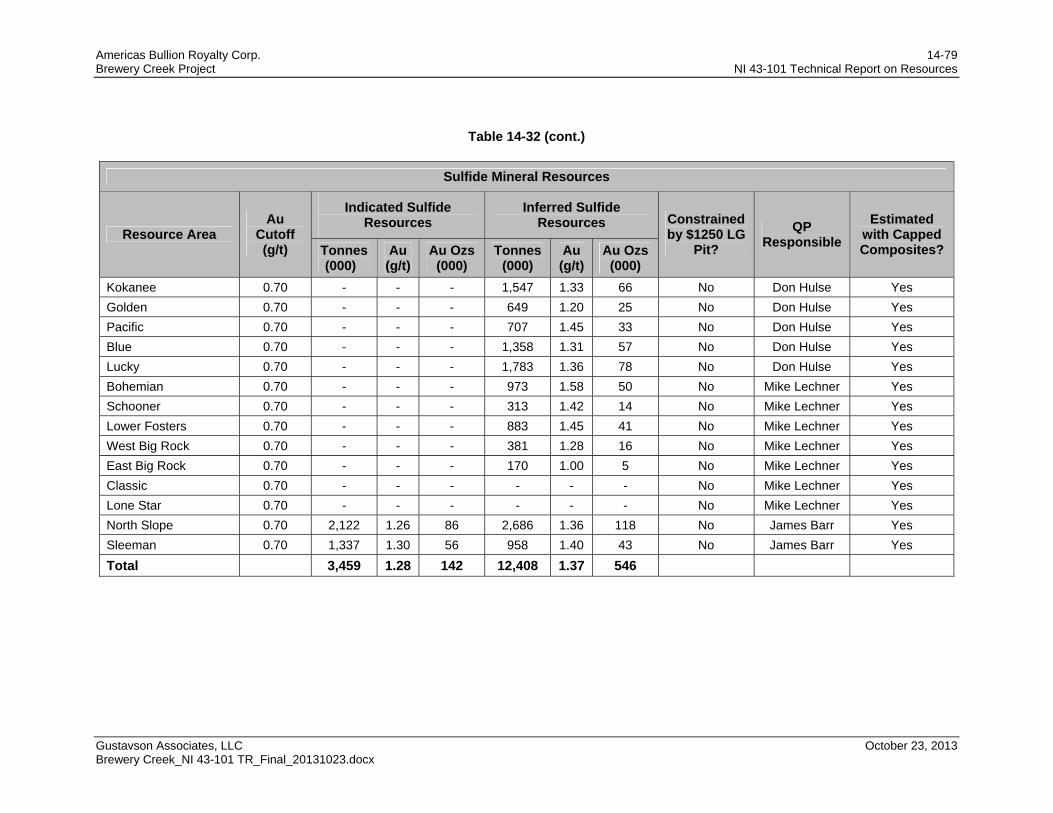
Americas Bullion Royalty Corp. 14-79 Brewery Creek Project NI 43-101 Technical Report on Resources
Gustavson Associates, LLC October 23, 2013 Brewery Creek_NI 43-101 TR_Final_20131023.docx
Table 14-32 (cont.)
Sulfide Mineral Resources
Resource Area Au
Cutoff (g/t)
Indicated Sulfide Resources
Inferred Sulfide Resources Constrained
by $1250 LG Pit?
QP Responsible
Estimated with Capped Composites? Tonnes
(000) Au (g/t)
Au Ozs (000)
Tonnes (000)
Au (g/t)
Au Ozs (000)
Kokanee 0.70 - - - 1,547 1.33 66 No Don Hulse Yes
Golden 0.70 - - - 649 1.20 25 No Don Hulse Yes
Pacific 0.70 - - - 707 1.45 33 No Don Hulse Yes
Blue 0.70 - - - 1,358 1.31 57 No Don Hulse Yes
Lucky 0.70 - - - 1,783 1.36 78 No Don Hulse Yes
Bohemian 0.70 - - - 973 1.58 50 No Mike Lechner Yes
Schooner 0.70 - - - 313 1.42 14 No Mike Lechner Yes
Lower Fosters 0.70 - - - 883 1.45 41 No Mike Lechner Yes
West Big Rock 0.70 - - - 381 1.28 16 No Mike Lechner Yes
East Big Rock 0.70 - - - 170 1.00 5 No Mike Lechner Yes
Classic 0.70 - - - - - - No Mike Lechner Yes
Lone Star 0.70 - - - - - - No Mike Lechner Yes
North Slope 0.70 2,122 1.26 86 2,686 1.36 118 No James Barr Yes
Sleeman 0.70 1,337 1.30 56 958 1.40 43 No James Barr Yes
Total 3,459 1.28 142 12,408 1.37 546
Americas Bullion Royalty Corp. 15-1 Brewery Creek Project NI 43-101 Technical Report on Resources
Gustavson Associates, LLC October 23, 2013 Brewery Creek_NI 43-101 TR_Final_20131023.docx
15 Adjacent Properties (Item 23) There are no mining properties adjacent to the Brewery Creek property.
Americas Bullion Royalty Corp. 16-1 Brewery Creek Project NI 43-101 Technical Report on Resources
Gustavson Associates, LLC October 23, 2013 Brewery Creek_NI 43-101 TR_Final_20131023.docx
16 Other Relevant Data and Information (Item 24) Other relevant data and information is contained throughout this report.
Americas Bullion Royalty Corp. 17-1 Brewery Creek Project NI 43-101 Technical Report on Resources
Gustavson Associates, LLC October 23, 2013 Brewery Creek_NI 43-101 TR_Final_20131023.docx
17 Interpretation and Conclusions (Item 25)
It is Gustavson’s conclusion from review of the information provided in this report that the Brewery Creek Project has merit and warrants continuing development.
17.1 Results
Exploration on the Project is advanced and has involved drilling, soil sampling and geophysical surveying. These exploration results guided drilling activities and helped to define the intrusion-related gold mineralization within the Project. Continued observations and exploration will better define the mineralization system and refine how targets are selected. The magnetic survey delineated a magnetic high, likely an intrusive body from the tombstone plutonic suite, in the southwest portion of the project area. Adjacent to this high are abrupt magnetic lows over the reserve trend mineralization. The IP survey identified a resistivity low near the surface which may indicate the location of the structure associated with mineralizing fluid flow.
The mineralization delineated to date consists of fracture-controlled quartz stockwork in siliciclastic and intrusive rocks. Most of the mineralized intrusive sills strike northwesterly and dip relatively shallowly to the southwest. The true thickness of the sills is better determined from recent drilling, as newer holes were drilled at angles approximately perpendicular to the trend of mineralization. The size and extent of each mineralized resource area, as discussed fully in Section 7.5, is summarized here. The Kokanee-Golden resource area mineralization is associated mainly with the quartz monzonite sill complex, with minor mineralization in siltstone and argillite. The Kokanee deposit is ~1100 metres along strike, while the Golden deposit is ~950 metres. The Pacific deposit mineralization is hosted by lower Paleozoic siltstone and is ~500 metres along strike. The Blue deposit mineralization is hosted primarily in quartz monzonite with subordinate mineralization in Paleozoic siltstone. The mineralization trends northeast for ~560 metres along strike. The Lucky resource area mineralization is associated with quartz monzonite and strikes for ~550 metres in a northeast trend. The Bohemian-Schooner resource area mineralization is hosted in mainly in clay-altered quartz monzonite sills, with subordinate mineralization in adjacent siltstone. Bohemian mineralization is ~520 metres along strike, and Schooner mineralization is ~450 metres along strike. Mineralization in the Lower Fosters resource area, part of the Canadian-Fosters complex, is hosted primarily in the limonite-altered quart monzonite and subordinately in sedimentary strata that lie adjacent to the intrusions. The Lower Foster mineralization has a strike length of ~550 metres. The West and East Big Rock resource area mineralization occurs primarily in limonite-altered quartz monzonite sills and subordinately in adjacent siliciclastic sedimentary strata. The Big Rock sills strike 070° azimuth and dip between 40 and 45 degrees southeast and have a drill-defined
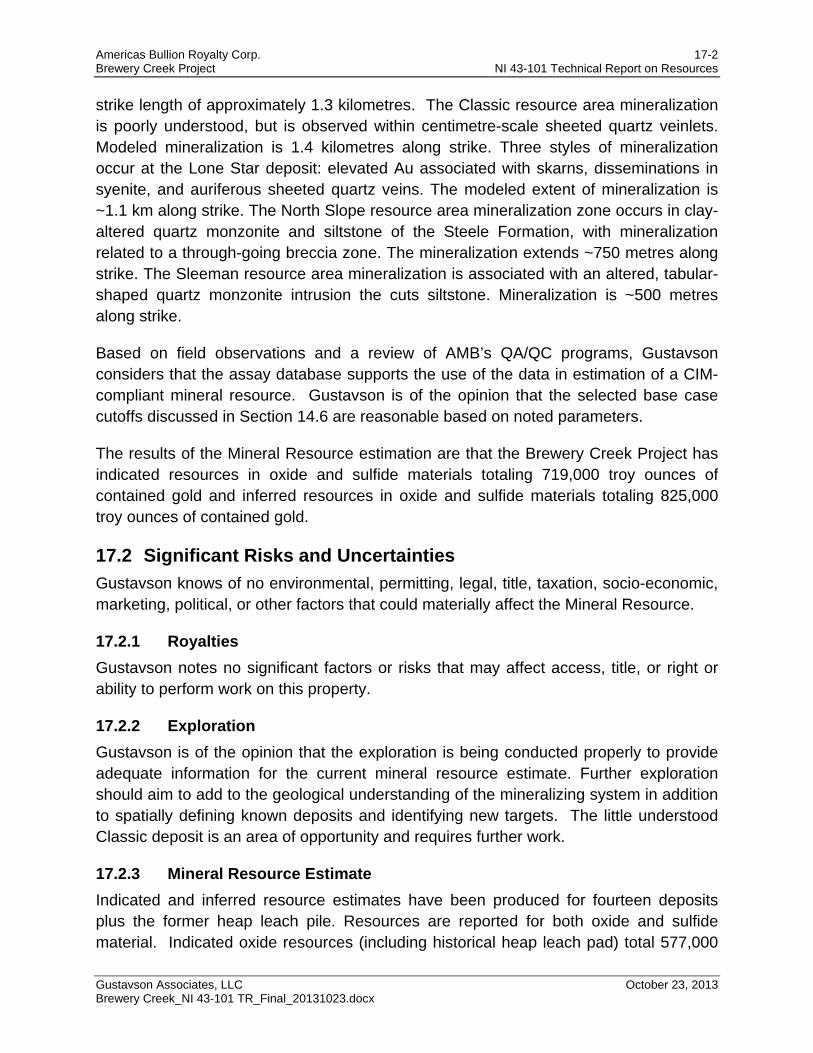
Americas Bullion Royalty Corp. 17-2 Brewery Creek Project NI 43-101 Technical Report on Resources
Gustavson Associates, LLC October 23, 2013 Brewery Creek_NI 43-101 TR_Final_20131023.docx
strike length of approximately 1.3 kilometres. The Classic resource area mineralization is poorly understood, but is observed within centimetre-scale sheeted quartz veinlets. Modeled mineralization is 1.4 kilometres along strike. Three styles of mineralization occur at the Lone Star deposit: elevated Au associated with skarns, disseminations in syenite, and auriferous sheeted quartz veins. The modeled extent of mineralization is ~1.1 km along strike. The North Slope resource area mineralization zone occurs in clay-altered quartz monzonite and siltstone of the Steele Formation, with mineralization related to a through-going breccia zone. The mineralization extends ~750 metres along strike. The Sleeman resource area mineralization is associated with an altered, tabular-shaped quartz monzonite intrusion the cuts siltstone. Mineralization is ~500 metres along strike.
Based on field observations and a review of AMB’s QA/QC programs, Gustavson considers that the assay database supports the use of the data in estimation of a CIM-compliant mineral resource. Gustavson is of the opinion that the selected base case cutoffs discussed in Section 14.6 are reasonable based on noted parameters.
The results of the Mineral Resource estimation are that the Brewery Creek Project has indicated resources in oxide and sulfide materials totaling 719,000 troy ounces of contained gold and inferred resources in oxide and sulfide materials totaling 825,000 troy ounces of contained gold.
17.2 Significant Risks and Uncertainties
Gustavson knows of no environmental, permitting, legal, title, taxation, socio-economic, marketing, political, or other factors that could materially affect the Mineral Resource.
17.2.1 Royalties
Gustavson notes no significant factors or risks that may affect access, title, or right or ability to perform work on this property.
17.2.2 Exploration
Gustavson is of the opinion that the exploration is being conducted properly to provide adequate information for the current mineral resource estimate. Further exploration should aim to add to the geological understanding of the mineralizing system in addition to spatially defining known deposits and identifying new targets. The little understood Classic deposit is an area of opportunity and requires further work.
17.2.3 Mineral Resource Estimate
Indicated and inferred resource estimates have been produced for fourteen deposits plus the former heap leach pile. Resources are reported for both oxide and sulfide material. Indicated oxide resources (including historical heap leach pad) total 577,000
Americas Bullion Royalty Corp. 17-3 Brewery Creek Project NI 43-101 Technical Report on Resources
Gustavson Associates, LLC October 23, 2013 Brewery Creek_NI 43-101 TR_Final_20131023.docx
troy ounces of contained gold in 14,152,000 tonnes of material at 1.27 g/t Au. Inferred oxide resources (including historical heap leach pad) total 279,000 troy ounces of contained gold in 9,309,000 tonnes of material at 0.93 g/t Au. Indicated sulfide resources total 142,000 troy ounces of contained gold in 3,459,000 tonnes of material at 1.28 g/t Au. Inferred sulfide resources total 546,000 troy ounces of contained gold in 12,408,000 tonnes of material at 1.37 g/t Au.
A better understanding of the mineralizing system (intrusive-related versus epithermal) may help to refine modeling methods. As with any mineral resource estimate, there exist both positive and negative opportunities when additional drilling is undertaken.
Americas Bullion Royalty Corp. 18-1 Brewery Creek Project NI 43-101 Technical Report on Resources
Gustavson Associates, LLC October 23, 2013 Brewery Creek_NI 43-101 TR_Final_20131023.docx
18 Recommendations (Item 26) Gustavson recommends a two-stage ongoing program for the Brewery Creek Project. In the first stage, exploration drilling should continue, particularly targeting the deeper portions of known deposits and closing up drill spacing to potentially upgrade inferred to indicated resources. In the second stage, additional engineering studies and an economic analysis should be completed, leading to finalization of the preliminary feasibility study and subsequent publication of a technical report inclusive of reserves.
18.1 Recommended Work Programs
Exploration Program: $2,240,000
An additional 10,000 metres of drilling is recommended at Lone Star and Classic to close up spacing and further test deeper parts of the system. This drilling could potentially result in upgrading these two resources from inferred to indicated status. Estimated cost of drilling, assaying, and project support is estimated to be $2,000,000. Metallurgical holes, totaling approximately 1200 metres of PQ core, are recommended to be drilled at Lucky, Kokanee and Golden for an additional direct drilling cost of approximately $240,000. This will better define the metallurgical characteristics of these resource areas.
Engineering Program: $625,000
As the Exploration Phase delineates further resources, the results will be fed into an Engineering Program. The existing engineering studies should be updated and refined into a prefeasibility level report. The primary task of updating of existing studies will be to incorporate all the resource areas with potentially minable oxide material into a comprehensive mine plan and schedule. Estimated cost is $150,000.
PQ core drilled during the Exploration Program should undergo metallurgical testing. Estimated cost of metallurgical testing and reporting on the PQ core is $225,000.
Updating of potential waste rock disposal sites and accompanying geotechnical investigations to accommodate new resource areas. Estimated cost $150,000.
An economic analysis should be completed, leading to finalization of the preliminary feasibility study and subsequent publication of a technical report inclusive of reserves. Estimated costs are $100,000.

Americas Bullion Royalty Corp. 18-2 Brewery Creek Project NI 43-101 Technical Report on Resources
Gustavson Associates, LLC October 23, 2013 Brewery Creek_NI 43-101 TR_Final_20131023.docx
18.1.2 Costs
The following are the estimated costs of recommended work.
Exploration: $2,240,000
Complete engineering studies into PFS level $ 625,000
Total: $2,865,000
Americas Bullion Royalty Corp. 19-1 Brewery Creek Project NI 43-101 Technical Report on Resources
Gustavson Associates, LLC October 23, 2013 Brewery Creek_NI 43-101 TR_Final_20131023.docx
19 References
Access, 2010. From Assessment and Permitting through Production to Post Closure: A Post Closure Analysis of a Northern Heap Leach Mine. Prepared by Access Consulting Group, dated 2010.
Alexco, 2005. Acknowledgement and Agreement to Be Bound. Prepared and Executed by Alexco Resource Corp. to Viceroy Minerals Corporation and Energold Minerals Inc. on March 15, 2005.
BBA, 2012. Conceptual Study: Connection to Yukon Energy Corporation Network. Prepared by BBA for Golden Predator Canada Corp., dated November 19, 2012.
Diment et al, 2009. Technical Report on the Brewery Creek Gold Project, Yukon Territory, Canada. Prepared by Richard M. Diment, P.G. and Ronald G. Simpson, P.G. of GeoSim Services, Inc. for Golden Predator Royalty & Development Corp., dated July 31, 2009.
Diment, R., and Simpson, R., 2003, SpectrumGold Inc. and 650399 BC Ltd. Brewery Creek Gold Project, Yukon Territory, Canada, Technical Report for Viceroy Corporation, May 16, 2003.
EBA, 2012a. 2012 Geotechnical Site Investigation & Geotechnical Pre-Feasibility Study for Six Proposed Pits. Prepared by EBA for Golden Predator Corp., dated December 2012.
EBA, 2012b. Waste Rock Deposition Sites, Preliminary Options and Volume Estimates. Prepared by EBA for Golden Predator Canada Corp., dated December 2012.
EBA, 2012c. Design Memo regarding Lower Foster Pit, Small Ephemeral Drainage Tributary Diversion – Conceptual Design. Prepared by EBA for Golden Predator Corp., dated December 20, 2012.
EBA, 2013a. Technical Memorandum regarding Brewery Creek Mine Haul Roads. Prepared by EBA for Golden Predator Corp., dated January 2, 2013.
EBA, 2013b. Updated Mineral Resource Estimate for the Brewery Creek Property, Yukon Territory, Canada. Prepared by EBA for Golden Predator Canada Corp., dated January 17, 2013.
EBA, 2013c. Draft Internal Pre-Feasibility Study for the Brewery Creek Property, Yukon Territory, Canada. Prepared by EBA for Golden Predator Canada Corp., dated May 2013.
Americas Bullion Royalty Corp. 19-2 Brewery Creek Project NI 43-101 Technical Report on Resources
Gustavson Associates, LLC October 23, 2013 Brewery Creek_NI 43-101 TR_Final_20131023.docx
Golden Predator, 2012a. Acknowledgement and Agreement to Be Bound. Prepared and Executed by Golden Predator Canada Corp. to Alexco Resource Corp. and Energold Minerals Inc., dated September 25, 2012.
Golden Predator, 2012b. Acknowledgement and Agreement to Be Bound. Prepared and Executed by Golden Predator Canada Corp. to Franco-Nevada Corporation, dated September 25, 2012.
Golden Predator, 2013a. 2012 Assessment Report on the Brewery Creek Property. Prepared by Golden Predator Canada Corp., dated January 9, 2013.
Golden Predator, 2013b. 2012 Annual Water License Report and 2012 Annual Quartz Mining License Report. Prepared by Golden Predator Corp. and submitted to Yukon Water Board and Yukon Government, Energy Mines and Resources, et al, dated February 2013.
Hemlo, 1992. Letter from Hemlo Gold to Total Erickson Resources Limited regarding Agreement Made the 9th Day of June, 1989 between Noranda Exploration Company, Limited and Total Erickson Resources Limited; dated September 23, 1992.
Hemlo, et al, 1993. Royalty Agreement between Hemlo Gold Mines, Inc. and Loki Gold Corporation, Executed on September 24, 1993.
KD, 2012. Memorandum regarding Brewery Creek Reprocessing Existing Heap Leach. Prepared by KD Engineering for Golden Predator Corp., dated November 5, 2012.
KD, 2013a. Equipment List. Prepared by KD Engineering for Golden Predator Corp., dated January 2013.
KD, 2013b. Electrical Load Study. Prepared by KD Engineering for Golden Predator Corp., dated February 6, 2013.
KD, 2013c. Capital Cost Estimate, Brewery Creek Prefeasibility Study Owner Operated Crushing. Prepared by KD Engineering for Golden Predator Corp., dated March 2013.
KD, 2013d. Operating Cost Estimate. Prepared by KD Engineering for Golden Predator Corp., dated April 2013.
Lindsay, M., (2006). The Structural and Hydrothermal Evolution of Intrusion-Related Gold Mineralisation at Brewery Creek Mine, Yukon, Canada. PhD thesis Submitted to the James Cook University, North Queensland, Australia. Murphy, D.C., 1997: Geology of the McQuesten River Region, Northern McQuesten and Mayo Map Areas, Yukon Territory (115P/14, 15, 16; 105M/13, 14). Exploration and Geological Services Division, Yukon Region. Bulletin 6. 95p. + maps.
Americas Bullion Royalty Corp. 19-3 Brewery Creek Project NI 43-101 Technical Report on Resources
Gustavson Associates, LLC October 23, 2013 Brewery Creek_NI 43-101 TR_Final_20131023.docx
Matrix, 2012. Heritage Resources Overview Assessment for the Brewery Creek Property. Prepared by Matrix Research Limited for Golden Predator Corp., dated June 2012.
McClelland, 2012. Report on Heap Leach Residue Testing, MLI Job No. 3618, dated Dec. 19 2012, McClelland Laboratories, Inc.
Newmont, et al, 2007. Assignment and Assumption Agreement between Newmont Mining Corporation and Franco-Nevada Corporation, Executed on December 20, 2007.
Noranda, 1989. Royalty Acknowledgement Agreement between Noranda Exploration Company, Limited and Total Erickson Resources, Limited, Executed on June 9, 1989.
NCL, 2013. Quote for Golden Predator to Provide a Complete Contracted Crushing, Screening, and Conveying Operation System at Brewery Creek Mine. Prepared by Nuway Crushing Ltd, dated January 12, 2013.
SGS et al, 2013. Design Criteria, Brewery Creek – Prefeasibility Study. Prepared by SGS Metcon and KD Engineering for Golden Predator Canada Corp., dated April 8, 2013.
Tetra Tech, 2012. Waste Rock Deposition Sites, Preliminary Options and Volume Estimates. Prepared by Tetra Tech for Golden Predator Corp., dated December 2012.
Tetra Tech, 2013a. Technical Memorandum regarding Brewery Creek Preliminary Heap Leach Facility Water Balance. Prepared by Tetra Tech for Golden Predator Corp., dated January 14, 2013.
Tetra Tech, 2013b. Heap Leach Facility Pre-Feasibility Design – Cells 8, 9, & 10. Prepared by Tetra Tech for Golden Predator, dated April 2013.
Viceroy Minerals Corporation, 2000. Brewery Creek Monthly Report, December 2000, Reagent Consumption Report page 21.
Vista, 2012. Letter from Vista Tek Limited to Golden Predator regarding September 2012 Engineering Inspection – Brewery Creek Mine, dated October 3, 2012.
Walker, 2012. Airborne Geophysical Survey Report Brewery Creek Block 2012. Precision GeoSurveys Inc. October 2012.
YEMR, 2004. Amendment to Yukon Quartz Mining Licence A99-01. Issued by Yukon Energy, Mines Resources to Viceroy Minerals Corporation, dated April 6, 2004.
YEMR, 2012a. Class 4 Quartz Mining Permit, Executed by Glenna Southwick of Yukon Energy, Mines and Resources on July 6, 2012.
Americas Bullion Royalty Corp. 19-4 Brewery Creek Project NI 43-101 Technical Report on Resources
Gustavson Associates, LLC October 23, 2013 Brewery Creek_NI 43-101 TR_Final_20131023.docx
YEMR, 2012b. Letter from Bryony McIntyre of Yukon Energy, Mines and Resources to John Legg of Golden Predator Canada Corp. regarding Assignment of Quartz Mining License A99-001 – Brewery Creek, dated July 6, 2012.
YEMR, 2012c. Type B Water License No. MN12-038. Permitted to Golden Predator Corporation by Yukon Water Board, dated August 6, 2012.

Americas Bullion Royalty Corp. 20-1 Brewery Creek Project NI 43-101 Technical Report on Resources
Gustavson Associates, LLC October 23, 2013 Brewery Creek_NI 43-101 TR_Final_20131023.docx
20 Glossary
20.1 Mineral Resources
The Mineral Resources and mineral reserves have been classified according to the “CIM Standards on Mineral Resources and Reserves: Definitions and Guidelines” (November 27, 2010). Accordingly, the Resources have been classified as Measured, Indicated or Inferred, the Reserves have been classified as Proven, and Probable based on the Measured and Indicated Resources as defined below.
A Mineral Resource is a concentration or occurrence of natural, solid, inorganic or fossilized organic material in or on the Earth’s crust in such form and quantity and of such a grade or quality that it has reasonable prospects for economic extraction. The location, quantity, grade, geological characteristics and continuity of a Mineral Resource are known, estimated or interpreted from specific geological evidence and knowledge.
An ‘Inferred Mineral Resource’ is that part of a Mineral Resource for which quantity and grade or quality can be estimated on the basis of geological evidence and limited sampling and reasonably assumed, but not verified, geological and grade continuity. The estimate is based on limited information and sampling gathered through appropriate techniques from locations such as outcrops, trenches, pits, workings and drillholes.
An ‘Indicated Mineral Resource’ is that part of a Mineral Resource for which quantity, grade or quality, densities, shape and physical characteristics can be estimated with a level of confidence sufficient to allow the appropriate application of technical and economic parameters, to support mine planning and evaluation of the economic viability of the deposit. The estimate is based on detailed and reliable exploration and testing information gathered through appropriate techniques from locations such as outcrops, trenches, pits, workings and drillholes that are spaced closely enough for geological and grade continuity to be reasonably assumed.
A ‘Measured Mineral Resource’ is that part of a Mineral Resource for which quantity, grade or quality, densities, shape, physical characteristics are so well established that they can be estimated with confidence sufficient to allow the appropriate application of technical and economic parameters, to support production planning and evaluation of the economic viability of the deposit. The estimate is based on detailed and reliable exploration, sampling and testing information gathered through appropriate techniques from locations such as outcrops, trenches, pits, workings and drillholes that are spaced closely enough to confirm both geological and grade continuity.
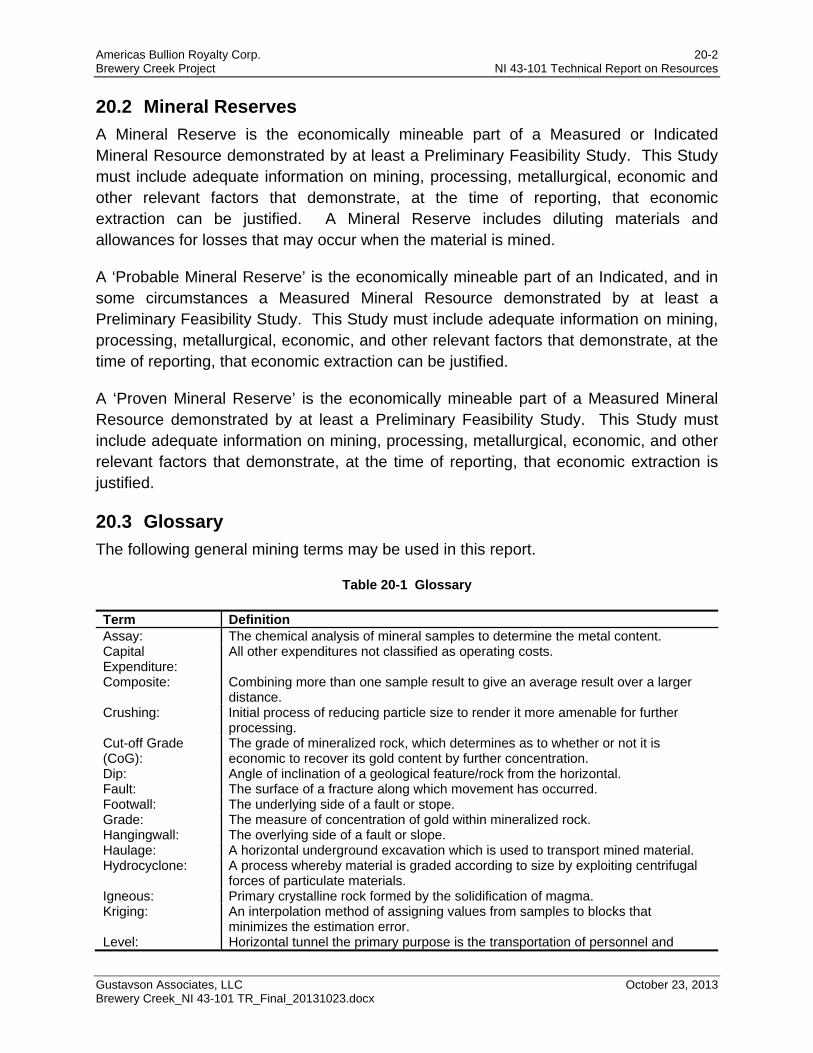
Americas Bullion Royalty Corp. 20-2 Brewery Creek Project NI 43-101 Technical Report on Resources
Gustavson Associates, LLC October 23, 2013 Brewery Creek_NI 43-101 TR_Final_20131023.docx
20.2 Mineral Reserves
A Mineral Reserve is the economically mineable part of a Measured or Indicated Mineral Resource demonstrated by at least a Preliminary Feasibility Study. This Study must include adequate information on mining, processing, metallurgical, economic and other relevant factors that demonstrate, at the time of reporting, that economic extraction can be justified. A Mineral Reserve includes diluting materials and allowances for losses that may occur when the material is mined.
A ‘Probable Mineral Reserve’ is the economically mineable part of an Indicated, and in some circumstances a Measured Mineral Resource demonstrated by at least a Preliminary Feasibility Study. This Study must include adequate information on mining, processing, metallurgical, economic, and other relevant factors that demonstrate, at the time of reporting, that economic extraction can be justified.
A ‘Proven Mineral Reserve’ is the economically mineable part of a Measured Mineral Resource demonstrated by at least a Preliminary Feasibility Study. This Study must include adequate information on mining, processing, metallurgical, economic, and other relevant factors that demonstrate, at the time of reporting, that economic extraction is justified.
20.3 Glossary
The following general mining terms may be used in this report.
Table 20-1 Glossary
Term Definition Assay: The chemical analysis of mineral samples to determine the metal content. Capital Expenditure:
All other expenditures not classified as operating costs.
Composite: Combining more than one sample result to give an average result over a larger distance.
Crushing: Initial process of reducing particle size to render it more amenable for further processing.
Cut-off Grade (CoG):
The grade of mineralized rock, which determines as to whether or not it is economic to recover its gold content by further concentration.
Dip: Angle of inclination of a geological feature/rock from the horizontal. Fault: The surface of a fracture along which movement has occurred. Footwall: The underlying side of a fault or stope. Grade: The measure of concentration of gold within mineralized rock. Hangingwall: The overlying side of a fault or slope. Haulage: A horizontal underground excavation which is used to transport mined material. Hydrocyclone: A process whereby material is graded according to size by exploiting centrifugal
forces of particulate materials. Igneous: Primary crystalline rock formed by the solidification of magma. Kriging: An interpolation method of assigning values from samples to blocks that
minimizes the estimation error. Level: Horizontal tunnel the primary purpose is the transportation of personnel and
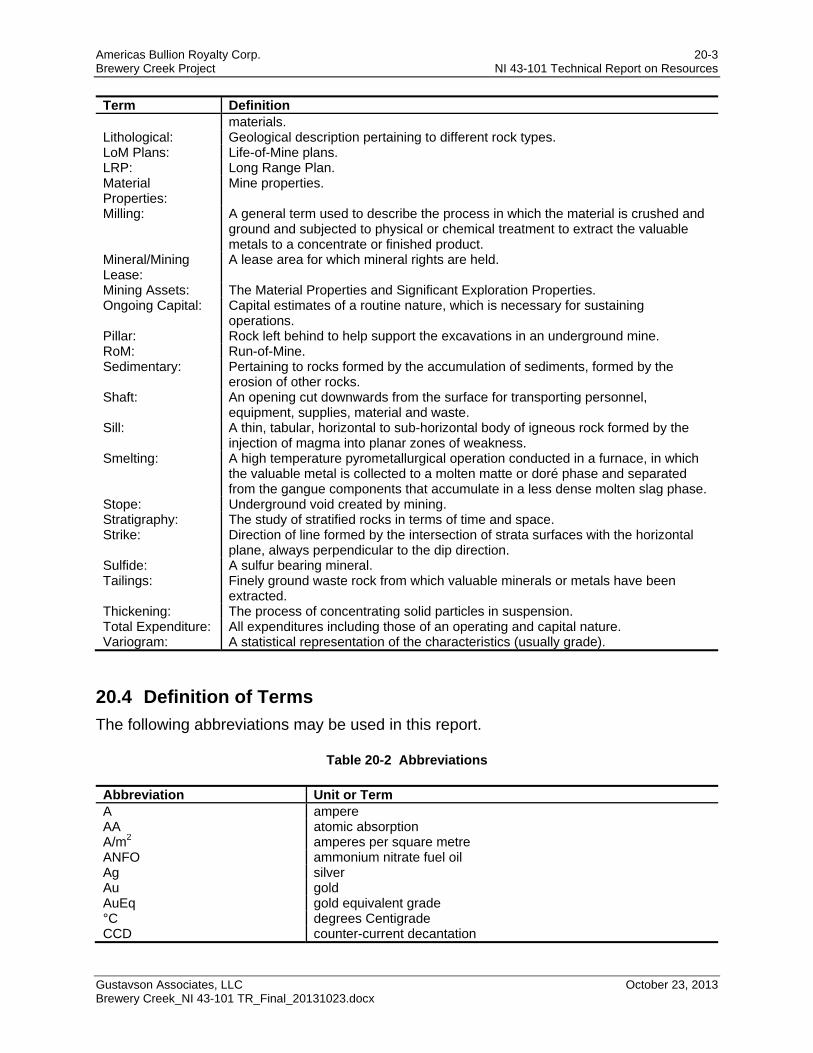
Americas Bullion Royalty Corp. 20-3 Brewery Creek Project NI 43-101 Technical Report on Resources
Gustavson Associates, LLC October 23, 2013 Brewery Creek_NI 43-101 TR_Final_20131023.docx
Term Definition materials.
Lithological: Geological description pertaining to different rock types. LoM Plans: Life-of-Mine plans. LRP: Long Range Plan. Material Properties:
Mine properties.
Milling: A general term used to describe the process in which the material is crushed and ground and subjected to physical or chemical treatment to extract the valuable metals to a concentrate or finished product.
Mineral/Mining Lease:
A lease area for which mineral rights are held.
Mining Assets: The Material Properties and Significant Exploration Properties. Ongoing Capital: Capital estimates of a routine nature, which is necessary for sustaining
operations. Pillar: Rock left behind to help support the excavations in an underground mine. RoM: Run-of-Mine. Sedimentary: Pertaining to rocks formed by the accumulation of sediments, formed by the
erosion of other rocks. Shaft: An opening cut downwards from the surface for transporting personnel,
equipment, supplies, material and waste. Sill: A thin, tabular, horizontal to sub-horizontal body of igneous rock formed by the
injection of magma into planar zones of weakness. Smelting: A high temperature pyrometallurgical operation conducted in a furnace, in which
the valuable metal is collected to a molten matte or doré phase and separated from the gangue components that accumulate in a less dense molten slag phase.
Stope: Underground void created by mining. Stratigraphy: The study of stratified rocks in terms of time and space. Strike: Direction of line formed by the intersection of strata surfaces with the horizontal
plane, always perpendicular to the dip direction. Sulfide: A sulfur bearing mineral. Tailings: Finely ground waste rock from which valuable minerals or metals have been
extracted. Thickening: The process of concentrating solid particles in suspension. Total Expenditure: All expenditures including those of an operating and capital nature. Variogram: A statistical representation of the characteristics (usually grade).
20.4 Definition of Terms
The following abbreviations may be used in this report.
Table 20-2 Abbreviations
Abbreviation Unit or Term A ampere AA atomic absorption A/m2 amperes per square metre ANFO ammonium nitrate fuel oil Ag silver Au gold AuEq gold equivalent grade °C degrees Centigrade CCD counter-current decantation
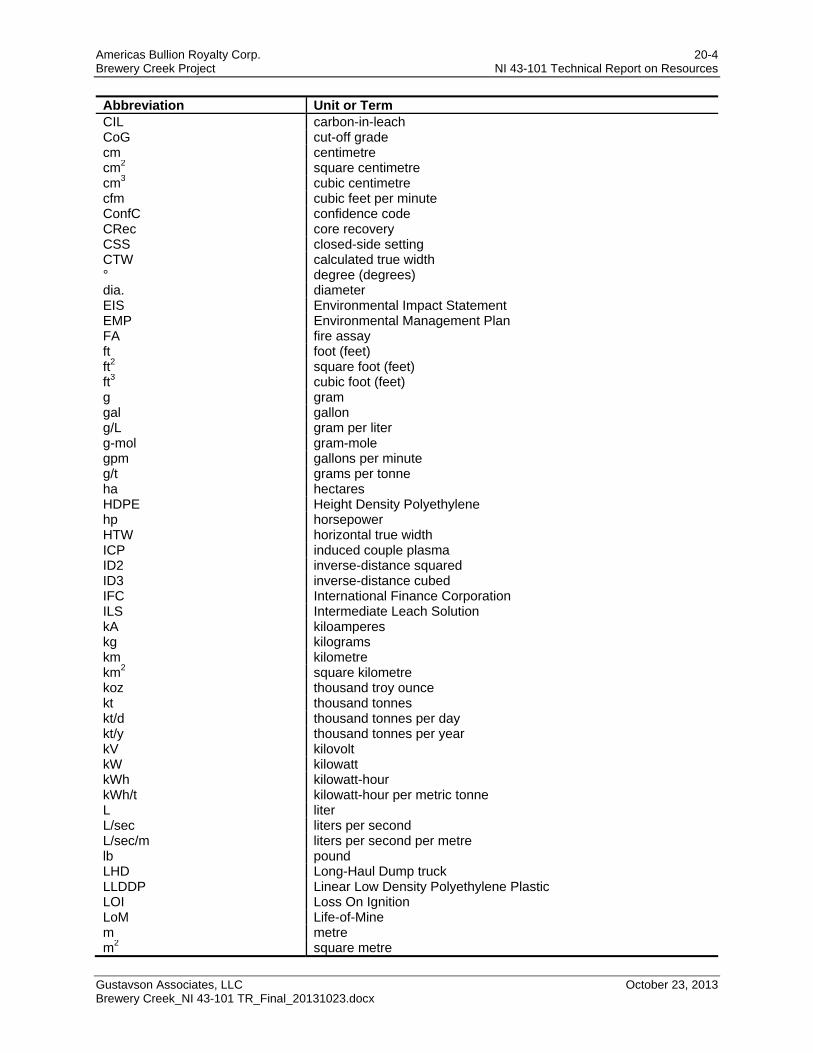
Americas Bullion Royalty Corp. 20-4 Brewery Creek Project NI 43-101 Technical Report on Resources
Gustavson Associates, LLC October 23, 2013 Brewery Creek_NI 43-101 TR_Final_20131023.docx
Abbreviation Unit or Term CIL carbon-in-leach CoG cut-off grade cm centimetre cm2 square centimetre cm3 cubic centimetre cfm cubic feet per minute ConfC confidence code CRec core recovery CSS closed-side setting CTW calculated true width ° degree (degrees) dia. diameter EIS Environmental Impact Statement EMP Environmental Management Plan FA fire assay ft foot (feet) ft2 square foot (feet) ft3 cubic foot (feet) g gram gal gallon g/L gram per liter g-mol gram-mole gpm gallons per minute g/t grams per tonne ha hectares HDPE Height Density Polyethylene hp horsepower HTW horizontal true width ICP induced couple plasma ID2 inverse-distance squared ID3 inverse-distance cubed IFC International Finance Corporation ILS Intermediate Leach Solution kA kiloamperes kg kilograms km kilometre km2 square kilometre koz thousand troy ounce kt thousand tonnes kt/d thousand tonnes per day kt/y thousand tonnes per year kV kilovolt kW kilowatt kWh kilowatt-hour kWh/t kilowatt-hour per metric tonne L liter L/sec liters per second L/sec/m liters per second per metre lb pound LHD Long-Haul Dump truck LLDDP Linear Low Density Polyethylene Plastic LOI Loss On Ignition LoM Life-of-Mine m metre m2 square metre
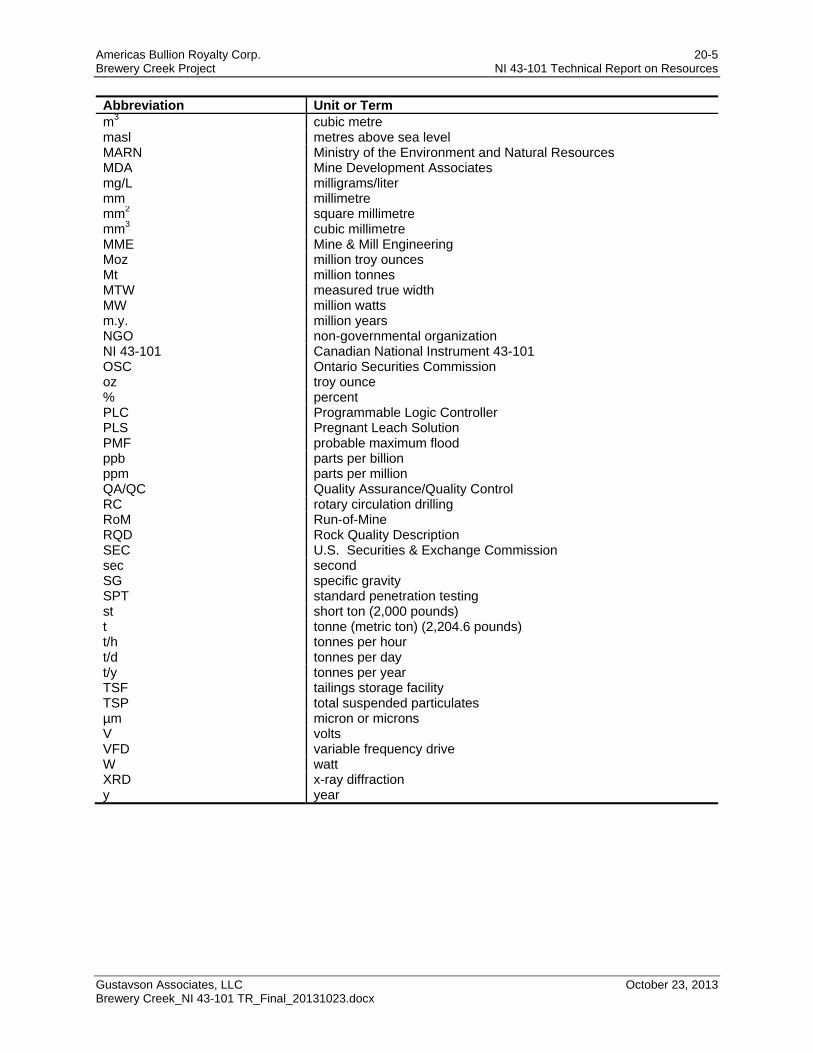
Americas Bullion Royalty Corp. 20-5 Brewery Creek Project NI 43-101 Technical Report on Resources
Gustavson Associates, LLC October 23, 2013 Brewery Creek_NI 43-101 TR_Final_20131023.docx
Abbreviation Unit or Term m3 cubic metre masl metres above sea level MARN Ministry of the Environment and Natural Resources MDA Mine Development Associates mg/L milligrams/liter mm millimetre mm2 square millimetre mm3 cubic millimetre MME Mine & Mill Engineering Moz million troy ounces Mt million tonnes MTW measured true width MW million watts m.y. million years NGO non-governmental organization NI 43-101 Canadian National Instrument 43-101 OSC Ontario Securities Commission oz troy ounce % percent PLC Programmable Logic Controller PLS Pregnant Leach Solution PMF probable maximum flood ppb parts per billion ppm parts per million QA/QC Quality Assurance/Quality Control RC rotary circulation drilling RoM Run-of-Mine RQD Rock Quality Description SEC U.S. Securities & Exchange Commission sec second SG specific gravity SPT standard penetration testing st short ton (2,000 pounds) t tonne (metric ton) (2,204.6 pounds) t/h tonnes per hour t/d tonnes per day t/y tonnes per year TSF tailings storage facility TSP total suspended particulates µm micron or microns V volts VFD variable frequency drive W watt XRD x-ray diffraction y year

Americas Bullion Royalty Corp. A-1 Brewery Creek Project NI 43-101 Technical Report on Resources
Gustavson Associates, LLC October 23, 2013 Brewery Creek_NI 43-101 TR_Final_20131023.docx
Appendix 1 Certificate of Authors
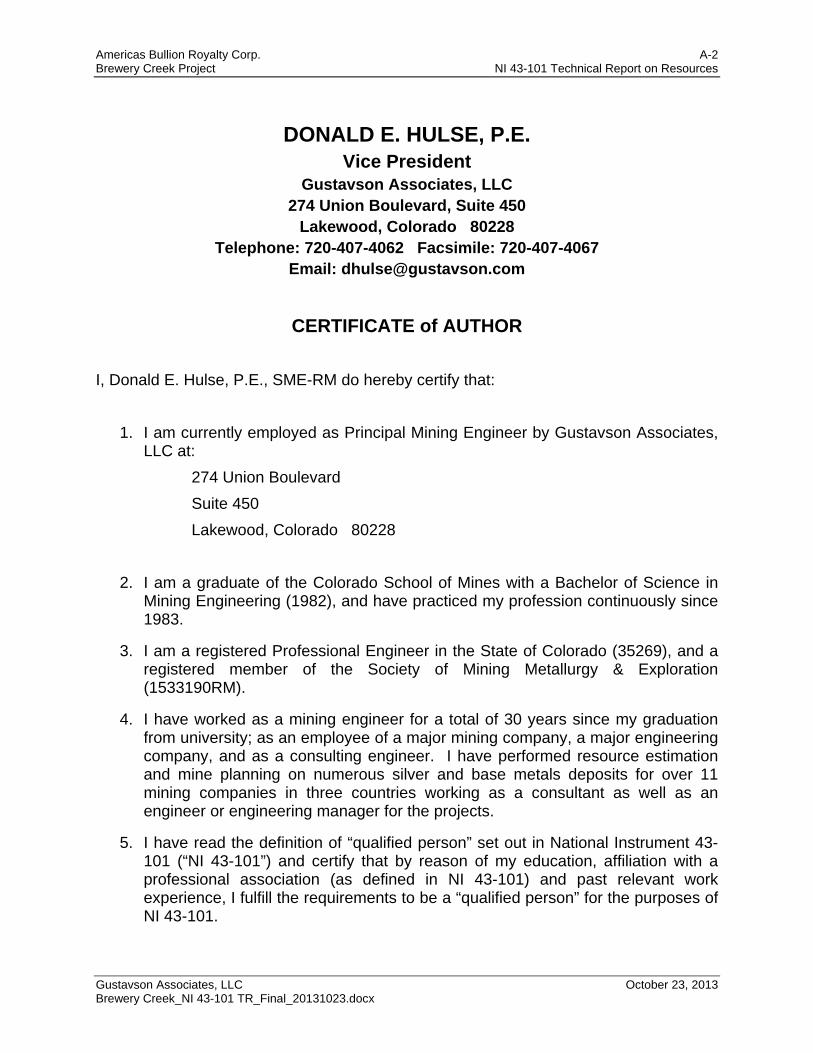
Americas Bullion Royalty Corp. A-2 Brewery Creek Project NI 43-101 Technical Report on Resources
Gustavson Associates, LLC October 23, 2013 Brewery Creek_NI 43-101 TR_Final_20131023.docx
DONALD E. HULSE, P.E. Vice President
Gustavson Associates, LLC 274 Union Boulevard, Suite 450
Lakewood, Colorado 80228 Telephone: 720-407-4062 Facsimile: 720-407-4067
Email: [email protected]
CERTIFICATE of AUTHOR
I, Donald E. Hulse, P.E., SME-RM do hereby certify that:
1. I am currently employed as Principal Mining Engineer by Gustavson Associates, LLC at:
274 Union Boulevard
Suite 450
Lakewood, Colorado 80228
2. I am a graduate of the Colorado School of Mines with a Bachelor of Science in Mining Engineering (1982), and have practiced my profession continuously since 1983.
3. I am a registered Professional Engineer in the State of Colorado (35269), and a registered member of the Society of Mining Metallurgy & Exploration (1533190RM).
4. I have worked as a mining engineer for a total of 30 years since my graduation from university; as an employee of a major mining company, a major engineering company, and as a consulting engineer. I have performed resource estimation and mine planning on numerous silver and base metals deposits for over 11 mining companies in three countries working as a consultant as well as an engineer or engineering manager for the projects.
5. I have read the definition of “qualified person” set out in National Instrument 43-101 (“NI 43-101”) and certify that by reason of my education, affiliation with a professional association (as defined in NI 43-101) and past relevant work experience, I fulfill the requirements to be a “qualified person” for the purposes of NI 43-101.
Americas Bullion Royalty Corp. A-3 Brewery Creek Project NI 43-101 Technical Report on Resources
Gustavson Associates, LLC October 23, 2013 Brewery Creek_NI 43-101 TR_Final_20131023.docx
6. I am responsible for the preparation of the technical report entitled “NI 43-101 Technical Report on Resources, Brewery Creek Project, Yukon Territory, Canada”, effective date June 1st, 2013, and dated October 23rd, 2013 (the “Technical Report”), with specific responsibility for Sections 14.1,14.5 and 14.6.
7. I have not had prior involvement with the property that is the subject of this Technical Report. I was responsible for Sections 14.1, 14.5, and 14.6 of the technical report titled “NI 43-101 Technical Report on Resources, Brewery Creek Project, Yukon Territory, Canada,” dated October 23rd, effective date June 1st.
8. I am independent of the issuer applying all of the tests in Section 1.5 of National Instrument 43-101.
9. I have read National Instrument 43-101 and Form 43-101, and the Technical Report has been prepared in compliance with that instrument and form.
10. As of the date of this certificate, to the best of my knowledge, information and belief, the Technical Report contains all scientific and technical information that is required to be disclosed to make the Technical Report not misleading.
Dated this 23rd day of October, 2013
/s/ Donald E. Hulse (Signature) Signature of Qualified Person
Donald E. Hulse Print name of Qualified Person
Americas Bullion Royalty Corp. A-4 Brewery Creek Project NI 43-101 Technical Report on Resources
Gustavson Associates, LLC October 23, 2013 Brewery Creek_NI 43-101 TR_Final_20131023.docx
M. Claiborne Newton, III, Ph.D., SME-RM Chief Geologist
Gustavson Associates, LLC 274 Union Boulevard, Suite 450
Lakewood, Colorado 80228 Telephone: 720-407-4062 Facsimile: 720-407-4067
Email: [email protected]
CERTIFICATE of AUTHOR
I, M. Claiborne Newton, III, Ph.D, SME-RM do hereby certify that:
1. I am currently employed as Vice President / Director – Geological Services by
ECSI, LLC at:
274 Union Boulevard Suite 450 Lakewood, Colorado 80228
2. I am a graduate of North Carolina State University with a Bachelor of Arts in
Geology (1977), a Master of Science degree in Geological Sciences (1983) from Virginia Polytechnic Institute and State University and a Doctorate of Philosophy in Geosciences (1990) from the University of Arizona. I have practiced my profession continuously since 1977.
3. I am a Registered Member in good standing of the Society for Mining, Metallurgy and Exploration (SME, #4145342RM) a Qualified Professional Member in good standing of the Mining and Metallurgical Society of America (MMSA, #01396QP) with recognized special expertise in geology, mining, and ore reserves, and a registered Professional Geologist in the State of Virginia (#2801001736). I am also a member of the Society of Economic Geologists.
4. I have worked as a geologist for a total of 36 years since graduation from university - as an employee of three major mining companies and two major engineering and geological consulting firms, as a consulting geologist and as a university instructor.
5. I have read the definition of “qualified person” set out in National Instrument 43-101 (“NI 43-101”) and certify that by reason of my education, affiliation with a professional association (as defined in NI 43-101) and past relevant work experience, I fulfill the requirements to be a “qualified person” for the purposes of NI 43-101.
Americas Bullion Royalty Corp. A-5 Brewery Creek Project NI 43-101 Technical Report on Resources
Gustavson Associates, LLC October 23, 2013 Brewery Creek_NI 43-101 TR_Final_20131023.docx
6. I am responsible for the preparation of the technical report entitled “NI 43-101 Technical Report on Resources, Brewery Creek Project, Yukon Territory, Canada”, effective date June 1st, 2013 and dated October 23rd, 2013 (the “Technical Report”), with specific responsibility for Sections 1 through 12.3, 15 through 20, and the overall content. I most recently visited the property for 2 days on June 4th and 5th, 2013.
7. I have not had prior involvement with the property that is the subject of this Technical Report. I was responsible for Sections 1 through 12.3, 15 through 20, and the overall content of the technical report titled “NI 43-101 Technical Report on Resources, Brewery Creek Project, Yukon Territory, Canada,” dated October 23rd, 2013 effective date June 1st, 2013.
8. I am independent of the issuer, applying all of the tests in Section 1.5 of National Instrument 43-101.
9. I have read National Instrument 43-101 and Form 43-101, and the Technical Report has been prepared in compliance with that instrument and form.
10. As of the date of this certificate, to the best of my knowledge, information and belief, the Technical Report contains all scientific and technical information that is required to be disclosed to make the Technical Report not misleading.
Dated this 23rd day of October, 2013
/s/ M. Claiborne Newton, III (Signature) Signature of Qualified Person
M. Claiborne Newton, III Print name of Qualified Person
Americas Bullion Royalty Corp. A-6 Brewery Creek Project NI 43-101 Technical Report on Resources
Gustavson Associates, LLC October 23, 2013 Brewery Creek_NI 43-101 TR_Final_20131023.docx
Michael J. Lechner, C.P.G President
Resource Modeling Inc. 124 Lazy J Drive, PO Box 295
Stites, ID 83552 Telephone: 208-926-4948 Facsimile: 208-926-4950
Email: [email protected]
CERTIFICATE of AUTHOR
I, Michael J. Lechner, C.P.G. do hereby certify that:
1. I am currently employed as a consulting geologist and President of Resource Modeling, Inc, at:
PO Box 295 Stites, Idaho 83552
2. I am a graduate of the University of Montana with a B.A. degree in Geology (1979)
3. I am a Registered Professional Geologist in the State of Arizona (#37753), a Certified Professional Geologist with the American Institute of Professional Geologists (#10690), a P. Geo. with British Columbia (#155344), and a Registered Member of SME (#4124987RM).
4. From 1979 to the present I have been actively employed in various capacities of the mining industry. I have worked as an exploration geologist exploring for precious and base metals throughout western North America (8 years), a mine geologist working at precious metal mines in California and Nevada (10 years), and a geologic consultant during which time I have estimated Mineral Resources for numerous precious and base metal deposits located throughout the world (14 years).
5. I have read the definition of “qualified person” set out in National Instrument 43-101 (“NI 43-101”) and certify that by reason of my education, affiliation with a professional association (as defined in NI 43-101) and past relevant work experience, I fulfill the requirements to be a “qualified person” for the purposes of NI 43-101.
Americas Bullion Royalty Corp. A-7 Brewery Creek Project NI 43-101 Technical Report on Resources
Gustavson Associates, LLC October 23, 2013 Brewery Creek_NI 43-101 TR_Final_20131023.docx
6. I am responsible for the preparation of the technical report entitled “NI 43-101 Technical Report on Resources, Brewery Creek Project, Yukon Territory, Canada”, effective date June 1st, 2013, and dated October 23rd, 2013 (the “Technical Report”), with specific responsibility for Sections 12.2,14.2, 14.3, 14.5, and 14.6. I most recently visited the property for 3 days on October 16th to 18th, 2012.
7. I have not had prior involvement with the property that is the subject of this Technical Report. I was responsible for Sections 12.2,14.2, 14.3, 14.5, and 14.6 of the technical report titled “NI 43-101 Technical Report on Resources, Brewery Creek Project, Yukon Territory, Canada,” dated October 23rd, 2013 effective date June 1st, 2013.
8. I am independent of the issuer applying all of the tests in Section 1.5 of National Instrument 43-101.
9. I have read National Instrument 43-101 and Form 43-101, and the Technical Report has been prepared in compliance with that instrument and form.
10. As of the date of this certificate, to the best of my knowledge, information and belief, the Technical Report contains all scientific and technical information that is required to be disclosed to make the Technical Report not misleading.
Dated this 23rd day of October, 2013
/s/ Michael J. Lechner (Signature) Signature of Qualified Person
Michael J. Lechner Print name of Qualified Person
Americas Bullion Royalty Corp. A-8 Brewery Creek Project NI 43-101 Technical Report on Resources
Gustavson Associates, LLC October 23, 2013 Brewery Creek_NI 43-101 TR_Final_20131023.docx
P. James F. Barr, P. Geo. Senior Geologist
EBA, A Tetra Tech Company 1066 West Hastings Street
Vancouver, BC V6E 3X2
CERTIFICATE of AUTHOR
I, P. James F. Barr, P. Geo. do hereby certify that:
1. I am currently employed as a senior geologist with EBA, A Tetra Tech Company, at:
1066 West Hastings Street Vancouver, BC V6E 3X2
2. I am a graduate of the University of Waterloo with a B.Sc. with a major in Environmental Science and joint minors in Earth Science and Chemistry (2003).
3. I am a registered Professional Geoscientist with the Association of Professional Engineers and Geoscientists of the province of British Columbia (#35150).
4. From 2003 to the present I have worked as an exploration and resource geologist for numerous projects in northern Canada and Mexico, and have worked on a precious metal oxide heap leach project in Mexico.
5. I have read the definition of “qualified person” set out in National Instrument 43-101 (“NI 43-101”) and certify that by reason of my education, affiliation with a professional association (as defined in NI 43-101) and past relevant work experience, I fulfill the requirements to be a “qualified person” for the purposes of NI 43-101.
6. I am responsible for the information referenced from previous technical reporting that is contained in Sections 12.1, 14.4, 14.5, and 14.6 of the technical report entitled “NI 43-101 Technical Report on Resources, Brewery Creek Project, Yukon Territory, Canada”, effective date June 1st, 2013, and dated October 23rd, 2013 (the “Technical Report”). I visited the property for 3 days on March 19th to 21st, 2012, and most recently visited the property for 2 days on May 30th and 31st, 2012.
Americas Bullion Royalty Corp. A-9 Brewery Creek Project NI 43-101 Technical Report on Resources
Gustavson Associates, LLC October 23, 2013 Brewery Creek_NI 43-101 TR_Final_20131023.docx
7. I was the principal author of the previous Technical Report titled “Updated Mineral Resource Estimate for the Brewery Creek Property, Yukon Territory, Canada” effective March 11, 2012, amended January 17, 2013.
8. I am independent of the issuer applying all of the tests in Section 1.5 of National Instrument 43-101.
9. I have read National Instrument 43-101 and Form 43-101, and the Technical Report has been prepared in compliance with that instrument and form.
10. As of the date of this certificate, to the best of my knowledge, information and belief, the Technical Report contains all scientific and technical information that is required to be disclosed to make the Technical Report not misleading.
Dated this 23rd day of October, 2013
/s/ P. James F. Barr (Signature) Signature of Qualified Person
P. James F. Barr Print name of Qualified Person
Americas Bullion Royalty Corp. A-10 Brewery Creek Project NI 43-101 Technical Report on Resources
Gustavson Associates, LLC October 23, 2013 Brewery Creek_NI 43-101 TR_Final_20131023.docx

Americas Bullion Royalty Corp. A-11 Brewery Creek Project NI 43-101 Technical Report on Resources
Gustavson Associates, LLC October 23, 2013 Brewery Creek_NI 43-101 TR_Final_20131023.docx
Americas Bullion Royalty Corp. B-1 Brewery Creek Project NI 43-101 Technical Report on Resources
Gustavson Associates, LLC October 23, 2013 Brewery Creek_NI 43-101 TR_Final_20131023.docx
Appendix 2 Claims List
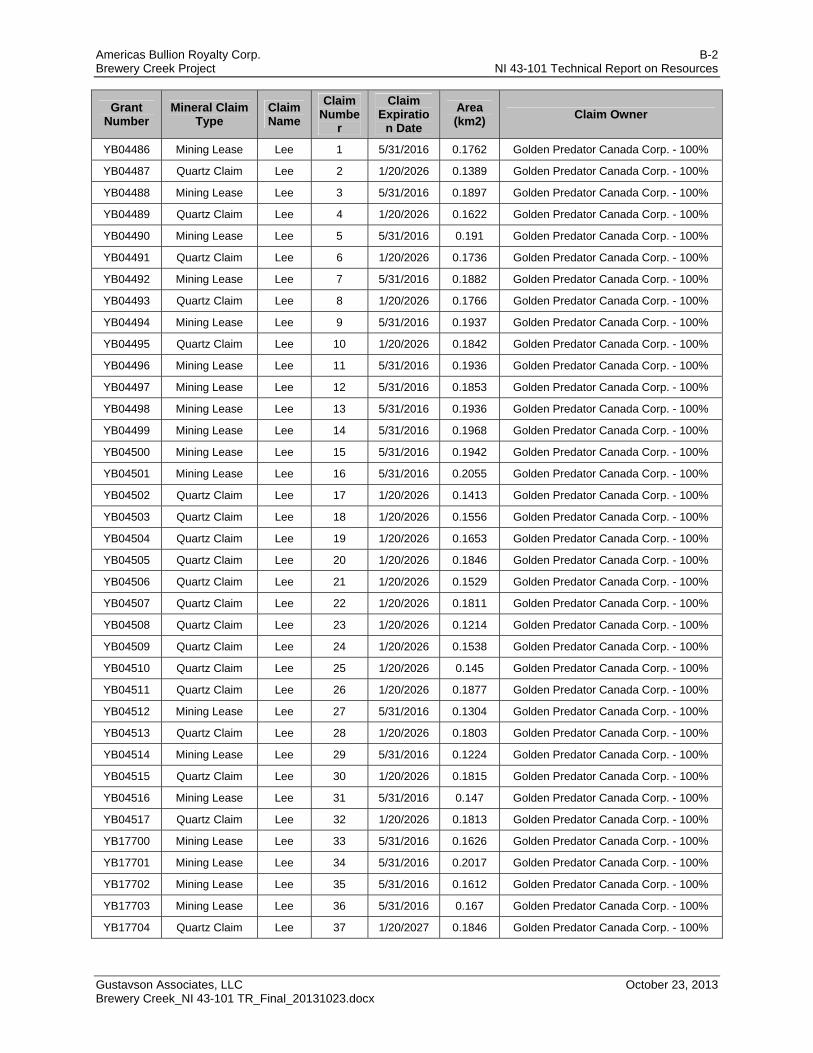
Americas Bullion Royalty Corp. B-2 Brewery Creek Project NI 43-101 Technical Report on Resources
Gustavson Associates, LLC October 23, 2013 Brewery Creek_NI 43-101 TR_Final_20131023.docx
Grant Number
Mineral Claim Type
Claim Name
Claim Numbe
r
Claim Expiratio
n Date
Area (km2)
Claim Owner
YB04486 Mining Lease Lee 1 5/31/2016 0.1762 Golden Predator Canada Corp. - 100%
YB04487 Quartz Claim Lee 2 1/20/2026 0.1389 Golden Predator Canada Corp. - 100%
YB04488 Mining Lease Lee 3 5/31/2016 0.1897 Golden Predator Canada Corp. - 100%
YB04489 Quartz Claim Lee 4 1/20/2026 0.1622 Golden Predator Canada Corp. - 100%
YB04490 Mining Lease Lee 5 5/31/2016 0.191 Golden Predator Canada Corp. - 100%
YB04491 Quartz Claim Lee 6 1/20/2026 0.1736 Golden Predator Canada Corp. - 100%
YB04492 Mining Lease Lee 7 5/31/2016 0.1882 Golden Predator Canada Corp. - 100%
YB04493 Quartz Claim Lee 8 1/20/2026 0.1766 Golden Predator Canada Corp. - 100%
YB04494 Mining Lease Lee 9 5/31/2016 0.1937 Golden Predator Canada Corp. - 100%
YB04495 Quartz Claim Lee 10 1/20/2026 0.1842 Golden Predator Canada Corp. - 100%
YB04496 Mining Lease Lee 11 5/31/2016 0.1936 Golden Predator Canada Corp. - 100%
YB04497 Mining Lease Lee 12 5/31/2016 0.1853 Golden Predator Canada Corp. - 100%
YB04498 Mining Lease Lee 13 5/31/2016 0.1936 Golden Predator Canada Corp. - 100%
YB04499 Mining Lease Lee 14 5/31/2016 0.1968 Golden Predator Canada Corp. - 100%
YB04500 Mining Lease Lee 15 5/31/2016 0.1942 Golden Predator Canada Corp. - 100%
YB04501 Mining Lease Lee 16 5/31/2016 0.2055 Golden Predator Canada Corp. - 100%
YB04502 Quartz Claim Lee 17 1/20/2026 0.1413 Golden Predator Canada Corp. - 100%
YB04503 Quartz Claim Lee 18 1/20/2026 0.1556 Golden Predator Canada Corp. - 100%
YB04504 Quartz Claim Lee 19 1/20/2026 0.1653 Golden Predator Canada Corp. - 100%
YB04505 Quartz Claim Lee 20 1/20/2026 0.1846 Golden Predator Canada Corp. - 100%
YB04506 Quartz Claim Lee 21 1/20/2026 0.1529 Golden Predator Canada Corp. - 100%
YB04507 Quartz Claim Lee 22 1/20/2026 0.1811 Golden Predator Canada Corp. - 100%
YB04508 Quartz Claim Lee 23 1/20/2026 0.1214 Golden Predator Canada Corp. - 100%
YB04509 Quartz Claim Lee 24 1/20/2026 0.1538 Golden Predator Canada Corp. - 100%
YB04510 Quartz Claim Lee 25 1/20/2026 0.145 Golden Predator Canada Corp. - 100%
YB04511 Quartz Claim Lee 26 1/20/2026 0.1877 Golden Predator Canada Corp. - 100%
YB04512 Mining Lease Lee 27 5/31/2016 0.1304 Golden Predator Canada Corp. - 100%
YB04513 Quartz Claim Lee 28 1/20/2026 0.1803 Golden Predator Canada Corp. - 100%
YB04514 Mining Lease Lee 29 5/31/2016 0.1224 Golden Predator Canada Corp. - 100%
YB04515 Quartz Claim Lee 30 1/20/2026 0.1815 Golden Predator Canada Corp. - 100%
YB04516 Mining Lease Lee 31 5/31/2016 0.147 Golden Predator Canada Corp. - 100%
YB04517 Quartz Claim Lee 32 1/20/2026 0.1813 Golden Predator Canada Corp. - 100%
YB17700 Mining Lease Lee 33 5/31/2016 0.1626 Golden Predator Canada Corp. - 100%
YB17701 Mining Lease Lee 34 5/31/2016 0.2017 Golden Predator Canada Corp. - 100%
YB17702 Mining Lease Lee 35 5/31/2016 0.1612 Golden Predator Canada Corp. - 100%
YB17703 Mining Lease Lee 36 5/31/2016 0.167 Golden Predator Canada Corp. - 100%
YB17704 Quartz Claim Lee 37 1/20/2027 0.1846 Golden Predator Canada Corp. - 100%

Americas Bullion Royalty Corp. B-3 Brewery Creek Project NI 43-101 Technical Report on Resources
Gustavson Associates, LLC October 23, 2013 Brewery Creek_NI 43-101 TR_Final_20131023.docx
Grant Number
Mineral Claim Type
Claim Name
Claim Numbe
r
Claim Expiratio
n Date
Area (km2)
Claim Owner
YB17705 Mining Lease Lee 38 5/31/2016 0.2038 Golden Predator Canada Corp. - 100%
YB17706 Quartz Claim Lee 39 1/20/2027 0.1876 Golden Predator Canada Corp. - 100%
YB17707 Mining Lease Lee 40 5/31/2016 0.2047 Golden Predator Canada Corp. - 100%
YB17708 Quartz Claim Lee 41 1/20/2027 0.1841 Golden Predator Canada Corp. - 100%
YB17709 Mining Lease Lee 42 5/31/2016 0.1625 Golden Predator Canada Corp. - 100%
YB17710 Quartz Claim Lee 43 1/20/2027 0.1872 Golden Predator Canada Corp. - 100%
YB17711 Mining Lease Lee 44 5/31/2016 0.1498 Golden Predator Canada Corp. - 100%
YB17712 Quartz Claim Lee 45 1/20/2027 0.2062 Golden Predator Canada Corp. - 100%
YB17713 Mining Lease Lee 46 5/31/2016 0.1258 Golden Predator Canada Corp. - 100%
YB17714 Mining Lease Lee 47 3/24/2022 0.1974 Golden Predator Canada Corp. - 100%
YB17715 Mining Lease Lee 48 5/31/2016 0.1106 Golden Predator Canada Corp. - 100%
YB17716 Mining Lease Lee 49 5/31/2016 0.1852 Golden Predator Canada Corp. - 100%
YB17717 Mining Lease Lee 50 5/31/2016 0.1105 Golden Predator Canada Corp. - 100%
YB17718 Mining Lease Lee 51 5/31/2016 0.211 Golden Predator Canada Corp. - 100%
YB17719 Mining Lease Lee 52 5/31/2016 0.1158 Golden Predator Canada Corp. - 100%
YB17720 Mining Lease Lee 53 5/31/2016 0.1875 Golden Predator Canada Corp. - 100%
YB17721 Mining Lease Lee 54 5/31/2016 0.0989 Golden Predator Canada Corp. - 100%
YB17722 Mining Lease Lee 55 5/31/2016 0.1834 Golden Predator Canada Corp. - 100%
YB17723 Mining Lease Lee 56 5/31/2016 0.1056 Golden Predator Canada Corp. - 100%
YB17724 Quartz Claim Lee 57 1/20/2027 0.1485 Golden Predator Canada Corp. - 100%
YB17725 Quartz Claim Lee 58 1/20/2027 0.1913 Golden Predator Canada Corp. - 100%
YB17726 Quartz Claim Lee 59 1/20/2027 0.1681 Golden Predator Canada Corp. - 100%
YB17727 Quartz Claim Lee 60 1/20/2027 0.2099 Golden Predator Canada Corp. - 100%
YB17728 Quartz Claim Lee 61 1/20/2027 0.1701 Golden Predator Canada Corp. - 100%
YB17729 Quartz Claim Lee 62 1/20/2027 0.2071 Golden Predator Canada Corp. - 100%
YB17730 Quartz Claim Lee 63 1/20/2027 0.1705 Golden Predator Canada Corp. - 100%
YB17731 Quartz Claim Lee 64 1/20/2027 0.2029 Golden Predator Canada Corp. - 100%
YB17732 Quartz Claim Lee 65 1/20/2027 0.1649 Golden Predator Canada Corp. - 100%
YB17733 Quartz Claim Lee 66 1/20/2027 0.1945 Golden Predator Canada Corp. - 100%
YB17734 Quartz Claim Lee 67 1/20/2027 0.1561 Golden Predator Canada Corp. - 100%
YB17735 Quartz Claim Lee 68 1/20/2027 0.1771 Golden Predator Canada Corp. - 100%
YB17736 Quartz Claim Lee 69 1/20/2027 0.1571 Golden Predator Canada Corp. - 100%
YB17737 Quartz Claim Lee 70 1/20/2027 0.1732 Golden Predator Canada Corp. - 100%
YB17738 Quartz Claim Lee 71 1/20/2027 0.1782 Golden Predator Canada Corp. - 100%
YB17739 Quartz Claim Lee 72 1/20/2027 0.1901 Golden Predator Canada Corp. - 100%
YB17740 Quartz Claim Lee 73 1/20/2027 0.1916 Golden Predator Canada Corp. - 100%
YB17741 Quartz Claim Lee 74 1/20/2027 0.1971 Golden Predator Canada Corp. - 100%
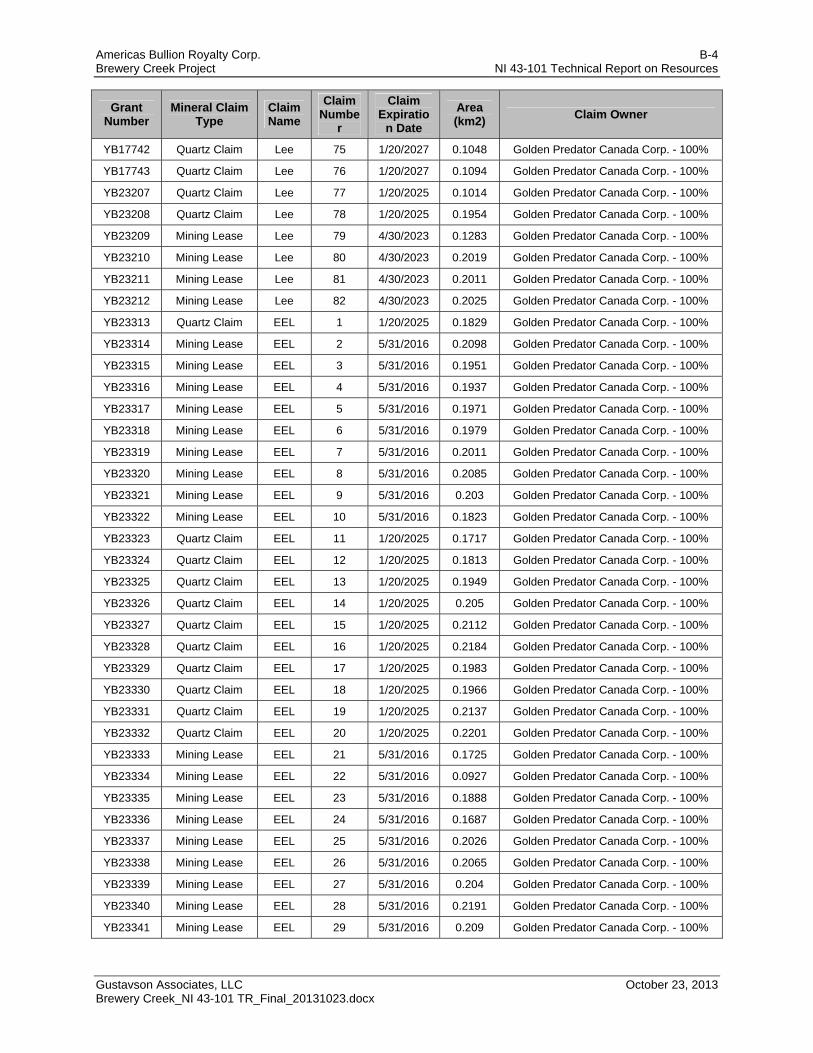
Americas Bullion Royalty Corp. B-4 Brewery Creek Project NI 43-101 Technical Report on Resources
Gustavson Associates, LLC October 23, 2013 Brewery Creek_NI 43-101 TR_Final_20131023.docx
Grant Number
Mineral Claim Type
Claim Name
Claim Numbe
r
Claim Expiratio
n Date
Area (km2)
Claim Owner
YB17742 Quartz Claim Lee 75 1/20/2027 0.1048 Golden Predator Canada Corp. - 100%
YB17743 Quartz Claim Lee 76 1/20/2027 0.1094 Golden Predator Canada Corp. - 100%
YB23207 Quartz Claim Lee 77 1/20/2025 0.1014 Golden Predator Canada Corp. - 100%
YB23208 Quartz Claim Lee 78 1/20/2025 0.1954 Golden Predator Canada Corp. - 100%
YB23209 Mining Lease Lee 79 4/30/2023 0.1283 Golden Predator Canada Corp. - 100%
YB23210 Mining Lease Lee 80 4/30/2023 0.2019 Golden Predator Canada Corp. - 100%
YB23211 Mining Lease Lee 81 4/30/2023 0.2011 Golden Predator Canada Corp. - 100%
YB23212 Mining Lease Lee 82 4/30/2023 0.2025 Golden Predator Canada Corp. - 100%
YB23313 Quartz Claim EEL 1 1/20/2025 0.1829 Golden Predator Canada Corp. - 100%
YB23314 Mining Lease EEL 2 5/31/2016 0.2098 Golden Predator Canada Corp. - 100%
YB23315 Mining Lease EEL 3 5/31/2016 0.1951 Golden Predator Canada Corp. - 100%
YB23316 Mining Lease EEL 4 5/31/2016 0.1937 Golden Predator Canada Corp. - 100%
YB23317 Mining Lease EEL 5 5/31/2016 0.1971 Golden Predator Canada Corp. - 100%
YB23318 Mining Lease EEL 6 5/31/2016 0.1979 Golden Predator Canada Corp. - 100%
YB23319 Mining Lease EEL 7 5/31/2016 0.2011 Golden Predator Canada Corp. - 100%
YB23320 Mining Lease EEL 8 5/31/2016 0.2085 Golden Predator Canada Corp. - 100%
YB23321 Mining Lease EEL 9 5/31/2016 0.203 Golden Predator Canada Corp. - 100%
YB23322 Mining Lease EEL 10 5/31/2016 0.1823 Golden Predator Canada Corp. - 100%
YB23323 Quartz Claim EEL 11 1/20/2025 0.1717 Golden Predator Canada Corp. - 100%
YB23324 Quartz Claim EEL 12 1/20/2025 0.1813 Golden Predator Canada Corp. - 100%
YB23325 Quartz Claim EEL 13 1/20/2025 0.1949 Golden Predator Canada Corp. - 100%
YB23326 Quartz Claim EEL 14 1/20/2025 0.205 Golden Predator Canada Corp. - 100%
YB23327 Quartz Claim EEL 15 1/20/2025 0.2112 Golden Predator Canada Corp. - 100%
YB23328 Quartz Claim EEL 16 1/20/2025 0.2184 Golden Predator Canada Corp. - 100%
YB23329 Quartz Claim EEL 17 1/20/2025 0.1983 Golden Predator Canada Corp. - 100%
YB23330 Quartz Claim EEL 18 1/20/2025 0.1966 Golden Predator Canada Corp. - 100%
YB23331 Quartz Claim EEL 19 1/20/2025 0.2137 Golden Predator Canada Corp. - 100%
YB23332 Quartz Claim EEL 20 1/20/2025 0.2201 Golden Predator Canada Corp. - 100%
YB23333 Mining Lease EEL 21 5/31/2016 0.1725 Golden Predator Canada Corp. - 100%
YB23334 Mining Lease EEL 22 5/31/2016 0.0927 Golden Predator Canada Corp. - 100%
YB23335 Mining Lease EEL 23 5/31/2016 0.1888 Golden Predator Canada Corp. - 100%
YB23336 Mining Lease EEL 24 5/31/2016 0.1687 Golden Predator Canada Corp. - 100%
YB23337 Mining Lease EEL 25 5/31/2016 0.2026 Golden Predator Canada Corp. - 100%
YB23338 Mining Lease EEL 26 5/31/2016 0.2065 Golden Predator Canada Corp. - 100%
YB23339 Mining Lease EEL 27 5/31/2016 0.204 Golden Predator Canada Corp. - 100%
YB23340 Mining Lease EEL 28 5/31/2016 0.2191 Golden Predator Canada Corp. - 100%
YB23341 Mining Lease EEL 29 5/31/2016 0.209 Golden Predator Canada Corp. - 100%
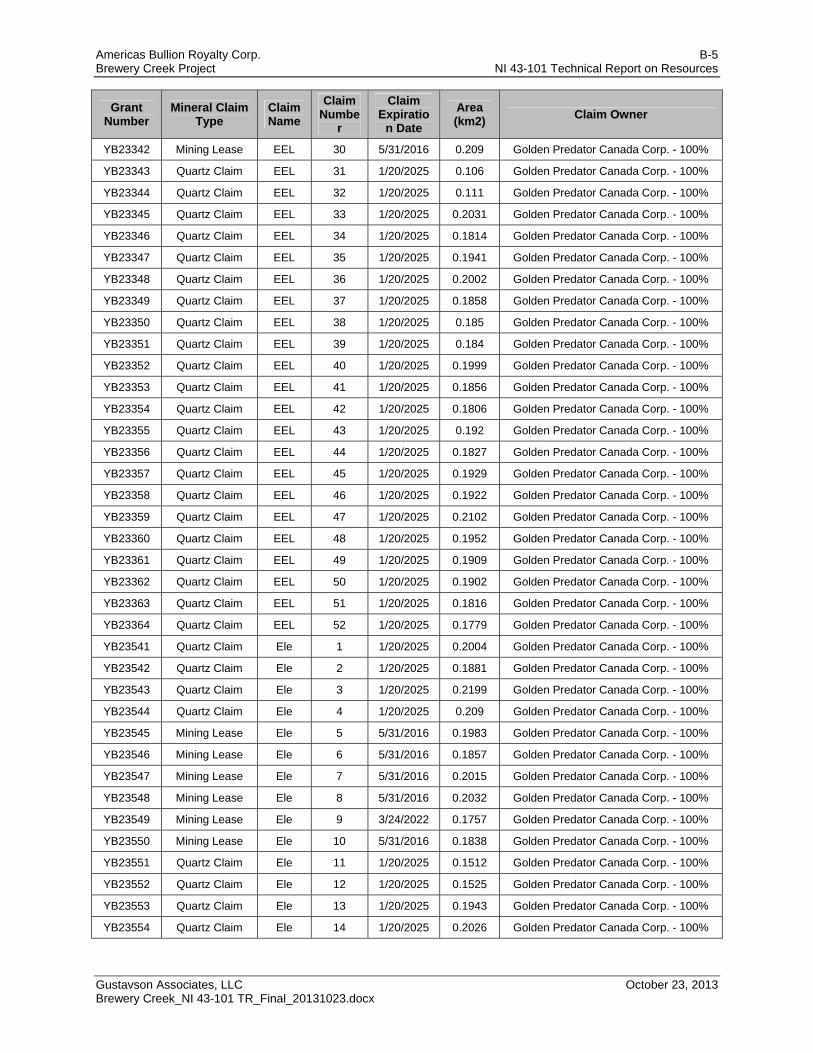
Americas Bullion Royalty Corp. B-5 Brewery Creek Project NI 43-101 Technical Report on Resources
Gustavson Associates, LLC October 23, 2013 Brewery Creek_NI 43-101 TR_Final_20131023.docx
Grant Number
Mineral Claim Type
Claim Name
Claim Numbe
r
Claim Expiratio
n Date
Area (km2)
Claim Owner
YB23342 Mining Lease EEL 30 5/31/2016 0.209 Golden Predator Canada Corp. - 100%
YB23343 Quartz Claim EEL 31 1/20/2025 0.106 Golden Predator Canada Corp. - 100%
YB23344 Quartz Claim EEL 32 1/20/2025 0.111 Golden Predator Canada Corp. - 100%
YB23345 Quartz Claim EEL 33 1/20/2025 0.2031 Golden Predator Canada Corp. - 100%
YB23346 Quartz Claim EEL 34 1/20/2025 0.1814 Golden Predator Canada Corp. - 100%
YB23347 Quartz Claim EEL 35 1/20/2025 0.1941 Golden Predator Canada Corp. - 100%
YB23348 Quartz Claim EEL 36 1/20/2025 0.2002 Golden Predator Canada Corp. - 100%
YB23349 Quartz Claim EEL 37 1/20/2025 0.1858 Golden Predator Canada Corp. - 100%
YB23350 Quartz Claim EEL 38 1/20/2025 0.185 Golden Predator Canada Corp. - 100%
YB23351 Quartz Claim EEL 39 1/20/2025 0.184 Golden Predator Canada Corp. - 100%
YB23352 Quartz Claim EEL 40 1/20/2025 0.1999 Golden Predator Canada Corp. - 100%
YB23353 Quartz Claim EEL 41 1/20/2025 0.1856 Golden Predator Canada Corp. - 100%
YB23354 Quartz Claim EEL 42 1/20/2025 0.1806 Golden Predator Canada Corp. - 100%
YB23355 Quartz Claim EEL 43 1/20/2025 0.192 Golden Predator Canada Corp. - 100%
YB23356 Quartz Claim EEL 44 1/20/2025 0.1827 Golden Predator Canada Corp. - 100%
YB23357 Quartz Claim EEL 45 1/20/2025 0.1929 Golden Predator Canada Corp. - 100%
YB23358 Quartz Claim EEL 46 1/20/2025 0.1922 Golden Predator Canada Corp. - 100%
YB23359 Quartz Claim EEL 47 1/20/2025 0.2102 Golden Predator Canada Corp. - 100%
YB23360 Quartz Claim EEL 48 1/20/2025 0.1952 Golden Predator Canada Corp. - 100%
YB23361 Quartz Claim EEL 49 1/20/2025 0.1909 Golden Predator Canada Corp. - 100%
YB23362 Quartz Claim EEL 50 1/20/2025 0.1902 Golden Predator Canada Corp. - 100%
YB23363 Quartz Claim EEL 51 1/20/2025 0.1816 Golden Predator Canada Corp. - 100%
YB23364 Quartz Claim EEL 52 1/20/2025 0.1779 Golden Predator Canada Corp. - 100%
YB23541 Quartz Claim Ele 1 1/20/2025 0.2004 Golden Predator Canada Corp. - 100%
YB23542 Quartz Claim Ele 2 1/20/2025 0.1881 Golden Predator Canada Corp. - 100%
YB23543 Quartz Claim Ele 3 1/20/2025 0.2199 Golden Predator Canada Corp. - 100%
YB23544 Quartz Claim Ele 4 1/20/2025 0.209 Golden Predator Canada Corp. - 100%
YB23545 Mining Lease Ele 5 5/31/2016 0.1983 Golden Predator Canada Corp. - 100%
YB23546 Mining Lease Ele 6 5/31/2016 0.1857 Golden Predator Canada Corp. - 100%
YB23547 Mining Lease Ele 7 5/31/2016 0.2015 Golden Predator Canada Corp. - 100%
YB23548 Mining Lease Ele 8 5/31/2016 0.2032 Golden Predator Canada Corp. - 100%
YB23549 Mining Lease Ele 9 3/24/2022 0.1757 Golden Predator Canada Corp. - 100%
YB23550 Mining Lease Ele 10 5/31/2016 0.1838 Golden Predator Canada Corp. - 100%
YB23551 Quartz Claim Ele 11 1/20/2025 0.1512 Golden Predator Canada Corp. - 100%
YB23552 Quartz Claim Ele 12 1/20/2025 0.1525 Golden Predator Canada Corp. - 100%
YB23553 Quartz Claim Ele 13 1/20/2025 0.1943 Golden Predator Canada Corp. - 100%
YB23554 Quartz Claim Ele 14 1/20/2025 0.2026 Golden Predator Canada Corp. - 100%
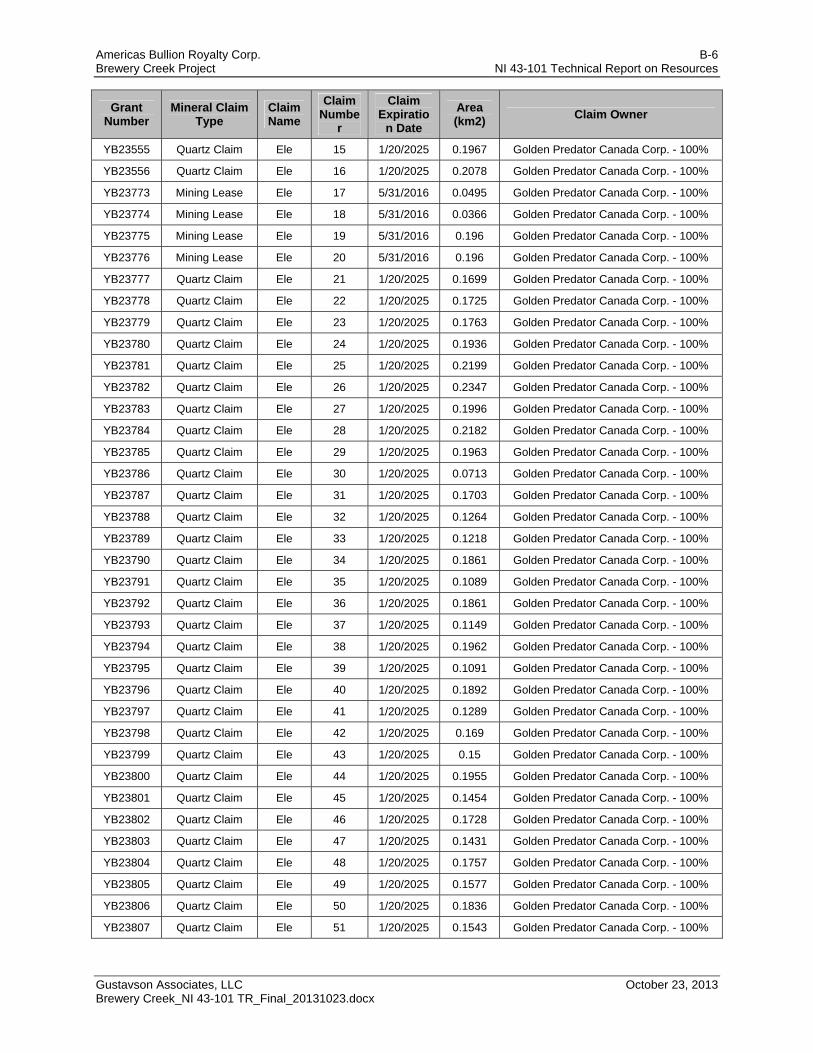
Americas Bullion Royalty Corp. B-6 Brewery Creek Project NI 43-101 Technical Report on Resources
Gustavson Associates, LLC October 23, 2013 Brewery Creek_NI 43-101 TR_Final_20131023.docx
Grant Number
Mineral Claim Type
Claim Name
Claim Numbe
r
Claim Expiratio
n Date
Area (km2)
Claim Owner
YB23555 Quartz Claim Ele 15 1/20/2025 0.1967 Golden Predator Canada Corp. - 100%
YB23556 Quartz Claim Ele 16 1/20/2025 0.2078 Golden Predator Canada Corp. - 100%
YB23773 Mining Lease Ele 17 5/31/2016 0.0495 Golden Predator Canada Corp. - 100%
YB23774 Mining Lease Ele 18 5/31/2016 0.0366 Golden Predator Canada Corp. - 100%
YB23775 Mining Lease Ele 19 5/31/2016 0.196 Golden Predator Canada Corp. - 100%
YB23776 Mining Lease Ele 20 5/31/2016 0.196 Golden Predator Canada Corp. - 100%
YB23777 Quartz Claim Ele 21 1/20/2025 0.1699 Golden Predator Canada Corp. - 100%
YB23778 Quartz Claim Ele 22 1/20/2025 0.1725 Golden Predator Canada Corp. - 100%
YB23779 Quartz Claim Ele 23 1/20/2025 0.1763 Golden Predator Canada Corp. - 100%
YB23780 Quartz Claim Ele 24 1/20/2025 0.1936 Golden Predator Canada Corp. - 100%
YB23781 Quartz Claim Ele 25 1/20/2025 0.2199 Golden Predator Canada Corp. - 100%
YB23782 Quartz Claim Ele 26 1/20/2025 0.2347 Golden Predator Canada Corp. - 100%
YB23783 Quartz Claim Ele 27 1/20/2025 0.1996 Golden Predator Canada Corp. - 100%
YB23784 Quartz Claim Ele 28 1/20/2025 0.2182 Golden Predator Canada Corp. - 100%
YB23785 Quartz Claim Ele 29 1/20/2025 0.1963 Golden Predator Canada Corp. - 100%
YB23786 Quartz Claim Ele 30 1/20/2025 0.0713 Golden Predator Canada Corp. - 100%
YB23787 Quartz Claim Ele 31 1/20/2025 0.1703 Golden Predator Canada Corp. - 100%
YB23788 Quartz Claim Ele 32 1/20/2025 0.1264 Golden Predator Canada Corp. - 100%
YB23789 Quartz Claim Ele 33 1/20/2025 0.1218 Golden Predator Canada Corp. - 100%
YB23790 Quartz Claim Ele 34 1/20/2025 0.1861 Golden Predator Canada Corp. - 100%
YB23791 Quartz Claim Ele 35 1/20/2025 0.1089 Golden Predator Canada Corp. - 100%
YB23792 Quartz Claim Ele 36 1/20/2025 0.1861 Golden Predator Canada Corp. - 100%
YB23793 Quartz Claim Ele 37 1/20/2025 0.1149 Golden Predator Canada Corp. - 100%
YB23794 Quartz Claim Ele 38 1/20/2025 0.1962 Golden Predator Canada Corp. - 100%
YB23795 Quartz Claim Ele 39 1/20/2025 0.1091 Golden Predator Canada Corp. - 100%
YB23796 Quartz Claim Ele 40 1/20/2025 0.1892 Golden Predator Canada Corp. - 100%
YB23797 Quartz Claim Ele 41 1/20/2025 0.1289 Golden Predator Canada Corp. - 100%
YB23798 Quartz Claim Ele 42 1/20/2025 0.169 Golden Predator Canada Corp. - 100%
YB23799 Quartz Claim Ele 43 1/20/2025 0.15 Golden Predator Canada Corp. - 100%
YB23800 Quartz Claim Ele 44 1/20/2025 0.1955 Golden Predator Canada Corp. - 100%
YB23801 Quartz Claim Ele 45 1/20/2025 0.1454 Golden Predator Canada Corp. - 100%
YB23802 Quartz Claim Ele 46 1/20/2025 0.1728 Golden Predator Canada Corp. - 100%
YB23803 Quartz Claim Ele 47 1/20/2025 0.1431 Golden Predator Canada Corp. - 100%
YB23804 Quartz Claim Ele 48 1/20/2025 0.1757 Golden Predator Canada Corp. - 100%
YB23805 Quartz Claim Ele 49 1/20/2025 0.1577 Golden Predator Canada Corp. - 100%
YB23806 Quartz Claim Ele 50 1/20/2025 0.1836 Golden Predator Canada Corp. - 100%
YB23807 Quartz Claim Ele 51 1/20/2025 0.1543 Golden Predator Canada Corp. - 100%

Americas Bullion Royalty Corp. B-7 Brewery Creek Project NI 43-101 Technical Report on Resources
Gustavson Associates, LLC October 23, 2013 Brewery Creek_NI 43-101 TR_Final_20131023.docx
Grant Number
Mineral Claim Type
Claim Name
Claim Numbe
r
Claim Expiratio
n Date
Area (km2)
Claim Owner
YB23808 Quartz Claim Ele 52 1/20/2025 0.182 Golden Predator Canada Corp. - 100%
YB23809 Quartz Claim Ele 53 1/20/2025 0.1606 Golden Predator Canada Corp. - 100%
YB23810 Quartz Claim Ele 54 1/20/2025 0.183 Golden Predator Canada Corp. - 100%
YB23811 Quartz Claim Ele 55 1/20/2025 0.1731 Golden Predator Canada Corp. - 100%
YB23812 Quartz Claim Ele 56 1/20/2025 0.1909 Golden Predator Canada Corp. - 100%
YB23813 Quartz Claim Ele 57 1/20/2025 0.1865 Golden Predator Canada Corp. - 100%
YB23814 Quartz Claim Ele 58 1/20/2025 0.2003 Golden Predator Canada Corp. - 100%
YB23815 Quartz Claim Ele 59 1/20/2025 0.1338 Golden Predator Canada Corp. - 100%
YB23816 Quartz Claim Ele 60 1/20/2025 0.1389 Golden Predator Canada Corp. - 100%
YB23817 Quartz Claim Ele 61 1/20/2025 0.1588 Golden Predator Canada Corp. - 100%
YB23818 Quartz Claim Ele 62 1/20/2025 0.152 Golden Predator Canada Corp. - 100%
YB23819 Quartz Claim Ele 63 1/20/2025 0.1805 Golden Predator Canada Corp. - 100%
YB23820 Quartz Claim Ele 64 1/20/2025 0.1731 Golden Predator Canada Corp. - 100%
YB23821 Quartz Claim Ele 65 1/20/2025 0.1616 Golden Predator Canada Corp. - 100%
YB23822 Quartz Claim Ele 66 1/20/2025 0.1597 Golden Predator Canada Corp. - 100%
YB23823 Quartz Claim Ele 67 1/20/2025 0.1672 Golden Predator Canada Corp. - 100%
YB23824 Quartz Claim Ele 68 1/20/2025 0.1707 Golden Predator Canada Corp. - 100%
YB23825 Quartz Claim Ele 69 1/20/2025 0.1692 Golden Predator Canada Corp. - 100%
YB23826 Quartz Claim Ele 70 1/20/2025 0.1702 Golden Predator Canada Corp. - 100%
YB23827 Quartz Claim Ele 71 1/20/2025 0.1741 Golden Predator Canada Corp. - 100%
YB23828 Quartz Claim Ele 72 1/20/2025 0.1845 Golden Predator Canada Corp. - 100%
YB23829 Quartz Claim Ele 73 1/20/2025 0.1727 Golden Predator Canada Corp. - 100%
YB23830 Quartz Claim Ele 74 1/20/2025 0.1833 Golden Predator Canada Corp. - 100%
YB23831 Quartz Claim Ele 75 1/20/2025 0.1781 Golden Predator Canada Corp. - 100%
YB23832 Quartz Claim Ele 76 1/20/2025 0.1896 Golden Predator Canada Corp. - 100%
YB23833 Quartz Claim Ele 77 1/20/2025 0.1858 Golden Predator Canada Corp. - 100%
YB23834 Quartz Claim Ele 78 1/20/2025 0.1994 Golden Predator Canada Corp. - 100%
YB23835 Quartz Claim Ele 79 1/20/2025 0.1268 Golden Predator Canada Corp. - 100%
YB23836 Quartz Claim Ele 80 1/20/2025 0.1353 Golden Predator Canada Corp. - 100%
YB23907 Mining Lease Eel 53 4/30/2019 0.133 Golden Predator Canada Corp. - 100%
YB23908 Quartz Claim Eel 54 1/20/2025 0.1303 Golden Predator Canada Corp. - 100%
YB23909 Mining Lease Eel 55 4/30/2019 0.1974 Golden Predator Canada Corp. - 100%
YB23910 Quartz Claim Eel 56 1/20/2025 0.2126 Golden Predator Canada Corp. - 100%
YB23911 Mining Lease Eel 57 4/30/2019 0.1957 Golden Predator Canada Corp. - 100%
YB23912 Quartz Claim Eel 58 1/20/2025 0.2079 Golden Predator Canada Corp. - 100%
YB23913 Quartz Claim Eel 59 1/20/2025 0.1521 Golden Predator Canada Corp. - 100%
YB23914 Quartz Claim Eel 60 1/20/2025 0.1722 Golden Predator Canada Corp. - 100%
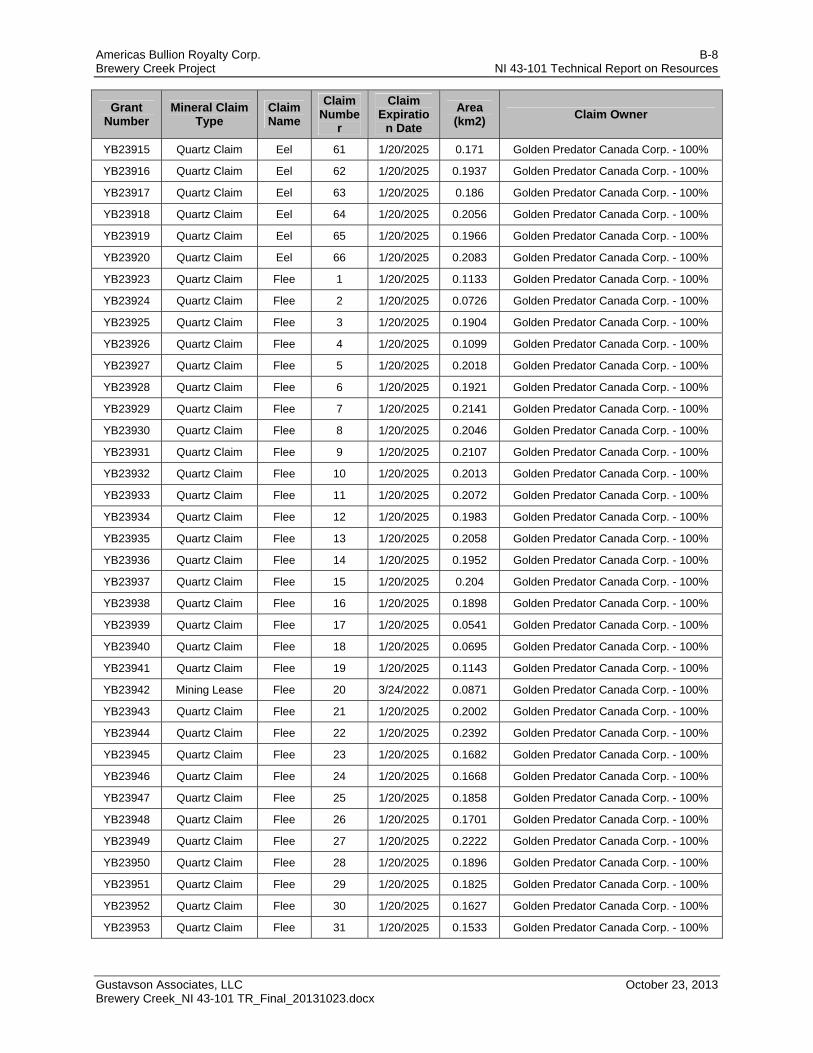
Americas Bullion Royalty Corp. B-8 Brewery Creek Project NI 43-101 Technical Report on Resources
Gustavson Associates, LLC October 23, 2013 Brewery Creek_NI 43-101 TR_Final_20131023.docx
Grant Number
Mineral Claim Type
Claim Name
Claim Numbe
r
Claim Expiratio
n Date
Area (km2)
Claim Owner
YB23915 Quartz Claim Eel 61 1/20/2025 0.171 Golden Predator Canada Corp. - 100%
YB23916 Quartz Claim Eel 62 1/20/2025 0.1937 Golden Predator Canada Corp. - 100%
YB23917 Quartz Claim Eel 63 1/20/2025 0.186 Golden Predator Canada Corp. - 100%
YB23918 Quartz Claim Eel 64 1/20/2025 0.2056 Golden Predator Canada Corp. - 100%
YB23919 Quartz Claim Eel 65 1/20/2025 0.1966 Golden Predator Canada Corp. - 100%
YB23920 Quartz Claim Eel 66 1/20/2025 0.2083 Golden Predator Canada Corp. - 100%
YB23923 Quartz Claim Flee 1 1/20/2025 0.1133 Golden Predator Canada Corp. - 100%
YB23924 Quartz Claim Flee 2 1/20/2025 0.0726 Golden Predator Canada Corp. - 100%
YB23925 Quartz Claim Flee 3 1/20/2025 0.1904 Golden Predator Canada Corp. - 100%
YB23926 Quartz Claim Flee 4 1/20/2025 0.1099 Golden Predator Canada Corp. - 100%
YB23927 Quartz Claim Flee 5 1/20/2025 0.2018 Golden Predator Canada Corp. - 100%
YB23928 Quartz Claim Flee 6 1/20/2025 0.1921 Golden Predator Canada Corp. - 100%
YB23929 Quartz Claim Flee 7 1/20/2025 0.2141 Golden Predator Canada Corp. - 100%
YB23930 Quartz Claim Flee 8 1/20/2025 0.2046 Golden Predator Canada Corp. - 100%
YB23931 Quartz Claim Flee 9 1/20/2025 0.2107 Golden Predator Canada Corp. - 100%
YB23932 Quartz Claim Flee 10 1/20/2025 0.2013 Golden Predator Canada Corp. - 100%
YB23933 Quartz Claim Flee 11 1/20/2025 0.2072 Golden Predator Canada Corp. - 100%
YB23934 Quartz Claim Flee 12 1/20/2025 0.1983 Golden Predator Canada Corp. - 100%
YB23935 Quartz Claim Flee 13 1/20/2025 0.2058 Golden Predator Canada Corp. - 100%
YB23936 Quartz Claim Flee 14 1/20/2025 0.1952 Golden Predator Canada Corp. - 100%
YB23937 Quartz Claim Flee 15 1/20/2025 0.204 Golden Predator Canada Corp. - 100%
YB23938 Quartz Claim Flee 16 1/20/2025 0.1898 Golden Predator Canada Corp. - 100%
YB23939 Quartz Claim Flee 17 1/20/2025 0.0541 Golden Predator Canada Corp. - 100%
YB23940 Quartz Claim Flee 18 1/20/2025 0.0695 Golden Predator Canada Corp. - 100%
YB23941 Quartz Claim Flee 19 1/20/2025 0.1143 Golden Predator Canada Corp. - 100%
YB23942 Mining Lease Flee 20 3/24/2022 0.0871 Golden Predator Canada Corp. - 100%
YB23943 Quartz Claim Flee 21 1/20/2025 0.2002 Golden Predator Canada Corp. - 100%
YB23944 Quartz Claim Flee 22 1/20/2025 0.2392 Golden Predator Canada Corp. - 100%
YB23945 Quartz Claim Flee 23 1/20/2025 0.1682 Golden Predator Canada Corp. - 100%
YB23946 Quartz Claim Flee 24 1/20/2025 0.1668 Golden Predator Canada Corp. - 100%
YB23947 Quartz Claim Flee 25 1/20/2025 0.1858 Golden Predator Canada Corp. - 100%
YB23948 Quartz Claim Flee 26 1/20/2025 0.1701 Golden Predator Canada Corp. - 100%
YB23949 Quartz Claim Flee 27 1/20/2025 0.2222 Golden Predator Canada Corp. - 100%
YB23950 Quartz Claim Flee 28 1/20/2025 0.1896 Golden Predator Canada Corp. - 100%
YB23951 Quartz Claim Flee 29 1/20/2025 0.1825 Golden Predator Canada Corp. - 100%
YB23952 Quartz Claim Flee 30 1/20/2025 0.1627 Golden Predator Canada Corp. - 100%
YB23953 Quartz Claim Flee 31 1/20/2025 0.1533 Golden Predator Canada Corp. - 100%
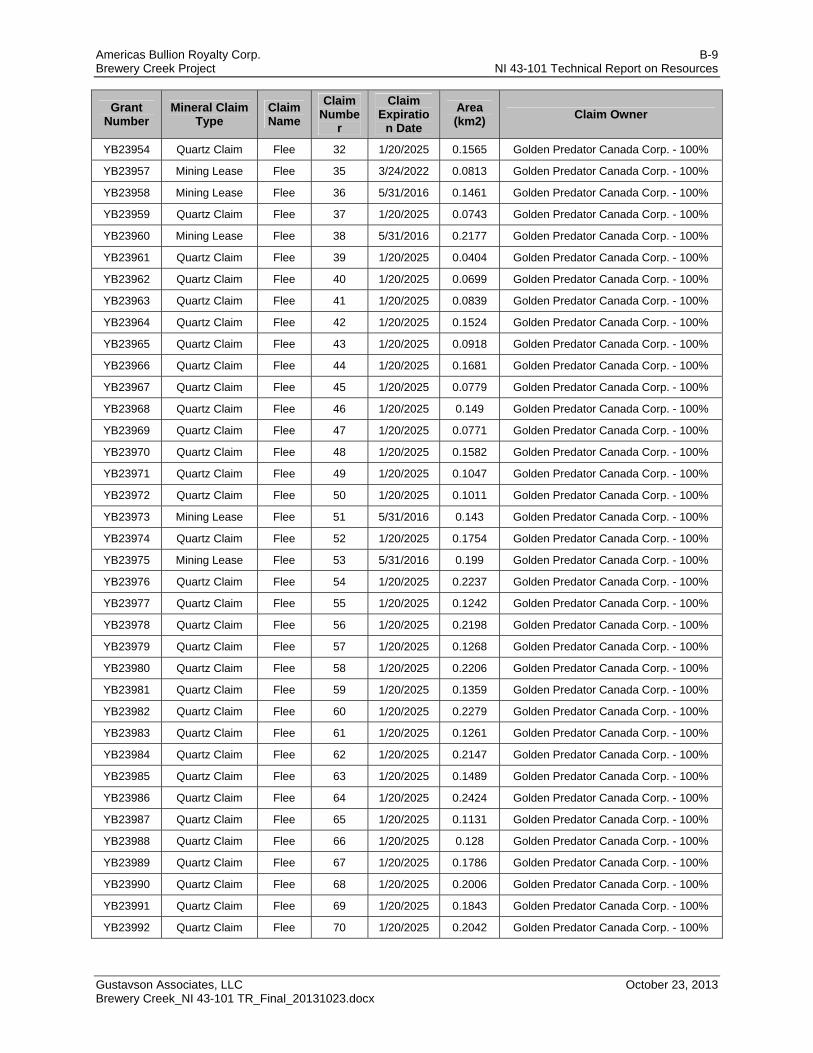
Americas Bullion Royalty Corp. B-9 Brewery Creek Project NI 43-101 Technical Report on Resources
Gustavson Associates, LLC October 23, 2013 Brewery Creek_NI 43-101 TR_Final_20131023.docx
Grant Number
Mineral Claim Type
Claim Name
Claim Numbe
r
Claim Expiratio
n Date
Area (km2)
Claim Owner
YB23954 Quartz Claim Flee 32 1/20/2025 0.1565 Golden Predator Canada Corp. - 100%
YB23957 Mining Lease Flee 35 3/24/2022 0.0813 Golden Predator Canada Corp. - 100%
YB23958 Mining Lease Flee 36 5/31/2016 0.1461 Golden Predator Canada Corp. - 100%
YB23959 Quartz Claim Flee 37 1/20/2025 0.0743 Golden Predator Canada Corp. - 100%
YB23960 Mining Lease Flee 38 5/31/2016 0.2177 Golden Predator Canada Corp. - 100%
YB23961 Quartz Claim Flee 39 1/20/2025 0.0404 Golden Predator Canada Corp. - 100%
YB23962 Quartz Claim Flee 40 1/20/2025 0.0699 Golden Predator Canada Corp. - 100%
YB23963 Quartz Claim Flee 41 1/20/2025 0.0839 Golden Predator Canada Corp. - 100%
YB23964 Quartz Claim Flee 42 1/20/2025 0.1524 Golden Predator Canada Corp. - 100%
YB23965 Quartz Claim Flee 43 1/20/2025 0.0918 Golden Predator Canada Corp. - 100%
YB23966 Quartz Claim Flee 44 1/20/2025 0.1681 Golden Predator Canada Corp. - 100%
YB23967 Quartz Claim Flee 45 1/20/2025 0.0779 Golden Predator Canada Corp. - 100%
YB23968 Quartz Claim Flee 46 1/20/2025 0.149 Golden Predator Canada Corp. - 100%
YB23969 Quartz Claim Flee 47 1/20/2025 0.0771 Golden Predator Canada Corp. - 100%
YB23970 Quartz Claim Flee 48 1/20/2025 0.1582 Golden Predator Canada Corp. - 100%
YB23971 Quartz Claim Flee 49 1/20/2025 0.1047 Golden Predator Canada Corp. - 100%
YB23972 Quartz Claim Flee 50 1/20/2025 0.1011 Golden Predator Canada Corp. - 100%
YB23973 Mining Lease Flee 51 5/31/2016 0.143 Golden Predator Canada Corp. - 100%
YB23974 Quartz Claim Flee 52 1/20/2025 0.1754 Golden Predator Canada Corp. - 100%
YB23975 Mining Lease Flee 53 5/31/2016 0.199 Golden Predator Canada Corp. - 100%
YB23976 Quartz Claim Flee 54 1/20/2025 0.2237 Golden Predator Canada Corp. - 100%
YB23977 Quartz Claim Flee 55 1/20/2025 0.1242 Golden Predator Canada Corp. - 100%
YB23978 Quartz Claim Flee 56 1/20/2025 0.2198 Golden Predator Canada Corp. - 100%
YB23979 Quartz Claim Flee 57 1/20/2025 0.1268 Golden Predator Canada Corp. - 100%
YB23980 Quartz Claim Flee 58 1/20/2025 0.2206 Golden Predator Canada Corp. - 100%
YB23981 Quartz Claim Flee 59 1/20/2025 0.1359 Golden Predator Canada Corp. - 100%
YB23982 Quartz Claim Flee 60 1/20/2025 0.2279 Golden Predator Canada Corp. - 100%
YB23983 Quartz Claim Flee 61 1/20/2025 0.1261 Golden Predator Canada Corp. - 100%
YB23984 Quartz Claim Flee 62 1/20/2025 0.2147 Golden Predator Canada Corp. - 100%
YB23985 Quartz Claim Flee 63 1/20/2025 0.1489 Golden Predator Canada Corp. - 100%
YB23986 Quartz Claim Flee 64 1/20/2025 0.2424 Golden Predator Canada Corp. - 100%
YB23987 Quartz Claim Flee 65 1/20/2025 0.1131 Golden Predator Canada Corp. - 100%
YB23988 Quartz Claim Flee 66 1/20/2025 0.128 Golden Predator Canada Corp. - 100%
YB23989 Quartz Claim Flee 67 1/20/2025 0.1786 Golden Predator Canada Corp. - 100%
YB23990 Quartz Claim Flee 68 1/20/2025 0.2006 Golden Predator Canada Corp. - 100%
YB23991 Quartz Claim Flee 69 1/20/2025 0.1843 Golden Predator Canada Corp. - 100%
YB23992 Quartz Claim Flee 70 1/20/2025 0.2042 Golden Predator Canada Corp. - 100%
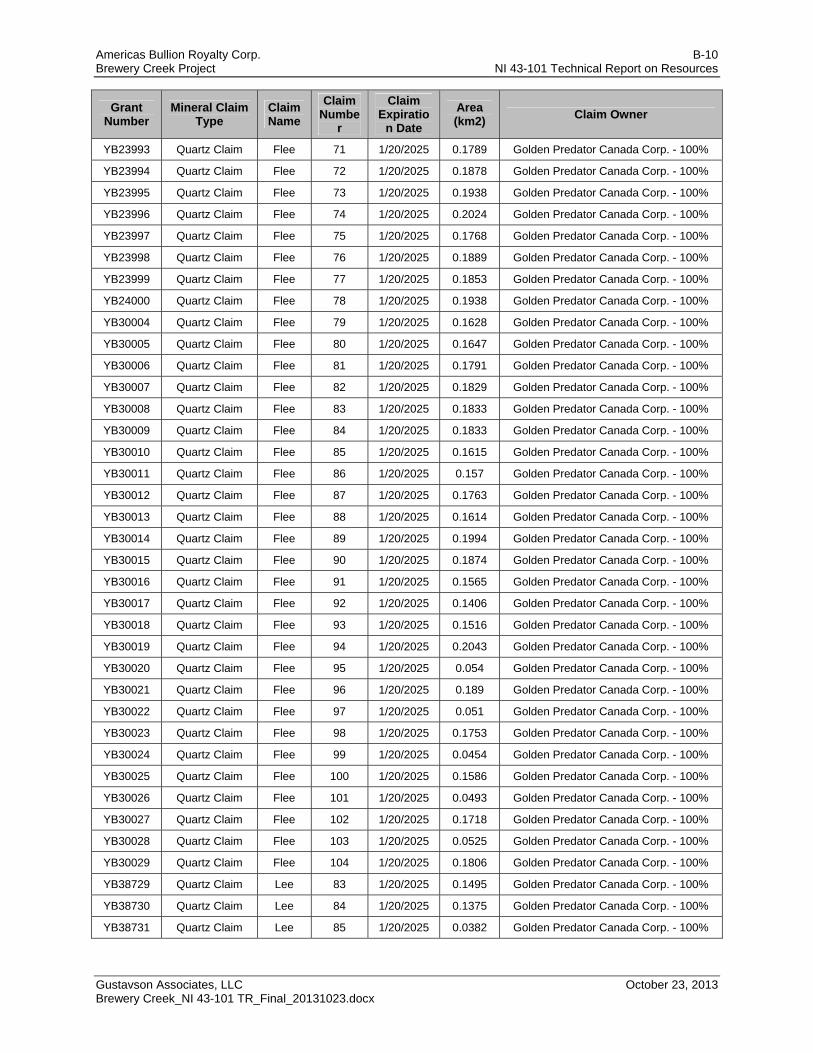
Americas Bullion Royalty Corp. B-10 Brewery Creek Project NI 43-101 Technical Report on Resources
Gustavson Associates, LLC October 23, 2013 Brewery Creek_NI 43-101 TR_Final_20131023.docx
Grant Number
Mineral Claim Type
Claim Name
Claim Numbe
r
Claim Expiratio
n Date
Area (km2)
Claim Owner
YB23993 Quartz Claim Flee 71 1/20/2025 0.1789 Golden Predator Canada Corp. - 100%
YB23994 Quartz Claim Flee 72 1/20/2025 0.1878 Golden Predator Canada Corp. - 100%
YB23995 Quartz Claim Flee 73 1/20/2025 0.1938 Golden Predator Canada Corp. - 100%
YB23996 Quartz Claim Flee 74 1/20/2025 0.2024 Golden Predator Canada Corp. - 100%
YB23997 Quartz Claim Flee 75 1/20/2025 0.1768 Golden Predator Canada Corp. - 100%
YB23998 Quartz Claim Flee 76 1/20/2025 0.1889 Golden Predator Canada Corp. - 100%
YB23999 Quartz Claim Flee 77 1/20/2025 0.1853 Golden Predator Canada Corp. - 100%
YB24000 Quartz Claim Flee 78 1/20/2025 0.1938 Golden Predator Canada Corp. - 100%
YB30004 Quartz Claim Flee 79 1/20/2025 0.1628 Golden Predator Canada Corp. - 100%
YB30005 Quartz Claim Flee 80 1/20/2025 0.1647 Golden Predator Canada Corp. - 100%
YB30006 Quartz Claim Flee 81 1/20/2025 0.1791 Golden Predator Canada Corp. - 100%
YB30007 Quartz Claim Flee 82 1/20/2025 0.1829 Golden Predator Canada Corp. - 100%
YB30008 Quartz Claim Flee 83 1/20/2025 0.1833 Golden Predator Canada Corp. - 100%
YB30009 Quartz Claim Flee 84 1/20/2025 0.1833 Golden Predator Canada Corp. - 100%
YB30010 Quartz Claim Flee 85 1/20/2025 0.1615 Golden Predator Canada Corp. - 100%
YB30011 Quartz Claim Flee 86 1/20/2025 0.157 Golden Predator Canada Corp. - 100%
YB30012 Quartz Claim Flee 87 1/20/2025 0.1763 Golden Predator Canada Corp. - 100%
YB30013 Quartz Claim Flee 88 1/20/2025 0.1614 Golden Predator Canada Corp. - 100%
YB30014 Quartz Claim Flee 89 1/20/2025 0.1994 Golden Predator Canada Corp. - 100%
YB30015 Quartz Claim Flee 90 1/20/2025 0.1874 Golden Predator Canada Corp. - 100%
YB30016 Quartz Claim Flee 91 1/20/2025 0.1565 Golden Predator Canada Corp. - 100%
YB30017 Quartz Claim Flee 92 1/20/2025 0.1406 Golden Predator Canada Corp. - 100%
YB30018 Quartz Claim Flee 93 1/20/2025 0.1516 Golden Predator Canada Corp. - 100%
YB30019 Quartz Claim Flee 94 1/20/2025 0.2043 Golden Predator Canada Corp. - 100%
YB30020 Quartz Claim Flee 95 1/20/2025 0.054 Golden Predator Canada Corp. - 100%
YB30021 Quartz Claim Flee 96 1/20/2025 0.189 Golden Predator Canada Corp. - 100%
YB30022 Quartz Claim Flee 97 1/20/2025 0.051 Golden Predator Canada Corp. - 100%
YB30023 Quartz Claim Flee 98 1/20/2025 0.1753 Golden Predator Canada Corp. - 100%
YB30024 Quartz Claim Flee 99 1/20/2025 0.0454 Golden Predator Canada Corp. - 100%
YB30025 Quartz Claim Flee 100 1/20/2025 0.1586 Golden Predator Canada Corp. - 100%
YB30026 Quartz Claim Flee 101 1/20/2025 0.0493 Golden Predator Canada Corp. - 100%
YB30027 Quartz Claim Flee 102 1/20/2025 0.1718 Golden Predator Canada Corp. - 100%
YB30028 Quartz Claim Flee 103 1/20/2025 0.0525 Golden Predator Canada Corp. - 100%
YB30029 Quartz Claim Flee 104 1/20/2025 0.1806 Golden Predator Canada Corp. - 100%
YB38729 Quartz Claim Lee 83 1/20/2025 0.1495 Golden Predator Canada Corp. - 100%
YB38730 Quartz Claim Lee 84 1/20/2025 0.1375 Golden Predator Canada Corp. - 100%
YB38731 Quartz Claim Lee 85 1/20/2025 0.0382 Golden Predator Canada Corp. - 100%
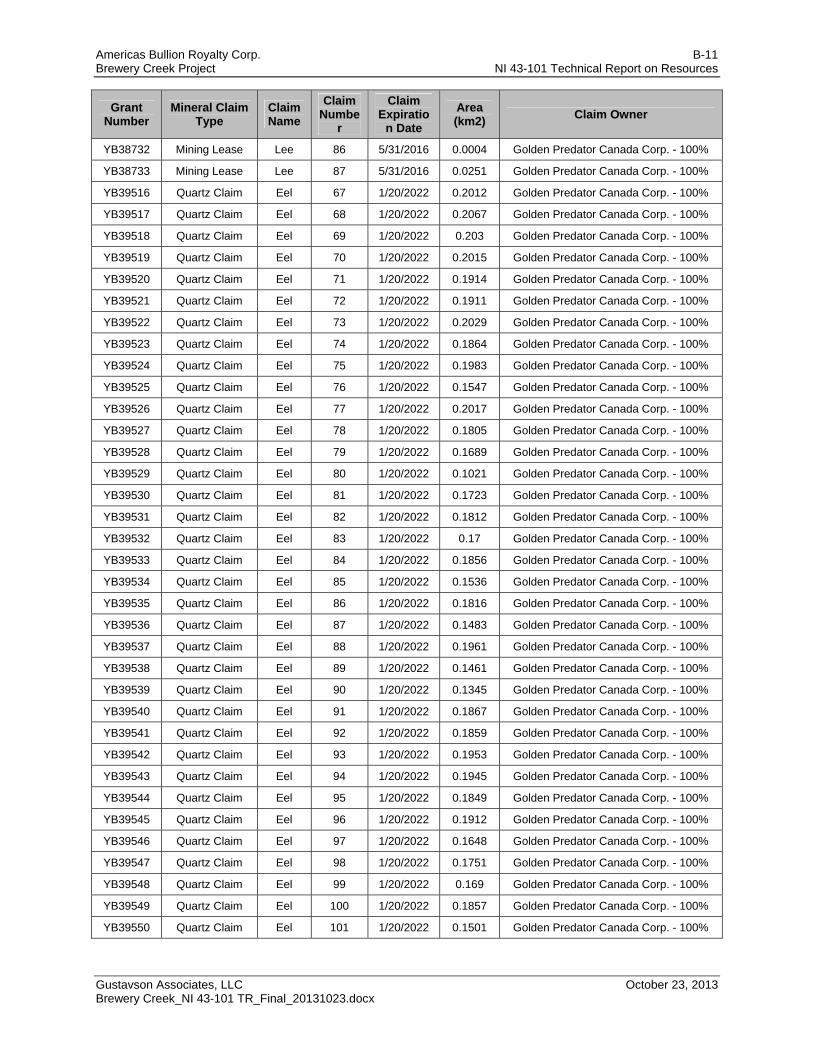
Americas Bullion Royalty Corp. B-11 Brewery Creek Project NI 43-101 Technical Report on Resources
Gustavson Associates, LLC October 23, 2013 Brewery Creek_NI 43-101 TR_Final_20131023.docx
Grant Number
Mineral Claim Type
Claim Name
Claim Numbe
r
Claim Expiratio
n Date
Area (km2)
Claim Owner
YB38732 Mining Lease Lee 86 5/31/2016 0.0004 Golden Predator Canada Corp. - 100%
YB38733 Mining Lease Lee 87 5/31/2016 0.0251 Golden Predator Canada Corp. - 100%
YB39516 Quartz Claim Eel 67 1/20/2022 0.2012 Golden Predator Canada Corp. - 100%
YB39517 Quartz Claim Eel 68 1/20/2022 0.2067 Golden Predator Canada Corp. - 100%
YB39518 Quartz Claim Eel 69 1/20/2022 0.203 Golden Predator Canada Corp. - 100%
YB39519 Quartz Claim Eel 70 1/20/2022 0.2015 Golden Predator Canada Corp. - 100%
YB39520 Quartz Claim Eel 71 1/20/2022 0.1914 Golden Predator Canada Corp. - 100%
YB39521 Quartz Claim Eel 72 1/20/2022 0.1911 Golden Predator Canada Corp. - 100%
YB39522 Quartz Claim Eel 73 1/20/2022 0.2029 Golden Predator Canada Corp. - 100%
YB39523 Quartz Claim Eel 74 1/20/2022 0.1864 Golden Predator Canada Corp. - 100%
YB39524 Quartz Claim Eel 75 1/20/2022 0.1983 Golden Predator Canada Corp. - 100%
YB39525 Quartz Claim Eel 76 1/20/2022 0.1547 Golden Predator Canada Corp. - 100%
YB39526 Quartz Claim Eel 77 1/20/2022 0.2017 Golden Predator Canada Corp. - 100%
YB39527 Quartz Claim Eel 78 1/20/2022 0.1805 Golden Predator Canada Corp. - 100%
YB39528 Quartz Claim Eel 79 1/20/2022 0.1689 Golden Predator Canada Corp. - 100%
YB39529 Quartz Claim Eel 80 1/20/2022 0.1021 Golden Predator Canada Corp. - 100%
YB39530 Quartz Claim Eel 81 1/20/2022 0.1723 Golden Predator Canada Corp. - 100%
YB39531 Quartz Claim Eel 82 1/20/2022 0.1812 Golden Predator Canada Corp. - 100%
YB39532 Quartz Claim Eel 83 1/20/2022 0.17 Golden Predator Canada Corp. - 100%
YB39533 Quartz Claim Eel 84 1/20/2022 0.1856 Golden Predator Canada Corp. - 100%
YB39534 Quartz Claim Eel 85 1/20/2022 0.1536 Golden Predator Canada Corp. - 100%
YB39535 Quartz Claim Eel 86 1/20/2022 0.1816 Golden Predator Canada Corp. - 100%
YB39536 Quartz Claim Eel 87 1/20/2022 0.1483 Golden Predator Canada Corp. - 100%
YB39537 Quartz Claim Eel 88 1/20/2022 0.1961 Golden Predator Canada Corp. - 100%
YB39538 Quartz Claim Eel 89 1/20/2022 0.1461 Golden Predator Canada Corp. - 100%
YB39539 Quartz Claim Eel 90 1/20/2022 0.1345 Golden Predator Canada Corp. - 100%
YB39540 Quartz Claim Eel 91 1/20/2022 0.1867 Golden Predator Canada Corp. - 100%
YB39541 Quartz Claim Eel 92 1/20/2022 0.1859 Golden Predator Canada Corp. - 100%
YB39542 Quartz Claim Eel 93 1/20/2022 0.1953 Golden Predator Canada Corp. - 100%
YB39543 Quartz Claim Eel 94 1/20/2022 0.1945 Golden Predator Canada Corp. - 100%
YB39544 Quartz Claim Eel 95 1/20/2022 0.1849 Golden Predator Canada Corp. - 100%
YB39545 Quartz Claim Eel 96 1/20/2022 0.1912 Golden Predator Canada Corp. - 100%
YB39546 Quartz Claim Eel 97 1/20/2022 0.1648 Golden Predator Canada Corp. - 100%
YB39547 Quartz Claim Eel 98 1/20/2022 0.1751 Golden Predator Canada Corp. - 100%
YB39548 Quartz Claim Eel 99 1/20/2022 0.169 Golden Predator Canada Corp. - 100%
YB39549 Quartz Claim Eel 100 1/20/2022 0.1857 Golden Predator Canada Corp. - 100%
YB39550 Quartz Claim Eel 101 1/20/2022 0.1501 Golden Predator Canada Corp. - 100%

Americas Bullion Royalty Corp. B-12 Brewery Creek Project NI 43-101 Technical Report on Resources
Gustavson Associates, LLC October 23, 2013 Brewery Creek_NI 43-101 TR_Final_20131023.docx
Grant Number
Mineral Claim Type
Claim Name
Claim Numbe
r
Claim Expiratio
n Date
Area (km2)
Claim Owner
YB39551 Quartz Claim Eel 102 1/20/2022 0.1491 Golden Predator Canada Corp. - 100%
YB39552 Quartz Claim Eel 103 1/20/2022 0.1932 Golden Predator Canada Corp. - 100%
YB39553 Quartz Claim Eel 104 1/20/2022 0.1847 Golden Predator Canada Corp. - 100%
YB39554 Quartz Claim Eel 105 1/20/2022 0.1982 Golden Predator Canada Corp. - 100%
YB39555 Quartz Claim Eel 106 1/20/2022 0.1856 Golden Predator Canada Corp. - 100%
YB39556 Quartz Claim Eel 107 1/20/2022 0.1981 Golden Predator Canada Corp. - 100%
YB39557 Quartz Claim Eel 108 1/20/2022 0.187 Golden Predator Canada Corp. - 100%
YB39558 Quartz Claim Eel 109 1/20/2022 0.1837 Golden Predator Canada Corp. - 100%
YB39559 Quartz Claim Eel 110 1/20/2022 0.1745 Golden Predator Canada Corp. - 100%
YB39560 Quartz Claim Eel 111 1/20/2022 0.1996 Golden Predator Canada Corp. - 100%
YB39561 Quartz Claim Eel 112 1/20/2022 0.1778 Golden Predator Canada Corp. - 100%
YB39562 Quartz Claim Eel 113 1/20/2022 0.0904 Golden Predator Canada Corp. - 100%
YB39563 Quartz Claim Eel 114 1/20/2022 0.0093 Golden Predator Canada Corp. - 100%
YB39564 Quartz Claim Eel 115 1/20/2022 0.1245 Golden Predator Canada Corp. - 100%
YB39565 Mining Lease Eel 116 5/31/2016 0.0704 Golden Predator Canada Corp. - 100%
YB39566 Quartz Claim Eel 117 1/20/2022 0.1597 Golden Predator Canada Corp. - 100%
YB39567 Quartz Claim Eel 118 1/20/2022 0.1548 Golden Predator Canada Corp. - 100%
YB39568 Quartz Claim Eel 119 1/20/2022 0.1784 Golden Predator Canada Corp. - 100%
YB39569 Quartz Claim Eel 120 1/20/2022 0.1886 Golden Predator Canada Corp. - 100%
YB39570 Quartz Claim Eel 121 1/20/2022 0.1916 Golden Predator Canada Corp. - 100%
YB39571 Quartz Claim Eel 122 1/20/2022 0.2099 Golden Predator Canada Corp. - 100%
YB39572 Quartz Claim Eel 123 1/20/2022 0.1355 Golden Predator Canada Corp. - 100%
YB39573 Quartz Claim Eel 124 1/20/2022 0.2164 Golden Predator Canada Corp. - 100%
YB39574 Quartz Claim Eel 125 1/20/2022 0.1261 Golden Predator Canada Corp. - 100%
YB39575 Quartz Claim Eel 126 1/20/2022 0.2236 Golden Predator Canada Corp. - 100%
YB39576 Quartz Claim Eel 127 1/20/2022 0.2158 Golden Predator Canada Corp. - 100%
YB39577 Quartz Claim Eel 128 1/20/2022 0.1812 Golden Predator Canada Corp. - 100%
YB39578 Quartz Claim Eel 129 1/20/2022 0.1902 Golden Predator Canada Corp. - 100%
YB39579 Quartz Claim Eel 130 1/20/2022 0.1741 Golden Predator Canada Corp. - 100%
YB39580 Quartz Claim Eel 131 1/20/2022 0.1999 Golden Predator Canada Corp. - 100%
YB39581 Quartz Claim Eel 132 1/20/2022 0.1849 Golden Predator Canada Corp. - 100%
YB39582 Quartz Claim Eel 133 1/20/2022 0.1691 Golden Predator Canada Corp. - 100%
YB39583 Quartz Claim Eel 134 1/20/2022 0.1544 Golden Predator Canada Corp. - 100%
YB39584 Quartz Claim Eel 135 1/20/2022 0.1843 Golden Predator Canada Corp. - 100%
YB39585 Quartz Claim Eel 136 1/20/2022 0.178 Golden Predator Canada Corp. - 100%
YB39586 Quartz Claim Eel 137 1/20/2022 0.1884 Golden Predator Canada Corp. - 100%
YB39587 Quartz Claim Eel 138 1/20/2022 0.1535 Golden Predator Canada Corp. - 100%

Americas Bullion Royalty Corp. B-13 Brewery Creek Project NI 43-101 Technical Report on Resources
Gustavson Associates, LLC October 23, 2013 Brewery Creek_NI 43-101 TR_Final_20131023.docx
Grant Number
Mineral Claim Type
Claim Name
Claim Numbe
r
Claim Expiratio
n Date
Area (km2)
Claim Owner
YB39588 Quartz Claim Eel 139 1/20/2022 0.0766 Golden Predator Canada Corp. - 100%
YB39589 Quartz Claim Eel 140 1/20/2022 0.0431 Golden Predator Canada Corp. - 100%
YB39590 Quartz Claim Eel 141 1/20/2022 0.1271 Golden Predator Canada Corp. - 100%
YB39591 Quartz Claim Eel 142 1/20/2022 0.1093 Golden Predator Canada Corp. - 100%
YB39592 Quartz Claim Eel 143 1/20/2022 0.1087 Golden Predator Canada Corp. - 100%
YB39593 Quartz Claim Eel 144 1/20/2022 0.142 Golden Predator Canada Corp. - 100%
YB39594 Quartz Claim Eel 145 1/20/2022 0.1904 Golden Predator Canada Corp. - 100%
YB39595 Quartz Claim Eel 146 1/20/2022 0.1947 Golden Predator Canada Corp. - 100%
YB39596 Quartz Claim Eel 147 1/20/2022 0.1849 Golden Predator Canada Corp. - 100%
YB39597 Quartz Claim Eel 148 1/20/2022 0.1897 Golden Predator Canada Corp. - 100%
YB39598 Quartz Claim Eel 149 1/20/2022 0.1953 Golden Predator Canada Corp. - 100%
YB39599 Quartz Claim Eel 150 1/20/2022 0.1994 Golden Predator Canada Corp. - 100%
YB39600 Quartz Claim Eel 151 1/20/2022 0.1593 Golden Predator Canada Corp. - 100%
YB39601 Quartz Claim Eel 152 1/20/2022 0.1666 Golden Predator Canada Corp. - 100%
YB39602 Quartz Claim Eel 153 1/20/2022 0.1713 Golden Predator Canada Corp. - 100%
YB39603 Quartz Claim Eel 154 1/20/2022 0.1748 Golden Predator Canada Corp. - 100%
YB39604 Quartz Claim Eel 155 1/20/2022 0.1774 Golden Predator Canada Corp. - 100%
YB39605 Quartz Claim Eel 156 1/20/2022 0.1879 Golden Predator Canada Corp. - 100%
YB39606 Quartz Claim Eel 157 1/20/2022 0.1876 Golden Predator Canada Corp. - 100%
YB39607 Quartz Claim Eel 158 1/20/2022 0.1953 Golden Predator Canada Corp. - 100%
YB39608 Quartz Claim Eel 159 1/20/2022 0.1624 Golden Predator Canada Corp. - 100%
YB39609 Quartz Claim Eel 160 1/20/2022 0.1848 Golden Predator Canada Corp. - 100%
YB39610 Quartz Claim Eel 161 1/20/2022 0.1539 Golden Predator Canada Corp. - 100%
YB39611 Quartz Claim Eel 162 1/20/2022 0.1547 Golden Predator Canada Corp. - 100%
YB39612 Quartz Claim Eel 163 1/20/2022 0.0793 Golden Predator Canada Corp. - 100%
YB39613 Quartz Claim Eel 164 1/20/2022 0.1811 Golden Predator Canada Corp. - 100%
YB39614 Quartz Claim Eel 165 1/20/2022 0.0981 Golden Predator Canada Corp. - 100%
YB39615 Quartz Claim Eel 166 1/20/2022 0.1734 Golden Predator Canada Corp. - 100%
YB39616 Quartz Claim Eel 167 1/20/2022 0.1504 Golden Predator Canada Corp. - 100%
YB39617 Quartz Claim Eel 168 1/20/2022 0.2047 Golden Predator Canada Corp. - 100%
YB39618 Quartz Claim Eel 169 1/20/2022 0.1703 Golden Predator Canada Corp. - 100%
YB39619 Quartz Claim Eel 170 1/20/2022 0.1871 Golden Predator Canada Corp. - 100%
YB39620 Quartz Claim Eel 171 1/20/2022 0.1948 Golden Predator Canada Corp. - 100%
YB39621 Quartz Claim Eel 172 1/20/2022 0.1787 Golden Predator Canada Corp. - 100%
YB39622 Quartz Claim Eel 173 1/20/2022 0.1719 Golden Predator Canada Corp. - 100%
YB39623 Quartz Claim Eel 174 1/20/2022 0.1903 Golden Predator Canada Corp. - 100%
YB39624 Quartz Claim Eel 175 1/20/2022 0.1692 Golden Predator Canada Corp. - 100%

Americas Bullion Royalty Corp. B-14 Brewery Creek Project NI 43-101 Technical Report on Resources
Gustavson Associates, LLC October 23, 2013 Brewery Creek_NI 43-101 TR_Final_20131023.docx
Grant Number
Mineral Claim Type
Claim Name
Claim Numbe
r
Claim Expiratio
n Date
Area (km2)
Claim Owner
YB39625 Quartz Claim Eel 176 1/20/2022 0.1821 Golden Predator Canada Corp. - 100%
YB39626 Quartz Claim Eel 177 1/20/2022 0.2039 Golden Predator Canada Corp. - 100%
YB39627 Quartz Claim Eel 178 1/20/2022 0.211 Golden Predator Canada Corp. - 100%
YB39628 Quartz Claim Eel 179 1/20/2022 0.1956 Golden Predator Canada Corp. - 100%
YB39629 Quartz Claim Eel 180 1/20/2022 0.1994 Golden Predator Canada Corp. - 100%
YB39630 Quartz Claim Eel 181 1/20/2022 0.1941 Golden Predator Canada Corp. - 100%
YB39631 Quartz Claim Eel 182 1/20/2022 0.1939 Golden Predator Canada Corp. - 100%
YB39632 Quartz Claim Eel 183 1/20/2022 0.2042 Golden Predator Canada Corp. - 100%
YB39633 Quartz Claim Eel 184 1/20/2022 0.2046 Golden Predator Canada Corp. - 100%
YB39634 Quartz Claim Eel 185 1/20/2022 0.191 Golden Predator Canada Corp. - 100%
YB39635 Quartz Claim Eel 186 1/20/2022 0.1866 Golden Predator Canada Corp. - 100%
YB39636 Quartz Claim Eel 187 1/20/2022 0.2141 Golden Predator Canada Corp. - 100%
YB39637 Quartz Claim Eel 188 1/20/2022 0.2018 Golden Predator Canada Corp. - 100%
YB39638 Quartz Claim Eel 189 1/20/2022 0.2008 Golden Predator Canada Corp. - 100%
YB39639 Quartz Claim Eel 190 1/20/2022 0.1873 Golden Predator Canada Corp. - 100%
YB39640 Quartz Claim Eel 191 1/20/2022 0.1924 Golden Predator Canada Corp. - 100%
YB39641 Quartz Claim Eel 192 1/20/2022 0.1763 Golden Predator Canada Corp. - 100%
YB39642 Quartz Claim Eel 195 1/20/2022 0.1309 Golden Predator Canada Corp. - 100%
YB39643 Quartz Claim Eel 196 1/20/2022 0.1634 Golden Predator Canada Corp. - 100%
YB39644 Quartz Claim Eel 197 1/20/2022 0.1467 Golden Predator Canada Corp. - 100%
YB39645 Quartz Claim Eel 198 1/20/2022 0.1736 Golden Predator Canada Corp. - 100%
YB39646 Quartz Claim Eel 199 1/20/2022 0.1495 Golden Predator Canada Corp. - 100%
YB39647 Quartz Claim Eel 200 1/20/2022 0.1737 Golden Predator Canada Corp. - 100%
YB39648 Quartz Claim Eel 201 1/20/2022 0.165 Golden Predator Canada Corp. - 100%
YB39649 Quartz Claim Eel 202 1/20/2022 0.189 Golden Predator Canada Corp. - 100%
YB39650 Quartz Claim Eel 203 1/20/2022 0.164 Golden Predator Canada Corp. - 100%
YB39651 Quartz Claim Eel 204 1/20/2022 0.1863 Golden Predator Canada Corp. - 100%
YB39652 Quartz Claim Eel 205 1/20/2022 0.1647 Golden Predator Canada Corp. - 100%
YB39653 Quartz Claim Eel 206 1/20/2022 0.1897 Golden Predator Canada Corp. - 100%
YB39654 Quartz Claim Eel 207 1/20/2022 0.1531 Golden Predator Canada Corp. - 100%
YB39655 Quartz Claim Eel 208 1/20/2022 0.1811 Golden Predator Canada Corp. - 100%
YB39656 Quartz Claim Eel 209 1/20/2022 0.1282 Golden Predator Canada Corp. - 100%
YB39657 Quartz Claim Eel 210 1/20/2022 0.1475 Golden Predator Canada Corp. - 100%
YB39658 Quartz Claim Eel 211 1/20/2022 0.1621 Golden Predator Canada Corp. - 100%
YB39659 Quartz Claim Eel 212 1/20/2022 0.1691 Golden Predator Canada Corp. - 100%
YB39660 Quartz Claim Eel 213 1/20/2022 0.1876 Golden Predator Canada Corp. - 100%
YB39661 Quartz Claim Eel 214 1/20/2022 0.1884 Golden Predator Canada Corp. - 100%
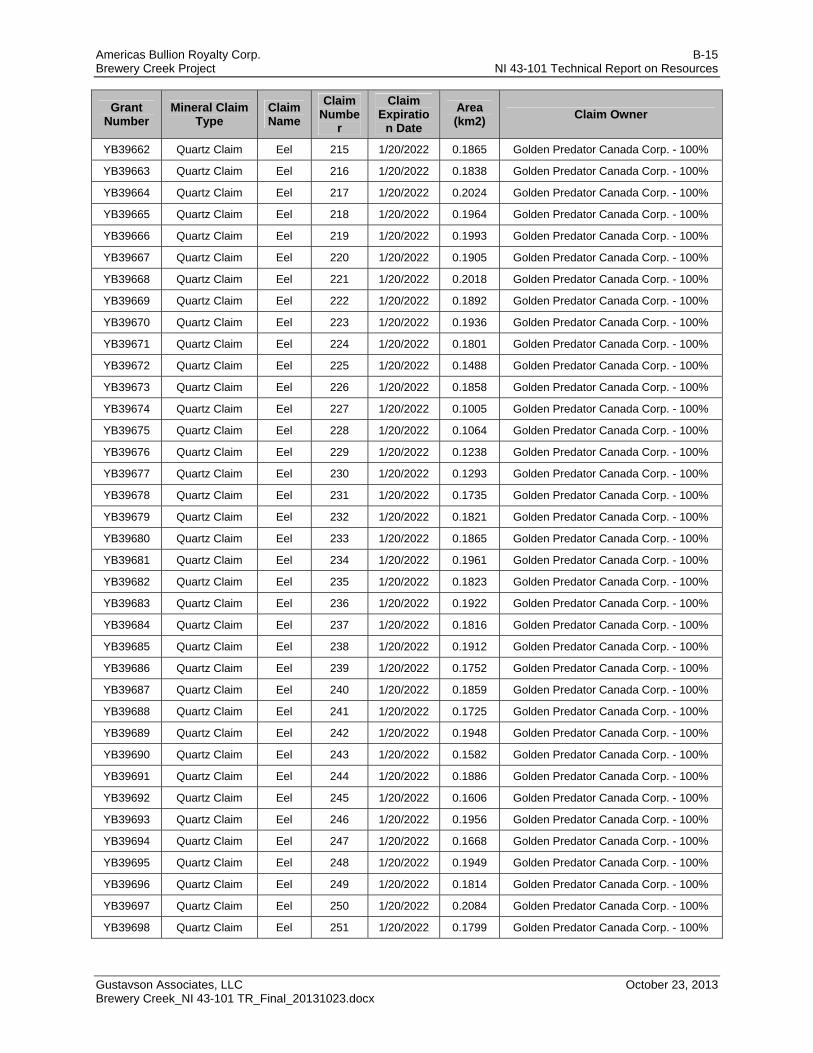
Americas Bullion Royalty Corp. B-15 Brewery Creek Project NI 43-101 Technical Report on Resources
Gustavson Associates, LLC October 23, 2013 Brewery Creek_NI 43-101 TR_Final_20131023.docx
Grant Number
Mineral Claim Type
Claim Name
Claim Numbe
r
Claim Expiratio
n Date
Area (km2)
Claim Owner
YB39662 Quartz Claim Eel 215 1/20/2022 0.1865 Golden Predator Canada Corp. - 100%
YB39663 Quartz Claim Eel 216 1/20/2022 0.1838 Golden Predator Canada Corp. - 100%
YB39664 Quartz Claim Eel 217 1/20/2022 0.2024 Golden Predator Canada Corp. - 100%
YB39665 Quartz Claim Eel 218 1/20/2022 0.1964 Golden Predator Canada Corp. - 100%
YB39666 Quartz Claim Eel 219 1/20/2022 0.1993 Golden Predator Canada Corp. - 100%
YB39667 Quartz Claim Eel 220 1/20/2022 0.1905 Golden Predator Canada Corp. - 100%
YB39668 Quartz Claim Eel 221 1/20/2022 0.2018 Golden Predator Canada Corp. - 100%
YB39669 Quartz Claim Eel 222 1/20/2022 0.1892 Golden Predator Canada Corp. - 100%
YB39670 Quartz Claim Eel 223 1/20/2022 0.1936 Golden Predator Canada Corp. - 100%
YB39671 Quartz Claim Eel 224 1/20/2022 0.1801 Golden Predator Canada Corp. - 100%
YB39672 Quartz Claim Eel 225 1/20/2022 0.1488 Golden Predator Canada Corp. - 100%
YB39673 Quartz Claim Eel 226 1/20/2022 0.1858 Golden Predator Canada Corp. - 100%
YB39674 Quartz Claim Eel 227 1/20/2022 0.1005 Golden Predator Canada Corp. - 100%
YB39675 Quartz Claim Eel 228 1/20/2022 0.1064 Golden Predator Canada Corp. - 100%
YB39676 Quartz Claim Eel 229 1/20/2022 0.1238 Golden Predator Canada Corp. - 100%
YB39677 Quartz Claim Eel 230 1/20/2022 0.1293 Golden Predator Canada Corp. - 100%
YB39678 Quartz Claim Eel 231 1/20/2022 0.1735 Golden Predator Canada Corp. - 100%
YB39679 Quartz Claim Eel 232 1/20/2022 0.1821 Golden Predator Canada Corp. - 100%
YB39680 Quartz Claim Eel 233 1/20/2022 0.1865 Golden Predator Canada Corp. - 100%
YB39681 Quartz Claim Eel 234 1/20/2022 0.1961 Golden Predator Canada Corp. - 100%
YB39682 Quartz Claim Eel 235 1/20/2022 0.1823 Golden Predator Canada Corp. - 100%
YB39683 Quartz Claim Eel 236 1/20/2022 0.1922 Golden Predator Canada Corp. - 100%
YB39684 Quartz Claim Eel 237 1/20/2022 0.1816 Golden Predator Canada Corp. - 100%
YB39685 Quartz Claim Eel 238 1/20/2022 0.1912 Golden Predator Canada Corp. - 100%
YB39686 Quartz Claim Eel 239 1/20/2022 0.1752 Golden Predator Canada Corp. - 100%
YB39687 Quartz Claim Eel 240 1/20/2022 0.1859 Golden Predator Canada Corp. - 100%
YB39688 Quartz Claim Eel 241 1/20/2022 0.1725 Golden Predator Canada Corp. - 100%
YB39689 Quartz Claim Eel 242 1/20/2022 0.1948 Golden Predator Canada Corp. - 100%
YB39690 Quartz Claim Eel 243 1/20/2022 0.1582 Golden Predator Canada Corp. - 100%
YB39691 Quartz Claim Eel 244 1/20/2022 0.1886 Golden Predator Canada Corp. - 100%
YB39692 Quartz Claim Eel 245 1/20/2022 0.1606 Golden Predator Canada Corp. - 100%
YB39693 Quartz Claim Eel 246 1/20/2022 0.1956 Golden Predator Canada Corp. - 100%
YB39694 Quartz Claim Eel 247 1/20/2022 0.1668 Golden Predator Canada Corp. - 100%
YB39695 Quartz Claim Eel 248 1/20/2022 0.1949 Golden Predator Canada Corp. - 100%
YB39696 Quartz Claim Eel 249 1/20/2022 0.1814 Golden Predator Canada Corp. - 100%
YB39697 Quartz Claim Eel 250 1/20/2022 0.2084 Golden Predator Canada Corp. - 100%
YB39698 Quartz Claim Eel 251 1/20/2022 0.1799 Golden Predator Canada Corp. - 100%
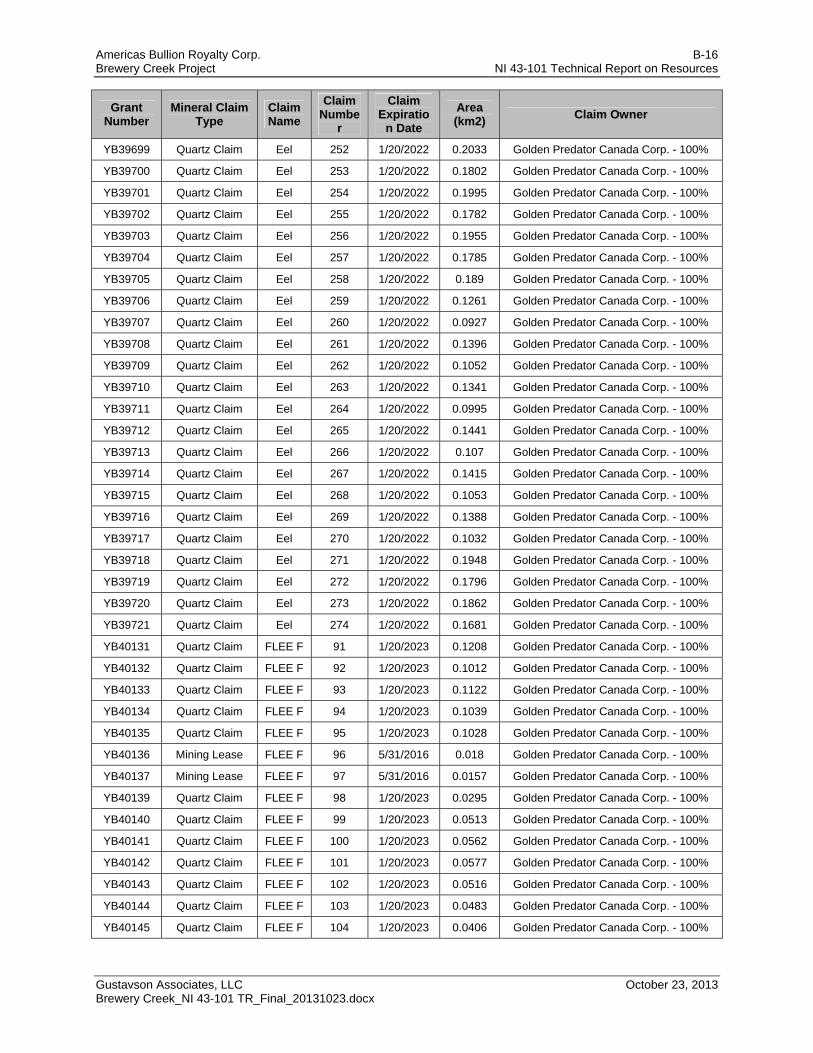
Americas Bullion Royalty Corp. B-16 Brewery Creek Project NI 43-101 Technical Report on Resources
Gustavson Associates, LLC October 23, 2013 Brewery Creek_NI 43-101 TR_Final_20131023.docx
Grant Number
Mineral Claim Type
Claim Name
Claim Numbe
r
Claim Expiratio
n Date
Area (km2)
Claim Owner
YB39699 Quartz Claim Eel 252 1/20/2022 0.2033 Golden Predator Canada Corp. - 100%
YB39700 Quartz Claim Eel 253 1/20/2022 0.1802 Golden Predator Canada Corp. - 100%
YB39701 Quartz Claim Eel 254 1/20/2022 0.1995 Golden Predator Canada Corp. - 100%
YB39702 Quartz Claim Eel 255 1/20/2022 0.1782 Golden Predator Canada Corp. - 100%
YB39703 Quartz Claim Eel 256 1/20/2022 0.1955 Golden Predator Canada Corp. - 100%
YB39704 Quartz Claim Eel 257 1/20/2022 0.1785 Golden Predator Canada Corp. - 100%
YB39705 Quartz Claim Eel 258 1/20/2022 0.189 Golden Predator Canada Corp. - 100%
YB39706 Quartz Claim Eel 259 1/20/2022 0.1261 Golden Predator Canada Corp. - 100%
YB39707 Quartz Claim Eel 260 1/20/2022 0.0927 Golden Predator Canada Corp. - 100%
YB39708 Quartz Claim Eel 261 1/20/2022 0.1396 Golden Predator Canada Corp. - 100%
YB39709 Quartz Claim Eel 262 1/20/2022 0.1052 Golden Predator Canada Corp. - 100%
YB39710 Quartz Claim Eel 263 1/20/2022 0.1341 Golden Predator Canada Corp. - 100%
YB39711 Quartz Claim Eel 264 1/20/2022 0.0995 Golden Predator Canada Corp. - 100%
YB39712 Quartz Claim Eel 265 1/20/2022 0.1441 Golden Predator Canada Corp. - 100%
YB39713 Quartz Claim Eel 266 1/20/2022 0.107 Golden Predator Canada Corp. - 100%
YB39714 Quartz Claim Eel 267 1/20/2022 0.1415 Golden Predator Canada Corp. - 100%
YB39715 Quartz Claim Eel 268 1/20/2022 0.1053 Golden Predator Canada Corp. - 100%
YB39716 Quartz Claim Eel 269 1/20/2022 0.1388 Golden Predator Canada Corp. - 100%
YB39717 Quartz Claim Eel 270 1/20/2022 0.1032 Golden Predator Canada Corp. - 100%
YB39718 Quartz Claim Eel 271 1/20/2022 0.1948 Golden Predator Canada Corp. - 100%
YB39719 Quartz Claim Eel 272 1/20/2022 0.1796 Golden Predator Canada Corp. - 100%
YB39720 Quartz Claim Eel 273 1/20/2022 0.1862 Golden Predator Canada Corp. - 100%
YB39721 Quartz Claim Eel 274 1/20/2022 0.1681 Golden Predator Canada Corp. - 100%
YB40131 Quartz Claim FLEE F 91 1/20/2023 0.1208 Golden Predator Canada Corp. - 100%
YB40132 Quartz Claim FLEE F 92 1/20/2023 0.1012 Golden Predator Canada Corp. - 100%
YB40133 Quartz Claim FLEE F 93 1/20/2023 0.1122 Golden Predator Canada Corp. - 100%
YB40134 Quartz Claim FLEE F 94 1/20/2023 0.1039 Golden Predator Canada Corp. - 100%
YB40135 Quartz Claim FLEE F 95 1/20/2023 0.1028 Golden Predator Canada Corp. - 100%
YB40136 Mining Lease FLEE F 96 5/31/2016 0.018 Golden Predator Canada Corp. - 100%
YB40137 Mining Lease FLEE F 97 5/31/2016 0.0157 Golden Predator Canada Corp. - 100%
YB40139 Quartz Claim FLEE F 98 1/20/2023 0.0295 Golden Predator Canada Corp. - 100%
YB40140 Quartz Claim FLEE F 99 1/20/2023 0.0513 Golden Predator Canada Corp. - 100%
YB40141 Quartz Claim FLEE F 100 1/20/2023 0.0562 Golden Predator Canada Corp. - 100%
YB40142 Quartz Claim FLEE F 101 1/20/2023 0.0577 Golden Predator Canada Corp. - 100%
YB40143 Quartz Claim FLEE F 102 1/20/2023 0.0516 Golden Predator Canada Corp. - 100%
YB40144 Quartz Claim FLEE F 103 1/20/2023 0.0483 Golden Predator Canada Corp. - 100%
YB40145 Quartz Claim FLEE F 104 1/20/2023 0.0406 Golden Predator Canada Corp. - 100%
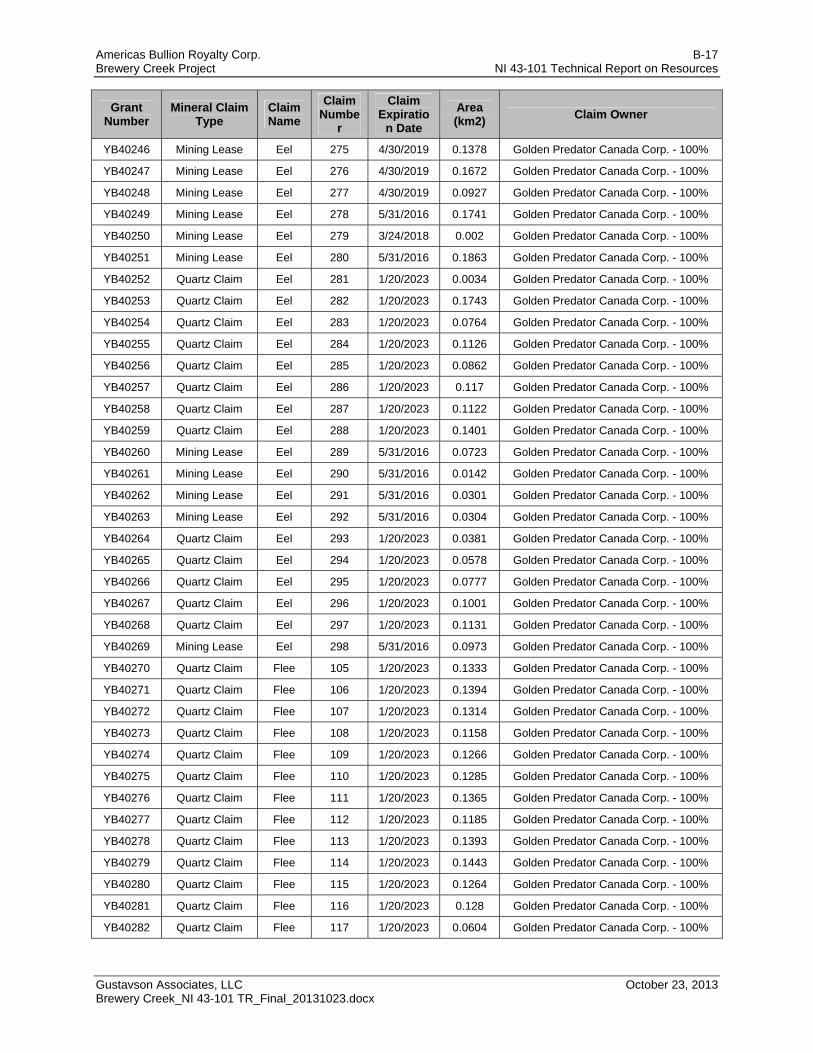
Americas Bullion Royalty Corp. B-17 Brewery Creek Project NI 43-101 Technical Report on Resources
Gustavson Associates, LLC October 23, 2013 Brewery Creek_NI 43-101 TR_Final_20131023.docx
Grant Number
Mineral Claim Type
Claim Name
Claim Numbe
r
Claim Expiratio
n Date
Area (km2)
Claim Owner
YB40246 Mining Lease Eel 275 4/30/2019 0.1378 Golden Predator Canada Corp. - 100%
YB40247 Mining Lease Eel 276 4/30/2019 0.1672 Golden Predator Canada Corp. - 100%
YB40248 Mining Lease Eel 277 4/30/2019 0.0927 Golden Predator Canada Corp. - 100%
YB40249 Mining Lease Eel 278 5/31/2016 0.1741 Golden Predator Canada Corp. - 100%
YB40250 Mining Lease Eel 279 3/24/2018 0.002 Golden Predator Canada Corp. - 100%
YB40251 Mining Lease Eel 280 5/31/2016 0.1863 Golden Predator Canada Corp. - 100%
YB40252 Quartz Claim Eel 281 1/20/2023 0.0034 Golden Predator Canada Corp. - 100%
YB40253 Quartz Claim Eel 282 1/20/2023 0.1743 Golden Predator Canada Corp. - 100%
YB40254 Quartz Claim Eel 283 1/20/2023 0.0764 Golden Predator Canada Corp. - 100%
YB40255 Quartz Claim Eel 284 1/20/2023 0.1126 Golden Predator Canada Corp. - 100%
YB40256 Quartz Claim Eel 285 1/20/2023 0.0862 Golden Predator Canada Corp. - 100%
YB40257 Quartz Claim Eel 286 1/20/2023 0.117 Golden Predator Canada Corp. - 100%
YB40258 Quartz Claim Eel 287 1/20/2023 0.1122 Golden Predator Canada Corp. - 100%
YB40259 Quartz Claim Eel 288 1/20/2023 0.1401 Golden Predator Canada Corp. - 100%
YB40260 Mining Lease Eel 289 5/31/2016 0.0723 Golden Predator Canada Corp. - 100%
YB40261 Mining Lease Eel 290 5/31/2016 0.0142 Golden Predator Canada Corp. - 100%
YB40262 Mining Lease Eel 291 5/31/2016 0.0301 Golden Predator Canada Corp. - 100%
YB40263 Mining Lease Eel 292 5/31/2016 0.0304 Golden Predator Canada Corp. - 100%
YB40264 Quartz Claim Eel 293 1/20/2023 0.0381 Golden Predator Canada Corp. - 100%
YB40265 Quartz Claim Eel 294 1/20/2023 0.0578 Golden Predator Canada Corp. - 100%
YB40266 Quartz Claim Eel 295 1/20/2023 0.0777 Golden Predator Canada Corp. - 100%
YB40267 Quartz Claim Eel 296 1/20/2023 0.1001 Golden Predator Canada Corp. - 100%
YB40268 Quartz Claim Eel 297 1/20/2023 0.1131 Golden Predator Canada Corp. - 100%
YB40269 Mining Lease Eel 298 5/31/2016 0.0973 Golden Predator Canada Corp. - 100%
YB40270 Quartz Claim Flee 105 1/20/2023 0.1333 Golden Predator Canada Corp. - 100%
YB40271 Quartz Claim Flee 106 1/20/2023 0.1394 Golden Predator Canada Corp. - 100%
YB40272 Quartz Claim Flee 107 1/20/2023 0.1314 Golden Predator Canada Corp. - 100%
YB40273 Quartz Claim Flee 108 1/20/2023 0.1158 Golden Predator Canada Corp. - 100%
YB40274 Quartz Claim Flee 109 1/20/2023 0.1266 Golden Predator Canada Corp. - 100%
YB40275 Quartz Claim Flee 110 1/20/2023 0.1285 Golden Predator Canada Corp. - 100%
YB40276 Quartz Claim Flee 111 1/20/2023 0.1365 Golden Predator Canada Corp. - 100%
YB40277 Quartz Claim Flee 112 1/20/2023 0.1185 Golden Predator Canada Corp. - 100%
YB40278 Quartz Claim Flee 113 1/20/2023 0.1393 Golden Predator Canada Corp. - 100%
YB40279 Quartz Claim Flee 114 1/20/2023 0.1443 Golden Predator Canada Corp. - 100%
YB40280 Quartz Claim Flee 115 1/20/2023 0.1264 Golden Predator Canada Corp. - 100%
YB40281 Quartz Claim Flee 116 1/20/2023 0.128 Golden Predator Canada Corp. - 100%
YB40282 Quartz Claim Flee 117 1/20/2023 0.0604 Golden Predator Canada Corp. - 100%

Americas Bullion Royalty Corp. B-18 Brewery Creek Project NI 43-101 Technical Report on Resources
Gustavson Associates, LLC October 23, 2013 Brewery Creek_NI 43-101 TR_Final_20131023.docx
Grant Number
Mineral Claim Type
Claim Name
Claim Numbe
r
Claim Expiratio
n Date
Area (km2)
Claim Owner
YB40283 Quartz Claim Eel 301 1/20/2023 0.0837 Golden Predator Canada Corp. - 100%
YB40284 Quartz Claim Eel 302 1/20/2023 0.0782 Golden Predator Canada Corp. - 100%
YB40285 Quartz Claim Eel 303 1/20/2023 0.1152 Golden Predator Canada Corp. - 100%
YB40286 Quartz Claim Eel 305 1/20/2023 0.0647 Golden Predator Canada Corp. - 100%
YB40287 Quartz Claim Eel 306 1/20/2023 0.0378 Golden Predator Canada Corp. - 100%
YB40288 Quartz Claim Eel 307 1/20/2023 0.0124 Golden Predator Canada Corp. - 100%
YB40317 Quartz Claim Flee 118 1/20/2023 0.0526 Golden Predator Canada Corp. - 100%
YB40318 Quartz Claim Flee 119 1/20/2023 0.1769 Golden Predator Canada Corp. - 100%
YB40319 Quartz Claim Flee 120 1/20/2023 0.0304 Golden Predator Canada Corp. - 100%
YB40320 Quartz Claim Flee 121 1/20/2023 0.0406 Golden Predator Canada Corp. - 100%
YB40321 Quartz Claim Eel 299 1/20/2023 0.1681 Golden Predator Canada Corp. - 100%
YB40322 Quartz Claim Eel 300 1/20/2023 0.2034 Golden Predator Canada Corp. - 100%
YB40323 Quartz Claim Eel 304 1/20/2023 0.1623 Golden Predator Canada Corp. - 100%
YB40324 Quartz Claim Lee 88 1/20/2023 0.1006 Golden Predator Canada Corp. - 100%
YB40325 Quartz Claim Lee 89 1/20/2023 0.0926 Golden Predator Canada Corp. - 100%
YB40326 Quartz Claim Eel 313 1/20/2019 0.1997 Golden Predator Canada Corp. - 100%
YB40327 Quartz Claim Eel 314 1/20/2019 0.1742 Golden Predator Canada Corp. - 100%
YB40328 Quartz Claim Eel 315 1/20/2019 0.1965 Golden Predator Canada Corp. - 100%
YB40329 Quartz Claim Eel 316 1/20/2019 0.1684 Golden Predator Canada Corp. - 100%
YB40330 Quartz Claim Eel 317 1/20/2019 0.1937 Golden Predator Canada Corp. - 100%
YB40331 Quartz Claim Eel 318 1/20/2019 0.1632 Golden Predator Canada Corp. - 100%
YB40332 Quartz Claim Eel 319 1/20/2019 0.2067 Golden Predator Canada Corp. - 100%
YB40333 Quartz Claim Eel 320 1/20/2019 0.1827 Golden Predator Canada Corp. - 100%
YB40334 Quartz Claim Eel 321 1/20/2019 0.1936 Golden Predator Canada Corp. - 100%
YB40335 Quartz Claim Eel 322 1/20/2019 0.1762 Golden Predator Canada Corp. - 100%
YB40336 Quartz Claim Eel 323 1/20/2019 0.1879 Golden Predator Canada Corp. - 100%
YB40337 Quartz Claim Eel 324 1/20/2019 0.1779 Golden Predator Canada Corp. - 100%
YB40338 Quartz Claim Eel 325 1/20/2019 0.1751 Golden Predator Canada Corp. - 100%
YB40339 Quartz Claim Eel 326 1/20/2019 0.169 Golden Predator Canada Corp. - 100%
YB40340 Quartz Claim Eel 327 1/20/2019 0.1925 Golden Predator Canada Corp. - 100%
YB40341 Quartz Claim Eel 328 1/20/2019 0.1923 Golden Predator Canada Corp. - 100%
YB40342 Quartz Claim Eel 329 1/20/2019 0.1744 Golden Predator Canada Corp. - 100%
YB40343 Quartz Claim Eel 330 1/20/2019 0.18 Golden Predator Canada Corp. - 100%
YB40344 Quartz Claim Eel 331 1/20/2019 0.1764 Golden Predator Canada Corp. - 100%
YB40345 Quartz Claim Eel 332 1/20/2019 0.1912 Golden Predator Canada Corp. - 100%
YB40346 Quartz Claim Eel 333 1/20/2019 0.1737 Golden Predator Canada Corp. - 100%
YB40347 Quartz Claim Eel 334 1/20/2019 0.205 Golden Predator Canada Corp. - 100%

Americas Bullion Royalty Corp. B-19 Brewery Creek Project NI 43-101 Technical Report on Resources
Gustavson Associates, LLC October 23, 2013 Brewery Creek_NI 43-101 TR_Final_20131023.docx
Grant Number
Mineral Claim Type
Claim Name
Claim Numbe
r
Claim Expiratio
n Date
Area (km2)
Claim Owner
YB40348 Quartz Claim Eel 335 1/20/2019 0.1666 Golden Predator Canada Corp. - 100%
YB40349 Quartz Claim Eel 336 1/20/2019 0.1953 Golden Predator Canada Corp. - 100%
YB40350 Quartz Claim Eel 337 1/20/2019 0.1587 Golden Predator Canada Corp. - 100%
YB40351 Quartz Claim Eel 338 1/20/2019 0.1828 Golden Predator Canada Corp. - 100%
YB40352 Quartz Claim Eel 339 1/20/2019 0.1795 Golden Predator Canada Corp. - 100%
YB40353 Quartz Claim Eel 340 1/20/2019 0.2098 Golden Predator Canada Corp. - 100%
YB40354 Quartz Claim Eel 341 1/20/2019 0.1717 Golden Predator Canada Corp. - 100%
YB40355 Quartz Claim Eel 342 1/20/2019 0.1992 Golden Predator Canada Corp. - 100%
YB40356 Quartz Claim Eel 343 1/20/2019 0.1738 Golden Predator Canada Corp. - 100%
YB40357 Quartz Claim Eel 344 1/20/2019 0.2026 Golden Predator Canada Corp. - 100%
YB40358 Quartz Claim Eel 345 1/20/2019 0.1625 Golden Predator Canada Corp. - 100%
YB40359 Quartz Claim Eel 346 1/20/2019 0.1866 Golden Predator Canada Corp. - 100%
YB40360 Quartz Claim Eel 347 1/20/2019 0.1845 Golden Predator Canada Corp. - 100%
YB40361 Quartz Claim Eel 348 1/20/2019 0.2118 Golden Predator Canada Corp. - 100%
YB40362 Quartz Claim Eel 349 1/20/2019 0.172 Golden Predator Canada Corp. - 100%
YB40363 Quartz Claim Eel 350 1/20/2019 0.1968 Golden Predator Canada Corp. - 100%
YB40364 Quartz Claim Eel 351 1/20/2019 0.1722 Golden Predator Canada Corp. - 100%
YB40365 Quartz Claim Eel 352 1/20/2019 0.1886 Golden Predator Canada Corp. - 100%
YB40366 Quartz Claim Eel 308 1/20/2023 0.1013 Golden Predator Canada Corp. - 100%
YB40367 Quartz Claim Eel 309 1/20/2023 0.1287 Golden Predator Canada Corp. - 100%
YB40368 Quartz Claim Eel 310 1/20/2023 0.0957 Golden Predator Canada Corp. - 100%
YB40369 Quartz Claim Eel 311 1/20/2023 0.0731 Golden Predator Canada Corp. - 100%
YB40370 Quartz Claim Eel 312 1/20/2023 0.04 Golden Predator Canada Corp. - 100%
YB40371 Quartz Claim Eel 353 1/20/2019 0.1731 Golden Predator Canada Corp. - 100%
YB40372 Quartz Claim Eel 354 1/20/2019 0.1727 Golden Predator Canada Corp. - 100%
YB40373 Quartz Claim Eel 355 1/20/2019 0.1707 Golden Predator Canada Corp. - 100%
YB40374 Quartz Claim Eel 356 1/20/2019 0.1738 Golden Predator Canada Corp. - 100%
YB40375 Quartz Claim Eel 357 1/20/2019 0.1922 Golden Predator Canada Corp. - 100%
YB40376 Quartz Claim Eel 358 1/20/2019 0.1939 Golden Predator Canada Corp. - 100%
YB40377 Quartz Claim Eel 359 1/20/2019 0.184 Golden Predator Canada Corp. - 100%
YB40378 Quartz Claim Eel 360 1/20/2019 0.1895 Golden Predator Canada Corp. - 100%
YB40379 Quartz Claim Eel 361 1/20/2019 0.2171 Golden Predator Canada Corp. - 100%
YB40380 Quartz Claim Eel 362 1/20/2019 0.2239 Golden Predator Canada Corp. - 100%
YB40381 Quartz Claim Eel 363 1/20/2019 0.1938 Golden Predator Canada Corp. - 100%
YB40382 Quartz Claim Eel 364 1/20/2019 0.1983 Golden Predator Canada Corp. - 100%
YB40383 Quartz Claim Eel 365 1/20/2019 0.1941 Golden Predator Canada Corp. - 100%
YB40384 Quartz Claim Eel 366 1/20/2019 0.2056 Golden Predator Canada Corp. - 100%

Americas Bullion Royalty Corp. B-20 Brewery Creek Project NI 43-101 Technical Report on Resources
Gustavson Associates, LLC October 23, 2013 Brewery Creek_NI 43-101 TR_Final_20131023.docx
Grant Number
Mineral Claim Type
Claim Name
Claim Numbe
r
Claim Expiratio
n Date
Area (km2)
Claim Owner
YB40385 Quartz Claim Eel 367 1/20/2019 0.1925 Golden Predator Canada Corp. - 100%
YB40386 Quartz Claim Eel 368 1/20/2019 0.2023 Golden Predator Canada Corp. - 100%
YB40387 Quartz Claim Eel 369 1/20/2019 0.2138 Golden Predator Canada Corp. - 100%
YB40388 Quartz Claim Eel 370 1/20/2019 0.2271 Golden Predator Canada Corp. - 100%
YB40389 Quartz Claim Eel 371 1/20/2019 0.2102 Golden Predator Canada Corp. - 100%
YB40390 Quartz Claim Eel 372 1/20/2019 0.224 Golden Predator Canada Corp. - 100%
YB40393 Quartz Claim Eel 373 1/20/2019 0.0923 Golden Predator Canada Corp. - 100%
YB40394 Quartz Claim Eel 374 1/20/2019 0.1793 Golden Predator Canada Corp. - 100%
YB40395 Quartz Claim Eel 375 1/20/2019 0.1092 Golden Predator Canada Corp. - 100%
YB40396 Quartz Claim Eel 376 1/20/2019 0.1214 Golden Predator Canada Corp. - 100%
YB40397 Quartz Claim Eel 377 1/20/2019 0.1746 Golden Predator Canada Corp. - 100%
YB40398 Quartz Claim Eel 378 1/20/2019 0.1696 Golden Predator Canada Corp. - 100%
YB40399 Quartz Claim Eel 379 1/20/2019 0.1167 Golden Predator Canada Corp. - 100%
YB40400 Quartz Claim Eel 380 1/20/2019 0.1073 Golden Predator Canada Corp. - 100%
YB40401 Quartz Claim Eel 381 1/20/2019 0.137 Golden Predator Canada Corp. - 100%
YB40402 Quartz Claim Eel 382 1/20/2019 0.1496 Golden Predator Canada Corp. - 100%
YB40403 Quartz Claim Eel 383 1/20/2019 0.0828 Golden Predator Canada Corp. - 100%
YB40404 Quartz Claim Eel 384 1/20/2019 0.0871 Golden Predator Canada Corp. - 100%
YB40405 Quartz Claim Eel 385 1/20/2020 0.1744 Golden Predator Canada Corp. - 100%
YB40406 Quartz Claim Eel 386 1/20/2020 0.1873 Golden Predator Canada Corp. - 100%
YB40407 Quartz Claim Eel 387 1/20/2020 0.1966 Golden Predator Canada Corp. - 100%
YB40408 Quartz Claim Eel 388 1/20/2020 0.2118 Golden Predator Canada Corp. - 100%
YB40409 Quartz Claim Eel 389 1/20/2020 0.2089 Golden Predator Canada Corp. - 100%
YB40410 Quartz Claim Eel 390 1/20/2020 0.212 Golden Predator Canada Corp. - 100%
YB40411 Quartz Claim Eel 391 1/20/2020 0.1344 Golden Predator Canada Corp. - 100%
YB40412 Quartz Claim Eel 392 1/20/2020 0.142 Golden Predator Canada Corp. - 100%
YB40413 Quartz Claim Eel 393 1/20/2020 0.2073 Golden Predator Canada Corp. - 100%
YB40414 Quartz Claim Eel 394 1/20/2020 0.0996 Golden Predator Canada Corp. - 100%
YB40415 Quartz Claim Eel 395 1/20/2020 0.1959 Golden Predator Canada Corp. - 100%
YB40416 Quartz Claim Eel 396 1/20/2020 0.1484 Golden Predator Canada Corp. - 100%
YB40417 Quartz Claim Eel 397 1/20/2020 0.2145 Golden Predator Canada Corp. - 100%
YB40418 Quartz Claim Eel 398 1/20/2020 0.1408 Golden Predator Canada Corp. - 100%
YB40419 Quartz Claim Eel 399 1/20/2020 0.1495 Golden Predator Canada Corp. - 100%
YB40420 Quartz Claim Eel 400 1/20/2020 0.0971 Golden Predator Canada Corp. - 100%
YB40421 Quartz Claim Eel 401 1/20/2020 0.0917 Golden Predator Canada Corp. - 100%
YB40422 Quartz Claim Eel 402 1/20/2020 0.1141 Golden Predator Canada Corp. - 100%
YB40423 Quartz Claim Eel 403 1/20/2020 0.2045 Golden Predator Canada Corp. - 100%

Americas Bullion Royalty Corp. B-21 Brewery Creek Project NI 43-101 Technical Report on Resources
Gustavson Associates, LLC October 23, 2013 Brewery Creek_NI 43-101 TR_Final_20131023.docx
Grant Number
Mineral Claim Type
Claim Name
Claim Numbe
r
Claim Expiratio
n Date
Area (km2)
Claim Owner
YB40424 Quartz Claim Eel 404 1/20/2020 0.2151 Golden Predator Canada Corp. - 100%
YB40425 Quartz Claim Eel 405 1/20/2020 0.224 Golden Predator Canada Corp. - 100%
YB40426 Quartz Claim Eel 406 1/20/2020 0.2355 Golden Predator Canada Corp. - 100%
YB40427 Quartz Claim Eel 407 1/20/2020 0.187 Golden Predator Canada Corp. - 100%
YB40428 Quartz Claim Eel 408 1/20/2020 0.1967 Golden Predator Canada Corp. - 100%
YB40429 Quartz Claim Eel 409 1/20/2020 0.1208 Golden Predator Canada Corp. - 100%
YB40430 Quartz Claim Eel 410 1/20/2020 0.0433 Golden Predator Canada Corp. - 100%
YB40431 Quartz Claim Eel 411 1/20/2020 0.2401 Golden Predator Canada Corp. - 100%
YB40432 Quartz Claim Eel 412 1/20/2020 0.14 Golden Predator Canada Corp. - 100%
YB40433 Quartz Claim Eel 413 1/20/2020 0.1756 Golden Predator Canada Corp. - 100%
YB40434 Quartz Claim Eel 414 1/20/2020 0.1092 Golden Predator Canada Corp. - 100%
YB40435 Quartz Claim Eel 415 1/20/2020 0.1187 Golden Predator Canada Corp. - 100%
YB40436 Quartz Claim Eel 416 1/20/2020 0.0627 Golden Predator Canada Corp. - 100%
YB40437 Quartz Claim Eel 417 1/20/2020 0.1457 Golden Predator Canada Corp. - 100%
YB40438 Quartz Claim Eel 418 1/20/2020 0.1277 Golden Predator Canada Corp. - 100%
YB40439 Quartz Claim Eel 419 1/20/2019 0.1081 Golden Predator Canada Corp. - 100%
YB40440 Quartz Claim Eel 420 1/20/2019 0.1152 Golden Predator Canada Corp. - 100%
YB40441 Quartz Claim Eel 421 1/20/2019 0.1682 Golden Predator Canada Corp. - 100%
YB40442 Quartz Claim Eel 422 1/20/2019 0.1599 Golden Predator Canada Corp. - 100%
YB40443 Quartz Claim Eel 423 1/20/2019 0.2096 Golden Predator Canada Corp. - 100%
YB40444 Quartz Claim Eel 424 1/20/2019 0.2043 Golden Predator Canada Corp. - 100%
YB40445 Quartz Claim Eel 425 1/20/2019 0.1682 Golden Predator Canada Corp. - 100%
YB40446 Quartz Claim Eel 426 1/20/2019 0.1834 Golden Predator Canada Corp. - 100%
YB40447 Quartz Claim Eel 427 1/20/2019 0.1597 Golden Predator Canada Corp. - 100%
YB40448 Quartz Claim Eel 428 1/20/2019 0.1581 Golden Predator Canada Corp. - 100%
YB40449 Quartz Claim Eel 429 1/20/2019 0.1544 Golden Predator Canada Corp. - 100%
YB40450 Quartz Claim Eel 430 1/20/2019 0.1584 Golden Predator Canada Corp. - 100%
YB40451 Quartz Claim Eel 431 1/20/2019 0.1514 Golden Predator Canada Corp. - 100%
YB40452 Quartz Claim Eel 432 1/20/2019 0.1533 Golden Predator Canada Corp. - 100%
YB40453 Quartz Claim Eel 433 1/20/2019 0.098 Golden Predator Canada Corp. - 100%
YB40454 Quartz Claim Eel 434 1/20/2019 0.1693 Golden Predator Canada Corp. - 100%
YB40455 Quartz Claim Eel 435 1/20/2019 0.1884 Golden Predator Canada Corp. - 100%
YB40456 Quartz Claim Eel 436 1/20/2019 0.177 Golden Predator Canada Corp. - 100%
YB40457 Quartz Claim Eel 437 1/20/2019 0.1905 Golden Predator Canada Corp. - 100%
YB40458 Quartz Claim Eel 438 1/20/2019 0.1859 Golden Predator Canada Corp. - 100%
YB40459 Quartz Claim Eel 439 1/20/2019 0.1967 Golden Predator Canada Corp. - 100%
YB40460 Quartz Claim Eel 440 1/20/2019 0.1958 Golden Predator Canada Corp. - 100%
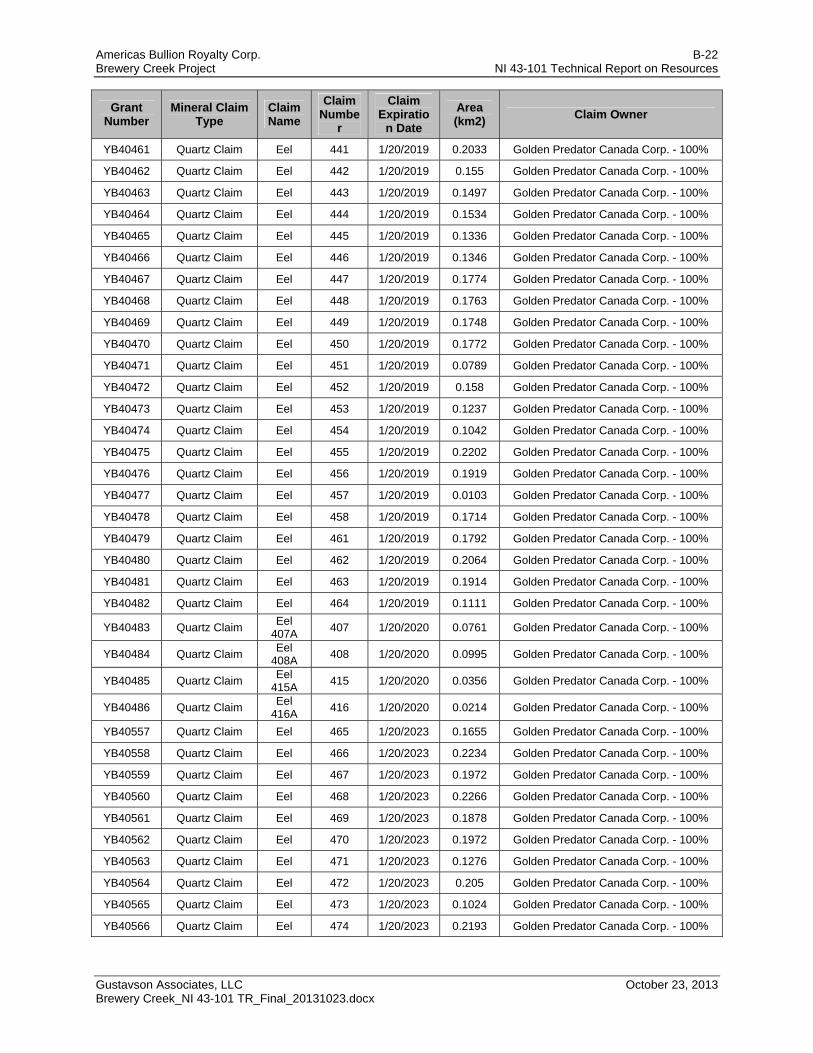
Americas Bullion Royalty Corp. B-22 Brewery Creek Project NI 43-101 Technical Report on Resources
Gustavson Associates, LLC October 23, 2013 Brewery Creek_NI 43-101 TR_Final_20131023.docx
Grant Number
Mineral Claim Type
Claim Name
Claim Numbe
r
Claim Expiratio
n Date
Area (km2)
Claim Owner
YB40461 Quartz Claim Eel 441 1/20/2019 0.2033 Golden Predator Canada Corp. - 100%
YB40462 Quartz Claim Eel 442 1/20/2019 0.155 Golden Predator Canada Corp. - 100%
YB40463 Quartz Claim Eel 443 1/20/2019 0.1497 Golden Predator Canada Corp. - 100%
YB40464 Quartz Claim Eel 444 1/20/2019 0.1534 Golden Predator Canada Corp. - 100%
YB40465 Quartz Claim Eel 445 1/20/2019 0.1336 Golden Predator Canada Corp. - 100%
YB40466 Quartz Claim Eel 446 1/20/2019 0.1346 Golden Predator Canada Corp. - 100%
YB40467 Quartz Claim Eel 447 1/20/2019 0.1774 Golden Predator Canada Corp. - 100%
YB40468 Quartz Claim Eel 448 1/20/2019 0.1763 Golden Predator Canada Corp. - 100%
YB40469 Quartz Claim Eel 449 1/20/2019 0.1748 Golden Predator Canada Corp. - 100%
YB40470 Quartz Claim Eel 450 1/20/2019 0.1772 Golden Predator Canada Corp. - 100%
YB40471 Quartz Claim Eel 451 1/20/2019 0.0789 Golden Predator Canada Corp. - 100%
YB40472 Quartz Claim Eel 452 1/20/2019 0.158 Golden Predator Canada Corp. - 100%
YB40473 Quartz Claim Eel 453 1/20/2019 0.1237 Golden Predator Canada Corp. - 100%
YB40474 Quartz Claim Eel 454 1/20/2019 0.1042 Golden Predator Canada Corp. - 100%
YB40475 Quartz Claim Eel 455 1/20/2019 0.2202 Golden Predator Canada Corp. - 100%
YB40476 Quartz Claim Eel 456 1/20/2019 0.1919 Golden Predator Canada Corp. - 100%
YB40477 Quartz Claim Eel 457 1/20/2019 0.0103 Golden Predator Canada Corp. - 100%
YB40478 Quartz Claim Eel 458 1/20/2019 0.1714 Golden Predator Canada Corp. - 100%
YB40479 Quartz Claim Eel 461 1/20/2019 0.1792 Golden Predator Canada Corp. - 100%
YB40480 Quartz Claim Eel 462 1/20/2019 0.2064 Golden Predator Canada Corp. - 100%
YB40481 Quartz Claim Eel 463 1/20/2019 0.1914 Golden Predator Canada Corp. - 100%
YB40482 Quartz Claim Eel 464 1/20/2019 0.1111 Golden Predator Canada Corp. - 100%
YB40483 Quartz Claim Eel
407A 407 1/20/2020 0.0761 Golden Predator Canada Corp. - 100%
YB40484 Quartz Claim Eel
408A 408 1/20/2020 0.0995 Golden Predator Canada Corp. - 100%
YB40485 Quartz Claim Eel
415A 415 1/20/2020 0.0356 Golden Predator Canada Corp. - 100%
YB40486 Quartz Claim Eel
416A 416 1/20/2020 0.0214 Golden Predator Canada Corp. - 100%
YB40557 Quartz Claim Eel 465 1/20/2023 0.1655 Golden Predator Canada Corp. - 100%
YB40558 Quartz Claim Eel 466 1/20/2023 0.2234 Golden Predator Canada Corp. - 100%
YB40559 Quartz Claim Eel 467 1/20/2023 0.1972 Golden Predator Canada Corp. - 100%
YB40560 Quartz Claim Eel 468 1/20/2023 0.2266 Golden Predator Canada Corp. - 100%
YB40561 Quartz Claim Eel 469 1/20/2023 0.1878 Golden Predator Canada Corp. - 100%
YB40562 Quartz Claim Eel 470 1/20/2023 0.1972 Golden Predator Canada Corp. - 100%
YB40563 Quartz Claim Eel 471 1/20/2023 0.1276 Golden Predator Canada Corp. - 100%
YB40564 Quartz Claim Eel 472 1/20/2023 0.205 Golden Predator Canada Corp. - 100%
YB40565 Quartz Claim Eel 473 1/20/2023 0.1024 Golden Predator Canada Corp. - 100%
YB40566 Quartz Claim Eel 474 1/20/2023 0.2193 Golden Predator Canada Corp. - 100%
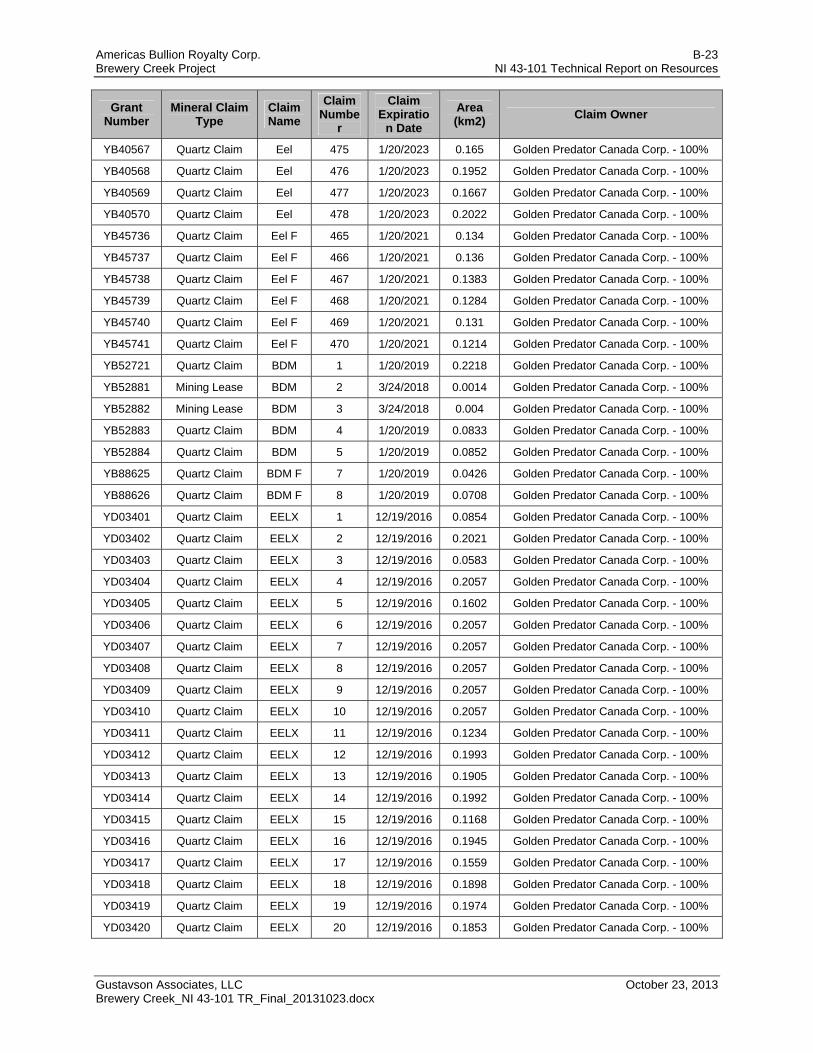
Americas Bullion Royalty Corp. B-23 Brewery Creek Project NI 43-101 Technical Report on Resources
Gustavson Associates, LLC October 23, 2013 Brewery Creek_NI 43-101 TR_Final_20131023.docx
Grant Number
Mineral Claim Type
Claim Name
Claim Numbe
r
Claim Expiratio
n Date
Area (km2)
Claim Owner
YB40567 Quartz Claim Eel 475 1/20/2023 0.165 Golden Predator Canada Corp. - 100%
YB40568 Quartz Claim Eel 476 1/20/2023 0.1952 Golden Predator Canada Corp. - 100%
YB40569 Quartz Claim Eel 477 1/20/2023 0.1667 Golden Predator Canada Corp. - 100%
YB40570 Quartz Claim Eel 478 1/20/2023 0.2022 Golden Predator Canada Corp. - 100%
YB45736 Quartz Claim Eel F 465 1/20/2021 0.134 Golden Predator Canada Corp. - 100%
YB45737 Quartz Claim Eel F 466 1/20/2021 0.136 Golden Predator Canada Corp. - 100%
YB45738 Quartz Claim Eel F 467 1/20/2021 0.1383 Golden Predator Canada Corp. - 100%
YB45739 Quartz Claim Eel F 468 1/20/2021 0.1284 Golden Predator Canada Corp. - 100%
YB45740 Quartz Claim Eel F 469 1/20/2021 0.131 Golden Predator Canada Corp. - 100%
YB45741 Quartz Claim Eel F 470 1/20/2021 0.1214 Golden Predator Canada Corp. - 100%
YB52721 Quartz Claim BDM 1 1/20/2019 0.2218 Golden Predator Canada Corp. - 100%
YB52881 Mining Lease BDM 2 3/24/2018 0.0014 Golden Predator Canada Corp. - 100%
YB52882 Mining Lease BDM 3 3/24/2018 0.004 Golden Predator Canada Corp. - 100%
YB52883 Quartz Claim BDM 4 1/20/2019 0.0833 Golden Predator Canada Corp. - 100%
YB52884 Quartz Claim BDM 5 1/20/2019 0.0852 Golden Predator Canada Corp. - 100%
YB88625 Quartz Claim BDM F 7 1/20/2019 0.0426 Golden Predator Canada Corp. - 100%
YB88626 Quartz Claim BDM F 8 1/20/2019 0.0708 Golden Predator Canada Corp. - 100%
YD03401 Quartz Claim EELX 1 12/19/2016 0.0854 Golden Predator Canada Corp. - 100%
YD03402 Quartz Claim EELX 2 12/19/2016 0.2021 Golden Predator Canada Corp. - 100%
YD03403 Quartz Claim EELX 3 12/19/2016 0.0583 Golden Predator Canada Corp. - 100%
YD03404 Quartz Claim EELX 4 12/19/2016 0.2057 Golden Predator Canada Corp. - 100%
YD03405 Quartz Claim EELX 5 12/19/2016 0.1602 Golden Predator Canada Corp. - 100%
YD03406 Quartz Claim EELX 6 12/19/2016 0.2057 Golden Predator Canada Corp. - 100%
YD03407 Quartz Claim EELX 7 12/19/2016 0.2057 Golden Predator Canada Corp. - 100%
YD03408 Quartz Claim EELX 8 12/19/2016 0.2057 Golden Predator Canada Corp. - 100%
YD03409 Quartz Claim EELX 9 12/19/2016 0.2057 Golden Predator Canada Corp. - 100%
YD03410 Quartz Claim EELX 10 12/19/2016 0.2057 Golden Predator Canada Corp. - 100%
YD03411 Quartz Claim EELX 11 12/19/2016 0.1234 Golden Predator Canada Corp. - 100%
YD03412 Quartz Claim EELX 12 12/19/2016 0.1993 Golden Predator Canada Corp. - 100%
YD03413 Quartz Claim EELX 13 12/19/2016 0.1905 Golden Predator Canada Corp. - 100%
YD03414 Quartz Claim EELX 14 12/19/2016 0.1992 Golden Predator Canada Corp. - 100%
YD03415 Quartz Claim EELX 15 12/19/2016 0.1168 Golden Predator Canada Corp. - 100%
YD03416 Quartz Claim EELX 16 12/19/2016 0.1945 Golden Predator Canada Corp. - 100%
YD03417 Quartz Claim EELX 17 12/19/2016 0.1559 Golden Predator Canada Corp. - 100%
YD03418 Quartz Claim EELX 18 12/19/2016 0.1898 Golden Predator Canada Corp. - 100%
YD03419 Quartz Claim EELX 19 12/19/2016 0.1974 Golden Predator Canada Corp. - 100%
YD03420 Quartz Claim EELX 20 12/19/2016 0.1853 Golden Predator Canada Corp. - 100%
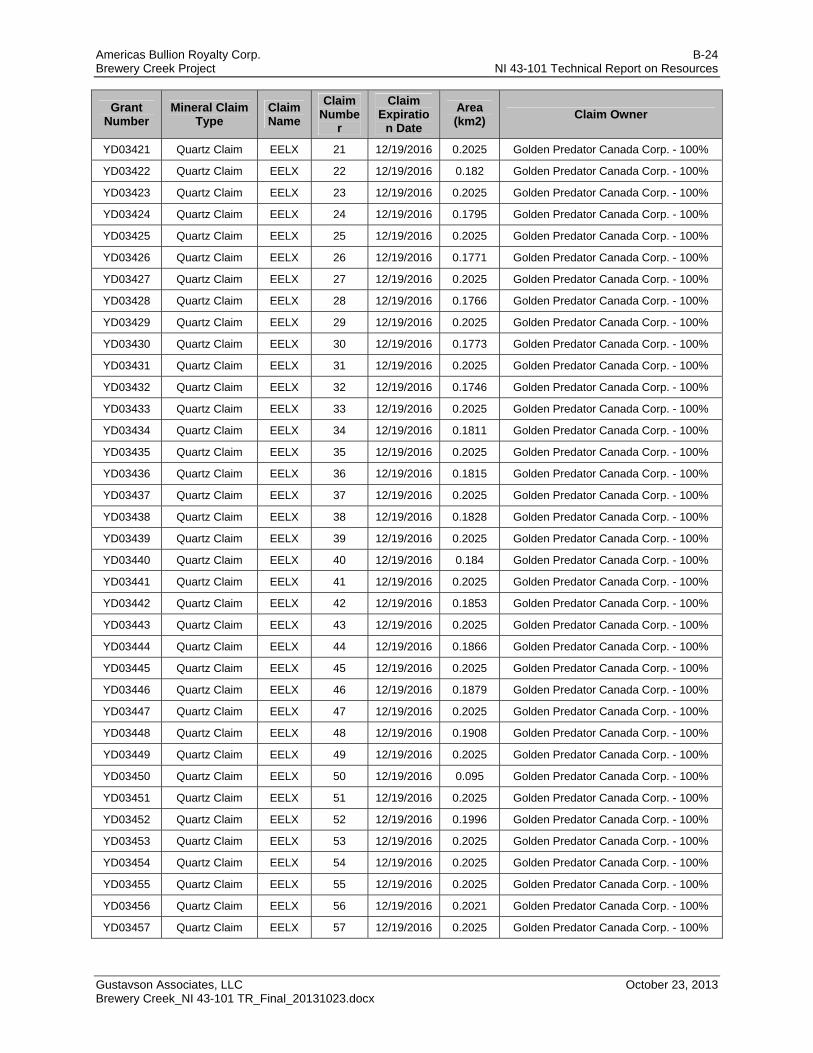
Americas Bullion Royalty Corp. B-24 Brewery Creek Project NI 43-101 Technical Report on Resources
Gustavson Associates, LLC October 23, 2013 Brewery Creek_NI 43-101 TR_Final_20131023.docx
Grant Number
Mineral Claim Type
Claim Name
Claim Numbe
r
Claim Expiratio
n Date
Area (km2)
Claim Owner
YD03421 Quartz Claim EELX 21 12/19/2016 0.2025 Golden Predator Canada Corp. - 100%
YD03422 Quartz Claim EELX 22 12/19/2016 0.182 Golden Predator Canada Corp. - 100%
YD03423 Quartz Claim EELX 23 12/19/2016 0.2025 Golden Predator Canada Corp. - 100%
YD03424 Quartz Claim EELX 24 12/19/2016 0.1795 Golden Predator Canada Corp. - 100%
YD03425 Quartz Claim EELX 25 12/19/2016 0.2025 Golden Predator Canada Corp. - 100%
YD03426 Quartz Claim EELX 26 12/19/2016 0.1771 Golden Predator Canada Corp. - 100%
YD03427 Quartz Claim EELX 27 12/19/2016 0.2025 Golden Predator Canada Corp. - 100%
YD03428 Quartz Claim EELX 28 12/19/2016 0.1766 Golden Predator Canada Corp. - 100%
YD03429 Quartz Claim EELX 29 12/19/2016 0.2025 Golden Predator Canada Corp. - 100%
YD03430 Quartz Claim EELX 30 12/19/2016 0.1773 Golden Predator Canada Corp. - 100%
YD03431 Quartz Claim EELX 31 12/19/2016 0.2025 Golden Predator Canada Corp. - 100%
YD03432 Quartz Claim EELX 32 12/19/2016 0.1746 Golden Predator Canada Corp. - 100%
YD03433 Quartz Claim EELX 33 12/19/2016 0.2025 Golden Predator Canada Corp. - 100%
YD03434 Quartz Claim EELX 34 12/19/2016 0.1811 Golden Predator Canada Corp. - 100%
YD03435 Quartz Claim EELX 35 12/19/2016 0.2025 Golden Predator Canada Corp. - 100%
YD03436 Quartz Claim EELX 36 12/19/2016 0.1815 Golden Predator Canada Corp. - 100%
YD03437 Quartz Claim EELX 37 12/19/2016 0.2025 Golden Predator Canada Corp. - 100%
YD03438 Quartz Claim EELX 38 12/19/2016 0.1828 Golden Predator Canada Corp. - 100%
YD03439 Quartz Claim EELX 39 12/19/2016 0.2025 Golden Predator Canada Corp. - 100%
YD03440 Quartz Claim EELX 40 12/19/2016 0.184 Golden Predator Canada Corp. - 100%
YD03441 Quartz Claim EELX 41 12/19/2016 0.2025 Golden Predator Canada Corp. - 100%
YD03442 Quartz Claim EELX 42 12/19/2016 0.1853 Golden Predator Canada Corp. - 100%
YD03443 Quartz Claim EELX 43 12/19/2016 0.2025 Golden Predator Canada Corp. - 100%
YD03444 Quartz Claim EELX 44 12/19/2016 0.1866 Golden Predator Canada Corp. - 100%
YD03445 Quartz Claim EELX 45 12/19/2016 0.2025 Golden Predator Canada Corp. - 100%
YD03446 Quartz Claim EELX 46 12/19/2016 0.1879 Golden Predator Canada Corp. - 100%
YD03447 Quartz Claim EELX 47 12/19/2016 0.2025 Golden Predator Canada Corp. - 100%
YD03448 Quartz Claim EELX 48 12/19/2016 0.1908 Golden Predator Canada Corp. - 100%
YD03449 Quartz Claim EELX 49 12/19/2016 0.2025 Golden Predator Canada Corp. - 100%
YD03450 Quartz Claim EELX 50 12/19/2016 0.095 Golden Predator Canada Corp. - 100%
YD03451 Quartz Claim EELX 51 12/19/2016 0.2025 Golden Predator Canada Corp. - 100%
YD03452 Quartz Claim EELX 52 12/19/2016 0.1996 Golden Predator Canada Corp. - 100%
YD03453 Quartz Claim EELX 53 12/19/2016 0.2025 Golden Predator Canada Corp. - 100%
YD03454 Quartz Claim EELX 54 12/19/2016 0.2025 Golden Predator Canada Corp. - 100%
YD03455 Quartz Claim EELX 55 12/19/2016 0.2025 Golden Predator Canada Corp. - 100%
YD03456 Quartz Claim EELX 56 12/19/2016 0.2021 Golden Predator Canada Corp. - 100%
YD03457 Quartz Claim EELX 57 12/19/2016 0.2025 Golden Predator Canada Corp. - 100%
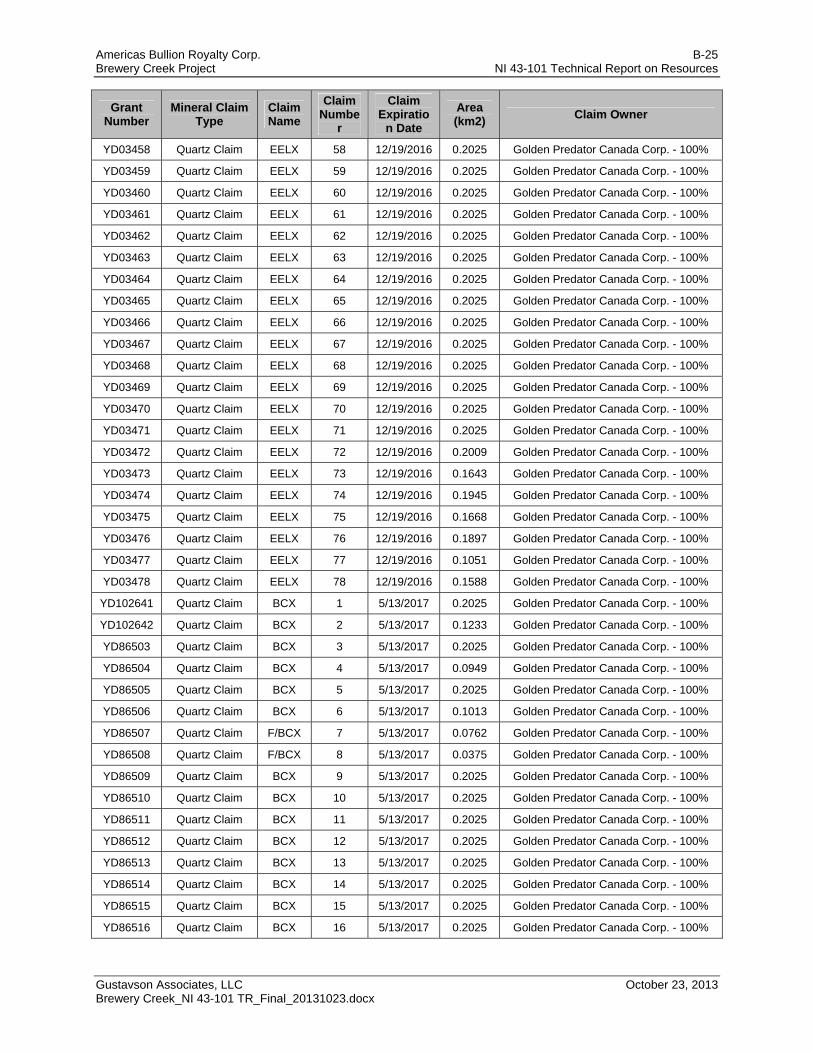
Americas Bullion Royalty Corp. B-25 Brewery Creek Project NI 43-101 Technical Report on Resources
Gustavson Associates, LLC October 23, 2013 Brewery Creek_NI 43-101 TR_Final_20131023.docx
Grant Number
Mineral Claim Type
Claim Name
Claim Numbe
r
Claim Expiratio
n Date
Area (km2)
Claim Owner
YD03458 Quartz Claim EELX 58 12/19/2016 0.2025 Golden Predator Canada Corp. - 100%
YD03459 Quartz Claim EELX 59 12/19/2016 0.2025 Golden Predator Canada Corp. - 100%
YD03460 Quartz Claim EELX 60 12/19/2016 0.2025 Golden Predator Canada Corp. - 100%
YD03461 Quartz Claim EELX 61 12/19/2016 0.2025 Golden Predator Canada Corp. - 100%
YD03462 Quartz Claim EELX 62 12/19/2016 0.2025 Golden Predator Canada Corp. - 100%
YD03463 Quartz Claim EELX 63 12/19/2016 0.2025 Golden Predator Canada Corp. - 100%
YD03464 Quartz Claim EELX 64 12/19/2016 0.2025 Golden Predator Canada Corp. - 100%
YD03465 Quartz Claim EELX 65 12/19/2016 0.2025 Golden Predator Canada Corp. - 100%
YD03466 Quartz Claim EELX 66 12/19/2016 0.2025 Golden Predator Canada Corp. - 100%
YD03467 Quartz Claim EELX 67 12/19/2016 0.2025 Golden Predator Canada Corp. - 100%
YD03468 Quartz Claim EELX 68 12/19/2016 0.2025 Golden Predator Canada Corp. - 100%
YD03469 Quartz Claim EELX 69 12/19/2016 0.2025 Golden Predator Canada Corp. - 100%
YD03470 Quartz Claim EELX 70 12/19/2016 0.2025 Golden Predator Canada Corp. - 100%
YD03471 Quartz Claim EELX 71 12/19/2016 0.2025 Golden Predator Canada Corp. - 100%
YD03472 Quartz Claim EELX 72 12/19/2016 0.2009 Golden Predator Canada Corp. - 100%
YD03473 Quartz Claim EELX 73 12/19/2016 0.1643 Golden Predator Canada Corp. - 100%
YD03474 Quartz Claim EELX 74 12/19/2016 0.1945 Golden Predator Canada Corp. - 100%
YD03475 Quartz Claim EELX 75 12/19/2016 0.1668 Golden Predator Canada Corp. - 100%
YD03476 Quartz Claim EELX 76 12/19/2016 0.1897 Golden Predator Canada Corp. - 100%
YD03477 Quartz Claim EELX 77 12/19/2016 0.1051 Golden Predator Canada Corp. - 100%
YD03478 Quartz Claim EELX 78 12/19/2016 0.1588 Golden Predator Canada Corp. - 100%
YD102641 Quartz Claim BCX 1 5/13/2017 0.2025 Golden Predator Canada Corp. - 100%
YD102642 Quartz Claim BCX 2 5/13/2017 0.1233 Golden Predator Canada Corp. - 100%
YD86503 Quartz Claim BCX 3 5/13/2017 0.2025 Golden Predator Canada Corp. - 100%
YD86504 Quartz Claim BCX 4 5/13/2017 0.0949 Golden Predator Canada Corp. - 100%
YD86505 Quartz Claim BCX 5 5/13/2017 0.2025 Golden Predator Canada Corp. - 100%
YD86506 Quartz Claim BCX 6 5/13/2017 0.1013 Golden Predator Canada Corp. - 100%
YD86507 Quartz Claim F/BCX 7 5/13/2017 0.0762 Golden Predator Canada Corp. - 100%
YD86508 Quartz Claim F/BCX 8 5/13/2017 0.0375 Golden Predator Canada Corp. - 100%
YD86509 Quartz Claim BCX 9 5/13/2017 0.2025 Golden Predator Canada Corp. - 100%
YD86510 Quartz Claim BCX 10 5/13/2017 0.2025 Golden Predator Canada Corp. - 100%
YD86511 Quartz Claim BCX 11 5/13/2017 0.2025 Golden Predator Canada Corp. - 100%
YD86512 Quartz Claim BCX 12 5/13/2017 0.2025 Golden Predator Canada Corp. - 100%
YD86513 Quartz Claim BCX 13 5/13/2017 0.2025 Golden Predator Canada Corp. - 100%
YD86514 Quartz Claim BCX 14 5/13/2017 0.2025 Golden Predator Canada Corp. - 100%
YD86515 Quartz Claim BCX 15 5/13/2017 0.2025 Golden Predator Canada Corp. - 100%
YD86516 Quartz Claim BCX 16 5/13/2017 0.2025 Golden Predator Canada Corp. - 100%
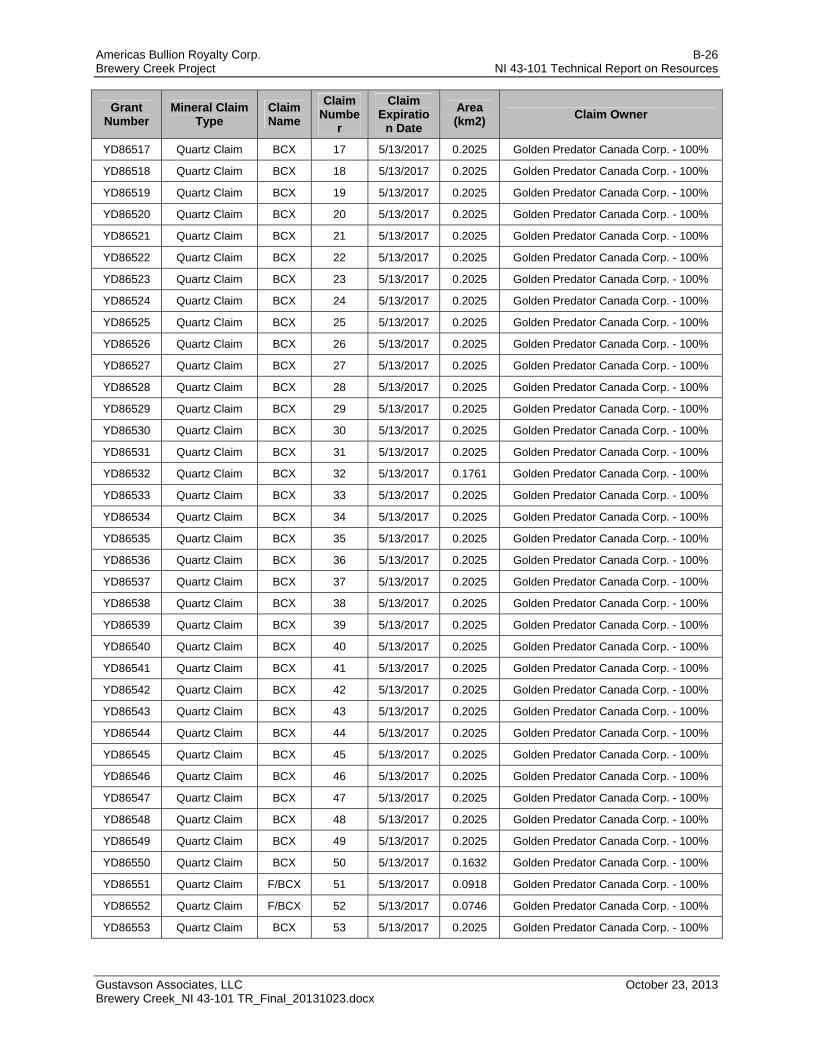
Americas Bullion Royalty Corp. B-26 Brewery Creek Project NI 43-101 Technical Report on Resources
Gustavson Associates, LLC October 23, 2013 Brewery Creek_NI 43-101 TR_Final_20131023.docx
Grant Number
Mineral Claim Type
Claim Name
Claim Numbe
r
Claim Expiratio
n Date
Area (km2)
Claim Owner
YD86517 Quartz Claim BCX 17 5/13/2017 0.2025 Golden Predator Canada Corp. - 100%
YD86518 Quartz Claim BCX 18 5/13/2017 0.2025 Golden Predator Canada Corp. - 100%
YD86519 Quartz Claim BCX 19 5/13/2017 0.2025 Golden Predator Canada Corp. - 100%
YD86520 Quartz Claim BCX 20 5/13/2017 0.2025 Golden Predator Canada Corp. - 100%
YD86521 Quartz Claim BCX 21 5/13/2017 0.2025 Golden Predator Canada Corp. - 100%
YD86522 Quartz Claim BCX 22 5/13/2017 0.2025 Golden Predator Canada Corp. - 100%
YD86523 Quartz Claim BCX 23 5/13/2017 0.2025 Golden Predator Canada Corp. - 100%
YD86524 Quartz Claim BCX 24 5/13/2017 0.2025 Golden Predator Canada Corp. - 100%
YD86525 Quartz Claim BCX 25 5/13/2017 0.2025 Golden Predator Canada Corp. - 100%
YD86526 Quartz Claim BCX 26 5/13/2017 0.2025 Golden Predator Canada Corp. - 100%
YD86527 Quartz Claim BCX 27 5/13/2017 0.2025 Golden Predator Canada Corp. - 100%
YD86528 Quartz Claim BCX 28 5/13/2017 0.2025 Golden Predator Canada Corp. - 100%
YD86529 Quartz Claim BCX 29 5/13/2017 0.2025 Golden Predator Canada Corp. - 100%
YD86530 Quartz Claim BCX 30 5/13/2017 0.2025 Golden Predator Canada Corp. - 100%
YD86531 Quartz Claim BCX 31 5/13/2017 0.2025 Golden Predator Canada Corp. - 100%
YD86532 Quartz Claim BCX 32 5/13/2017 0.1761 Golden Predator Canada Corp. - 100%
YD86533 Quartz Claim BCX 33 5/13/2017 0.2025 Golden Predator Canada Corp. - 100%
YD86534 Quartz Claim BCX 34 5/13/2017 0.2025 Golden Predator Canada Corp. - 100%
YD86535 Quartz Claim BCX 35 5/13/2017 0.2025 Golden Predator Canada Corp. - 100%
YD86536 Quartz Claim BCX 36 5/13/2017 0.2025 Golden Predator Canada Corp. - 100%
YD86537 Quartz Claim BCX 37 5/13/2017 0.2025 Golden Predator Canada Corp. - 100%
YD86538 Quartz Claim BCX 38 5/13/2017 0.2025 Golden Predator Canada Corp. - 100%
YD86539 Quartz Claim BCX 39 5/13/2017 0.2025 Golden Predator Canada Corp. - 100%
YD86540 Quartz Claim BCX 40 5/13/2017 0.2025 Golden Predator Canada Corp. - 100%
YD86541 Quartz Claim BCX 41 5/13/2017 0.2025 Golden Predator Canada Corp. - 100%
YD86542 Quartz Claim BCX 42 5/13/2017 0.2025 Golden Predator Canada Corp. - 100%
YD86543 Quartz Claim BCX 43 5/13/2017 0.2025 Golden Predator Canada Corp. - 100%
YD86544 Quartz Claim BCX 44 5/13/2017 0.2025 Golden Predator Canada Corp. - 100%
YD86545 Quartz Claim BCX 45 5/13/2017 0.2025 Golden Predator Canada Corp. - 100%
YD86546 Quartz Claim BCX 46 5/13/2017 0.2025 Golden Predator Canada Corp. - 100%
YD86547 Quartz Claim BCX 47 5/13/2017 0.2025 Golden Predator Canada Corp. - 100%
YD86548 Quartz Claim BCX 48 5/13/2017 0.2025 Golden Predator Canada Corp. - 100%
YD86549 Quartz Claim BCX 49 5/13/2017 0.2025 Golden Predator Canada Corp. - 100%
YD86550 Quartz Claim BCX 50 5/13/2017 0.1632 Golden Predator Canada Corp. - 100%
YD86551 Quartz Claim F/BCX 51 5/13/2017 0.0918 Golden Predator Canada Corp. - 100%
YD86552 Quartz Claim F/BCX 52 5/13/2017 0.0746 Golden Predator Canada Corp. - 100%
YD86553 Quartz Claim BCX 53 5/13/2017 0.2025 Golden Predator Canada Corp. - 100%
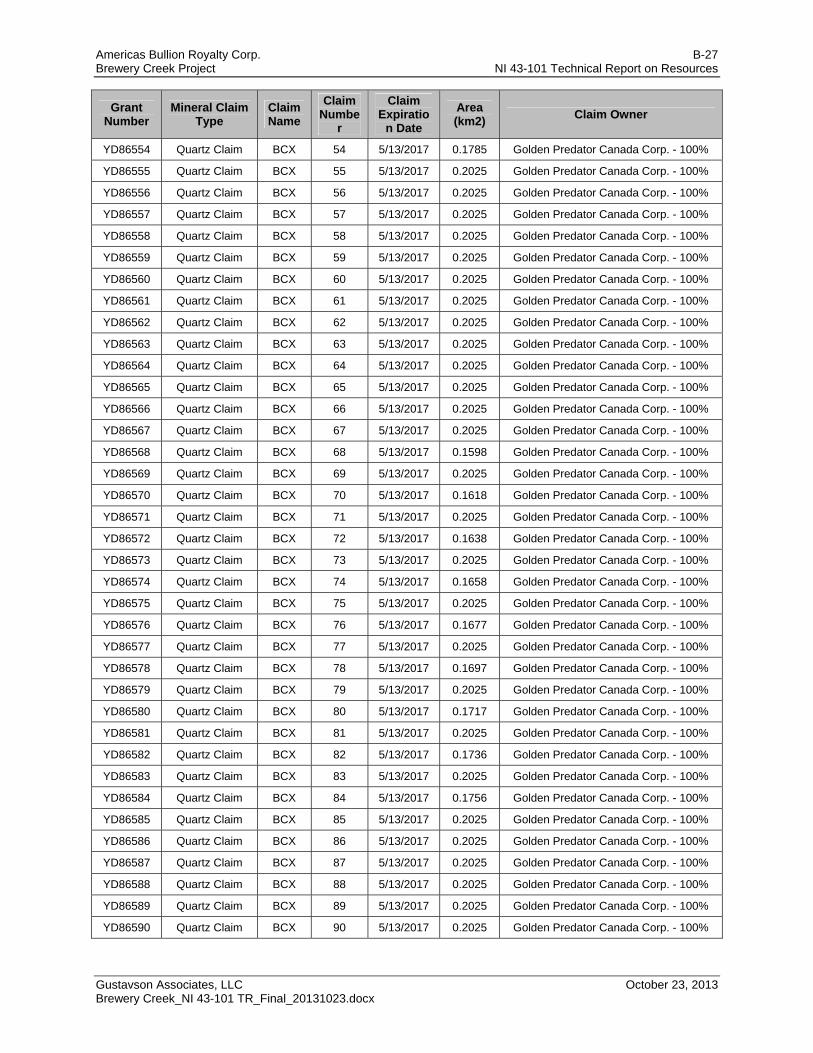
Americas Bullion Royalty Corp. B-27 Brewery Creek Project NI 43-101 Technical Report on Resources
Gustavson Associates, LLC October 23, 2013 Brewery Creek_NI 43-101 TR_Final_20131023.docx
Grant Number
Mineral Claim Type
Claim Name
Claim Numbe
r
Claim Expiratio
n Date
Area (km2)
Claim Owner
YD86554 Quartz Claim BCX 54 5/13/2017 0.1785 Golden Predator Canada Corp. - 100%
YD86555 Quartz Claim BCX 55 5/13/2017 0.2025 Golden Predator Canada Corp. - 100%
YD86556 Quartz Claim BCX 56 5/13/2017 0.2025 Golden Predator Canada Corp. - 100%
YD86557 Quartz Claim BCX 57 5/13/2017 0.2025 Golden Predator Canada Corp. - 100%
YD86558 Quartz Claim BCX 58 5/13/2017 0.2025 Golden Predator Canada Corp. - 100%
YD86559 Quartz Claim BCX 59 5/13/2017 0.2025 Golden Predator Canada Corp. - 100%
YD86560 Quartz Claim BCX 60 5/13/2017 0.2025 Golden Predator Canada Corp. - 100%
YD86561 Quartz Claim BCX 61 5/13/2017 0.2025 Golden Predator Canada Corp. - 100%
YD86562 Quartz Claim BCX 62 5/13/2017 0.2025 Golden Predator Canada Corp. - 100%
YD86563 Quartz Claim BCX 63 5/13/2017 0.2025 Golden Predator Canada Corp. - 100%
YD86564 Quartz Claim BCX 64 5/13/2017 0.2025 Golden Predator Canada Corp. - 100%
YD86565 Quartz Claim BCX 65 5/13/2017 0.2025 Golden Predator Canada Corp. - 100%
YD86566 Quartz Claim BCX 66 5/13/2017 0.2025 Golden Predator Canada Corp. - 100%
YD86567 Quartz Claim BCX 67 5/13/2017 0.2025 Golden Predator Canada Corp. - 100%
YD86568 Quartz Claim BCX 68 5/13/2017 0.1598 Golden Predator Canada Corp. - 100%
YD86569 Quartz Claim BCX 69 5/13/2017 0.2025 Golden Predator Canada Corp. - 100%
YD86570 Quartz Claim BCX 70 5/13/2017 0.1618 Golden Predator Canada Corp. - 100%
YD86571 Quartz Claim BCX 71 5/13/2017 0.2025 Golden Predator Canada Corp. - 100%
YD86572 Quartz Claim BCX 72 5/13/2017 0.1638 Golden Predator Canada Corp. - 100%
YD86573 Quartz Claim BCX 73 5/13/2017 0.2025 Golden Predator Canada Corp. - 100%
YD86574 Quartz Claim BCX 74 5/13/2017 0.1658 Golden Predator Canada Corp. - 100%
YD86575 Quartz Claim BCX 75 5/13/2017 0.2025 Golden Predator Canada Corp. - 100%
YD86576 Quartz Claim BCX 76 5/13/2017 0.1677 Golden Predator Canada Corp. - 100%
YD86577 Quartz Claim BCX 77 5/13/2017 0.2025 Golden Predator Canada Corp. - 100%
YD86578 Quartz Claim BCX 78 5/13/2017 0.1697 Golden Predator Canada Corp. - 100%
YD86579 Quartz Claim BCX 79 5/13/2017 0.2025 Golden Predator Canada Corp. - 100%
YD86580 Quartz Claim BCX 80 5/13/2017 0.1717 Golden Predator Canada Corp. - 100%
YD86581 Quartz Claim BCX 81 5/13/2017 0.2025 Golden Predator Canada Corp. - 100%
YD86582 Quartz Claim BCX 82 5/13/2017 0.1736 Golden Predator Canada Corp. - 100%
YD86583 Quartz Claim BCX 83 5/13/2017 0.2025 Golden Predator Canada Corp. - 100%
YD86584 Quartz Claim BCX 84 5/13/2017 0.1756 Golden Predator Canada Corp. - 100%
YD86585 Quartz Claim BCX 85 5/13/2017 0.2025 Golden Predator Canada Corp. - 100%
YD86586 Quartz Claim BCX 86 5/13/2017 0.2025 Golden Predator Canada Corp. - 100%
YD86587 Quartz Claim BCX 87 5/13/2017 0.2025 Golden Predator Canada Corp. - 100%
YD86588 Quartz Claim BCX 88 5/13/2017 0.2025 Golden Predator Canada Corp. - 100%
YD86589 Quartz Claim BCX 89 5/13/2017 0.2025 Golden Predator Canada Corp. - 100%
YD86590 Quartz Claim BCX 90 5/13/2017 0.2025 Golden Predator Canada Corp. - 100%
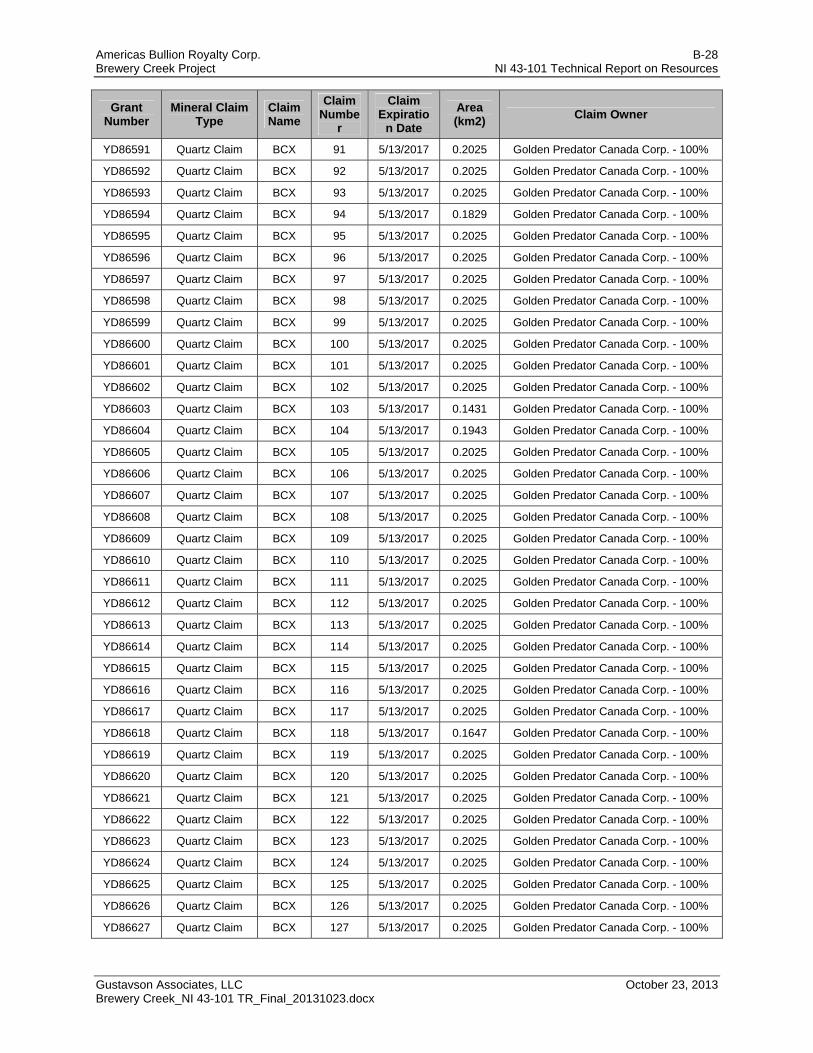
Americas Bullion Royalty Corp. B-28 Brewery Creek Project NI 43-101 Technical Report on Resources
Gustavson Associates, LLC October 23, 2013 Brewery Creek_NI 43-101 TR_Final_20131023.docx
Grant Number
Mineral Claim Type
Claim Name
Claim Numbe
r
Claim Expiratio
n Date
Area (km2)
Claim Owner
YD86591 Quartz Claim BCX 91 5/13/2017 0.2025 Golden Predator Canada Corp. - 100%
YD86592 Quartz Claim BCX 92 5/13/2017 0.2025 Golden Predator Canada Corp. - 100%
YD86593 Quartz Claim BCX 93 5/13/2017 0.2025 Golden Predator Canada Corp. - 100%
YD86594 Quartz Claim BCX 94 5/13/2017 0.1829 Golden Predator Canada Corp. - 100%
YD86595 Quartz Claim BCX 95 5/13/2017 0.2025 Golden Predator Canada Corp. - 100%
YD86596 Quartz Claim BCX 96 5/13/2017 0.2025 Golden Predator Canada Corp. - 100%
YD86597 Quartz Claim BCX 97 5/13/2017 0.2025 Golden Predator Canada Corp. - 100%
YD86598 Quartz Claim BCX 98 5/13/2017 0.2025 Golden Predator Canada Corp. - 100%
YD86599 Quartz Claim BCX 99 5/13/2017 0.2025 Golden Predator Canada Corp. - 100%
YD86600 Quartz Claim BCX 100 5/13/2017 0.2025 Golden Predator Canada Corp. - 100%
YD86601 Quartz Claim BCX 101 5/13/2017 0.2025 Golden Predator Canada Corp. - 100%
YD86602 Quartz Claim BCX 102 5/13/2017 0.2025 Golden Predator Canada Corp. - 100%
YD86603 Quartz Claim BCX 103 5/13/2017 0.1431 Golden Predator Canada Corp. - 100%
YD86604 Quartz Claim BCX 104 5/13/2017 0.1943 Golden Predator Canada Corp. - 100%
YD86605 Quartz Claim BCX 105 5/13/2017 0.2025 Golden Predator Canada Corp. - 100%
YD86606 Quartz Claim BCX 106 5/13/2017 0.2025 Golden Predator Canada Corp. - 100%
YD86607 Quartz Claim BCX 107 5/13/2017 0.2025 Golden Predator Canada Corp. - 100%
YD86608 Quartz Claim BCX 108 5/13/2017 0.2025 Golden Predator Canada Corp. - 100%
YD86609 Quartz Claim BCX 109 5/13/2017 0.2025 Golden Predator Canada Corp. - 100%
YD86610 Quartz Claim BCX 110 5/13/2017 0.2025 Golden Predator Canada Corp. - 100%
YD86611 Quartz Claim BCX 111 5/13/2017 0.2025 Golden Predator Canada Corp. - 100%
YD86612 Quartz Claim BCX 112 5/13/2017 0.2025 Golden Predator Canada Corp. - 100%
YD86613 Quartz Claim BCX 113 5/13/2017 0.2025 Golden Predator Canada Corp. - 100%
YD86614 Quartz Claim BCX 114 5/13/2017 0.2025 Golden Predator Canada Corp. - 100%
YD86615 Quartz Claim BCX 115 5/13/2017 0.2025 Golden Predator Canada Corp. - 100%
YD86616 Quartz Claim BCX 116 5/13/2017 0.2025 Golden Predator Canada Corp. - 100%
YD86617 Quartz Claim BCX 117 5/13/2017 0.2025 Golden Predator Canada Corp. - 100%
YD86618 Quartz Claim BCX 118 5/13/2017 0.1647 Golden Predator Canada Corp. - 100%
YD86619 Quartz Claim BCX 119 5/13/2017 0.2025 Golden Predator Canada Corp. - 100%
YD86620 Quartz Claim BCX 120 5/13/2017 0.2025 Golden Predator Canada Corp. - 100%
YD86621 Quartz Claim BCX 121 5/13/2017 0.2025 Golden Predator Canada Corp. - 100%
YD86622 Quartz Claim BCX 122 5/13/2017 0.2025 Golden Predator Canada Corp. - 100%
YD86623 Quartz Claim BCX 123 5/13/2017 0.2025 Golden Predator Canada Corp. - 100%
YD86624 Quartz Claim BCX 124 5/13/2017 0.2025 Golden Predator Canada Corp. - 100%
YD86625 Quartz Claim BCX 125 5/13/2017 0.2025 Golden Predator Canada Corp. - 100%
YD86626 Quartz Claim BCX 126 5/13/2017 0.2025 Golden Predator Canada Corp. - 100%
YD86627 Quartz Claim BCX 127 5/13/2017 0.2025 Golden Predator Canada Corp. - 100%
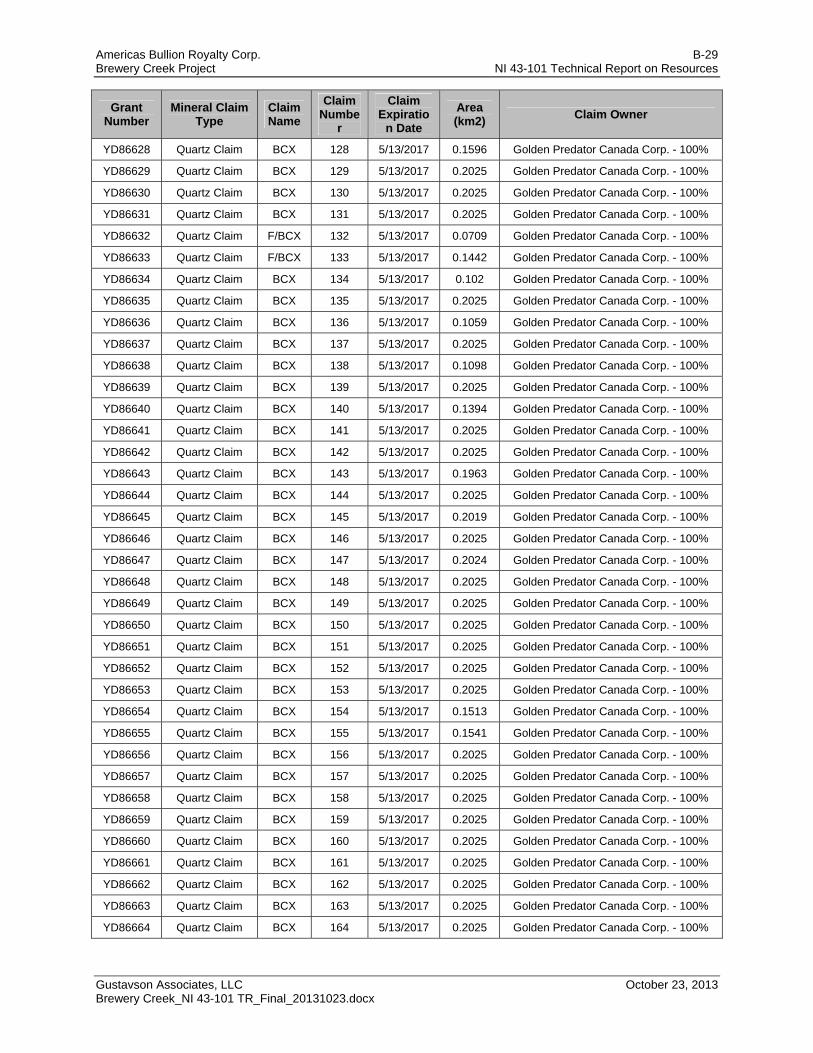
Americas Bullion Royalty Corp. B-29 Brewery Creek Project NI 43-101 Technical Report on Resources
Gustavson Associates, LLC October 23, 2013 Brewery Creek_NI 43-101 TR_Final_20131023.docx
Grant Number
Mineral Claim Type
Claim Name
Claim Numbe
r
Claim Expiratio
n Date
Area (km2)
Claim Owner
YD86628 Quartz Claim BCX 128 5/13/2017 0.1596 Golden Predator Canada Corp. - 100%
YD86629 Quartz Claim BCX 129 5/13/2017 0.2025 Golden Predator Canada Corp. - 100%
YD86630 Quartz Claim BCX 130 5/13/2017 0.2025 Golden Predator Canada Corp. - 100%
YD86631 Quartz Claim BCX 131 5/13/2017 0.2025 Golden Predator Canada Corp. - 100%
YD86632 Quartz Claim F/BCX 132 5/13/2017 0.0709 Golden Predator Canada Corp. - 100%
YD86633 Quartz Claim F/BCX 133 5/13/2017 0.1442 Golden Predator Canada Corp. - 100%
YD86634 Quartz Claim BCX 134 5/13/2017 0.102 Golden Predator Canada Corp. - 100%
YD86635 Quartz Claim BCX 135 5/13/2017 0.2025 Golden Predator Canada Corp. - 100%
YD86636 Quartz Claim BCX 136 5/13/2017 0.1059 Golden Predator Canada Corp. - 100%
YD86637 Quartz Claim BCX 137 5/13/2017 0.2025 Golden Predator Canada Corp. - 100%
YD86638 Quartz Claim BCX 138 5/13/2017 0.1098 Golden Predator Canada Corp. - 100%
YD86639 Quartz Claim BCX 139 5/13/2017 0.2025 Golden Predator Canada Corp. - 100%
YD86640 Quartz Claim BCX 140 5/13/2017 0.1394 Golden Predator Canada Corp. - 100%
YD86641 Quartz Claim BCX 141 5/13/2017 0.2025 Golden Predator Canada Corp. - 100%
YD86642 Quartz Claim BCX 142 5/13/2017 0.2025 Golden Predator Canada Corp. - 100%
YD86643 Quartz Claim BCX 143 5/13/2017 0.1963 Golden Predator Canada Corp. - 100%
YD86644 Quartz Claim BCX 144 5/13/2017 0.2025 Golden Predator Canada Corp. - 100%
YD86645 Quartz Claim BCX 145 5/13/2017 0.2019 Golden Predator Canada Corp. - 100%
YD86646 Quartz Claim BCX 146 5/13/2017 0.2025 Golden Predator Canada Corp. - 100%
YD86647 Quartz Claim BCX 147 5/13/2017 0.2024 Golden Predator Canada Corp. - 100%
YD86648 Quartz Claim BCX 148 5/13/2017 0.2025 Golden Predator Canada Corp. - 100%
YD86649 Quartz Claim BCX 149 5/13/2017 0.2025 Golden Predator Canada Corp. - 100%
YD86650 Quartz Claim BCX 150 5/13/2017 0.2025 Golden Predator Canada Corp. - 100%
YD86651 Quartz Claim BCX 151 5/13/2017 0.2025 Golden Predator Canada Corp. - 100%
YD86652 Quartz Claim BCX 152 5/13/2017 0.2025 Golden Predator Canada Corp. - 100%
YD86653 Quartz Claim BCX 153 5/13/2017 0.2025 Golden Predator Canada Corp. - 100%
YD86654 Quartz Claim BCX 154 5/13/2017 0.1513 Golden Predator Canada Corp. - 100%
YD86655 Quartz Claim BCX 155 5/13/2017 0.1541 Golden Predator Canada Corp. - 100%
YD86656 Quartz Claim BCX 156 5/13/2017 0.2025 Golden Predator Canada Corp. - 100%
YD86657 Quartz Claim BCX 157 5/13/2017 0.2025 Golden Predator Canada Corp. - 100%
YD86658 Quartz Claim BCX 158 5/13/2017 0.2025 Golden Predator Canada Corp. - 100%
YD86659 Quartz Claim BCX 159 5/13/2017 0.2025 Golden Predator Canada Corp. - 100%
YD86660 Quartz Claim BCX 160 5/13/2017 0.2025 Golden Predator Canada Corp. - 100%
YD86661 Quartz Claim BCX 161 5/13/2017 0.2025 Golden Predator Canada Corp. - 100%
YD86662 Quartz Claim BCX 162 5/13/2017 0.2025 Golden Predator Canada Corp. - 100%
YD86663 Quartz Claim BCX 163 5/13/2017 0.2025 Golden Predator Canada Corp. - 100%
YD86664 Quartz Claim BCX 164 5/13/2017 0.2025 Golden Predator Canada Corp. - 100%
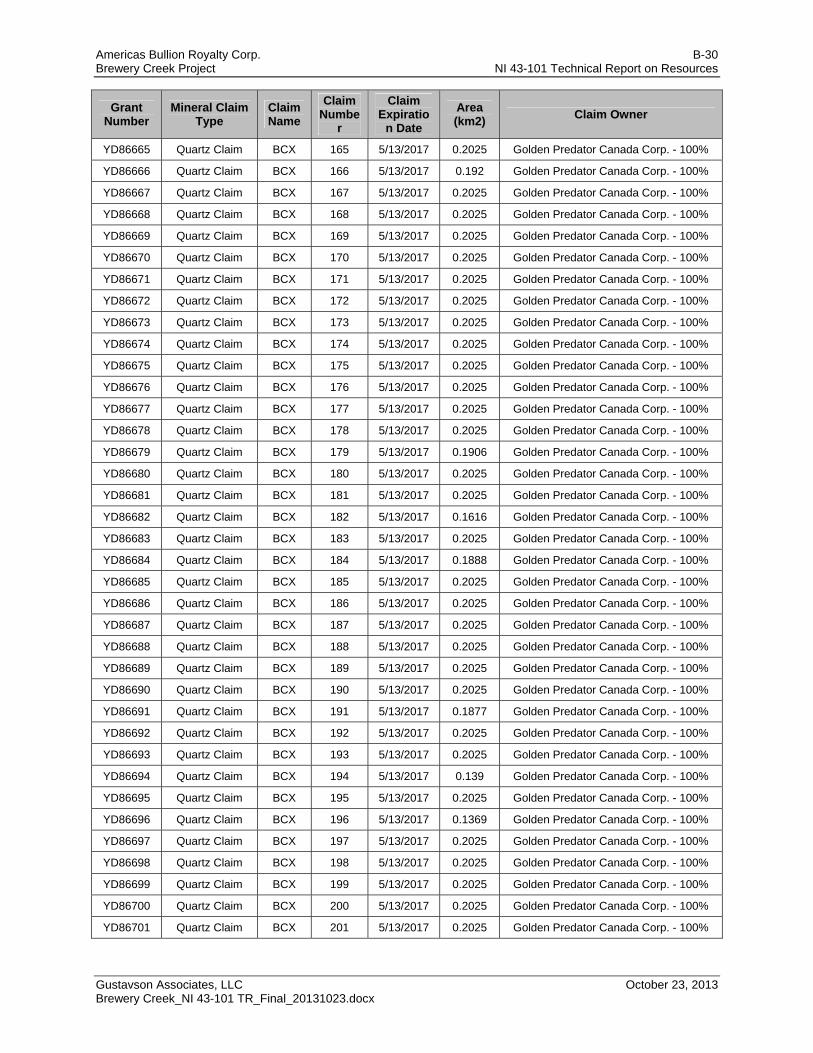
Americas Bullion Royalty Corp. B-30 Brewery Creek Project NI 43-101 Technical Report on Resources
Gustavson Associates, LLC October 23, 2013 Brewery Creek_NI 43-101 TR_Final_20131023.docx
Grant Number
Mineral Claim Type
Claim Name
Claim Numbe
r
Claim Expiratio
n Date
Area (km2)
Claim Owner
YD86665 Quartz Claim BCX 165 5/13/2017 0.2025 Golden Predator Canada Corp. - 100%
YD86666 Quartz Claim BCX 166 5/13/2017 0.192 Golden Predator Canada Corp. - 100%
YD86667 Quartz Claim BCX 167 5/13/2017 0.2025 Golden Predator Canada Corp. - 100%
YD86668 Quartz Claim BCX 168 5/13/2017 0.2025 Golden Predator Canada Corp. - 100%
YD86669 Quartz Claim BCX 169 5/13/2017 0.2025 Golden Predator Canada Corp. - 100%
YD86670 Quartz Claim BCX 170 5/13/2017 0.2025 Golden Predator Canada Corp. - 100%
YD86671 Quartz Claim BCX 171 5/13/2017 0.2025 Golden Predator Canada Corp. - 100%
YD86672 Quartz Claim BCX 172 5/13/2017 0.2025 Golden Predator Canada Corp. - 100%
YD86673 Quartz Claim BCX 173 5/13/2017 0.2025 Golden Predator Canada Corp. - 100%
YD86674 Quartz Claim BCX 174 5/13/2017 0.2025 Golden Predator Canada Corp. - 100%
YD86675 Quartz Claim BCX 175 5/13/2017 0.2025 Golden Predator Canada Corp. - 100%
YD86676 Quartz Claim BCX 176 5/13/2017 0.2025 Golden Predator Canada Corp. - 100%
YD86677 Quartz Claim BCX 177 5/13/2017 0.2025 Golden Predator Canada Corp. - 100%
YD86678 Quartz Claim BCX 178 5/13/2017 0.2025 Golden Predator Canada Corp. - 100%
YD86679 Quartz Claim BCX 179 5/13/2017 0.1906 Golden Predator Canada Corp. - 100%
YD86680 Quartz Claim BCX 180 5/13/2017 0.2025 Golden Predator Canada Corp. - 100%
YD86681 Quartz Claim BCX 181 5/13/2017 0.2025 Golden Predator Canada Corp. - 100%
YD86682 Quartz Claim BCX 182 5/13/2017 0.1616 Golden Predator Canada Corp. - 100%
YD86683 Quartz Claim BCX 183 5/13/2017 0.2025 Golden Predator Canada Corp. - 100%
YD86684 Quartz Claim BCX 184 5/13/2017 0.1888 Golden Predator Canada Corp. - 100%
YD86685 Quartz Claim BCX 185 5/13/2017 0.2025 Golden Predator Canada Corp. - 100%
YD86686 Quartz Claim BCX 186 5/13/2017 0.2025 Golden Predator Canada Corp. - 100%
YD86687 Quartz Claim BCX 187 5/13/2017 0.2025 Golden Predator Canada Corp. - 100%
YD86688 Quartz Claim BCX 188 5/13/2017 0.2025 Golden Predator Canada Corp. - 100%
YD86689 Quartz Claim BCX 189 5/13/2017 0.2025 Golden Predator Canada Corp. - 100%
YD86690 Quartz Claim BCX 190 5/13/2017 0.2025 Golden Predator Canada Corp. - 100%
YD86691 Quartz Claim BCX 191 5/13/2017 0.1877 Golden Predator Canada Corp. - 100%
YD86692 Quartz Claim BCX 192 5/13/2017 0.2025 Golden Predator Canada Corp. - 100%
YD86693 Quartz Claim BCX 193 5/13/2017 0.2025 Golden Predator Canada Corp. - 100%
YD86694 Quartz Claim BCX 194 5/13/2017 0.139 Golden Predator Canada Corp. - 100%
YD86695 Quartz Claim BCX 195 5/13/2017 0.2025 Golden Predator Canada Corp. - 100%
YD86696 Quartz Claim BCX 196 5/13/2017 0.1369 Golden Predator Canada Corp. - 100%
YD86697 Quartz Claim BCX 197 5/13/2017 0.2025 Golden Predator Canada Corp. - 100%
YD86698 Quartz Claim BCX 198 5/13/2017 0.2025 Golden Predator Canada Corp. - 100%
YD86699 Quartz Claim BCX 199 5/13/2017 0.2025 Golden Predator Canada Corp. - 100%
YD86700 Quartz Claim BCX 200 5/13/2017 0.2025 Golden Predator Canada Corp. - 100%
YD86701 Quartz Claim BCX 201 5/13/2017 0.2025 Golden Predator Canada Corp. - 100%
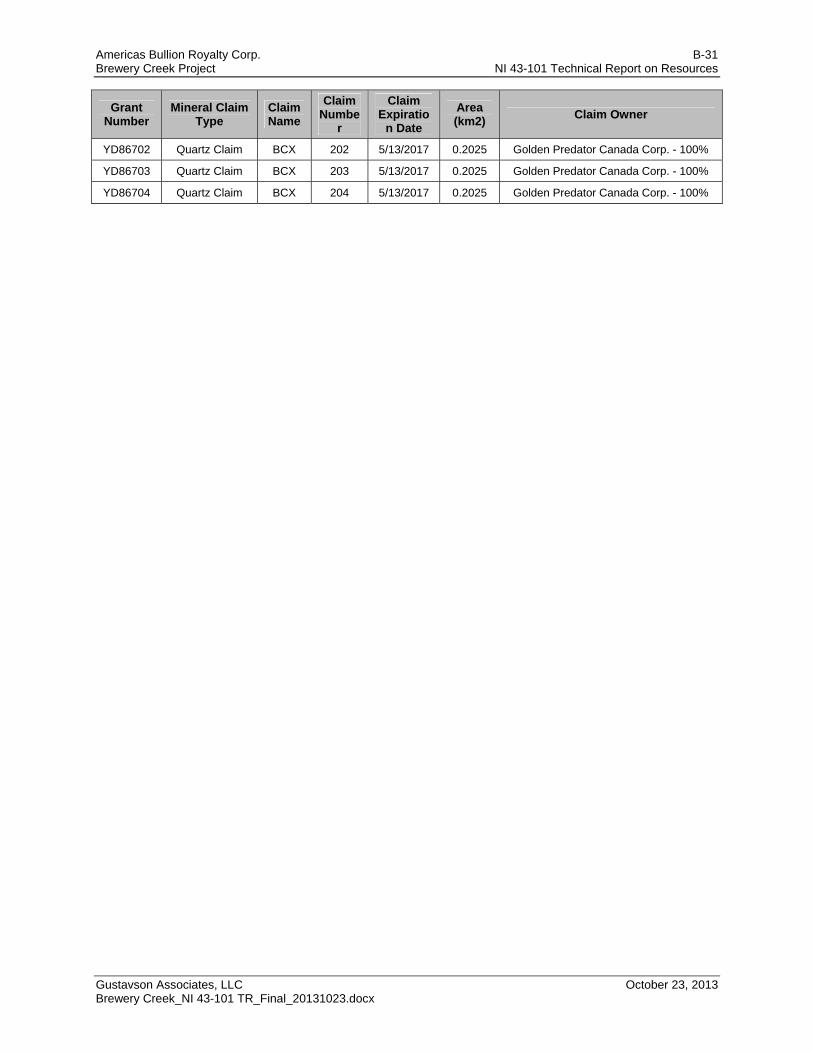
Americas Bullion Royalty Corp. B-31 Brewery Creek Project NI 43-101 Technical Report on Resources
Gustavson Associates, LLC October 23, 2013 Brewery Creek_NI 43-101 TR_Final_20131023.docx
Grant Number
Mineral Claim Type
Claim Name
Claim Numbe
r
Claim Expiratio
n Date
Area (km2)
Claim Owner
YD86702 Quartz Claim BCX 202 5/13/2017 0.2025 Golden Predator Canada Corp. - 100%
YD86703 Quartz Claim BCX 203 5/13/2017 0.2025 Golden Predator Canada Corp. - 100%
YD86704 Quartz Claim BCX 204 5/13/2017 0.2025 Golden Predator Canada Corp. - 100%
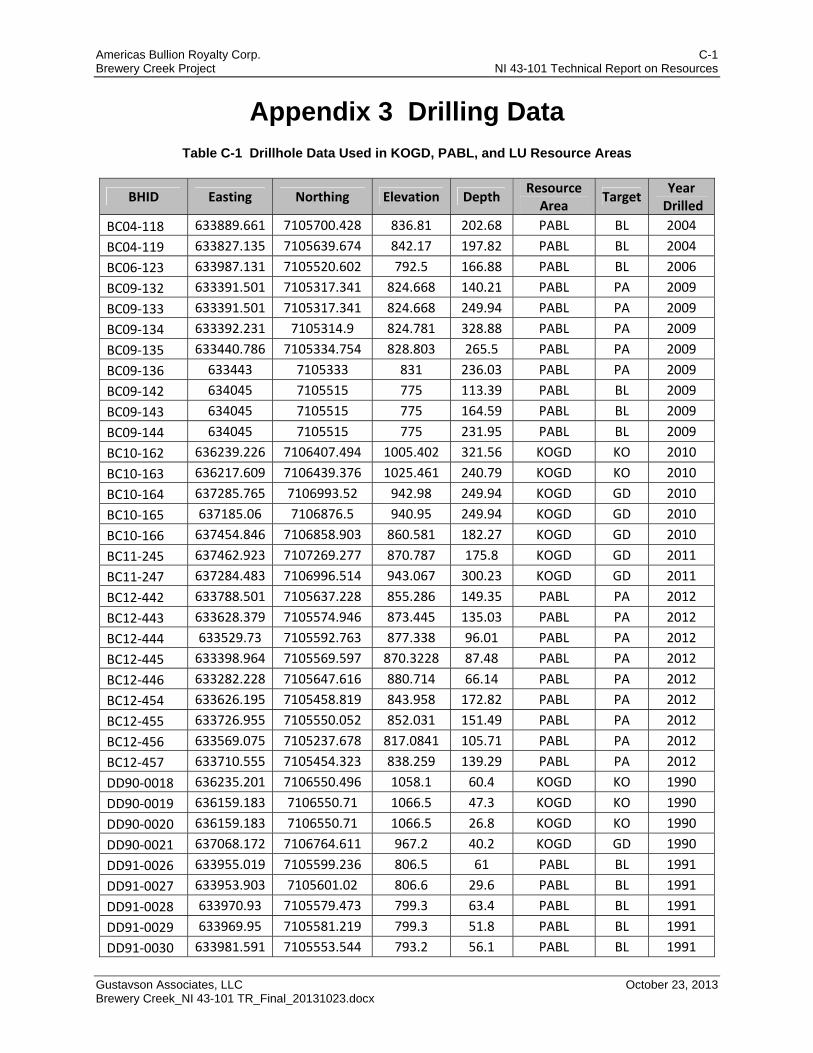
Americas Bullion Royalty Corp. C-1 Brewery Creek Project NI 43-101 Technical Report on Resources
Gustavson Associates, LLC October 23, 2013 Brewery Creek_NI 43-101 TR_Final_20131023.docx
Appendix 3 Drilling Data Table C-1 Drillhole Data Used in KOGD, PABL, and LU Resource Areas
BHID Easting Northing Elevation Depth Resource Area
Target Year
Drilled
BC04‐118 633889.661 7105700.428 836.81 202.68 PABL BL 2004
BC04‐119 633827.135 7105639.674 842.17 197.82 PABL BL 2004
BC06‐123 633987.131 7105520.602 792.5 166.88 PABL BL 2006
BC09‐132 633391.501 7105317.341 824.668 140.21 PABL PA 2009
BC09‐133 633391.501 7105317.341 824.668 249.94 PABL PA 2009
BC09‐134 633392.231 7105314.9 824.781 328.88 PABL PA 2009
BC09‐135 633440.786 7105334.754 828.803 265.5 PABL PA 2009
BC09‐136 633443 7105333 831 236.03 PABL PA 2009
BC09‐142 634045 7105515 775 113.39 PABL BL 2009
BC09‐143 634045 7105515 775 164.59 PABL BL 2009
BC09‐144 634045 7105515 775 231.95 PABL BL 2009
BC10‐162 636239.226 7106407.494 1005.402 321.56 KOGD KO 2010
BC10‐163 636217.609 7106439.376 1025.461 240.79 KOGD KO 2010
BC10‐164 637285.765 7106993.52 942.98 249.94 KOGD GD 2010
BC10‐165 637185.06 7106876.5 940.95 249.94 KOGD GD 2010
BC10‐166 637454.846 7106858.903 860.581 182.27 KOGD GD 2010
BC11‐245 637462.923 7107269.277 870.787 175.8 KOGD GD 2011
BC11‐247 637284.483 7106996.514 943.067 300.23 KOGD GD 2011
BC12‐442 633788.501 7105637.228 855.286 149.35 PABL PA 2012
BC12‐443 633628.379 7105574.946 873.445 135.03 PABL PA 2012
BC12‐444 633529.73 7105592.763 877.338 96.01 PABL PA 2012
BC12‐445 633398.964 7105569.597 870.3228 87.48 PABL PA 2012
BC12‐446 633282.228 7105647.616 880.714 66.14 PABL PA 2012
BC12‐454 633626.195 7105458.819 843.958 172.82 PABL PA 2012
BC12‐455 633726.955 7105550.052 852.031 151.49 PABL PA 2012
BC12‐456 633569.075 7105237.678 817.0841 105.71 PABL PA 2012
BC12‐457 633710.555 7105454.323 838.259 139.29 PABL PA 2012
DD90‐0018 636235.201 7106550.496 1058.1 60.4 KOGD KO 1990
DD90‐0019 636159.183 7106550.71 1066.5 47.3 KOGD KO 1990
DD90‐0020 636159.183 7106550.71 1066.5 26.8 KOGD KO 1990
DD90‐0021 637068.172 7106764.611 967.2 40.2 KOGD GD 1990
DD91‐0026 633955.019 7105599.236 806.5 61 PABL BL 1991
DD91‐0027 633953.903 7105601.02 806.6 29.6 PABL BL 1991
DD91‐0028 633970.93 7105579.473 799.3 63.4 PABL BL 1991
DD91‐0029 633969.95 7105581.219 799.3 51.8 PABL BL 1991
DD91‐0030 633981.591 7105553.544 793.2 56.1 PABL BL 1991
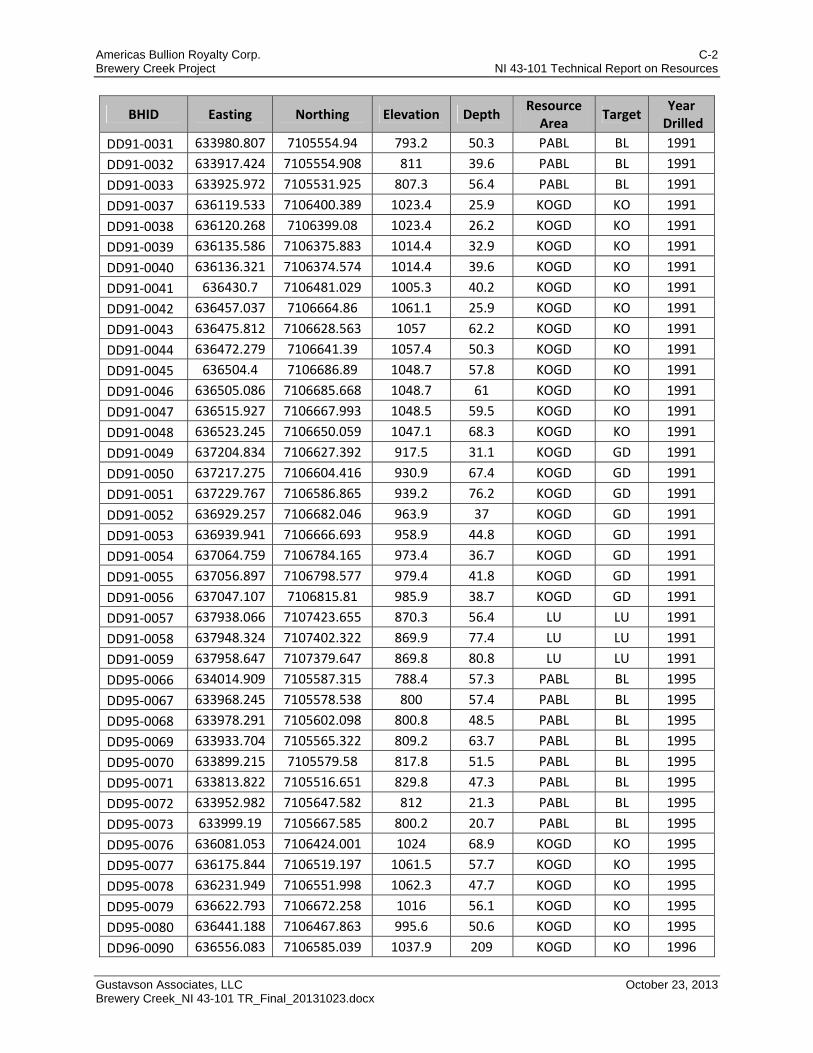
Americas Bullion Royalty Corp. C-2 Brewery Creek Project NI 43-101 Technical Report on Resources
Gustavson Associates, LLC October 23, 2013 Brewery Creek_NI 43-101 TR_Final_20131023.docx
BHID Easting Northing Elevation Depth Resource Area
Target Year
Drilled
DD91‐0031 633980.807 7105554.94 793.2 50.3 PABL BL 1991
DD91‐0032 633917.424 7105554.908 811 39.6 PABL BL 1991
DD91‐0033 633925.972 7105531.925 807.3 56.4 PABL BL 1991
DD91‐0037 636119.533 7106400.389 1023.4 25.9 KOGD KO 1991
DD91‐0038 636120.268 7106399.08 1023.4 26.2 KOGD KO 1991
DD91‐0039 636135.586 7106375.883 1014.4 32.9 KOGD KO 1991
DD91‐0040 636136.321 7106374.574 1014.4 39.6 KOGD KO 1991
DD91‐0041 636430.7 7106481.029 1005.3 40.2 KOGD KO 1991
DD91‐0042 636457.037 7106664.86 1061.1 25.9 KOGD KO 1991
DD91‐0043 636475.812 7106628.563 1057 62.2 KOGD KO 1991
DD91‐0044 636472.279 7106641.39 1057.4 50.3 KOGD KO 1991
DD91‐0045 636504.4 7106686.89 1048.7 57.8 KOGD KO 1991
DD91‐0046 636505.086 7106685.668 1048.7 61 KOGD KO 1991
DD91‐0047 636515.927 7106667.993 1048.5 59.5 KOGD KO 1991
DD91‐0048 636523.245 7106650.059 1047.1 68.3 KOGD KO 1991
DD91‐0049 637204.834 7106627.392 917.5 31.1 KOGD GD 1991
DD91‐0050 637217.275 7106604.416 930.9 67.4 KOGD GD 1991
DD91‐0051 637229.767 7106586.865 939.2 76.2 KOGD GD 1991
DD91‐0052 636929.257 7106682.046 963.9 37 KOGD GD 1991
DD91‐0053 636939.941 7106666.693 958.9 44.8 KOGD GD 1991
DD91‐0054 637064.759 7106784.165 973.4 36.7 KOGD GD 1991
DD91‐0055 637056.897 7106798.577 979.4 41.8 KOGD GD 1991
DD91‐0056 637047.107 7106815.81 985.9 38.7 KOGD GD 1991
DD91‐0057 637938.066 7107423.655 870.3 56.4 LU LU 1991
DD91‐0058 637948.324 7107402.322 869.9 77.4 LU LU 1991
DD91‐0059 637958.647 7107379.647 869.8 80.8 LU LU 1991
DD95‐0066 634014.909 7105587.315 788.4 57.3 PABL BL 1995
DD95‐0067 633968.245 7105578.538 800 57.4 PABL BL 1995
DD95‐0068 633978.291 7105602.098 800.8 48.5 PABL BL 1995
DD95‐0069 633933.704 7105565.322 809.2 63.7 PABL BL 1995
DD95‐0070 633899.215 7105579.58 817.8 51.5 PABL BL 1995
DD95‐0071 633813.822 7105516.651 829.8 47.3 PABL BL 1995
DD95‐0072 633952.982 7105647.582 812 21.3 PABL BL 1995
DD95‐0073 633999.19 7105667.585 800.2 20.7 PABL BL 1995
DD95‐0076 636081.053 7106424.001 1024 68.9 KOGD KO 1995
DD95‐0077 636175.844 7106519.197 1061.5 57.7 KOGD KO 1995
DD95‐0078 636231.949 7106551.998 1062.3 47.7 KOGD KO 1995
DD95‐0079 636622.793 7106672.258 1016 56.1 KOGD KO 1995
DD95‐0080 636441.188 7106467.863 995.6 50.6 KOGD KO 1995
DD96‐0090 636556.083 7106585.039 1037.9 209 KOGD KO 1996
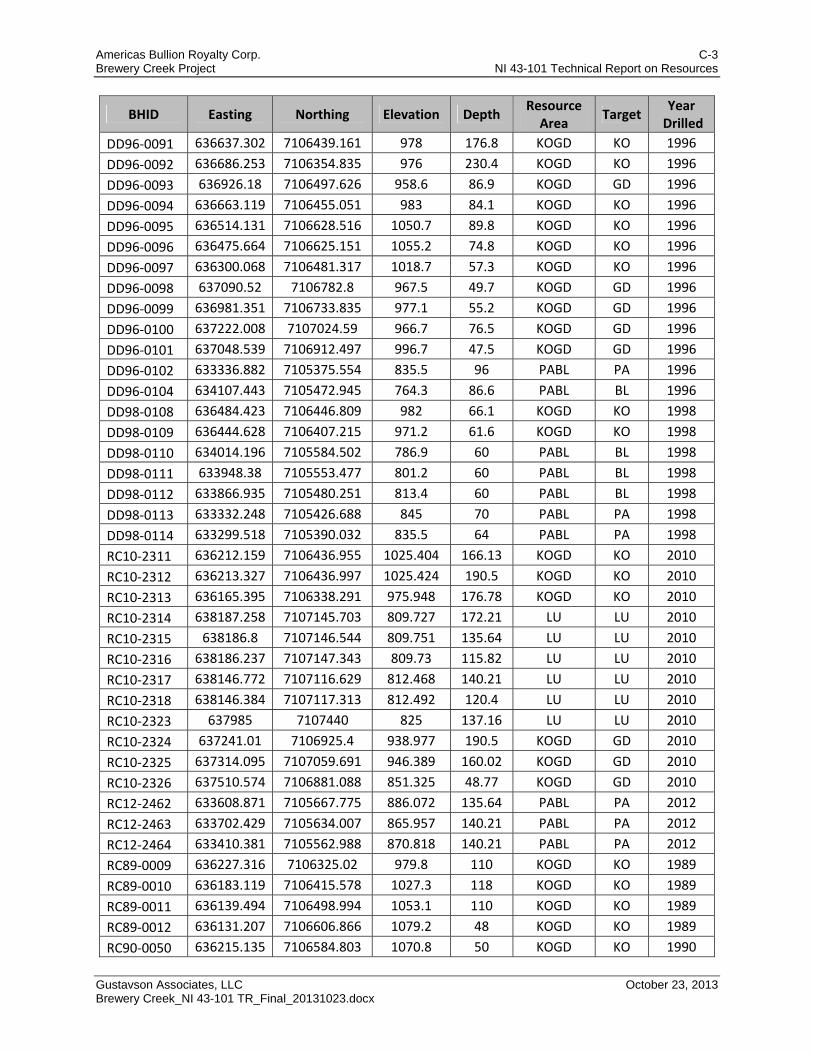
Americas Bullion Royalty Corp. C-3 Brewery Creek Project NI 43-101 Technical Report on Resources
Gustavson Associates, LLC October 23, 2013 Brewery Creek_NI 43-101 TR_Final_20131023.docx
BHID Easting Northing Elevation Depth Resource Area
Target Year
Drilled
DD96‐0091 636637.302 7106439.161 978 176.8 KOGD KO 1996
DD96‐0092 636686.253 7106354.835 976 230.4 KOGD KO 1996
DD96‐0093 636926.18 7106497.626 958.6 86.9 KOGD GD 1996
DD96‐0094 636663.119 7106455.051 983 84.1 KOGD KO 1996
DD96‐0095 636514.131 7106628.516 1050.7 89.8 KOGD KO 1996
DD96‐0096 636475.664 7106625.151 1055.2 74.8 KOGD KO 1996
DD96‐0097 636300.068 7106481.317 1018.7 57.3 KOGD KO 1996
DD96‐0098 637090.52 7106782.8 967.5 49.7 KOGD GD 1996
DD96‐0099 636981.351 7106733.835 977.1 55.2 KOGD GD 1996
DD96‐0100 637222.008 7107024.59 966.7 76.5 KOGD GD 1996
DD96‐0101 637048.539 7106912.497 996.7 47.5 KOGD GD 1996
DD96‐0102 633336.882 7105375.554 835.5 96 PABL PA 1996
DD96‐0104 634107.443 7105472.945 764.3 86.6 PABL BL 1996
DD98‐0108 636484.423 7106446.809 982 66.1 KOGD KO 1998
DD98‐0109 636444.628 7106407.215 971.2 61.6 KOGD KO 1998
DD98‐0110 634014.196 7105584.502 786.9 60 PABL BL 1998
DD98‐0111 633948.38 7105553.477 801.2 60 PABL BL 1998
DD98‐0112 633866.935 7105480.251 813.4 60 PABL BL 1998
DD98‐0113 633332.248 7105426.688 845 70 PABL PA 1998
DD98‐0114 633299.518 7105390.032 835.5 64 PABL PA 1998
RC10‐2311 636212.159 7106436.955 1025.404 166.13 KOGD KO 2010
RC10‐2312 636213.327 7106436.997 1025.424 190.5 KOGD KO 2010
RC10‐2313 636165.395 7106338.291 975.948 176.78 KOGD KO 2010
RC10‐2314 638187.258 7107145.703 809.727 172.21 LU LU 2010
RC10‐2315 638186.8 7107146.544 809.751 135.64 LU LU 2010
RC10‐2316 638186.237 7107147.343 809.73 115.82 LU LU 2010
RC10‐2317 638146.772 7107116.629 812.468 140.21 LU LU 2010
RC10‐2318 638146.384 7107117.313 812.492 120.4 LU LU 2010
RC10‐2323 637985 7107440 825 137.16 LU LU 2010
RC10‐2324 637241.01 7106925.4 938.977 190.5 KOGD GD 2010
RC10‐2325 637314.095 7107059.691 946.389 160.02 KOGD GD 2010
RC10‐2326 637510.574 7106881.088 851.325 48.77 KOGD GD 2010
RC12‐2462 633608.871 7105667.775 886.072 135.64 PABL PA 2012
RC12‐2463 633702.429 7105634.007 865.957 140.21 PABL PA 2012
RC12‐2464 633410.381 7105562.988 870.818 140.21 PABL PA 2012
RC89‐0009 636227.316 7106325.02 979.8 110 KOGD KO 1989
RC89‐0010 636183.119 7106415.578 1027.3 118 KOGD KO 1989
RC89‐0011 636139.494 7106498.994 1053.1 110 KOGD KO 1989
RC89‐0012 636131.207 7106606.866 1079.2 48 KOGD KO 1989
RC90‐0050 636215.135 7106584.803 1070.8 50 KOGD KO 1990

Americas Bullion Royalty Corp. C-4 Brewery Creek Project NI 43-101 Technical Report on Resources
Gustavson Associates, LLC October 23, 2013 Brewery Creek_NI 43-101 TR_Final_20131023.docx
BHID Easting Northing Elevation Depth Resource Area
Target Year
Drilled
RC90‐0051 636226.772 7106565.508 1065.3 50 KOGD KO 1990
RC90‐0052 636236.262 7106547.992 1058.2 30 KOGD KO 1990
RC90‐0053 636142.119 7106590.494 1075.4 50 KOGD KO 1990
RC90‐0054 636150.912 7106568.912 1073.1 50 KOGD KO 1990
RC90‐0055 636161.214 7106550.359 1066.4 50 KOGD KO 1990
RC90‐0056 636170.383 7106527.495 1060.1 50 KOGD KO 1990
RC90‐0057 636113.968 7106543.436 1062.3 50 KOGD KO 1990
RC90‐0058 636104.477 7106562.79 1063.3 50 KOGD KO 1990
RC90‐0059 636125.506 7106522.478 1058.5 50 KOGD KO 1990
RC90‐0060 636277.715 7106565.437 1054.6 50 KOGD KO 1990
RC90‐0061 636263.868 7106582.341 1062.8 50 KOGD KO 1990
RC90‐0062 636254.949 7106605.576 1071.8 50 KOGD KO 1990
RC90‐0063 636084.843 7106508.118 1044.2 50 KOGD KO 1990
RC90‐0064 636096.332 7106489.085 1044.2 50 KOGD KO 1990
RC90‐0065 636072.412 7106444.291 1025.1 50 KOGD KO 1990
RC90‐0066 636082.976 7106424.048 1024.3 50 KOGD KO 1990
RC90‐0067 636091.611 7106404.789 1021.8 50 KOGD KO 1990
RC90‐0068 636104.424 7106385.236 1017.5 50 KOGD KO 1990
RC90‐0069 636989.64 7106927.961 1015.7 58 KOGD GD 1990
RC90‐0070 636995.766 7106911.538 1012.1 62 KOGD GD 1990
RC90‐0071 637005.926 7106894.055 1006.9 64 KOGD GD 1990
RC90‐0072 637014.807 7106874.359 1002.9 64 KOGD GD 1990
RC90‐0073 637045.941 7106815.844 986.8 52 KOGD GD 1990
RC90‐0074 637056.347 7106797.924 979.7 52 KOGD GD 1990
RC90‐0075 637064.024 7106783.637 973.6 50 KOGD GD 1990
RC90‐0076 637072.84 7106767.12 966.5 50 KOGD GD 1990
RC90‐0077 636904.948 7106842.345 1018.2 50 KOGD GD 1990
RC90‐0078 636919.171 7106824.16 1011.6 50 KOGD GD 1990
RC90‐0079 636929.723 7106800.466 1004.6 50 KOGD GD 1990
RC90‐0080 636935.074 7106781.542 998.6 50 KOGD GD 1990
RC90‐0081 636943.503 7106761.017 991.8 50 KOGD GD 1990
RC90‐0082 636955.047 7106742.703 984.6 50 KOGD GD 1990
RC90‐0083 636967.374 7106722.993 977 50 KOGD GD 1990
RC90‐0084 636977.818 7106707.047 970.3 50 KOGD GD 1990
RC90‐0117 636183.533 7106506.524 1052.4 60 KOGD KO 1990
RC90‐0118 636196.519 7106483.395 1045.4 62 KOGD KO 1990
RC90‐0119 636205.836 7106463.944 1038.6 64 KOGD KO 1990
RC90‐0120 636218.098 7106443.738 1031.2 60 KOGD KO 1990
RC90‐0121 636110.805 7106462.083 1040.5 62 KOGD KO 1990
RC90‐0122 636123.001 7106435.868 1035.8 76 KOGD KO 1990
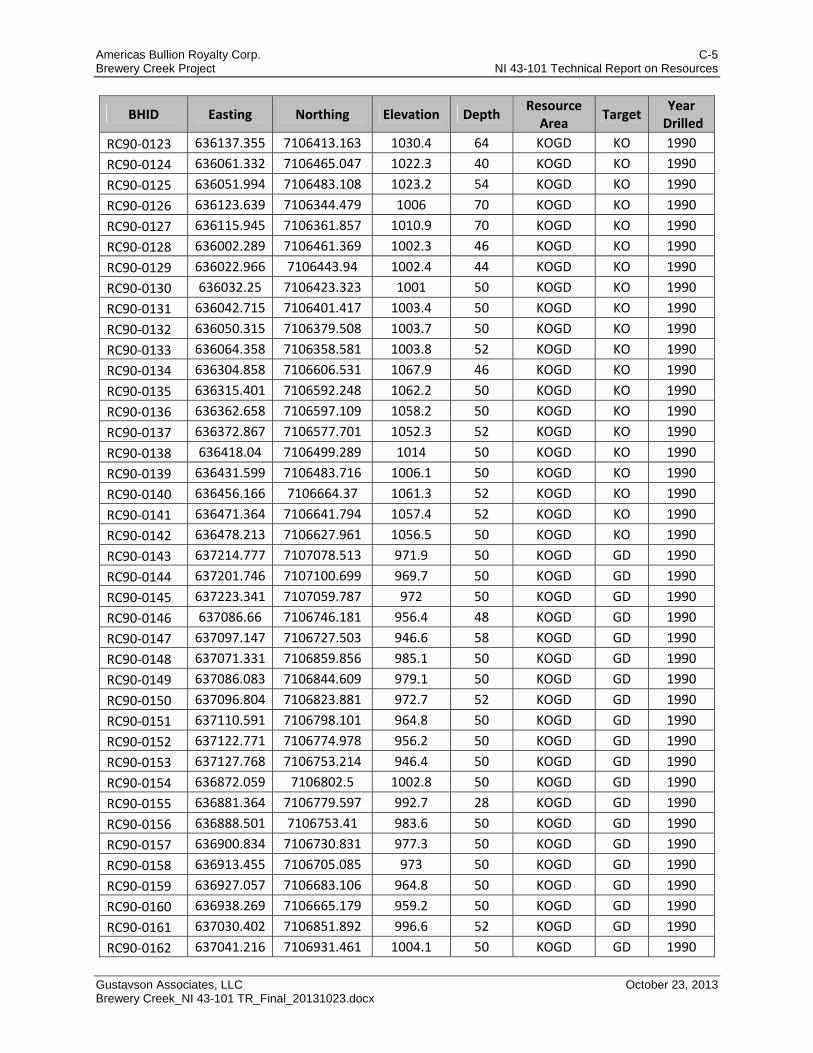
Americas Bullion Royalty Corp. C-5 Brewery Creek Project NI 43-101 Technical Report on Resources
Gustavson Associates, LLC October 23, 2013 Brewery Creek_NI 43-101 TR_Final_20131023.docx
BHID Easting Northing Elevation Depth Resource Area
Target Year
Drilled
RC90‐0123 636137.355 7106413.163 1030.4 64 KOGD KO 1990
RC90‐0124 636061.332 7106465.047 1022.3 40 KOGD KO 1990
RC90‐0125 636051.994 7106483.108 1023.2 54 KOGD KO 1990
RC90‐0126 636123.639 7106344.479 1006 70 KOGD KO 1990
RC90‐0127 636115.945 7106361.857 1010.9 70 KOGD KO 1990
RC90‐0128 636002.289 7106461.369 1002.3 46 KOGD KO 1990
RC90‐0129 636022.966 7106443.94 1002.4 44 KOGD KO 1990
RC90‐0130 636032.25 7106423.323 1001 50 KOGD KO 1990
RC90‐0131 636042.715 7106401.417 1003.4 50 KOGD KO 1990
RC90‐0132 636050.315 7106379.508 1003.7 50 KOGD KO 1990
RC90‐0133 636064.358 7106358.581 1003.8 52 KOGD KO 1990
RC90‐0134 636304.858 7106606.531 1067.9 46 KOGD KO 1990
RC90‐0135 636315.401 7106592.248 1062.2 50 KOGD KO 1990
RC90‐0136 636362.658 7106597.109 1058.2 50 KOGD KO 1990
RC90‐0137 636372.867 7106577.701 1052.3 52 KOGD KO 1990
RC90‐0138 636418.04 7106499.289 1014 50 KOGD KO 1990
RC90‐0139 636431.599 7106483.716 1006.1 50 KOGD KO 1990
RC90‐0140 636456.166 7106664.37 1061.3 52 KOGD KO 1990
RC90‐0141 636471.364 7106641.794 1057.4 52 KOGD KO 1990
RC90‐0142 636478.213 7106627.961 1056.5 50 KOGD KO 1990
RC90‐0143 637214.777 7107078.513 971.9 50 KOGD GD 1990
RC90‐0144 637201.746 7107100.699 969.7 50 KOGD GD 1990
RC90‐0145 637223.341 7107059.787 972 50 KOGD GD 1990
RC90‐0146 637086.66 7106746.181 956.4 48 KOGD GD 1990
RC90‐0147 637097.147 7106727.503 946.6 58 KOGD GD 1990
RC90‐0148 637071.331 7106859.856 985.1 50 KOGD GD 1990
RC90‐0149 637086.083 7106844.609 979.1 50 KOGD GD 1990
RC90‐0150 637096.804 7106823.881 972.7 52 KOGD GD 1990
RC90‐0151 637110.591 7106798.101 964.8 50 KOGD GD 1990
RC90‐0152 637122.771 7106774.978 956.2 50 KOGD GD 1990
RC90‐0153 637127.768 7106753.214 946.4 50 KOGD GD 1990
RC90‐0154 636872.059 7106802.5 1002.8 50 KOGD GD 1990
RC90‐0155 636881.364 7106779.597 992.7 28 KOGD GD 1990
RC90‐0156 636888.501 7106753.41 983.6 50 KOGD GD 1990
RC90‐0157 636900.834 7106730.831 977.3 50 KOGD GD 1990
RC90‐0158 636913.455 7106705.085 973 50 KOGD GD 1990
RC90‐0159 636927.057 7106683.106 964.8 50 KOGD GD 1990
RC90‐0160 636938.269 7106665.179 959.2 50 KOGD GD 1990
RC90‐0161 637030.402 7106851.892 996.6 52 KOGD GD 1990
RC90‐0162 637041.216 7106931.461 1004.1 50 KOGD GD 1990
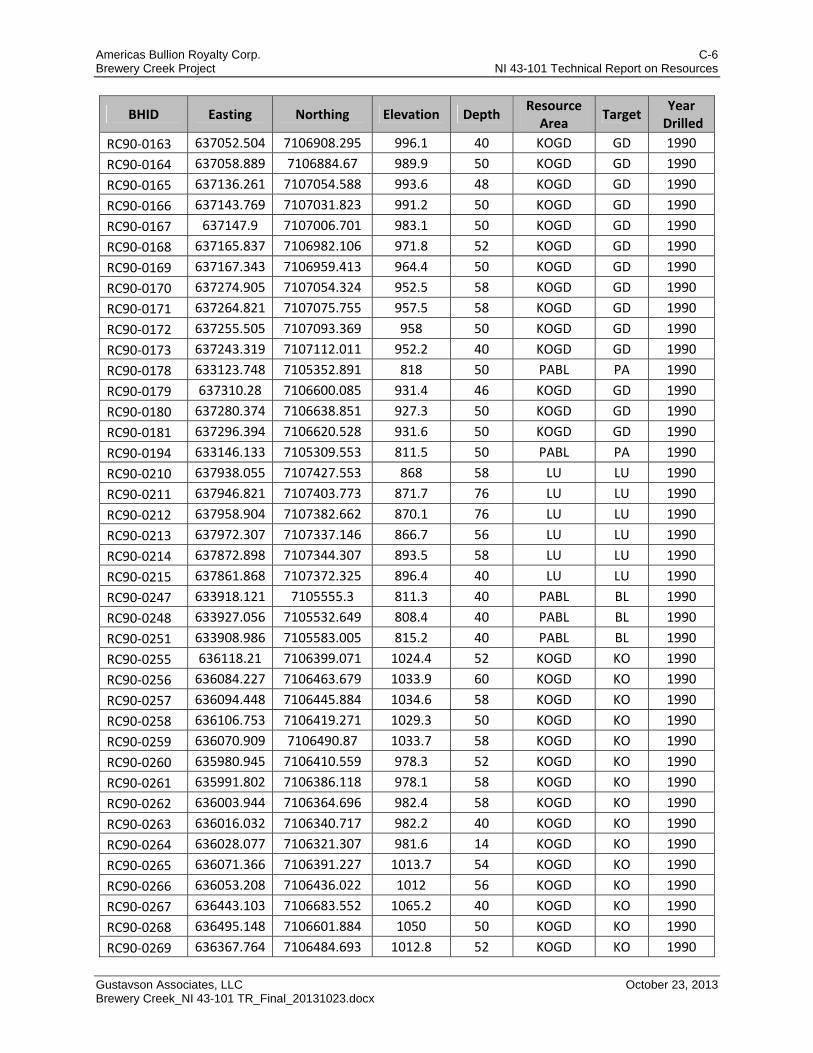
Americas Bullion Royalty Corp. C-6 Brewery Creek Project NI 43-101 Technical Report on Resources
Gustavson Associates, LLC October 23, 2013 Brewery Creek_NI 43-101 TR_Final_20131023.docx
BHID Easting Northing Elevation Depth Resource Area
Target Year
Drilled
RC90‐0163 637052.504 7106908.295 996.1 40 KOGD GD 1990
RC90‐0164 637058.889 7106884.67 989.9 50 KOGD GD 1990
RC90‐0165 637136.261 7107054.588 993.6 48 KOGD GD 1990
RC90‐0166 637143.769 7107031.823 991.2 50 KOGD GD 1990
RC90‐0167 637147.9 7107006.701 983.1 50 KOGD GD 1990
RC90‐0168 637165.837 7106982.106 971.8 52 KOGD GD 1990
RC90‐0169 637167.343 7106959.413 964.4 50 KOGD GD 1990
RC90‐0170 637274.905 7107054.324 952.5 58 KOGD GD 1990
RC90‐0171 637264.821 7107075.755 957.5 58 KOGD GD 1990
RC90‐0172 637255.505 7107093.369 958 50 KOGD GD 1990
RC90‐0173 637243.319 7107112.011 952.2 40 KOGD GD 1990
RC90‐0178 633123.748 7105352.891 818 50 PABL PA 1990
RC90‐0179 637310.28 7106600.085 931.4 46 KOGD GD 1990
RC90‐0180 637280.374 7106638.851 927.3 50 KOGD GD 1990
RC90‐0181 637296.394 7106620.528 931.6 50 KOGD GD 1990
RC90‐0194 633146.133 7105309.553 811.5 50 PABL PA 1990
RC90‐0210 637938.055 7107427.553 868 58 LU LU 1990
RC90‐0211 637946.821 7107403.773 871.7 76 LU LU 1990
RC90‐0212 637958.904 7107382.662 870.1 76 LU LU 1990
RC90‐0213 637972.307 7107337.146 866.7 56 LU LU 1990
RC90‐0214 637872.898 7107344.307 893.5 58 LU LU 1990
RC90‐0215 637861.868 7107372.325 896.4 40 LU LU 1990
RC90‐0247 633918.121 7105555.3 811.3 40 PABL BL 1990
RC90‐0248 633927.056 7105532.649 808.4 40 PABL BL 1990
RC90‐0251 633908.986 7105583.005 815.2 40 PABL BL 1990
RC90‐0255 636118.21 7106399.071 1024.4 52 KOGD KO 1990
RC90‐0256 636084.227 7106463.679 1033.9 60 KOGD KO 1990
RC90‐0257 636094.448 7106445.884 1034.6 58 KOGD KO 1990
RC90‐0258 636106.753 7106419.271 1029.3 50 KOGD KO 1990
RC90‐0259 636070.909 7106490.87 1033.7 58 KOGD KO 1990
RC90‐0260 635980.945 7106410.559 978.3 52 KOGD KO 1990
RC90‐0261 635991.802 7106386.118 978.1 58 KOGD KO 1990
RC90‐0262 636003.944 7106364.696 982.4 58 KOGD KO 1990
RC90‐0263 636016.032 7106340.717 982.2 40 KOGD KO 1990
RC90‐0264 636028.077 7106321.307 981.6 14 KOGD KO 1990
RC90‐0265 636071.366 7106391.227 1013.7 54 KOGD KO 1990
RC90‐0266 636053.208 7106436.022 1012 56 KOGD KO 1990
RC90‐0267 636443.103 7106683.552 1065.2 40 KOGD KO 1990
RC90‐0268 636495.148 7106601.884 1050 50 KOGD KO 1990
RC90‐0269 636367.764 7106484.693 1012.8 52 KOGD KO 1990

Americas Bullion Royalty Corp. C-7 Brewery Creek Project NI 43-101 Technical Report on Resources
Gustavson Associates, LLC October 23, 2013 Brewery Creek_NI 43-101 TR_Final_20131023.docx
BHID Easting Northing Elevation Depth Resource Area
Target Year
Drilled
RC90‐0270 636380.337 7106462.709 1003.1 52 KOGD KO 1990
RC90‐0271 636392.844 7106440.228 989.4 52 KOGD KO 1990
RC90‐0272 636442.882 7106467.092 994.7 52 KOGD KO 1990
RC90‐0273 636455.988 7106445.179 978.8 52 KOGD KO 1990
RC90‐0274 636506.706 7106565.78 1032.2 50 KOGD KO 1990
RC90‐0275 636522.971 7106543.345 1023.1 52 KOGD KO 1990
RC90‐0276 636540.642 7106521.471 1016.4 52 KOGD KO 1990
RC90‐0277 636546.885 7106493.403 1000.8 50 KOGD KO 1990
RC90‐0278 636503.671 7106689.006 1048.7 40 KOGD KO 1990
RC90‐0279 636515.573 7106666.99 1048.6 52 KOGD KO 1990
RC90‐0280 636529.213 7106641.472 1046.4 64 KOGD KO 1990
RC90‐0281 636536.89 7106619.836 1045.6 42 KOGD KO 1990
RC90‐0282 637187.779 7106652.254 907.5 46 KOGD GD 1990
RC90‐0283 637204.447 7106627.06 918.5 50 KOGD GD 1990
RC90‐0284 637216.366 7106605.627 931.2 52 KOGD GD 1990
RC90‐0285 637231.014 7106582.398 939.9 50 KOGD GD 1990
RC90‐0286 637272.414 7106658.95 913.6 40 KOGD GD 1990
RC90‐0287 637335.324 7106669.625 926.5 52 KOGD GD 1990
RC90‐0288 637314.953 7106693.656 914.9 40 KOGD GD 1990
RC90‐0289 637347.602 7106642.652 923.6 52 KOGD GD 1990
RC90‐0290 636949.358 7106864.324 1017.4 46 KOGD GD 1990
RC90‐0291 636960.951 7106844.085 1013.2 52 KOGD GD 1990
RC90‐0292 636974.434 7106826.402 1005.8 52 KOGD GD 1990
RC90‐0293 636983.123 7106804.187 999.4 52 KOGD GD 1990
RC90‐0294 636997.924 7106783.341 992.7 50 KOGD GD 1990
RC90‐0295 637016.073 7106760.817 980.9 52 KOGD GD 1990
RC90‐0296 637023.015 7106744.165 972.8 50 KOGD GD 1990
RC90‐0297 637035.517 7106722.715 962.7 50 KOGD GD 1990
RC90‐0298 637096.54 7106989.544 997.3 58 KOGD GD 1990
RC90‐0299 637109.407 7106968.873 987.2 40 KOGD GD 1990
RC90‐0300 637126.054 7106947.801 974.7 52 KOGD GD 1990
RC90‐0301 637135.364 7106922.031 962 50 KOGD GD 1990
RC90‐0302 637150.061 7106902.389 954.1 52 KOGD GD 1990
RC90‐0303 637161.108 7106874.955 943.7 50 KOGD GD 1990
RC90‐0304 637173.931 7106851.504 939.4 52 KOGD GD 1990
RC90‐0305 637187.26 7106827.763 932.6 70 KOGD GD 1990
RC90‐0306 637200.753 7106806.182 923.1 62 KOGD GD 1990
RC90‐0307 637217.394 7106782.466 911.1 52 KOGD GD 1990
RC90‐0308 637886.56 7107322.016 888.8 66 LU LU 1990
RC90‐0309 637899.858 7107304.459 883.3 70 LU LU 1990
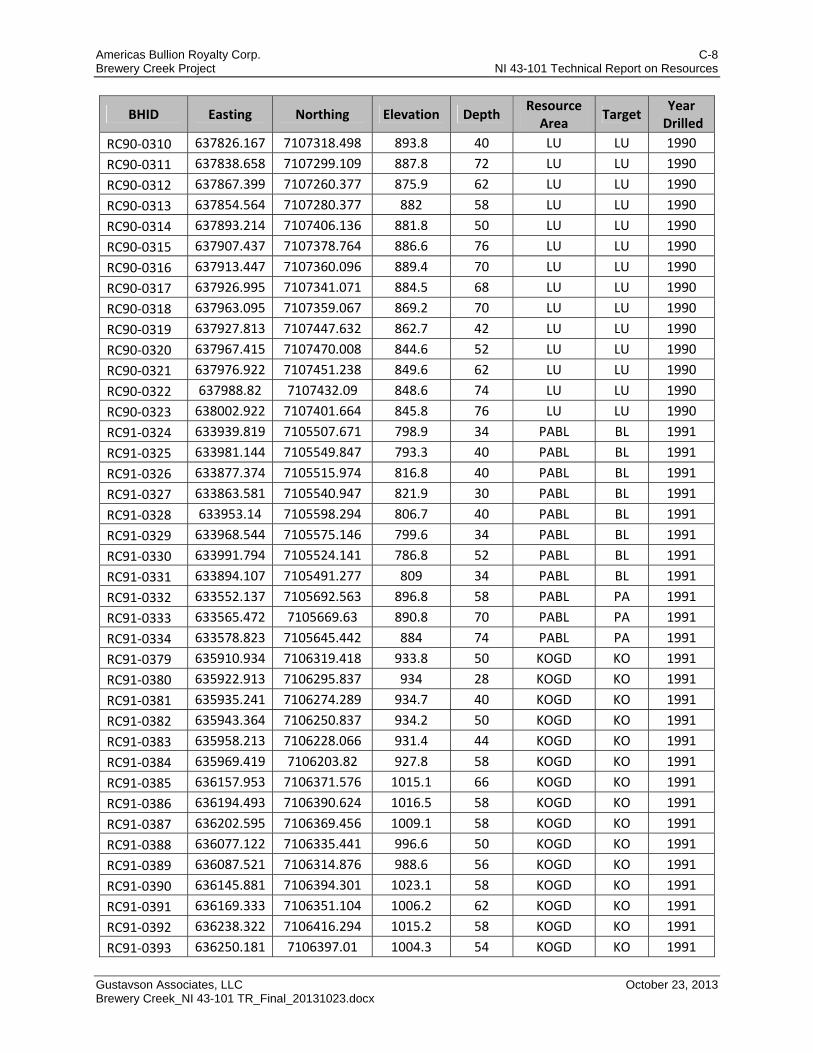
Americas Bullion Royalty Corp. C-8 Brewery Creek Project NI 43-101 Technical Report on Resources
Gustavson Associates, LLC October 23, 2013 Brewery Creek_NI 43-101 TR_Final_20131023.docx
BHID Easting Northing Elevation Depth Resource Area
Target Year
Drilled
RC90‐0310 637826.167 7107318.498 893.8 40 LU LU 1990
RC90‐0311 637838.658 7107299.109 887.8 72 LU LU 1990
RC90‐0312 637867.399 7107260.377 875.9 62 LU LU 1990
RC90‐0313 637854.564 7107280.377 882 58 LU LU 1990
RC90‐0314 637893.214 7107406.136 881.8 50 LU LU 1990
RC90‐0315 637907.437 7107378.764 886.6 76 LU LU 1990
RC90‐0316 637913.447 7107360.096 889.4 70 LU LU 1990
RC90‐0317 637926.995 7107341.071 884.5 68 LU LU 1990
RC90‐0318 637963.095 7107359.067 869.2 70 LU LU 1990
RC90‐0319 637927.813 7107447.632 862.7 42 LU LU 1990
RC90‐0320 637967.415 7107470.008 844.6 52 LU LU 1990
RC90‐0321 637976.922 7107451.238 849.6 62 LU LU 1990
RC90‐0322 637988.82 7107432.09 848.6 74 LU LU 1990
RC90‐0323 638002.922 7107401.664 845.8 76 LU LU 1990
RC91‐0324 633939.819 7105507.671 798.9 34 PABL BL 1991
RC91‐0325 633981.144 7105549.847 793.3 40 PABL BL 1991
RC91‐0326 633877.374 7105515.974 816.8 40 PABL BL 1991
RC91‐0327 633863.581 7105540.947 821.9 30 PABL BL 1991
RC91‐0328 633953.14 7105598.294 806.7 40 PABL BL 1991
RC91‐0329 633968.544 7105575.146 799.6 34 PABL BL 1991
RC91‐0330 633991.794 7105524.141 786.8 52 PABL BL 1991
RC91‐0331 633894.107 7105491.277 809 34 PABL BL 1991
RC91‐0332 633552.137 7105692.563 896.8 58 PABL PA 1991
RC91‐0333 633565.472 7105669.63 890.8 70 PABL PA 1991
RC91‐0334 633578.823 7105645.442 884 74 PABL PA 1991
RC91‐0379 635910.934 7106319.418 933.8 50 KOGD KO 1991
RC91‐0380 635922.913 7106295.837 934 28 KOGD KO 1991
RC91‐0381 635935.241 7106274.289 934.7 40 KOGD KO 1991
RC91‐0382 635943.364 7106250.837 934.2 50 KOGD KO 1991
RC91‐0383 635958.213 7106228.066 931.4 44 KOGD KO 1991
RC91‐0384 635969.419 7106203.82 927.8 58 KOGD KO 1991
RC91‐0385 636157.953 7106371.576 1015.1 66 KOGD KO 1991
RC91‐0386 636194.493 7106390.624 1016.5 58 KOGD KO 1991
RC91‐0387 636202.595 7106369.456 1009.1 58 KOGD KO 1991
RC91‐0388 636077.122 7106335.441 996.6 50 KOGD KO 1991
RC91‐0389 636087.521 7106314.876 988.6 56 KOGD KO 1991
RC91‐0390 636145.881 7106394.301 1023.1 58 KOGD KO 1991
RC91‐0391 636169.333 7106351.104 1006.2 62 KOGD KO 1991
RC91‐0392 636238.322 7106416.294 1015.2 58 KOGD KO 1991
RC91‐0393 636250.181 7106397.01 1004.3 54 KOGD KO 1991
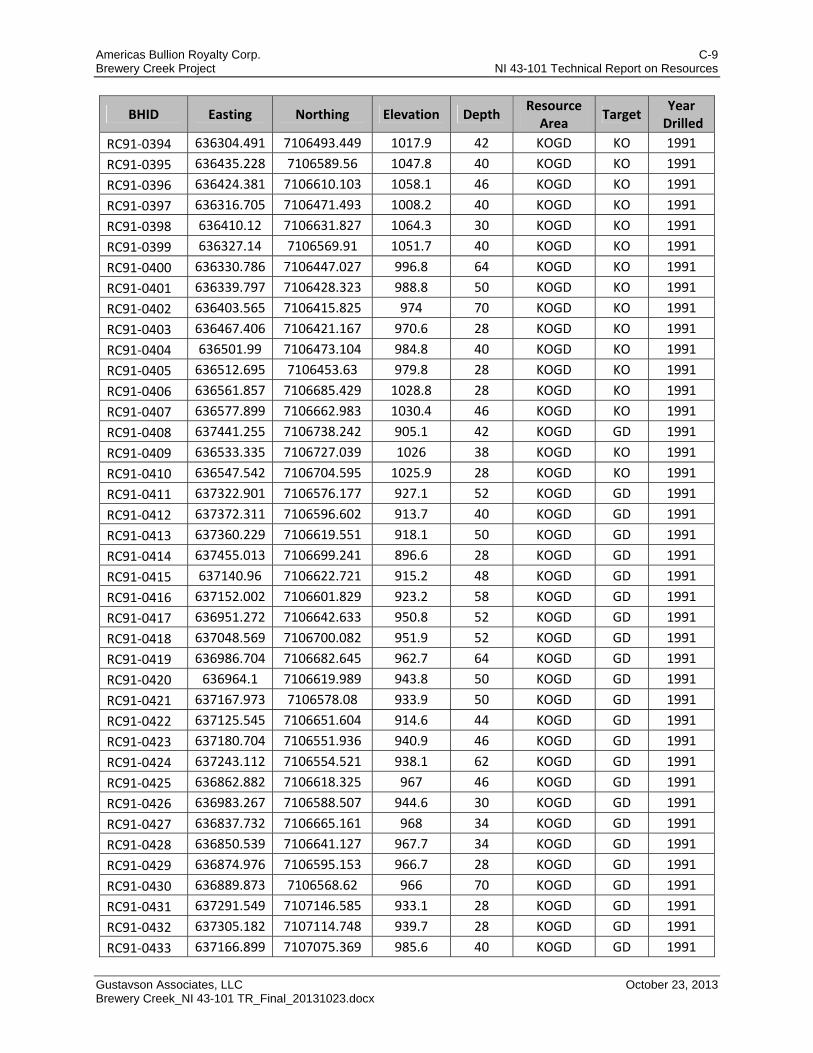
Americas Bullion Royalty Corp. C-9 Brewery Creek Project NI 43-101 Technical Report on Resources
Gustavson Associates, LLC October 23, 2013 Brewery Creek_NI 43-101 TR_Final_20131023.docx
BHID Easting Northing Elevation Depth Resource Area
Target Year
Drilled
RC91‐0394 636304.491 7106493.449 1017.9 42 KOGD KO 1991
RC91‐0395 636435.228 7106589.56 1047.8 40 KOGD KO 1991
RC91‐0396 636424.381 7106610.103 1058.1 46 KOGD KO 1991
RC91‐0397 636316.705 7106471.493 1008.2 40 KOGD KO 1991
RC91‐0398 636410.12 7106631.827 1064.3 30 KOGD KO 1991
RC91‐0399 636327.14 7106569.91 1051.7 40 KOGD KO 1991
RC91‐0400 636330.786 7106447.027 996.8 64 KOGD KO 1991
RC91‐0401 636339.797 7106428.323 988.8 50 KOGD KO 1991
RC91‐0402 636403.565 7106415.825 974 70 KOGD KO 1991
RC91‐0403 636467.406 7106421.167 970.6 28 KOGD KO 1991
RC91‐0404 636501.99 7106473.104 984.8 40 KOGD KO 1991
RC91‐0405 636512.695 7106453.63 979.8 28 KOGD KO 1991
RC91‐0406 636561.857 7106685.429 1028.8 28 KOGD KO 1991
RC91‐0407 636577.899 7106662.983 1030.4 46 KOGD KO 1991
RC91‐0408 637441.255 7106738.242 905.1 42 KOGD GD 1991
RC91‐0409 636533.335 7106727.039 1026 38 KOGD KO 1991
RC91‐0410 636547.542 7106704.595 1025.9 28 KOGD KO 1991
RC91‐0411 637322.901 7106576.177 927.1 52 KOGD GD 1991
RC91‐0412 637372.311 7106596.602 913.7 40 KOGD GD 1991
RC91‐0413 637360.229 7106619.551 918.1 50 KOGD GD 1991
RC91‐0414 637455.013 7106699.241 896.6 28 KOGD GD 1991
RC91‐0415 637140.96 7106622.721 915.2 48 KOGD GD 1991
RC91‐0416 637152.002 7106601.829 923.2 58 KOGD GD 1991
RC91‐0417 636951.272 7106642.633 950.8 52 KOGD GD 1991
RC91‐0418 637048.569 7106700.082 951.9 52 KOGD GD 1991
RC91‐0419 636986.704 7106682.645 962.7 64 KOGD GD 1991
RC91‐0420 636964.1 7106619.989 943.8 50 KOGD GD 1991
RC91‐0421 637167.973 7106578.08 933.9 50 KOGD GD 1991
RC91‐0422 637125.545 7106651.604 914.6 44 KOGD GD 1991
RC91‐0423 637180.704 7106551.936 940.9 46 KOGD GD 1991
RC91‐0424 637243.112 7106554.521 938.1 62 KOGD GD 1991
RC91‐0425 636862.882 7106618.325 967 46 KOGD GD 1991
RC91‐0426 636983.267 7106588.507 944.6 30 KOGD GD 1991
RC91‐0427 636837.732 7106665.161 968 34 KOGD GD 1991
RC91‐0428 636850.539 7106641.127 967.7 34 KOGD GD 1991
RC91‐0429 636874.976 7106595.153 966.7 28 KOGD GD 1991
RC91‐0430 636889.873 7106568.62 966 70 KOGD GD 1991
RC91‐0431 637291.549 7107146.585 933.1 28 KOGD GD 1991
RC91‐0432 637305.182 7107114.748 939.7 28 KOGD GD 1991
RC91‐0433 637166.899 7107075.369 985.6 40 KOGD GD 1991
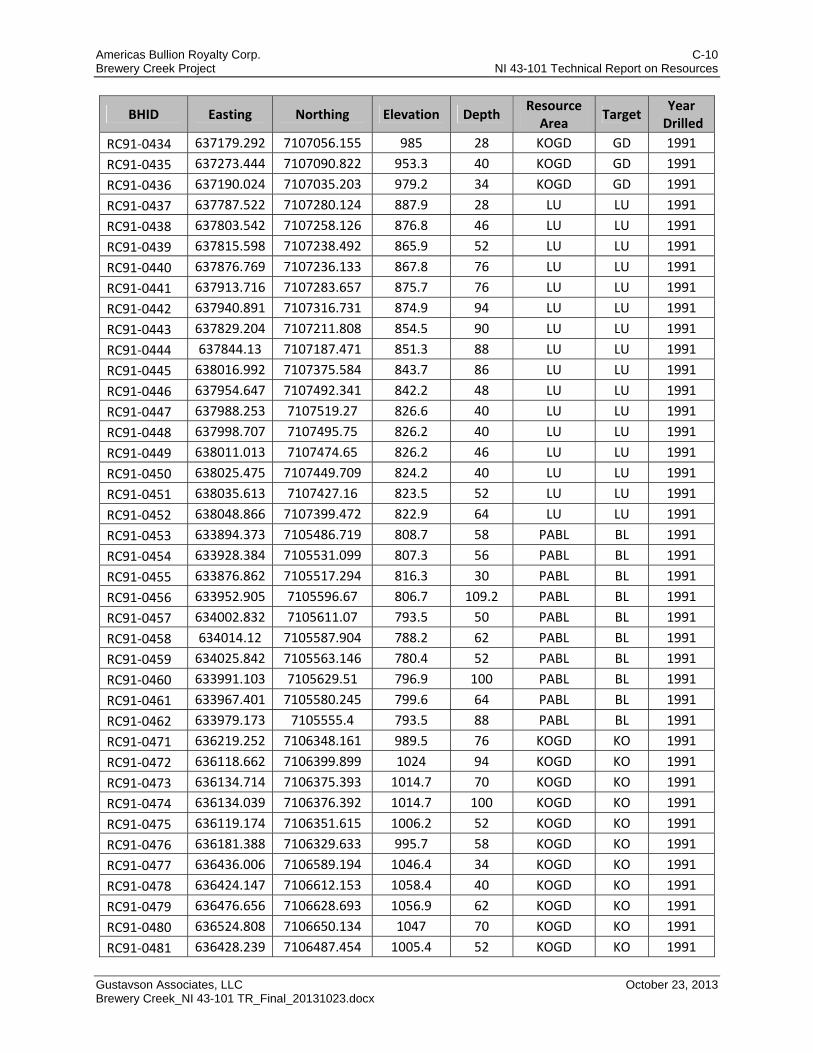
Americas Bullion Royalty Corp. C-10 Brewery Creek Project NI 43-101 Technical Report on Resources
Gustavson Associates, LLC October 23, 2013 Brewery Creek_NI 43-101 TR_Final_20131023.docx
BHID Easting Northing Elevation Depth Resource Area
Target Year
Drilled
RC91‐0434 637179.292 7107056.155 985 28 KOGD GD 1991
RC91‐0435 637273.444 7107090.822 953.3 40 KOGD GD 1991
RC91‐0436 637190.024 7107035.203 979.2 34 KOGD GD 1991
RC91‐0437 637787.522 7107280.124 887.9 28 LU LU 1991
RC91‐0438 637803.542 7107258.126 876.8 46 LU LU 1991
RC91‐0439 637815.598 7107238.492 865.9 52 LU LU 1991
RC91‐0440 637876.769 7107236.133 867.8 76 LU LU 1991
RC91‐0441 637913.716 7107283.657 875.7 76 LU LU 1991
RC91‐0442 637940.891 7107316.731 874.9 94 LU LU 1991
RC91‐0443 637829.204 7107211.808 854.5 90 LU LU 1991
RC91‐0444 637844.13 7107187.471 851.3 88 LU LU 1991
RC91‐0445 638016.992 7107375.584 843.7 86 LU LU 1991
RC91‐0446 637954.647 7107492.341 842.2 48 LU LU 1991
RC91‐0447 637988.253 7107519.27 826.6 40 LU LU 1991
RC91‐0448 637998.707 7107495.75 826.2 40 LU LU 1991
RC91‐0449 638011.013 7107474.65 826.2 46 LU LU 1991
RC91‐0450 638025.475 7107449.709 824.2 40 LU LU 1991
RC91‐0451 638035.613 7107427.16 823.5 52 LU LU 1991
RC91‐0452 638048.866 7107399.472 822.9 64 LU LU 1991
RC91‐0453 633894.373 7105486.719 808.7 58 PABL BL 1991
RC91‐0454 633928.384 7105531.099 807.3 56 PABL BL 1991
RC91‐0455 633876.862 7105517.294 816.3 30 PABL BL 1991
RC91‐0456 633952.905 7105596.67 806.7 109.2 PABL BL 1991
RC91‐0457 634002.832 7105611.07 793.5 50 PABL BL 1991
RC91‐0458 634014.12 7105587.904 788.2 62 PABL BL 1991
RC91‐0459 634025.842 7105563.146 780.4 52 PABL BL 1991
RC91‐0460 633991.103 7105629.51 796.9 100 PABL BL 1991
RC91‐0461 633967.401 7105580.245 799.6 64 PABL BL 1991
RC91‐0462 633979.173 7105555.4 793.5 88 PABL BL 1991
RC91‐0471 636219.252 7106348.161 989.5 76 KOGD KO 1991
RC91‐0472 636118.662 7106399.899 1024 94 KOGD KO 1991
RC91‐0473 636134.714 7106375.393 1014.7 70 KOGD KO 1991
RC91‐0474 636134.039 7106376.392 1014.7 100 KOGD KO 1991
RC91‐0475 636119.174 7106351.615 1006.2 52 KOGD KO 1991
RC91‐0476 636181.388 7106329.633 995.7 58 KOGD KO 1991
RC91‐0477 636436.006 7106589.194 1046.4 34 KOGD KO 1991
RC91‐0478 636424.147 7106612.153 1058.4 40 KOGD KO 1991
RC91‐0479 636476.656 7106628.693 1056.9 62 KOGD KO 1991
RC91‐0480 636524.808 7106650.134 1047 70 KOGD KO 1991
RC91‐0481 636428.239 7106487.454 1005.4 52 KOGD KO 1991

Americas Bullion Royalty Corp. C-11 Brewery Creek Project NI 43-101 Technical Report on Resources
Gustavson Associates, LLC October 23, 2013 Brewery Creek_NI 43-101 TR_Final_20131023.docx
BHID Easting Northing Elevation Depth Resource Area
Target Year
Drilled
RC91‐0482 636489.967 7106493.904 995.9 52 KOGD KO 1991
RC91‐0483 636479.339 7106521.001 1010.3 52 KOGD KO 1991
RC91‐0484 636464.67 7106542.839 1023.2 46 KOGD KO 1991
RC91‐0485 636502.108 7106688.931 1048.7 56 KOGD KO 1991
RC91‐0486 636596.354 7106641.55 1030.8 68 KOGD KO 1991
RC91‐0487 636562.44 7106685.412 1029.3 28 KOGD KO 1991
RC91‐0488 636609.632 7106695.289 1012.7 30 KOGD KO 1991
RC91‐0489 636610.368 7106693.98 1012.7 40 KOGD KO 1991
RC91‐0490 636623.066 7106672.181 1015.8 52 KOGD KO 1991
RC91‐0491 636632.741 7106650.865 1019.5 64 KOGD KO 1991
RC91‐0492 637457.584 7106656.478 890 40 KOGD GD 1991
RC91‐0493 637467.456 7106638.487 889.7 40 KOGD GD 1991
RC91‐0494 637482.01 7106612.565 886.2 40 KOGD GD 1991
RC91‐0495 637386.046 7106686.08 914.1 40 KOGD GD 1991
RC91‐0496 637395.7 7106663.374 909.8 52 KOGD GD 1991
RC91‐0497 637407.411 7106635.164 904.8 46 KOGD GD 1991
RC91‐0498 637418.824 7106619.533 900.6 58 KOGD GD 1991
RC91‐0499 637230.529 7106582.24 939.4 102 KOGD GD 1991
RC91‐0500 637096.837 7106595.737 925.5 52 KOGD GD 1991
RC91‐0501 637124.134 7106554.471 939.5 82 KOGD GD 1991
RC91‐0502 637108.321 7106575.896 936 76 KOGD GD 1991
RC91‐0503 636999.832 7106658.447 948.7 40 KOGD GD 1991
RC91‐0504 637175.907 7106747.317 927.7 58 KOGD GD 1991
RC91‐0505 637100.679 7106897.023 974.9 40 KOGD GD 1991
RC91‐0506 637110.344 7106874.093 966.2 40 KOGD GD 1991
RC91‐0507 637121.478 7106843.032 961.5 46 KOGD GD 1991
RC91‐0508 637138.772 7106820.602 953 40 KOGD GD 1991
RC91‐0509 637151.704 7106796.753 945.5 34 KOGD GD 1991
RC91‐0510 637166.531 7106770.754 936.1 46 KOGD GD 1991
RC91‐0511 637089.479 7106918.4 983.6 40 KOGD GD 1991
RC91‐0512 637066.398 7106966.859 1001.8 52 KOGD GD 1991
RC91‐0513 636946.216 7106865.428 1016.9 40 KOGD GD 1991
RC91‐0514 637041.429 7106931.695 1004.3 52 KOGD GD 1991
RC91‐0515 637080.278 7106941.935 992.6 58 KOGD GD 1991
RC91‐0516 637204.203 7107010.562 968.6 58 KOGD GD 1991
RC91‐0517 636992.752 7106564.672 942.5 100 KOGD GD 1991
RC91‐0518 637004.143 7106547.651 942.5 88 KOGD GD 1991
RC91‐0519 636793.604 7106637.37 982.7 48 KOGD GD 1991
RC91‐0520 636805.588 7106614.596 982.2 70 KOGD GD 1991
RC91‐0521 636815.939 7106594.119 982.1 82 KOGD GD 1991

Americas Bullion Royalty Corp. C-12 Brewery Creek Project NI 43-101 Technical Report on Resources
Gustavson Associates, LLC October 23, 2013 Brewery Creek_NI 43-101 TR_Final_20131023.docx
BHID Easting Northing Elevation Depth Resource Area
Target Year
Drilled
RC91‐0522 636830.967 7106568.578 978 88 KOGD GD 1991
RC91‐0523 637925.379 7107261.047 867.4 94 LU LU 1991
RC91‐0524 637756.136 7107242.502 869.9 52 LU LU 1991
RC91‐0525 637768.349 7107218.708 862.8 40 LU LU 1991
RC91‐0526 637774.484 7107192.876 859.3 118 LU LU 1991
RC91‐0527 637789.84 7107167.978 851.2 82 LU LU 1991
RC91‐0528 637808.485 7107145.388 839.1 112 LU LU 1991
RC91‐0529 637856.408 7107162.336 842.7 82 LU LU 1991
RC91‐0530 637820.623 7107130.508 832.1 82 LU LU 1991
RC91‐0531 637833.463 7107210.757 854.7 82 LU LU 1991
RC91‐0532 638010.579 7107256.118 852.4 74 LU LU 1991
RC91‐0533 638029.476 7107344.364 847.2 76 LU LU 1991
RC91‐0534 633827.414 7105498.57 824.4 40 PABL BL 1991
RC91‐0535 633838.641 7105475.715 819.9 30 PABL BL 1991
RC91‐0536 633850.119 7105453.23 814.1 60 PABL BL 1991
RC91‐0537 633865.153 7105428.496 808.1 70 PABL BL 1991
RC91‐0538 633909.146 7105465.512 802 70 PABL BL 1991
RC91‐0539 633910.126 7105463.766 802 88 PABL BL 1991
RC91‐0540 634076.234 7105589.175 772.5 70 PABL BL 1991
RC91‐0541 634064.075 7105610.014 775.5 70 PABL BL 1991
RC91‐0542 634023.988 7105677.735 793.4 50 PABL BL 1991
RC91‐0543 634035.956 7105654.378 788.5 50 PABL BL 1991
RC91‐0544 634049.645 7105634.284 782.1 50 PABL BL 1991
RC91‐0545 634002.87 7105611.207 793.4 70 PABL BL 1991
RC91‐0546 634037.358 7105538.96 775.4 106 PABL BL 1991
RC91‐0547 634002.139 7105499.183 783.9 70 PABL BL 1991
RC91‐0548 634052.661 7105712.225 787.1 46 PABL BL 1991
RC91‐0549 634062.114 7105700.085 783.9 50 PABL BL 1991
RC91‐0550 634100.011 7105631.363 766.9 50 PABL BL 1991
RC91‐0551 634091.414 7105648.922 770.2 70 PABL BL 1991
RC91‐0552 634076.826 7105671.84 776.3 52 PABL BL 1991
RC91‐0553 636449.455 7106561.157 1035.8 52 KOGD KO 1991
RC91‐0554 636483.496 7106720.037 1048.1 36 KOGD KO 1991
RC91‐0555 636692.984 7106628.923 1005.7 64 KOGD KO 1991
RC91‐0556 636681.876 7106647.482 1006 70 KOGD KO 1991
RC91‐0557 636666.096 7106670.074 1006 52 KOGD KO 1991
RC91‐0558 636665.115 7106671.819 1006 46 KOGD KO 1991
RC91‐0559 636487.767 7106500.476 996.5 46 KOGD KO 1991
RC91‐0560 636500.634 7106474.294 985.1 52 KOGD KO 1991
RC91‐0561 636949.49 7106543.914 953.5 64 KOGD GD 1991
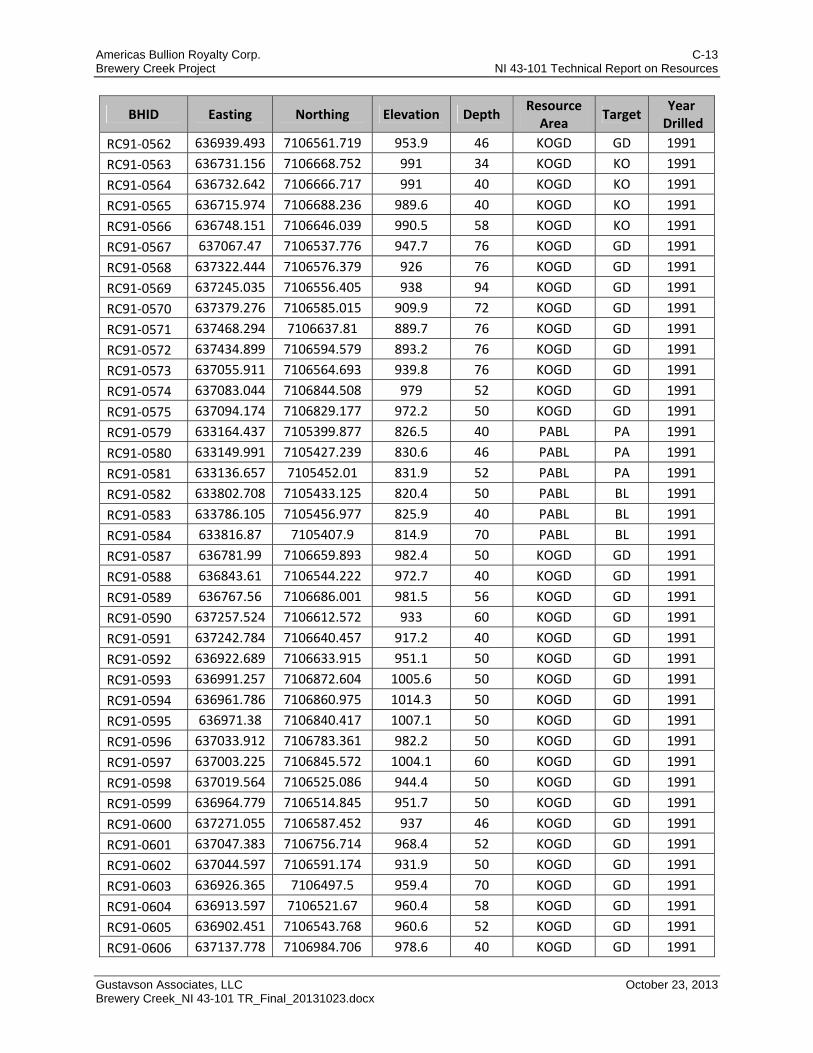
Americas Bullion Royalty Corp. C-13 Brewery Creek Project NI 43-101 Technical Report on Resources
Gustavson Associates, LLC October 23, 2013 Brewery Creek_NI 43-101 TR_Final_20131023.docx
BHID Easting Northing Elevation Depth Resource Area
Target Year
Drilled
RC91‐0562 636939.493 7106561.719 953.9 46 KOGD GD 1991
RC91‐0563 636731.156 7106668.752 991 34 KOGD KO 1991
RC91‐0564 636732.642 7106666.717 991 40 KOGD KO 1991
RC91‐0565 636715.974 7106688.236 989.6 40 KOGD KO 1991
RC91‐0566 636748.151 7106646.039 990.5 58 KOGD KO 1991
RC91‐0567 637067.47 7106537.776 947.7 76 KOGD GD 1991
RC91‐0568 637322.444 7106576.379 926 76 KOGD GD 1991
RC91‐0569 637245.035 7106556.405 938 94 KOGD GD 1991
RC91‐0570 637379.276 7106585.015 909.9 72 KOGD GD 1991
RC91‐0571 637468.294 7106637.81 889.7 76 KOGD GD 1991
RC91‐0572 637434.899 7106594.579 893.2 76 KOGD GD 1991
RC91‐0573 637055.911 7106564.693 939.8 76 KOGD GD 1991
RC91‐0574 637083.044 7106844.508 979 52 KOGD GD 1991
RC91‐0575 637094.174 7106829.177 972.2 50 KOGD GD 1991
RC91‐0579 633164.437 7105399.877 826.5 40 PABL PA 1991
RC91‐0580 633149.991 7105427.239 830.6 46 PABL PA 1991
RC91‐0581 633136.657 7105452.01 831.9 52 PABL PA 1991
RC91‐0582 633802.708 7105433.125 820.4 50 PABL BL 1991
RC91‐0583 633786.105 7105456.977 825.9 40 PABL BL 1991
RC91‐0584 633816.87 7105407.9 814.9 70 PABL BL 1991
RC91‐0587 636781.99 7106659.893 982.4 50 KOGD GD 1991
RC91‐0588 636843.61 7106544.222 972.7 40 KOGD GD 1991
RC91‐0589 636767.56 7106686.001 981.5 56 KOGD GD 1991
RC91‐0590 637257.524 7106612.572 933 60 KOGD GD 1991
RC91‐0591 637242.784 7106640.457 917.2 40 KOGD GD 1991
RC91‐0592 636922.689 7106633.915 951.1 50 KOGD GD 1991
RC91‐0593 636991.257 7106872.604 1005.6 50 KOGD GD 1991
RC91‐0594 636961.786 7106860.975 1014.3 50 KOGD GD 1991
RC91‐0595 636971.38 7106840.417 1007.1 50 KOGD GD 1991
RC91‐0596 637033.912 7106783.361 982.2 50 KOGD GD 1991
RC91‐0597 637003.225 7106845.572 1004.1 60 KOGD GD 1991
RC91‐0598 637019.564 7106525.086 944.4 50 KOGD GD 1991
RC91‐0599 636964.779 7106514.845 951.7 50 KOGD GD 1991
RC91‐0600 637271.055 7106587.452 937 46 KOGD GD 1991
RC91‐0601 637047.383 7106756.714 968.4 52 KOGD GD 1991
RC91‐0602 637044.597 7106591.174 931.9 50 KOGD GD 1991
RC91‐0603 636926.365 7106497.5 959.4 70 KOGD GD 1991
RC91‐0604 636913.597 7106521.67 960.4 58 KOGD GD 1991
RC91‐0605 636902.451 7106543.768 960.6 52 KOGD GD 1991
RC91‐0606 637137.778 7106984.706 978.6 40 KOGD GD 1991
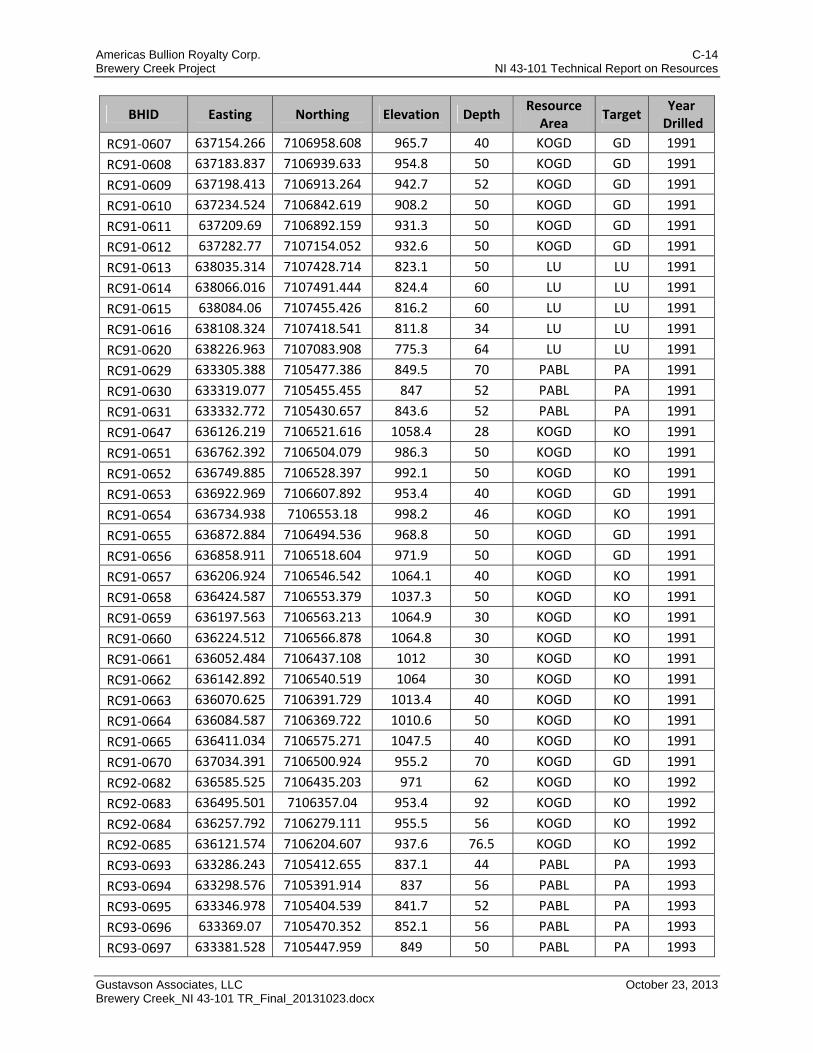
Americas Bullion Royalty Corp. C-14 Brewery Creek Project NI 43-101 Technical Report on Resources
Gustavson Associates, LLC October 23, 2013 Brewery Creek_NI 43-101 TR_Final_20131023.docx
BHID Easting Northing Elevation Depth Resource Area
Target Year
Drilled
RC91‐0607 637154.266 7106958.608 965.7 40 KOGD GD 1991
RC91‐0608 637183.837 7106939.633 954.8 50 KOGD GD 1991
RC91‐0609 637198.413 7106913.264 942.7 52 KOGD GD 1991
RC91‐0610 637234.524 7106842.619 908.2 50 KOGD GD 1991
RC91‐0611 637209.69 7106892.159 931.3 50 KOGD GD 1991
RC91‐0612 637282.77 7107154.052 932.6 50 KOGD GD 1991
RC91‐0613 638035.314 7107428.714 823.1 50 LU LU 1991
RC91‐0614 638066.016 7107491.444 824.4 60 LU LU 1991
RC91‐0615 638084.06 7107455.426 816.2 60 LU LU 1991
RC91‐0616 638108.324 7107418.541 811.8 34 LU LU 1991
RC91‐0620 638226.963 7107083.908 775.3 64 LU LU 1991
RC91‐0629 633305.388 7105477.386 849.5 70 PABL PA 1991
RC91‐0630 633319.077 7105455.455 847 52 PABL PA 1991
RC91‐0631 633332.772 7105430.657 843.6 52 PABL PA 1991
RC91‐0647 636126.219 7106521.616 1058.4 28 KOGD KO 1991
RC91‐0651 636762.392 7106504.079 986.3 50 KOGD KO 1991
RC91‐0652 636749.885 7106528.397 992.1 50 KOGD KO 1991
RC91‐0653 636922.969 7106607.892 953.4 40 KOGD GD 1991
RC91‐0654 636734.938 7106553.18 998.2 46 KOGD KO 1991
RC91‐0655 636872.884 7106494.536 968.8 50 KOGD GD 1991
RC91‐0656 636858.911 7106518.604 971.9 50 KOGD GD 1991
RC91‐0657 636206.924 7106546.542 1064.1 40 KOGD KO 1991
RC91‐0658 636424.587 7106553.379 1037.3 50 KOGD KO 1991
RC91‐0659 636197.563 7106563.213 1064.9 30 KOGD KO 1991
RC91‐0660 636224.512 7106566.878 1064.8 30 KOGD KO 1991
RC91‐0661 636052.484 7106437.108 1012 30 KOGD KO 1991
RC91‐0662 636142.892 7106540.519 1064 30 KOGD KO 1991
RC91‐0663 636070.625 7106391.729 1013.4 40 KOGD KO 1991
RC91‐0664 636084.587 7106369.722 1010.6 50 KOGD KO 1991
RC91‐0665 636411.034 7106575.271 1047.5 40 KOGD KO 1991
RC91‐0670 637034.391 7106500.924 955.2 70 KOGD GD 1991
RC92‐0682 636585.525 7106435.203 971 62 KOGD KO 1992
RC92‐0683 636495.501 7106357.04 953.4 92 KOGD KO 1992
RC92‐0684 636257.792 7106279.111 955.5 56 KOGD KO 1992
RC92‐0685 636121.574 7106204.607 937.6 76.5 KOGD KO 1992
RC93‐0693 633286.243 7105412.655 837.1 44 PABL PA 1993
RC93‐0694 633298.576 7105391.914 837 56 PABL PA 1993
RC93‐0695 633346.978 7105404.539 841.7 52 PABL PA 1993
RC93‐0696 633369.07 7105470.352 852.1 56 PABL PA 1993
RC93‐0697 633381.528 7105447.959 849 50 PABL PA 1993
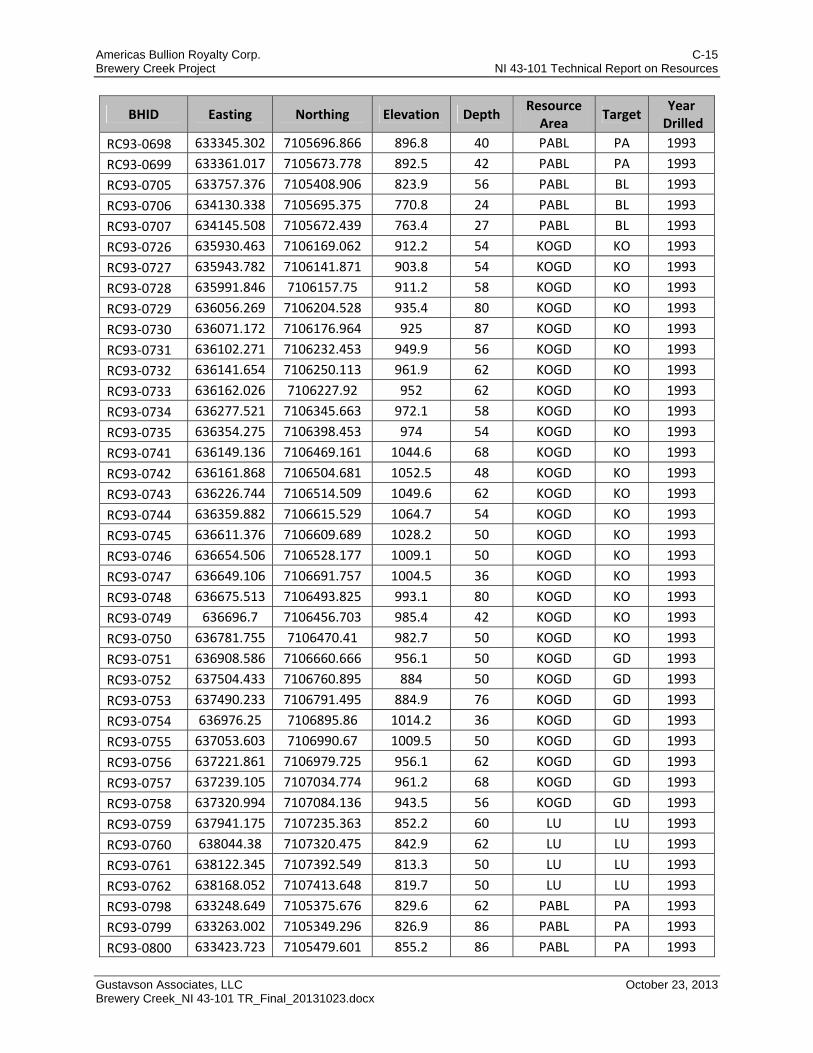
Americas Bullion Royalty Corp. C-15 Brewery Creek Project NI 43-101 Technical Report on Resources
Gustavson Associates, LLC October 23, 2013 Brewery Creek_NI 43-101 TR_Final_20131023.docx
BHID Easting Northing Elevation Depth Resource Area
Target Year
Drilled
RC93‐0698 633345.302 7105696.866 896.8 40 PABL PA 1993
RC93‐0699 633361.017 7105673.778 892.5 42 PABL PA 1993
RC93‐0705 633757.376 7105408.906 823.9 56 PABL BL 1993
RC93‐0706 634130.338 7105695.375 770.8 24 PABL BL 1993
RC93‐0707 634145.508 7105672.439 763.4 27 PABL BL 1993
RC93‐0726 635930.463 7106169.062 912.2 54 KOGD KO 1993
RC93‐0727 635943.782 7106141.871 903.8 54 KOGD KO 1993
RC93‐0728 635991.846 7106157.75 911.2 58 KOGD KO 1993
RC93‐0729 636056.269 7106204.528 935.4 80 KOGD KO 1993
RC93‐0730 636071.172 7106176.964 925 87 KOGD KO 1993
RC93‐0731 636102.271 7106232.453 949.9 56 KOGD KO 1993
RC93‐0732 636141.654 7106250.113 961.9 62 KOGD KO 1993
RC93‐0733 636162.026 7106227.92 952 62 KOGD KO 1993
RC93‐0734 636277.521 7106345.663 972.1 58 KOGD KO 1993
RC93‐0735 636354.275 7106398.453 974 54 KOGD KO 1993
RC93‐0741 636149.136 7106469.161 1044.6 68 KOGD KO 1993
RC93‐0742 636161.868 7106504.681 1052.5 48 KOGD KO 1993
RC93‐0743 636226.744 7106514.509 1049.6 62 KOGD KO 1993
RC93‐0744 636359.882 7106615.529 1064.7 54 KOGD KO 1993
RC93‐0745 636611.376 7106609.689 1028.2 50 KOGD KO 1993
RC93‐0746 636654.506 7106528.177 1009.1 50 KOGD KO 1993
RC93‐0747 636649.106 7106691.757 1004.5 36 KOGD KO 1993
RC93‐0748 636675.513 7106493.825 993.1 80 KOGD KO 1993
RC93‐0749 636696.7 7106456.703 985.4 42 KOGD KO 1993
RC93‐0750 636781.755 7106470.41 982.7 50 KOGD KO 1993
RC93‐0751 636908.586 7106660.666 956.1 50 KOGD GD 1993
RC93‐0752 637504.433 7106760.895 884 50 KOGD GD 1993
RC93‐0753 637490.233 7106791.495 884.9 76 KOGD GD 1993
RC93‐0754 636976.25 7106895.86 1014.2 36 KOGD GD 1993
RC93‐0755 637053.603 7106990.67 1009.5 50 KOGD GD 1993
RC93‐0756 637221.861 7106979.725 956.1 62 KOGD GD 1993
RC93‐0757 637239.105 7107034.774 961.2 68 KOGD GD 1993
RC93‐0758 637320.994 7107084.136 943.5 56 KOGD GD 1993
RC93‐0759 637941.175 7107235.363 852.2 60 LU LU 1993
RC93‐0760 638044.38 7107320.475 842.9 62 LU LU 1993
RC93‐0761 638122.345 7107392.549 813.3 50 LU LU 1993
RC93‐0762 638168.052 7107413.648 819.7 50 LU LU 1993
RC93‐0798 633248.649 7105375.676 829.6 62 PABL PA 1993
RC93‐0799 633263.002 7105349.296 826.9 86 PABL PA 1993
RC93‐0800 633423.723 7105479.601 855.2 86 PABL PA 1993

Americas Bullion Royalty Corp. C-16 Brewery Creek Project NI 43-101 Technical Report on Resources
Gustavson Associates, LLC October 23, 2013 Brewery Creek_NI 43-101 TR_Final_20131023.docx
BHID Easting Northing Elevation Depth Resource Area
Target Year
Drilled
RC93‐0801 633440.108 7105451.032 850.9 62 PABL PA 1993
RC93‐0802 633331.456 7105354.59 831.2 108 PABL PA 1993
RC93‐0803 633365.306 7105370.058 835.6 102 PABL PA 1993
RC93‐0809 637946.195 7107404.684 870 76 LU LU 1993
RC93‐0810 637946.445 7107405.055 870.1 54 LU LU 1993
RC93‐0811 637938.213 7107427.068 869.4 68 LU LU 1993
RC93‐0828 633271.498 7105539.174 859.9 74 PABL PA 1993
RC93‐0840 633491.788 7105466.189 852.2 54 PABL PA 1993
RC93‐0841 633203.301 7105352.712 823.4 44 PABL PA 1993
RC94‐0849 633772.072 7105427.042 824.1 110 PABL BL 1994
RC94‐0850 633793.386 7105449.931 824.1 55.1 PABL BL 1994
RC94‐0851 633819.734 7105451.193 819.9 50 PABL BL 1994
RC94‐0852 633841.266 7105523.925 824.3 30 PABL BL 1994
RC94‐0853 633853.823 7105501.358 821.3 40 PABL BL 1994
RC94‐0854 633865.922 7105480.83 815.6 50 PABL BL 1994
RC94‐0855 633902.737 7105520.012 809.9 50 PABL BL 1994
RC94‐0856 633910.971 7105557.826 811.7 66 PABL BL 1994
RC94‐0857 633889.789 7105545.115 815.4 40 PABL BL 1994
RC94‐0858 633920.931 7105599.71 814.8 40 PABL BL 1994
RC94‐0859 633936.426 7105512.08 802.4 86 PABL BL 1994
RC94‐0860 633916.154 7105498.158 805.9 66 PABL BL 1994
RC94‐0861 633959.704 7105474.296 791 50 PABL BL 1994
RC94‐0862 633993.411 7105519.424 786.5 86 PABL BL 1994
RC94‐0863 633970.786 7105513.366 793.2 60 PABL BL 1994
RC94‐0864 633957.544 7105535.318 798.2 50 PABL BL 1994
RC94‐0865 633946.093 7105556.325 803.3 50 PABL BL 1994
RC94‐0866 633935.012 7105575.244 808.7 40 PABL BL 1994
RC94‐0867 633959.434 7105635.477 809.1 50 PABL BL 1994
RC94‐0868 633986.039 7105542.15 790.3 80 PABL BL 1994
RC94‐0869 633997.436 7105567.388 788.2 70 PABL BL 1994
RC94‐0870 634029.611 7105611.77 788 56 PABL BL 1994
RC94‐0871 634017.67 7105633.65 792 46 PABL BL 1994
RC94‐0872 634007.276 7105656.858 796 40 PABL BL 1994
RC94‐0873 633973.711 7105608.825 802.1 49 PABL BL 1994
RC94‐0874 633985.995 7105588.171 794.8 66 PABL BL 1994
RC94‐0875 634041.803 7105590.261 781.4 65 PABL BL 1994
RC94‐0876 634011.539 7105544.312 779.7 80 PABL BL 1994
RC94‐0877 634023.082 7105522.323 778.4 80 PABL BL 1994
RC94‐0878 634054.642 7105567.393 776.2 70 PABL BL 1994
RC94‐0879 634066.518 7105546.854 771.6 75 PABL BL 1994
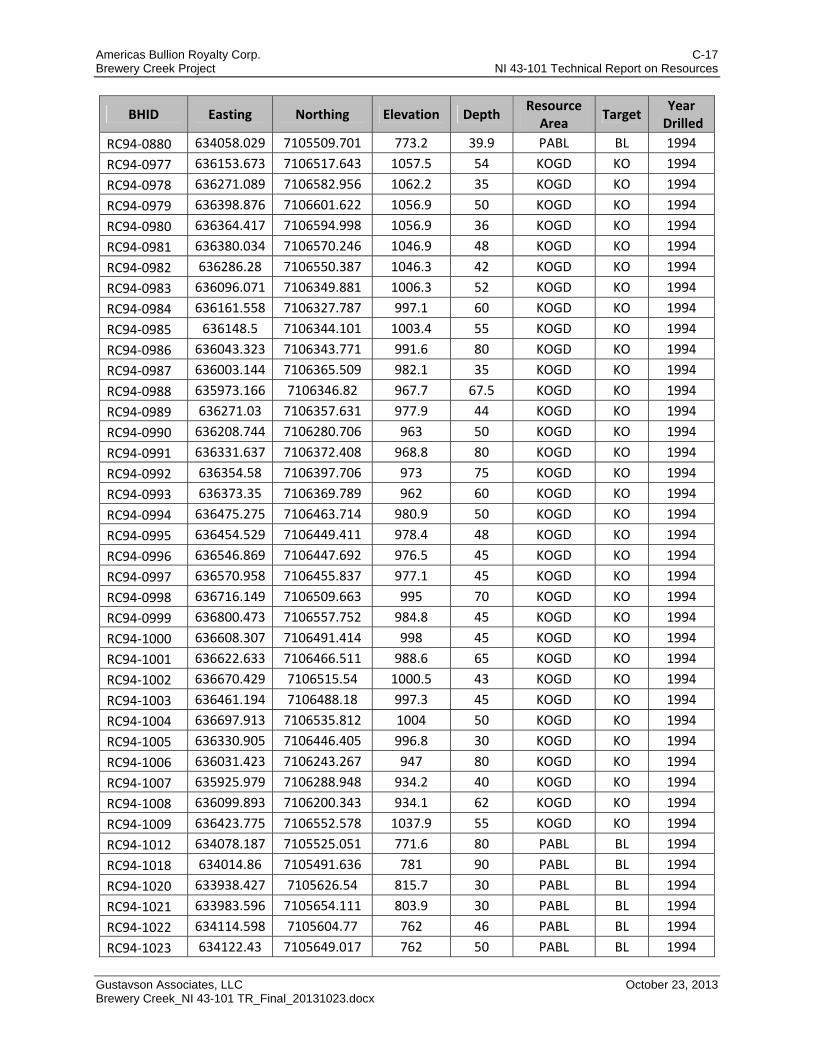
Americas Bullion Royalty Corp. C-17 Brewery Creek Project NI 43-101 Technical Report on Resources
Gustavson Associates, LLC October 23, 2013 Brewery Creek_NI 43-101 TR_Final_20131023.docx
BHID Easting Northing Elevation Depth Resource Area
Target Year
Drilled
RC94‐0880 634058.029 7105509.701 773.2 39.9 PABL BL 1994
RC94‐0977 636153.673 7106517.643 1057.5 54 KOGD KO 1994
RC94‐0978 636271.089 7106582.956 1062.2 35 KOGD KO 1994
RC94‐0979 636398.876 7106601.622 1056.9 50 KOGD KO 1994
RC94‐0980 636364.417 7106594.998 1056.9 36 KOGD KO 1994
RC94‐0981 636380.034 7106570.246 1046.9 48 KOGD KO 1994
RC94‐0982 636286.28 7106550.387 1046.3 42 KOGD KO 1994
RC94‐0983 636096.071 7106349.881 1006.3 52 KOGD KO 1994
RC94‐0984 636161.558 7106327.787 997.1 60 KOGD KO 1994
RC94‐0985 636148.5 7106344.101 1003.4 55 KOGD KO 1994
RC94‐0986 636043.323 7106343.771 991.6 80 KOGD KO 1994
RC94‐0987 636003.144 7106365.509 982.1 35 KOGD KO 1994
RC94‐0988 635973.166 7106346.82 967.7 67.5 KOGD KO 1994
RC94‐0989 636271.03 7106357.631 977.9 44 KOGD KO 1994
RC94‐0990 636208.744 7106280.706 963 50 KOGD KO 1994
RC94‐0991 636331.637 7106372.408 968.8 80 KOGD KO 1994
RC94‐0992 636354.58 7106397.706 973 75 KOGD KO 1994
RC94‐0993 636373.35 7106369.789 962 60 KOGD KO 1994
RC94‐0994 636475.275 7106463.714 980.9 50 KOGD KO 1994
RC94‐0995 636454.529 7106449.411 978.4 48 KOGD KO 1994
RC94‐0996 636546.869 7106447.692 976.5 45 KOGD KO 1994
RC94‐0997 636570.958 7106455.837 977.1 45 KOGD KO 1994
RC94‐0998 636716.149 7106509.663 995 70 KOGD KO 1994
RC94‐0999 636800.473 7106557.752 984.8 45 KOGD KO 1994
RC94‐1000 636608.307 7106491.414 998 45 KOGD KO 1994
RC94‐1001 636622.633 7106466.511 988.6 65 KOGD KO 1994
RC94‐1002 636670.429 7106515.54 1000.5 43 KOGD KO 1994
RC94‐1003 636461.194 7106488.18 997.3 45 KOGD KO 1994
RC94‐1004 636697.913 7106535.812 1004 50 KOGD KO 1994
RC94‐1005 636330.905 7106446.405 996.8 30 KOGD KO 1994
RC94‐1006 636031.423 7106243.267 947 80 KOGD KO 1994
RC94‐1007 635925.979 7106288.948 934.2 40 KOGD KO 1994
RC94‐1008 636099.893 7106200.343 934.1 62 KOGD KO 1994
RC94‐1009 636423.775 7106552.578 1037.9 55 KOGD KO 1994
RC94‐1012 634078.187 7105525.051 771.6 80 PABL BL 1994
RC94‐1018 634014.86 7105491.636 781 90 PABL BL 1994
RC94‐1020 633938.427 7105626.54 815.7 30 PABL BL 1994
RC94‐1021 633983.596 7105654.111 803.9 30 PABL BL 1994
RC94‐1022 634114.598 7105604.77 762 46 PABL BL 1994
RC94‐1023 634122.43 7105649.017 762 50 PABL BL 1994
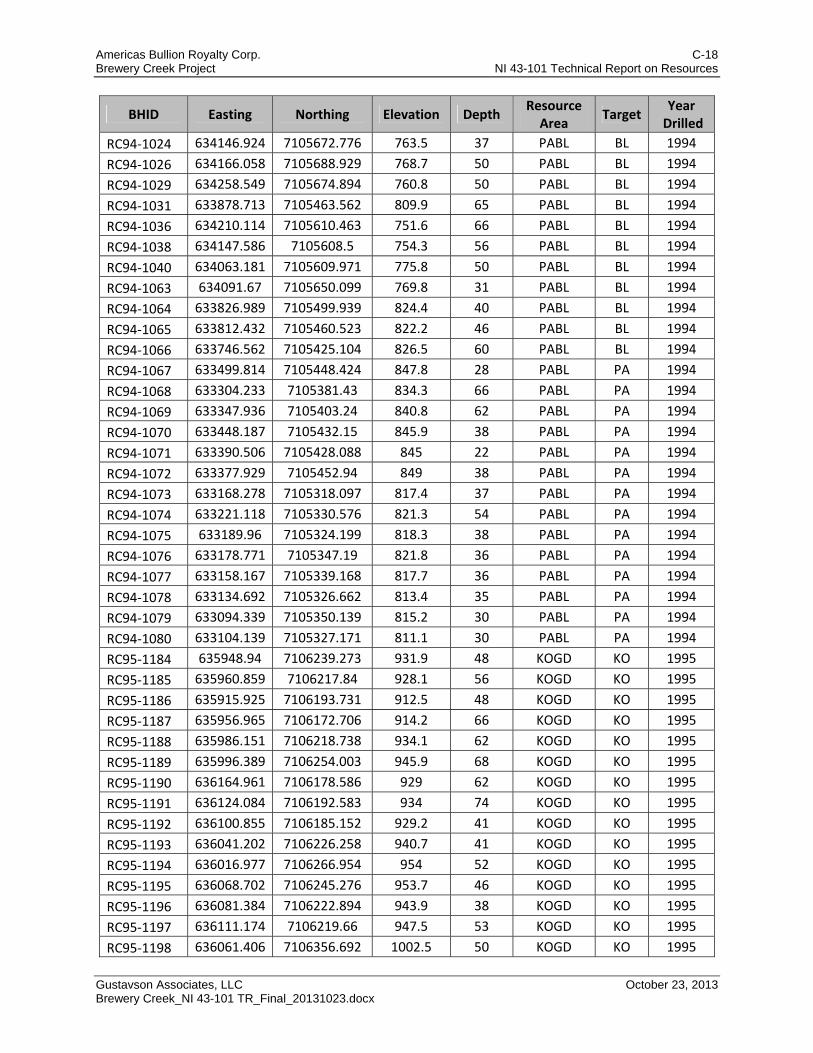
Americas Bullion Royalty Corp. C-18 Brewery Creek Project NI 43-101 Technical Report on Resources
Gustavson Associates, LLC October 23, 2013 Brewery Creek_NI 43-101 TR_Final_20131023.docx
BHID Easting Northing Elevation Depth Resource Area
Target Year
Drilled
RC94‐1024 634146.924 7105672.776 763.5 37 PABL BL 1994
RC94‐1026 634166.058 7105688.929 768.7 50 PABL BL 1994
RC94‐1029 634258.549 7105674.894 760.8 50 PABL BL 1994
RC94‐1031 633878.713 7105463.562 809.9 65 PABL BL 1994
RC94‐1036 634210.114 7105610.463 751.6 66 PABL BL 1994
RC94‐1038 634147.586 7105608.5 754.3 56 PABL BL 1994
RC94‐1040 634063.181 7105609.971 775.8 50 PABL BL 1994
RC94‐1063 634091.67 7105650.099 769.8 31 PABL BL 1994
RC94‐1064 633826.989 7105499.939 824.4 40 PABL BL 1994
RC94‐1065 633812.432 7105460.523 822.2 46 PABL BL 1994
RC94‐1066 633746.562 7105425.104 826.5 60 PABL BL 1994
RC94‐1067 633499.814 7105448.424 847.8 28 PABL PA 1994
RC94‐1068 633304.233 7105381.43 834.3 66 PABL PA 1994
RC94‐1069 633347.936 7105403.24 840.8 62 PABL PA 1994
RC94‐1070 633448.187 7105432.15 845.9 38 PABL PA 1994
RC94‐1071 633390.506 7105428.088 845 22 PABL PA 1994
RC94‐1072 633377.929 7105452.94 849 38 PABL PA 1994
RC94‐1073 633168.278 7105318.097 817.4 37 PABL PA 1994
RC94‐1074 633221.118 7105330.576 821.3 54 PABL PA 1994
RC94‐1075 633189.96 7105324.199 818.3 38 PABL PA 1994
RC94‐1076 633178.771 7105347.19 821.8 36 PABL PA 1994
RC94‐1077 633158.167 7105339.168 817.7 36 PABL PA 1994
RC94‐1078 633134.692 7105326.662 813.4 35 PABL PA 1994
RC94‐1079 633094.339 7105350.139 815.2 30 PABL PA 1994
RC94‐1080 633104.139 7105327.171 811.1 30 PABL PA 1994
RC95‐1184 635948.94 7106239.273 931.9 48 KOGD KO 1995
RC95‐1185 635960.859 7106217.84 928.1 56 KOGD KO 1995
RC95‐1186 635915.925 7106193.731 912.5 48 KOGD KO 1995
RC95‐1187 635956.965 7106172.706 914.2 66 KOGD KO 1995
RC95‐1188 635986.151 7106218.738 934.1 62 KOGD KO 1995
RC95‐1189 635996.389 7106254.003 945.9 68 KOGD KO 1995
RC95‐1190 636164.961 7106178.586 929 62 KOGD KO 1995
RC95‐1191 636124.084 7106192.583 934 74 KOGD KO 1995
RC95‐1192 636100.855 7106185.152 929.2 41 KOGD KO 1995
RC95‐1193 636041.202 7106226.258 940.7 41 KOGD KO 1995
RC95‐1194 636016.977 7106266.954 954 52 KOGD KO 1995
RC95‐1195 636068.702 7106245.276 953.7 46 KOGD KO 1995
RC95‐1196 636081.384 7106222.894 943.9 38 KOGD KO 1995
RC95‐1197 636111.174 7106219.66 947.5 53 KOGD KO 1995
RC95‐1198 636061.406 7106356.692 1002.5 50 KOGD KO 1995
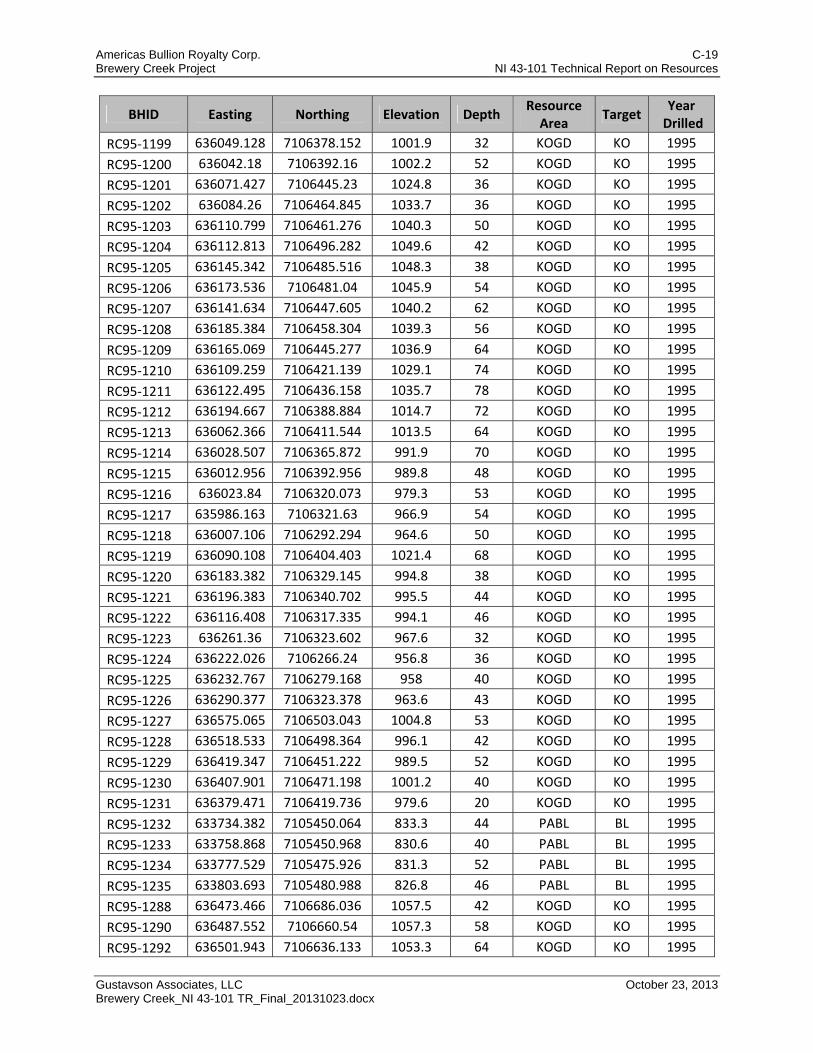
Americas Bullion Royalty Corp. C-19 Brewery Creek Project NI 43-101 Technical Report on Resources
Gustavson Associates, LLC October 23, 2013 Brewery Creek_NI 43-101 TR_Final_20131023.docx
BHID Easting Northing Elevation Depth Resource Area
Target Year
Drilled
RC95‐1199 636049.128 7106378.152 1001.9 32 KOGD KO 1995
RC95‐1200 636042.18 7106392.16 1002.2 52 KOGD KO 1995
RC95‐1201 636071.427 7106445.23 1024.8 36 KOGD KO 1995
RC95‐1202 636084.26 7106464.845 1033.7 36 KOGD KO 1995
RC95‐1203 636110.799 7106461.276 1040.3 50 KOGD KO 1995
RC95‐1204 636112.813 7106496.282 1049.6 42 KOGD KO 1995
RC95‐1205 636145.342 7106485.516 1048.3 38 KOGD KO 1995
RC95‐1206 636173.536 7106481.04 1045.9 54 KOGD KO 1995
RC95‐1207 636141.634 7106447.605 1040.2 62 KOGD KO 1995
RC95‐1208 636185.384 7106458.304 1039.3 56 KOGD KO 1995
RC95‐1209 636165.069 7106445.277 1036.9 64 KOGD KO 1995
RC95‐1210 636109.259 7106421.139 1029.1 74 KOGD KO 1995
RC95‐1211 636122.495 7106436.158 1035.7 78 KOGD KO 1995
RC95‐1212 636194.667 7106388.884 1014.7 72 KOGD KO 1995
RC95‐1213 636062.366 7106411.544 1013.5 64 KOGD KO 1995
RC95‐1214 636028.507 7106365.872 991.9 70 KOGD KO 1995
RC95‐1215 636012.956 7106392.956 989.8 48 KOGD KO 1995
RC95‐1216 636023.84 7106320.073 979.3 53 KOGD KO 1995
RC95‐1217 635986.163 7106321.63 966.9 54 KOGD KO 1995
RC95‐1218 636007.106 7106292.294 964.6 50 KOGD KO 1995
RC95‐1219 636090.108 7106404.403 1021.4 68 KOGD KO 1995
RC95‐1220 636183.382 7106329.145 994.8 38 KOGD KO 1995
RC95‐1221 636196.383 7106340.702 995.5 44 KOGD KO 1995
RC95‐1222 636116.408 7106317.335 994.1 46 KOGD KO 1995
RC95‐1223 636261.36 7106323.602 967.6 32 KOGD KO 1995
RC95‐1224 636222.026 7106266.24 956.8 36 KOGD KO 1995
RC95‐1225 636232.767 7106279.168 958 40 KOGD KO 1995
RC95‐1226 636290.377 7106323.378 963.6 43 KOGD KO 1995
RC95‐1227 636575.065 7106503.043 1004.8 53 KOGD KO 1995
RC95‐1228 636518.533 7106498.364 996.1 42 KOGD KO 1995
RC95‐1229 636419.347 7106451.222 989.5 52 KOGD KO 1995
RC95‐1230 636407.901 7106471.198 1001.2 40 KOGD KO 1995
RC95‐1231 636379.471 7106419.736 979.6 20 KOGD KO 1995
RC95‐1232 633734.382 7105450.064 833.3 44 PABL BL 1995
RC95‐1233 633758.868 7105450.968 830.6 40 PABL BL 1995
RC95‐1234 633777.529 7105475.926 831.3 52 PABL BL 1995
RC95‐1235 633803.693 7105480.988 826.8 46 PABL BL 1995
RC95‐1288 636473.466 7106686.036 1057.5 42 KOGD KO 1995
RC95‐1290 636487.552 7106660.54 1057.3 58 KOGD KO 1995
RC95‐1292 636501.943 7106636.133 1053.3 64 KOGD KO 1995

Americas Bullion Royalty Corp. C-20 Brewery Creek Project NI 43-101 Technical Report on Resources
Gustavson Associates, LLC October 23, 2013 Brewery Creek_NI 43-101 TR_Final_20131023.docx
BHID Easting Northing Elevation Depth Resource Area
Target Year
Drilled
RC95‐1293 636292.009 7106586.333 1062.1 26 KOGD KO 1995
RC95‐1294 636492.49 7106601.309 1050.4 40 KOGD KO 1995
RC95‐1295 636215.511 7106532.882 1058.4 46 KOGD KO 1995
RC95‐1296 636515.715 7106711.049 1039.8 49 KOGD KO 1995
RC95‐1297 636348.681 7106582.593 1054.6 40 KOGD KO 1995
RC95‐1298 636548.081 7106660.346 1041.3 60 KOGD KO 1995
RC95‐1299 636341.308 7106541.818 1036.6 42 KOGD KO 1995
RC95‐1300 636236.577 7106494.545 1041.9 66 KOGD KO 1995
RC95‐1301 636254.754 7106513.833 1042.3 48 KOGD KO 1995
RC95‐1302 636590.079 7106585.546 1031.2 66 KOGD KO 1995
RC95‐1303 636462.552 7106599.293 1050.4 40 KOGD KO 1995
RC95‐1304 636585.842 7106683.754 1023 42 KOGD KO 1995
RC95‐1305 636686.261 7106558.199 1008.8 64 KOGD KO 1995
RC95‐1306 636648.346 7106667.79 1011.9 50 KOGD KO 1995
RC95‐1307 636766.765 7106550.402 991.8 42 KOGD KO 1995
RC95‐1308 636745.001 7106492.581 988.6 42 KOGD KO 1995
RC95‐1309 636832.728 7106675.094 967.8 30 KOGD GD 1995
RC95‐1310 636782.988 7106579.501 989.8 46 KOGD KO 1995
RC95‐1311 636806.009 7106581.992 984.8 42 KOGD KO 1995
RC95‐1312 636725.247 7106485.496 989.1 42 KOGD KO 1995
RC95‐1313 636650.192 7106476.032 989 50 KOGD KO 1995
RC95‐1314 636598.701 7106457.882 981.1 44 KOGD KO 1995
RC95‐1315 636559.981 7106424.748 968 36 KOGD KO 1995
RC95‐1316 636537.971 7106414.328 968.1 46 KOGD KO 1995
RC95‐1317 636489.154 7106438.79 973.8 50 KOGD KO 1995
RC95‐1318 636390.383 7106399.689 969.7 40 KOGD KO 1995
RC95‐1319 636346.252 7106348.012 962 54 KOGD KO 1995
RC95‐1320 636690.121 7106692.421 992.7 38 KOGD KO 1995
RC95‐1321 636757.117 7106664.169 987.6 36 KOGD KO 1995
RC95‐1322 636719.829 7106538.027 999.9 56 KOGD KO 1995
RC95‐1323 636878.421 7106672.532 959.8 26 KOGD GD 1995
RC95‐1324 636634.394 7106445.564 979.5 60 KOGD KO 1995
RC95‐1325 636431.517 7106431.997 976.4 50 KOGD KO 1995
RC95‐1326 636405.308 7106375.353 962.9 62 KOGD KO 1995
RC95‐1327 636378.353 7106356.181 960.3 78 KOGD KO 1995
RC95‐1328 636321.052 7106391.261 978 72 KOGD KO 1995
RC95‐1329 636339.192 7106426.949 988.5 56 KOGD KO 1995
RC95‐1330 636377.467 7106418.609 979.7 50 KOGD KO 1995
RC95‐1331 636243.69 7106305.862 963.6 50 KOGD KO 1995
RC95‐1332 636199.275 7106299.612 978.8 36 KOGD KO 1995
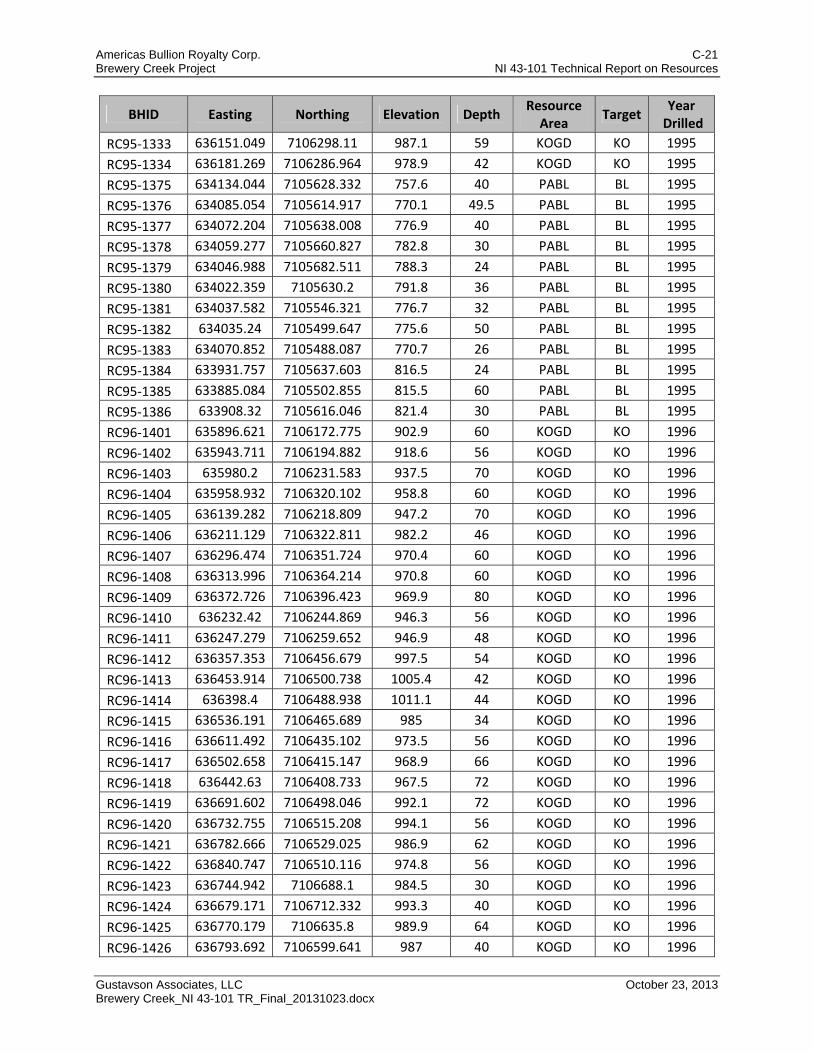
Americas Bullion Royalty Corp. C-21 Brewery Creek Project NI 43-101 Technical Report on Resources
Gustavson Associates, LLC October 23, 2013 Brewery Creek_NI 43-101 TR_Final_20131023.docx
BHID Easting Northing Elevation Depth Resource Area
Target Year
Drilled
RC95‐1333 636151.049 7106298.11 987.1 59 KOGD KO 1995
RC95‐1334 636181.269 7106286.964 978.9 42 KOGD KO 1995
RC95‐1375 634134.044 7105628.332 757.6 40 PABL BL 1995
RC95‐1376 634085.054 7105614.917 770.1 49.5 PABL BL 1995
RC95‐1377 634072.204 7105638.008 776.9 40 PABL BL 1995
RC95‐1378 634059.277 7105660.827 782.8 30 PABL BL 1995
RC95‐1379 634046.988 7105682.511 788.3 24 PABL BL 1995
RC95‐1380 634022.359 7105630.2 791.8 36 PABL BL 1995
RC95‐1381 634037.582 7105546.321 776.7 32 PABL BL 1995
RC95‐1382 634035.24 7105499.647 775.6 50 PABL BL 1995
RC95‐1383 634070.852 7105488.087 770.7 26 PABL BL 1995
RC95‐1384 633931.757 7105637.603 816.5 24 PABL BL 1995
RC95‐1385 633885.084 7105502.855 815.5 60 PABL BL 1995
RC95‐1386 633908.32 7105616.046 821.4 30 PABL BL 1995
RC96‐1401 635896.621 7106172.775 902.9 60 KOGD KO 1996
RC96‐1402 635943.711 7106194.882 918.6 56 KOGD KO 1996
RC96‐1403 635980.2 7106231.583 937.5 70 KOGD KO 1996
RC96‐1404 635958.932 7106320.102 958.8 60 KOGD KO 1996
RC96‐1405 636139.282 7106218.809 947.2 70 KOGD KO 1996
RC96‐1406 636211.129 7106322.811 982.2 46 KOGD KO 1996
RC96‐1407 636296.474 7106351.724 970.4 60 KOGD KO 1996
RC96‐1408 636313.996 7106364.214 970.8 60 KOGD KO 1996
RC96‐1409 636372.726 7106396.423 969.9 80 KOGD KO 1996
RC96‐1410 636232.42 7106244.869 946.3 56 KOGD KO 1996
RC96‐1411 636247.279 7106259.652 946.9 48 KOGD KO 1996
RC96‐1412 636357.353 7106456.679 997.5 54 KOGD KO 1996
RC96‐1413 636453.914 7106500.738 1005.4 42 KOGD KO 1996
RC96‐1414 636398.4 7106488.938 1011.1 44 KOGD KO 1996
RC96‐1415 636536.191 7106465.689 985 34 KOGD KO 1996
RC96‐1416 636611.492 7106435.102 973.5 56 KOGD KO 1996
RC96‐1417 636502.658 7106415.147 968.9 66 KOGD KO 1996
RC96‐1418 636442.63 7106408.733 967.5 72 KOGD KO 1996
RC96‐1419 636691.602 7106498.046 992.1 72 KOGD KO 1996
RC96‐1420 636732.755 7106515.208 994.1 56 KOGD KO 1996
RC96‐1421 636782.666 7106529.025 986.9 62 KOGD KO 1996
RC96‐1422 636840.747 7106510.116 974.8 56 KOGD KO 1996
RC96‐1423 636744.942 7106688.1 984.5 30 KOGD KO 1996
RC96‐1424 636679.171 7106712.332 993.3 40 KOGD KO 1996
RC96‐1425 636770.179 7106635.8 989.9 64 KOGD KO 1996
RC96‐1426 636793.692 7106599.641 987 40 KOGD KO 1996
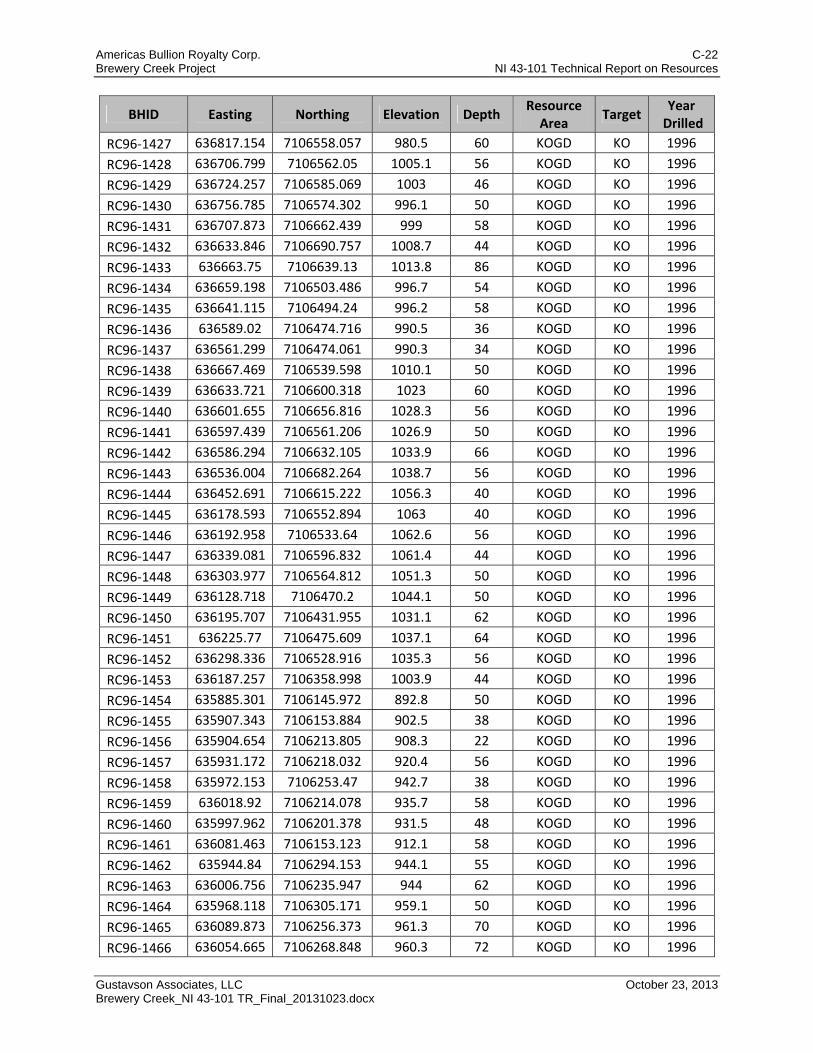
Americas Bullion Royalty Corp. C-22 Brewery Creek Project NI 43-101 Technical Report on Resources
Gustavson Associates, LLC October 23, 2013 Brewery Creek_NI 43-101 TR_Final_20131023.docx
BHID Easting Northing Elevation Depth Resource Area
Target Year
Drilled
RC96‐1427 636817.154 7106558.057 980.5 60 KOGD KO 1996
RC96‐1428 636706.799 7106562.05 1005.1 56 KOGD KO 1996
RC96‐1429 636724.257 7106585.069 1003 46 KOGD KO 1996
RC96‐1430 636756.785 7106574.302 996.1 50 KOGD KO 1996
RC96‐1431 636707.873 7106662.439 999 58 KOGD KO 1996
RC96‐1432 636633.846 7106690.757 1008.7 44 KOGD KO 1996
RC96‐1433 636663.75 7106639.13 1013.8 86 KOGD KO 1996
RC96‐1434 636659.198 7106503.486 996.7 54 KOGD KO 1996
RC96‐1435 636641.115 7106494.24 996.2 58 KOGD KO 1996
RC96‐1436 636589.02 7106474.716 990.5 36 KOGD KO 1996
RC96‐1437 636561.299 7106474.061 990.3 34 KOGD KO 1996
RC96‐1438 636667.469 7106539.598 1010.1 50 KOGD KO 1996
RC96‐1439 636633.721 7106600.318 1023 60 KOGD KO 1996
RC96‐1440 636601.655 7106656.816 1028.3 56 KOGD KO 1996
RC96‐1441 636597.439 7106561.206 1026.9 50 KOGD KO 1996
RC96‐1442 636586.294 7106632.105 1033.9 66 KOGD KO 1996
RC96‐1443 636536.004 7106682.264 1038.7 56 KOGD KO 1996
RC96‐1444 636452.691 7106615.222 1056.3 40 KOGD KO 1996
RC96‐1445 636178.593 7106552.894 1063 40 KOGD KO 1996
RC96‐1446 636192.958 7106533.64 1062.6 56 KOGD KO 1996
RC96‐1447 636339.081 7106596.832 1061.4 44 KOGD KO 1996
RC96‐1448 636303.977 7106564.812 1051.3 50 KOGD KO 1996
RC96‐1449 636128.718 7106470.2 1044.1 50 KOGD KO 1996
RC96‐1450 636195.707 7106431.955 1031.1 62 KOGD KO 1996
RC96‐1451 636225.77 7106475.609 1037.1 64 KOGD KO 1996
RC96‐1452 636298.336 7106528.916 1035.3 56 KOGD KO 1996
RC96‐1453 636187.257 7106358.998 1003.9 44 KOGD KO 1996
RC96‐1454 635885.301 7106145.972 892.8 50 KOGD KO 1996
RC96‐1455 635907.343 7106153.884 902.5 38 KOGD KO 1996
RC96‐1456 635904.654 7106213.805 908.3 22 KOGD KO 1996
RC96‐1457 635931.172 7106218.032 920.4 56 KOGD KO 1996
RC96‐1458 635972.153 7106253.47 942.7 38 KOGD KO 1996
RC96‐1459 636018.92 7106214.078 935.7 58 KOGD KO 1996
RC96‐1460 635997.962 7106201.378 931.5 48 KOGD KO 1996
RC96‐1461 636081.463 7106153.123 912.1 58 KOGD KO 1996
RC96‐1462 635944.84 7106294.153 944.1 55 KOGD KO 1996
RC96‐1463 636006.756 7106235.947 944 62 KOGD KO 1996
RC96‐1464 635968.118 7106305.171 959.1 50 KOGD KO 1996
RC96‐1465 636089.873 7106256.373 961.3 70 KOGD KO 1996
RC96‐1466 636054.665 7106268.848 960.3 72 KOGD KO 1996

Americas Bullion Royalty Corp. C-23 Brewery Creek Project NI 43-101 Technical Report on Resources
Gustavson Associates, LLC October 23, 2013 Brewery Creek_NI 43-101 TR_Final_20131023.docx
BHID Easting Northing Elevation Depth Resource Area
Target Year
Drilled
RC96‐1467 636191.865 7106313.015 982.9 36 KOGD KO 1996
RC96‐1468 636219.133 7106307.33 972.1 36 KOGD KO 1996
RC96‐1469 636203.746 7106291.446 971.6 8 KOGD KO 1996
RC96‐1470 636246.744 7106342.486 976.8 60 KOGD KO 1996
RC96‐1471 636194.844 7106268.3 962.7 44 KOGD KO 1996
RC96‐1472 636228.471 7106291.106 962.6 37 KOGD KO 1996
RC96‐1473 636287.8 7106363.498 975.7 50 KOGD KO 1996
RC96‐1474 636572.787 7106402.551 965.4 60 KOGD KO 1996
RC96‐1475 636594.416 7106418.958 969.3 23 KOGD KO 1996
RC96‐1476 636625.388 7106410.761 969.1 64.3 KOGD KO 1996
RC96‐1477 636759.589 7106467.825 984.4 54 KOGD KO 1996
RC96‐1478 636795.26 7106504.757 981 76 KOGD KO 1996
RC96‐1479 636819.469 7106506.767 977.6 66 KOGD KO 1996
RC96‐1480 636888.099 7106575.66 964.7 62 KOGD GD 1996
RC96‐1481 636876.533 7106596.258 965.1 46 KOGD GD 1996
RC96‐1482 636677.635 7106470.444 987 40 KOGD KO 1996
RC96‐1483 636515.345 7106391.735 964.1 42 KOGD KO 1996
RC96‐1484 636455.861 7106385.167 959.9 90 KOGD KO 1996
RC96‐1485 636468.5 7106416.156 969.3 60 KOGD KO 1996
RC96‐1486 636598.864 7106355.087 957.9 100 KOGD KO 1996
RC96‐1487 636272.396 7106300.066 957.5 50 KOGD KO 1996
RC96‐1488 636454.635 7106287.908 937.7 44 KOGD KO 1996
RC96‐1489 636311.215 7106235.421 932.9 94 KOGD KO 1996
RC96‐1490 636783.699 7106424.883 981 90 KOGD KO 1996
RC96‐1491 636418.235 7106350.697 953.2 66 KOGD KO 1996
RC96‐1492 636387.421 7106405.373 970.6 44 KOGD KO 1996
RC96‐1493 636740.505 7106648.63 992 46 KOGD KO 1996
RC96‐1494 636620.957 7106715.549 1002.5 40 KOGD KO 1996
RC96‐1495 636619.455 7106624.909 1026.1 32 KOGD KO 1996
RC96‐1496 636599.482 7106609.434 1030.6 46 KOGD KO 1996
RC96‐1497 636506.774 7106729.218 1037.5 22 KOGD KO 1996
RC96‐1498 636477.039 7106735.009 1045.7 39 KOGD KO 1996
RC96‐1499 636462.227 7106703.603 1056.2 36 KOGD KO 1996
RC96‐1500 636515.447 7106610.653 1048.5 90 KOGD KO 1996
RC96‐1501 636570.063 7106666.731 1032.3 52 KOGD KO 1996
RC96‐1502 636573.809 7106706.615 1015.8 24 KOGD KO 1996
RC96‐1503 636644.006 7106716.563 998.6 40 KOGD KO 1996
RC96‐1504 636472.097 7106580.659 1038.8 54 KOGD KO 1996
RC96‐1505 636440.608 7106636.334 1061.8 40 KOGD KO 1996
RC96‐1506 636372.04 7106583.666 1054.3 42 KOGD KO 1996
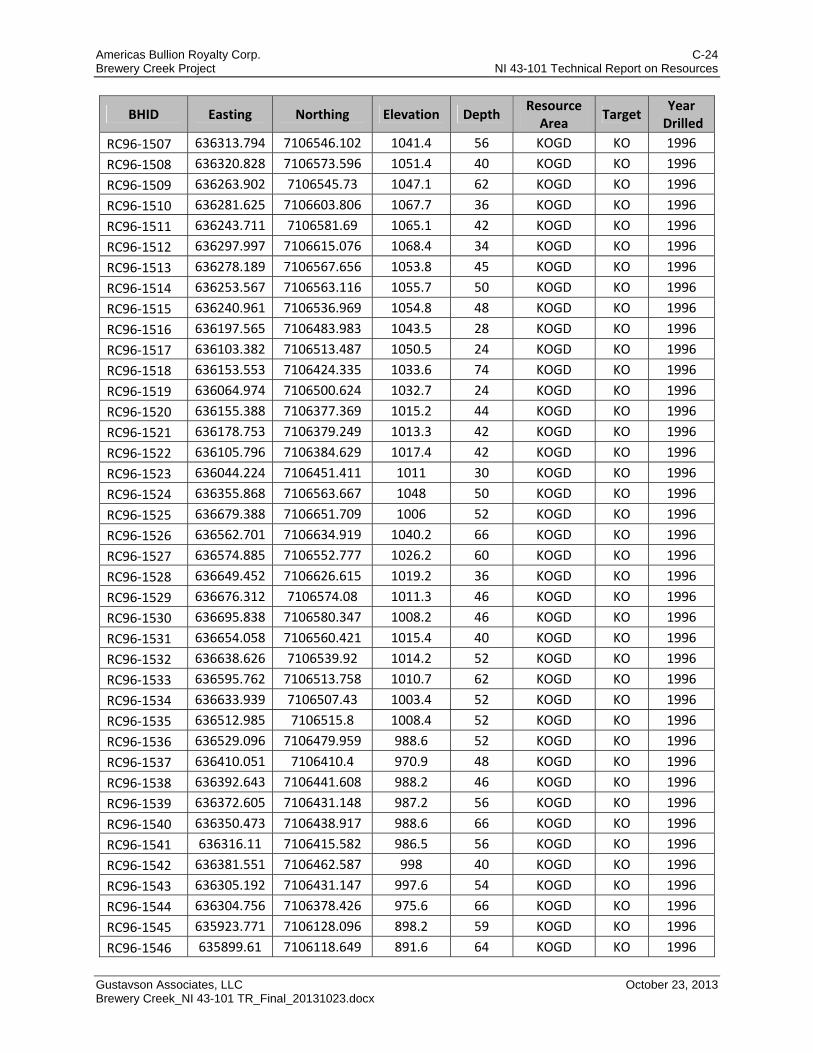
Americas Bullion Royalty Corp. C-24 Brewery Creek Project NI 43-101 Technical Report on Resources
Gustavson Associates, LLC October 23, 2013 Brewery Creek_NI 43-101 TR_Final_20131023.docx
BHID Easting Northing Elevation Depth Resource Area
Target Year
Drilled
RC96‐1507 636313.794 7106546.102 1041.4 56 KOGD KO 1996
RC96‐1508 636320.828 7106573.596 1051.4 40 KOGD KO 1996
RC96‐1509 636263.902 7106545.73 1047.1 62 KOGD KO 1996
RC96‐1510 636281.625 7106603.806 1067.7 36 KOGD KO 1996
RC96‐1511 636243.711 7106581.69 1065.1 42 KOGD KO 1996
RC96‐1512 636297.997 7106615.076 1068.4 34 KOGD KO 1996
RC96‐1513 636278.189 7106567.656 1053.8 45 KOGD KO 1996
RC96‐1514 636253.567 7106563.116 1055.7 50 KOGD KO 1996
RC96‐1515 636240.961 7106536.969 1054.8 48 KOGD KO 1996
RC96‐1516 636197.565 7106483.983 1043.5 28 KOGD KO 1996
RC96‐1517 636103.382 7106513.487 1050.5 24 KOGD KO 1996
RC96‐1518 636153.553 7106424.335 1033.6 74 KOGD KO 1996
RC96‐1519 636064.974 7106500.624 1032.7 24 KOGD KO 1996
RC96‐1520 636155.388 7106377.369 1015.2 44 KOGD KO 1996
RC96‐1521 636178.753 7106379.249 1013.3 42 KOGD KO 1996
RC96‐1522 636105.796 7106384.629 1017.4 42 KOGD KO 1996
RC96‐1523 636044.224 7106451.411 1011 30 KOGD KO 1996
RC96‐1524 636355.868 7106563.667 1048 50 KOGD KO 1996
RC96‐1525 636679.388 7106651.709 1006 52 KOGD KO 1996
RC96‐1526 636562.701 7106634.919 1040.2 66 KOGD KO 1996
RC96‐1527 636574.885 7106552.777 1026.2 60 KOGD KO 1996
RC96‐1528 636649.452 7106626.615 1019.2 36 KOGD KO 1996
RC96‐1529 636676.312 7106574.08 1011.3 46 KOGD KO 1996
RC96‐1530 636695.838 7106580.347 1008.2 46 KOGD KO 1996
RC96‐1531 636654.058 7106560.421 1015.4 40 KOGD KO 1996
RC96‐1532 636638.626 7106539.92 1014.2 52 KOGD KO 1996
RC96‐1533 636595.762 7106513.758 1010.7 62 KOGD KO 1996
RC96‐1534 636633.939 7106507.43 1003.4 52 KOGD KO 1996
RC96‐1535 636512.985 7106515.8 1008.4 52 KOGD KO 1996
RC96‐1536 636529.096 7106479.959 988.6 52 KOGD KO 1996
RC96‐1537 636410.051 7106410.4 970.9 48 KOGD KO 1996
RC96‐1538 636392.643 7106441.608 988.2 46 KOGD KO 1996
RC96‐1539 636372.605 7106431.148 987.2 56 KOGD KO 1996
RC96‐1540 636350.473 7106438.917 988.6 66 KOGD KO 1996
RC96‐1541 636316.11 7106415.582 986.5 56 KOGD KO 1996
RC96‐1542 636381.551 7106462.587 998 40 KOGD KO 1996
RC96‐1543 636305.192 7106431.147 997.6 54 KOGD KO 1996
RC96‐1544 636304.756 7106378.426 975.6 66 KOGD KO 1996
RC96‐1545 635923.771 7106128.096 898.2 59 KOGD KO 1996
RC96‐1546 635899.61 7106118.649 891.6 64 KOGD KO 1996
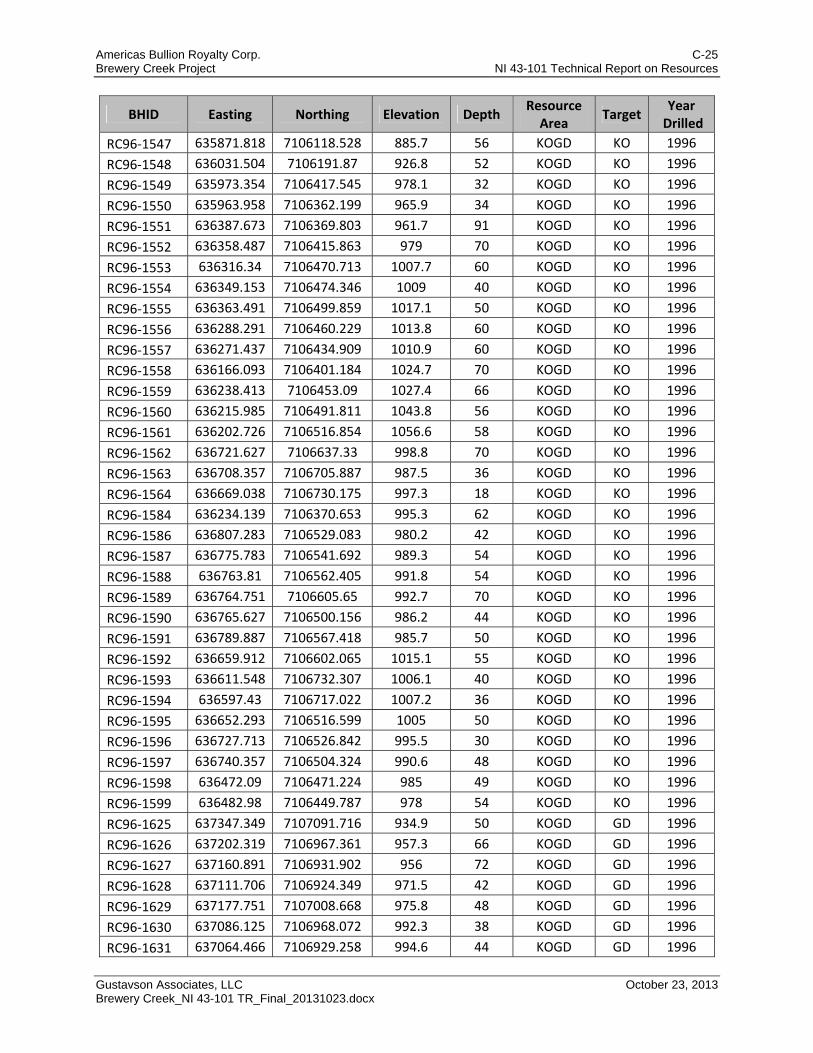
Americas Bullion Royalty Corp. C-25 Brewery Creek Project NI 43-101 Technical Report on Resources
Gustavson Associates, LLC October 23, 2013 Brewery Creek_NI 43-101 TR_Final_20131023.docx
BHID Easting Northing Elevation Depth Resource Area
Target Year
Drilled
RC96‐1547 635871.818 7106118.528 885.7 56 KOGD KO 1996
RC96‐1548 636031.504 7106191.87 926.8 52 KOGD KO 1996
RC96‐1549 635973.354 7106417.545 978.1 32 KOGD KO 1996
RC96‐1550 635963.958 7106362.199 965.9 34 KOGD KO 1996
RC96‐1551 636387.673 7106369.803 961.7 91 KOGD KO 1996
RC96‐1552 636358.487 7106415.863 979 70 KOGD KO 1996
RC96‐1553 636316.34 7106470.713 1007.7 60 KOGD KO 1996
RC96‐1554 636349.153 7106474.346 1009 40 KOGD KO 1996
RC96‐1555 636363.491 7106499.859 1017.1 50 KOGD KO 1996
RC96‐1556 636288.291 7106460.229 1013.8 60 KOGD KO 1996
RC96‐1557 636271.437 7106434.909 1010.9 60 KOGD KO 1996
RC96‐1558 636166.093 7106401.184 1024.7 70 KOGD KO 1996
RC96‐1559 636238.413 7106453.09 1027.4 66 KOGD KO 1996
RC96‐1560 636215.985 7106491.811 1043.8 56 KOGD KO 1996
RC96‐1561 636202.726 7106516.854 1056.6 58 KOGD KO 1996
RC96‐1562 636721.627 7106637.33 998.8 70 KOGD KO 1996
RC96‐1563 636708.357 7106705.887 987.5 36 KOGD KO 1996
RC96‐1564 636669.038 7106730.175 997.3 18 KOGD KO 1996
RC96‐1584 636234.139 7106370.653 995.3 62 KOGD KO 1996
RC96‐1586 636807.283 7106529.083 980.2 42 KOGD KO 1996
RC96‐1587 636775.783 7106541.692 989.3 54 KOGD KO 1996
RC96‐1588 636763.81 7106562.405 991.8 54 KOGD KO 1996
RC96‐1589 636764.751 7106605.65 992.7 70 KOGD KO 1996
RC96‐1590 636765.627 7106500.156 986.2 44 KOGD KO 1996
RC96‐1591 636789.887 7106567.418 985.7 50 KOGD KO 1996
RC96‐1592 636659.912 7106602.065 1015.1 55 KOGD KO 1996
RC96‐1593 636611.548 7106732.307 1006.1 40 KOGD KO 1996
RC96‐1594 636597.43 7106717.022 1007.2 36 KOGD KO 1996
RC96‐1595 636652.293 7106516.599 1005 50 KOGD KO 1996
RC96‐1596 636727.713 7106526.842 995.5 30 KOGD KO 1996
RC96‐1597 636740.357 7106504.324 990.6 48 KOGD KO 1996
RC96‐1598 636472.09 7106471.224 985 49 KOGD KO 1996
RC96‐1599 636482.98 7106449.787 978 54 KOGD KO 1996
RC96‐1625 637347.349 7107091.716 934.9 50 KOGD GD 1996
RC96‐1626 637202.319 7106967.361 957.3 66 KOGD GD 1996
RC96‐1627 637160.891 7106931.902 956 72 KOGD GD 1996
RC96‐1628 637111.706 7106924.349 971.5 42 KOGD GD 1996
RC96‐1629 637177.751 7107008.668 975.8 48 KOGD GD 1996
RC96‐1630 637086.125 7106968.072 992.3 38 KOGD GD 1996
RC96‐1631 637064.466 7106929.258 994.6 44 KOGD GD 1996
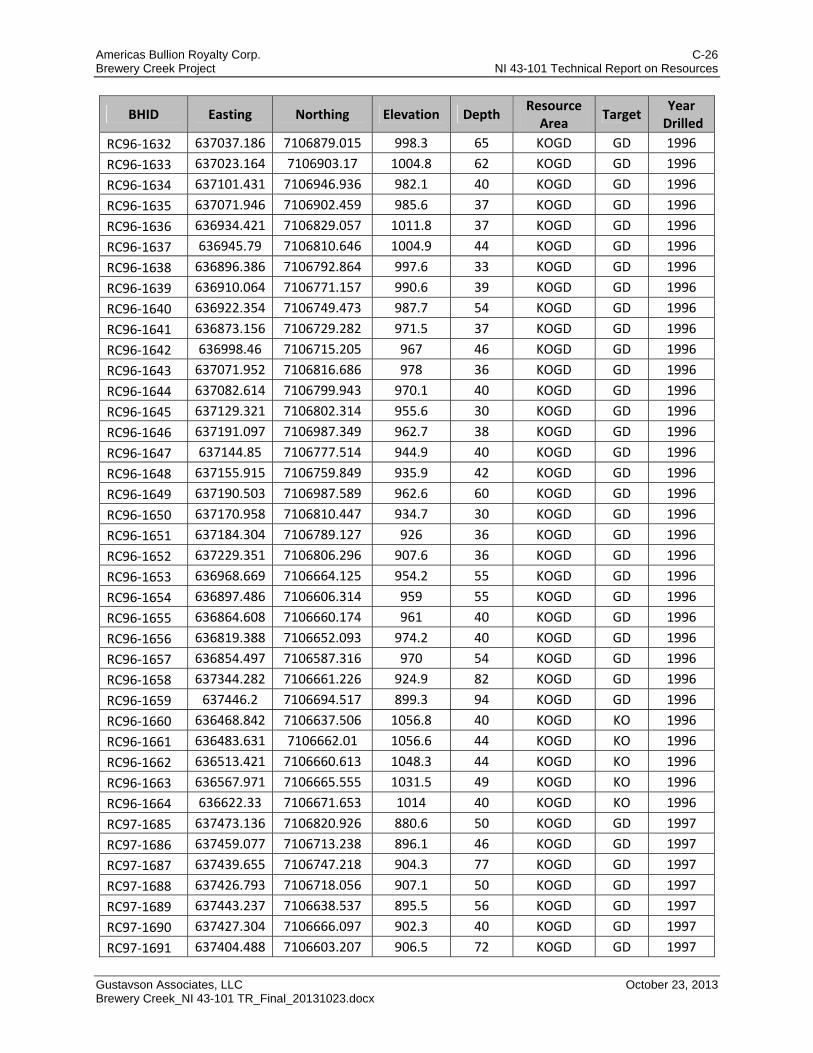
Americas Bullion Royalty Corp. C-26 Brewery Creek Project NI 43-101 Technical Report on Resources
Gustavson Associates, LLC October 23, 2013 Brewery Creek_NI 43-101 TR_Final_20131023.docx
BHID Easting Northing Elevation Depth Resource Area
Target Year
Drilled
RC96‐1632 637037.186 7106879.015 998.3 65 KOGD GD 1996
RC96‐1633 637023.164 7106903.17 1004.8 62 KOGD GD 1996
RC96‐1634 637101.431 7106946.936 982.1 40 KOGD GD 1996
RC96‐1635 637071.946 7106902.459 985.6 37 KOGD GD 1996
RC96‐1636 636934.421 7106829.057 1011.8 37 KOGD GD 1996
RC96‐1637 636945.79 7106810.646 1004.9 44 KOGD GD 1996
RC96‐1638 636896.386 7106792.864 997.6 33 KOGD GD 1996
RC96‐1639 636910.064 7106771.157 990.6 39 KOGD GD 1996
RC96‐1640 636922.354 7106749.473 987.7 54 KOGD GD 1996
RC96‐1641 636873.156 7106729.282 971.5 37 KOGD GD 1996
RC96‐1642 636998.46 7106715.205 967 46 KOGD GD 1996
RC96‐1643 637071.952 7106816.686 978 36 KOGD GD 1996
RC96‐1644 637082.614 7106799.943 970.1 40 KOGD GD 1996
RC96‐1645 637129.321 7106802.314 955.6 30 KOGD GD 1996
RC96‐1646 637191.097 7106987.349 962.7 38 KOGD GD 1996
RC96‐1647 637144.85 7106777.514 944.9 40 KOGD GD 1996
RC96‐1648 637155.915 7106759.849 935.9 42 KOGD GD 1996
RC96‐1649 637190.503 7106987.589 962.6 60 KOGD GD 1996
RC96‐1650 637170.958 7106810.447 934.7 30 KOGD GD 1996
RC96‐1651 637184.304 7106789.127 926 36 KOGD GD 1996
RC96‐1652 637229.351 7106806.296 907.6 36 KOGD GD 1996
RC96‐1653 636968.669 7106664.125 954.2 55 KOGD GD 1996
RC96‐1654 636897.486 7106606.314 959 55 KOGD GD 1996
RC96‐1655 636864.608 7106660.174 961 40 KOGD GD 1996
RC96‐1656 636819.388 7106652.093 974.2 40 KOGD GD 1996
RC96‐1657 636854.497 7106587.316 970 54 KOGD GD 1996
RC96‐1658 637344.282 7106661.226 924.9 82 KOGD GD 1996
RC96‐1659 637446.2 7106694.517 899.3 94 KOGD GD 1996
RC96‐1660 636468.842 7106637.506 1056.8 40 KOGD KO 1996
RC96‐1661 636483.631 7106662.01 1056.6 44 KOGD KO 1996
RC96‐1662 636513.421 7106660.613 1048.3 44 KOGD KO 1996
RC96‐1663 636567.971 7106665.555 1031.5 49 KOGD KO 1996
RC96‐1664 636622.33 7106671.653 1014 40 KOGD KO 1996
RC97‐1685 637473.136 7106820.926 880.6 50 KOGD GD 1997
RC97‐1686 637459.077 7106713.238 896.1 46 KOGD GD 1997
RC97‐1687 637439.655 7106747.218 904.3 77 KOGD GD 1997
RC97‐1688 637426.793 7106718.056 907.1 50 KOGD GD 1997
RC97‐1689 637443.237 7106638.537 895.5 56 KOGD GD 1997
RC97‐1690 637427.304 7106666.097 902.3 40 KOGD GD 1997
RC97‐1691 637404.488 7106603.207 906.5 72 KOGD GD 1997
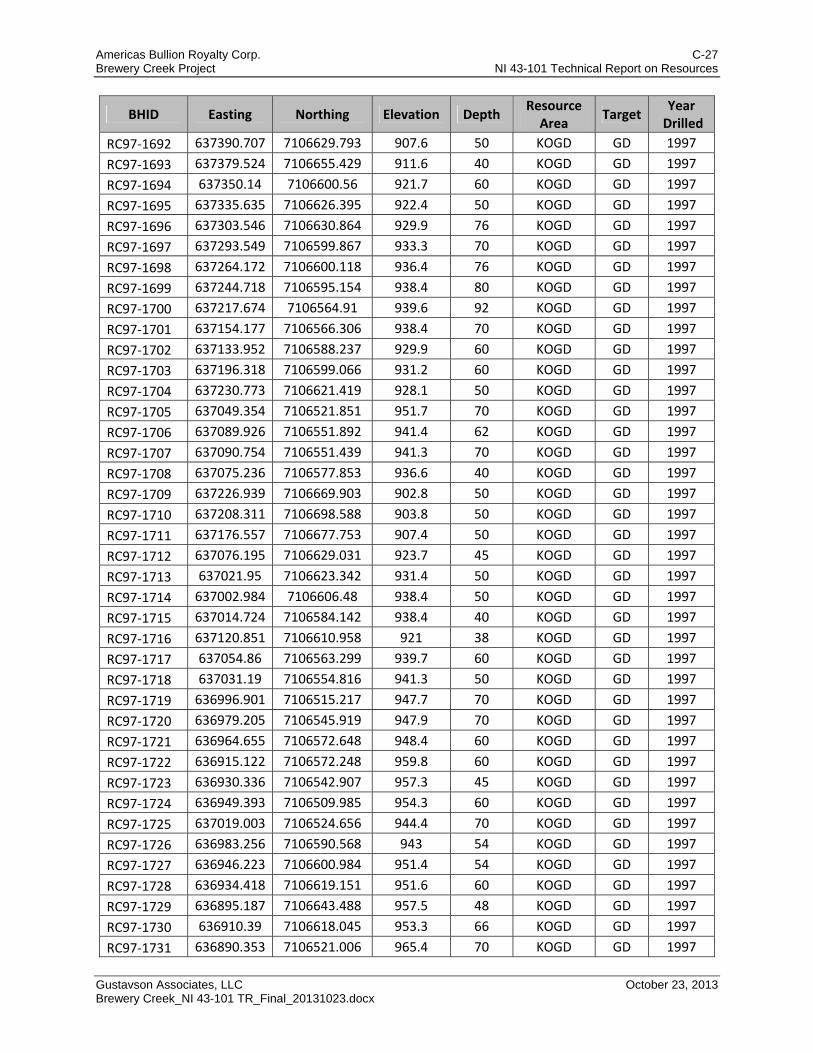
Americas Bullion Royalty Corp. C-27 Brewery Creek Project NI 43-101 Technical Report on Resources
Gustavson Associates, LLC October 23, 2013 Brewery Creek_NI 43-101 TR_Final_20131023.docx
BHID Easting Northing Elevation Depth Resource Area
Target Year
Drilled
RC97‐1692 637390.707 7106629.793 907.6 50 KOGD GD 1997
RC97‐1693 637379.524 7106655.429 911.6 40 KOGD GD 1997
RC97‐1694 637350.14 7106600.56 921.7 60 KOGD GD 1997
RC97‐1695 637335.635 7106626.395 922.4 50 KOGD GD 1997
RC97‐1696 637303.546 7106630.864 929.9 76 KOGD GD 1997
RC97‐1697 637293.549 7106599.867 933.3 70 KOGD GD 1997
RC97‐1698 637264.172 7106600.118 936.4 76 KOGD GD 1997
RC97‐1699 637244.718 7106595.154 938.4 80 KOGD GD 1997
RC97‐1700 637217.674 7106564.91 939.6 92 KOGD GD 1997
RC97‐1701 637154.177 7106566.306 938.4 70 KOGD GD 1997
RC97‐1702 637133.952 7106588.237 929.9 60 KOGD GD 1997
RC97‐1703 637196.318 7106599.066 931.2 60 KOGD GD 1997
RC97‐1704 637230.773 7106621.419 928.1 50 KOGD GD 1997
RC97‐1705 637049.354 7106521.851 951.7 70 KOGD GD 1997
RC97‐1706 637089.926 7106551.892 941.4 62 KOGD GD 1997
RC97‐1707 637090.754 7106551.439 941.3 70 KOGD GD 1997
RC97‐1708 637075.236 7106577.853 936.6 40 KOGD GD 1997
RC97‐1709 637226.939 7106669.903 902.8 50 KOGD GD 1997
RC97‐1710 637208.311 7106698.588 903.8 50 KOGD GD 1997
RC97‐1711 637176.557 7106677.753 907.4 50 KOGD GD 1997
RC97‐1712 637076.195 7106629.031 923.7 45 KOGD GD 1997
RC97‐1713 637021.95 7106623.342 931.4 50 KOGD GD 1997
RC97‐1714 637002.984 7106606.48 938.4 50 KOGD GD 1997
RC97‐1715 637014.724 7106584.142 938.4 40 KOGD GD 1997
RC97‐1716 637120.851 7106610.958 921 38 KOGD GD 1997
RC97‐1717 637054.86 7106563.299 939.7 60 KOGD GD 1997
RC97‐1718 637031.19 7106554.816 941.3 50 KOGD GD 1997
RC97‐1719 636996.901 7106515.217 947.7 70 KOGD GD 1997
RC97‐1720 636979.205 7106545.919 947.9 70 KOGD GD 1997
RC97‐1721 636964.655 7106572.648 948.4 60 KOGD GD 1997
RC97‐1722 636915.122 7106572.248 959.8 60 KOGD GD 1997
RC97‐1723 636930.336 7106542.907 957.3 45 KOGD GD 1997
RC97‐1724 636949.393 7106509.985 954.3 60 KOGD GD 1997
RC97‐1725 637019.003 7106524.656 944.4 70 KOGD GD 1997
RC97‐1726 636983.256 7106590.568 943 54 KOGD GD 1997
RC97‐1727 636946.223 7106600.984 951.4 54 KOGD GD 1997
RC97‐1728 636934.418 7106619.151 951.6 60 KOGD GD 1997
RC97‐1729 636895.187 7106643.488 957.5 48 KOGD GD 1997
RC97‐1730 636910.39 7106618.045 953.3 66 KOGD GD 1997
RC97‐1731 636890.353 7106521.006 965.4 70 KOGD GD 1997
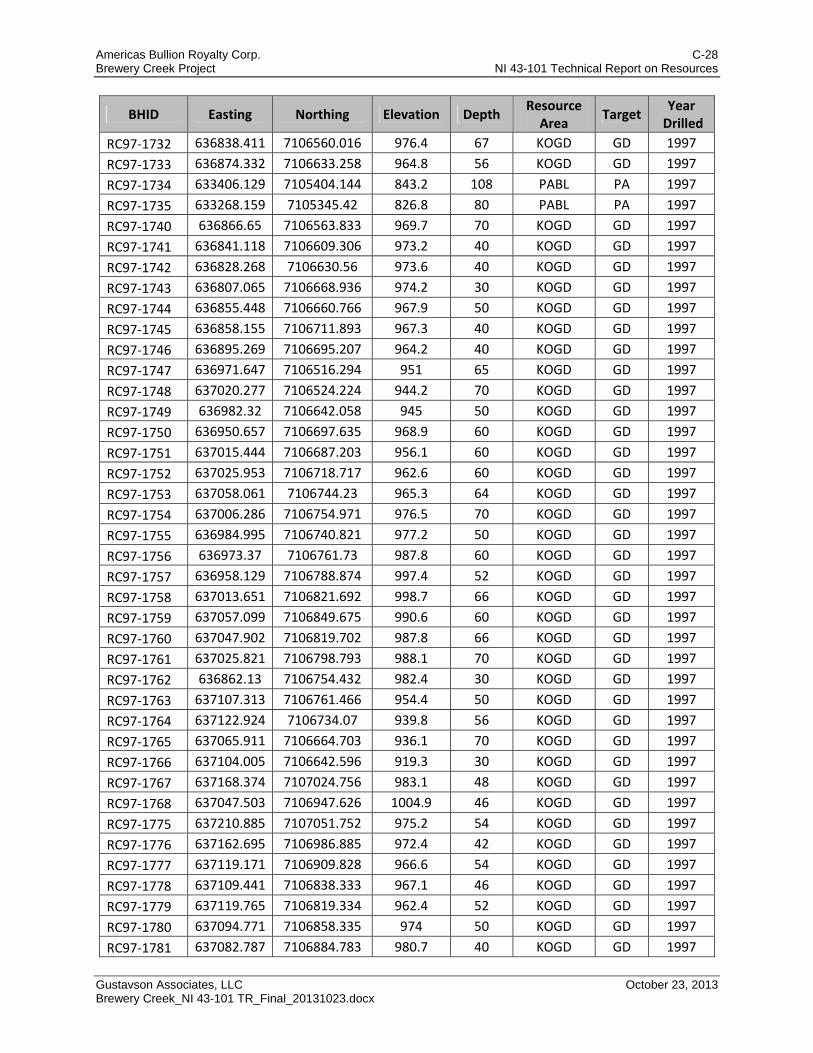
Americas Bullion Royalty Corp. C-28 Brewery Creek Project NI 43-101 Technical Report on Resources
Gustavson Associates, LLC October 23, 2013 Brewery Creek_NI 43-101 TR_Final_20131023.docx
BHID Easting Northing Elevation Depth Resource Area
Target Year
Drilled
RC97‐1732 636838.411 7106560.016 976.4 67 KOGD GD 1997
RC97‐1733 636874.332 7106633.258 964.8 56 KOGD GD 1997
RC97‐1734 633406.129 7105404.144 843.2 108 PABL PA 1997
RC97‐1735 633268.159 7105345.42 826.8 80 PABL PA 1997
RC97‐1740 636866.65 7106563.833 969.7 70 KOGD GD 1997
RC97‐1741 636841.118 7106609.306 973.2 40 KOGD GD 1997
RC97‐1742 636828.268 7106630.56 973.6 40 KOGD GD 1997
RC97‐1743 636807.065 7106668.936 974.2 30 KOGD GD 1997
RC97‐1744 636855.448 7106660.766 967.9 50 KOGD GD 1997
RC97‐1745 636858.155 7106711.893 967.3 40 KOGD GD 1997
RC97‐1746 636895.269 7106695.207 964.2 40 KOGD GD 1997
RC97‐1747 636971.647 7106516.294 951 65 KOGD GD 1997
RC97‐1748 637020.277 7106524.224 944.2 70 KOGD GD 1997
RC97‐1749 636982.32 7106642.058 945 50 KOGD GD 1997
RC97‐1750 636950.657 7106697.635 968.9 60 KOGD GD 1997
RC97‐1751 637015.444 7106687.203 956.1 60 KOGD GD 1997
RC97‐1752 637025.953 7106718.717 962.6 60 KOGD GD 1997
RC97‐1753 637058.061 7106744.23 965.3 64 KOGD GD 1997
RC97‐1754 637006.286 7106754.971 976.5 70 KOGD GD 1997
RC97‐1755 636984.995 7106740.821 977.2 50 KOGD GD 1997
RC97‐1756 636973.37 7106761.73 987.8 60 KOGD GD 1997
RC97‐1757 636958.129 7106788.874 997.4 52 KOGD GD 1997
RC97‐1758 637013.651 7106821.692 998.7 66 KOGD GD 1997
RC97‐1759 637057.099 7106849.675 990.6 60 KOGD GD 1997
RC97‐1760 637047.902 7106819.702 987.8 66 KOGD GD 1997
RC97‐1761 637025.821 7106798.793 988.1 70 KOGD GD 1997
RC97‐1762 636862.13 7106754.432 982.4 30 KOGD GD 1997
RC97‐1763 637107.313 7106761.466 954.4 50 KOGD GD 1997
RC97‐1764 637122.924 7106734.07 939.8 56 KOGD GD 1997
RC97‐1765 637065.911 7106664.703 936.1 70 KOGD GD 1997
RC97‐1766 637104.005 7106642.596 919.3 30 KOGD GD 1997
RC97‐1767 637168.374 7107024.756 983.1 48 KOGD GD 1997
RC97‐1768 637047.503 7106947.626 1004.9 46 KOGD GD 1997
RC97‐1775 637210.885 7107051.752 975.2 54 KOGD GD 1997
RC97‐1776 637162.695 7106986.885 972.4 42 KOGD GD 1997
RC97‐1777 637119.171 7106909.828 966.6 54 KOGD GD 1997
RC97‐1778 637109.441 7106838.333 967.1 46 KOGD GD 1997
RC97‐1779 637119.765 7106819.334 962.4 52 KOGD GD 1997
RC97‐1780 637094.771 7106858.335 974 50 KOGD GD 1997
RC97‐1781 637082.787 7106884.783 980.7 40 KOGD GD 1997
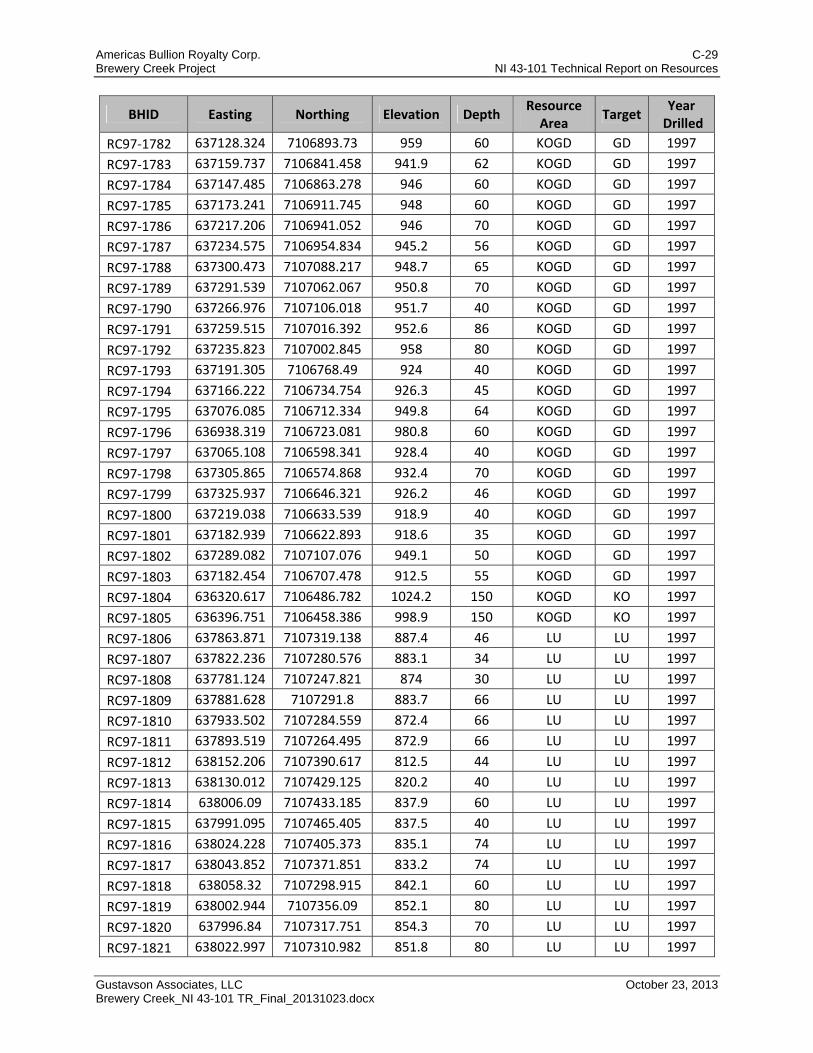
Americas Bullion Royalty Corp. C-29 Brewery Creek Project NI 43-101 Technical Report on Resources
Gustavson Associates, LLC October 23, 2013 Brewery Creek_NI 43-101 TR_Final_20131023.docx
BHID Easting Northing Elevation Depth Resource Area
Target Year
Drilled
RC97‐1782 637128.324 7106893.73 959 60 KOGD GD 1997
RC97‐1783 637159.737 7106841.458 941.9 62 KOGD GD 1997
RC97‐1784 637147.485 7106863.278 946 60 KOGD GD 1997
RC97‐1785 637173.241 7106911.745 948 60 KOGD GD 1997
RC97‐1786 637217.206 7106941.052 946 70 KOGD GD 1997
RC97‐1787 637234.575 7106954.834 945.2 56 KOGD GD 1997
RC97‐1788 637300.473 7107088.217 948.7 65 KOGD GD 1997
RC97‐1789 637291.539 7107062.067 950.8 70 KOGD GD 1997
RC97‐1790 637266.976 7107106.018 951.7 40 KOGD GD 1997
RC97‐1791 637259.515 7107016.392 952.6 86 KOGD GD 1997
RC97‐1792 637235.823 7107002.845 958 80 KOGD GD 1997
RC97‐1793 637191.305 7106768.49 924 40 KOGD GD 1997
RC97‐1794 637166.222 7106734.754 926.3 45 KOGD GD 1997
RC97‐1795 637076.085 7106712.334 949.8 64 KOGD GD 1997
RC97‐1796 636938.319 7106723.081 980.8 60 KOGD GD 1997
RC97‐1797 637065.108 7106598.341 928.4 40 KOGD GD 1997
RC97‐1798 637305.865 7106574.868 932.4 70 KOGD GD 1997
RC97‐1799 637325.937 7106646.321 926.2 46 KOGD GD 1997
RC97‐1800 637219.038 7106633.539 918.9 40 KOGD GD 1997
RC97‐1801 637182.939 7106622.893 918.6 35 KOGD GD 1997
RC97‐1802 637289.082 7107107.076 949.1 50 KOGD GD 1997
RC97‐1803 637182.454 7106707.478 912.5 55 KOGD GD 1997
RC97‐1804 636320.617 7106486.782 1024.2 150 KOGD KO 1997
RC97‐1805 636396.751 7106458.386 998.9 150 KOGD KO 1997
RC97‐1806 637863.871 7107319.138 887.4 46 LU LU 1997
RC97‐1807 637822.236 7107280.576 883.1 34 LU LU 1997
RC97‐1808 637781.124 7107247.821 874 30 LU LU 1997
RC97‐1809 637881.628 7107291.8 883.7 66 LU LU 1997
RC97‐1810 637933.502 7107284.559 872.4 66 LU LU 1997
RC97‐1811 637893.519 7107264.495 872.9 66 LU LU 1997
RC97‐1812 638152.206 7107390.617 812.5 44 LU LU 1997
RC97‐1813 638130.012 7107429.125 820.2 40 LU LU 1997
RC97‐1814 638006.09 7107433.185 837.9 60 LU LU 1997
RC97‐1815 637991.095 7107465.405 837.5 40 LU LU 1997
RC97‐1816 638024.228 7107405.373 835.1 74 LU LU 1997
RC97‐1817 638043.852 7107371.851 833.2 74 LU LU 1997
RC97‐1818 638058.32 7107298.915 842.1 60 LU LU 1997
RC97‐1819 638002.944 7107356.09 852.1 80 LU LU 1997
RC97‐1820 637996.84 7107317.751 854.3 70 LU LU 1997
RC97‐1821 638022.997 7107310.982 851.8 80 LU LU 1997
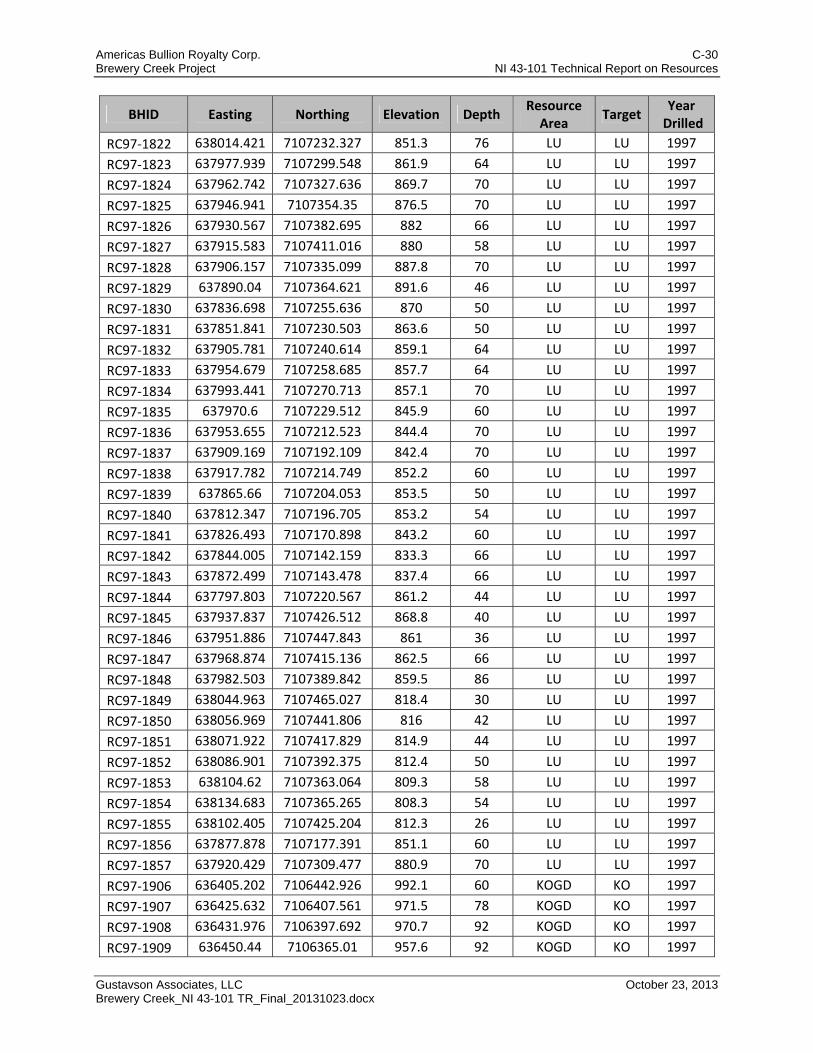
Americas Bullion Royalty Corp. C-30 Brewery Creek Project NI 43-101 Technical Report on Resources
Gustavson Associates, LLC October 23, 2013 Brewery Creek_NI 43-101 TR_Final_20131023.docx
BHID Easting Northing Elevation Depth Resource Area
Target Year
Drilled
RC97‐1822 638014.421 7107232.327 851.3 76 LU LU 1997
RC97‐1823 637977.939 7107299.548 861.9 64 LU LU 1997
RC97‐1824 637962.742 7107327.636 869.7 70 LU LU 1997
RC97‐1825 637946.941 7107354.35 876.5 70 LU LU 1997
RC97‐1826 637930.567 7107382.695 882 66 LU LU 1997
RC97‐1827 637915.583 7107411.016 880 58 LU LU 1997
RC97‐1828 637906.157 7107335.099 887.8 70 LU LU 1997
RC97‐1829 637890.04 7107364.621 891.6 46 LU LU 1997
RC97‐1830 637836.698 7107255.636 870 50 LU LU 1997
RC97‐1831 637851.841 7107230.503 863.6 50 LU LU 1997
RC97‐1832 637905.781 7107240.614 859.1 64 LU LU 1997
RC97‐1833 637954.679 7107258.685 857.7 64 LU LU 1997
RC97‐1834 637993.441 7107270.713 857.1 70 LU LU 1997
RC97‐1835 637970.6 7107229.512 845.9 60 LU LU 1997
RC97‐1836 637953.655 7107212.523 844.4 70 LU LU 1997
RC97‐1837 637909.169 7107192.109 842.4 70 LU LU 1997
RC97‐1838 637917.782 7107214.749 852.2 60 LU LU 1997
RC97‐1839 637865.66 7107204.053 853.5 50 LU LU 1997
RC97‐1840 637812.347 7107196.705 853.2 54 LU LU 1997
RC97‐1841 637826.493 7107170.898 843.2 60 LU LU 1997
RC97‐1842 637844.005 7107142.159 833.3 66 LU LU 1997
RC97‐1843 637872.499 7107143.478 837.4 66 LU LU 1997
RC97‐1844 637797.803 7107220.567 861.2 44 LU LU 1997
RC97‐1845 637937.837 7107426.512 868.8 40 LU LU 1997
RC97‐1846 637951.886 7107447.843 861 36 LU LU 1997
RC97‐1847 637968.874 7107415.136 862.5 66 LU LU 1997
RC97‐1848 637982.503 7107389.842 859.5 86 LU LU 1997
RC97‐1849 638044.963 7107465.027 818.4 30 LU LU 1997
RC97‐1850 638056.969 7107441.806 816 42 LU LU 1997
RC97‐1851 638071.922 7107417.829 814.9 44 LU LU 1997
RC97‐1852 638086.901 7107392.375 812.4 50 LU LU 1997
RC97‐1853 638104.62 7107363.064 809.3 58 LU LU 1997
RC97‐1854 638134.683 7107365.265 808.3 54 LU LU 1997
RC97‐1855 638102.405 7107425.204 812.3 26 LU LU 1997
RC97‐1856 637877.878 7107177.391 851.1 60 LU LU 1997
RC97‐1857 637920.429 7107309.477 880.9 70 LU LU 1997
RC97‐1906 636405.202 7106442.926 992.1 60 KOGD KO 1997
RC97‐1907 636425.632 7106407.561 971.5 78 KOGD KO 1997
RC97‐1908 636431.976 7106397.692 970.7 92 KOGD KO 1997
RC97‐1909 636450.44 7106365.01 957.6 92 KOGD KO 1997
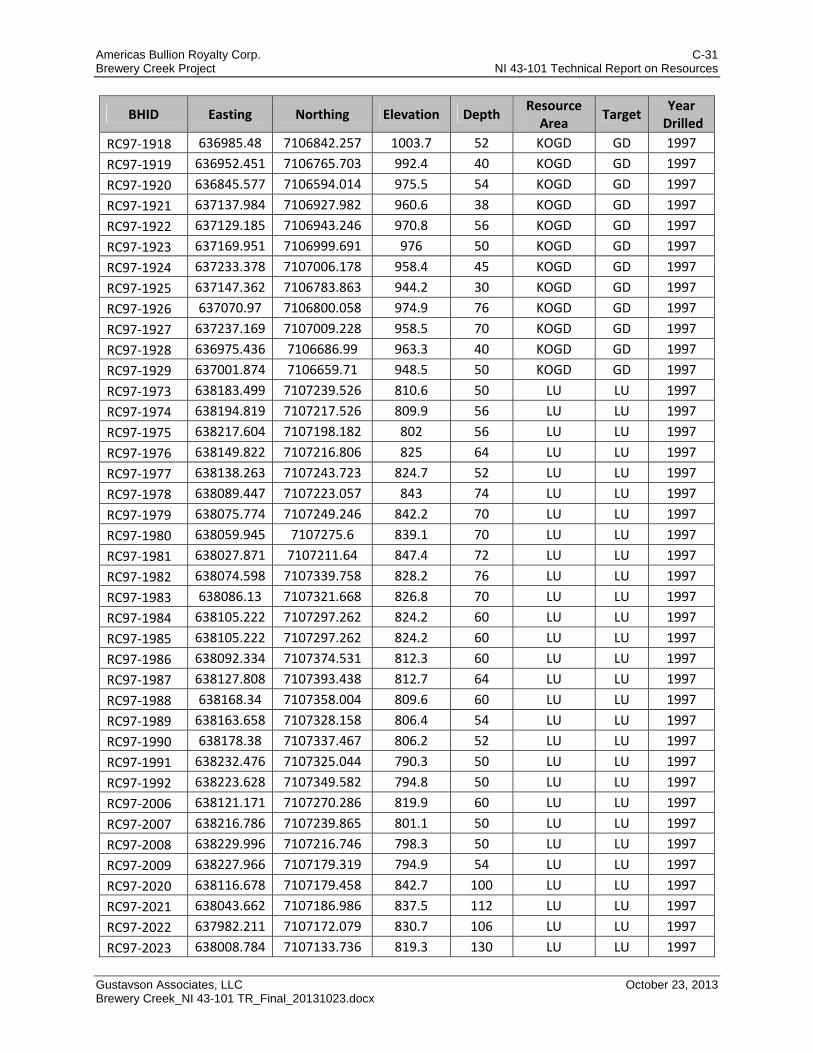
Americas Bullion Royalty Corp. C-31 Brewery Creek Project NI 43-101 Technical Report on Resources
Gustavson Associates, LLC October 23, 2013 Brewery Creek_NI 43-101 TR_Final_20131023.docx
BHID Easting Northing Elevation Depth Resource Area
Target Year
Drilled
RC97‐1918 636985.48 7106842.257 1003.7 52 KOGD GD 1997
RC97‐1919 636952.451 7106765.703 992.4 40 KOGD GD 1997
RC97‐1920 636845.577 7106594.014 975.5 54 KOGD GD 1997
RC97‐1921 637137.984 7106927.982 960.6 38 KOGD GD 1997
RC97‐1922 637129.185 7106943.246 970.8 56 KOGD GD 1997
RC97‐1923 637169.951 7106999.691 976 50 KOGD GD 1997
RC97‐1924 637233.378 7107006.178 958.4 45 KOGD GD 1997
RC97‐1925 637147.362 7106783.863 944.2 30 KOGD GD 1997
RC97‐1926 637070.97 7106800.058 974.9 76 KOGD GD 1997
RC97‐1927 637237.169 7107009.228 958.5 70 KOGD GD 1997
RC97‐1928 636975.436 7106686.99 963.3 40 KOGD GD 1997
RC97‐1929 637001.874 7106659.71 948.5 50 KOGD GD 1997
RC97‐1973 638183.499 7107239.526 810.6 50 LU LU 1997
RC97‐1974 638194.819 7107217.526 809.9 56 LU LU 1997
RC97‐1975 638217.604 7107198.182 802 56 LU LU 1997
RC97‐1976 638149.822 7107216.806 825 64 LU LU 1997
RC97‐1977 638138.263 7107243.723 824.7 52 LU LU 1997
RC97‐1978 638089.447 7107223.057 843 74 LU LU 1997
RC97‐1979 638075.774 7107249.246 842.2 70 LU LU 1997
RC97‐1980 638059.945 7107275.6 839.1 70 LU LU 1997
RC97‐1981 638027.871 7107211.64 847.4 72 LU LU 1997
RC97‐1982 638074.598 7107339.758 828.2 76 LU LU 1997
RC97‐1983 638086.13 7107321.668 826.8 70 LU LU 1997
RC97‐1984 638105.222 7107297.262 824.2 60 LU LU 1997
RC97‐1985 638105.222 7107297.262 824.2 60 LU LU 1997
RC97‐1986 638092.334 7107374.531 812.3 60 LU LU 1997
RC97‐1987 638127.808 7107393.438 812.7 64 LU LU 1997
RC97‐1988 638168.34 7107358.004 809.6 60 LU LU 1997
RC97‐1989 638163.658 7107328.158 806.4 54 LU LU 1997
RC97‐1990 638178.38 7107337.467 806.2 52 LU LU 1997
RC97‐1991 638232.476 7107325.044 790.3 50 LU LU 1997
RC97‐1992 638223.628 7107349.582 794.8 50 LU LU 1997
RC97‐2006 638121.171 7107270.286 819.9 60 LU LU 1997
RC97‐2007 638216.786 7107239.865 801.1 50 LU LU 1997
RC97‐2008 638229.996 7107216.746 798.3 50 LU LU 1997
RC97‐2009 638227.966 7107179.319 794.9 54 LU LU 1997
RC97‐2020 638116.678 7107179.458 842.7 100 LU LU 1997
RC97‐2021 638043.662 7107186.986 837.5 112 LU LU 1997
RC97‐2022 637982.211 7107172.079 830.7 106 LU LU 1997
RC97‐2023 638008.784 7107133.736 819.3 130 LU LU 1997

Americas Bullion Royalty Corp. C-32 Brewery Creek Project NI 43-101 Technical Report on Resources
Gustavson Associates, LLC October 23, 2013 Brewery Creek_NI 43-101 TR_Final_20131023.docx
BHID Easting Northing Elevation Depth Resource Area
Target Year
Drilled
RC97‐2024 638289.519 7107228.962 767.9 66 LU LU 1997
RC97‐2025 637257.22 7106714.598 952.5 22 KOGD GD 1997
RC98‐2039 637518.371 7106813.053 874.9 66 KOGD GD 1998
RC98‐2040 637419.132 7106781.728 900.5 50 KOGD GD 1998
RC98‐2041 637269.65 7106639.368 924 76 KOGD GD 1998
RC98‐2042 637282.636 7106565.6 933.5 84 KOGD GD 1998
RC98‐2043 637199.995 7106560.254 940.3 80 KOGD GD 1998
RC98‐2044 637178.574 7106597.589 929 70 KOGD GD 1998
RC98‐2045 636957.19 7106532.855 953.1 56 KOGD GD 1998
RC98‐2046 635896.455 7106381.553 949.7 60 KOGD KO 1998
RC98‐2047 635972.823 7106304.142 959.8 60 KOGD KO 1998
RC98‐2048 636044.654 7106311.793 978.2 86 KOGD KO 1998
RC98‐2049 636376.38 7106533.056 1038.5 54 KOGD KO 1998
RC98‐2050 636429.346 7106545.719 1036.3 50 KOGD KO 1998
RC98‐2051 636001.882 7106331.614 974.6 64 KOGD KO 1998
RC98‐2052 636546.527 7106551.419 1027 56 KOGD KO 1998
RC98‐2053 636618.534 7106525.066 1013.8 50 KOGD KO 1998
RC98‐2054 636708.166 7106521.022 995 50 KOGD KO 1998
RC98‐2055 636322.293 7106339.023 962.4 80 KOGD KO 1998
RC98‐2056 636431.583 7106398.39 968.5 70 KOGD KO 1998
RC98‐2057 637063.699 7106701.927 945.6 56 KOGD GD 1998
RC98‐2058 637033.375 7106755.73 972.5 56 KOGD GD 1998
RC98‐2059 637142.164 7106716.752 929.6 50 KOGD GD 1998
RC98‐2060 637201.227 7106757.761 921.3 30 KOGD GD 1998
RC98‐2061 637230.497 7106915.338 931.9 60 KOGD GD 1998
RC98‐2062 637240.278 7107050.246 963.6 60 KOGD GD 1998
RC98‐2063 637385.13 7107099.978 919.8 30 KOGD GD 1998
RC98‐2064 637040.936 7106722.661 958.7 60 KOGD GD 1998
RC98‐2065 636304.454 7106269.514 950.4 80 KOGD KO 1998
RC98‐2124 633561.213 7105435.858 843.5 64 PABL PA 1998
RC98‐2125 638184.428 7107313.423 801 100 LU LU 1998
RC98‐2126 638184.428 7107313.423 801 52 LU LU 1998
RC98‐2127 638206.9 7107367.737 803.6 40 LU LU 1998
RC98‐2128 638258.94 7107381.029 797 43 LU LU 1998
RC98‐2129 638225.387 7107347.47 794.1 40 LU LU 1998
RC98‐2130 638271.322 7107358.363 784.9 30 LU LU 1998
RC98‐2131 638152.704 7107408.925 818.3 140 LU LU 1998
RC98‐2132 638117.18 7107230.838 833 54 LU LU 1998
RC98‐2133 638072.625 7107187.88 841.3 50 LU LU 1998
RC98‐2134 637960.009 7107146.279 823.8 80 LU LU 1998
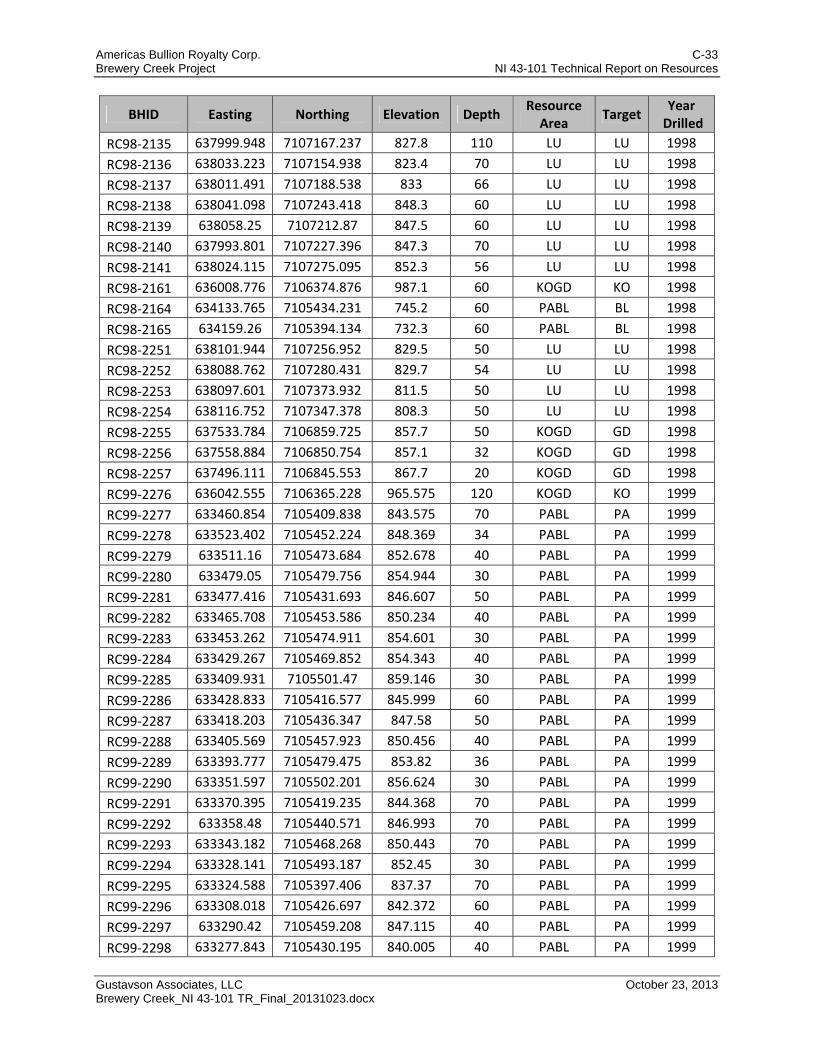
Americas Bullion Royalty Corp. C-33 Brewery Creek Project NI 43-101 Technical Report on Resources
Gustavson Associates, LLC October 23, 2013 Brewery Creek_NI 43-101 TR_Final_20131023.docx
BHID Easting Northing Elevation Depth Resource Area
Target Year
Drilled
RC98‐2135 637999.948 7107167.237 827.8 110 LU LU 1998
RC98‐2136 638033.223 7107154.938 823.4 70 LU LU 1998
RC98‐2137 638011.491 7107188.538 833 66 LU LU 1998
RC98‐2138 638041.098 7107243.418 848.3 60 LU LU 1998
RC98‐2139 638058.25 7107212.87 847.5 60 LU LU 1998
RC98‐2140 637993.801 7107227.396 847.3 70 LU LU 1998
RC98‐2141 638024.115 7107275.095 852.3 56 LU LU 1998
RC98‐2161 636008.776 7106374.876 987.1 60 KOGD KO 1998
RC98‐2164 634133.765 7105434.231 745.2 60 PABL BL 1998
RC98‐2165 634159.26 7105394.134 732.3 60 PABL BL 1998
RC98‐2251 638101.944 7107256.952 829.5 50 LU LU 1998
RC98‐2252 638088.762 7107280.431 829.7 54 LU LU 1998
RC98‐2253 638097.601 7107373.932 811.5 50 LU LU 1998
RC98‐2254 638116.752 7107347.378 808.3 50 LU LU 1998
RC98‐2255 637533.784 7106859.725 857.7 50 KOGD GD 1998
RC98‐2256 637558.884 7106850.754 857.1 32 KOGD GD 1998
RC98‐2257 637496.111 7106845.553 867.7 20 KOGD GD 1998
RC99‐2276 636042.555 7106365.228 965.575 120 KOGD KO 1999
RC99‐2277 633460.854 7105409.838 843.575 70 PABL PA 1999
RC99‐2278 633523.402 7105452.224 848.369 34 PABL PA 1999
RC99‐2279 633511.16 7105473.684 852.678 40 PABL PA 1999
RC99‐2280 633479.05 7105479.756 854.944 30 PABL PA 1999
RC99‐2281 633477.416 7105431.693 846.607 50 PABL PA 1999
RC99‐2282 633465.708 7105453.586 850.234 40 PABL PA 1999
RC99‐2283 633453.262 7105474.911 854.601 30 PABL PA 1999
RC99‐2284 633429.267 7105469.852 854.343 40 PABL PA 1999
RC99‐2285 633409.931 7105501.47 859.146 30 PABL PA 1999
RC99‐2286 633428.833 7105416.577 845.999 60 PABL PA 1999
RC99‐2287 633418.203 7105436.347 847.58 50 PABL PA 1999
RC99‐2288 633405.569 7105457.923 850.456 40 PABL PA 1999
RC99‐2289 633393.777 7105479.475 853.82 36 PABL PA 1999
RC99‐2290 633351.597 7105502.201 856.624 30 PABL PA 1999
RC99‐2291 633370.395 7105419.235 844.368 70 PABL PA 1999
RC99‐2292 633358.48 7105440.571 846.993 70 PABL PA 1999
RC99‐2293 633343.182 7105468.268 850.443 70 PABL PA 1999
RC99‐2294 633328.141 7105493.187 852.45 30 PABL PA 1999
RC99‐2295 633324.588 7105397.406 837.37 70 PABL PA 1999
RC99‐2296 633308.018 7105426.697 842.372 60 PABL PA 1999
RC99‐2297 633290.42 7105459.208 847.115 40 PABL PA 1999
RC99‐2298 633277.843 7105430.195 840.005 40 PABL PA 1999

Americas Bullion Royalty Corp. C-34 Brewery Creek Project NI 43-101 Technical Report on Resources
Gustavson Associates, LLC October 23, 2013 Brewery Creek_NI 43-101 TR_Final_20131023.docx
BHID Easting Northing Elevation Depth Resource Area
Target Year
Drilled
RC99‐2299 633295.356 7105348.015 828.564 70 PABL PA 1999
RC99‐2300 633283.519 7105370.061 831.376 82 PABL PA 1999
RC99‐2301 633268.375 7105395.565 834.128 46 PABL PA 1999
RC99‐2302 633256.416 7105416.872 836.423 30 PABL PA 1999
RC99‐2303 633237.721 7105400.625 832.399 40 PABL PA 1999
RC99‐2304 633240.459 7105346.163 824.526 54 PABL PA 1999
RC99‐2305 633232.42 7105358.473 825.221 44 PABL PA 1999
RC99‐2306 633219.234 7105381.652 828.198 30 PABL PA 1999
RC99‐2307 633193.77 7105375.144 825.192 40 PABL PA 1999
RC99‐2308 633197.762 7105316.651 819.206 50 PABL PA 1999
RC99‐2309 633176.864 7105306.572 815.456 46 PABL PA 1999